Abstract
Severe human activities in coastal areas have greatly impacted the sources and biogeochemical behaviors of organic matter (OM), including particulate OM (POM) and dissolved OM (DOM). However, few studies have incorporated the indices of POM and DOM to address this issue. Here, a dataset of the combination of stable isotopes of carbon and nitrogen in POM and the optical properties of DOM was presented in Xi Bay, a semi-enclosed bay with a highly developing industrial port in Beibu Gulf, South China, to reveal the origin, distribution, and fate of OM during the rainy season. In the upper bay, depleted δ13C suggested that particulate organic carbon (POC) mainly originated from terrestrial sources. However, the negative relationship between chromophoric DOM (CDOM) and particulate nitrogen (PN) suggested that bacterial-mediated decomposition of POM may be the primary source of CDOM. The negative correlation between humic-like fluorescent components (C1 and C2) and salinity suggested that those two components were mainly affected by terrestrial input. The significant correlation between the protein-like component (C3) and Chl a suggested that C3 was mainly derived from phytoplankton production in the upper bay. In the lower bay, the increase of δ13C values indicated an increased contribution of marine POC. The high levels of CDOM may be due to the decomposition of marine (fresh) POM. However, the low levels of C1 and C2 might be affected by dilution with seawater, and the increased levels of the protein-like C3 were due to enhanced primary production. In addition, the enhancement of δ15N values in both the upper and lower bays indicated serious nitrogen pollution in the bay. This study highlights that biological production fueled by excess nutrients is the dominant OM dynamic process in the bay with high human impact in Beibu Gulf.
Introduction
Coastal bays are one of the most important zones of the land and ocean, which can receive a tremendous amount of terrestrial and marine organic matter (OM) (Lin et al., 2019; Gao et al., 2021; Zhou et al., 2021; Dan et al., 2022). The inventories of particulate and dissolved organic matter (POM and DOM) are the most important organic carbon pools in the ocean, which play a crucial role in the global carbon and nitrogen cycle, thereby affecting climate change (Ye et al., 2018; Yang et al., 2020; Qu et al., 2022). However, the biogeochemistry of OM in coastal bays is quite complex owing to the multiple influences from the physical, chemical, and biological processes that occur in these areas (Huang et al., 2020; Liu et al., 2020; Wang et al., 2022). Thus, it is necessary to understand the origin, distribution, and fate of OM in coastal bays.
However, the increase in human activities has greatly changed the sources, dynamic processes, and fate of OM, thereby modifying the oceanic carbon and nitrogen budget and cycling (Ke et al., 2017; Ke et al., 2020; Gao et al., 2021; Zhao et al., 2021; Li et al., 2021). For example, the increasing flux of OM generated by primary production has caused an increase in the concentrations and isotopic values of OM from the bay mouth to the bay head, and the anthropogenic factors have significantly modified the sources, transportation, and deposition of OM in Dongshan Bay (Gao et al., 2021). Different sources or intensities of anthropogenic nutrient loading enriched δ13C of POM, whereas the depleted δ15N of POM was influenced by urban sewage in Daya Bay (Ke et al., 2017), and a similar phenomenon was found in Jiaozhou Bay (Ke et al., 2020). Moreover, for the DOM in eutrophic water, anthropogenic inputs could be an important source of DOM in seawater, contributing to a medium level of a protein-like fluorescent component in Xiangshan Bay, China (Zhao et al., 2021). Li et al. (2021) demonstrated that the increasing primary and microbiological production induced by the increase of eutrophication and contamination play a significant role in determining the DOM abundance and distribution in three coastal bays in North China. In addition, in the eutrophic coastal waters of Roskilde Fjord, Denmark, the autotrophic OM was the primary source of specific recalcitrant DOM, resulting in a great quantity of organic carbon in the ocean (Asmala et al., 2018). However, the above mentioned studies separately focused on the POM or DOM; thus, the sources and biogeochemical behaviors of OM and the interactions between POM and DOM in the bay with intensive human activities are still poorly understood.
Stable carbon (δ13C) and nitrogen (δ15N) isotope compositions of POM and the ratios of carbon/nitrogen (C/N) of POM are extensively applied to study the response to human activities in aquatic environments from the perspective of ecology and biogeochemistry (Ke et al., 2017; Ye et al., 2017; Ke et al., 2020; Huang et al., 2020; Gao et al., 2021). Generally, the δ13C values of terrestrial C3 plants range from −30‰ to −23‰ (average of −27‰), which are lower than those from marine phytoplankton (−22‰~−19‰) (Meyers, 1994; Meyers, 1997). Similarly, δ15N is an indicator of anthropogenic pollution. The δ15N values from terrestrial vascular plants (−5‰~18‰, with a mean value of 3‰) are lower than those from marine OM (3‰~12‰, with a mean value of 6‰) (Brandes and Devol, 2002; Middelburg and Herman, 2007). By contrast, the OM derived from sewage usually has higher δ15N values (Ye et al., 2016; Sarma et al., 2020). Commonly, the C/N ratios from marine OM (5~8) are typically lower than those from terrestrial OM (≥20) (Meyers, 1994; Meyers, 1997). In addition, absorption spectroscopy and fluorescence have been extensively used to track the DOM dynamics in estuarine and coastal ecosystems (Gao et al., 2019; Liu et al., 2020; Zhao et al., 2021; Li et al., 2021; Li et al., 2022). Absorption coefficients (e.g., a254, a325) are considered good proxies to determine the levels of chromophoric DOM (CDOM), and absorption spectral slope (e.g., S275–295) and specific UV absorbance (e.g., SUVA254) are good qualitative proxies for the molecular size and aromaticity of DOM (Helms et al., 2008; Guo et al., 2014; Gao et al., 2019; Wang et al., 2021). In addition, fluorescent DOM (FDOM) can provide a variety of indices for characterizing DOM quantity (e.g., intensities of various fluorescent components) and quality (Guo et al., 2014; Gao et al., 2019; Yang et al., 2020). Many studies have used optical properties to study the DOM in human-influenced estuaries and coastal bays, such as the Liao and Daliao rivers–estuaries (He et al., 2022), Xiangshan Bay (Zhao et al., 2021), and the coastal bays in North China (Li et al., 2021). These studies indicated that optical properties are an effective tool for studying the source and dynamics of DOM. Thus, incorporating POM and DOM indices can help us comprehensively understand the sources, fate, and interactions of OM in aquatic environments (Qu et al., 2022).
Beibu Gulf is a semi-closed bay with a newly and highly developing industrial and port area located in the northwestern South China Sea (SCS) (Chen et al., 2018; Dan et al., 2020; Lao et al., 2021a). The marine ecosystems in the coastal bay are now facing increasing contaminant loads due to the rapid economic development of coastal urban agglomeration around the coastal cities in Beibu Gulf (Chen et al., 2018; Lao et al., 2019; Lao et al., 2021a; Lao et al., 2021b; Lao et al., 2022a). Excessive terrestrial contamination inputs have caused many environmental issues, such as the acidification of coastal waters (Lao et al., 2022a), increasing eutrophication (Lao et al., 2021b), and frequent red tides (Xu et al., 2019; Zhang et al., 2019). Due to the seasonal intrusion of different water masses (Lao et al., 2022b) and severe industrial and port activities in Beibu Gulf, the biogeochemical processes of OM become more complicated (Wang and Guo, 2010; Kaiser et al., 2014; Liao et al., 2018; Dan et al., 2020). Although some studies have tried to reveal the OM source and its biogeochemical processes in the gulf (Wang and Guo, 2010; Kaiser et al., 2014; Liao et al., 2018; Dan et al., 2020), the dynamics of OM in the estuaries and bays are still unclear due to complex influencing factors, such as hydrology and intensive human activities. More importantly, these studies mostly used a single means, such as a single stable isotope (Kaiser et al., 2014; Liao et al., 2018; Dan et al., 2020) and the geochemical parameters or optical properties of OM (Wang and Guo, 2010). There are few studies incorporating the indices of POM and DOM to comprehensively understand the dynamics of OM in the gulf.
Compared with other larger estuaries and bays, small and semi-enclosed bays are extremely sensitive to anthropogenic destabilization (Ke et al., 2020; Gao et al., 2021; Li et al., 2021). Xi Bay is a semi-enclosed bay with a highly developing industrial and port located at the top of the northern Beibu Gulf along the coast of Fangchenggang City, Guangxi Province. In this study, the parameters of particulate organic carbon (POC) and particulate nitrogen (PN), the stable isotopes of POM (δ13C and δ15N), dissolved organic carbon (DOC), CDOM, FDOM, and other physicochemical parameters were investigated to explore the OM sources and its biogeochemistry in Xi Bay.
Materials and methods
Study area
The semi-enclosed Xi Bay is situated in the northern Beibu Gulf (Figure 1). The East Asian monsoon controls the climate in this area. The rainfall during the rainy season (91% of the annual rainfall) (April–October) is much higher than that during the dry season (March–November) (China Meteorological Data Sharing Service System, http://data.cma.cn/site/index.html). The Fangcheng River flows into Xi Bay. The annual runoff of this river is 542.25 × 10⁸ m3, and the highest runoff occurs in July (127.41 × 10⁸ m3) (Lao et al., 2020). There is only a narrow outlet channel linking with the outer Beibu Gulf, thus limiting the water exchange between the upper bay and the lower bay (Cai et al., 2022). The peninsula in the east part of Xi Bay is the center of Fangchenggang City. In addition, the eastern coast of the bay mouth is the port and industrial regions, which is seriously affected by human activities recently (Cai et al., 2022).
Figure 1

Map of the study area and sampling stations in Xi Bay (upper bay: W1–W5; lower bay: W6–W14).
Sampling collection
The depth of the sampling station is 1.3–9.5 m, and surface seawater (0.5 m depth) samples were collected from 14 stations in Xi Bay in July (rainy season) 2021. According to the geographical characteristics and the change of salinity, the isotopic compositions of POM, and the absorption spectroscopy and fluorescence of DOM, the stations were grouped into two sections: the upper bay (stations W1–W5) and the lower bay (stations W6–W14) (Figure 1). The temperature was determined by a digital thermometer (SWL1-1), and salinity was determined by a salinometer (SYA2-2) in the field. Dissolved oxygen (DO) was also determined on-site using the Winkler method. The apparent oxygen utilization (AOU) was calculated by subtracting the observed DO concentration from the saturated DO concentration. For the analysis of nutrients (NO3−, NO2−, NH4+, PO43−), glass fiber filters (47 mm diameter, Whatman GF/F) were used to filter the water samples, and the filtrate was stored at −20°C for laboratory analysis. Seawater for the Chl a samples was filtered by glass fiber membranes (GF/F, Whatman) with a diameter of 47 mm. The POM (POC and PN) samples were filtered by precombustion (450°C, 4 h) GF/F. Seawater samples for DOC, CDOM, and FDOM analyses were vacuum-filtered by precombustion (450°C, 4 h) glass fiber filters (47 mm diameter, Whatman GF/F), kept in the dark, and stored in high-density polyethylene (HDPE) vials at −20°C before being analyzed in the laboratory. The optical measurements of DOM were finished within 1 week.
Measurements of nutrients, Chl a, and DOC
Nutrients (NO3−, NO2−, NH4+, PO43−) were measured by a San++ continuous flow analyzer (Skalar, Netherlands). The detection limits of NO2−, NO3−, and NH4+ were all 0.1 μg L−1, and the detection limit of PO43− was 0.02 μg L−1. Chl a was extracted with a 90% volume fraction of acetone, then measured using the fluorometric method (Lorenzen, 1967). The DOC concentration was measured with a Vario TOC analyzer (Elementar, Germany), and potassium hydrogen phthalate was used as the standard DOC calibration curve. The average peak area of the samples (injected three times) was calculated by subtracting the running blank and dividing by the slope of the standard curve to obtain the DOC concentrations. The DOC analysis variation coefficient was 2%.
Total suspended matter, POC, PN, and isotope analyses
The total suspended matter (TSM) concentration was calculated using different weights between the preweighed and reweighed samples. For the POC and PN concentrations and isotopic compositions, concentrated HCl vapor was used to remove inorganic carbon in the filters. The POM sample was tightly packed into tin cans and then determined by an elemental analysis isotope ratio mass spectrometer (253 Plus, EA-IRMS). The Vienna Pee Dee Belemnite (VPDB) and atmospheric N2 were the references for δ13C and δ15N, respectively. The accuracy of POC and PN is 0.83% ± 0.1% (n = 8, IVA33802180) and 0.07% ± 0.01% (n = 8, IVA33802180), respectively. The precision of POC and PN is ±0.1%. The accuracy of δ13C and δ15N is −26.4‰ ± 0.2‰ (n = 8, USGS40) and −4.5‰ ± 0.2‰ (n = 8, USGS40), respectively. In addition, the precision of δ13C and δ15N is ±0.2‰.
CDOM analysis
The CDOM absorbance spectra were measured by a Shimadzu UV-1780 dual-beam spectrophotometer (Shimadzu, Japan), with a 10-cm quartz cell. Absorbance (Aλ) scans ranged from 240 to 800 nm, with a spectral resolution of 0.5 nm. Milli-Q water was used for baseline correction. A Napierian absorption coefficient (aλ, m−1) was calculated as 2.303 times the absorbance (Aλ) divided by the light path length of the cell in meters (0.1 m). There, a254 and a325 were used to quantify CDOM abundance in this study (Wang et al., 2021), and the CDOM absorption coefficients at other wavelengths (e.g., 280, 350, 355, 412 nm) are presented in Table S1. The spectral slope (S275–295) was calculated using linear fitting of the log-transformed absorption coefficient. The value of SUVA254 was calculated by dividing the decadal absorption coefficient (i.e., A(λ)/L) by the corresponding DOC content (mg C L−1) (Wang et al., 2021).
FDOM analysis and PARAFAC modeling
The FDOM excitation–emission matrices (EEMs) were obtained by a Hitachi F-7100 fluorescence spectrofluorometer. The excitation (Ex) wavelengths spanned from 240 to 450 nm in 5 nm increments with 10 nm slit width, and emission (Em) wavelengths spanned from 280 to 600 nm in 2 nm increments with 5 nm slit width. An absorbance-based approach was used to correct the inner-filtering effects, and the Raman spectra of Milli-Q water were used to normalize and blank-correct the EEMs. Fluorescence intensity was presented as Raman units (RU). The fluorescence indices [i.e., fluorescence index (FI), humification index (HIX), and biological index (BIX)] were used to describe the composition and characteristics of DOM. FI is the ratio of EM fluorescence intensity at 450 and 500 nm when Ex = 370 (McKnight et al., 2001). HIX is the ratio of an integral area over Em 435–480 to 300–345 nm when Ex = 255 nm (Zsolnay et al., 1999). BIX is the ratio of EM fluorescence intensity at 380 and 430 nm when Ex = 310 nm (Huguet et al., 2009).
PARAFAC modeling resulting in a three-component model that included two humic-like components (C1–C2) and one protein-like component (C3) explained more than 99% of the variability among the EEMs (Figure S1). C1 displayed Ex/Em at ≤240 and 290/390 nm, which is similar to peaks A and M (Coble, 1996); C2 displayed Ex/Em at 260 and 360/440 nm, which is a mixture of peaks A and C (Coble, 1996). C3 displayed Ex/Em at 275/328 nm, which resembles traditionally peak T (Coble, 1996).
Statistical analysis
The potential POM sources in Xi Bay were quantified by the Bayesian mixing model in R software (MixSIAR v.3.1.10). Redundancy analysis (RDA) was conducted to investigate the relationships between the DOM and environmental variables by Canoco 5.0. Linear correlations between DOM parameters and salinity, Chl a, and POM were performed using SPSS 22.0. The Student’s t-test in SPSS 22.0 also was used to analyze the differences between the parameters in the upper bay and the lower bay. A one-way ANOVA was performed before the Student’s t-test to see if the data had homogeneous variances (F-test).
Results
Physicochemical parameters
Our previous study showed the physicochemical parameters during the same cruise in Xi Bay (Cai et al., 2022). The distributions of the physicochemical parameters are shown in Figure 2. The water temperature varied between 31.90°C and 32.40°C (an average of 32.09°C ± 0.14°C), with the highest temperature in station W8. The mean temperature was 32.12°C ± 0.13°C in the upper bay and 32.08°C ± 0.16°C in the lower bay. Salinity varied between 14.59 and 24.22 (an average of 19.89 ± 2.57), and the salinity increased seaward. The mean salinity was 17.71 ± 2.52 in the upper bay and 21.10 ± 1.71 in the lower bay. The level of DO ranged from 5.92 to 7.00 mg L−1 (an average of 6.50 ± 0.29 mg L−1), and the highest value occurred in the bay mouth area. The mean value of DO was 6.38 ± 0.29 mg L−1 in the upper bay and 6.57 ± 0.29 mg L−1 in the lower bay. Moreover, the levels of AOU ranged from −0.42 to 0.78 mg L−1 (average of 0.04 ± 0.32 mg L−1), and the highest value occurred in station W1. The mean value of AOU was 0.23 ± 0.33 mg L−1 in the upper bay and −0.07 ± 0.27 mg L−1 in the lower bay. The detailed spatial distributions of AOU are presented in Figure 2C, and the spatial distributions of DO are presented in Figure S2. The level of Chl a varied between 1.60 and 12.30 μg L−1, and the mean value of Chl a (2.78 ± 0.94 μg L−1) in the upper bay was lower than that in the lower bay (7.47 ± 3.22 μg L−1) (t-test, p < 0.01). The concentrations of NH4+, NO2−, NO3−, and PO43− ranged from 1.26 to 7.36 μmol L−1, 0.61 to 2.54 μmol L−1, 8.21 to 89.93 μmol L−1, and 0.36 to 1.00 μmol L−1, with average values of 3.14 ± 2.16 μmol L−1, 1.18 ± 0.63 μmol L−1, 36.48 ± 34.81 μmol L−1, and 0.60 ± 0.22 μmol L−1, respectively. In addition, the mean values of NH4+, NO2−, NO3−, and PO43− were 2.95 ± 1.25 μmol L−1, 0.88 ± 0.13 μmol L−1, 33.27 ± 31.10 μmol L−1, and 0.79 ± 0.16 μmol L−1 in the upper bay and 3.24 ± 2.60 μmol L−1, 1.35 ± 0.75 μmol L−1, 38.27 ± 38.41 μmol L−1, and 0.50 ± 0.17 μmol L−1 in the lower bay, respectively.
Figure 2
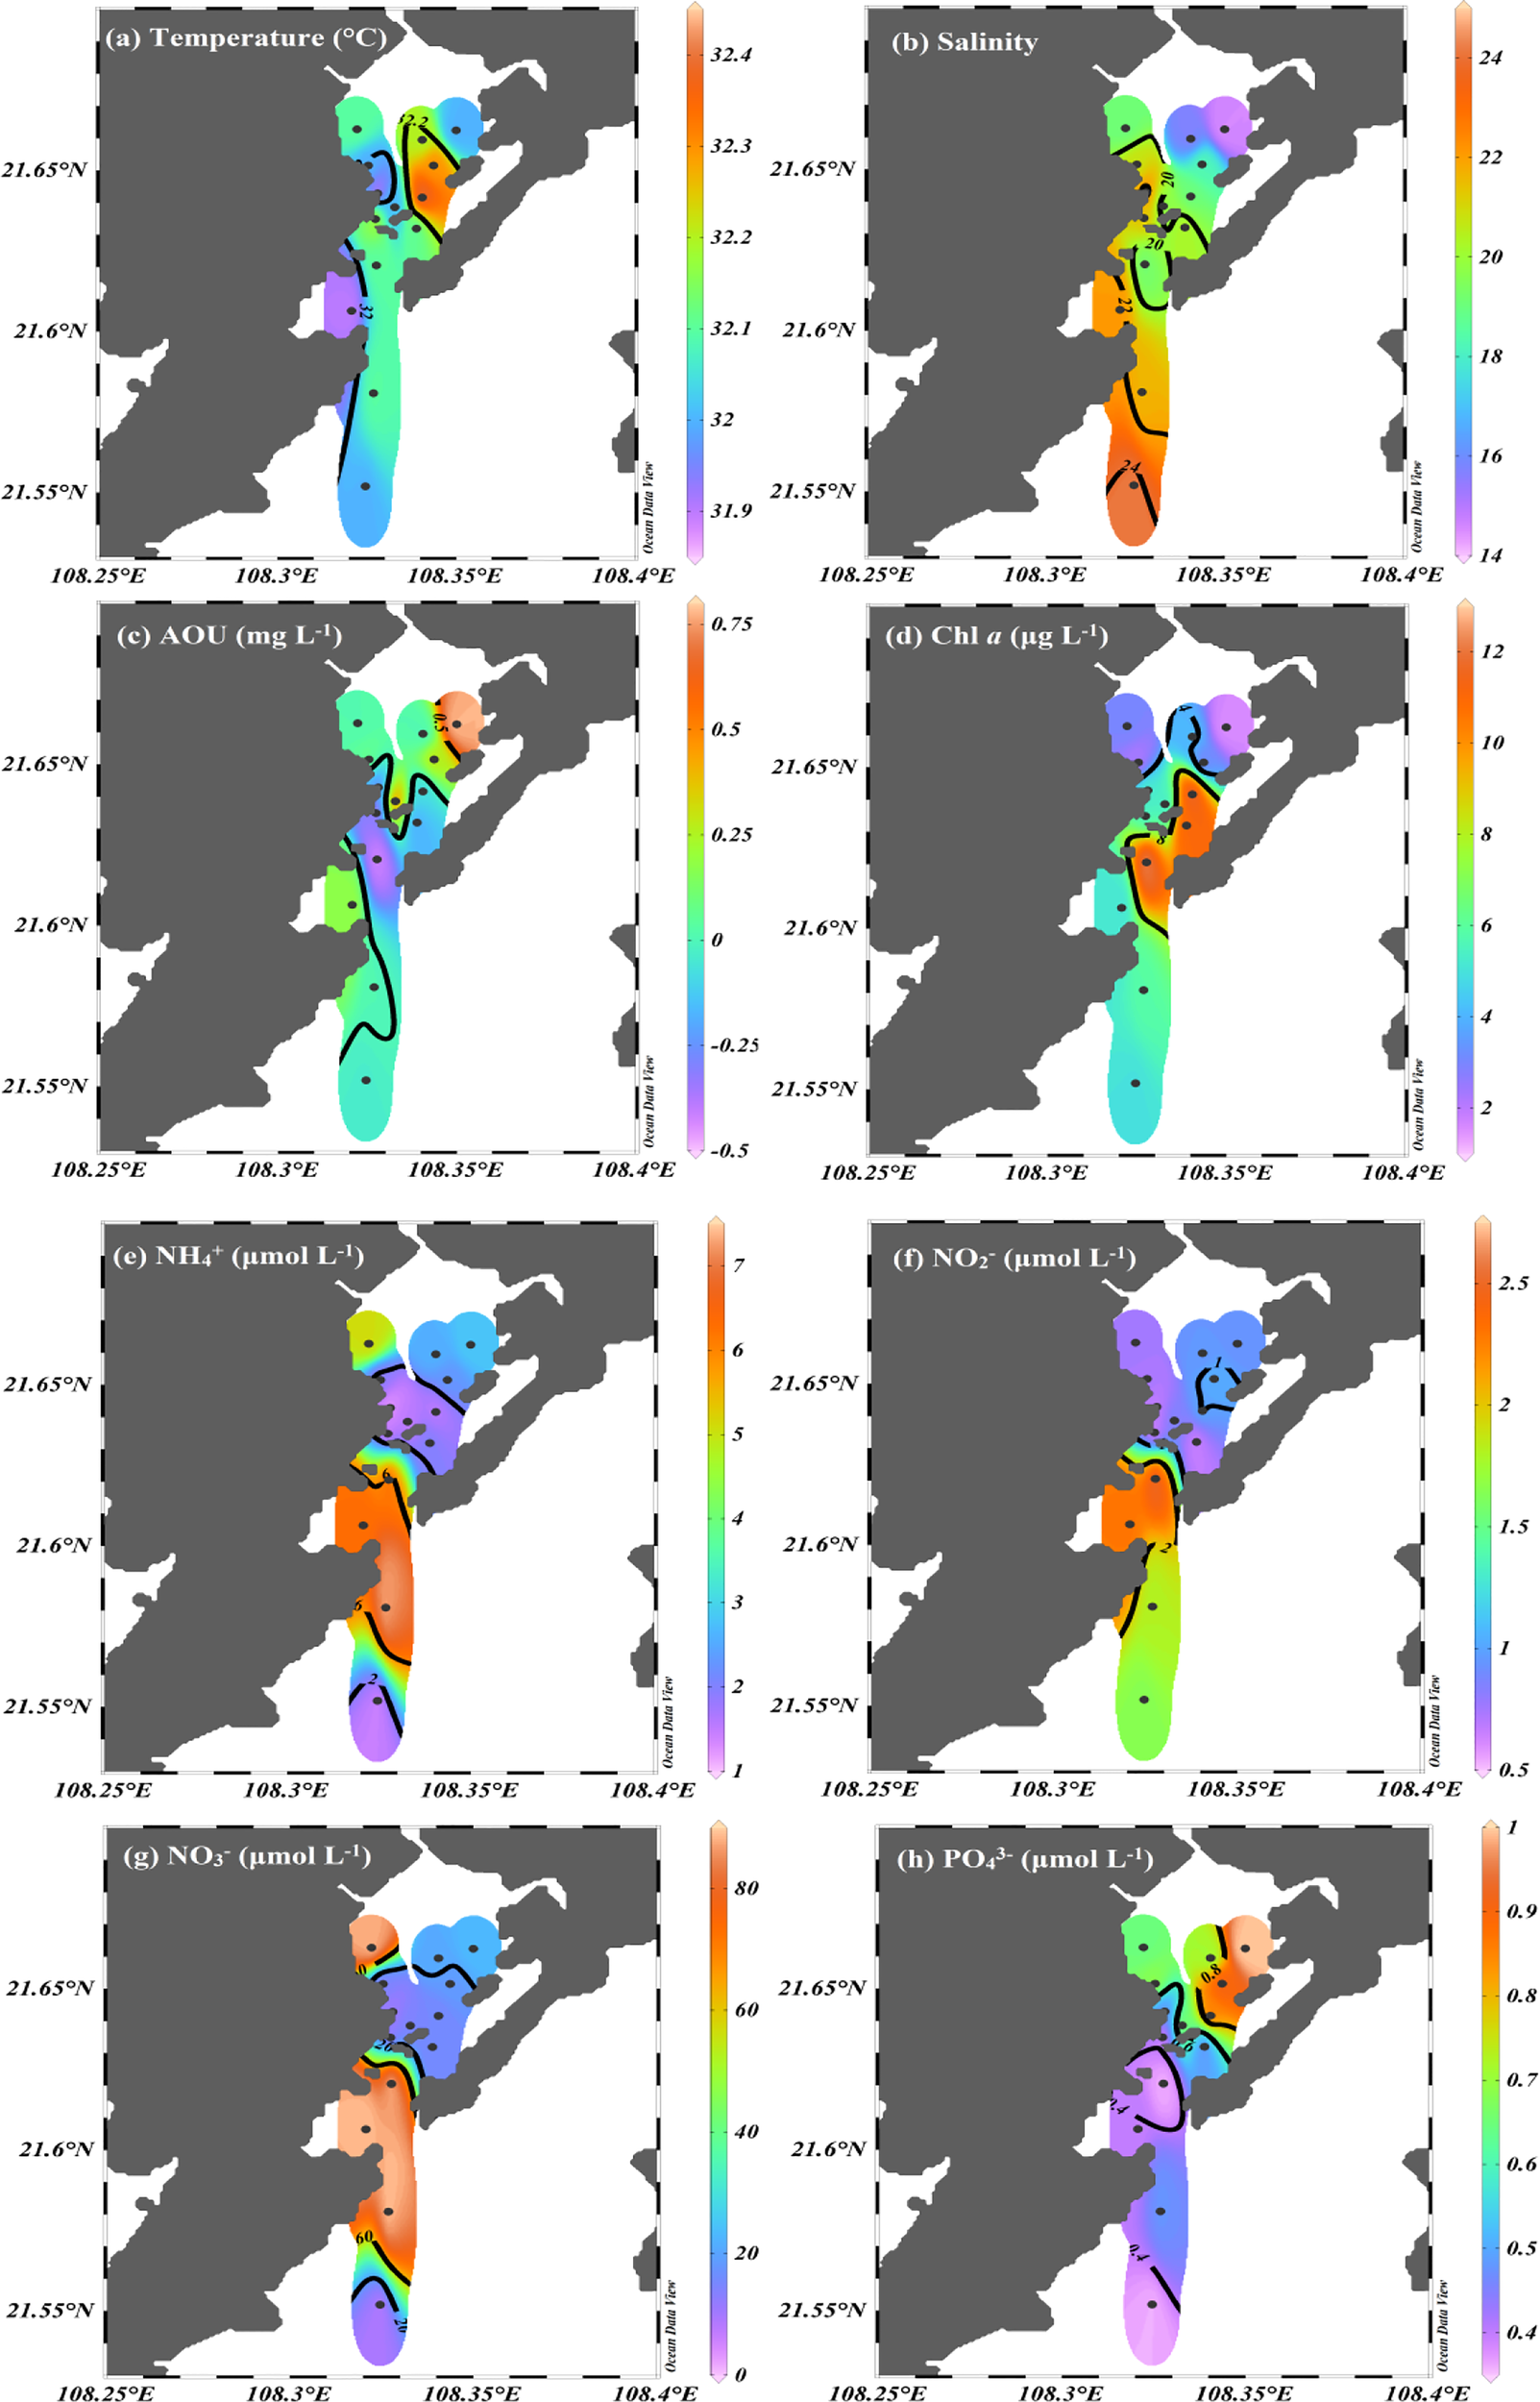
Spatial distributions of (A) temperature, (B) salinity, (C) AOU, (D) Chl a, and (E–H) nutrients (NH4+, NO2−, NO3−, PO43−) in Xi Bay. Black dots represent the sampling sites.
POC, PN, TSM, C/N ratios, and isotopic composition (δ13C and δ15N)
The concentrations of POC and PN varied between 0.38 and 1.85 mg L−1 (an average of 0.92 ± 0.34 mg L−1) and between 0.03 and 0.11 mg L−1 (an average of 0.08 ± 0.02 mg L−1), respectively (Figures 3A, B). The mean values of POC and PN were 0.86 ± 0.22 mg L−1 and 0.08 ± 0.02 mg L−1 in the upper bay and 0.96 ± 0.40 mg L−1 and 0.07 ± 0.02 mg L−1 in the lower bay, respectively. Relatively high concentrations of POC occurred in the lower bay (station W14), whereas high PN concentrations were found in the upper bay. TSM ranged from 9.80 to 36.60 mg L−1 (an average of 21.58 ± 8.55 mg L−1), and the mean value of TSM was 23.78 ± 10.94 mg L−1 in the upper bay and 19.75 ± 6.44 mg L−1 in the lower bay. The C/N ratios of POM ranged from 9.68 to 46.47 (an average of 15.51 ± 9.29), and the mean C/N ratios were 12.29 ± 1.34 in the upper bay and 17.31 ± 11.37 in the lower bay. The highest ratio occurred in station W14. δ13C and δ15N ranged from −27.0‰ to −23.5‰ (an average of −24.7‰ ± 1.1‰) and −5.4‰ to 9.6‰ (an average of 8.2‰ ± 1.2‰), respectively. The mean values of δ13C and δ15N were −25.24‰ ± 0.96‰ and 7.34‰ ± 1.41‰ in the upper bay and −24.42‰ ± 1.16‰ and 8.64‰ ± 0.73‰ in the lower bay, respectively. The high values of δ13C occurred in the bay mouth, whereas the low value was found in station W1 (upper bay). However, the δ15N values increased seaward.
Figure 3

Spatial distributions of (A) POC, (B) PN, (C) TSM, (D) C/N, (E) δ13C, and (F) δ15N in Xi Bay. Black dots represent the sampling sites.
Distributions of DOC, CDOM, and FDOM
As shown in Figure 4, the DOC value varied between 1.29 and 1.84 mg L−1 (average of 1.53 ± 0.19 mg L−1), with the highest value in station W12. The mean value of DOC was 1.55 ± 0.21 mg L−1 in the upper bay and 1.52 ± 0.19 mg L−1 in the lower bay. The CDOM absorption coefficient at a254 and a325 ranged from 2.49 to 6.63 m−1 and 0.78 to 2.00 m−1, with a mean value of 3.70 ± 1.08 m−1 and 1.18 ± 0.31 m−1, respectively. The mean values of a254 and a325 were 3.08 ± 0.62 m−1 and 1.01 ± 0.20 m−1 in the upper bay and 4.05 ± 1.15 m−1 and 1.27 ± 0.33 m−1 in the lower bay, respectively. Obviously, the level of both a254 and a325 showed an increase seaward. In addition, a significant relationship (R2 = 0.99, p < 0.01, n = 14) was found between the a254 and a325 in Xi Bay. The S275–295 ranged from 16.70 to 18.90 μm−1 (average of 17.98 ± 0.54 μm−1) and increased seaward. The mean S275–295 was 17.52 ± 0.47 μm−1 in the upper bay and 18.23 ± 0.40 μm−1 in the lower bay. The SUVA254 ranged from 0.59 to 2.23 m2 g−1 C (average of 1.07 ± 0.42 m2 g−1 C) and shared a distribution pattern similar to that of a254 and a325. The mean SUVA254 was 0.87 ± 0.19 m2 g−1 C in the upper bay and 1.21 ± 0.50 m2 g−1 C in the lower bay.
Figure 4

Spatial distributions of (A) DOC (mg L−1), (B)a254 (m−1), (C)a325 (m−1), (D)S275−295 (μm−1), and (E) SUVA254 (m2 g−1 C) in Xi Bay. Black dots represent the sampling sites.
The fluorescence intensity of C1 and C2 varied between 0.23 and 0.29 RU (average of 0.26 ± 0.01 RU) and between 0.16 and 0.22 RU (average of 0.18 ± 0.02 RU), respectively. The mean C1 and C2 values were 0.26 ± 0.02 and 0.20 ± 0.02 RU in the upper bay and 0.25 ± 0.01 and 0.17 ± 0.01 RU in the lower bay, respectively. The highest C1 and C2 occurred in W1, while the lowest C1 occurred in W9 and the lowest C2 occurred in the lower bay (stations W12 and W13). The fluorescence intensity of C3 ranged from 0.10 to 0.12 RU (average of 0.11 ± 0.01 RU) in Xi Bay, the distribution pattern was nearly homogeneous in the upper bay, and the highest value was observed in W8. Moreover, the mean C3 was 0.10 ± 0.004 RU in the upper bay and 0.11 ± 0.01 RU in the lower bay. The HIX ranged from 2.56 to 3.98 (average of 3.41 ± 0.39) and generally decreased seaward (Figure 5D). The mean HIX was 3.76 ± 0.24 in the upper bay and 3.22 ± 0.31 in the lower bay. In contrast, BIX varied from 1.02 to 1.59 (average of 1.17 ± 0.14) and increased seaward. The mean BIX was 1.09 ± 0.07 in the upper bay and 1.22 ± 0.15 in the lower bay. The FI ranged from 2.48 to 2.74 (average of 2.54 ± 0.06), and the highest FI was observed in W5. In addition, the mean FI was 2.56 ± 0.10 in the upper bay and 2.52 ± 0.02 in the lower bay.
Figure 5
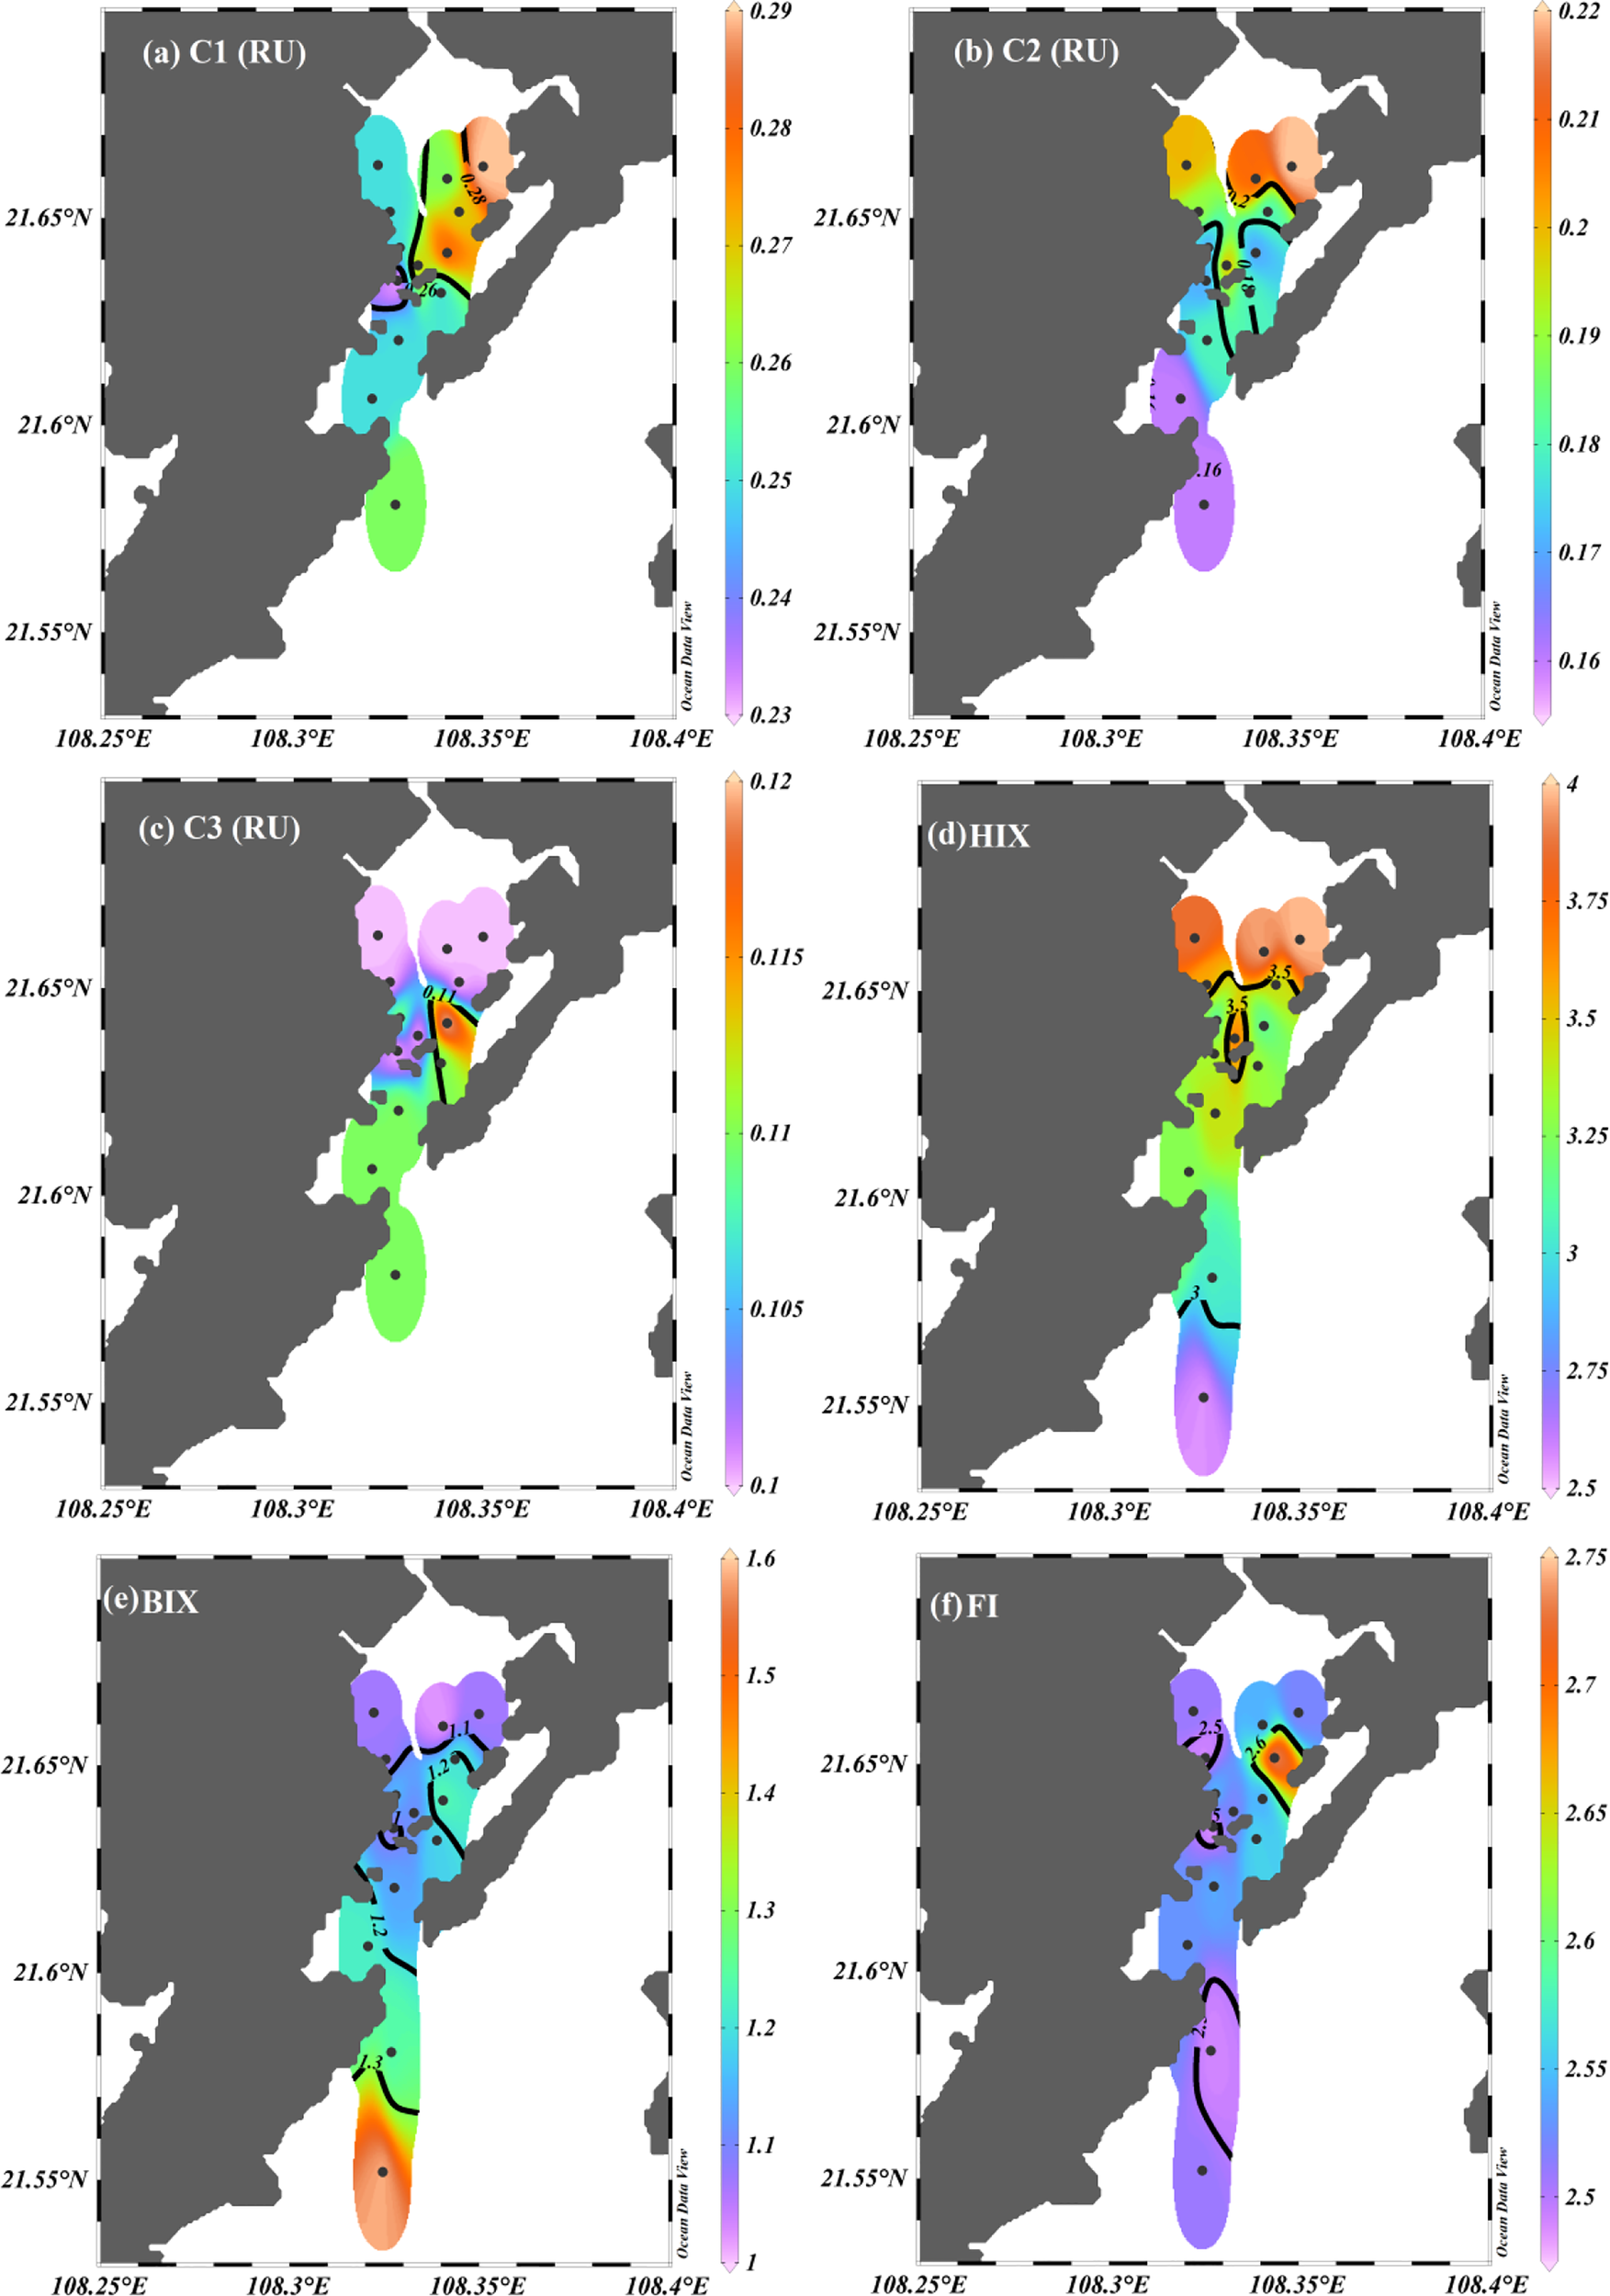
Spatial distributions of (A) C1 (RU), (B) C2 (RU), (C) C3 (RU), (D) HIX, (E) BIX, and (F) FI in Xi Bay. Black dots represent the sampling sites.
Discussion
The POM sources and their dynamics in Xi Bay
Generally, different sources of OM showed different isotopic characteristics (Ye et al., 2017; Sarma et al., 2020; Lu et al., 2022). In the upper bay, the average δ13C values (−25.3‰ ± 1.0‰) are close to the values of terrestrial C3 plants (−27‰) (Meyers, 1994; Meyers, 1997), suggesting that the terrestrial input may be the dominant POM source in this region. In addtion, the ratio of POC/Chl a can be used to distinguish the sources of POM. A high POC/Chl a ratio (>200) is generally considered to be from detrital or degraded OM (i.e., terrigenous input), whereas a lower ratio (<200) is from fresh phytoplankton. (Guo et al., 2015; Gawade et al., 2018; Gao et al., 2021). As shown in Figure 6, the high POC/Chl a ratios are >200 in the upper bay, further confirming the dominance of terrigenous input. There is a river (Fangcheng River) in the upper bay, and the high rainfall and runoff would excite more terrigenous POM into the upper bay during the rainy season. In addition, the lower Chl a (2.78 μg L−1) (t-test, p < 0.01) levels were found in the upper bay. This may be influenced by the light limitation (i.e., high turbidity due to the input of terrestrial particles), which would limit the phytoplankton growth in the upper bay. The δ15N is considered to be more sensitive than the δ13C to environmental pollution, and the values are affected by the biogeochemical processes of the POM (Ke et al., 2017; Ke et al., 2020). The δ15N compositions (7.3‰ ± 1.4‰) were higher than the values from terrestrial vascular plants (3‰) and marine organic matter (6‰) in the upper bay (Brandes and Devol, 2002; Middelburg and Herman, 2007), indicating nitrogen pollution in this region (Cai et al., 2022). After the light isotope (14N) consumption during the nitrogen biogeochemical processes, heavy 15N is retained in the residual pool (Ke et al., 2017). In addition, the concentration of dissolved inorganic nitrogen in Xi Bay was significantly higher than that in the other coastal bays in the northern Beibu Gulf, such as Qinzhou Bay (1.5 times) and Tieshangang Bay (1.7 times) (Cai et al., 2022), consistent with the above inference. Generally, we also quantified the contribution of potential POM sources by the Bayesian mixing model based on the isotopic characteristics of different sources (Table S1). The result showed that terrestrial OM (including the C3 and C4 plants, soil OM, and sewage) contributed 60.6% to the POM pool in the upper bay (Figure 7A).
Figure 6
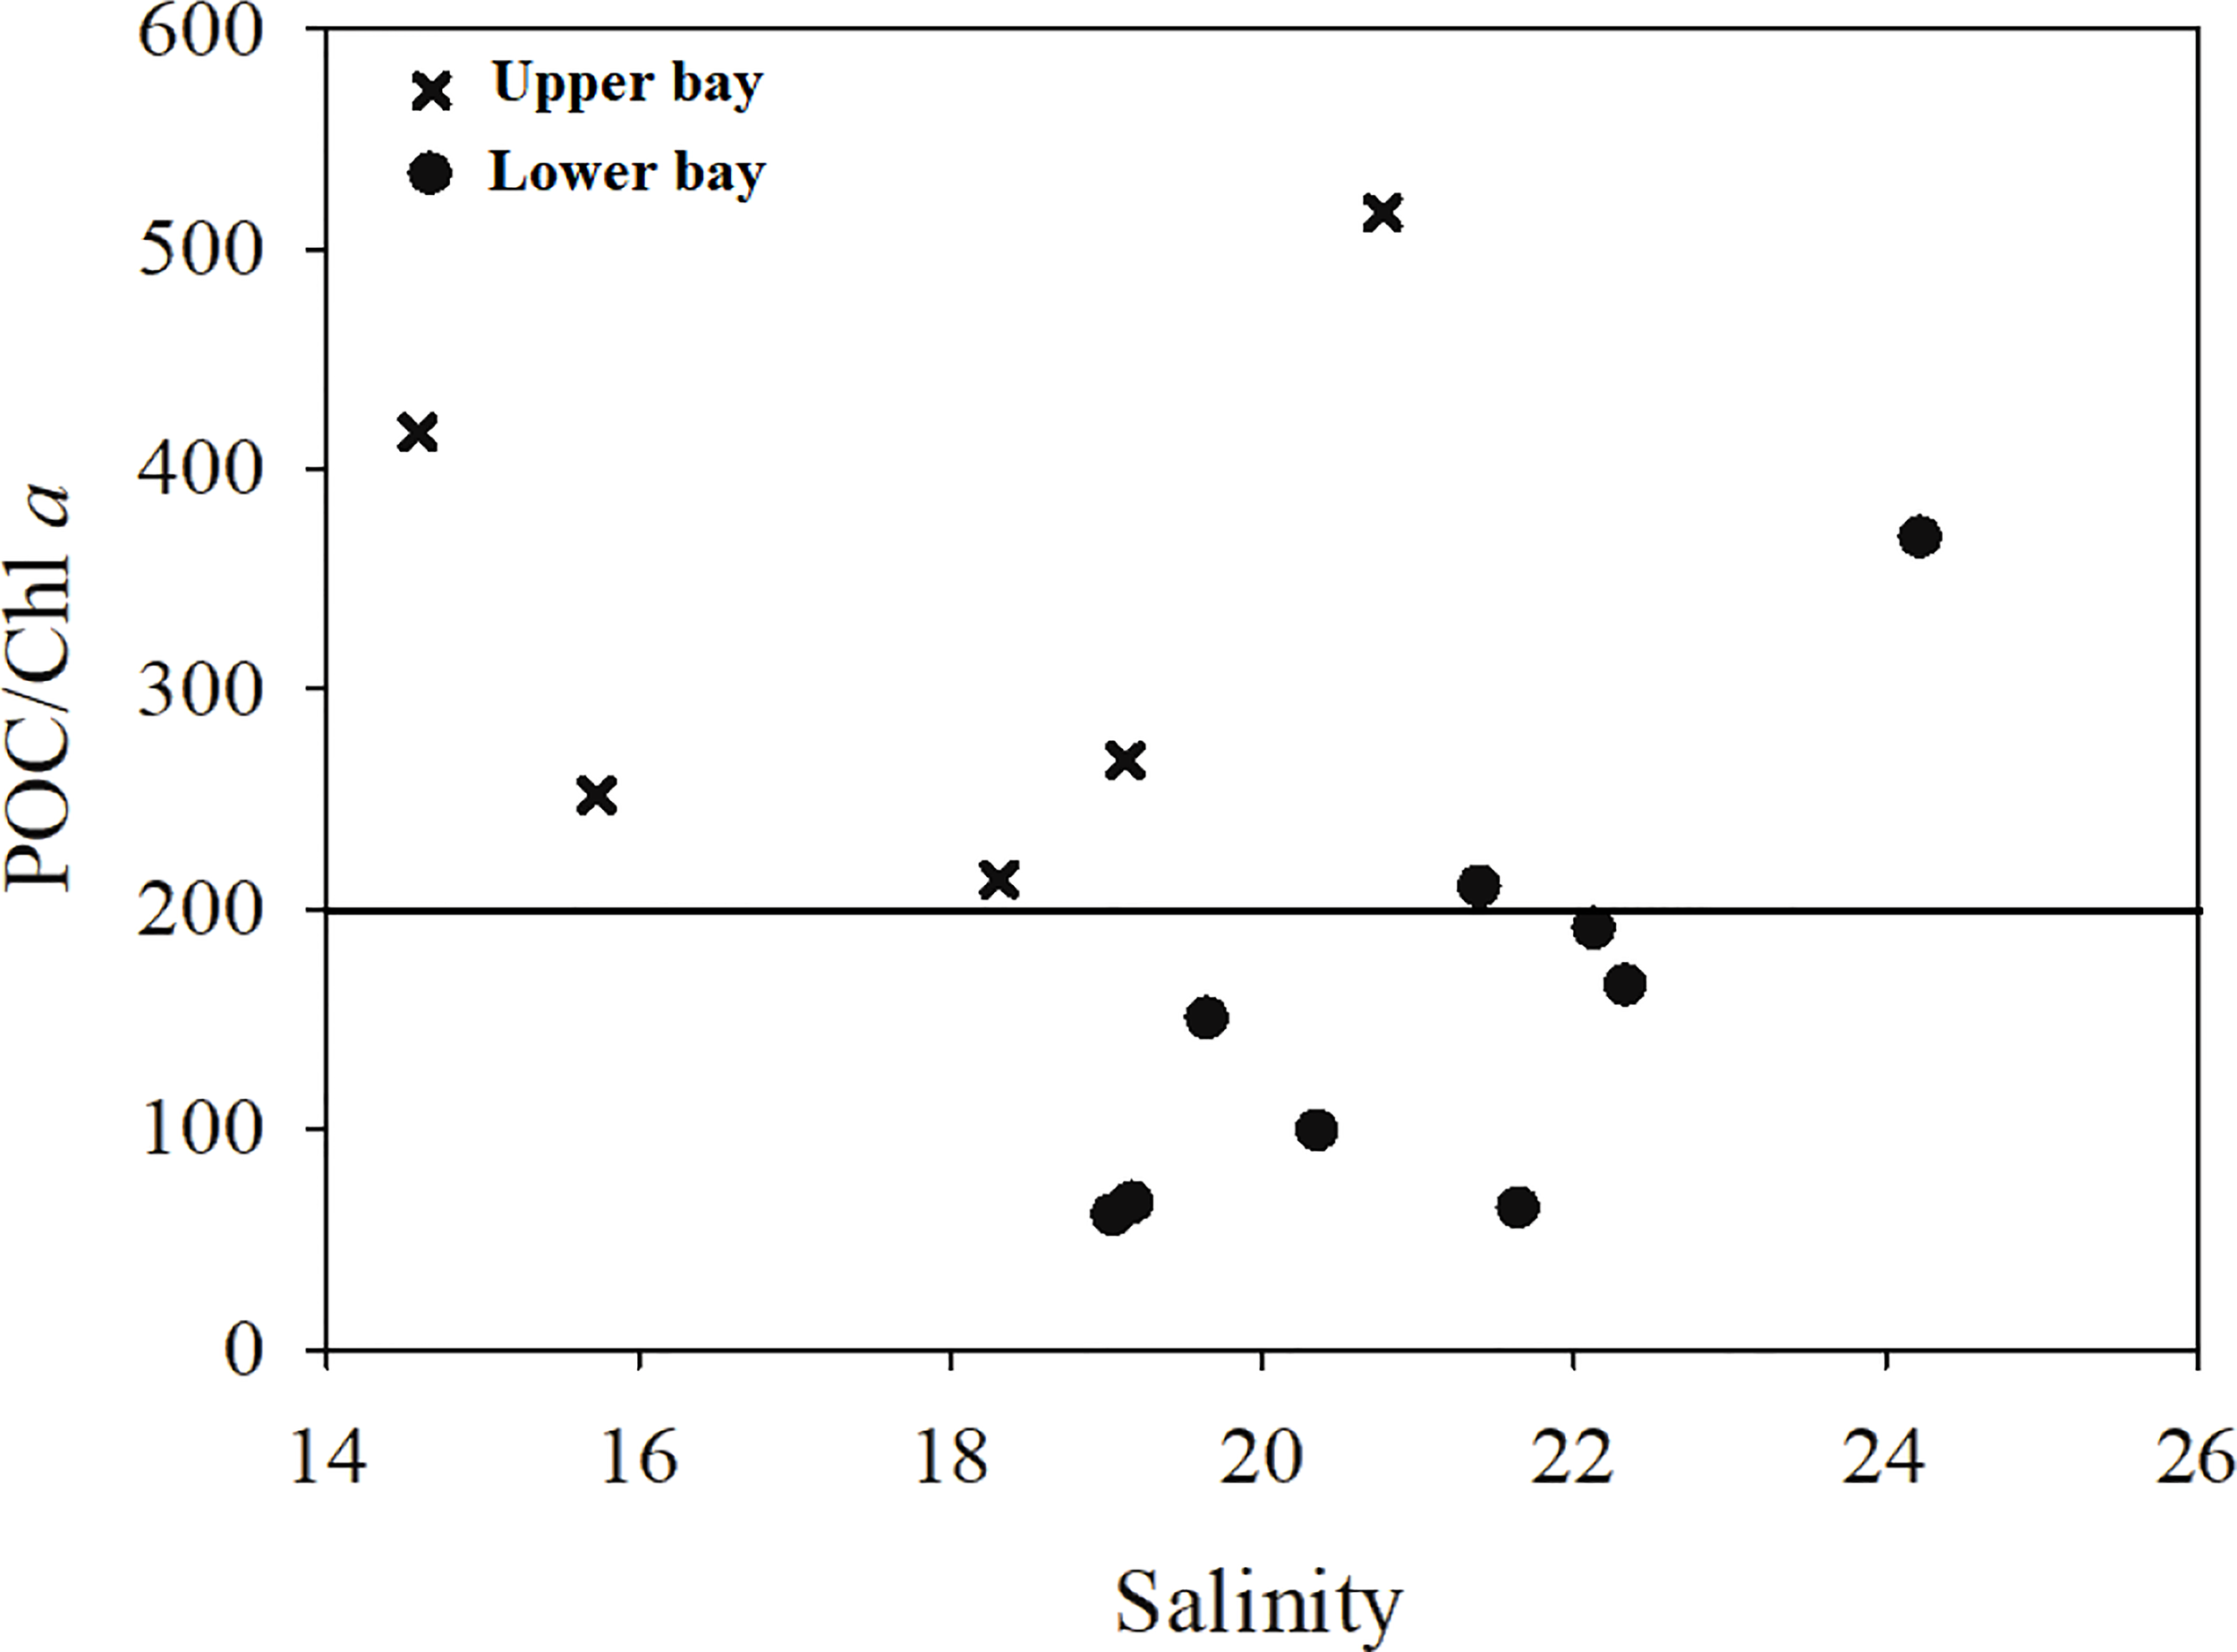
Salinity and POC/Chl a ratios in the upper bay (W1–W5) and the lower bay (W6–W14) of Xi Bay.
Figure 7
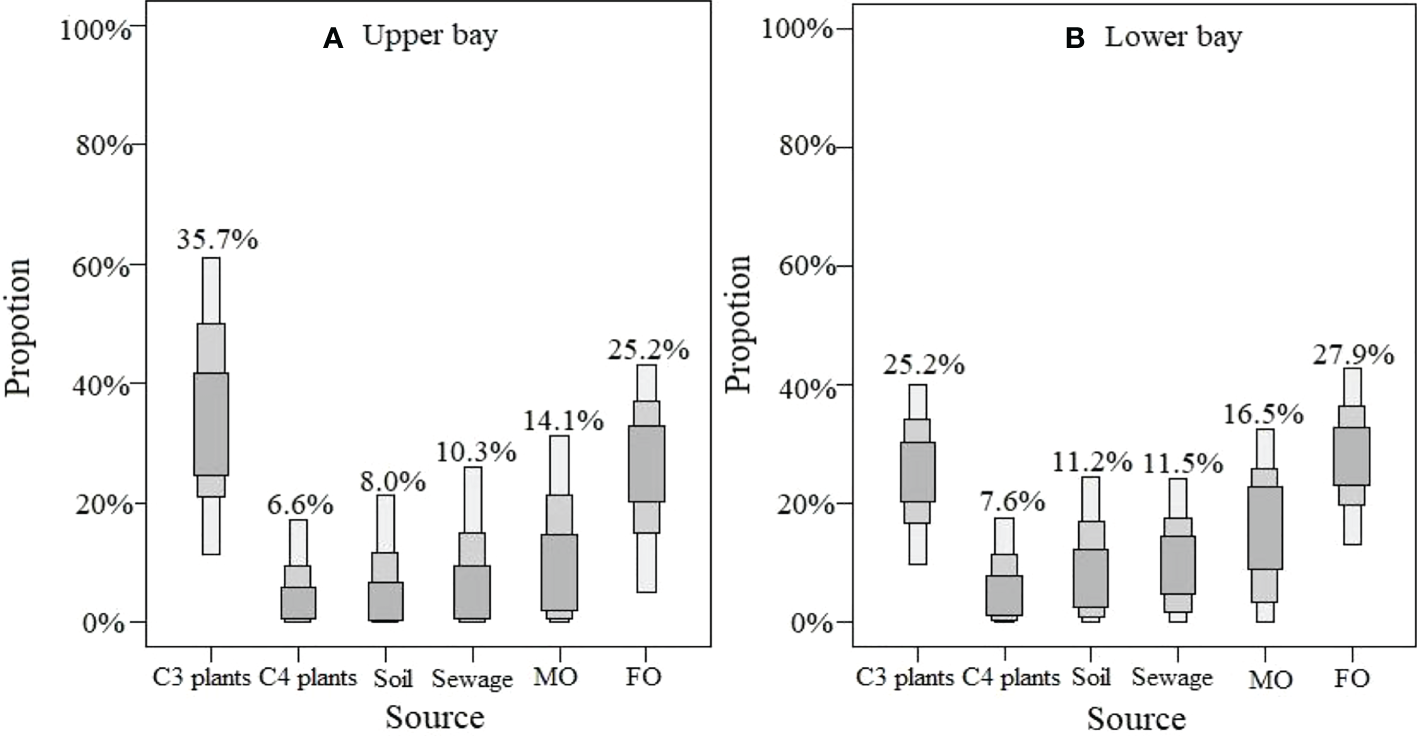
Source apportionment of the POM sources in the upper bay (A) and lower bay (B; soil represents terrestrial soil organic matter, MO represents marine organic matter, and FP represents freshwater phytoplankton). The dark boxes indicate the median values, and the light-colored boxes at the top and bottom indicate the maximum and minimum values.
In the lower bay, enhancement of δ13C values (−24.4‰ ± 1.2‰) was found in seawater. The increase in phytoplankton production may be responsible for the enriched δ13C values in the lower bay (Chen et al., 2008; Ke et al., 2017; Huang et al., 2020). In addition, except for stations W9 and W14 (Figure 6), lower POC/Chl a ratios (<200) in the lower bay (t-test, p < 0.01) indicated that the POC mainly originated from fresh phytoplankton, consistent with the higher Chl a (7.47 ± 3.22 μg L−1) (t-test, p < 0.01) in this region. Interestingly, the higher δ13C values occurred in the bay mouth (t-test, p < 0.01), which was also consistent with the distribution of higher Chl a in the bay mouth area (t-test, p < 0.01). The intense human activities in the bay mouth would carry more nutrients from the nearby region into the seawater, thus resulting in the increase of biological OM production (Figure 3). High phytoplankton biomass can consume a large amount of atmospheric CO2 due to phytoplankton growth, resulting in more HCO3− taken by the phytoplankton and, thus, enriched δ13C compositions of organic carbon (Ke et al., 2017; Gao et al., 2021). Many studies have confirmed that an abundant nutrient input into the estuaries and coastal bays would cause phytoplankton bloom easily and enrich the δ13C-POC (Gao et al., 2021), such as in Daya Bay (Ke et al., 2017) and Jiaozhou Bay (Ke et al., 2020). In addition, the δ15N compositions (8.6‰ ± 0.7‰) were higher than the values in the upper bay (t-test, p < 0.05), indicating more serious nitrogen pollution in the lower bay. As discussed above, the discharge of industrial wastewater from the port and the industrial activities contributed to the serious nitrogen pollution in the lower bay (Cai et al., 2022). Moreover, a high δ15N signal was also found in sedimentary, suspended particles and plant particulate matter on the coast of the northern Beibu Gulf (Kaiser et al., 2014; Liao et al., 2018). Unlike the upper bay, the contribution of terrestrial OM decreased to 55.5%, whereas the contribution of marine OM and freshwater phytoplankton increased to 16.5% and 27.9% in the lower bay, respectively (Figure 7B).
The sources and dynamics of DOM in Xi Bay
A significant spatiotemporal variation of DOM in the estuaries and coastal bays due to the biogeochemical gradients from estuaries and bays to the open seas was widely reported previously. These studies showed that estuaries and bays discharge large quantities of terrestrial DOM to the coastal waters, and the distribution and variability of DOM are primarily controlled by estuarine mixing (Li et al., 2019; Yang et al., 2019; Liu et al., 2020). In this study, there was no relationship between salinity and DOC (p > 0.05), suggesting no conservative mixing of DOC with seawater in Xi Bay. Previous studies showed that CDOM is usually correlated with the bulk DOC pool in the coastal area (Rochelle-Newall and Fisher, 2002; Coble, 2007; Zhu et al., 2018). However, no correlation between CDOM and DOC (p > 0.05) was found in this study. Thus, the other additional (phytoplankton production or wastewater discharge) or removal (decomposition) processes may affect DOC distribution in this region (Yu et al., 2016; Zhu et al., 2018). A similar result is also observed in the Pearl River Estuary (Chen et al., 2004; Li et al., 2019) and the Changjiang estuary (Yu et al., 2016). For the CDOM, both the a254 and a325 were positively correlated with salinity (Figures 8B, C), suggesting that physical mixing is the major factor shaping the distribution pattern of CDOM in the upper and lower bays. However, the low R2 values (0.34) for the regressions of CDOM versus salinity indicate that other processes have considerable contributions to CDOM distribution in the bay. Notably, lower a254 and a325 occurred in the upper bay (t-test, p < 0.01), which was opposite to the distribution pattern of the humic-like FDOM. It likely indicated that terrestrial input is not the main source of CDOM in this area. Thus, biological production may be a major source of CDOM. However, the Chl a content is lower in the upper bay (t-test, p < 0.01), and there is no correlation between CDOM and Chl a throughout the bay or in the upper bay. Actually, the degradation of POM (PN) can produce the humic-like component and refractory DOM components. In this study, there is a negative correlation between PN and a254 (p < 0.05, n = 13) and between PN and a325 (p < 0.05, n = 13) in Xi Bay (Figures 9C, D), and these results suggest that bacterial-mediated degradation of POM may be the primary source of CDOM (Angela et al., 2016; Bowen et al., 2019; Wang et al., 2021). In addition, the decomposition of POM also contributes to C1 due to the negative correlation between POC and C1 (Figure 9B). Microbial decomposition is considered to be a major source of the humic-like component due to the increase of humic-like fluorescence during microbial decomposition incubations (Angela et al., 2016; Bowen et al., 2019; Wang et al., 2021). Moreover, the increase in runoff during the rainy season would carry more domestic sewage or bacteria into the coastal water (Corapcioglu and Haridas, 1984; Perkins et al., 2016; Mattioli et al., 2016), contributing to the decomposition of OM. The positive AOU values (>0) in the upper bay also support the decomposition of OM (Figure 2C). Moreover, as a semi-enclosed bay, the hydrodynamic conditions in Xi Bay are weak (Cai et al., 2022), and the longer water residence times in the upper bay provide good conditions for bacteria activity. This process enhances the production of biorefractory molecules and humic-like fluorescent DOM (Asmala et al., 2018; Qu et al., 2022; He et al., 2022). However, there is no relationship between PN and the humic-like component, suggesting that the distribution of humic-like components (C1 and C2) may be less affected by the decomposition of POM. As shown in Figure 5, the higher C1 and C2 levels were all found in the upper bay (t-test, p < 0.01), and C1 and C2 were negatively correlated with salinity (Figure 8), suggesting that the dominant source of C1 and C2 could originate from the terrestrial inputs. Thus, although part of C1 and C2 was released from the degradation of POM, the increase of terrestrial input would result in the weakening of those correlations. On the contrary, the distribution of C3 increased gradually from the upper bay to the lower bay, which is quite different from the humic-like C1 and C2. Previous studies showed that the protein-like components can be produced/released by phytoplankton (Guo et al., 2011; Guo et al., 2014; Asmala et al., 2018). The significant positive relationship between C3 versus Chl a (p < 0.01, n = 13) suggests that the protein-like C3 is mainly derived from in-situ phytoplankton primary production (Figure 9A). As discussed above, the relatively low Chl a concentration may be due to high turbidity in the upper bay. Thus, the levels of C3 were lower (t-test, p < 0.01) in the upper bay due to the low Chl a concentration.
Figure 8
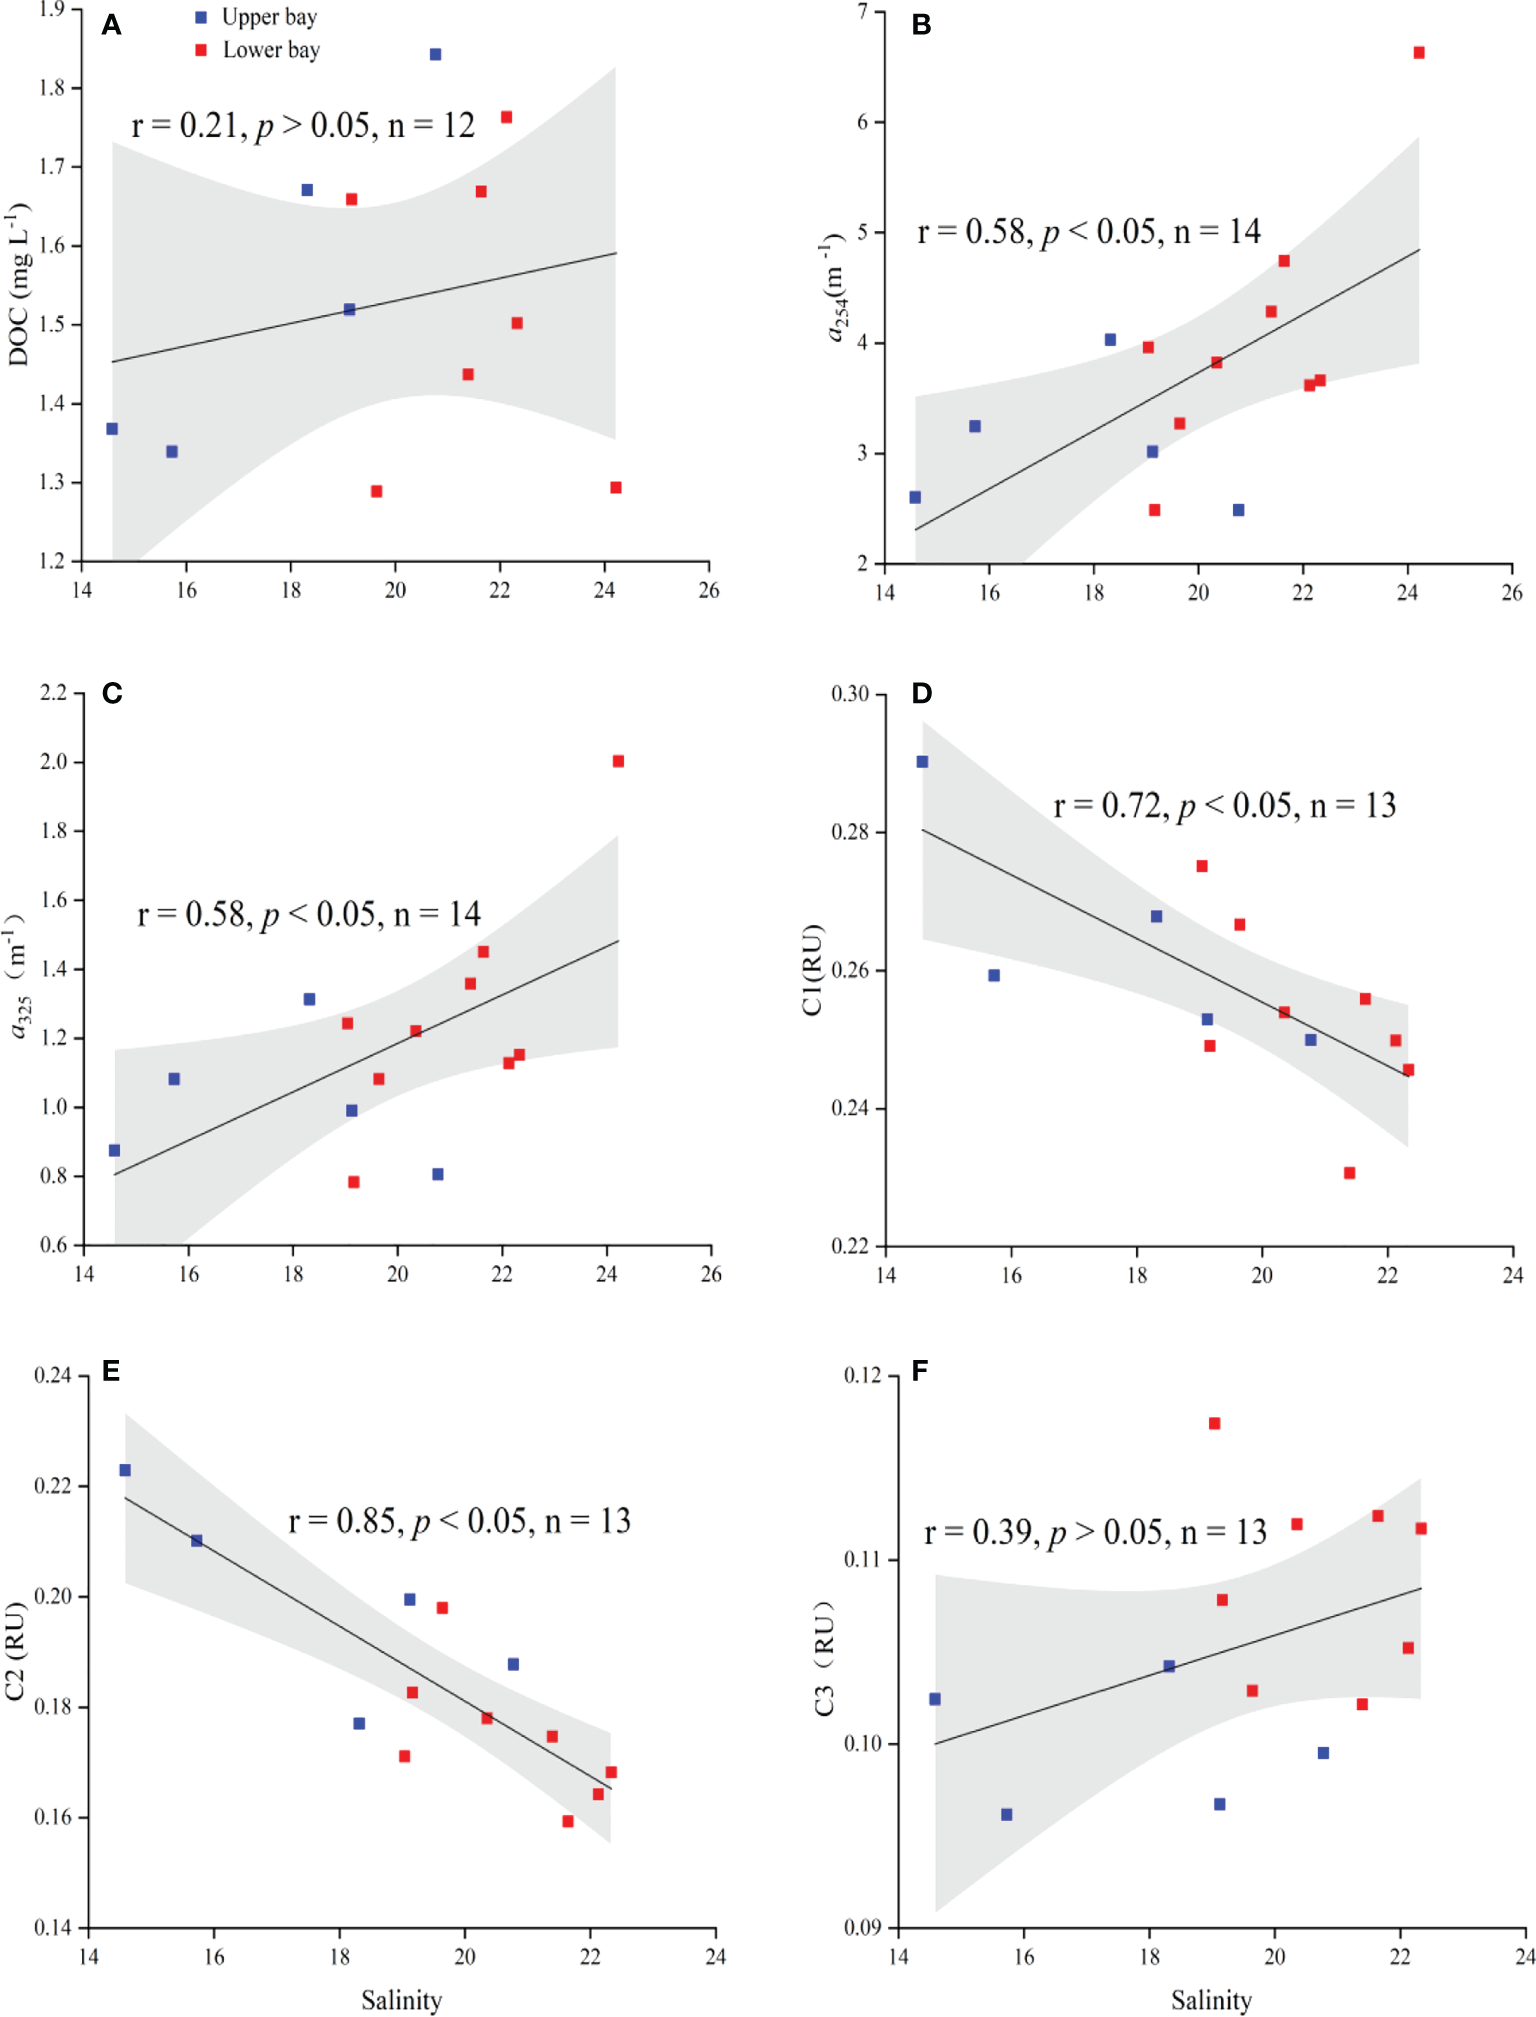
Relationships between (A) DOC and salinity, (B)a254 and salinity, (C)a325 and salinity, (D) C1 and salinity, (E) C2 and salinity, and (F) C3 and salinity in the water of Xi Bay. The black lines and gray shadows represent the linear fit lines and 95% confidence bands. Because the DOC values in stations W8 and W10 and the FDOM (C1, C2, and C3) fluorescence intensity in station W14 had no dates, these points were excluded from the analysis.
Figure 9
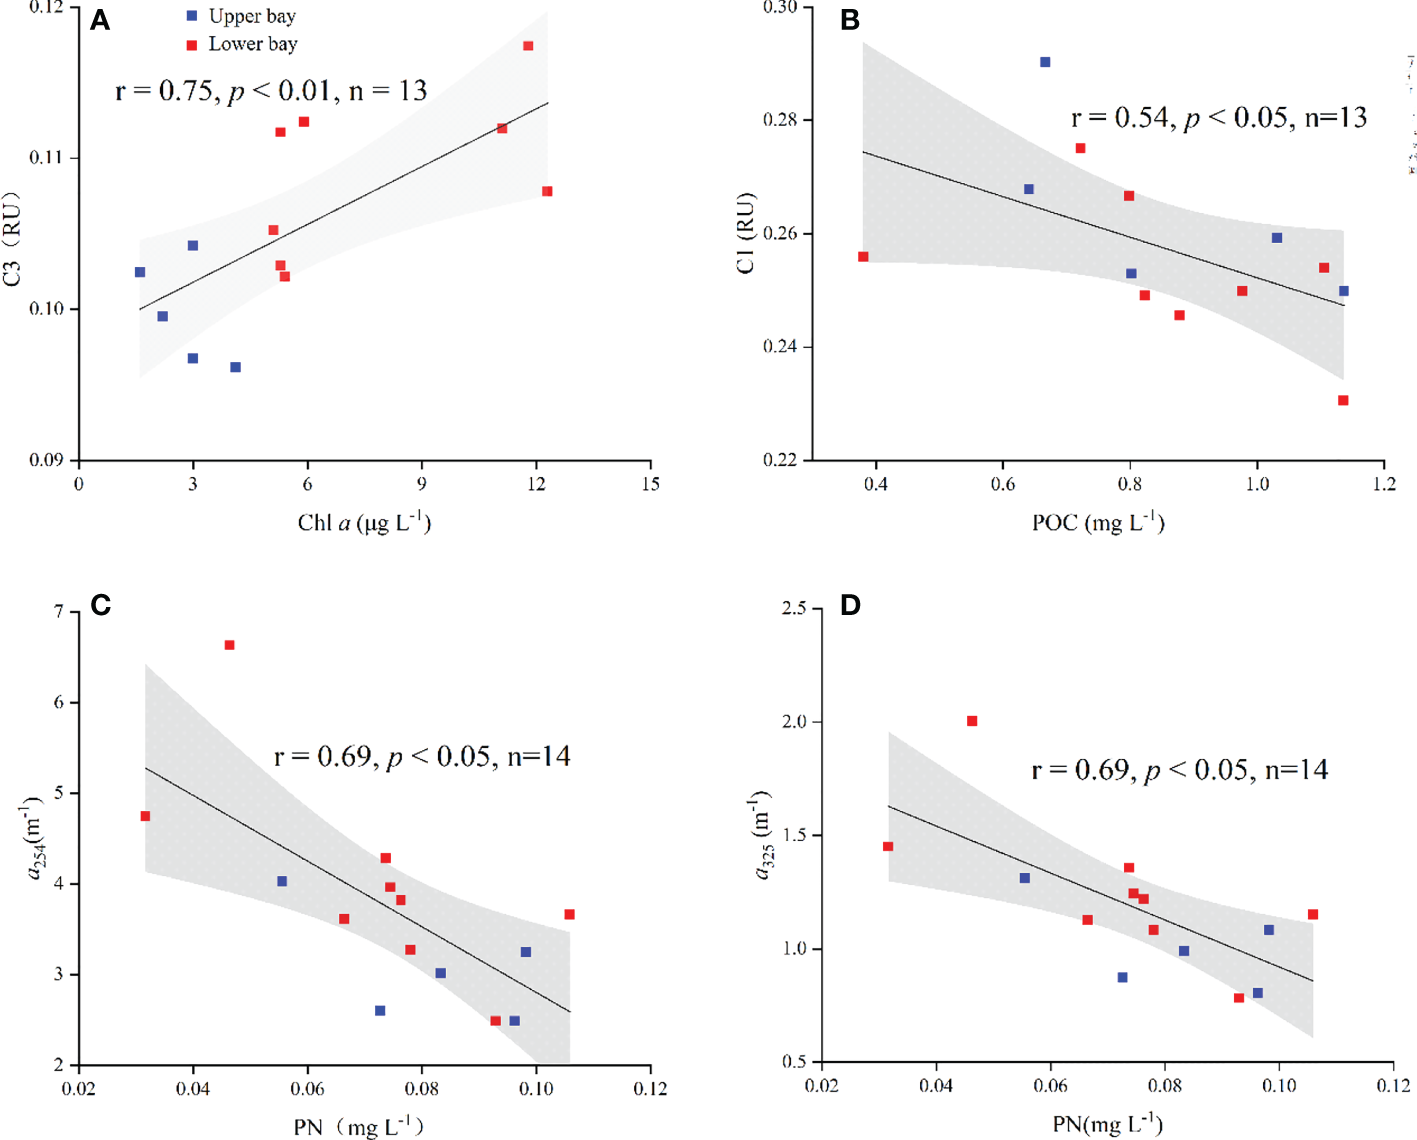
(A) Relationships between C3 and Chl a, (B) C1 and POC, (C)a254 and PN, and (D)a325 and PN in Xi Bay. The black lines and gray shadows represent the linear fit lines and 95% confidence bands. Because the C1 and C3 fluorescence intensity in station W14 had no dates, these points were excluded from the analysis.
In the lower bay, the distribution of DOC may be affected by biological activity, as the DOC is oriented in the same direction as the arrow of Chl a in the RDA analysis (Ouyang et al., 2018; Yan et al., 2022) (Figure 10B). It can be seen that there is enhanced CDOM (a254 and a325) in the seaward stations (W13 and W14) (Figures 4B, C), which is not affected by dilution. The increased salinity and the higher S275–295 (t-test, p < 0.01) suggest a decrease in terrigenous CDOM in this area. Thus, the high content of CDOM was mainly autochthonous. We believe that the decomposition of marine (fresh) POM (i.e., PN) produces more CDOM in the lower bay (Guo et al., 2015; Gawade et al., 2018; Gao et al., 2021).
Figure 10
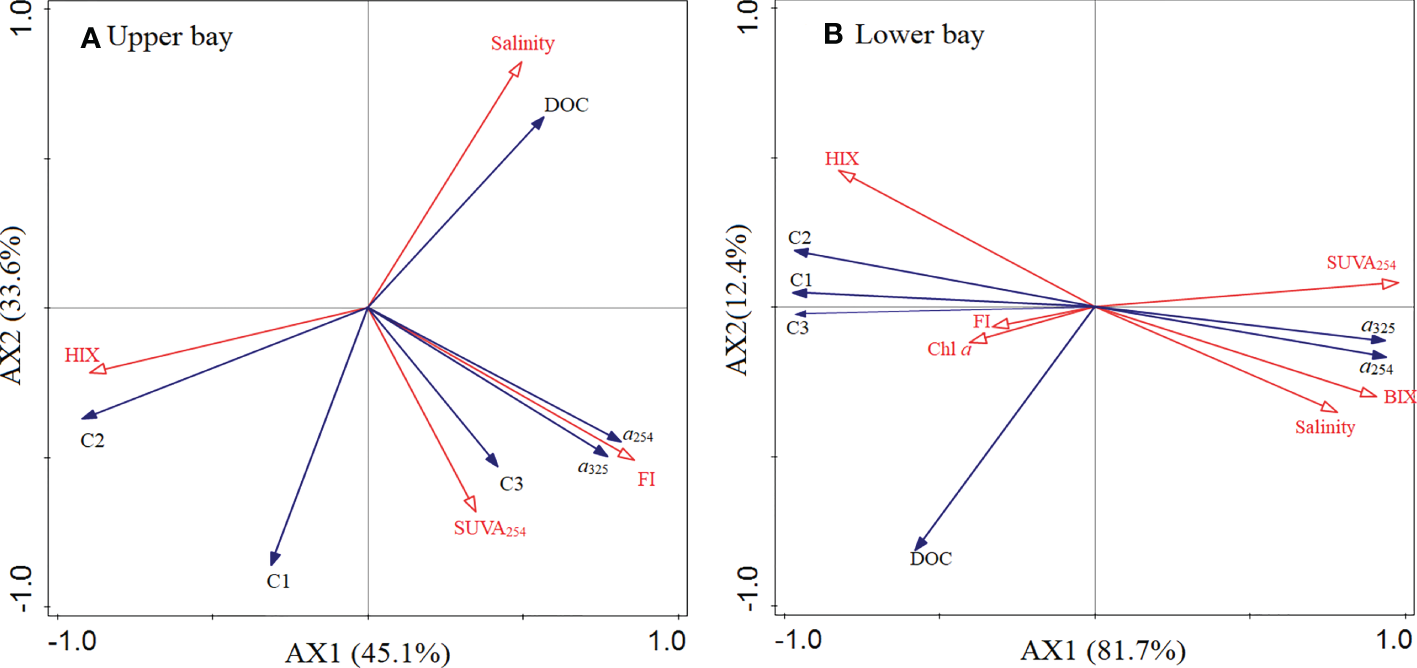
Redundancy analysis ordination showing the relationship between DOM and the environmental parameters in the upper bay (A) and the lower bay (B).
For the FDOM, the input of wastewater discharges from the bay mouth may increase the level of humic-like components, and the high leaves of fresh POC occurred in the lower bay, which would promote the production of humic-like C1. However, the level of C1 and C2 decreased from the upper bay to the lower bay, which could have been affected by the dilution of seawater. In addition to the dilution of seawater, photobleaching may be another reason for the lower level of the humic-like component in the lower bay. Generally, the humic-like FDOM intensity is lower in surface waters where sunlight penetrates and photolyzes the involved compounds (Angela et al., 2016; Wang et al., 2017; Wang et al., 2021). In this study, the low HIX further supports the above inference in the lower bay. Previous studies also showed that photobleaching in aquatic environments can alter DOM from larger molecules to smaller labile photoproducts (Angela et al., 2016). In addition, the spectral slope S275–295 shows a higher value in the lower bay, indicating the low molecular weight of DOM in this area. This distribution could be explained by the strong photobleaching in seawater, which could degrade DOM constituents and yield high spectral slopes (Zhou et al., 2018). In the lower bay, the turbidity of water may gradually decrease as the terrigenous particle input decreases. Therefore, photobleaching would be enhanced, which changes the DOM pool to low HIX and low molecular weight in the lower bay.
Interestingly, the leaves of the protein-like C3 in the lower bay were higher (t-test, p < 0.01) than those in the upper bay. Moreover, the contribution of C3 to the FDOM pool increased to 20% in the lower bay. Anthropogenic inputs (i.e., wastewater discharges) are considered important markers of protein-like components (Zhao et al., 2021; Li et al., 2021). The protein-like C3 exhibited a higher value in the bay mouth (i.e., station W8) (t-test, p < 0.01) (Figure 5). This phenomenon may be caused by the input of industrial wastewater. However, the distribution of the protein-like components is consistent with the distribution of Chl a in the lower bay (Figure 2D). Although the terrigenous input decreased in the lower bay, an abundant nutrient input was observed in the bay mouth due to intensive human activities. This favorable condition promotes the growth of phytoplankton in the lower bay. This suggests that the higher protein-like C3 in the lower bay is mainly from the autochthonous organism activities due to the phytoplankton blooms induced by the high anthropogenic nutrient input. Thus, the direct input of industrial wastewater may have a little effect on the protein-like C3, which is also supported by the high FI (>1.9) (Figure 5).
Conclusion
In this study, POC, PN, δ13C and δ15N of POM, DOC, CDOM, and FDOM were determined to explore the dynamics of OM in Xi Bay during the rainy season. A summary of the origin of POM and DOM and its biogeochemical processes is presented in Figure 11. In the upper bay, our results showed that POC mainly originated from terrestrial sources. However, the negative relationship between CDOM and PN suggested that bacterial-mediated decomposition of POM may be the primary source of CDOM. The negative correlation between the humic-like fluorescent components (C1 and C2) and salinity suggested that those components were mainly affected by terrestrial input. The significant correlation between the protein-like component (C3) and Chl a suggested that C3 was mainly derived from phytoplankton production in the upper bay. In the lower bay, the increase of δ13C indicated an increasing contribution of marine POC. The high levels of CDOM may be due to the decomposition of marine (fresh) POM in the lower bay. However, the low levels of C1 and C2 may be affected by dilution with seawater, and the increased levels of the protein-like C3 were affected by enhanced primary production. In addition, the enriched δ15N indicated serious nitrogen pollution in both the upper and lower bays. This study highlights that the biological production of OM fueled by nutrients resulting from human activities is the dominant process in the bay. Thus, human activity and biological processes must be fully considered to better understand carbon and nitrogen cycling in intensive human activities or nutrient-rich bays.
Figure 11

Simplified schematic sketch summarizing the major biogeochemical processes in Xi Bay.
Funding
This study was supported by the National Natural Science Foundation of China (U1901213, 92158201), Guangdong Provincial College Innovation Team Project (2019KCXTF021), First-Class Discipline Plan of Guangdong Province (080503032101, 231420003), and Guangxi Natural Science Foundation of China (2020GXNSFBA297065).
Acknowledgments
We would like to thank the Marine Environmental Monitoring Centre of Beihai, State Oceanic Administration, for their support in collecting the water samples.
Publisher’s note
All claims expressed in this article are solely those of the authors and do not necessarily represent those of their affiliated organizations, or those of the publisher, the editors and the reviewers. Any product that may be evaluated in this article, or claim that may be made by its manufacturer, is not guaranteed or endorsed by the publisher.
Statements
Data availability statement
The original contributions presented in the study are included in the article/Supplementary Material. Further inquiries can be directed to the corresponding author.
Author contributions
FC was responsible for the conceptualization. XL and QL prepared and wrote the original draft. FC wrote, reviewed, and edited the manuscript. XZ was responsible for the data curation. CC and QZ were responsible for the experimental operation. XL and QL were responsible for the field sampling. FC and QL funded the acquisition. All authors contributed to the article and approved the submitted version.
Conflict of interest
The authors declare that the research was conducted in the absence of any commercial or financial relationships that could be construed as a potential conflict of interest.
Supplementary material
The Supplementary Material for this article can be found online at: https://www.frontiersin.org/articles/10.3389/fmars.2022.1043278/full#supplementary-material
References
1
Angela M. ,. H. Kraus T. E. ,. C. Pellerin B. A. (2016). Optical properties of dissolved organic matter (DOM): Effects of biological and photolytic degradation. Limnology Oceanography61, 1015–1032. doi: 10.1002/lno.10270
2
Asmala E. Haraguchi L. Markager S. Massicotte P. Riemann B. Staehr P. A. et al . (2018). Eutrophication leads to accumulation of recalcitrant autochthonous organic matter in coastal environment. Global Biogeochemical Cycles32, 1673–1687. doi: 10.1029/2017GB005848
3
Bowen J. C. Kaplan L. A. Cory R. M. (2019). Photodegradation disproportionately impacts biodegradation of semi-labile DOM in streams. Limnology Oceanography65, 1–14. doi: 10.1002/lno.11244
4
Brandes J. A. Devol A. H. (2002). A global marine-fixed nitrogen isotopic budget: implications for Holocene nitrogen cycling. Global Biogeochem. Cycles16, 1120–1134. doi: 10.1029/2001GB001856
5
Cai S. Lao Q. Jin G. Chen C. Zhou X. Zhu Q. et al . (2022). Sources of nitrate in a heavily nitrogen pollution bay in beibu gulf, as identified using stable isotopes. Front. Mar. Sci.9, 956474. doi: 10.3389/fmars.2022.956474
6
Chen F. J. Jing L. Qian B. H. Wu Z. Huang P. Chen. K. et al . (2018). Geochemical assessment and spatial analysis of heavy metals in the surface sediments in the Eastern beibu gulf: A reflection on the industrial development of the south China coast. Int. J. Environ. Res. Public Health15, 496. doi: 10.3390/ijerph15030496
7
Chen Z. Li Y. Pan J. (2004). Distributions of colored dissolved organic matter and dissolved organic carbon in the pearl river estuary, China. Cont. Shelf Res.24, 1845–1856. doi: 10.1016/j.csr.2004.06.011
8
Chen F. R. Zhang L. Yang Y. Q. Zhang D. R. (2008). Chemical and isotopic alteration of organic matter during early diagenesis: evidence from the coastal area off-shore the pearl river estuary, south China. J. Mar. Systems.74, 372–380. doi: 10.1016/j.jmarsys.2008.02.004
9
Coble P. G. (1996). Characterization of marine and terrestrial DOM in seawater using excitation emission matrix spectroscopy. Marine Chemistry51 (4), 325–346. doi: 10.1016/0304-4203(95)00062-3
10
Coble P. G. (2007). Marine optical biogeochemistry: the chemistry of ocean color. Chem. Reviews-Columbus107 (2), 402–418. doi: 10.1021/cr050350+
11
Corapcioglu M. Y. Haridas A. (1984). Transport and fate of microorganisms in porous media: A theoretical investigation. J. Hydrology72, 149–169. doi: 10.1016/0022-1694(84)90189-6
12
Dan S. F. Cui D. Y. Yang B. Wang X. Ning Z. Lu D. et al . (2022). Sources, burial flux and mass inventory of black carbon in surface sediments of the daya bay, a typical mariculture bay of China. Mar. pollut. Bulletin.179 (5-12), 113708. doi: 10.1016/j.marpolbul.2022.113708
13
Dan S. F. Lan W. L. Yang B. Han L. J. Ning Z. M. (2020). Bulk sedimentary phosphorus in relation to organic carbon, sediment textural properties and hydrodynamics in the northern beibu gulf, south China Sea. Mar. pollut. Bull.155, 111176. doi: 10.1016/j.marpolbul.2020.111176
14
Gao L. Gao Y. Zong H. Guo L. (2019). Elucidating the hidden nonconservative behavior of DOM in large river-dominated estuarine and coastal environments. J. Geophysical Research: Oceans124, 4258–4271. doi: 10.1029/2018JC014731
15
Gao C. Yu F. Chen J. Huanhg Z. Jiang Y. Zhuang Z. et al . (2021). Anthropogenic impact on the organic carbon sources, transport and distribution in a subtropical semi-enclosed bay. Sci. Total Environ.767, 145047. doi: 10.1016/j.scitotenv.2021.145047
16
Gawade L. Krishna M. S. Sarma V. V. S. S. Hemalatha K. P. J. Rao Y. V. (2018). Spatio-temporal variability in the sources of particulate organic carbon and nitrogen in a tropical godavari estuary. Estuar. Coast. Shelf Sci.215, 20–29. doi: 10.1016/j.ecss.2018.10.004
17
Guo W. Yang L. Hong H. Stedmon C. Wang F. Xu J. et al . (2011). Assessing the dynamics of chromophoric dissolved organic matter in a subtropical estuary using parallel factor analysis. Mar. Chem.124 (1-4), 125–133. doi: 10.1016/j.marchem.2011.01.003
18
Guo W. Yang L. Zhai W. D. Chen W. Z. Osburn C. L. Huang X. et al . (2014). Runoff-mediated seasonal oscillation in the dynamics of dissolved organic matter in different branches of a large bifurcated estuary–the changjiang estuary. J. Geophysical Research: Biogeosciences.119, 7 7 6–7 793. doi: 10.1002/2013JG002540
19
Guo W. Ye F. Xu S. Jia G. D. (2015). Seasonal variation in sources and processing of particulate organic carbon in the pearl river estuary, south China. Estuar. Coast. Shelf Sci.167, 540–548. doi: 10.1016/j.ecss.2015.11.004
20
He D. Li P. He C. Wang Y. Shi Q. (2022). Eutrophication and watershed characteristics shape changes in dissolved organic matter chemistry along two river-estuarine transects. Water Res.214, 118196. doi: 10.1016/j.watres.2022.118196
21
Helms J. R. Stubbins A. Ritchie J. D. Minor E. C. Kieber D. J. Mopper K. (2008). Absorption spectral slopes and slope ratios as indicators of molecular weight, source, and photobleaching of chromophoric dissolved organic matter. Limnology Oceanography53 (3), 955–969. doi: 10.4319/lo.2008.53.3.0955
22
Huang C. Chen F. J. Zhang S. W. Chen C. Q. Meng Y. F. Zhu Q. M. et al . (2020). Carbon and nitrogen isotopic composition of particulate organic matter in the pearl river estuary and the adjacent shelf. Estuar. Estuarine Coast. Shelf Science.246, 107003. doi: 10.1016/j.ecss.2020.107003
23
Huguet A. Vacher L. Relexans S. Saubusse S. Froidefond J. M. Parlanti E. (2009). Properties of fluorescent dissolved organic matter in the gironde estuary. Organic Geochemistry.40 (6), 706–719. doi: 10.1016/j.orggeochem.2009.03.002
24
Kaiser D. Unger D. Qiu G. (2014). Particulate organic matter dynamics in coastal systems of the northern beibu gulf. Continental Shelf Res.82, 99–118. doi: 10.1016/j.csr.2014.04.006
25
Ke Z. X. Chen D. T. Liu J. X. Tan Y. H. (2020). The effects of anthropogenic nutrient inputs on stable carbon and nitrogen isotopes in suspended particulate organic matter in jiaozhou bay, China. Continental Shelf Res.208, 104244. doi: 10.1016/j.csr.2020.104244
26
Ke Z. X. Tan Y. H. Huang L. M. Zhao C. Y. Jiang X. (2017). Spatial distributions of δ13C, δ15N and C/N ratios in suspended particulate organic matter of a bay under serious anthropogenic influences: Daya bay, China. Mar. pollut. Bull.114, 183–191. doi: 10.1016/j.marpolbul.2016.08.078
27
Lao Q. Cai S. Huang P. Chen F. Su Q. Lei X. et al . (2022a). Contaminant characteristics and influencing factors of heavy metals in seawater and sediments in a typical mariculture bay in south China. Front. Mar. Sci.9. doi: 10.3389/fmars.2022.923494
28
Lao Q. Liu G. Shen Y. Su Q. Gao J. Chen F. (2020). Distribution characteristics and fluxes of nutrients in the rivers of the beibu gulf. Hai Yang Xue Bao42 (12), 93–100. doi: 10.3969/j.issn.0253–4193.2020.12.010
29
Lao Q. B. Liu G. Q. Shen Y. L. Su Q. Z. Lei X. T. (2021b). Biogeochemical processes and eutrophication status of nutrients in the northern beibu gulf, south China. J. Earth System Sci.130, 119. doi: 10.1007/s12040-021-01706-y
30
Lao Q. B. Liu G. Q. Zhou X. Chen F. J. Zhang S. W. (2021a). Sources of polychlorinated biphenyls (PCBs) and dichlorodiphenyltrichloroethanes (DDTs) found in surface sediment from coastal areas of beibu gulf: A reflection on shipping activities and coastal industries. Mar. pollut. Bull.167, 112318. doi: 10.1016/j.marpolbul.2021.112318
31
Lao Q. B. Su Q. Z. Liu G. Q. Shen Y. L. Chen F. J. (2019). Spatial distribution of and historical changes in heavy metals in the surface seawater and sediments of the beibu gulf, China. Mar. pollut. Bull.146, 427–434. doi: 10.1016/j.marpolbul.2019.06.080
32
Lao Q. Zhang S. Li Z. Chen F. Zhou X. Jin G. et al . (2022b). Quantification of the seasonal intrusion of water masses and their impact on nutrients in the beibu gulf using dual water isotopes. J. Geophysical Research: Oceans127, e2021JC018065. doi: 10.1029/2021JC018065
33
Liao W. Hu J. Zhou H. Hu J. Peng P. Deng W. (2018). Sources and distribution of sedimentary organic matter in the beibu gulf, China: Application of multiple proxies. Mar. Chem.206, 74–83. doi: 10.1016/j.marchem.2018.09.006
34
Lin Y. Li Y. Zheng B. Yin X. Wang L. He J. et al . (2019). Evolution of sedimentary organic matter in a small river estuary after the typhoon process: A case study of quanzhou bay. Sci. Total Environ.686 (OCT.10), 290–300. doi: 10.1016/j.scitotenv.2019.05.452
35
Li Y. Song G. Massicotte P. Yang F. M. Li R. H. Xie H. X. (2019). Distribution, seasonality, and fluxes of dissolved organic matter in the pearl river (Zhujiang) estuary, China. Biogeosciences16 (13), 2751–2770. doi: 10.5194/bg-16-2751-2019
36
Liu G. Lao Q. Su Q. Shen Y. Chen F. Qing S. et al . (2020). Spatial and seasonal characteristics of dissolved heavy metals in the aquaculture areas of beibu gulf, south China. Hum. Ecol. Risk Assessment: Int. J.26 (7), 1957–1969. doi: 10.1080/10807039.2019.1629273
37
Liu Y. Ye Q. Huang W. Feng L. Wang Y. Xie Z. (2020). Spectroscopic and molecular-level characteristics of dissolved organic matter in the pearl river estuary, south China. Sci. Total Environment.710, 136307. doi: 10.1016/j.scitotenv.2019.136307
38
Li Y. Z. Zhang Y. b. Li Z. Wang J. Dang C. Y. Fu J. (2022). Characterization of colored dissolved organic matter in the northeastern south China Sea using EEMs-PARAFAC and absorption spectroscopy. J. Sea Res.180, 102159. doi: 10.1016/j.seares.2021.102159
39
Li P. Zhao C. Liu K. Xiao X. Wang Y. Wang Y. et al . (2021). Anthropogenic influences on dissolved organic matter in three coastal bays, north China. Front. Earth Sci.9. doi: 10.3389/feart.2021.697758
40
Lorenzen C. J. (1967). Determination of chlorophyll and pheopigments: spectrophotometric equations. Limnology Oceanography12, 343–346. doi: 10.4319/lo.1967.12.2.0343
41
Lu X. Zhou X. Jin G. Chen F. Zhang S. Li Z. et al . (2022). Biological impact of typhoon wipha in the coastal area of western guangdong: A comparative field observation perspective. J. Geophysical Research: Biogeosciences127, e2021JG006589. doi: 10.1029/2021JG006589
42
Mattioli M. C. Sassoubre L. M. Russell T. L. Boehm A. B. (2016). Decay of sewage-sourced microbial source tracking markers and fecal indicator bacteria in marine waters. Water Res.108, 106–114. doi: 10.1016/j.watres.2016.10.066
43
McKnight D. M. Boyer E. W. Westerhoff P. K. Doran P. T. Kulbe T. Andersen D. T. (2001). Spectrofluorometric characterization of dissolved organic matter for indication of precursor organic material and aromaticity. Limnol. Oceanogr.46, 38–48. doi: 10.4319/lo.2001.46.1.0038
44
Meyers P. A. (1994). Preservation of elemental and isotopic source identification of sedimentary organic matter. Chem. Geology114, 289–302. doi: 10.1016/0009-2541(94)90059-0
45
Meyers P. A. (1997). Organic geochemical proxies of paleoceanographic, paleolimnologic, and paleoclimatic processes. Organic Geochemistry27, 213–250. doi: 10.1016/s0146-6380(97)00049-1
46
Middelburg J. J. Herman P. M. (2007). Organic matter processing in tidal estuaries. Mar. Chem.106, 127–147. doi: 10.1016/j.marchem.2006.02.007
47
Ouyang W. Yang W. Tysklind M. Xu Y. Lin C. Gao X. et al . (2018). Using river sediments to analyze the driving force difference for non-point source pollution dynamics between two scales of watersheds. Water Res.139, 311–320. doi: 10.1016/j.watres.2018.04.020
48
Perkins T. L. Perrow K. Rajko-Nenow P. Jago C. F. Jones D. L. Malham S. K. et al . (2016). Decay rates of faecal indicator bacteria from sewage and ovine faeces in brackish and freshwater microcosms with contrasting suspended particulate matter concentrations. Sci. Total Environ.572, 1645–1652. doi: 10.1016/j.scitotenv.2016.03.076
49
Qu L. Y. He C. Wu Z. T. Dahlgren R. A. Ren M. X. Li P. H. et al . (2022). Hypolimnetic deoxygenation enhanced production and export of recalcitrant dissolved organic matter in a large stratified reservoir. Water Res.219, 118537. doi: 10.1016/j.watres.2022.118537
50
Rochelle-Newall E. J. Fisher T. R. (2002). Chromophoric dissolved organic matter and dissolved organic carbon in Chesapeake bay. Mar. Chem.77 (1), 23–41. doi: 10.1016/s0304-4203(01)00073-1
51
Sarma V. V. S. S. Krishna M. S. Srinivas T. N. R. (2020). Sources of organic matter and tracing of nutrient pollution in the coastal bay of Bengal. Mar. pollut. Bull.159, 111477. doi: 10.1016/j.marpolbul.2020.111477
52
Wang F. L. Guo W. D. (2010). Photodegradation of DOM in the pearl river estuary and the beibu gulf of the south China Sea in autumn. Acta Scientiae Circumstantiae.30 (3), 606–613. doi: 10.1631/jzus.A1000244
53
Wang C. Guo W. Li Y. Stubbins A. Li Y. Song G. et al . (2017). Hydrological and biogeochemical controls on absorption and fluorescence of dissolved organic matter in the northern south China Sea. J. Geophysical Res. Biogeosciences122, 3405–3418. doi: 10.1002/2017JG004100
54
Wang C. Li Y. Li Y. Zhou H. Stubbins A. Dahlgren R. A. (2021). Dissolved organic matter dynamics in the epipelagic Northwest pacific low-latitude Western boundary current system: Insights from optical analyses. J. Geophysical Res.126, e2021JC017458. doi: 10.1029/2021JC017458
55
Wang C. Zhang C. Wang Y. Jia G. Wang Y. Zhu C. et al . (2022). Anthropogenic perturbations to the fate of terrestrial organic matter in a river-dominated marginal sea. Geochimica Cosmochimica Acta333, 242–262. doi: 10.1016/j.gca.2022.07.012
56
Xu Y. Zhang T. Zhou J. (2019). Historical occurrence of algal blooms in the northern beibu gulf of China and implications for future trends. Front. Microbiol.10. doi: 10.3389/fmicb.2019.00451
57
Yan R. Feng J. Wang Y. Fu L. Luo X. Niu L. et al . (2022). Distribution, sources, and biogeochemistry of carbon pools (DIC, DOC, and POC) in the mangrove-fringed zhangjiang estuary, China. Front. Mar. Science.9. doi: 10.3389/fmars.2022.909839
58
Yang Li Cheng Q. Zhuang W. E. Wang H. Chen. W. (2019). Seasonal changes in the chemical composition and reactivity of dissolved organic matter at the land-ocean interface of a subtropical river. Environ. Sci. pollut. Res.26, 24595–24608. doi: 10.1007/s11356-019-05700-2
59
Yang L. Zhang J. Yang G. P. (2020). Mixing behavior, biological and photolytic degradation of dissolved organic matter in the East China Sea and the yellow Sea. Sci. Total Environment.762 (6), 143164. doi: 10.1016/j.scitotenv.2020.143164
60
Ye F. Guo W. Shi Z. Jia G. Wei G. (2017). Seasonal dynamics of particulate organic matter and its response to flooding in the pearl river estuary, China, revealed by stable isotope (δ13C and δ15N) analyses. J. Geophysical Research: Oceans.122, 6835–6856. doi: 10.1002/2017JC012931
61
Ye F. Guo W. Wei G. J. Jia G. D. (2018). The sources and transformations of dissolved organic matter in the pearl river estuary, China, as revealed by stable isotopes. J. Geophysical Research: Oceans123, 6893–6908. doi: 10.1029/2018JC014004
62
Ye F. Jia G. D. Xie L. H. Wei G. J. Xu J. (2016). Isotope constraints on seasonal dynamics of dissolved and particulate n in the pearl river estuary, south China. J. Geophysical Research: Oceans.121, (12). doi: 10.1002/2016JC012066
63
Yu X. L. Shen F. Liu Y. Y. (2016). Light absorption properties of CDOM in the changjiang (Yangtze) estuarine and coastal waters: An alternative approach for DOC estimation. Estuar. Coast. Shelf Sci.181, 302–311. doi: 10.1016/j.ecss.2016.09.004
64
Zhang D. Lu D. Yan B. Zhang J. Ning Z. Yu K. (2019). Influence of natural and anthropogenic factors on spatial-temporal hydrochemistry and the susceptibility to nutrient enrichment in a subtropical estuary. Mar. pollut. Bull.146, 945–954. doi: 10.1016/j.marpolbul.2019.07.056
65
Zhao C. Zhou Y. Pang Y. Zhang Y. Huang W. Wang Y. et al . (2021). The optical and molecular signatures of DOM under the eutrophication status in a shallow, semi-enclosed coastal bay in southeast China. Sci. China Earth Sciences.647), 1090–1104. doi: 10.1007/s11430-020-9728-4
66
Zhou F. X. Gao X. L. Song J. M. Chen C. T. A. Yuan H. M. Xing Q. J et al . (2018). Absorption properties of chromophoric dissolved organic matter (CDOM) in the East China Sea and the waters off eastern Taiwan. Continental Shelf Research154, 12–23. doi: 10.1016/j.csr.2018.03.005
67
Zhu W. Z. Zhang H. H. Zhang J. Yang G. P. (2018). Seasonal variation in chromophoric dissolved organic matter and relationships among fluorescent components, absorption coefficients and dissolved organic carbon in the bohai Sea, the yellow Sea and the East China Sea. J. Mar. Syst.180, 9–23. doi: 10.1016/j.jmarsys.2017.12.003
68
Zsolnay A. Baigar E. Jimenez M. Steinweg B. Saccomandi F. (1999). Differentiating with fluorescence spectroscopy the sources of dissolved organic matter in soils subjected to drying. Chemosphere38 (1), 45–50. doi: 10.1016/S0045-6535(98)00166-0
69
Zhou X. Jin G. Z. Song Z. G. Zhang S. W. Chen C. Q. et al (2021). Effects of typhoon mujigae on the biogeochemistry and ecology of a semi-enclosed bay in the northern south China Sea. J. Geophysical Research: Biogeosciences126, e2020JG006031. doi: 110.1029/2020jg006031
Summary
Keywords
particulate organic matter, dissolved organic matter, stable isotope, optical properties, Beibu Gulf
Citation
Lu X, Lao Q, Chen F, Zhou X, Chen C and Zhu Q (2022) Assessing the sources and dynamics of organic matter in a high human impact bay in the northern Beibu Gulf: Insights from stable isotopes and optical properties. Front. Mar. Sci. 9:1043278. doi: 10.3389/fmars.2022.1043278
Received
13 September 2022
Accepted
28 October 2022
Published
22 November 2022
Volume
9 - 2022
Edited by
Qing Luo, Shenyang University, China
Reviewed by
Wen-zhuo Zhu, Zhejiang Ocean University, China; Liyin Qu, Wenzhou University, China
Updates
Copyright
© 2022 Lu, Lao, Chen, Zhou, Chen and Zhu.
This is an open-access article distributed under the terms of the Creative Commons Attribution License (CC BY). The use, distribution or reproduction in other forums is permitted, provided the original author(s) and the copyright owner(s) are credited and that the original publication in this journal is cited, in accordance with accepted academic practice. No use, distribution or reproduction is permitted which does not comply with these terms.
*Correspondence: Fajin Chen, fjchen@gdou.edu.cn
This article was submitted to Marine Pollution, a section of the journal Frontiers in Marine Science
Disclaimer
All claims expressed in this article are solely those of the authors and do not necessarily represent those of their affiliated organizations, or those of the publisher, the editors and the reviewers. Any product that may be evaluated in this article or claim that may be made by its manufacturer is not guaranteed or endorsed by the publisher.