
95% of researchers rate our articles as excellent or good
Learn more about the work of our research integrity team to safeguard the quality of each article we publish.
Find out more
ORIGINAL RESEARCH article
Front. Mar. Sci. , 06 December 2022
Sec. Ocean Solutions
Volume 9 - 2022 | https://doi.org/10.3389/fmars.2022.1039233
This article is part of the Research Topic Dynamics and Hydrodynamics of Offshore Renewable Energy Devices View all 9 articles
 Yuquan Zhang1
 Renwei Ji2*
 Ke Sun2*
 Zhi Zhang3Yuan Zheng1Jisheng Zhang4Xuewei Zhang2Emmanuel Fernandez Rodriguez5
To understand the interaction wake effects of aligned horizontal-axis wind turbines, a refined and low-cost wake simulation framework is developed by combining the actuator line (AL) with a local dynamic Smagorinsky (LDS) model. Firstly, the published performance of the NREL-5MW wind turbine is used to corroborate the accuracy of the AL-LDS coupling model. Secondly, the research is extended to predict the interference between two tandem rotor wakes. The influence of the precone characteristics on the overall wake and power output of the tandem wind turbines is explored by modifying the upstream wind turbine and introducing the latest third-generation Ω vortex identification method in the post-processing procedure. According to results, the tandem wind turbines have complex wake interference, with the precone angle variation always reducing the global output power, and leading to an unstable downstream turbine wake. This is detrimental to system lifespan due to high performance fluctuation and stress and as well may have ecological implications due to sediment alteration. From results, an upwind turbine with precone angle (negative) can lead to higher downstream but lower upstream turbine performance, compared with a non-tilted turbine. Despite the optimal precone angle of the upstream wind turbine is 0°, a -2.5° proves more advantageous owing to the large flexible deformation of the turbine wingtips. The findings can serve as a continuous incentive for improving wind farm numerical simulation.
Wind energy plays an important role in energy supply (Veers et al., 2019; Zeng et al., 2021a; Nash et al., 2021). Newer concepts in wind turbines, such as greater hub height installation, can improve the utilization rate of wind farm energy and land resources (Rinne et al., 2018). Nevertheless, the problem of wind turbine wake interference caused by the array arrangement is becoming more significant (Azlan et al., 2021; Sun et al., 2021; Xu et al., 2021), as configurations of turbines must not only be space but also economic efficient. The spacing between wind turbine rotors is the most direct factor affecting the overall output power. For example, the spacing tends to improve the wind farm’s efficiency (Yu et al., 2018), although it lowers the power density (production per land area) (Zuo et al., 2016; Yuan et al., 2020; Yuan et al., 2021). However, the wind farm is limited by the site area, so it is impossible to increase or decrease the wind turbine rotors spacing indefinitely. Therefore, to explore the mechanism of the wind turbine wake flow, especially under a specific tandem spacing, the full understanding and forecasting of the front turbine wake in the wind farm is of great significance to improve its overall energy efficiency (Sharma et al., 2018; Wang et al., 2019; Nakhchi et al., 2022).
Diverse methods in model-scaled wind turbines have provided insights on the wake development. Wang (Wang et al., 2016) combined the body-fitted mesh and Reynolds Average Navier-Stokes (RANS) method to explore the near-wake characteristics of the Phase VI model-scale wind turbine under shear flow. However, little was said regarding the velocity deficit of the flow field and wake vortex structure in post-processing. Gao (2016) studied, by using Fluent software based on the RANS method, the wake interference of five model-scale wind turbines. The wake velocity deficit was only included in the post-processing, restricting the wake velocity contour and wake vortex structure visualization. In Qian (Qian et al., 2018), the wake of the MEXICO model-scale wind turbine was investigated with yaw influence, by using a Detached-eddy-simulation (DES) method. The post-processing step used the first-generation vortex identification method (vorticity), thus identifying only one rough vortex surface profile and constricting the phenomenon of vortex shedding (tip vortex and root vortex). To obtain more representation of the wind turbine aerodynamics, Gao (Gao et al., 2021) combined the actuator line (AL) and standard Smagorinsky sub-grid models in the Large-eddy-simulation (LES) method to reproduce the downstream flow of a model-scale wind turbine located in Gansu. In the post-processing step, the second-generation (Q) vortex identification method identified the wake vortex, allowing conceptualization of the migration and break-up of the wake vortex under yaw conditions.
In the aspect of the full-scale wind turbine research, Hornung (Hornung et al., 2015) studied the aerodynamic performance of a series of real-scale wind turbines based on the actuator disk (AD) model. However, this method ignores the blade rotation and the wind turbine wake vortex shedding phenomenon, so wake results are limited at best, and inappropriate at worst. Fleming (Fleming et al., 2015) used a series of full-scale wind turbines and implemented the pitch control in the front turbine, thereby alleviating the downstream flow disturbance. Notwithstanding, the overall farm efficiency changed little, to the disadvantage of a higher fatigue load at the root of the blade. Gebraad (Gebraad et al., 2015) attempted, with little success, to improve the overall wind farm power by actively adjusting the pitch angle and rotational speed of the upstream real-scale wind turbine. Whereas Wang (Wang et al., 2019) adopted the OpenFOAM software to investigate the response of a full-scale wind turbine by using the second-generation (Q) vortex identification method. Huang (Huang et al., 2021) studied the wake characteristics of the spar-type real-scale floating wind turbine by using the coupling method of actuator line (AL) and RANS, and introduced the latest third-generation Ω vortex identification method to visualize the vortex arrangement in post-processing.
One question to be asked, however, is to what extent the simulations are acceptable, and under what terms, as approaches carry well-known shortcomings. In the aspect of wind turbine modeling, most studies (Houtin–Mongrolle et al., 2020; Pinguet et al., 2020; Whitehouse et al., 2022) use the body-fitted grid method, thus necessitating a large number of near-wall grids to simulate the boundary layer flow on the blade surface to meet the requirements of Y plus. In essence, it is not suitable for the large-scale real-scale wind farm numerical simulation. Regarding turbulence, most studies (Rezaeiha et al., 2019; Heinz, 2020; Zeng et al., 2021b) are based on RANS, DES or LES (standard Smagorinsky sub-grid model) methods, hence results can be disagreeable. The scientific inquiry is not only focused on the force (power and thrust) of the wind turbine as to optimize geometric design and prolong lifespan due to failure prevention and implementation of monitoring and evaluation activities, but also in the wake velocity distribution to assess the production of posterior turbines, farm revenues and environmental repercussions. The wakes are, though, difficult to predict, as the turbines even in steady flows, form vortices along the flow direction, particularly from the blade tips and hub owing to substantial flows spin, thus affecting the instantaneous load, power and noise output. Authors still emphasize the factors associated with the vortex evolvement, with the aim of improving cost efficiency of the wind farm through selection of the turbine geometric features. However, due to the lack of refinement of the flow field simulation, the mesh viscosity is rapidly dissipated during the downstream propagation of the wind turbine wake vortex, which leads to the lack of discussion on mutual vortex interaction and their fragmentation. In the aspect of visualization of the wind turbine wake vortex structure, the first-generation (Vorticity) and second-generation (Q) vortex identification methods are mainly used (Liu et al., 2019; Bai et al., 2020; Wang et al., 2020), having two main limitations: (1) The first-generation can only represent a rough vortex surface profile, limiting the knowledge on the blade root and tip vortex; (2) The threshold of the second-generation (Q) vortex identification method is stochastic, as adjustments are required per moments of and with situations. Also, it fails to display simultaneously the strong, in conjunction with the weak vortices.
Besides selecting the layout of upstream and downstream turbines, it is believed the effect of leaning the rotor blades against the wind may improve substantially the power output (Jokar et al., 2022), named precone strategy. Nevertheless, it is yet unclear to what extent the earlier flow response affects the turbine noise and the subsequent flow disturbance, both parameters associated with longevity of components and cost efficiency. Therefore, this paper combines the actuator line (AL) with a localized dynamic Smagorinsky (LDS) sub-grid model to develop a refined numerical simulation framework (AL-LDS coupled model framework) for the horizontal-axis wind turbine wake. The advantage of the AL method is to replace the blades with body force along rotating lines to predict, in a simple manner, the flow around the turbine. Even though, the method ignores the nacelle and hub presence, the findings can be acceptable. Whilst the LDS represents the small-scale fluid motions (turbulence), not accounted in the large-scale models, by using a local eddy viscosity. As a result, this method is adequate for complex flows and has high precision and low computational cost, compared with solving the full turbine and spatial and temporal turbulence scales, such as in Direct Numerical Simulation. In this paper, the accuracy of the AL-LDS coupled model framework is firstly validated. Secondly, two tandem wind turbines are selected as the research object. By changing the precone angle of the upstream wind turbine in the range of -15°~15°, the wake characteristics of the tandem turbine rotors are explored. Finally, the post-processing program of the latest third-generation Ω vortex identification method (Liu et al., 2019; Liu and Liu, 2019; Xu et al., 2019) is compiled, to visualize the wind turbine wake vortex structure under the precone variation. By comparing the differences of the first, second, and third vortex identification methods, the influence mechanism of the upstream wind turbine wake vortex structure on the downstream wind turbine is further understood, thus proving valuable to the conceptualization of wind farms.
For the modelling part, the governing equations of the fluid dynamics, are as follows:
where ρ is the fluid density, v is the kinematic viscosity, U is the velocity of the flow field, and fϵ represents the body force source term of the wind turbine.
A local dynamic Smagorinsky (LDS) sub-grid model (Piomelli and Liu, 1995; Wang and Bergstrom, 2005) is programmed by utilizing the LES method. In contrast to the standard and average dynamic Smagorinsky (ADS) sub-grid model, the LDS sub-grid model can consider the instantaneous and local effects of the flow field, hence greatly improving the near-wall results (Ji et al., 2022). Here, the governing equation is discretized by the collocated finite volume method (FVM) (Novikov et al., 2021), and the momentum equation is solved by the transient PISO algorithm (Barton, 1998). The second-order bounded semi-implicit Crank-Nicholson scheme (Huang et al., 2010) is adopted for time advancement, whereas the second-order QUICK scheme (Hayase et al., 1992), for the convection term, and the second-order unbounded Gaussian linear scheme based on central difference (Rosenblatt, 2000), for remaining terms. The linear system of equations for pressure (p) is calculated by the preconditioned conjugate gradient (PCG) solver (Wesseling, 1987) based on the multigrid method, whereas the linear system of equations for the velocity (U) is calculated by the PBiCG solver (Behrens, 2009).
The actuator line (AL) model (Figure 1) is a full three-dimensional transient aerodynamic model for the horizontal-axis wind turbine, proposed by Sorensen in 2002 (Sorensen and Shen, 2002). The main point of the AL model is to replace the wind turbine blade with a virtual actuator line with the body force, and the blade is divided into several elements along the radial direction, called the actuator point. The aerodynamic load per radial blade section is calculated by utilizing the lift-drag coefficient of the airfoil. This approach reduces the computational complexity of simulating the solid blades presence, the flow solution in the boundary layer on the blade surface, and mesh rotation strategies (sliding mesh, dynamic mesh or overset mesh) to account for blade rotation. As a result, the iteration time under each time step in the numerical simulation (Yu et al., 2020) is lower compared to blade-resolved method.
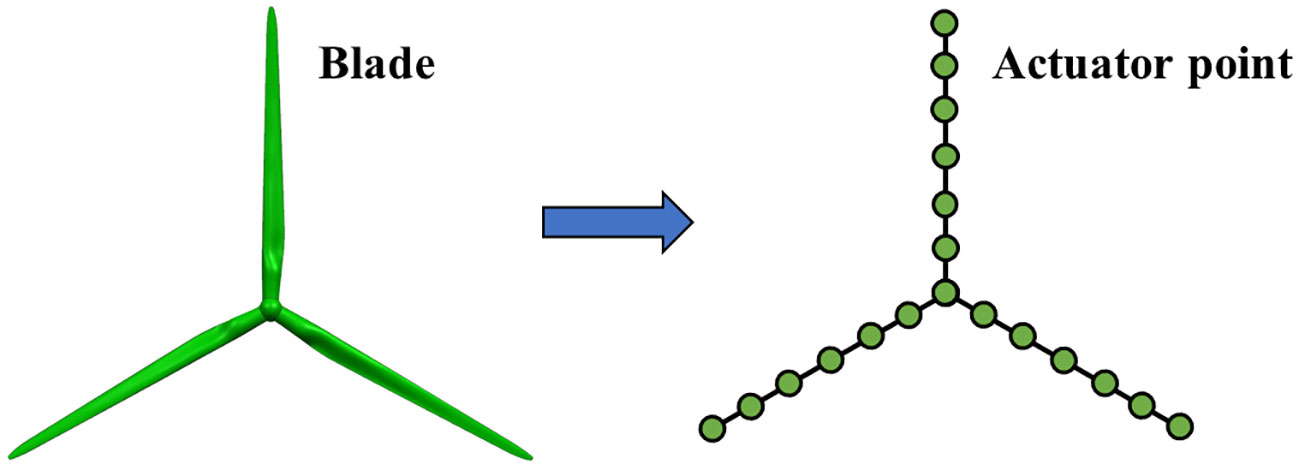
Figure 1 The schematic diagram of the actuator line (AL) model.
Figure 2 shows the velocity vector diagram of the blade section at the actuator point. First, the flow field velocity on the mesh element near the actuator point is acquired, and then, the axial velocity Ux and tangential velocity Ur at the actuator point obtained by linear interpolation. The relative inflow velocity Urel is:
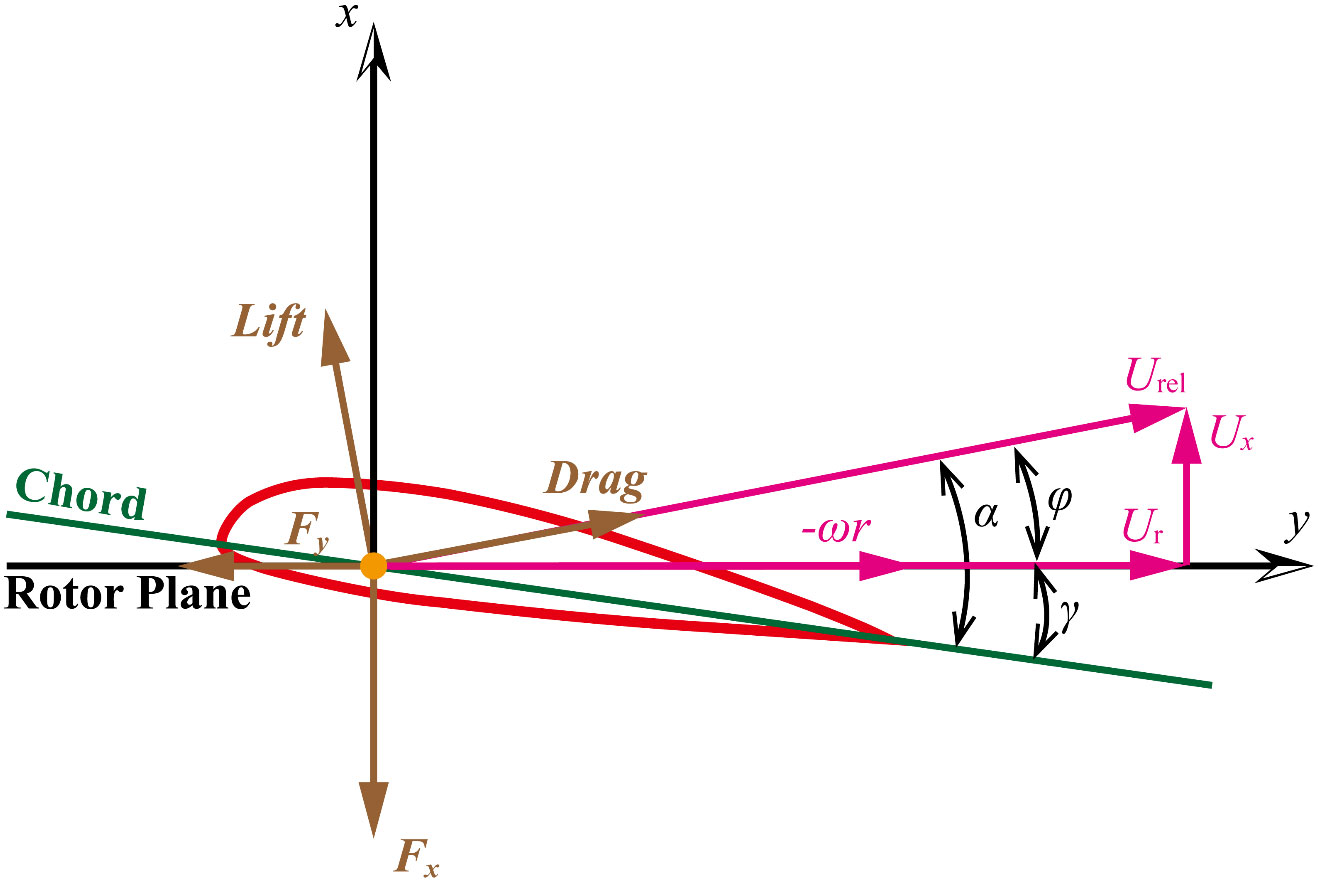
Figure 2 The velocity vector diagram of the blade section at actuator point.
where γ represents the local pitch angle of the blade section at the actuator point. The angle of attack α represents the angle between the relative inflow velocity Urel and the chord of the airfoil at the actuator point, which is determined as:
where φ, the inflow angle, represents the angle between the relative inflow velocity Urel and the rotating plane of the wind turbine. It is determined by
The lift (L) and drag (D) of the wind turbine at each actuator point only relate to the relative inflow velocity Urel, the chord length Reynolds number Rec and the angle of attack α. They are determined by
The local tip loss correction is implemented in the numerical simulation of this paper. It is
where c is the chord length, w is the blade section thickness, eL and eD are unit vectors, R is the turbine radius, and Nblade is the number of blades.
In addition, the body force source term representing the wind turbine needs to be smoothed before acting on the flow field to avoid numerical oscillation (Sorensen and Shen, 2002; Martínez-Tossas et al., 2015). The expression of Gaussian smoothing function σϵ(l) is
where l represents the distance from the center of the actuator point to the center of the grid near the body force. The Gaussian projection coefficient ϵ is a parameter to adjust the density of the body force, and the value of ϵ can be determined according to the characteristic chord length or grid size near the actuator point.
To sum up, the key of the solution program based on the actuator line (AL) model is to smoothly load the body force onto the grid elements around the wind turbine. The procedure per time step can be summarized as follows: (1) Acquire the positions of the actuator points per parallel zone of the flow field. (2) Calculate their relative inflow velocity Urel (as shown in Equation 3). (3) Obtain the body force of each actuator point. (4) Modify the body force through the Gaussian function, to then project in the flow field. (5) solve the flow. (6) Rotate the blade to update positions of the actuator points. (7) This process, repeated in next time steps, gives the transient solution.
The wind turbine wake contains many vortex structures of varying scales and intensity, playing a crucial part in the generation and continuance of the turbulent flow [Zhang et al., 2020; Zhang et al., 2021; Chen et al., 2022]. For example, it increases the fatigue load and power fluctuation, turbulent kinetic energy (TKE) in the wake of the front turbine and decreases the production of the rear device (Zhang et al., 2021). The vortex identification methods are important tools for visualizing the vortex evolvement. In order to reveal the wake vortex interaction among multiple turbine rotors in a wind farm, various vortex identification methods have been presented and applied. Vortex identification methods have been developed for three generations, mainly including: (1) The first-generation (Vorticity); (2) The second-generation (Q、λ2、λci、Δ et al.); (3) The third-generation (Ω et al.). The Vorticity-based approaches are considered the first generation, where
However, previous studies (Hunt, 1987) state the differences between vorticity and vortex. In other words, they are both vectors but differ in size and direction. This approach fails to capture the vortex intensity, as it only identifies a rough outline of the vortex surface, dismissing the correct shedding and development process of strong and weak vortices (Shen, 2015; Qian et al., 2018; Ren et al., 2020).
On the other hand, Q and λ2 methods can be understood as a modification of the first-generation Vorticity method. The λci and Δ methods are based on the influence of the velocity gradient tensor ∇U on the local instantaneous streamline (Dong et al., 2019). Following Hunt (Hunt et al., 1988), the second Galileo invariant Q>0 of the velocity gradient tensor ∇U represents the vortex structure.
where A is the symmetric whilst B the antisymmetric components of the velocity gradient tensor.
Nevertheless, the threshold selection suffers impediments: (1) It is sensitive to the particular vortex structure. (2) It fails to capture the weak along strong vortices. To overcome these problems, Liu (Liu et al., 2016) suggested the third-generation Ω vortex identification method.
where A and B are the same as Equation (13), and σ is a small positive number, preventing the division by zero.
The Ω, between 0 and 1, provides the concentration of the vortex and rigidity of the fluid motion. When Ω=1, the fluid rotates as the rigid body, and if Ω>0.5, the antisymmetric tensor B is dominant, relative to the symmetric tensor A. In contrast to the second-generation vortex identification method, the Ω method has the following benefits: (1) The computer programming and real significance are simple. (2) It displays both strong and weak vortices (Dong et al., 2019; Gui et al., 2019). (3) Due to normalization, it is easier to apply to a flow control (Wang et al., 2021). (4) The threshold is fixed (Ω=0.52) (Liu et al., 2016; Ren et al., 2020; Zhao et al., 2020), especially in the unsteady flow, preventing adjustments per time step.
In this paper, the NREL-5MW real-scale wind turbine is adopted, as seen in Figure 3. The operating parameters are summarized in Table 1.
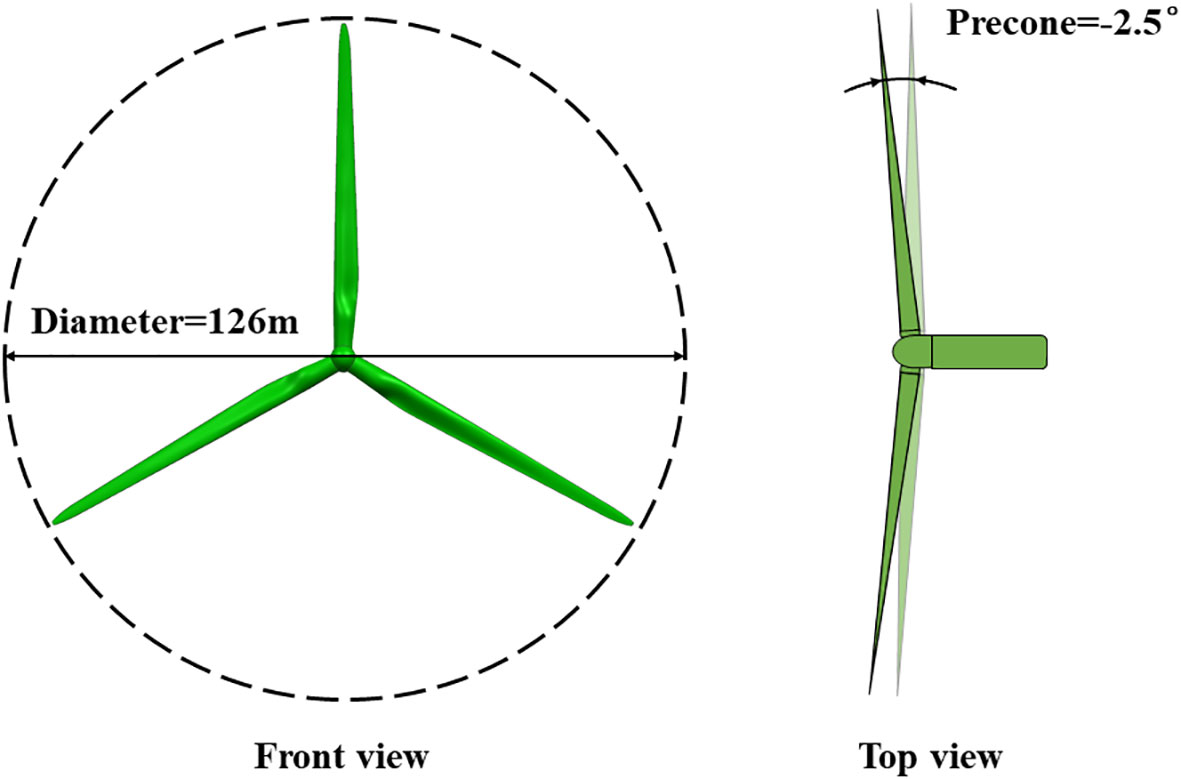
Figure 3 The schematic diagram of the NREL-5MW wind turbine.
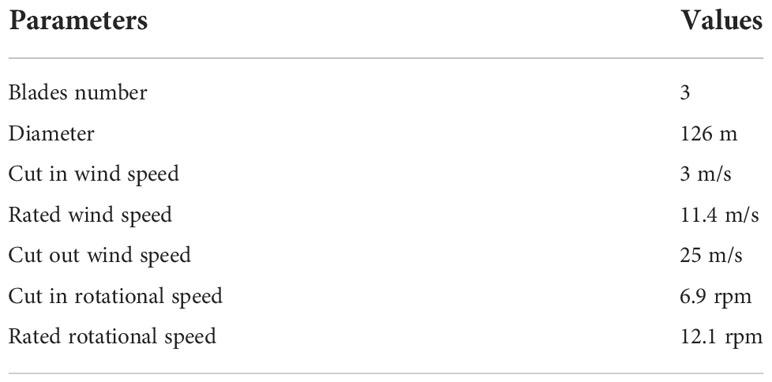
Table 1 The NREL-5MW wind turbine model parameters.
In the simulations, the computational domain and turbine position are set according to the operating conditions. Figure 4 is a schematic diagram of the computational domain in the single-rotor and twin-rotors scenarios. The single-rotor is positioned 3D (D represents turbine diameter) distances after the inlet, and 9D before the outlet. The outlet and the top sides of the rectangular prism are the pressure boundaries, whilst the bottom is the slip boundary; the right and left sides denote the symmetrical boundaries. Figure 4A shows the layout of a single-rotor validation case, with 9 different inlet wind speeds (3, 4, 5, 6, 7, 8, 9, 11, 11.4m/s). Figure 4B is the arrangement scheme of two-rotors in series with a longitudinal spacing of 6D. The upstream wind turbine is set to 11 different precone angles (-15°~15°, interval 2.5°), contrasted to only -2.5° at the downstream wind turbine.

Figure 4 The schematics of the computational domain. (A) single-rotor (B) twin-rotors.
Since the Cartesian mesh discretizes the whole computational domain, the solution in the boundary layer on the blade surface is dismissed, improving the computational efficiency. The mesh adopts a three-layer step-by-step refinement scheme, as seen in Figure 5. The recommended mesh number in the diameter direction near the wind turbine is 60~80 (Ji et al., 2022), and the total number of meshes is close to 11 million. For the selection of time step, the tip Courant number is set to less than 0.5, and the total calculation time usually ensures the flow field is looped for 4 to 5 times. As a result, this configuration scheme can clearly capture the development process of tip vortex and root vortex (Yu et al., 2020; Ji et al., 2022).

Figure 5 The schematic diagram of step-by-step mesh refinement.
In order to corroborate the calculation accuracy of the AL-LDS coupling model, the thrust and power of a single 5MW wind turbine are forecasted under different wind speeds. Results are then compared with published data, using other methods and software. Table 2 summarizes this.
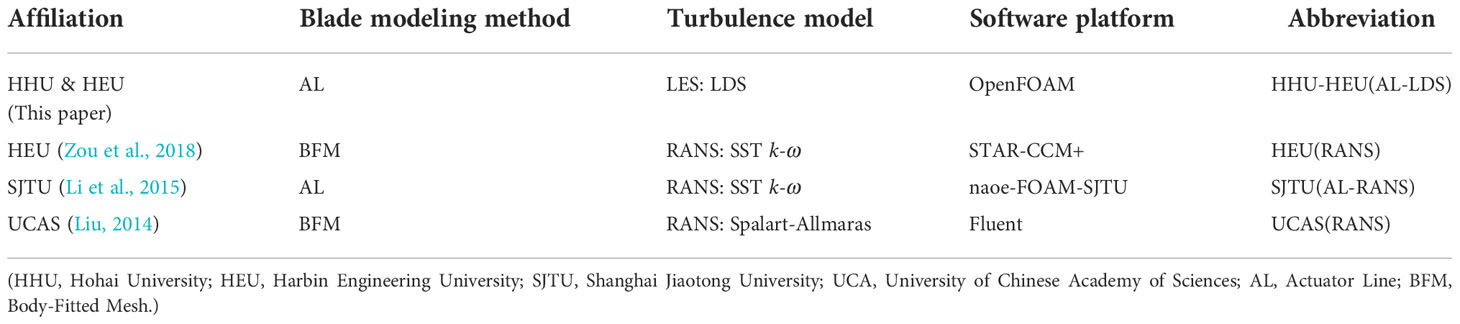
Table 2 Comparison of basic numerical methods from published works.
Figure 6 compares the method’s prediction with similar works. The AL-LDS coupling model power curve is in good agreement with the NREL and other works, although some methods show a large deviation near the rated wind speed. In terms of thrust, the results of the AL-LDS coupling model are lower than the NREL but more consistent than the other works. The possible reason is that the NREL benchmark value is calculated by the FAST software, based on the BEMT (Blade element momentum theory), without considering the viscous effect of the fluid, and employing many empirical correction models (three-dimensional effect, rotation effect, dynamic stall, tip loss, etc.). However, this paper and most scholars adopt the viscous CFD method.
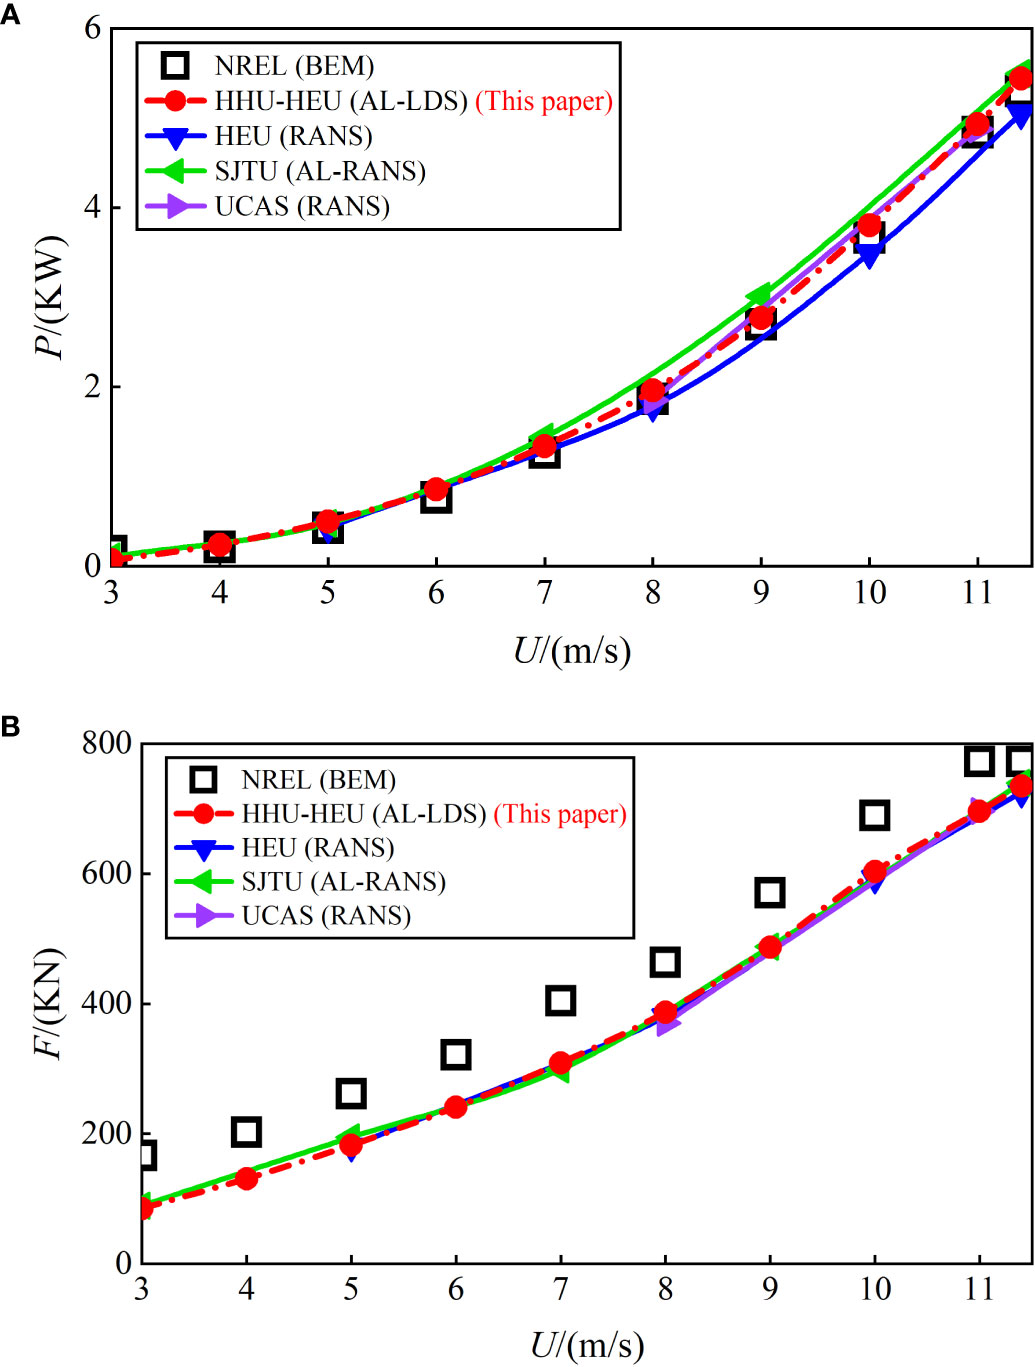
Figure 6 Comparison between calculation results of different scholars and NREL benchmark values under different wind speeds. (A) Power (B) Thrust.
In order to capture the unstable behaviors, the average power and thrust comprise the instantaneous results of convergence in the last three rotation cycles. Figure 7 shows the individual and total performance under the single and tandem scenario, in function of the wind speed. The ratio of power per turbine to the power of the upstream wind turbine (WT1) without precone variation is termed the output power ratio η. The details are summarized in shown in Table 3.
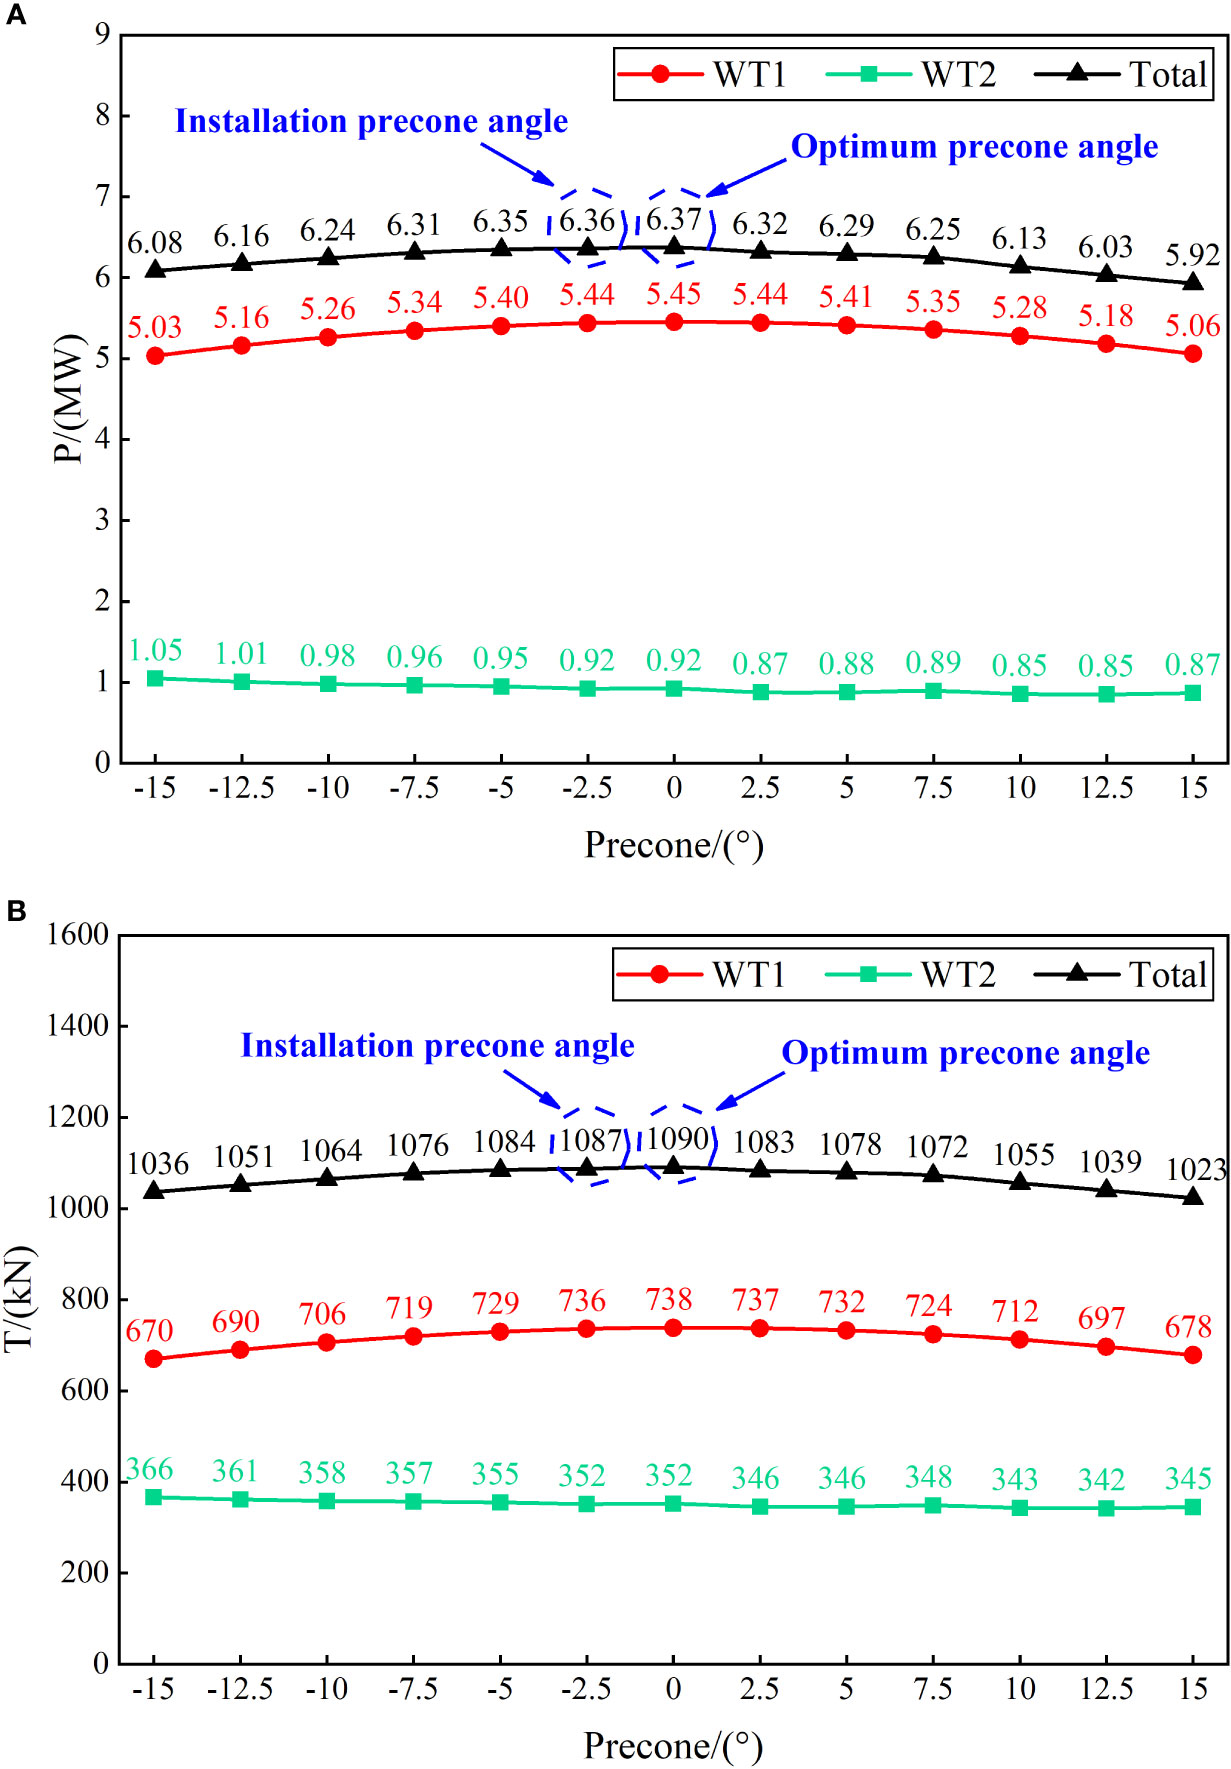
Figure 7 Variation of power and thrust of the aligned wind turbines with precone angle. (A) Power (B) Thrust.
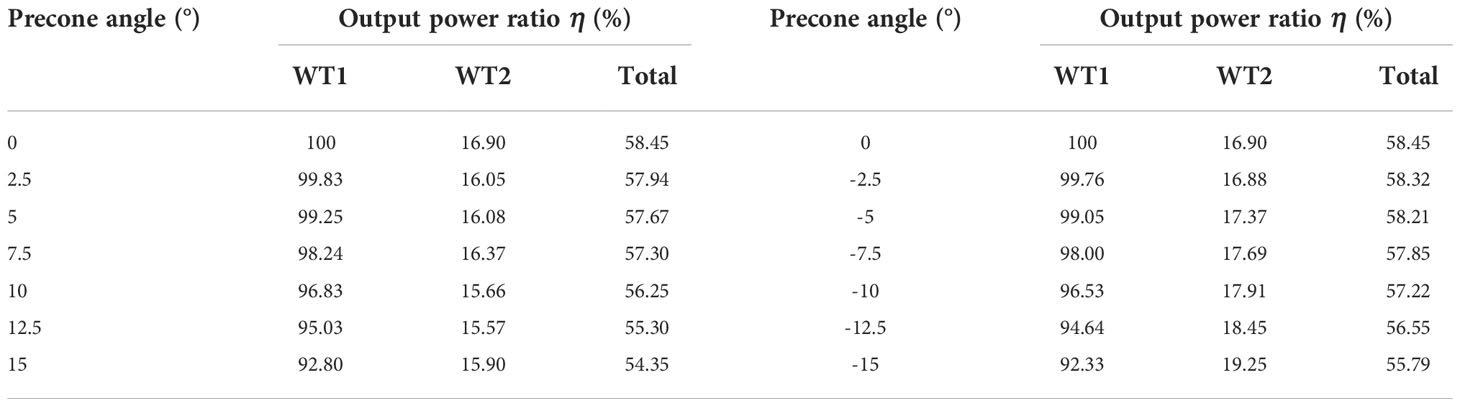
Table 3 Output power ratio η of each turbine under precone variation.
By analyzing Figure 7 and Table 3, we observe the following:
(1) Clearly, the power and thrust of the upstream turbine (WT1) is much larger than the downstream (WT2) due to the reduced downstream velocity. When the WT1 precone angle increases from -15° to 15° at an interval of 2.5°, the WT1 output power increases at first and then decreases, but the overall change is not obvious, with a maximum increase of 8.35%. The output power of WT2 remains basically unchanged and is always in a low power state. Table 3 shows the maximum output power ratio of WT2 is always lower than 20%. Simply put differently, the precone change increases the upstream turbine’s output power without weakening the wake, whilst the downstream wind turbine remains in a strong wake state.
(2) The wind turbine has two forms: upwind direction and downwind direction, so both positive and negative precone angles can be applied to the actual wind farm. Compared with the positive precone angle, the negative precone change of upstream wind turbine (-15°~0°) is more beneficial to the total power output of the twin-rotors in series under the same absolute value of precone angle.
(3) Although the overall power of the tandem wind turbines becomes the highest when the precone angle is 0°, it is necessary to set a certain precone angle to prevent the blade tip’s flexible deformation (Sayed et al., 2019) and collision with the tower. The recommended value is -2.5°.
(4) When the precone angle of WT1 is 15°, the overall output power is the least at 5.92MW. When the WT1 is at the optimal precone angle 0°, the maximum output power of the WT1 is 5.45MW, compared to the total’s 6.37MW. A similar value is obtained if the precone angle is -2.5°. Therefore, the overall total power increases by 7.46~7.6% compared to other cases. As expected the thrust becomes the highest (1087~1090 KN) with maximum power efficiency.
Figure 8A shows the longitudinal-section (x-y plane) velocity contour of the tandem twin-rotors under different precone angles of the upstream wind turbine (WT1). Whereas Figure 8B shows the cross-section (y-z plane) velocity contour of the tandem twin-rotors at different positions along the flow direction when the WT1 is installed with a precone angle of -2.5°. It can be seen from the figure that:
(1) The wake of the WT2 (Figure 8A) with precone variation angle always follows a similar but unstable plume pattern, compared with the smooth WT1 wake development; the streamwise wake width expansion is slightly larger than the diameter of the wind turbine. However, when the wake propagates to the WT2, the width of the wake further expands and the wake meandering phenomenon becomes more obvious. This results in a serious yet irregular secondary velocity loss (~ 0 m/s) along the blade radius direction. The WT2 stays completely in the mixing region of strong wake of the WT1. This increases turbine inefficiency, performance fluctuation and fatigue strain for the WT2.
(2) The wake before and after the rotation of the wind turbine blade may be clearly captured in the cross-section velocity contour of the wind turbine position (See Figure 8B in x=0D, x=6D). As seen, the evolution process of the wind turbine wake can be truly simulated by using the actuator line (AL) rather than the body-fitted mesh method. The wind turbine wake velocity increases gradually along the blade radius direction, and the wake velocity loss at the tip position is more significant than that at the blade root. The reason for this phenomenon may be from two causes: (a) the blade airfoil used gradually transitions to a circle near the blade root, and with the change of the airfoil, the decrease of the incoming wind speed at the blade root gradually weakens; (b) the AL disregards the nacelle and only considers the influence of the blades rotation, which leads to the high velocity of the wake center in the cross-section.
(3) The tandem spacing between WT1 and WT2 is 6D. It is clear from Figure 8B that there is a significant velocity deficit when the incoming flow passes through the positions of WT1 and WT2. The velocity contour of the wake cross-section behind the WT1 is relatively regular, showing a symmetrical circular distribution (see x=1D~5D in Figure 8B), indicating that the force acting on the WT1 is more uniform. However, after the WT2 position (x=6D), the wake velocity shows a secondary loss, and the shape becomes irregular, indicating that the stress instability of the WT2 increases. When the wake develops to x=12D, the superimposed wake effect of the WT1 and the WT2 has basically returned to the incoming wind speed, and the wind turbine can be arranged after 12D.
(4) The rotation of the blade not only causes the loss of the wake velocity behind the rotating plane, but also causes the uneven pressure distribution, and instability of the flow field around the rotating plane of the wind turbine. This leads to the expansion of the wind turbine wake, especially after the wakes of the upstream and downstream turbines are superimposed, thus, the cross-section area affected by the wake expansion even increases to about 1.5 times of the swept area of the wind turbine. In a wind farm conception, the transverse spacing of the turbines should be adequately increased to reduce the influence of the superimposed wake effect of the upstream wind turbine.
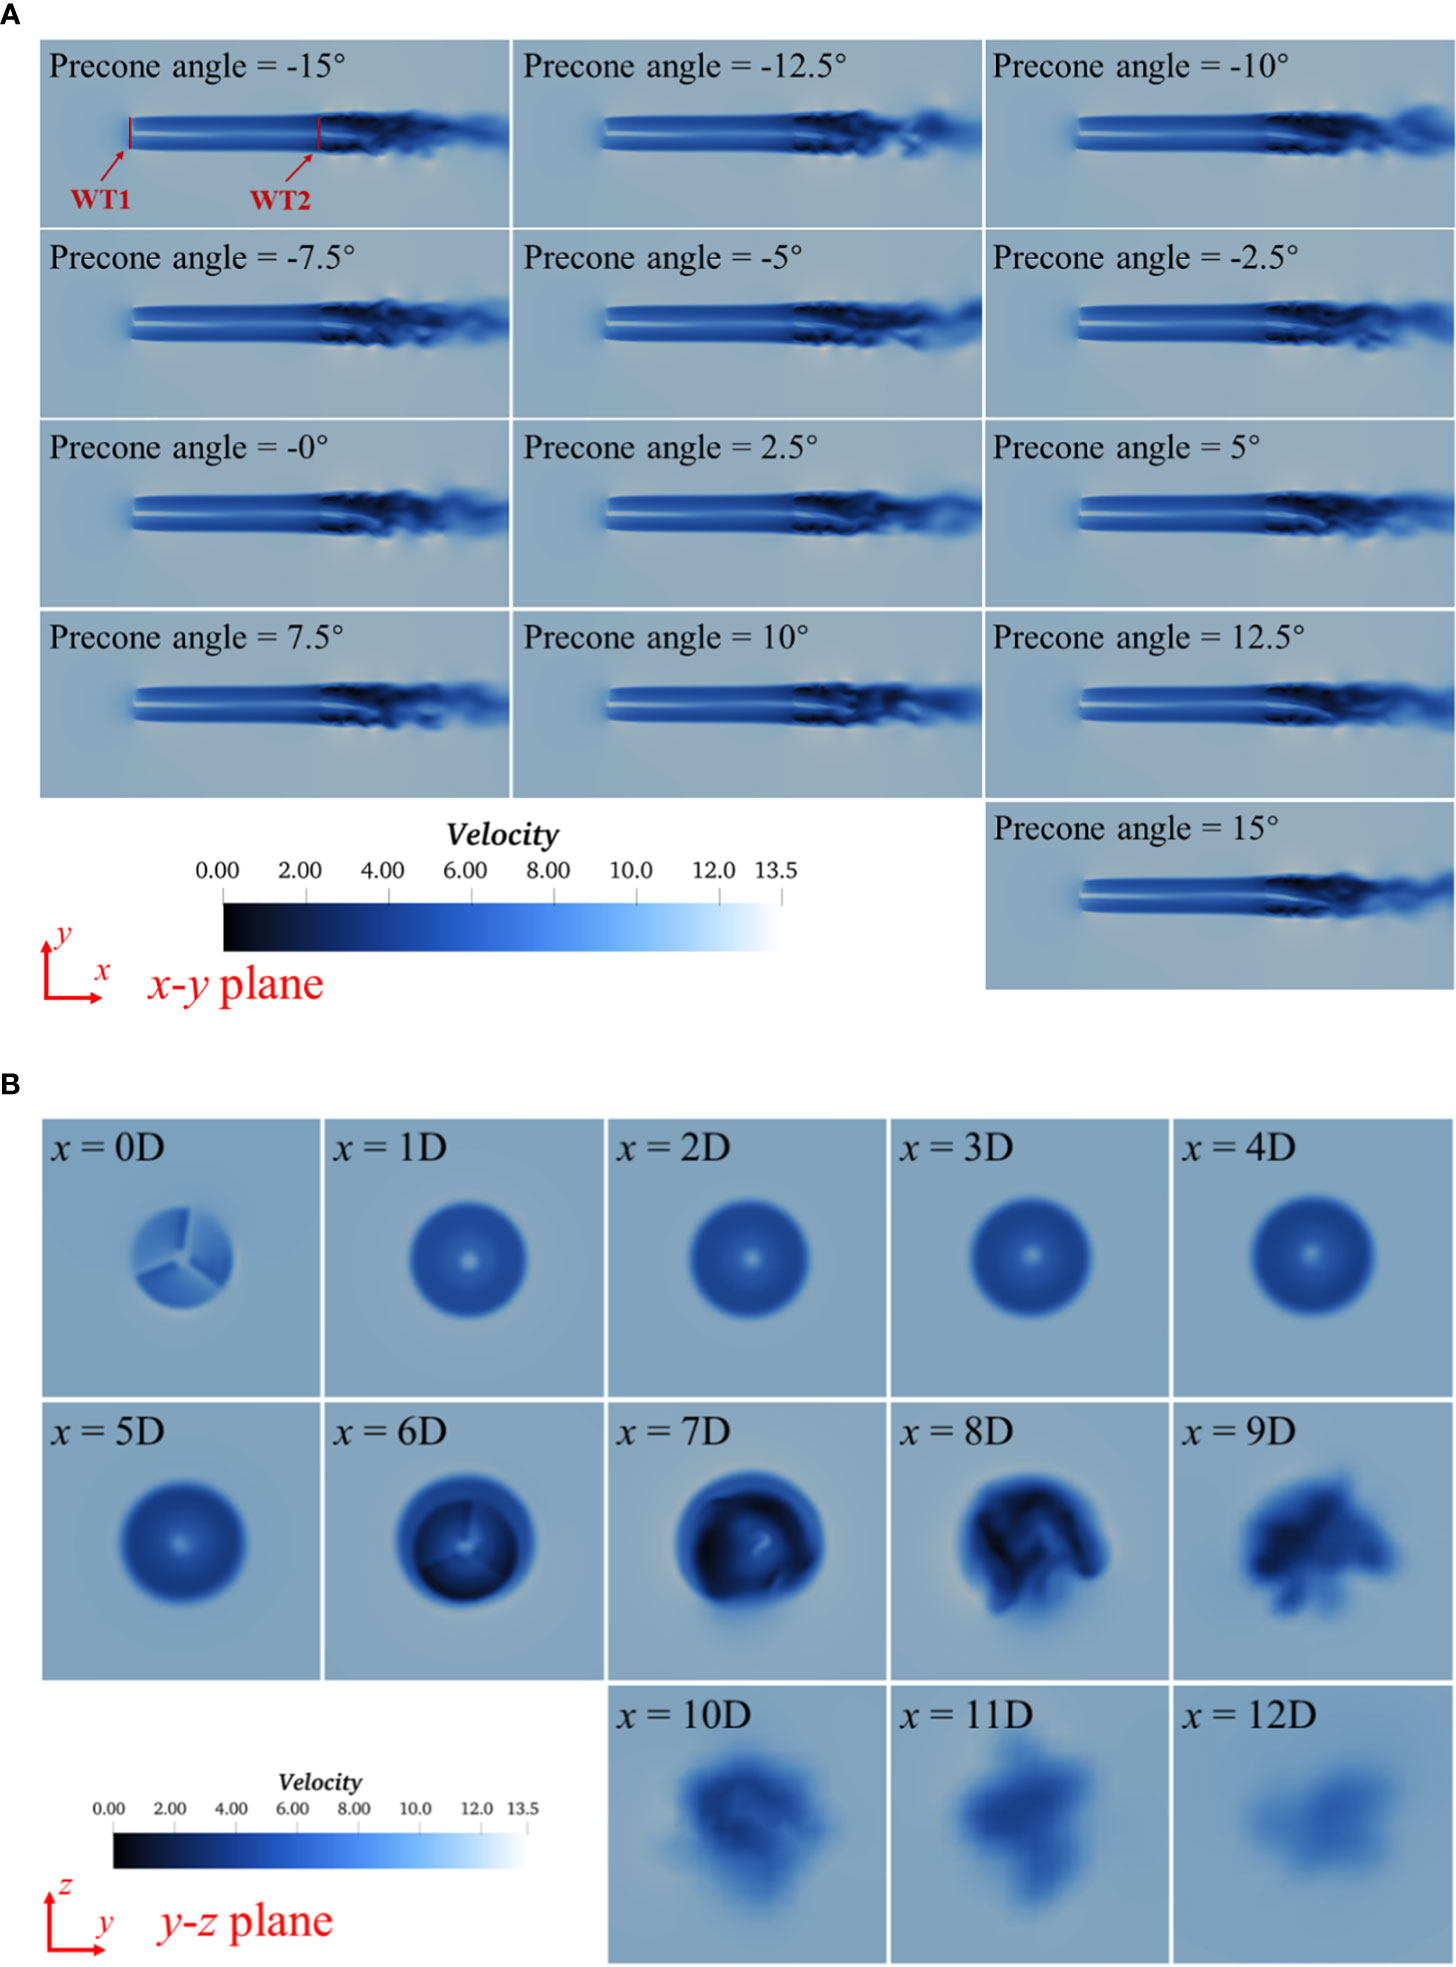
Figure 8 The velocity contour of the aligned wind turbines. (A) x-y plane velocity contour of the WT1 at different precone angle (B) y-z plane velocity contour of the WT1 at precone angle (-2.5°).
Owing to the flow similarity among the precone angle cases in Figure 8, only the wake development (WT1) with precone angle -2.5° is investigated. By comparing the differences of three different vortex identification methods (the first-generation Vorticity, the second-generation Q and the third-generation Ω) in wake vortex identification, this paper explores the applicability of the latest third-generation Ω vortex identification method in wind turbine wake vortex identification under precone changes. The advantages are compared with previous generation vortex identification methods.
Firstly, the first-generation (Vorticity) vortex identification method is selected, and five different thresholds are selected to capture the wake vortex structure. It can be found from Figure 9 that: (1) With the increase of the threshold, the displayed vortex structure decreases rapidly. (2) When the Vorticity=0.25, the WT1 wake vortex develops downstream, thus changing the inflow conditions of the WT2. (3) The vortex visualization in first-generation (Vorticity) vortex identification is incomplete, by not capturing the root, tip, strong, and weak vortex, and the shedding and development process of the vortex.
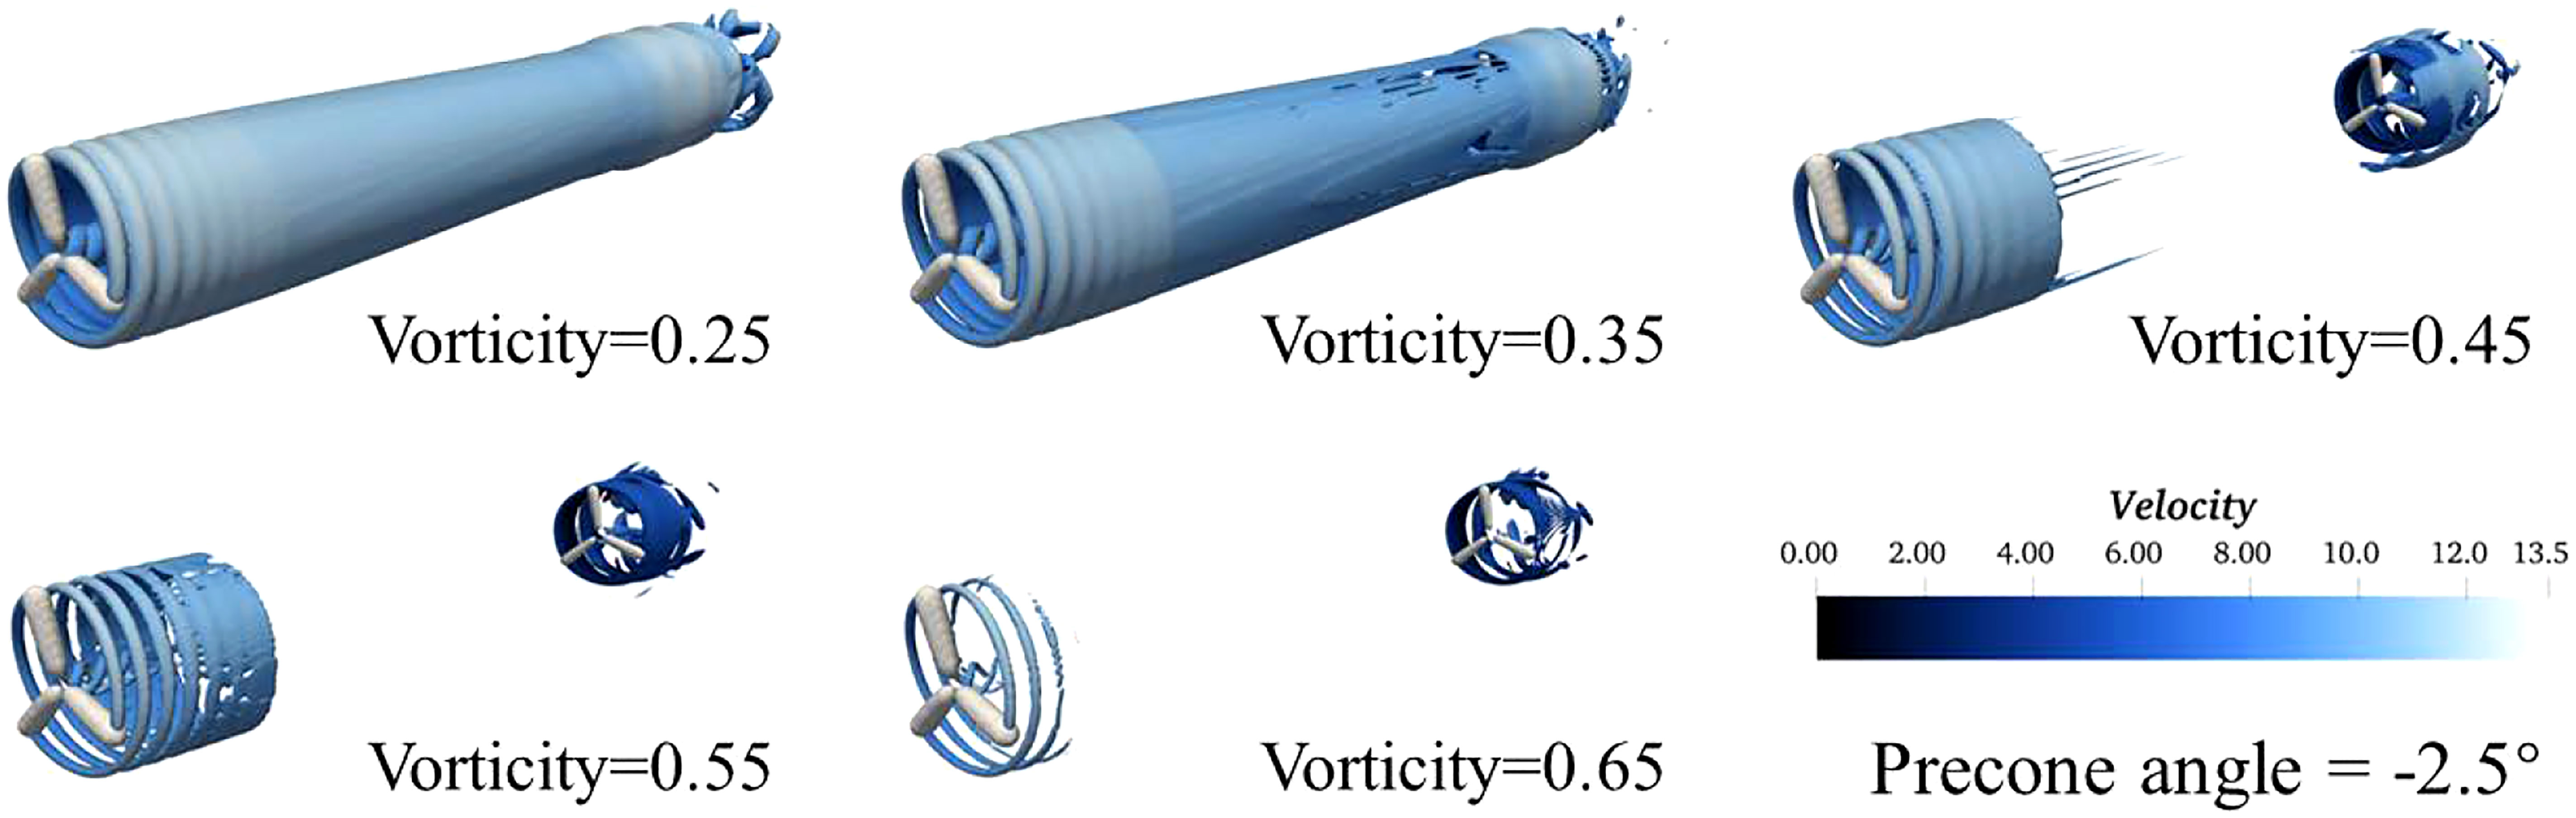
Figure 9 Under the precone angle (-2.5°) of the WT1, the first-generation vortex identification method (Vorticity) visualizes the wake vortex structure.
Secondly, the second-generation (Q) vortex identification method is selected, and it can be found from Figure 10 that: (1) The threshold needs to be adjusted repeatedly to capture the wake vortex structure, which is too dependent on artificial experience. (2) As the threshold becomes larger, the captured vortex structure is eventually smaller. (3) When the Q=0.0001, the visualization improves in terms of blade tip vortex shedding and gradually merge into the vortex surface downstream. (4) The strong vortex structure can only be captured, compared to concealed the weak vortex structure after the split of the vortex surface.
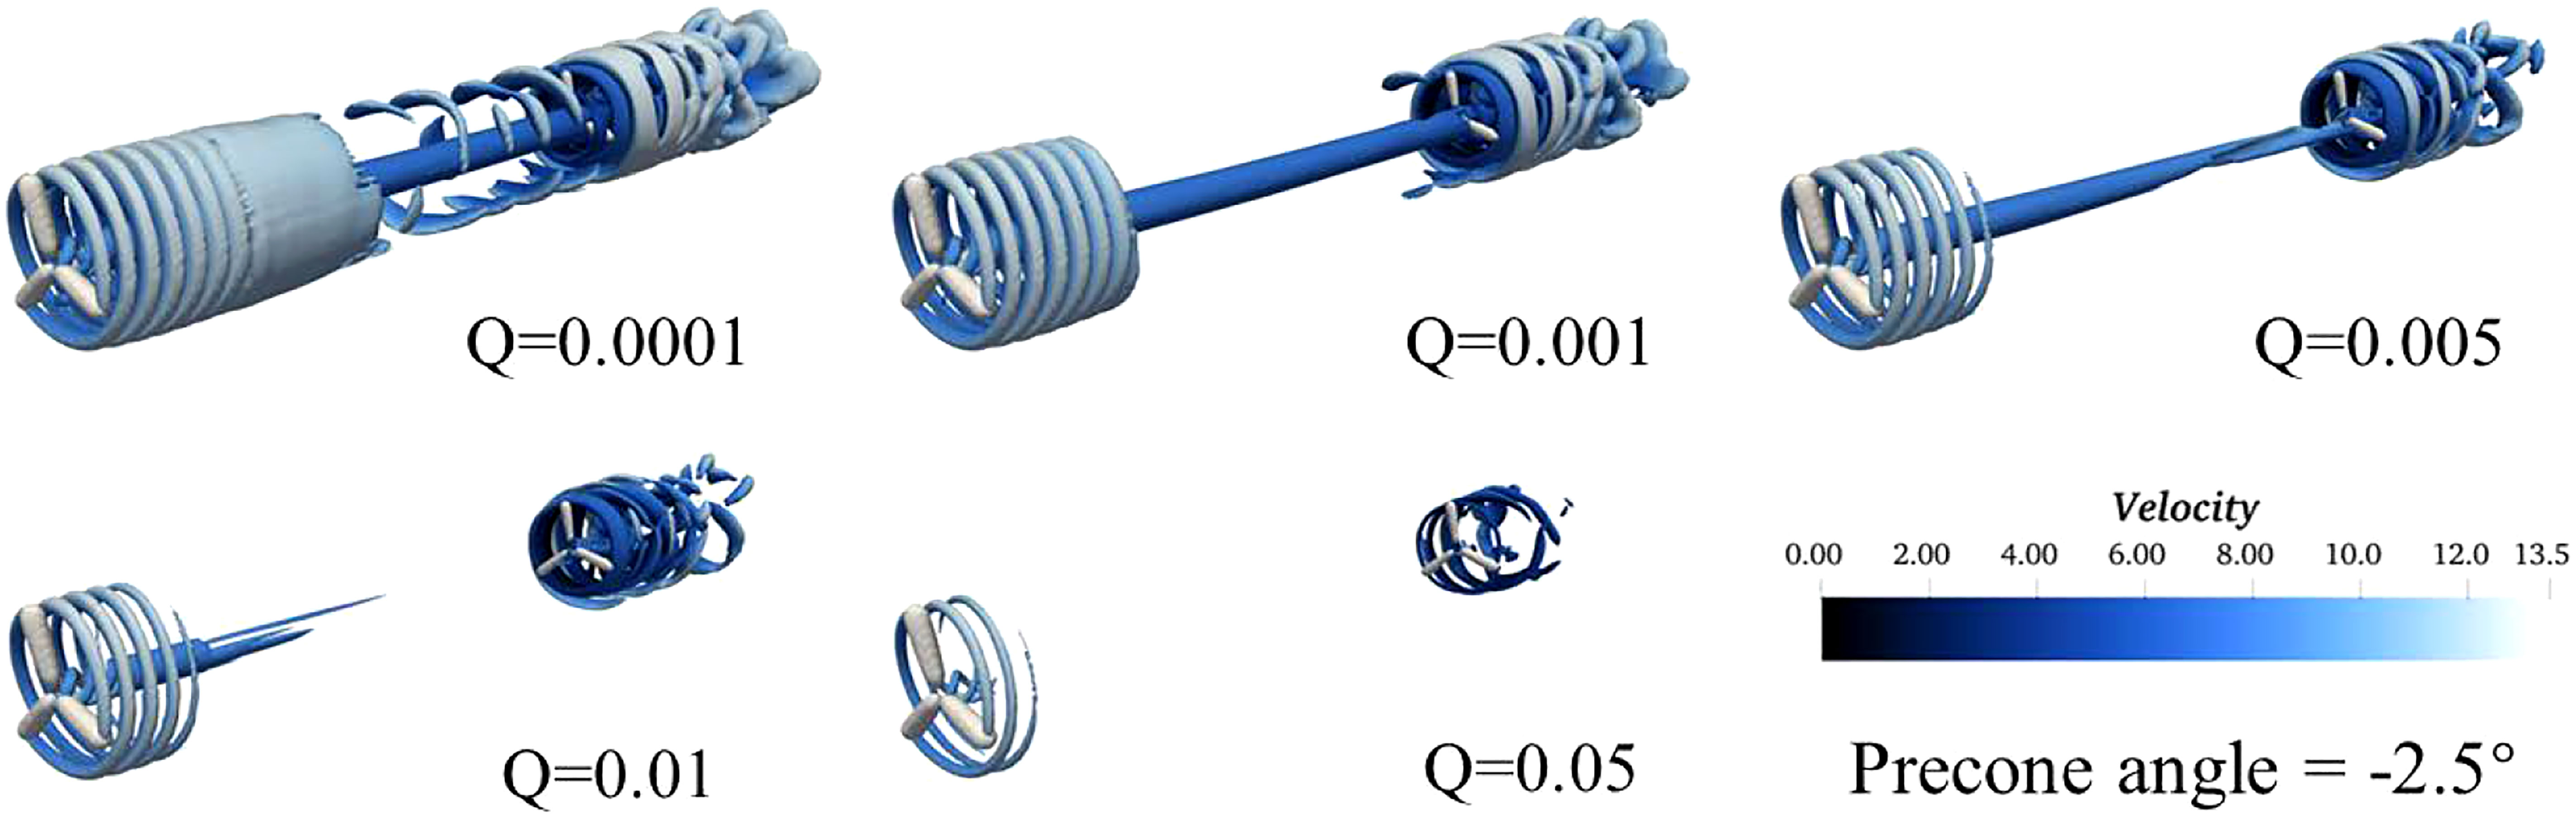
Figure 10 Under the precone angle (-2.5°) of the WT1, the second-generation vortex identification method (Q) visualizes the wake vortex structure.
Finally, the latest third-generation Ω vortex identification method is selected. The Ω is a bounded quantity between 0 and 1, and the preliminary recommended threshold given by Liu (Liu et al., 2016) is 0.52. Figure 11 explores the difference of wake vortex visualization by selecting five thresholds near the recommended value, it can be found that: (1) The recommended threshold is also applicable to the wake vortex identification of wind turbine under precone change, and the capture of wake vortex structure does not depend on human experience. (2) The tip vortex can be clearly captured as it gradually dissipates horizontally. (3) The Ω method illustrates the development of strong along with weak vortices. When the WT1 wake vortex gradually propagates downstream to the WT2 position, the upstream and downstream wake vortices interact, and the wake vortices are broken, resulting in many broken weak vortices. This is a phenomenon that other methods cannot capture by adjusting the threshold.
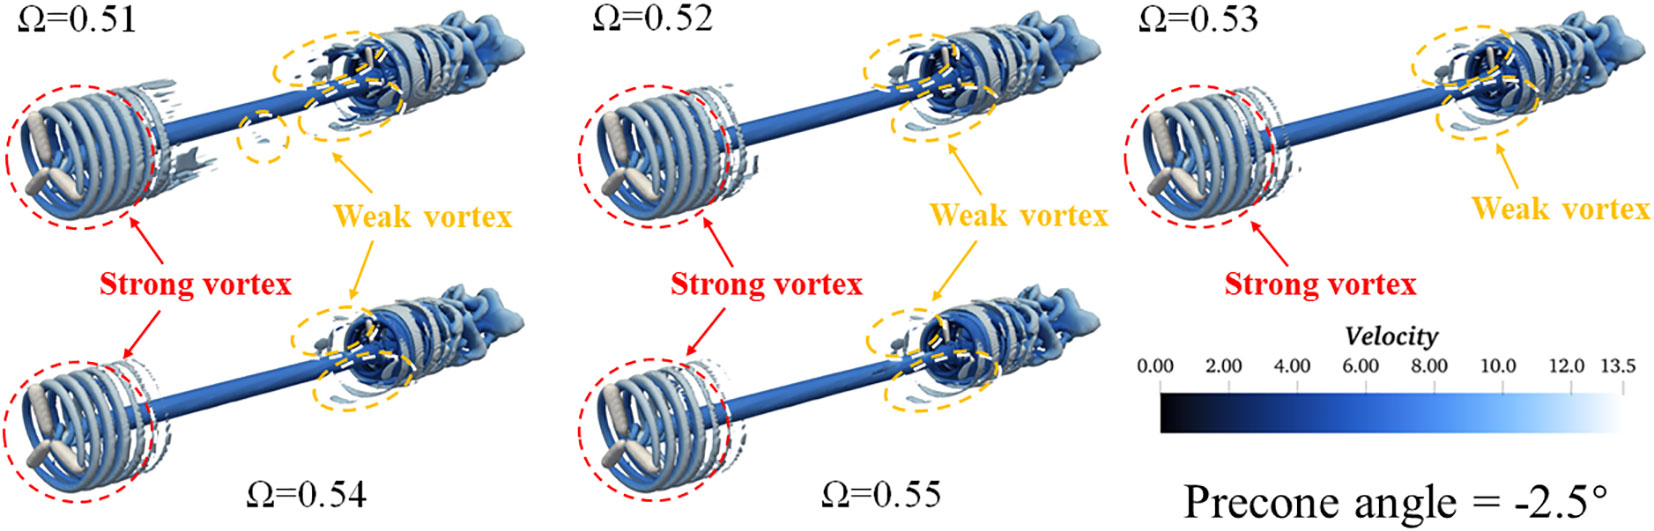
Figure 11 Under the precone angle (-2.5°) of the WT1, the third-generation vortex identification method (W) visualizes the wake vortex structure.
In this paper, an LDS sub-grid model is first programmed, and then an accurate simulation framework for the wind turbine wake (AL-LDS coupled model framework) is developed based on the actuator line and LDS sub-grid model. Secondly, two tandem wind turbines are selected as the research object. By changing the precone angle of the upstream turbine (-15°~15°), the aerodynamic characteristics and wake interference of the tandem twin-rotors are explored. Finally, the latest post-processing program of the third-generation Ω vortex identification method is compiled, and it is applied to the visualization study of the wake vortex of the tandem turbines under the precone change condition for the first time. The following conclusions are drawn:
(1) The precone change can increase the output power of the WT1, without weakening the wake effect of the WT1. However the WT2 stays in a strong wake state. Under the same absolute value of precone angle, the negative precone change of WT1 (-15°~0°) is more beneficial to the overall power output of the tandem twin-rotors.
(2) When the WT1 precone angle is 15°, the overall efficiency of the tandem wind turbines is the lowest. When the optimal precone angle of WT1 is 0° and -2.5°, the overall output power is increased by 7.4%~7.6%. Although the overall output power is optimal when the precone angle is 0°, we suggest the actual installation precone angle of the turbine is -2.5° due to the large flexible deformation of the blade tip.
(3) There is a wake velocity loss behind the WT1. When the wake propagates to the WT2, the wake meandering phenomenon is more obvious, resulting in a serious secondary velocity loss. The WT2 is completely in the mixing region of strong wake of the WT1, which leads to the increase of inefficiency, performance fluctuation and fatigue load in the WT2.
(4) During the downstream propagation of the WT1 wake, the wake width gradually expands, surpassing minimally the diameter. When the WT1 and WT2 wakes are superimposed, the cross-section area of the wake expansion further increases to about 1.5 times that of the wind turbine sweep area. In the actual wind farm, the lateral spacing of multi-rotors should be increased to reduce the influence of the turbine superimposed wake effect.
(5) The cross-section velocity contour of the WT1 near-wake is relatively regular, showing a circular symmetrical distribution, indicating that the force acting on the WT1 is more uniform. However, the shape of the wake behind the WT2 becomes irregular and the velocity shows a secondary loss, indicating that the stress instability of the WT2 is increased. When the wake develops to x=12D, the superimposed wake effect has basically restored the wind speed of the incoming flow.
(6) In the aspect of wake visualization, the first-generation (Vorticity) method is incomplete. The second-generation (Q) method can capture the process of the tip vortex developing downstream and gradually dissipating, but the threshold selection depends on experience. By contrast, the threshold of the third-generation (Ω) method is fixed, thus capturing the strong vortex, and identifying the weak vortex due to interaction of the wake vortex with the downstream wind turbine. This phenomenon cannot be captured by other vortex identification methods.
The original contributions presented in the study are included in the article/supplementary material. Further inquiries can be directed to the corresponding author.
YZ: Conceptualization, Investigation, Funding acquisition. RJ: Methodology, Validation, Writing – original draft, Investigation. KS: Conceptualization, Supervision, Investigation. ZZ: Writing – original draft, Investigation. YZ: Supervision, Resources. JZ: Investigation, Resources. XZ: Conceptualization, Investigation. ER: Writing – submitted draft, Writing – review and draft. All authors contributed to the article and approved the submitted version.
This work was supported by the Key Project of NSFC-Shandong Joint Research Funding POW3C (No. U1906230), the National Natural Science Foundation of China (No. 52171255, 51979062, 51879064 and 51579055), and Joint Laboratory of Offshore Wind Power and Intelligent Energy System, North China Electric Power University (HNKJ20-H88). In addition, the reviewers’ suggestions are also appreciated.
The authors declare that the research was conducted in the absence of any commercial or financial relationships that could be construed as a potential conflict of interest.
All claims expressed in this article are solely those of the authors and do not necessarily represent those of their affiliated organizations, or those of the publisher, the editors and the reviewers. Any product that may be evaluated in this article, or claim that may be made by its manufacturer, is not guaranteed or endorsed by the publisher.
Azlan F., Kurnia J. C., Tan B. T., Ismadi M. Z. (2021). Review on optimisation methods of wind farm array under three classical wind condition problems. Renewable Sustain. Energy Rev. 135, 110047. doi: 10.1016/j.rser.2020.110047
Bai X., Cheng H., Ji B., Long X., Qian Z., Peng X. (2020). Comparative study of different vortex identification methods in a tip-leakage cavitating flow. Ocean Eng. 207, 107373. doi: 10.1016/j.oceaneng.2020.107373
Barton I. E. (1998). Comparison of SIMPLE-and PISO-type algorithms for transient flows. Int. J. numerical Methods fluids 26 (4), 459–483. doi: 10.1002/(SICI)1097-0363(19980228)26:4<459::AID-FLD645>3.0.CO;2-U
Behrens T. (2009). OpenFOAM's basic solvers for linear systems of equations. Chalmers Department Appl. Mechanics 18 (02). http://www.tfd.chalmers.se/~hani/kurser/OS_CFD_2008/TimBehrens/tibeh-report-fin.pdf
Chen G., Li X. B., Liang X. F. (2022). IDDES simulation of the performance and wake dynamics of the wind turbines under different turbulent inflow conditions. Energy 238, 121772. doi: 10.1016/j.energy.2021.121772
Dong X., Gao Y., Liu C. (2019). New normalized rortex/vortex identification method. Phys. Fluids 31 (1), 011701. doi: 10.1063/1.5066016
Fleming P., Gebraad P. M. O., Lee S., van Wingerden J. W., Johnson K., Churchfield M., et al. (2015). Simulation comparison of wake mitigation control strategies for a two-turbine case. Wind Energy 18 (12), 2135–2143. doi: 10.1002/we.1810
Gao L. (2016). Numerical simulation of wind turbine wake interference effect (Beijing: North China Electric Power University).
Gao Z., Li Y., Wang T., Shen W., Zheng X., Pröbsting S., et al. (2021). Modelling the nacelle wake of a horizontal-axis wind turbine under different yaw conditions. Renewable Energy 172, 263–275. doi: 10.1016/j.renene.2021.02.140
Gebraad P. M. O., Fleming P. A., van Wingerden J. W. (2015). “Comparison of actuation methods for wake control in wind plants,” in 2015 American Control Conference (ACC). 1695–1701, IEEE.
Gui N., Qi H., Ge L., Cheng P. X., Wu H., Yang X. T., et al. (2019). Analysis and correlation of fluid acceleration with vorticity and liutex (Rortex) in swirling jets. J. Hydrodynamics 31 (5), 864–872. doi: 10.1007/s42241-019-0044-y
Hayase T., Humphrey J. A. C., Greif R. (1992). A consistently formulated QUICK scheme for fast and stable convergence using finite-volume iterative calculation procedures. J. Comput. Phys. 98 (1), 108–118. doi: 10.1016/0021-9991(92)90177-Z
Heinz S. (2020). A review of hybrid RANS-LES methods for turbulent flows: Concepts and applications. Prog. Aerospace Sci. 114, 100597. doi: 10.1016/j.paerosci.2019.100597
Hornung C., Viellieber M., Class A. (2015). Simulation of wake effects of windfarms using an actuator disk implementation. PAMM 15 (1), 487–488. doi: 10.1002/pamm.201510234
Houtin–Mongrolle F., Bénard P., Moureau V., Lartigue G., Bricteux L., Reveillon J. (2020). “Actuator grid method for turbulence generation applied to yawed wind turbines,” in Journal of physics, vol. 1618. (IOP Publishing), 062064.
Huang Y., Cao L., Wan D. (2021). “Application of liutex for analysis of complex wake flows characteristics of the wind turbine,” in Liutex and third generation of vortex definition and identification (Cham: Springer), 353–371.
Huang Z., Pan G., Pan H. K. (2010). Perfect plane wave injection for crank–Nicholson time-domain method. IET microwaves antennas propagation 4 (11), 1855–1862. doi: 10.1049/iet-map.2009.0315
Hunt J. C. R. (1987). Vorticity and vortex dynamics in complex turbulent flows. Trans. Can. Soc. Mechanical Eng. 11 (1), 21–35. doi: 10.1139/tcsme-1987-0004
Hunt J., Wray A., Moin P. (1988). Eddies, stream, and convergence zones in turbulent flows. Center Turbulent Res. Rep. CTR-S88.
Ji R., Sun K., Zhang J., Zhu R., Wang S. (2022). A novel actuator line-immersed boundary (AL-IB) hybrid approach for wake characteristics prediction of a horizontal-axis wind turbine. Energy Conversion Manage. 253, 115193. doi: 10.1016/j.enconman.2021.115193
Jokar H., Mahzoon M., Vatankhah R. (2022). Nonlinear dynamic characteristics of horizontal-axis wind turbine blades including pre-twist. Ocean Eng. 256, 111441. doi: 10.1016/j.oceaneng.2022.111441
Li P., Cheng P., Wan D. C., Xiao Q. (2015). “Numerical simulations of wake flows of floating offshore wind turbines by unsteady actuator line model,” in Proceedings of the 9th international workshop on ship and marine hydrodynamics, Glasgow, UK. 26–28.
Liu Q. (2014). Study on dynamic response and aerodynamic characteristics of floating wind turbine (Beijing: University of Chinese Academy of Sciences).
Liu C., Gao Y., Dong X., et al. (2019). Third generation of vortex identification methods: Omega and Liutex/Rortex based systems. J. Hydrodynamics 31 (2), 205–223. doi: 10.1007/s42241-019-0022-4
Liu J., Liu C. (2019). Modified normalized rortex/vortex identification method. Phys. Fluids 31 (6), 061704. doi: 10.1063/1.5109437
Liu C. Q., Wang Y. Q., Yang Y., Duan Z. (2016). New omega vortex identification method. Sci. China Physics Mechanics Astronomy 59 (8), 1–9. doi: 10.1007/s11433-016-0022-6
Martínez-Tossas L. A., Churchfield M. J., Leonardi S. (2015). Large Eddy simulations of the flow past wind turbines: actuator line and disk modeling. Wind Energy 18 (6), 1047–1060. doi: 10.1002/we.1747
Nakhchi M. E., Naung S. W., Rahmati M. (2022). A novel hybrid control strategy of wind turbine wakes in tandem configuration to improve power production. Energy Conversion Manage. 260, 115575. doi: 10.1016/j.enconman.2022.115575
Nash R., Nouri R., Vasel-Be-Hagh A. (2021). Wind turbine wake control strategies: A review and concept proposal. Energy Conversion Manage. 245, 114581. doi: 10.1016/j.enconman.2021.114581
Novikov A., Voskov D. V., Khait M., Hajibeygi H., Jansen J. D. (2021). “A collocated finite volume scheme for high-performance simulation of induced seismicity in geo-energy applications,” in SPE Reservoir Simulation Conference, OnePetro.
Pinguet R., Kanner S., Benoit M., Molin B.. (2020). “Validation of open-source overset mesh method using free-decay tests of floating offshore wind turbine,” in The 30th International Ocean and Polar Engineering Conference, OnePetro.
Piomelli U., Liu J. (1995). Large-Eddy simulation of rotating channel flows using a localized dynamic model. Phys. fluids 7 (4), 839–848. doi: 10.1063/1.868607
Qian Y., Zhang Z., Wang T. (2018). Comparative study of the aerodynamic performance of the new MEXICO rotor under yaw conditions. Energies 11 (4), 833. doi: 10.3390/en11040833
Ren Z., Wang J., Wan D. (2020). Investigation of the flow field of a ship in planar motion mechanism tests by the vortex identification method. J. Mar. Sci. Eng. 8 (9), 649. doi: 10.3390/jmse8090649
Rezaeiha A., Montazeri H., Blocken B. (2019). CFD analysis of dynamic stall on vertical axis wind turbines using scale-adaptive simulation (SAS): Comparison against URANS and hybrid RANS/LES. Energy Conversion Manage. 196, 1282–1298. doi: 10.1016/j.enconman.2019.06.081
Rinne E., Holttinen H., Kiviluoma J., Rissanen S. (2018). Effects of turbine technology and land use on wind power resource potential. Nat. Energy 3 (6), 494–500. doi: 10.1038/s41560-018-0137-9
Rosenblatt M. (2000). Gaussian And non-Gaussian linear time series and random fields (Springer Science & Business Media).
Sayed M., Lutz T., Krämer E., Shayegan S., Wüchner R. (2019). Aeroelastic analysis of 10 MW wind turbine using CFD–CSD explicit FSI-coupling approach. J. Fluids Structures 87, 354–377. doi: 10.1016/j.jfluidstructs.2019.03.023
Sharma V., Cortina G., Margairaz F., Parlange M. B., Calaf M. (2018). Evolution of flow characteristics through finite-sized wind farms and influence of turbine arrangement. Renewable Energy 115, 1196–1208. doi: 10.1016/j.renene.2017.08.075
Shen W. Z. (2015). Validation of the actuator line model for simulating flows past yawed wind turbine rotors. J. Power Energy Eng. 3 (07), 7. doi: 10.4236/jpee.2015.37002
Sorensen J. N., Shen W. Z. (2002). Numerical modeling of wind turbine wakes. J. Fluids Eng. 124 (2), 393–399. doi: 10.1115/1.1471361
Sun K., Ji R., Zhang J., Li Y., Wang B.. (2021). Investigations on the hydrodynamic interference of the multi-rotor vertical axis tidal current turbine. Renewable Energy 169, 752–764. doi: 10.1016/j.renene.2021.01.055
Veers P., Dykes K., Lantz E., Barth S., Bottasso C. L., Carlson O., et al. (2019). Grand challenges in the science of wind energy. Science 366 (6464), eaau2027. doi: 10.1126/science.aau2027
Wang B. C., Bergstrom D. J. (2005). A general optimal formulation for the dynamic smagorinsky subgrid-scale stress model. Int. J. numerical Methods fluids 49 (12), 1359–1389. doi: 10.1002/fld.1031
Wang X., Chen G., Xiao L., Wen B. R., Tian X. L. (2019). Numerical simulation of aerodynamic characteristics of large scale horizontal axial fan. China Offshore Platform 334 (6), 31–39.
Wang Y., Gao Y., Xu H., Dong X. R., Liu J. M., Xu W. Q., et al. (2020). Liutex theoretical system and six core elements of vortex identification. J. Hydrodynamics 32 (2), 197–211. doi: 10.1007/s42241-020-0018-0
Wang Y., Miao W., Ding Q., Li C., Xiang B. (2019). Numerical investigations on control strategies of wake deviation for large wind turbines in an offshore wind farm. Ocean Eng. 173, 794–801. doi: 10.1016/j.oceaneng.2019.01.042
Wang Y. Q., Yu H. D., Zhao W. W., Wan D. C. (2021). Liutex-based vortex control with implications for cavitation suppression. J. Hydrodynamics 33 (1), 74–85. doi: 10.1007/s42241-021-0013-0
Wang H., Zhang B., Qiu Q. (2016). Numerical study of the effects of wind shear coefficients on the flow characteristics of the near wake of a wind turbine blade. Proc. Institution Mechanical Engineers Part A: J. Power Energy 230 (1), 86–98. doi: 10.1177/0957650915617855
Wesseling P. (1987). “Linear multigrid methods,” in Multigrid methods (Society for Industrial and Applied Mathematics), 31–55.
Whitehouse G. R., Boschitsch A. H., Danilov P. (2022). “Efficient Cartesian grid CFD-based methods for aeroelastic analysis of wind turbines,” in AIAA SCITECH 2022 Forum. 1017.
Xu H., Cai X., Liu C. (2019). Liutex (vortex) core definition and automatic identification for turbulence vortex structures. J. Hydrodynamics 31 (5), 857–863. doi: 10.1007/s42241-019-0066-5
Xu W., Li Y., Li G., Li S., Zhang C., Wang F. (2021). High-resolution numerical simulation of the performance of vertical axis wind turbines in urban area: Part II, array of vertical axis wind turbines between buildings. Renewable Energy 176, 25–39. doi: 10.1016/j.renene.2021.05.011
Yuan Z., Jiang J., Zang J., Sheng Q., Sun K., Zhang X., et al. (2020). A fast two-dimensional numerical method for the wake simulation of a vertical axis wind turbine. Energies 14 (1), 49. doi: 10.3390/en14010049
Yuan Z., Sheng Q., Sun K., Zang J., Zhang X., Jing F., et al. (2021). The array optimization of vertical axis wind turbine based on a new asymmetric wake model. J. Mar. Sci. Eng. 9 (8), 820. doi: 10.3390/jmse9080820
Yu Z., Hu Z., Zheng X., Ma Q., Hao H. (2020). Aeroelastic performance analysis of wind turbine in the wake with a new elastic actuator line model. Water 12 (5), 1233. doi: 10.3390/w12051233
Yu Z., Zheng X., Ma Q. (2018). Study on actuator line modeling of two NREL 5-MW wind turbine wakes. Appl. Sci. 8 (3), 434. doi: 10.3390/app8030434
Zeng X., Shi W., Michailides C., Zhang S., Li X. (2021a). Numerical and experimental investigation of breaking wave forces on a monopile-type offshore wind turbine. Renewable Energy 175, 501–519. doi: 10.1016/j.renene.2021.05.009
Zeng X., Shi W., Michailides C., Wang K., Li X. (2021b). Comparative experimental and numerical study of wave loads on a monopile structure using different turbulence models. China Ocean Eng. 35 (4), 554–565. doi: 10.1007/s13344-021-0050-z
Zhang Y., Zang W., Zheng J., Zhang J., Zheng Y., Zang W., et al. (2021). The influence of waves propagating with the current on the wake of a tidal stream turbine. Appl. Energy 290, 116729. doi: 10.1016/j.apenergy.2021.116729
Zhang Y., Zhang J., Lin X., Wang R., Zhang C., Zhao J. (2020). Experimental investigation into downstream field of a horizontal axis tidal stream turbine supported by a mono pile. Appl. Ocean Res. 101, 102257. doi: 10.1016/j.apor.2020.102257
Zhang Y., Zhang Z., Zheng J., Cappietti L., Zhang J., Zheng Y., et al. (2021). Experimental investigation into effects of boundary proximity and blockage on horizontal-axis tidal turbine wake. Ocean Eng. 225, 108829. doi: 10.1016/j.oceaneng.2021.108829
Zhao W., Wang J., Wan D. (2020). Vortex identification methods in marine hydrodynamics. J. Hydrodynamics 32 (2), 286–295. doi: 10.1007/s42241-020-0022-4
Zou C. L., Wang Q., Liao K. P., Ma Q. W. (2018). “Analysis of the tower influence on floating offshore wind turbine aerodynamic performance based on CFD method,” in The 28th International Ocean and Polar Engineering Conference, OnePetro.
Keywords: wind turbine, actuator line, large eddy simulation, precone variation, vortex identification method, refined numerical simulation
Citation: Zhang Y, Ji R, Sun K, Zhang Z, Zheng Y, Zhang J, Zhang X and Rodriguez EF (2022) Research on complex wake interference of aligned rotors considering the precone variation of the upstream wind turbine. Front. Mar. Sci. 9:1039233. doi: 10.3389/fmars.2022.1039233
Received: 07 September 2022; Accepted: 16 November 2022;
Published: 06 December 2022.
Edited by:
Sheng Xu, Jiangsu University of Science and Technology, ChinaReviewed by:
Yuanchuan Liu, Ocean University of China, ChinaCopyright © 2022 Zhang, Ji, Sun, Zhang, Zheng, Zhang, Zhang and Rodriguez. This is an open-access article distributed under the terms of the Creative Commons Attribution License (CC BY). The use, distribution or reproduction in other forums is permitted, provided the original author(s) and the copyright owner(s) are credited and that the original publication in this journal is cited, in accordance with accepted academic practice. No use, distribution or reproduction is permitted which does not comply with these terms.
*Correspondence: Renwei Ji, amlyZW53ZWlAaHJiZXUuZWR1LmNu; Ke Sun, c3Vua2VAaHJiZXUuZWR1LmNu
Disclaimer: All claims expressed in this article are solely those of the authors and do not necessarily represent those of their affiliated organizations, or those of the publisher, the editors and the reviewers. Any product that may be evaluated in this article or claim that may be made by its manufacturer is not guaranteed or endorsed by the publisher.
Research integrity at Frontiers
Learn more about the work of our research integrity team to safeguard the quality of each article we publish.