 Sung-Hun Kim
 Hyoun-Woo Kang
 Il-Ju Moon
 Sok Kuh Kang
 Pao-Shin Chu
- 1Marine Environmental & Climate Research Division, Korea Institute of Ocean Science and Technology, Busan, South Korea
- 2Typhoon Research Center, Jeju National University, Jeju, South Korea
- 3Department of Atmospheric Sciences, School of Ocean and Earth Science and Technology, University of Hawaii at Manoa, Honolulu, HI, United States
The air-sea drag coefficient (Cd) is closely related to tropical cyclone (TC) intensification. Several recent studies suggested that the Cd decreases in winds greater than 33 m s−1. The effects of Cd reduction in high winds on TC intensity, especially rapid intensification (RI) and the lifetime maximum intensity (LMI) distribution, were investigated by analyzing the wind-dependent Cd-based ocean vertical mixing and the energy budget. In addition, to consider the uncertainty of the Cd in extreme winds (above 50 m s−1), three types of Cd fitting that decrease after 33 m s−1, which show different trends after 50 m s−1 (increase, flat, and decrease), were adopted. The results were then compared with those for the control fitting (saturated after 33 m s−1) and show that the reduced Cd in high winds drives an increase in net energy by reducing frictional dissipation and suppressing sea surface cooling. This extra energy prevents the TC from achieving a steady-state, causing the bimodality of simulated maximum potential intensity. The observed steady-state probability (intensification rate and RI probability) in the Cd reduced wind range were significantly lower (higher) than in the others. These results suggest that Cd reduction might potentially induce the RI and LMI bimodality.
1 Introduction
The intensity of tropical cyclones (TCs) is sensitive to the fluxes of enthalpy and momentum in the air-sea interface in the high wind core of the storm (Ooyama, 1969; Rosenthal, 1971; Emanuel, 1986; Emanuel, 1995; Emanuel, 2003). The accurate parameterization of the air-sea exchange process is crucial to understanding the mechanisms controlling the evolution of TCs (Emanuel, 2003). Several studies have examined the air-sea drag coefficient (Cd) parameterization under TC winds. Recent studies showed that Cd decreases after saturation at approximately 33 m s−1 in open-ocean TC conditions (Powell et al., 2003; Bye & Jenkins, 2006; Jarosz et al., 2007; Holthuijsen et al., 2012; Soloviev et al., 2014; Zou et al., 2018; Donelan, 2018; Golbraikh & Shtemler, 2020), however, few studies investigated the drag-reduction (DR) effects on TC intensity.
Soloviev et al. (2014) argued that the Cd would decrease with wind speeds of 35–60 m s−1 and increase in extreme winds greater than 60 m s−1, based on two-phase parameterization and observations of previous studies. They suggested that the minima of Cd at 60 m s−1 might explain the rapid intensification (RI), which is a critical factor in the bimodal distribution of lifetime maximum intensity (LMI; Figure 1; see Lee et al., 2016). Soloviev et al. (2017) again showed through case analysis that DR induces RI and recently suggested that an increase in Cd in extreme wind speed is the leading cause of the rapid weakening of Category 5 TCs. Donelan (2018) analyzed the DR-based theoretical maximum potential intensity (MPI; Emanuel, 1988; Emanuel, 1995) at several fixed sea surface temperatures (SSTs) and compared the results with the empirical MPI proposed by DeMaria and Kaplan (1994). Donelan found that the DR is a critical factor in the RI, which is a characteristic of the climatology of Atlantic hurricanes. To explain the reason for RI and the bimodality of LMI, however, these studies focused on only the reduction in frictional dissipation.
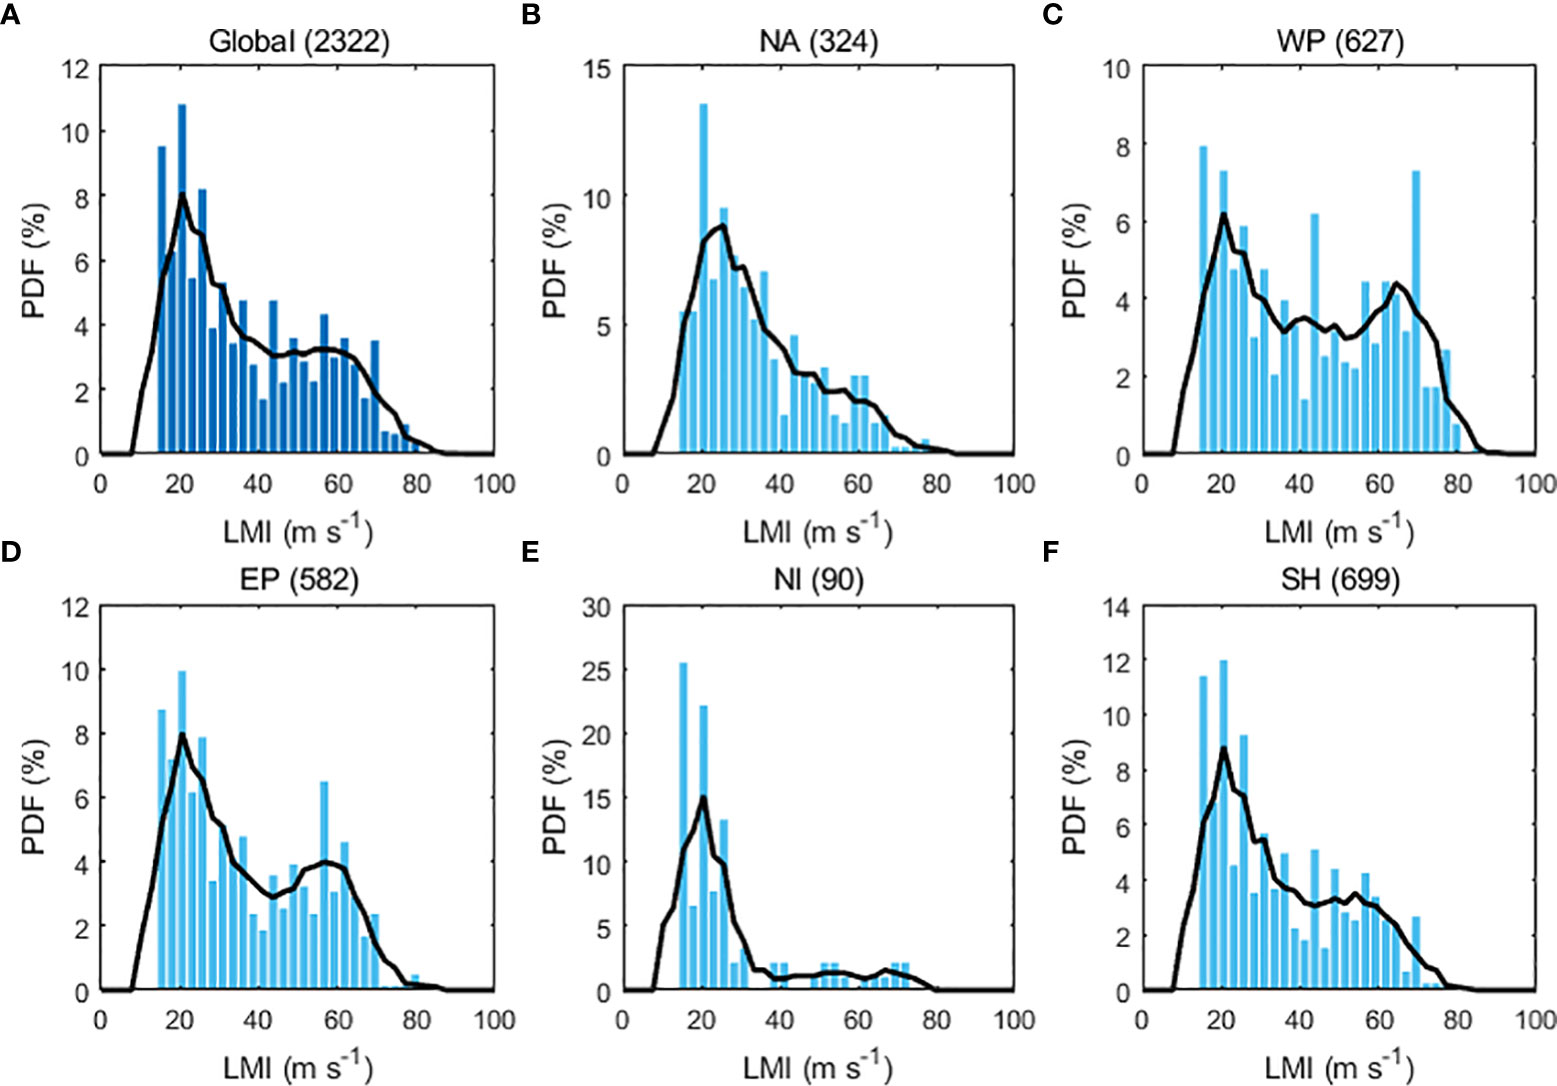
Figure 1 Distribution of tropical cyclone lifetime maximum intensity in 1982–2020: (A) Global, (B) North Atlantic, (C) Western Pacific, (D) Eastern Pacific, (E) North Indian Ocean, and (F) Southern Hemisphere. The blue bars show the raw data binned into 2.6 m s−1 bins. The solid black lines indicate the smoothed probability density functions with a window width of 10.3 m s−1. The number of samples is indicated in parentheses. Only samples from 2001–2017 with a distance of 259 km (global mean of the radius of at least 17.5 m s−1 winds + one standard deviation from land) were analyzed to exclude cases affected by topography. Short-lived tropical cyclones (two days or less at tropical storm-force intensity) were excluded to avoid data heterogeneity (Landsea et al., 2010).
The MPI is widely used to estimate TC maximum surface wind speed for a given atmospheric thermal environment and SST (Emanuel, 1988; Emanuel, 1995). However, TCs gain the energy needed to evolve from a TC-induced well-mixed ocean. Lin et al. (2013) suggested that TC intensity has a stronger relationship with depth-averaged temperatures (DAT; Price, 2009) than with pre-storm SSTs. They revised the MPI using DATs instead of SSTs to reduce the positive bias of the maximum intensity prediction. The DAT-based MPI is frequently used to predict TC intensity and RI (Balaguru et al., 2015; Gao et al., 2016; Balaguru et al., 2018; Kim et al., 2018; Lee et al., 2019). Inspired by previous studies (Lin et al., 2013; Soloviev et al., 2014; Soloviev et al., 2017; Donelan, 2018), Lee et al. (2019) suggested the net energy gain rate (NGR) index, which is the difference between DAT-based energy generation and wind-dependent Cd-based frictional dissipation. The NGR significantly improved prediction accuracy in the short forecast lead times. In addition, they found that the effect of DAT and wind-dependent Cd on the intensity prediction significantly contributed to improvements in accuracy.
The TC-induced sea surface cooling, which plays a critical role in TC evolution, is determined mainly by the upper-ocean thermal structure, wind stress, and translation speed (Shay et al., 2000; Shay et al., 2000; Emanuel, 2003; Pun et al., 2007; Wada & Usui, 2007; Lin et al., 2008; Goni et al., 2009; Kaplan et al., 2010). Because wind stress depends on the Cd, changes in the Cd may also affect TC-induced sea surface cooling. Therefore, to understand the effect of DR on TC intensification, it is first necessary to quantitatively investigate the role of DR in TC-induced sea surface cooling.
In this study, we investigate the effects of DR on RI and the distribution of LMI by using the NGR. Additionally, we analyzed its impact on sea surface cooling, which was not addressed in previous studies. The data and methodology are described in Section 2. Section 3 examines the effects of Cd reduction on TC-induced sea surface cooling and net energy budget. The discussion and summary are presented in Section 4.
2 Methods
2.1 Data collection
The position and translation speed of TC were obtained from the International Best Track Archive for Climate Stewardship Version 4 for 1982–2020. The statistical data for subsequent analysis were calculated at 6-hour intervals for TCs with wind speeds of or greater than 34 kt. In this study, a TC was defined as being affected by land when the radius of the 34 kt wind, which is the analysis minimum intensity, reaches the land. Therefore, the cases in which the TC was within 259 km (the global mean 34kt wind radius + one σ in 2001–2020) of the coastline were excluded from the analysis. In addition, short-duration TCs (less than two days) were excluded from the study to avoid the data heterogeneity caused by improved observational capacity during the analysis period (Landsea et al., 2010; Villarini et al., 2011). The present study used ocean profiles (temperature and salinity) obtained from the European Centre for Medium-Range Weather Forecasts (ECMWF) Ocean Reanalysis System 5 monthly data with a horizontal resolution of 0.25 degrees for the analysis period. The atmospheric profiles used in this study were obtained from the ECMWF ERA5 monthly data with a horizontal resolution of 0.25 degrees. These environmental profiles were averaged within a radius of 200 km from the storm center.
2.2 Wind-dependent drag coefficient
The air-sea drag coefficient increases linearly with wind speed (Large & Pond, 1981; Wu, 1982; Edson et al., 2013), however, recent studies have shown that Cd saturates (Donelan et al., 2004; Takagaki et al., 2012; Komori et al., 2018) or decreases at winds of approximately 30–35 m s−1 (Powell et al., 2003; Bye & Jenkins, 2006; Jarosz et al., 2007; Holthuijsen et al., 2012; Soloviev et al., 2014; Zou et al., 2018; Donelan, 2018; Golbraikh & Shtemler, 2020). Golbraikh and Shtemler (2020) showed that the two different tendencies of Cd at high wind speeds are due to the foam layer effect at the air-sea interface. They suggested that the laboratory-measured sea surface drag is the result of the foam-free condition and that sea surface drag would be reduced under TC conditions when the foam layer effect is taken into account.
Because of limited observation and experimentation, there is still no consensus on extreme wind speeds greater than 50 m s−1 (Rotunno & Emanuel, 1987; Montgomery et al., 2010; Bell et al., 2012). However, recent observational and modeling studies have suggested several possibilities for the behavior of Cd in extreme winds: increase (Soloviev et al., 2014; Soloviev et al., 2017; Donelan, 2018), no change (Walsh et al., 2010), or decrease (Bye & Jenkins, 2006; Kudryavtsev & Makin, 2011; Holthuijsen et al., 2012). To consider all possibilities for the behavior of Cd in extreme wind speed, three DR fittings that decrease after 33 m s−1 but show different trends after 50 m s−1 (increase, IC; flat, FLT; decrease, DC) were adopted. In addition, the results of control fittings (Donelan et al., 2004, D04, Figure 2, grey box) in which Cd is saturated at 33 m s−1 were compared with the results of DR fittings to investigate the effect of DR.
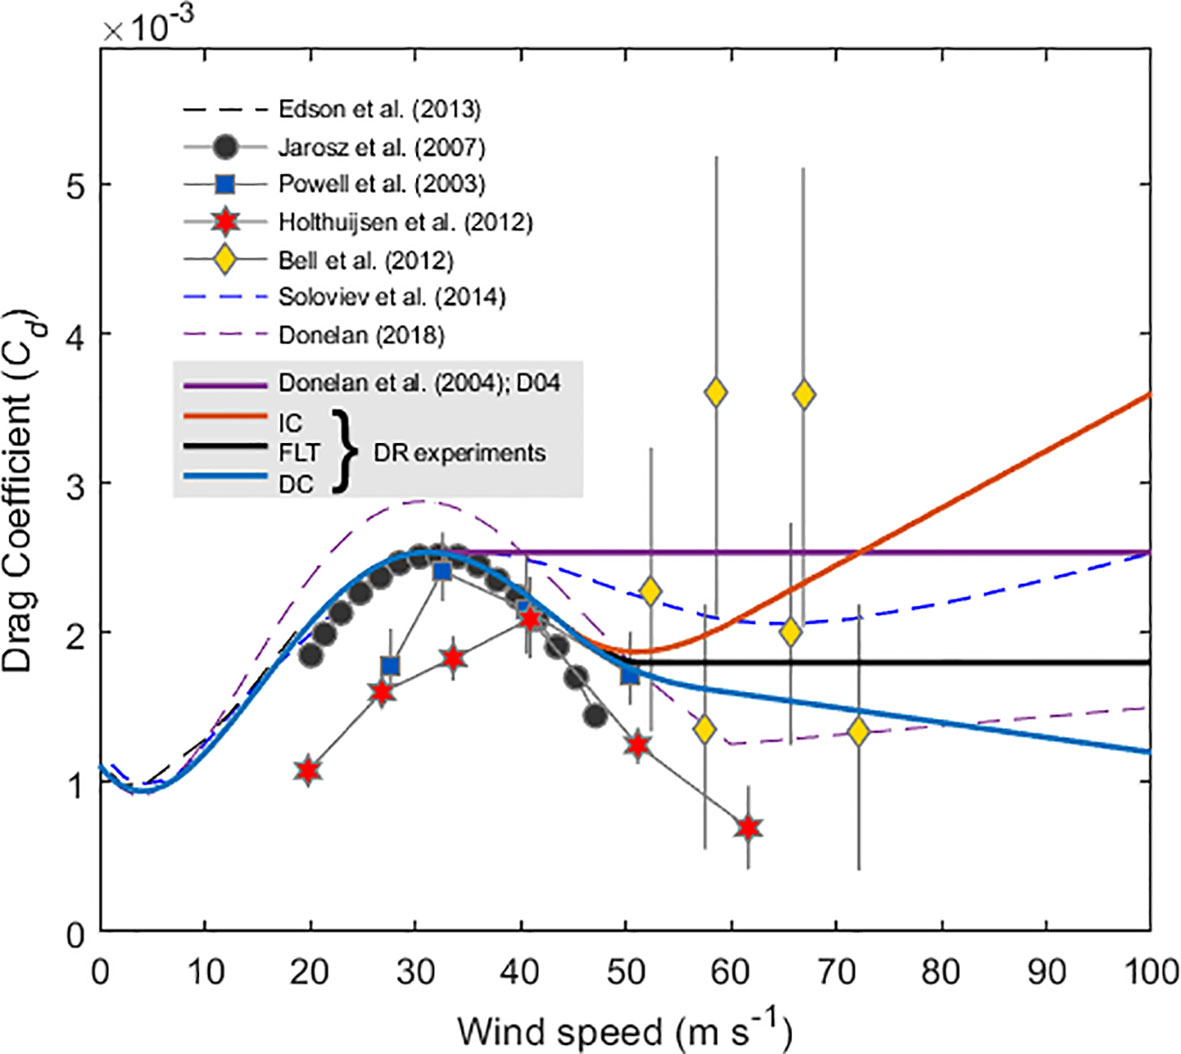
Figure 2 Comparison of drag coefficients (Cd) as a function of wind speed at 10 m height. Parameterizations of Cd shown in the grey box were used in this study.
The exchange of energy in the air-sea interface depends not only on Cd but also on the transfer of heat through the surface. The neutral Cdis defined as:
where κ is the von Kármán constant, and z0is the roughness length for momentum. The neutral exchange coefficient of enthalpy (Ck) is determined by z0and the roughness length for enthalpy (zt).
Therefore, a change in Cd, a function of z0, leads to a change in Ck. In this study, Ck was calculated using z0 estimated by Cd presented above, and zt was used in the Hurricane WRF v4.0a (Biswas et al., 2018).
2.3 Depth-averaged temperature
Price (2009) suggested that the DAT is a good metric to estimate a realistic ocean response by TCs:
where d is the depth of TC-induced vertical mixing. The DAT is the vertically averaged temperature from the sea surface to d, and refers to the SST beneath a TC. An accurate estimation of d resulting from TC winds is necessary to calculate a realistic DAT. The bulk Richardson number-based estimation of d, as proposed by Price (1981), was applied as follows:
where ρ(z) is the density profile, g is the gravitational acceleration, ρ0 is the seawater density, ρa is the air density, τ is the wind stress, Rh is the maximum wind radius, Uh is TC translation speed, U is wind speed, and S is the non-dimensional storm speed (Price et al., 1994). The bottom term in Equation (4) represents the shear production of turbulence and the top term is the consumption of turbulence. In this study, the DAT was calculated by increasing U from 1 to 100 m s−1 at 1 m s−1 intervals for all global observed TC locations. For the estimation of d, we used the observed Uh, and fixed Rh to 35 km.
2.4 Net energy gain rate and probability density function of maximum potential intensity
The NGR, which is the difference between energy generation (GDAT) by enthalpy flux and frictional dissipation (Dw) by sea surface drag, represents the energy budget of TC (Lee et al., 2019). It is indicated by:
where To is the TC outflow temperature, is the sea surface saturation enthalpy, and k is the near-surface enthalpy in the TC environment. The first term in the GDAT is thermodynamic efficiency, which refers to the ratio of the enthalpy of convective air being used as the energy source of the TC. In the calculation of MPI, Emanuel (1995) assumed that the total energy input of TC is dominated by the contribution near the maximum wind radius. However, Wang and Xu (2010) showed that the Dw was about 25% greater than the energy generation rate (G) near the radius of maximum wind in the numerically simulated mature TC, while the Dw was lower than the G outside the eyewall. They also showed that the energy shortage near the eyewall is relieved by the inflow of energy produced outside the eyewall. Therefore, for this study we increased GDAT by 25% to account for the energy input inward from outside the eyewall. The probability density function (PDF) of the MPI was estimated based on the cumulative density function (CDF) as follows.
The present study calculated the NGR according to the wind speed at 1 m s−1 intervals at the observed TC locations using the DAT calculated in the previous section. Based on these results, the PDF of the MPI was estimated.
3 Results
3.1 The drag coefficient and tropical cyclone-induced sea surface cooling
The mixing length is strongly influenced by the momentum flux, which is a function of wind speed and Cd. Therefore, the increased momentum flux with wind speed leads to deeper vertical mixing, which results in lower DATs (Figures 3A–C; blue lines). Conversely, decreasing the Cd reduces the momentum flux, which weakens vertical mixing. The difference in the DATs in the DR experiments (IC, FLT, DC) and the D04 gradually increased with the reduction in the Cd and was ~0.9 ± 0.5°C at 50 m s−1 (Figures 3A–C; red lines). The DAT is crucial in determining the GDAT efficiency (the RHS first term of Equation [6]) and saturation enthalpy at the sea surface. Thus, a change in the DAT can significantly influence GDAT.
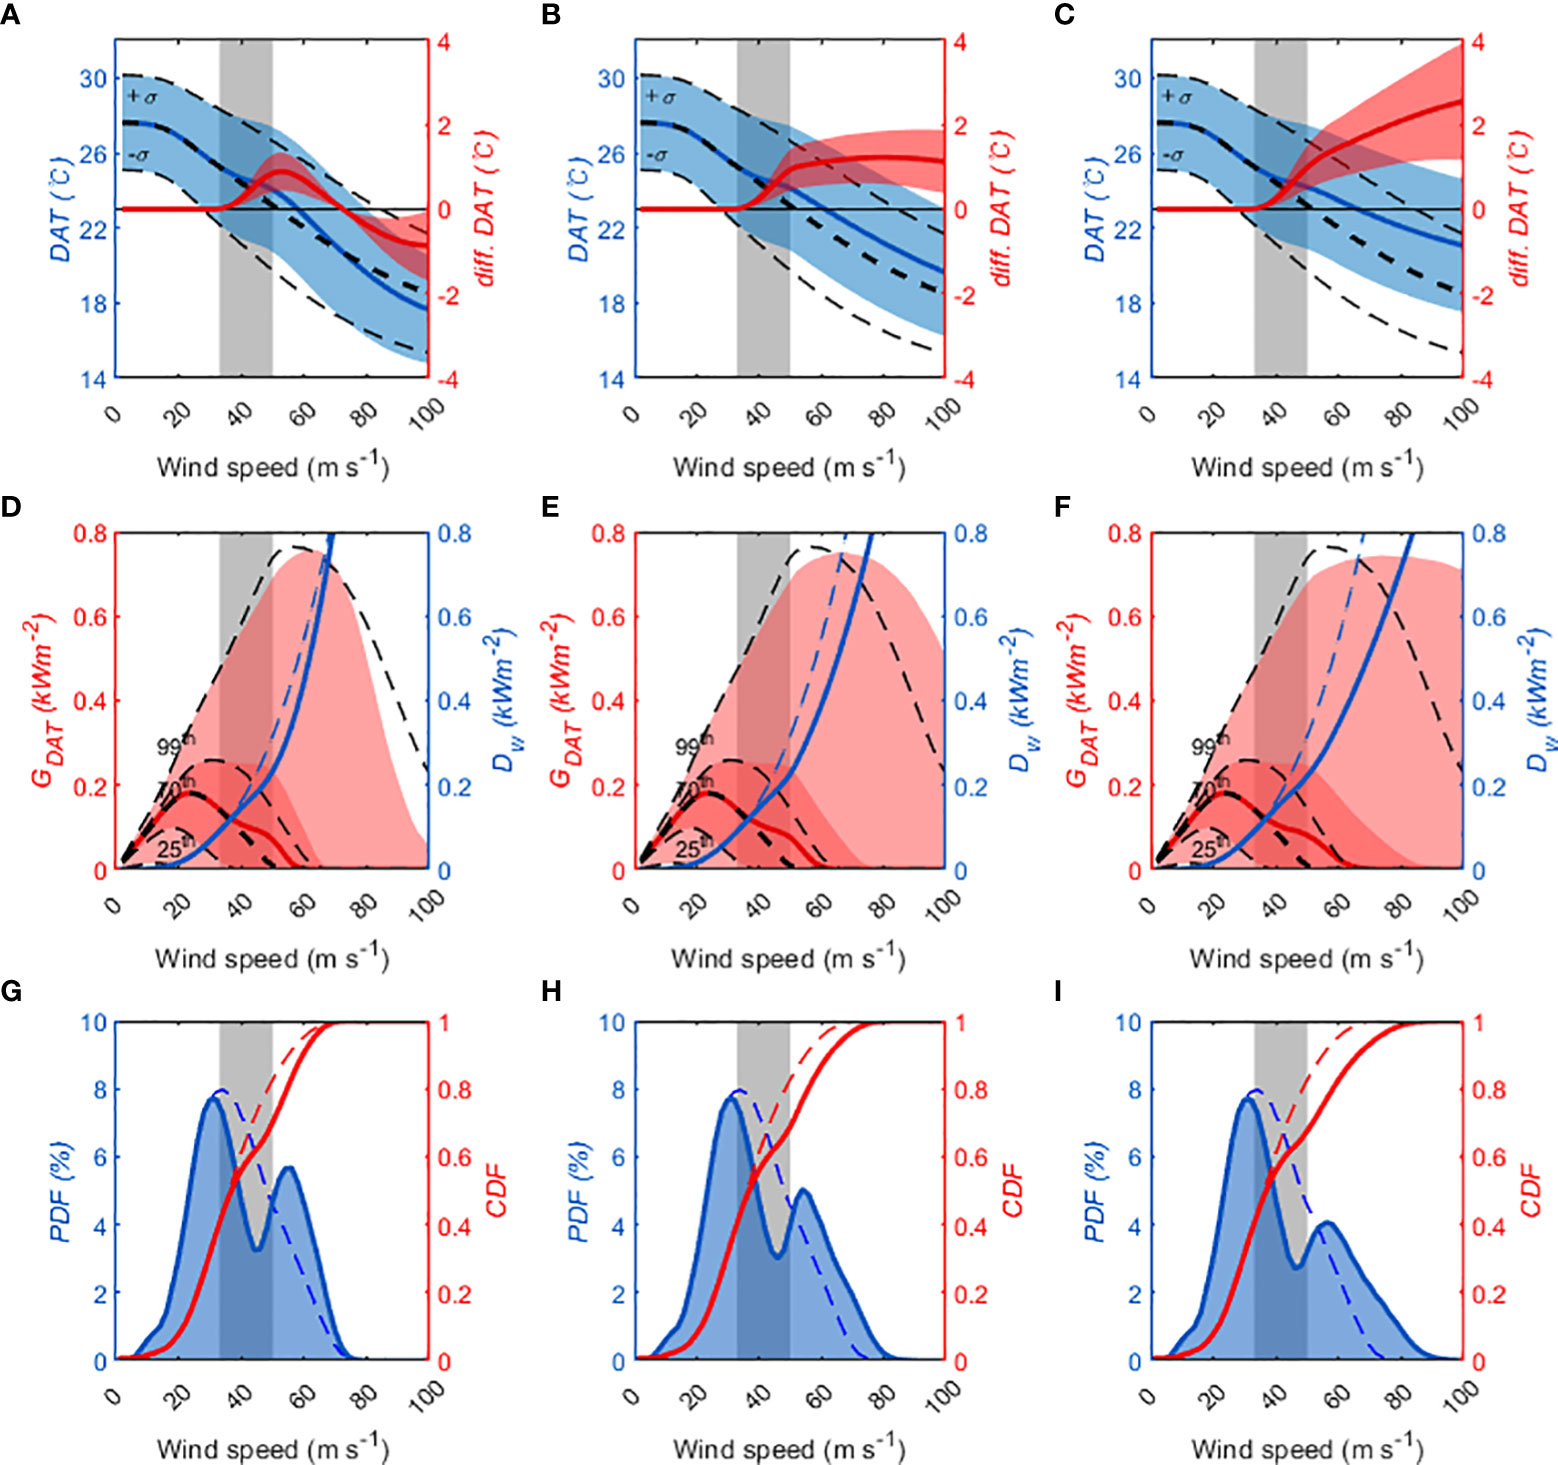
Figure 3 (A–C) The distribution of the depth-averaged temperature (DAT) and difference between D04 and each experiment: IC (left panels), FTL (center panels) and DC (right panels). The blue solid line and thick black dashed line indicate mean of DAT for each experiment and D04, respectively. The red solid line is the mean difference between D04 and each experiment. The shaded areas and black dashed lines indicate ±1σ intervals. (D–F) The distribution of the depth-averaged temperature-based energy generation (GDAT) and frictional dissipation (Dw). The red solid line and thick black dashed line indicate the median of Gdat for each experiment and D04, respectively. The red shaded areas and black dashed lines indicate percentiles (25th, 70th, 99th) of Gdat for each experiment and D04, respectively. (G–I) The distribution of the cumulative distribution functions (red lines) and probability density functions (blue lines) of maximum potential intensity (MPI). The dashed lines represent the results of D04 and solid lines indicate the results of the three experiments. The probability density function of MPI is smoothed with a window width of 4 m s−1.
3.2 The net energy gain rate and the distribution of maximum potential intensity
The comparison of GDAT percentiles (Figures 3D–F) shows that those in the DR experiments (solid red line and shaded area) were higher than D04 (black dashed lines) in the DR wind speed range (DRR). The local increase in DAT, discussed in the previous section, leads to an increase in thermodynamic efficiency and (first and last term in Equation [6]), which results in an increase in GDAT in DRR.
A comparison of Dw showed that DR experiments are commonly more minor than D04 in DRR (Figures 3D–F; thick blue lines). As indicated in previous studies (Soloviev et al., 2014; Soloviev et al., 2017; Donelan, 2018), DR reduces frictional dissipation in the boundary layer, thereby contributing to an increased energy budget.
Local changes of these two parameters in DRR provide extra energy (i.e., NGR) to the TCs, allowing them to intensify further. The difference between CDF in DR experiments and that in the D04 experiment was approximately 0.14 at 50 m s −1 (Figures 3G–I; red lines). This result suggested that 14% of TCs did not achieve the steady-state in DRR due to the locally increased NGR. In comparing the PDFs of the estimated MPI based on the NGR for each experiment, the MPI PDF of the DR experiments indicated a bimodal distribution (Figures 3G–I; thick blue lines), whereas the results for the D04 showed unimodality (Figures 3G–I; dashed blue lines). The first peak position of the MPI PDF in the DR experiments was 32 m s−1; the second peak appeared between approximately 54–56 m s−1. The probability density was 7.7% for the first peak and 5.7%, 5.0%, and 4.1% for the second peak in IC, FLT, and DC, respectively. Except for the position of the first peak, the distributions of the simulated MPI in the DR experiments agree relatively well with observations (first peak; 20.6 m s−1, 8.1%, second peak; 56.6 m s−1, 3.2%, see Figure 1A).
Tang and Emanuel (2010) investigated the effects of vertical wind shear-induced ventilation on TC intensity. They found that ventilation decreased the maximum steady-state intensity below the potential intensity. Using a simple two-layer diagnostic balance model and regression analysis of observed Atlantic hurricanes, DeMaria (1996) revealed that intense TCs tend to be less sensitive to the vertical shear effect. These studies found that it is difficult for weak TCs to achieve their MPI because of the influence of wind shear. In contrast, intense TCs are more strongly vertically coupled, which allows them to achieve the MPI by resisting the force of the wind shear. This intensity dependence on wind shear influences may explain the differences in the first peak position of the MPI PDF and LMI.
Next, we investigated the quantitative contribution of each term to the increase in NGR. The difference in the mean NGRs of the DR and D04 experiments were approximately 0.12 kW on average in the three experiments at 50 m s−1. The contributions of Dw and GDAT to the increase in mean NGR were about 0.09 kW and 0.03 kW, respectively. Previous studies (Soloviev et al., 2014; Soloviev et al., 2017; Donelan, 2018) did not address the DR effects on SST cooling inhibition (i.e., contribute to GDAT). However, this effect contributed about 25% of the increase in NGR, which could reduce the PDF of MPI in DRR by about 3.3%. This suggests that the impact of DR on TC-induced mixing makes a significant contribution to TC intensification.
3.3 The rapid intensification and ratio of achievement of a steady–state
This section examines the observed TC intensification rate in the DRR. Figure 4A shows the observed 12-hour TC intensification rate (solid black line and red shaded area) and the steady-state achievement rate (ρ steady-state; dashed blue line). This study defined TC with no intensity change for 18 hours as the steady-state achievement. The ρ steady-state was calculated excluding the case of the weakening stage and is defined as follows:
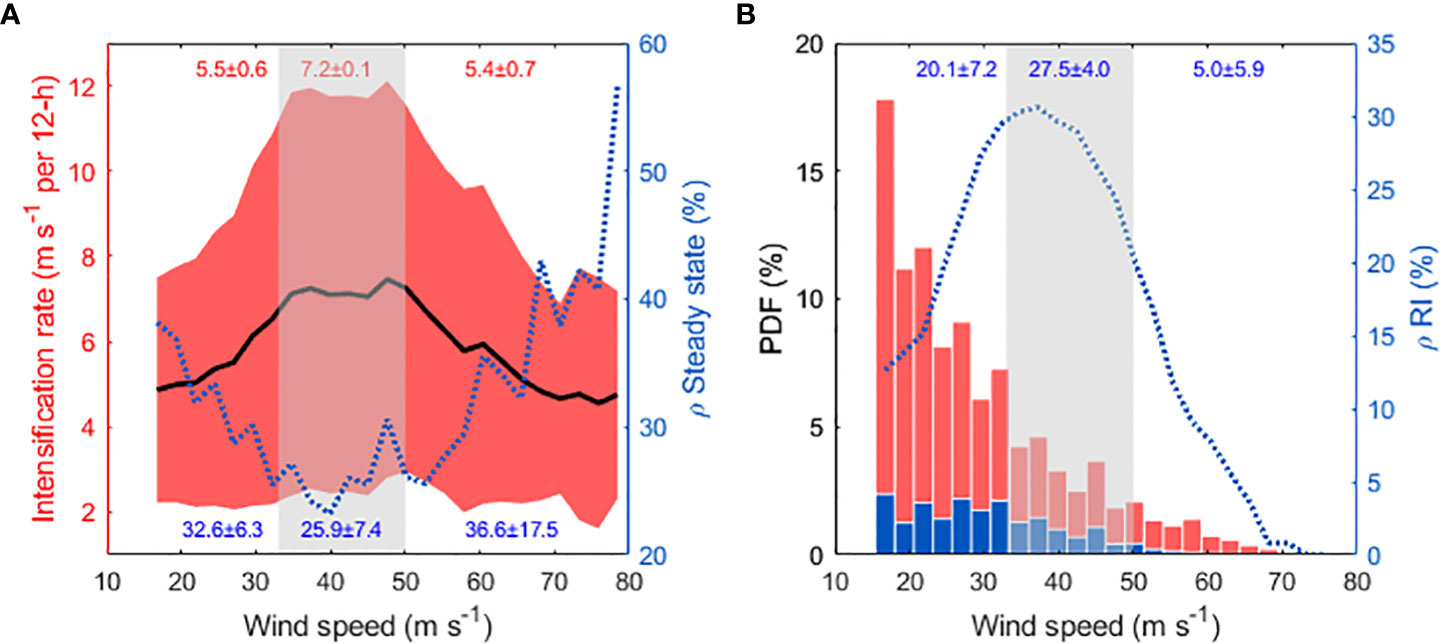
Figure 4 (A) The distribution of the mean intensification rate (solid black line; unit: m s−1 per 12-h) in intensification cases and the probability of the achievement of a steady-state (dotted blue line). The red shaded area shows the ±1σ interval of the intensification rate. The intensification rate and the achievement of a steady-state are smoothed with a window width of 5.1 m s−1. (B) The probability density function distribution of the intensified cases (red bars) over 24 hours and rapid intensification cases (blue bars). The blue dashed line indicates the probability of rapid intensification in the intensification cases. The gray shaded area indicates the reduced drag coefficient wind range. The mean values of each variable for each wind section are shown at the top or bottom of the figure.
The average intensification rate in the DRR was 7.2 ± 0.1 m s−1 per 12 hours and it was statistically significantly higher than the other ranges by approximately 1.8 m s−1 per 12 hours. RI, defined as the development of more than 15.4 m s−1 within 24 hours, also had a higher probability of occurrence in the DRR than in the other ranges (Figure 4B).
The increased NGR may lead to TC intensification, making it difficult for the TC to achieve a steady-state. The correlation coefficient for the TC intensification rate and steady-state probability was −0.78, which indicates statistical significance. Therefore, the low probability of steady-state in the DRR may lead to the local minima of LMI distribution and, consequently, the bimodality of the LMI distribution. The increase in the RI rate in the DRR may support the findings of previous studies (Lee et al., 2016; Soloviev et al., 2017) that most of the TCs of the second peak of LMI distribution (TCs passing through the DRR) experienced RI events.
4 Summary and discussion
The Cd is closely related to TC intensification because it is a critical factor in the sea surface cooling-related momentum flux and frictional dissipation. The parameterization of the Cd under high winds has previously been attempted and many recent studies suggest that the Cd will decrease with winds greater than 30–35 m s−1. These studies argue that the DR may trigger the RI of TCs, which might lead to the bimodality of the LMI. However, the explanations for this mechanism only focused on the frictional dissipation in the boundary layer. In this study, we analyzed the TC-induced vertical mixing and energy budget based on realistic wind-dependent Cd to investigate the DR effect on TC intensification and distribution of the LMI. We then estimated the PDF of the theoretical maximum intensity based on these results. Three DR fittings with different slopes at winds greater than 50 m s−1 were adopted to consider the uncertainty of the Cd in extreme winds, and the results were compared with those for the fixed Cd fittings at winds greater than 33 m s−1.
The decrease in Cd reduced frictional dissipation at the air-sea interface and reduced the momentum flux to the ocean. Due to this latter effect, the DAT of three DR experiments was approximately 0.9 ± 0.5°C greater than D04 at 50 m s−1. The increase in the NGR caused by the reduction in the Cd in the three DR experiments was ~0.12 kW at 50 m s−1. One-fourth of this increase was attributed to a decrease in the negative feedback caused by the weakening of sea surface cooling, with the remainder due to a reduction in frictional dissipation.
Consequently, this extra energy locally increased the intensification rate, making it difficult for the TC to achieve a steady-state. The observations showed that the TC intensification rate and the probability of RI in the DRR were statistically significantly higher than in other wind ranges. In contrast, the ratio of achievement of steady-state was lower. The intensification rate and steady-state achievement ratio showed a statistically significant negative correlation (r = −0.78). These results indicated that the low steady-state probability in the DRR may lead to the local minima of the distribution of LMI, resulting in bimodality (Figure 5).
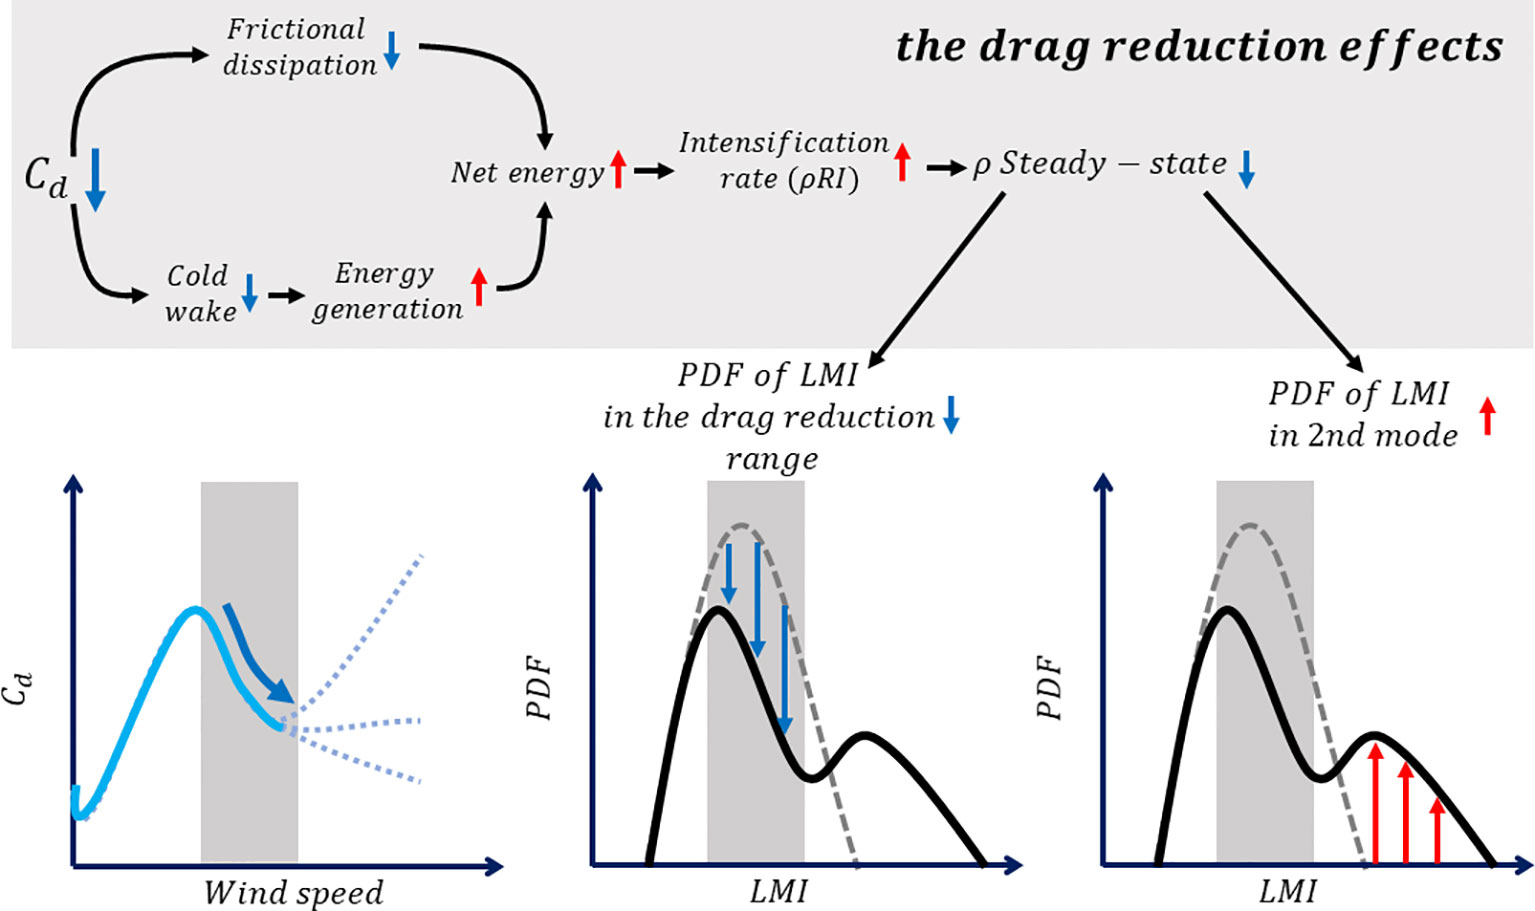
Figure 5 Process flow diagram of the drag reduction effects on the distribution of lifetime maximum intensity.
For a TC to intensify into the major storm (the second mode of PDF), it must pass through the DRR. This is possible if the TC gains more energy than is dissipated through the friction (35–50 m s−1; 0.10 kW−0.22 kW) of the DRR. Only TCs placed in a thermal environment above the top 70th percentile can intensify above 50 m s−1 (Figures 3D, E, F; see 70th percentile). The minimum thermal environment not trapped in DRR should be at least 4.4 Pa. The temperature distribution in the ocean with this value was 26.2 ± 0.6°C and the difference from the pre-storm SST was –1.9 ± 0.8°C.
In this study, the second mode of MPI PDF appeared in all DR experiments regardless of the Cd tendencies after 50 m s−1. This contradicts Soloviev’s assertion that the second mode of LMI results from Cd increasing after reaching its local minimum. Cd shows a relatively linear relationship with wind speed at extreme winds; however, frictional dissipation is proportional to the cube of the wind speed. Therefore, the friction dissipation in extreme winds is more governed by wind speed than by Cd. Friction dissipation in extreme winds increases rapidly with wind speed regardless of the change in Cd, leading to the weakening of TCs. Thus, Soloviev’s explanation that the TC weakening due to the increase in Cd at extreme wind speed is the leading cause of the second mode of LMI can be disputed.
Because of external forcing, most TCs cannot reach their MPI (Tang & Emanuel, 2010). Consequently, this study’s peak positions of the estimated PDF of MPI and observed LMI distribution were slightly different. However, the probability distribution of TC intensity expands based on the distribution of the MPI (Emanuel, 2003). The fact that the distribution of MPI reproduced in this study shows bimodality similar to that of observation suggests that the distribution of TC intensity might be primarily governed by the exchange of enthalpy and momentum at the air-ocean interface. It also indicates that it is effective to project the distribution of LMI using that of MPI.
The many RI cases before the Cd-reduced wind speed range suggest that many factors influence TC intensification in addition to the Cd reduction. The effects of large-scale environmental fields, such as the upper-level trough (Hanley et al., 2001) and vertical wind shear (Merrill, 1988; DeMaria, 1996; Zeng et al., 2007; Bai & Wang, 2016), and internal storm dynamics, such as the eyewall replacement cycle (Sitkowski et al., 2011; Kossin & DeMaria, 2016; Fischer et al., 2020), are also important in understanding the TC intensification process. These studies enable a better understanding of the role of the atmospheric side on TC intensification that, in turn, allow for more accurate TC intensity predictions. However, studies of TC-induced changes in the air-sea interface, such as sea spray generation (Andreas & Emanuel, 2001; Andreas, 2010; Andreas, 2011; Komori et al., 2018) and wave-induced mixing (Fan et al., 2009; Zhang & Oey, 2019), are still challenging due to the difficulty and lack of observation under the strong TC condition. Therefore, continuous observation at the air-sea interface in strong winds and more research are needed to improve the understanding of the RI process.
Data availability statement
TC data can be found on the IBTrACS website (https://www.ncei.noaa.gov/data/international-best-track-archive-for-climate-stewardship-ibtracs/v04r00/access/netcdf/), ECMWF ORA-S5 monthly data at https://www.ecmwf.int/en/forecasts/dataset/ocean-reanalysis-system-5, and ECMWF ERA5 monthly data at https://www.ecmwf.int/en/forecasts/datasets/reanalysis-datasets/era5.
Author contributions
Conceptualization, SHK. Methodology, SHK and H-WK. Validation, SKK., H-WK and I-JM. Formal analysis, SHK. Data curation, H-WK and P-SC. Writing—original draft preparation, SHK. Supervision, SKK and H-WK. All authors contributed to the article and approved the submitted version.
Funding
This research was a part of the project titled “Study on Northwestern Pacific warming and genesis and rapid intensification of typhoon”, funded by the Ministry of Oceans and Fisheries, Korea (20220566). This research was partly supported by Research Program funded by the Ministry of Education(2021R1A2C1005287) and the Korea government (MSIT) (No. RS-2022-00144325) through the National Research Foundation of Korea (NRF). This research was partly supported by KIOST in-house project (EA0011).
Acknowledgments
The authors wish to thank May Izumi of the School of Ocean and Earth Science and Technology, University of Hawaii for her editorial assistance.
Conflict of interest
The authors declare that the research was conducted in the absence of any commercial or financial relationships that could be construed as a potential conflict of interest.
Publisher’s note
All claims expressed in this article are solely those of the authors and do not necessarily represent those of their affiliated organizations, or those of the publisher, the editors and the reviewers. Any product that may be evaluated in this article, or claim that may be made by its manufacturer, is not guaranteed or endorsed by the publisher.
References
Andreas E. L. (2010). Spray-mediated enthalpy flux to the atmosphere and salt flux to the ocean in high winds. J. Phys. Oceanogr. 40, 608–619. doi: 10.1175/2009JPO4232.1
Andreas E. L. (2011). Fallacies of the enthalpy transfer coefficient over the ocean in high winds. J. Atmos. Sci. 68, 1435–1445. doi: 10.1175/2011JAS3714.1
Andreas E. L., Emanuel K. A. (2001). Effects of sea spray on tropical cyclone intensity. J. Atmos. Sci. 58, 3741–3751. doi: 10.1175/1520-0469(2001)058<3741:EOSSOT>2.0.CO;2
Bai L., Wang Y. (2016). Effects of vertical wind shear on tropical cyclone intensity change. Journal of Tropical Meteorology 22, 11–18. doi: 10.16555/j.1006-8775.2016.01.002
Balaguru K., Foltz G. R., Leung L. R., D’Asaro E., Emanuel K. A., Liu H., et al. (2015). Dynamic potential intensity: An improved representation of the ocean’s impact on tropical cyclones. Geophys. Res. Lett. 42, 6739–6746. doi: 10.1002/2015GL064822
Balaguru K., Foltz G. R., Leung L. R., Hagos S. M., Judi D. R. (2018). On the use of ocean dynamic temperature for hurricane intensity forecasting. Wea. Forecasting 33, 411–418. doi: 10.1175/WAF-D-17-0143.1
Bell M. M., Montgomery M. T., Emanuel K. A. (2012). Air-sea enthalpy and momentum exchange at major hurricane wind speeds observed during CBLAST. J. Atmos. Sci. 69, 3197–3222. doi: 10.1175/JAS-D-11-0276.1
Biswas M. K., Abarca S., Bernardet L., Ginis I., Grell E., Iacono M., et al. (2018) Hurricane weather research and forecasting (HWRF) model: 2018 scientific documentation. Available at: https://dtcenter.org/HurrWRF/users/docs/index.php.
Bye J. A. T., Jenkins A. D. (2006). Drag coefficient reduction at very high wind speeds. J. Geophys. Res. 111, C03024. doi: 10.1029/2005JC003114
DeMaria M. (1996). The effect of vertical shear on tropical cyclone intensity change. J. Atmos. Sci. 53, 2076–2087. doi: 10.1175/1520-0469(1996)053<2076:TEOVSO>2.0.CO;2
DeMaria M., Kaplan J. (1994). A statistical hurricane intensity prediction scheme (SHIPS) for the Atlantic basin. Wea. Forecasting 9, 209–220. doi: 10.1175/1520-0434(1994)009<0209:ASHIPS>2.0.CO;2
Donelan M. A. (2018). On the decrease of the oceanic drag coefficient in high winds. J. Geophys. Res.-Oceans 123, 1485–1501. doi: 10.1002/2017JC013394
Donelan M. A., Haus B. K., Reul N., Plant W. J., Stiassnie M., Graber H. C., et al. (2004). On the limiting aerodynamic roughness of the ocean in very strong winds. Geophys. Res. Lett. 31, L18306. doi: 10.1029/2004GL019460
Edson J. B., Jampana V., Weller R. A., Bigorre S. P., Plueddemann A. J., Fairall C. W., et al. (2013). On the exchange of momentum over the open ocean. J. Phys. Oceanogr. 43 (8), 1589–1610. doi: 10.1175/JPO-D-12-0173.1
Emanuel K. A. (1986). An air-sea interaction theory for tropical cyclones. part I: Steady state maintenance. J. Atmos. Sci. 43, 585–604. doi: 10.1175/1520-0469(1986)043<0585:AASITF>2.0.CO;2
Emanuel K. A. (1988). The maximum intensity of hurricanes. J. Atmos. Sci. 45, 1143–1155. doi: 10.1175/1520-0469(1988)045<1143:TMIOH>2.0.CO;2
Emanuel K. A. (1995). Sensitivity of tropical cyclones to surface exchange coefficients and a revised steady-state model incorporating eye dynamics. J. Atmos. Sci. 52, 3969–3976. doi: 10.1175/1520-0469(1995)052<3969:SOTCTS>2.0.CO;2
Emanuel K. A. (2003). A similarity hypothesis for air-sea exchange at extreme wind speeds. J. Atmos. Sci. 60, 1420–1428. doi: 10.1175/1520-0469(2003)060<1420:ASHFAE>2.0.CO;2
Fan Y., Ginis I., Hara T. (2009). The effect of wind-wave-current interaction on air-sea momentum fluxes and ocean response in tropical cyclones. J. Phys. Oceanogr. 39 (4), 1019–1034. doi: 10.1175/2008JPO4066.1
Fischer M. S., Rogers R. F., Reasor P. D. (2020). The rapid intensification and eyewall replacement cycles of Hurricane Irma, (2017). Mon. Weather Rev. 148(3) 981–1004. doi: 10.1175/MWR-D-19-0185.1
Gao S., Zhang W., Liu J., Lin I. I., Chiu L. S., Cao K. (2016). Improvements in typhoon intensity change classification by incorporating an ocean coupling potential intensity index into decision trees. Wea. Forecasting 31, 95–106. doi: 10.1175/WAF-D-15-0062.1
Golbraikh E., Shtemler Y. M. (2020). Momentum and heat transfer across the foam-covered air-sea interface in hurricanes. Ocean Dynamics 70, 683–692. doi: 10.1007/s10236-020-01360-w
Goni G., DeMaria M., Knaff J., Sampson C., Ginis I., Bringas F., et al. (2009). Applications of satellite-derived ocean measurements to tropical cyclone intensity forecasting. Oceanography 22 (3), 190–197. doi: 10.5670/oceanog.2009.78
Hanley D., Molinari J., Keyser D. (2001). A composite study of the interactions between tropical cyclones and upper-tropospheric troughs. Mon. Weather Rev. 129, 2570–2584. doi: 10.1175/1520-0493(2001)129<2570:acsoti>2.0.co;2
Holthuijsen L. H., Powell M. D., Pietrzak D. (2012). Wind and waves in extreme hurricanes. J. Geophys. Res. 117, C09003. doi: 10.1029/2012JC007983
Jarosz E., Mitchell D. A., Wang D. W., Teague W. J. (2007). Bottom-up determination of air-sea momentum exchange under a major tropical cyclone. Science 315, 1707–1709. doi: 10.1126/science.1136466
Kaplan J., DeMaria M., Knaff J. (2010). A revised tropical cyclone rapid intensification index for the Atlantic and eastern north pacific basins. Wea. Forecasting 25, 220–241. doi: 10.1175/2009WAF2222280.1
Kim S. H., Moon I. J., Chu P. S. (2018). Statistical-dynamic typhoon intensity predictions in the western north pacific using track pattern clustering and ocean coupling predictors. Wea. Forecasting 33, 347–365. doi: 10.1175/WAF-D-17-0082.1
Komori S., Iwano K., Takagaki N., Onishi R., Kurose R., Takahashi K., et al. (2018). Laboratory measurements of heat transfer and drag coefficients at extremely high wind speeds. J. Phys. Oceanogr. 48, 959–974. doi: 10.1175/JPO-D-17-0243.1
Kossin J. P., DeMaria M. (2016). Reducing operational hurricane intensity forecast errors during eyewall replacement cycles. Weather and Forecasting 2, 601–608. doi: 10.1175/WAF-D-15-0123.1
Kudryavtsev V. N., Makin V. K. (2011). Impact of ocean spray on the dynamics of the marine atmospheric boundary layer. Boundary-Layer Meteorol 140, 383–410. doi: 10.1007/s10546-011-9624-2
Landsea C. W., Vecchi G. A., Bengtsson L., Knutson T. R. (2010). Impact of duration thresholds on Atlantic tropical cyclone counts. J. Climate 23, 2508–2519. doi: 10.1175/2009JCLI3034.1
Large W., Pond S. (1981). Open ocean momentum flux measurements in moderate to strong winds. J. Phys. Oceanogr. 11 (3), 324–336. doi: 10.1175/1520-0485(1981)011<0324:OOMFMI>2.0.CO;2
Lee W. J., Kim S. H., Chu P. S., Moon I. J., Soloviev A. V. (2019). An index to better estimate tropical cyclone intensity change in the western north pacific. Geophys. Res. Lett. 46 (15), 8960–8968. doi: 10.1029/2019GL083273
Lee C. Y., Tippett M. K., Sobel A. H., Camargo S. J. (2016). Rapid intensification and the bimodal distribution of tropical cyclone intensity. Nat. Commun. 7, 10625. doi: 10.1038/ncomms10625
Lin I. I., Black P., Price J. F., Yang C. Y., Chen S. S., Lien C. C., et al. (2013). An ocean coupling potential intensity index for tropical cyclones. Geophys. Res. Lett. 40, 1878–1882. doi: 10.1002/grl.50091
Lin I. I., Wu C. C., Pun I. F., Ko D. S. (2008). Upper-ocean thermal structure and the Western north pacific category 5 typhoons. part I: Ocean features and the category 5 typhoons intensification. Mon. Weather Rev. 136, 3288–3306. doi: 10.1175/2008MWR2277.1
Merrill R. T. (1988). Environmental influences on hurricane intensification. J. Atmospheric Sci. 45, 1678–1687. doi: 10.1175/1520-0469(1988)045<1678:eiohi>2.0.co;2
Montgomery M. T., Smith R. K., Nguyen S. V. (2010). Sensitivity of tropical-cyclone models to the surface drag coefficient. Quart. J. R. Meteor. Soc 136 (653), 1945–1953. doi: 10.1002/qj.702
Ooyama K. (1969). Numerical simulation of the life cycle of tropical cyclones. J. Atmos. Sci. 26, 3–40. doi: 10.1175/1520-0469(1969)026<0003:NSOTLC>2.0.CO;2
Powell M. D., Vickery P. J., Reinhold T. A. (2003). Reduced drag coefficient for high wind speeds in tropical cyclones. Nature 422, 279–283. doi: 10.1038/nature01481
Price J. F. (1981). Upper ocean response to a hurricane. J. Phys. Oceanogr. 11, 153–175. doi: 10.1175/1520-0485(1981)011<0153:UORTAH>2.0.CO;2
Price J. F. (2009). Metrics of hurricane-ocean interaction: Vertically-integrated or vertically-averaged ocean temperature? Ocean Sci. 5, 351–368. doi: 10.5194/os-5-351-2009
Price J. F., Sanford T. B., Forristall G. Z. (1994). Forced stage response to a moving hurricane. J. Phys. Oceanogr. 24 (2), 233–260. doi: 10.1175/1520-0485(1994)024<0233:FSRTAM>2.0.CO;2
Pun I. F., Lin I. I., Wu C. R., Ko D. S., Liu W. T. (2007). Validation and application of altimetry-derived upper ocean thermal structure in the Western north pacific ocean for typhoon intensity forecast. IEEE Trans. Geosci. Remote Sens. 45 (6), 1616–1630. doi: 10.1109/TGRS.2007.895950
Rosenthal S. L. (1971). The response of a tropical cyclone model to variations in boundary-layer parameters, initial conditions, lateral boundary conditions, and domain size. Mon. Weather Rev. 99, 767–777. doi: 10.1175/1520-0493(1971)099<0767:TROATC>2.3.CO;2
Rotunno R., Emanuel K. A. (1987). An air-sea interaction theory for tropical cyclones. part II: Evolutionary study using a nonhydrostatic axisymmetric numerical model. J. Atmos. Sci. 44, 542–561. doi: 10.1175/1520-0469(1987)044<0542:AAITFT>2.0.CO;2
Shay L. K., Goni G. J., Black P. G. (2000). Effects of a warm oceanic feature on hurricane opal. Mon. Weather Rev. 128, 1366–1383. doi: 10.1175/1520-0493(2000)128<1366:EOAWOF>2.0.CO;2
Sitkowski M., Kossin J. P., Rozoff C. M. (2011). Intensity and structure changes during hurricane eyewall replacement cycles. Mon. Weather Rev. 139, 3829–3847. doi: 10.1175/mwr-d-11-00034.1
Soloviev A. V., Lukas R., Donelan M. A., Haus B. K., Ginis I. (2014). The air-sea interface and surface stress under tropical cyclones. Sci. Rep. 4, 5306. doi: 10.1038/srep05306
Soloviev A. V., Lukas R., Donelan M. A., Haus B. K., Ginis I. (2017). Is the state of the air-sea interface a factor in rapid intensification and rapid decline of tropical cyclones? J. Geophys. Res.-Oceans 12, 10174–10183. doi: 10.1002/2017JC013435
Takagaki N., Komori S., Suzuki N., Iwano K., Kuramoto T., Shimada S., et al. (2012). Strong correlation between the drag coefficient and the shape of the wind sea spectrum over a broad range of wind speeds. Geophys. Res. Lett. 39, L23604. doi: 10.1029/2012GL053988.
Tang B., Emanuel K. A. (2010). Midlevel ventilation’s constraint on tropical cyclone intensity. J. Atmos. Sci. 67, 1817–1830. doi: 10.1175/2010JAS3318.1
Villarini G., Vecchi G. A., Knutson T. R., Smith J. A. (2011). Is the recorded increase in short duration north Atlantic tropical storms spurious? J. Geophys. Res. 116, D10114. doi: 10.1029/2010JD015493
Wada A., Usui N. (2007). Importance of tropical cyclone heat potential for tropical cyclone intensity and intensification in the Western north pacific. J. Oceanogr. 63, 427–447. doi: 10.1007/s10872-007-0039-0
Walsh K. J. E., Sandery P., Brassington G. B., Entel M., Siegenthaler-LeDrian C., Kepert J. D., et al. (2010). Constraints on drag and exchange coefficients at extreme wind speeds. J. Geophys. Res. Oceans 115, C005876. doi: 10.1029/2009jc005876
Wang Y., Xu J. (2010). Energy production, frictional dissipation, and maximum intensity of a numerically simulated tropical cyclone. J. Atmos. Sci. 67, 97–116. doi: 10.1175/2009JAS3143.1
Wu J. (1982). Wind-stress coefficients over sea surface from breeze to hurricane. J. Geophys. Res. C87, 9704–9706. doi: 10.1029/JC087iC12p09704
Zeng Z., Wang Y., Wu C.-C. (2007). Environmental dynamical control of tropical cyclone intensity-an observational study. Mon. Weather Rev. 135, 38–59. doi: 10.1175/mwr3278.1
Zhang L., Oey L. (2019). Young ocean waves favor the rapid intensification of tropical cyclones–a global observational analysis. Mon. Weather Rev. 147 (1), 311–328. doi: 10.1175/MWR-D-18-0214.1
Keywords: rapid intensification of the tropical cyclone, the drag coefficient, the tropical cyclone-ocean interaction, the tropical cyclone lifetime maximum intensity, the tropical cyclone-induced vertical ocean mixing
Citation: Kim S-H, Kang H-W, Moon I-J, Kang SK and Chu P-S (2022) Effects of the reduced air-sea drag coefficient in high winds on the rapid intensification of tropical cyclones and bimodality of the lifetime maximum intensity. Front. Mar. Sci. 9:1032888. doi: 10.3389/fmars.2022.1032888
Received: 31 August 2022; Accepted: 14 October 2022;
Published: 28 October 2022.
Edited by:
Jinbao Song, Zhejiang University, ChinaReviewed by:
Zhongshui Zou, Sun Yat-sen University, ChinaYukiharu Hisaki, University of the Ryukyus, Japan
Copyright © 2022 Kim, Kang, Moon, Kang and Chu. This is an open-access article distributed under the terms of the Creative Commons Attribution License (CC BY). The use, distribution or reproduction in other forums is permitted, provided the original author(s) and the copyright owner(s) are credited and that the original publication in this journal is cited, in accordance with accepted academic practice. No use, distribution or reproduction is permitted which does not comply with these terms.
*Correspondence: Hyoun-Woo Kang, aHdrYW5nQGtpb3N0LmFjLmty