 Maria Bollinger
 Keir J. Macartney
 Erin E. Easton
- The University of Texas Rio Grande Valley, School of Earth, Environmental and Marine Sciences, Port Isabel, TX, United States
On the continental shelf off the coast of South Texas lie a series of natural hard-bottom structures (rocky outcrops and relic coral-algal reefs) known as the South Texas Banks (STB), which provide critical habitat for benthic organisms and pelagic fish. The depth of the banks, a persistent nepheloid layer, and strong currents have resulted in few studies that provide quantitative biodiversity data on the STB. Using a remotely operated vehicle (ROV), video surveys were conducted to quantitatively describe the mesophotic coral communities and assess habitat suitability of five STB: North Hospital, Hospital, Southern, Big Adam, and Mysterious Banks. Each of these STB have significantly different benthic communites, with coral communities composed primarily of antipatharians and octocorals. Big Adam Bank had the lowest biodiversity and the least coral cover. Mysterious Bank had abundant antipatharians, specifically Stichopathes spp., but low biodiversity overall. Hospital Bank had low coral diversity that was offset by high diversity in sponges and other invertebrate species. North Hospital and Southern Banks had abundant and diverse populations of coral species, including scleractinians, and other benthic invertebrates. These data indicate that the STB are crucial islands of biodiversity in an area with few suitable areas for coral reef species. In addition, predictive modelling of habitat suitability provided valuable estimates on the potential distribution of key benthic community members, such as scleractinians and antipatharians, throughout the entire areas of the five banks assessed.
Introduction
Scattered on the continental shelf off the South Texas coast, between the deltas of Brazos-Colorado and Rio Grande Rivers in the northwestern Gulf of Mexico (GOM), lies a series of natural hard-bottom structures that are remnants of coral-algal reefs that perished approximately 10,000 years ago (Rezak et al., 1985) (Figure 1). These hard-bottom structures, which now lie between the 60 and 80 m isobaths and have crest depths ranging from 58 to 70 m, are collectively known as the South Texas Banks (STB) (Rezak et al., 1985; Nash et al., 2013). These sites provide critical, benthic, hard-bottom habitat for a variety of organisms, such as antipatharians, octocorals, scleractinians and sponges. Unlike the surrounding seafloor, which is primarily soft mud, these structures and inhabitants provide complex habitat for many economically important fish species while potentially providing a refuge for threatened shallow-water scleractinian corals (Glynn, 1996; Bongaerts et al., 2010; Bongaerts et al., 2017; Laverick et al., 2018). However, the regional depth (50-150 m), a persistent nepheloid layer, and strong currents make direct observational surveys of the STB challenging, so very few in-depth quantitative studies on the banks benthic communities have been conducted (Rezak et al., 1985; Rezak et al., 1990; Rodriguez et al., 2018).
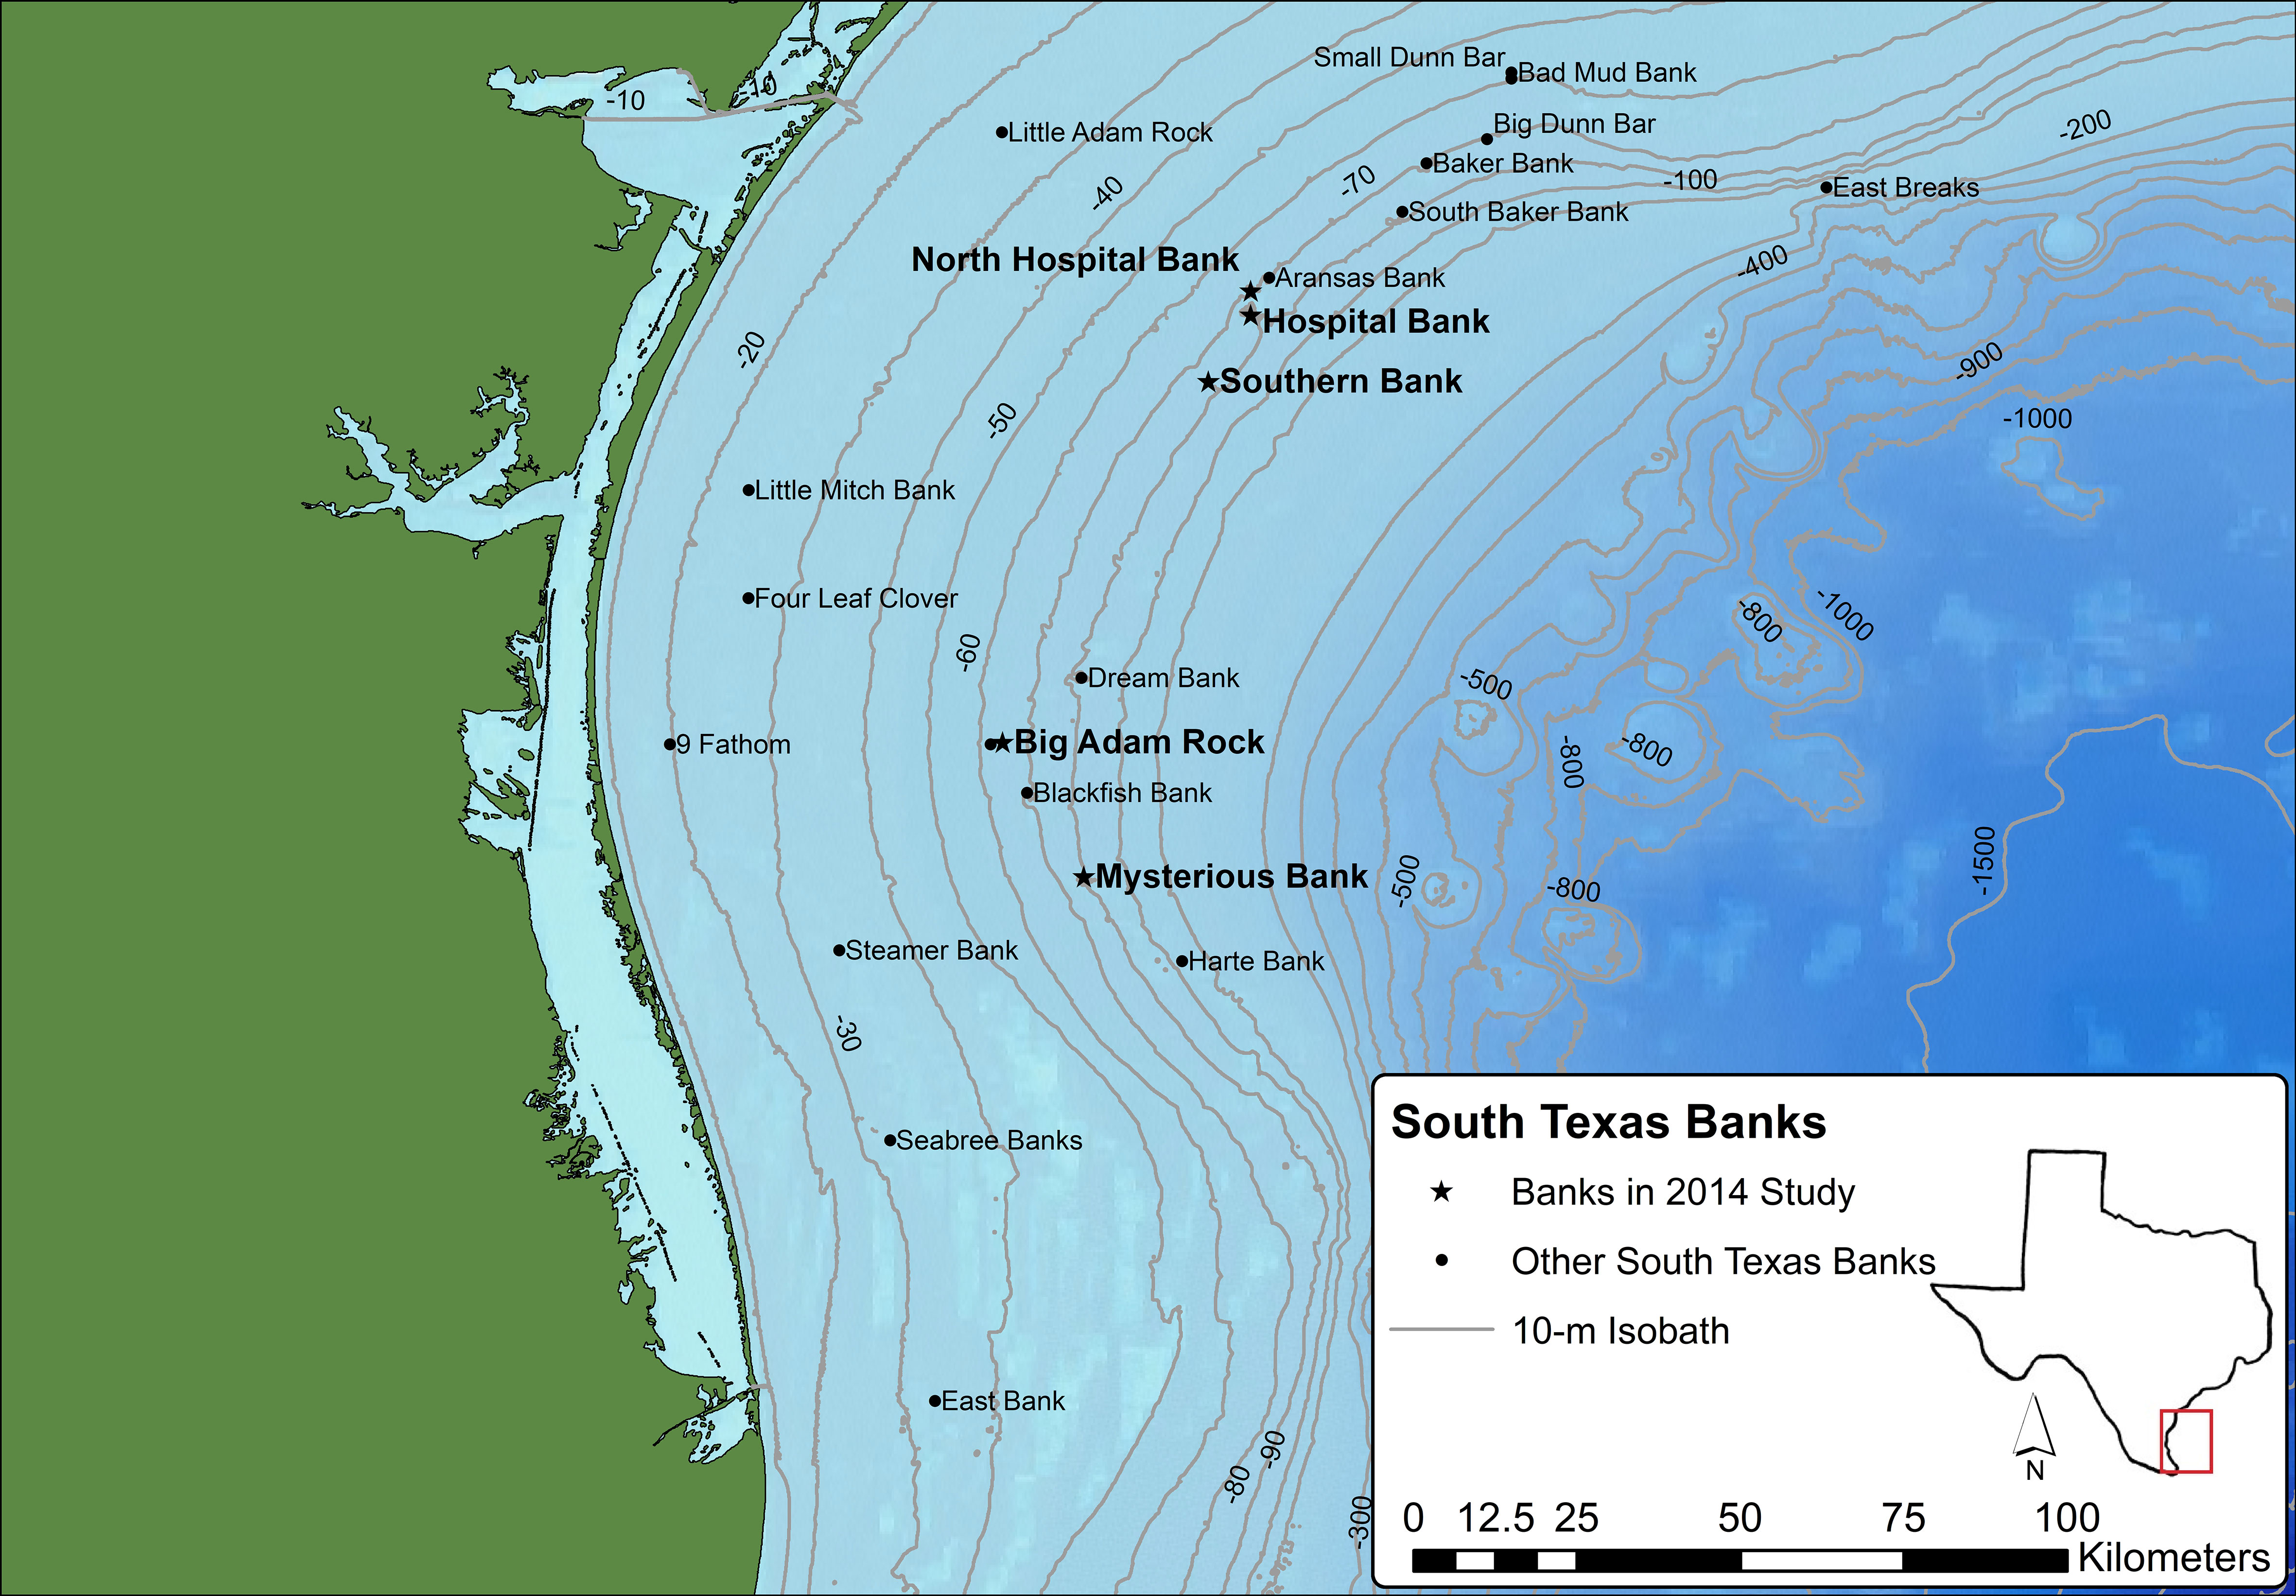
Figure 1 Locations of the South Texas Banks in relation to the coast of South Texas. The five banks studied for this research are denoted with stars. Basemap modified from data from Esri, Delorme, GEBCO, NOAA, NGDC, National Geographic, HERE, Geonames.org, and other contributors.
The South Texas Banks are considered mesophotic coral ecosystems (MCEs) primarily because of their depth (30-150 m) and the associated low light availability. MCEs can provide important habitat throughout the Caribbean and GOM for threatened hermatypic and ahermatypic corals (Silva & MacDonald, 2017; Etnoyer et al., 2018; Laverick et al., 2018; Lesser et al., 2018). Some of the STB may be able to act as a refuge for scleractinians in the GOM, such as Agaricia fragilis or Madracis brueggemani, which have been observed previously at the banks (Rezak et al., 1985; Rodriguez, 2015; Rodriguez et al., 2018). The STB also harbor large populations of antipatharians (black corals) and octocorals (Rezak et al., 1990; Nash et al., 2013; Rodriguez et al., 2018), which are ecologically important. For example, these organisms can act as complex habitat and food sources and, in the case of octocorals, by facilitating settlement of other benthic organisms on MCEs (Slattery and Lesser, 2021). The dense aggregations of these upright soft corals often are referred to as coral forests and support high levels of biodiversity (Nuttall et al., 2022).
However, corals can be highly susceptible because of their life-history characteristics to activities that cause disturbances to the benthos, such as trawling or hydrocarbon exploration (White et al., 2012; Clark et al., 2016; Etnoyer et al., 2016). These activities that cause expansion of the nepheloid layer, which has been observed at thicknesses greater than 35 m and can engulf lower relief STB. This can prevent hermatypic coral species that rely on photoautotrophic symbioses from persisting (Shideler, 1981; Rezak et al., 1985). For example, antipatharians and octocorals are typically long lived and slow growing (Roark et al., 2009; Wagner et al., 2012), resulting in slow recovery from disturbances. Since previous studies have shown these banks are ecologically productive sites and potential mesophotic refuges for scleractinians in the GOM such as Madracis brueggemanni and Agariciids (Rezak et al., 1985; Jordan, 2016; Rodriguez et al., 2018), further exploration of the remaining banks is required to assess total habitat available to these vulnerable coral taxa using both in-situ benthic surveys and habitat suitability modelling. Given the high degree of difficulty and effort in accessing and surveying MCEs, and in particular the STB (Loya et al., 2016; Rodriguez et al., 2018), the use of predictive habitat suitability models can be applied to large, unexplored areas revealing where species or groups of interest may exist. (Silva & MacDonald, 2017).
This study aims to investigate and quantitatively describe the mesophotic coral communities of five STB, allowing for robust comparison of habitat, and to produce habitat suitability models of coral communities for the studied banks. The target mesophotic bank, North Hospital (57 – 76 m depth), Hospital (57 – 87 m), Southern (59 – 92 m), Big Adam (60 – 69 m), and Mysterious Bank (70 – 83 m) (Figure 1), differ in vertical and topographical relief among banks, allowing for robust habitat suitability predictions. The habitat suitability models for antipatharians, octocorals, and scleractinians at each bank will produce the foundation for further investigation into these crucial mesophotic habitats, particularly in assessing presence and absence of scleractinian and black corals. There is relatively little known about the disturbance history on the STB but previous explorations of the banks have observed anthropogenic debris on the banks, particularly in the form of trawling or fishing gear (Hicks, personal observation). The results from this study also will provide baseline data (i.e., vulnerable species present in the area and species of economic interest) in the event of large-scale anthropogenic disturbances, such as oil spills from surrounding hydrocarbon exploration.
Methods
Data collection
This study incorporates geographic and geomorphic data collected aboard the Schmidt Ocean Institutes’ oceanographic R/V Falkor in September 2012 to locate and map several STB (Hicks et al., 2014). The R/V Falkor was equipped with a Kongsberg EM 710 multibeam echosounder and subsea acoustic positioning system that allowed researchers to create bathymetric maps of the relic coral-algal reefs (Schmidt Ocean Institute, 2012). Raw multibeam data was cleaned using EIVA Navimodel® (v4, EIVA, Skanderborg, Denmark) and converted into ASCII grid files for use in ArcGIS® (v10.3, Esri Corp, Redlands, CA, USA) to create a 2 m resolution bathymetric raster for each bank. The overall sizes and morphologies of individual banks were variable, and descriptions of each bank can be found in the supplemental documents (see Figure S1 and Table S1).
Exploratory video footage of the ocean floor was collected using a remotely operated vehicle (ROV) (Triggerfish T4H, Deep Ocean Engineering, San Jose, FL, USA) operated from the M/V Fling in September 2014. Prior to each dive, georeferenced multibeam maps were imported into SeaNet Pro navigation software (Tritech, Katy, TX, USA), and waypoints were chosen to plan the exploratory transect route for that bank. Transects were typically between 100-300 m depending on conditions at the bank (1-2 transects per bank). Live video from the forward navigation camera (380K pixel navigation camera, Deep Ocean Engineering, San Jose, FL, USA) was overlaid with depth, time, date, and a compass heading to provide a reference for surveys of the benthos. Downward-facing benthic community videos for analysis were taken in 1080p at 30fps (wide field of view) with a GoPro® Hero Black 3+ camera in a deep-water housing (iPix, I-Torch, London, Ontario, Canada) mounted on the bottom of the ROV’s frame with two 850 lumen LED lights (Deep Ocean Engineering, San Jose, FL, USA) facing downwards adjacent to the camera. Two lasers (SeaLaser 100, Subsea Technologies, Houston, TX, USA), 10 cm apart, were mounted within the field of view of the camera to scale benthic images. The banks’ topographies are typically flat bottom, interceded with vertical ridges rising to the next “platform,” so parallax effects on percentage cover estimates were not a concern for the bottom-mounted camera in this study (Lesser & Slattery, 2021).
Data processing
Video from the benthic camera was corrected for distortion using Adobe Premiere Pro’s (CC6, Adobe Inc. San Jose, CA, USA) default GoPro® Hero Black 3+ lens distortion tool and edited to eliminate blurry and unusable frames. The edited videos were divided into two-minute segments and five frames were selected at random from each segment until up to 50 suitable frames from each bank were collected (Mysterious n = 35, Hospital n = 25, all other banks n = 50, Figure S1)). Only frames where the lasers were limited to approximately 10% of the screen were chosen for further analysis to allow for the majority of mega-invertebrates to be identified while providing the largest field of view. Images were approximately 1 m2 and the 10 cm lasers were used to ensure the distance of the camera from the seafloor (0.5 – 1 m) was relatively uniform throughout the images.
To calculate percentage cover of benthic groups and corals, a grid with 100 crosshairs was overlaid onto each image and the subject under each crosshair was identified. Benthic organisms observed in the videos were identified to the lowest possible taxon based on morphological characteristics from video surveys and opportunistically collected specimens. In addition to percentage cover, all individual organisms and colonies were counted within each frame. Percentage cover and density counts were weighted according to each photo’s specific area which was measured using the 10 cm lasers. Metadata from the benthic videos were used to determine the time that each of the frames was taken. This time was matched with data from the Tritech MicroNav USBL acoustic tracking system to reveal ROV position within 0.2 m.
Statistical analysis
Shannon diversity index and Pielou’s evenness were calculated on species abundance data and, after samples with only one species were removed, averaged for each bank. Shannon diversity index was calculated using a natural logarithm base. One-way analysis of variance (ANOVA) was used to assess differences in target group mean percentage cover between the surveyed banks. Shapiro-Wilkes tests were used to test if the data fit a normal distribution. Any data that did not meet assumptions of normality were arcsin-square root transformed. Post hoc multiple comparisons were made using Tukey-Kramer HSD tests. For multivariate analyses, summed by bank percentage cover data were standardized and square-root transformed to down weight groupings with high abundances prior to statistical analyses. To compare the communities at the five banks, square-root transformed and standardized species’ abundance data in a Bray Curtis similarity matrix were used in an ANOSIM test and a metric multidimensional scaling (MDS) ordination with 95% bootstrap regions was generated from 150 bootstrap averages for each bank. The species that characterized each bank were identified using SIMPER analysis. The analyses were conducted using PRIMER (version 7) statistical package (Clarke & Gorley, 2015) or JMP (version 15).
Spatial analysis for predictive habitat modelling
Bathymetric data were imported into the Benthic Terrain Modeler (BTM) tool for ESRI ArcGIS® to create surfaces representing the slope, terrain ruggedness (using vector ruggedness measure [VRM]), curvature, and aspect (Wright et al., 2012) (Figure S1). All terrain ruggedness values were calculated using a 3×3 neighborhood size. BTM was also used to interpret multibeam mapping data into crests, flats, and depressions using calculated bathymetric position indexes (BPI). Broad- and fine-scale BPI were calculated using values representing the average size of bank components and features (Tables S1, S2). These predictor surfaces were standardized for geographic extent, spatial resolution (2 m), and coordinate system, and saved in ASCII format. The sizes of each of the background surfaces were chosen to ensure that the entirety of each bank was contained and that an excessive amount of area outside of the bank was not included. Bathymetric descriptions of each bank can be found in the supplemental material. Raw Bathymetric data was deposited in the Rolling Deck to Repository (DOI: https://doi.org/10.7284/118860)
Species distribution modeling
The distributions of antipatharians, octocorals, and scleractinians across the five STB were predicted using maximum entropy calculated through MaxEnt (v3.3.3k, Princeton, NJ, USA, Phillips et al., 2006). This software explores the relationship between species presence locations and environmental covariates to create a habitat suitability model across a landscape. Despite depending on only species presence data, under the assumption that the data represents a random sample of space (Merow et al., 2013), MaxEnt has consistently outperformed other models in tests for accuracy and it produces realistic suitability models with as low as five samples (Hernandez et al., 2006; Tittensor et al., 2009). The distribution of species is predicted by MaxEnt by assuming that there is equal probability on a landscape that the species will inhabit that cell (null hypothesis) and then by narrowing the habitat down to areas that fit within the constraints of the added environmental variables (Elith et al., 2011).
The MaxEnt Java software package was used in this study to model the probability that each of the following groups occur on the five STB (if enough samples were observed on the banks for MaxEnt modelling): (1) Stichopathes spp., (2) antipatharians (omitting Stichopathes spp.), (3) octocorals, and (4) scleractinians (Table 1). Stichopathes were found at densities much higher than other antipatharian conspecifics and thus were analyzed in a separate model. The other target categories (antipatharians, octocorals and scleractinians) were combined by order because of low sample sizes and similar densities. The sprawling growth form of Madracis brueggemani made it unfeasible to count individuals resulting in its omission from the abundance counts (Table 1). The suitability of the models was calculated by using the value of the area under the curve (AUC) in MaxEnt; an AUC value of 0.5 is considered no better than random. Seven environmental variables were used for all models: slope, curvature, terrain ruggedness, aspect, broad-scale BPI, fine-scale BPI, and depth. Each model ran until it reached a maximum of 1000 iterations or until the convergence threshold of log loss fell below the default setting of 0.00001 [Smaller log loss values correspond to better prediction of presence (Phillips and Dudnik, 2008)]. The regularization multiplier was kept at the default value of 1.Predictions were tested using 10-fold cross validation with random seeding (unless otherwise noted in the results). A jackknife test was used to determine the influence each variable had on the model. Suitable habitat categories (based on km2 of habitat area) were defined as follows: extremely low suitability (0–0.2), low suitability (0.2–0.4), moderate suitability (0.4–0.6), and high suitability (0.6–1) (sensu Kaymo & Asanok, 2020).
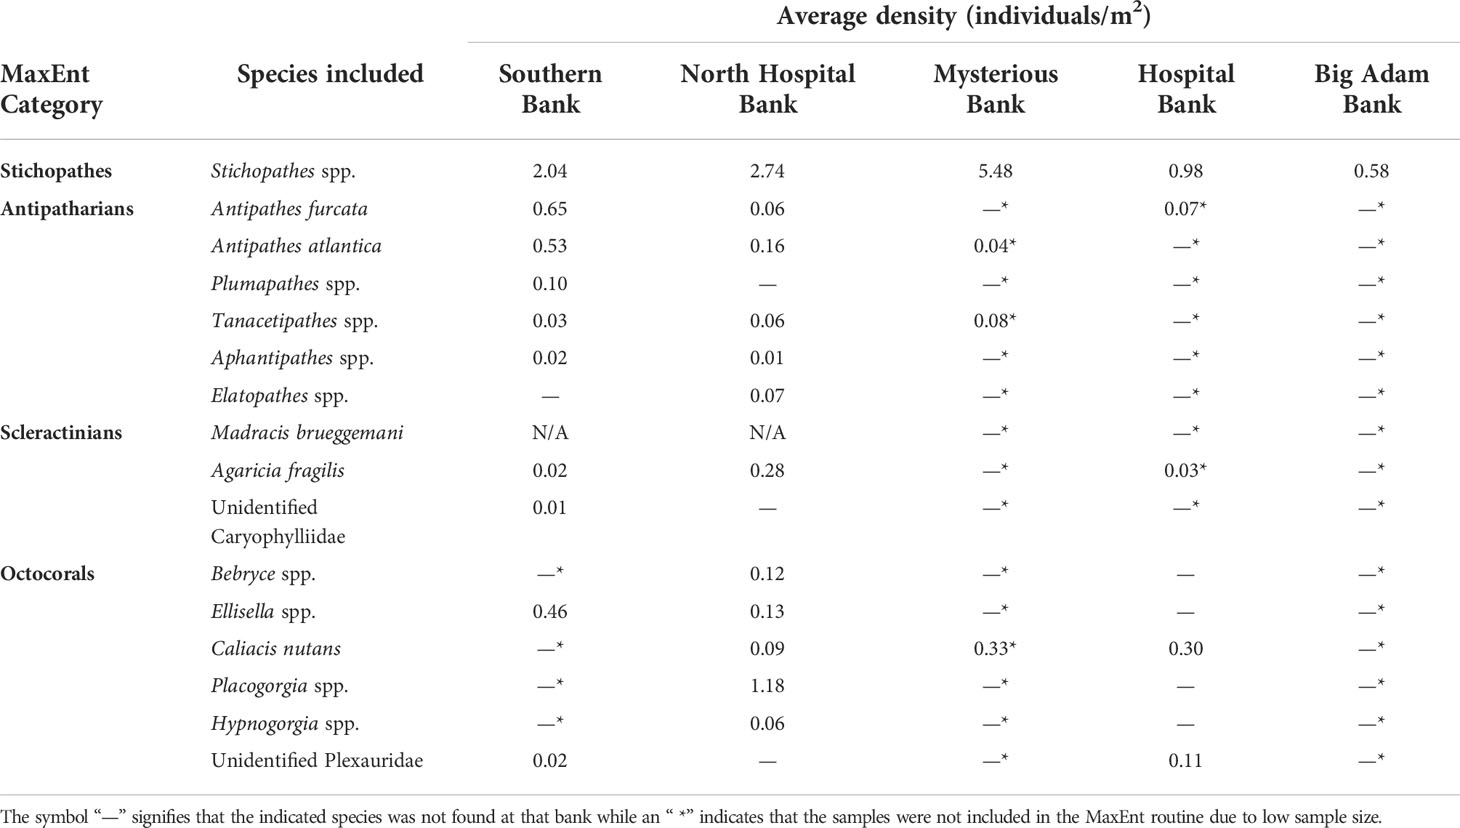
Table 1 Average densities of corals by bank. These categories were entered into MaxEnt to create habitat suitability models for each bank.
Results
Benthic cover and biodiversity of the banks
There were significant differences in both Shannon Diversity (ANOVA: F3,17 = 4.99, P = 0.014) and species evenness (ANOVA: F3,17 = 4.99, P = 0.014) among the banks (Table S4). For Shannon Diversity, Southern Bank had the highest mean value (1.51 ± 0.49 SE) followed by North Hospital Bank (1.14 ± 0.36 SE), Hospital Bank (0.58 ± 0.58 SE), Mysterious Bank (0.27 ± 0.32 SE), and Big Adam Bank (0.13 ± 0.48 SE) (Tukey’s HSD: P<0.05). Southern and North Hospital Banks had higher mean species evenness (0.67 ± 0.17 SE and 0.63 ± 0.12 SE respectively) compared to Hospital (0.58 ± 0.58 SE), Mysterious (0.27 ± 0.32 SE) and Big Adams Banks (0.13 ± 0.48 SE) (Tukey’s HSD: P<0.05).
Abiotic cover was high at all the surveyed banks with an average cover of 79.56% ( ± 1.67 SE) throughout the banks. Among banks there were significant differences in abiotic cover (ANOVA: F4, 205 = 79.02, P = <0.001). Fine sediment was >90% of total benthic cover at Big Adam, Mysterious and Hospital Banks (Figure 2, Figure S2). While significantly lower (Tukey’s HSD: P<0.05) than the three other banks, North Hospital and Southern Banks had more than half of their total benthic cover classified as abiotic as well (60.2% and 55.1%, respectively), typically being rubble or sand (Figure S2). Algal cover was also relatively high compared to other benthic groups throughout the banks studied, covering an average of 12.76% ( ± 1.23 SE) in the surveyed banks. Significant differences in algal cover were observed between the banks (ANOVA: F4, 205 = 45.07, P = <0.001) with higher mean algal cover at North Hospital and Southern Banks compared to the three other banks (Tukey’s HSD: P<0.05) (Figure 2A, Table 2). While image resolution made identification of macroalgal species difficult, the majority of macroalgal cover appeared to be from representatives of the family Anadyomenaceae or genus Lobophora but members of the genus Dictyota and Halimeda were also observed. Crustose coralline algae was also observed on Southern, North Hospital and Hospital banks.
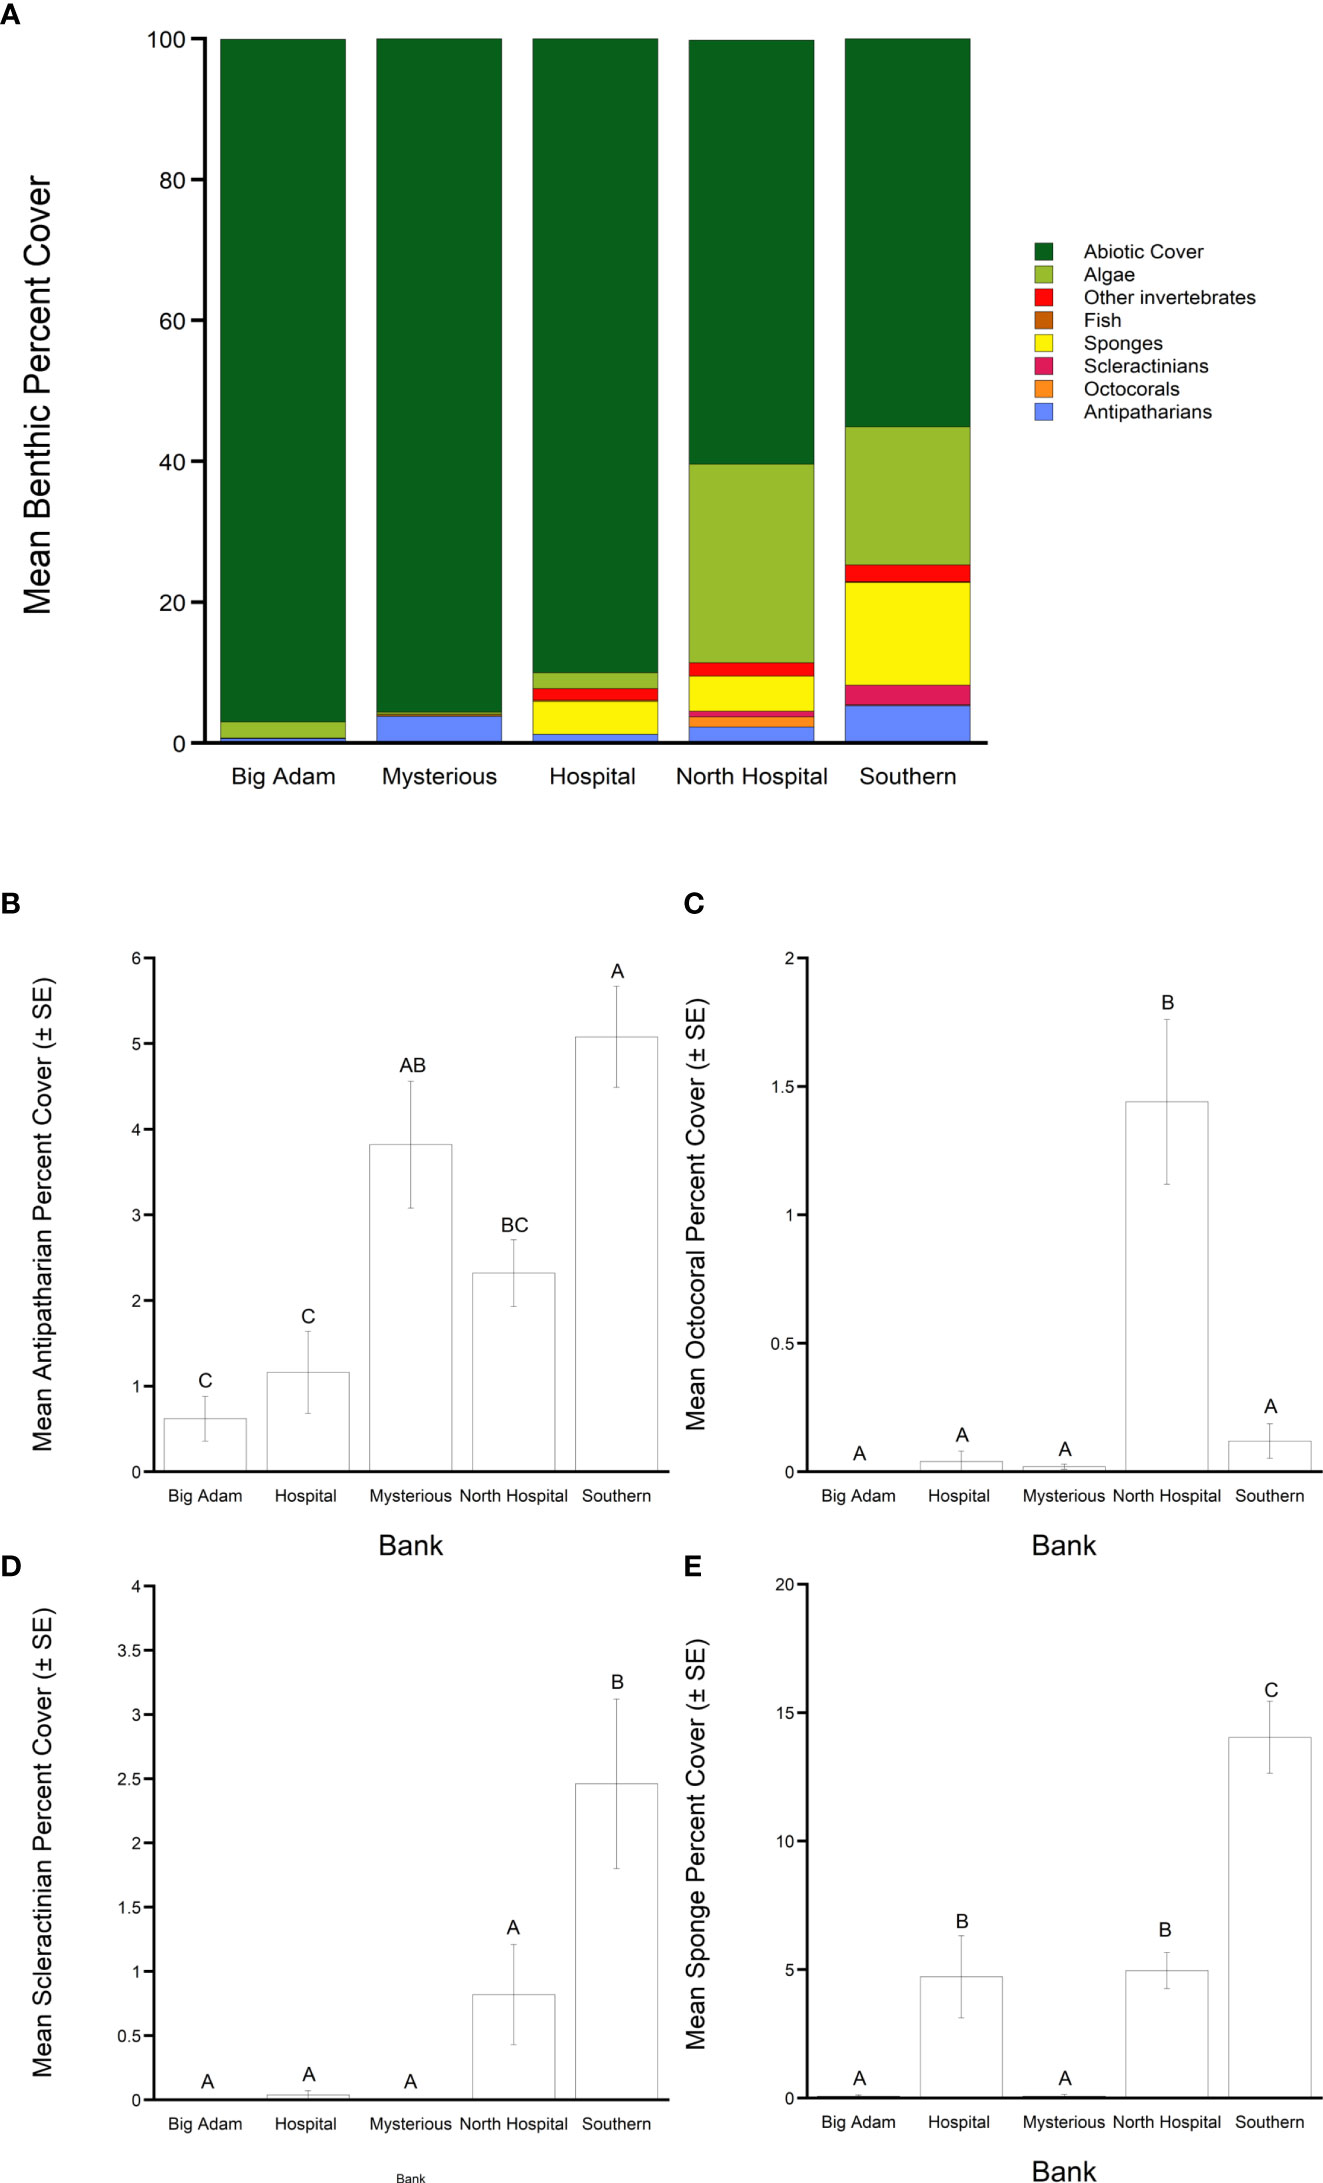
Figure 2 (A) Mean total percent cover of benthic groups from the five South Texas Banks surveyed. Subpanels show mean percent cover (± SE) of (B) antipatharians, (C) octocorals, (D) scleractinians, and (E) sponges. Levels not connected by the same letter are significantly different (Tukey’s HSD = >0.05).
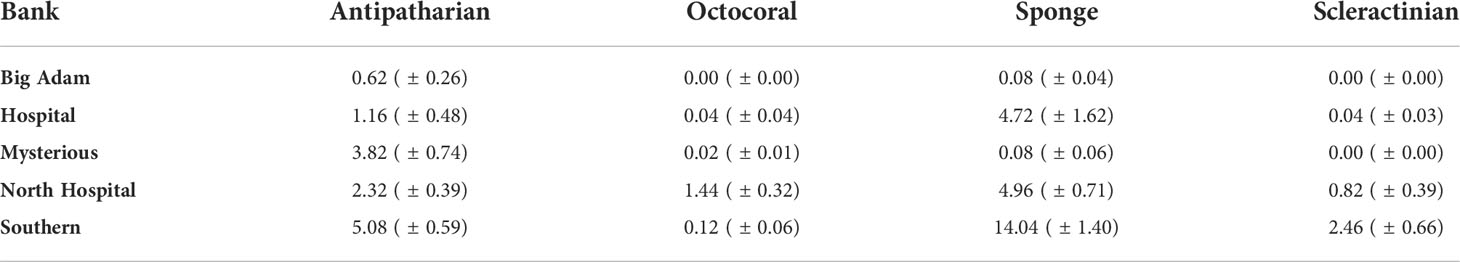
Table 2 Mean total percent cover (± SE) of target benthic groups found at the surveyed South Texas Banks.
Each of the five STB were found to host populations of at least one target coral group (antipatharians, octocorallians, and scleractinians) and a high cover of sponges and algae compared to the target groups (Figure 2A). Collectively at the surveyed banks, antipatharians were the most abundant target species with overall cover of 2.68% ( ± 0.25 SE). Seven species or species groups were observed on the banks: Stichopathes spp., Antipathes furcata, Antipathes atlantica, Plumapathes spp., Tanacetipathes spp., Aphantipathes spp., and Elatopathes spp. Of those groups, the Stichopathes spp. were the most abundant group at all the banks (Table 1). There were significant differences between the studied banks in antipatharian benthic cover (ANOVA: F4, 205 = 14.12, P = <0.001). Southern Bank had the highest mean antipatharian cover (5.08%), Mysterious and North Hospital Banks had intermediate mean cover (3.82% and 2.32% respectively), and Hospital and Big Adam Banks had the lowest mean cover of antipatharians (1.16% and 0.62% respectively) (Tukey’s HSD: P<0.05) (Figure 2B).
Octocorals had an average total cover of 0.41% ( ± 0.08 SE) collectively among all banks. Five species or species groups were observed at the banks; Bebryce spp., Ellisella spp., Caliacis nutans (Deichmann, 1936), Placogorgia spp., and Hypnogorgia spp. Significant differences in octocoral percentage cover were observed between the surveyed banks (ANOVA: F4, 205 = 13.01, P = <0.001). Southern Bank had the highest mean octocoral cover (1.44%) compared to all other banks (0-0.12%) (Tukey’s HSD: P<0.05) (Figure 2C). Scleractinians had the second highest mean total cover collectively at the surveyed banks at 0.76% ( ± 0.19 SE) (Figure 2D, Table 2) and three species were found at the banks: M. brueggemani, A. fragilis, and an unidentified Caryophylliidae species. Among banks there were significant differences in scleractinian cover (ANOVA: F4, 205 = 7.89, P = <0.001). There were significantly more scleractinians observed at Southern Bank (2.46%) than all other surveyed banks (0-0.82%) in this study (Tukey’s HSD: P<0.05) (Figure 2D, Table 2). Of the non-target benthic fauna, sponges represented a large component of cover at 5.11% ( ± 0.54 SE) throughout the surveyed banks. Dense aggregations of Aplysinidae, Irsinidae, and Plakinidae were observed along with a variety of morphologies, such as tube, vase, and encrusting sponges. There were significant differences in sponge cover among the banks (ANOVA: F4, 205 = 39.9, P = <0.001). Southern Bank had the highest mean sponge cover (14.04%), North Hospital and Hospital Banks had intermediate mean cover (4.96% and 4.72% respectively), and Mysterious and Big Adam Banks had the lowest mean sponge cover (0.08% at both sites) (Tukey’s HSD: P<0.05) (Figure 2E, Table 2).
At a community level, the five banks had significantly different benthic biotic structure (Figure 3, Table S3, ANOSIM: Global R = 0.550, p = 0.001). The largest differences in benthic communities were found between North Hospital and Mysterious Banks (ANOSIM: R = 0.754, p = 0.001) and Southern and Mysterious Banks (ANOSIM: R = 0.701, p = 0.001). Big Adam Bank and Mysterious Bank contained the most similar mesophotic benthic communities amongst the studied banks, but there were still significant differences observed between all banks as shown in the previous analyses (ANOSIM: R = 0.314, p = 0.002). These differences among benthic biotic communities were driven primarily by the higher abundance of Stichopathes spp. at Mysterious Bank (3.4% overall coverage vs. 0.6% at Big Adam Bank) and higher coverage of foliose algae species at Big Adam Bank (2.3%) than Mysterious Bank (0.3%).
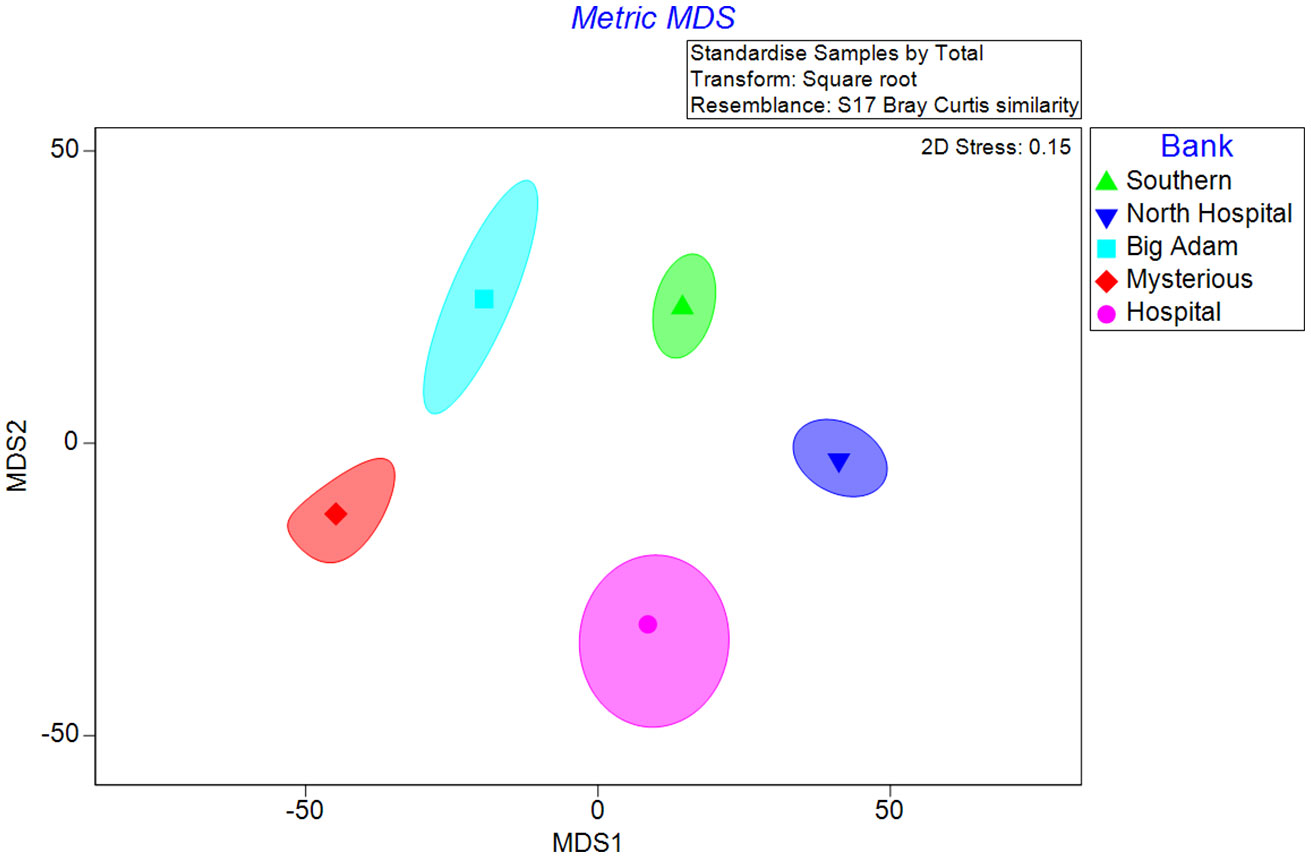
Figure 3 Two-dimensional metric MDS plot comparing percent cover of mesophotic benthic communities on five South Texas Banks. Points represent the group averages of the square root transformed samples. The contours represent nominal 95% bootstrap regions generated from 150 bootstrap averages for each Bank.
Habitat suitability models
Ten models delineating potential species presence were created using MaxEnt (Table 3): Stichopathes spp. at all five banks, antipatharians at North Hospital and Southern banks, octocorals at Hospital and North Hospital banks, and scleractinians at North Hospital and Southern banks. Each of the models had an AUC value greater than 0.9, which indicates a high-quality model (Table 3). Overall, the mesophotic coral distribution was influenced the most by depth and broad-scale BPI of each bank. The crest depth of each bank in this study showed the highest probabilities of mesophotic coral presence, regardless of taxon. At Big Adam and Mysterious Banks, where relief is low (Table S1, 9.5 m and 13.1 m, respectively), the broad-scale BPI (e.g., the shape of the crest) was the largest contributor to the predicted presence of Stichopathes spp. In models applied to the higher relief banks, depth contributed most to the models (Table 3, contribution: 60.2-95.5%).
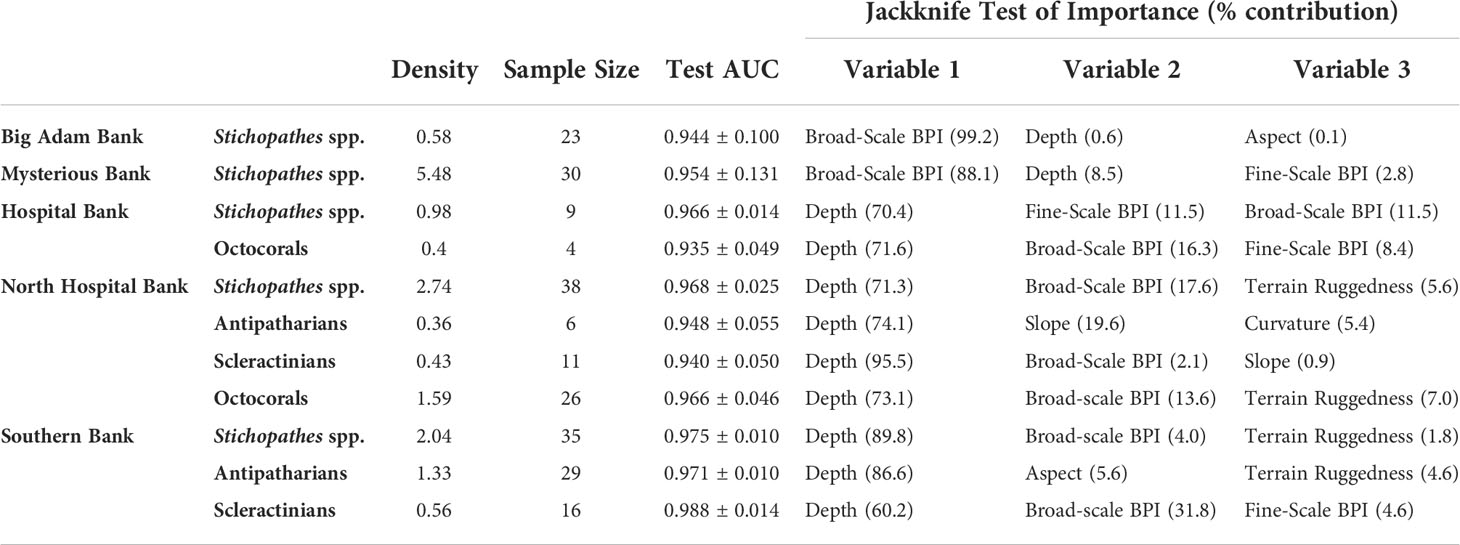
Table 3 MaxEnt data with parameters and variables with most importance on coral habitat suitability predictions.
At Big Adam Bank, only Stichopathes spp. were found with enough frequency (Table 1) to be able to create a habitat suitability model, which predicted that the whip coral would most likely be found at the highest crests of the mound (Figure 4A), with 0.02 km2 (4% of total area) having a high probability of presence (> 0.6; Table 4). Similarly, at Mysterious Bank, a habitat suitability model was only created for Stichopathes spp. The resulting model showed increased probability of presence at the crests of each component of the bank. There was 0.09 km2 (2.5% of total area) of reef that had a high probability of presence (Table 4) and the shallower crests typically showed maximum probability (100%, Figure 4B). At Hospital Bank, the probability of presence of Stichopathes spp. across the bank increased on the shallowest ridges of the bank, with higher presence at the crest. A total of 0.26 km2 (11% of total area) was found to have a high probability of presence (Figure 4C). At North Hospital Bank Stichopathes spp. presence was predicted at the highest points of North Hospital Bank (Figure 4D) and only 0.06 km2 (4% of total area) was found to have high probability of presence (Table 4). At Southern Bank the highest probability of Stichopathes spp. presence was found at the crest (Figure 4E); 0.05 km2 (5% of total area) was found to hold a high probability of presence (Table 4)
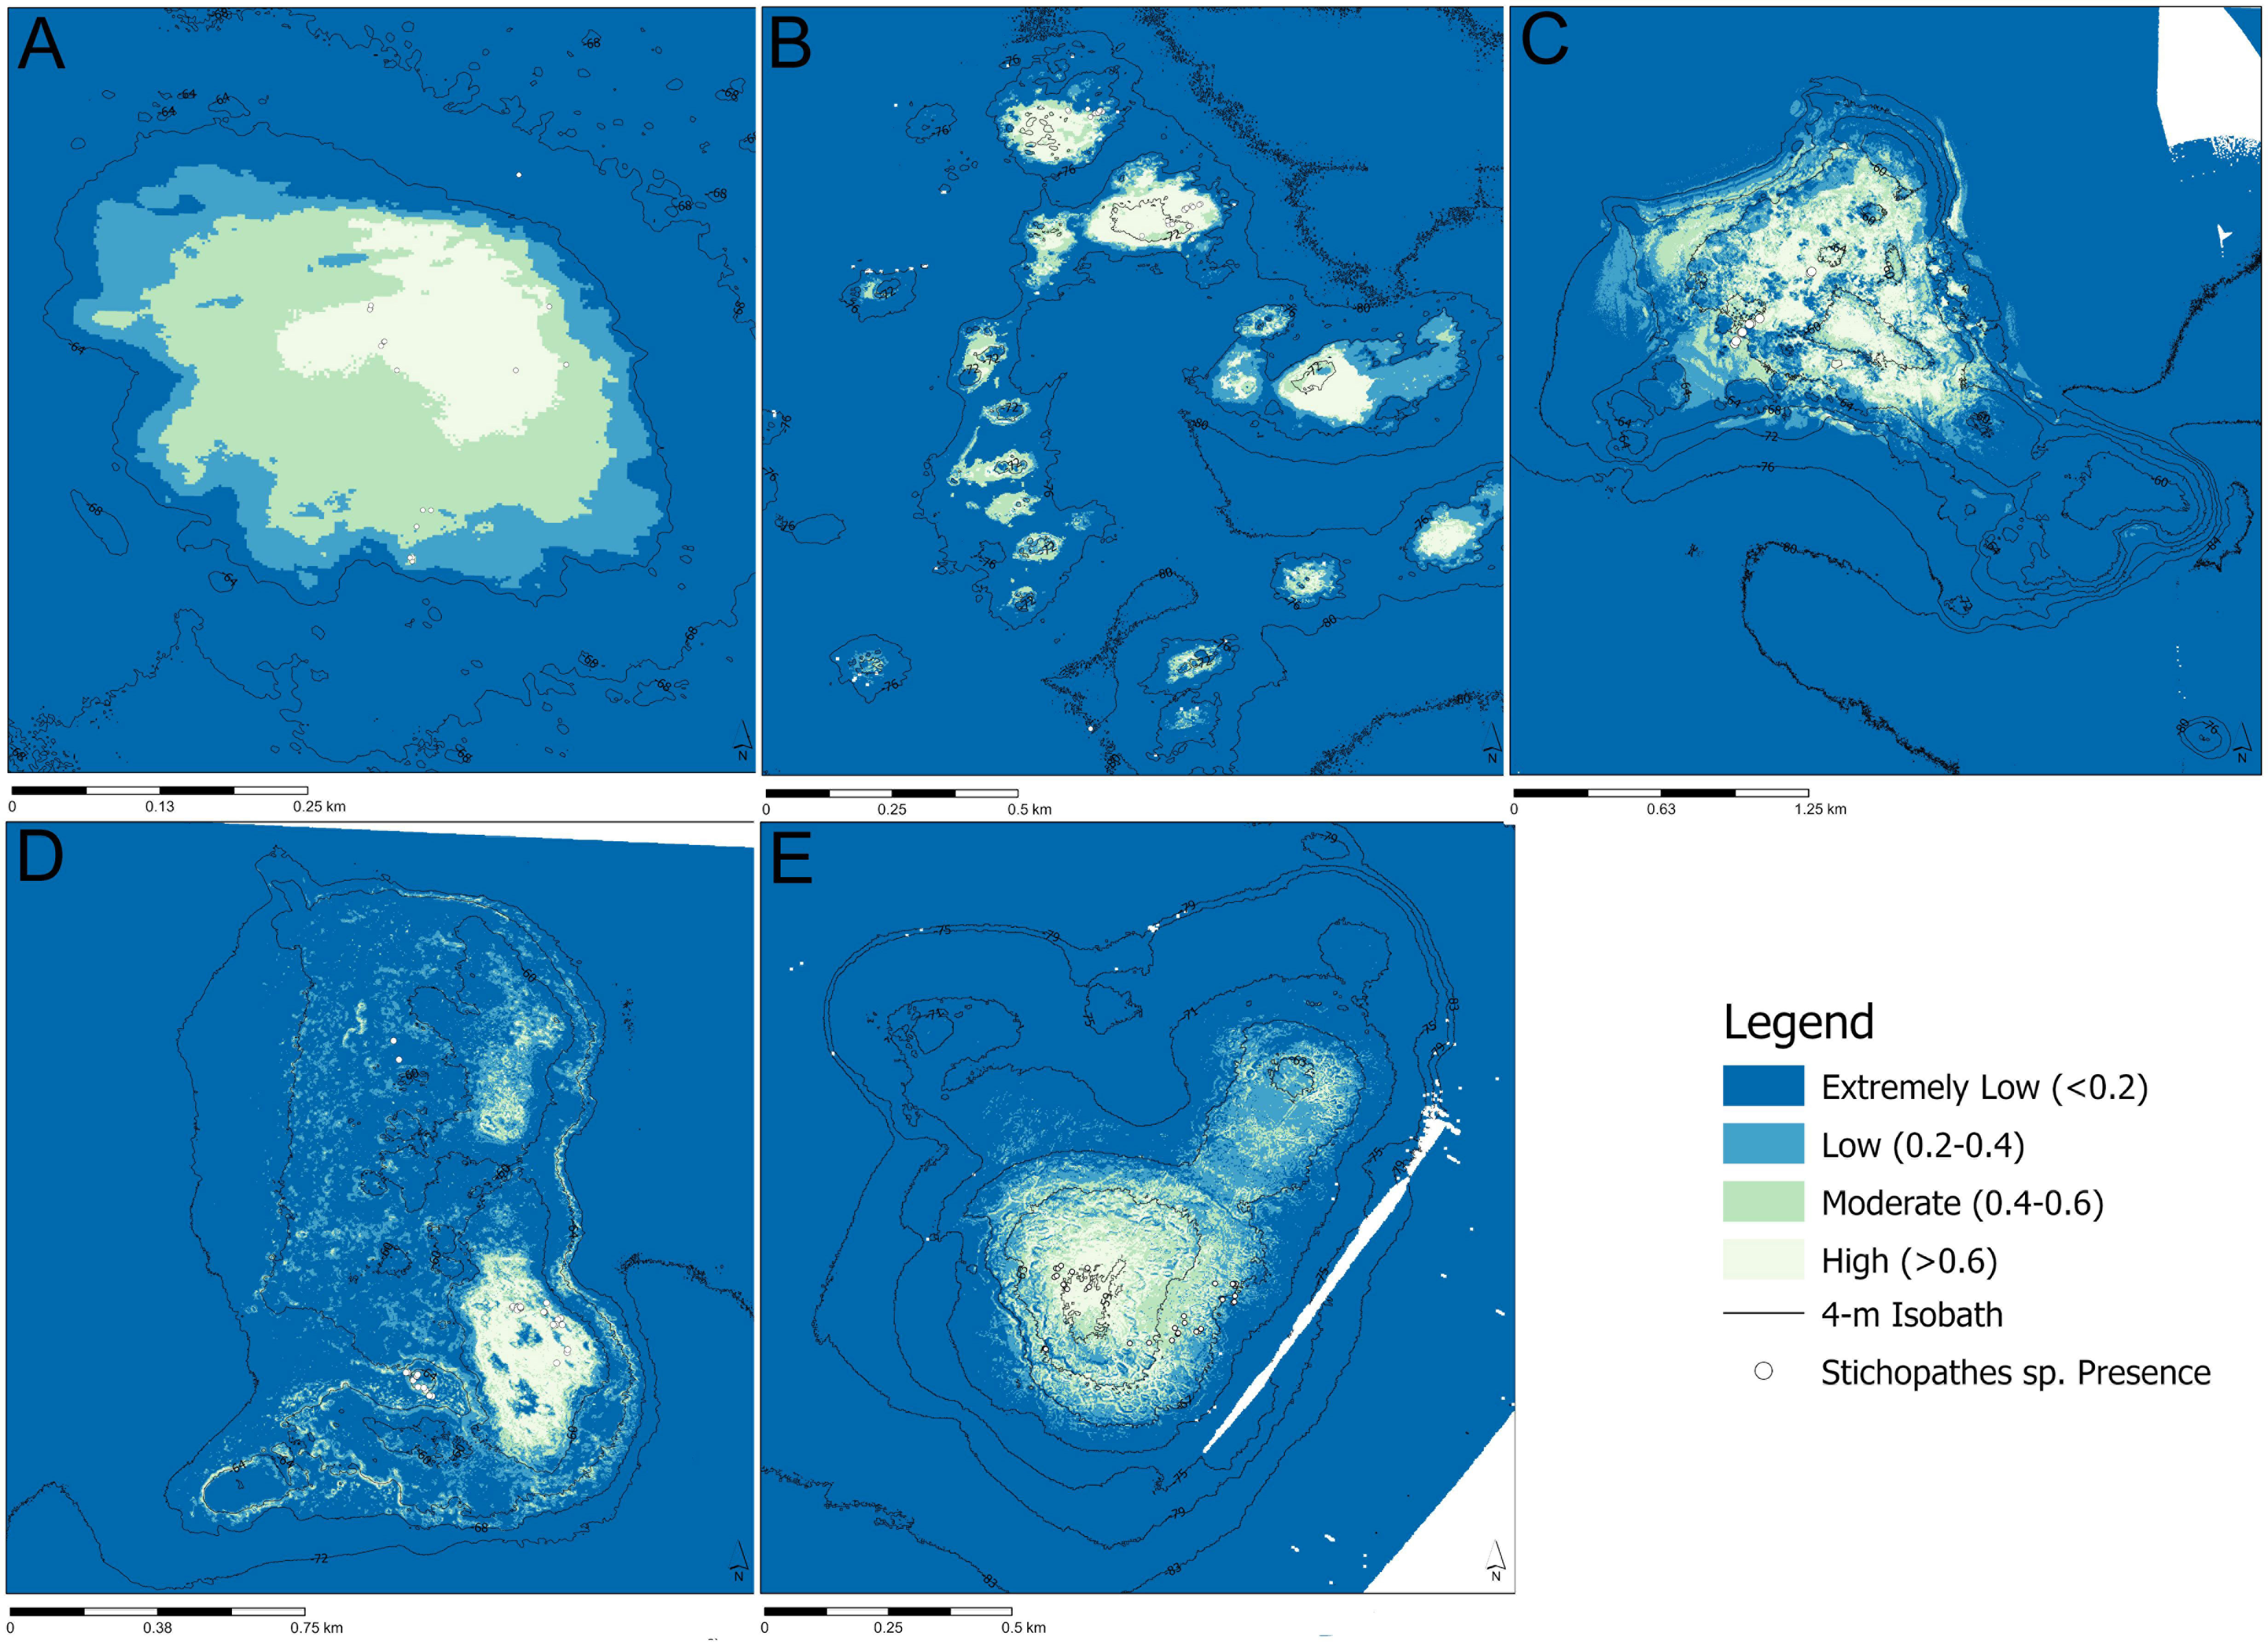
Figure 4 Predictive model of habitat suitability for Stichopathes spp. at (A) Big Adam Bank, (B) Mysterious Bank, (C) Hospital Bank, (D) North Hospital Bank, and (E) Southern Bank. Areas that are white to pale blue have a higher probability of the presence of Stichopathes spp., whereas areas that are darker blue have a low probability that Stichopathes spp. will be present.
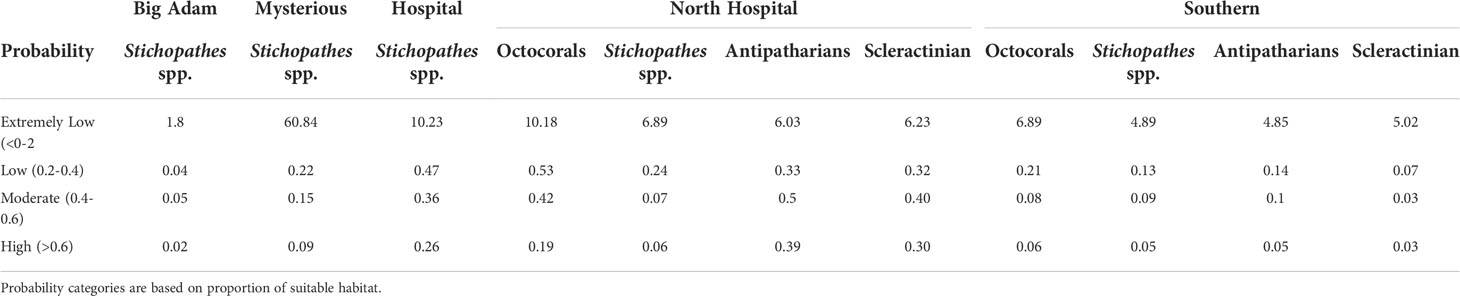
Table 4 MaxEnt habitat suitability predictions (km2) for each bank and species group.
Habitat suitability for all other antipatharians besides Stichopathes spp. was predicted at North Hospital and Southern Banks (Figures 5A, B). At North Hospital Bank antipatharians were likely to be present extended to other crests of the bank and areas with a high slope; 0.05 km2 (3.5% of total area) of reef had a high probability of presence (Table 4; Figure 5A). For Southern Bank, depth had an inverse relationship with habitat suitability for antipatharians. The resulting logistic model for antipatharians was spread out over the face of the bank and was more affected by the macroscale topology than the model for Stichopathes spp. at this site (Figure 5B). There was a total of 0.39 km2 (38% of total area) of reef found to have a high probability of antipatharian presence (Table 4).
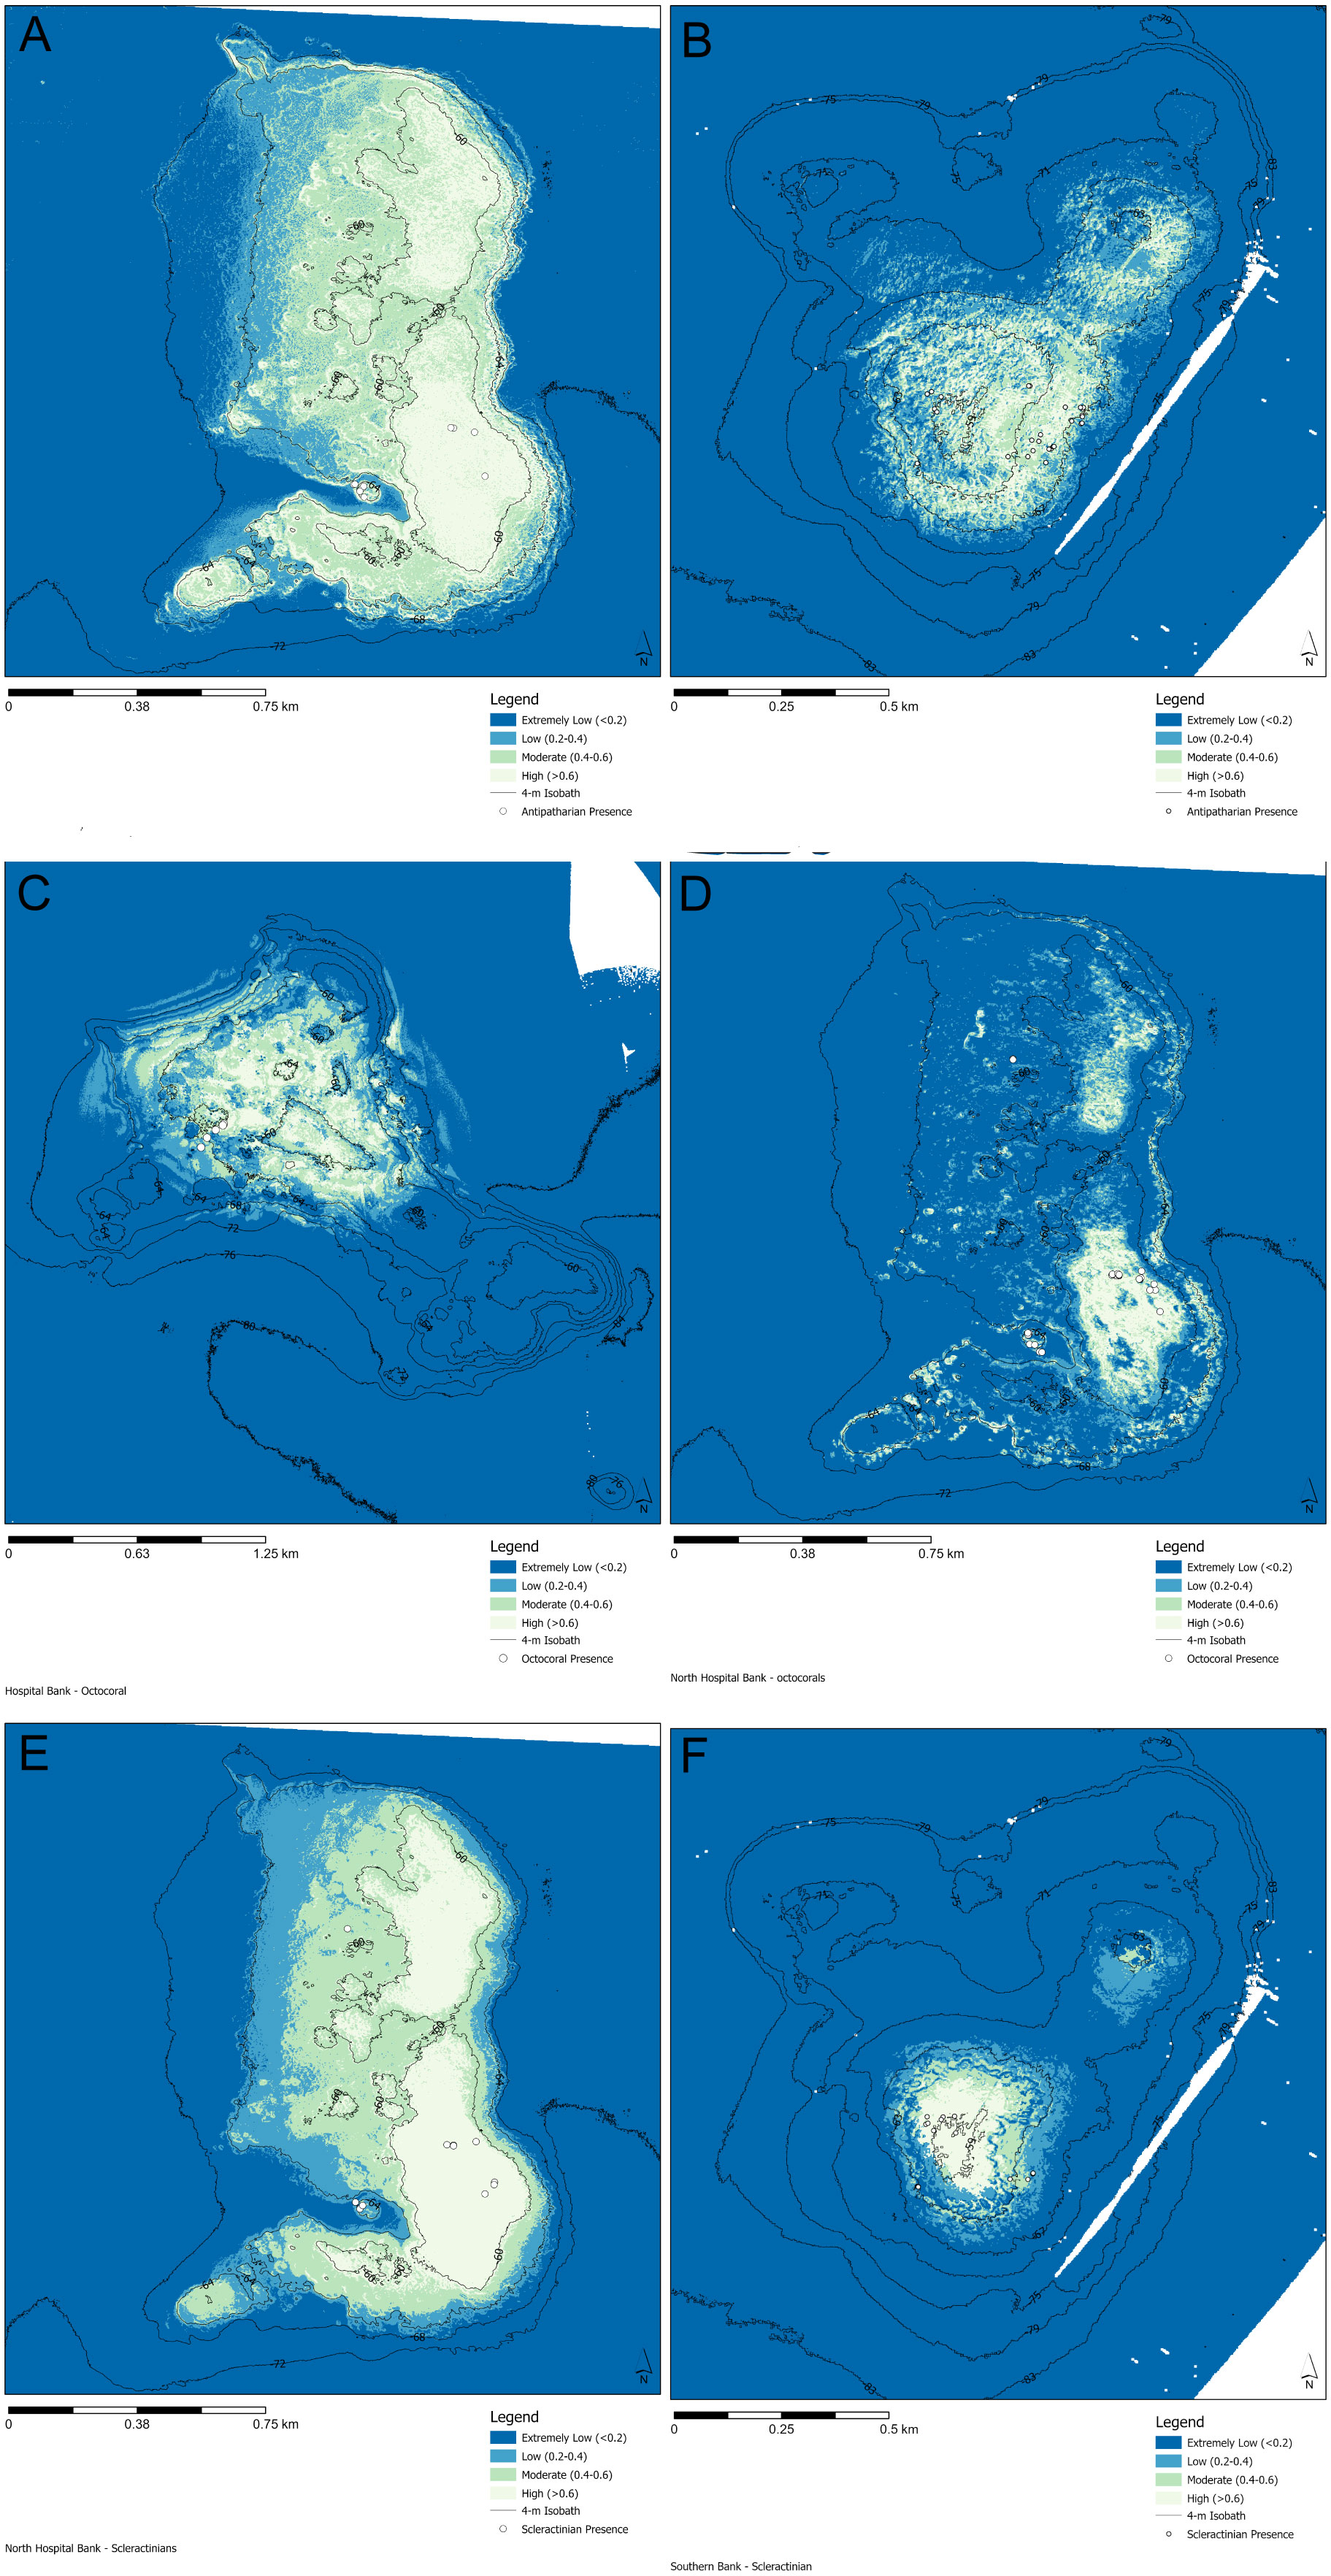
Figure 5 Predictive model of habitat suitability for antipatharians, octocorals or scleractinians on the South Texas Banks. Models for antipatharians were run for (A) North Hospital Bank and (B) Southern Bank. Models for octocorals were run for (C) North Hospital Bank and (D) Hospital Bank. Models for scleractinians were run for (E) North Hospital Bank and (F) Southern Bank. Areas that are white to pale blue have a higher probability of the presence of antipatharians or octocorals, areas that are darker blue have a low probability that of antipatharians or octocorals will be present.
The habitat suitability for octocorals was predicted for Southern and North Hospital Bank; the shallowest points showed highest probability of having an octocoral present (Figures 5C, D) respectively at 0.06 km2 and 0.19 km2 (6% and 13% of total area respectively) of habitat. The scleractinian habitat suitability models were created by combining presence samples of M. brueggemani, A. fragilis, and another unidentified stony coral species. On North Hospital Bank the habitat suitability showed crests and ridges of the bank held the highest potential to host scleractinians corals (Figure 5E) with 0.30 km2 (21% of total area) of habitat found to have a high probability (Table 4). The logistic model only predicted high probabilities of finding a scleractinian at the two shallowest areas (0.03 km2) (3% of total area) at Southern Bank (Figure 5F).
Discussion
South Texas banks each support unique benthic communities
This research represents the first quantitative description of the benthic invertebrate communities of these five banks and the first attempt at modelling habitat suitability for key, threatened, benthic community members on the STB. Each of the five banks in this study had significantly different benthic invertebrate community compositions, likely driven by relief and crest depths at each site. Geomorphology, relief, rugosity, and in particular, substrate type are the most important variables for predicting coral distributions at these banks and others in the GOM (Silva & MacDonald, 2017; Etnoyer et al., 2018; Rodriguez et al., 2018). As such, it was unsurprising that Big Adam Bank and Mysterious bank had lower biodiversity relative to the other three banks in this study. This low biodiversity was likely due to the presence of the nepheloid layer and the resulting layer of mud deposited on the bank surface, combined with lower total relief relative to the other banks in the survey. The layer of deposited fine silt can smother or reduce the recruitment of sessile benthic invertebrates at these sites (Rezak et al., 1990). The chronic turbidity, produced by particle concentrations between 49*104 and 111*104 particles/cc, can reduce light transmissivity (% T/m) by up to 70% compared to surface values (Shideler, 1981). This poses as a barrier for photoautotrophic organisms by reducing available photosynthetically available radiation (PAR) due to light attenuation with depth but also the scattering effect of the particles in the water column. North Hospital and Southern Banks hosted abundant and diverse populations of coral species and other benthic invertebrates, which can support populations of species of commercial concern, such as red snapper (Lutjanus campechanus, Froese and Pauly, 2022) and several serranid species (Jordan, 2016). These findings are consistent with other studies at the banks, including Nash’s (2013) predictions that North Hospital and Southern Banks would contain more diversity than Big Adam, Hospital, and Mysterious Banks based on their geomorphology and depth.
Antipatharians were abundant at all five banks consistent with observations of abundant populations of antipatharians at other STB and low-relief structures in the northwestern GOM (Rodriguez et al., 2018; Nuttall et al., 2022). The high abundance of the group was driven primarily by the presence of Stichopathes spp., whose whip-like growth pattern keeps the majority of their polyps higher in the water column, potentially avoiding smothering. Although this study focused on the corals found at these five banks, other conspicuous invertebrates that are characteristic of mesophotic reefs were also observed, including comatulid crinoids, bivalves, zooanthids, sea cucumbers, and at least twenty different morphotypes of sponges. Although it was difficult to identify sponges to species level, ball, finger, encrusting, and clionid sponges were all seen at the banks. The relatively small sample size of frame grabs (n = 25-50 frame grabs per bank) also failed to capture the entire benthic invertebrate community that could be found at a bank (evident from watching the video footage in its entirety). To capture this diversity would require a much more comprehensive study (e.g., greater coverage of transects and a greater number of frames) at each bank.
The surveyed banks did show some differences in species composition and abundances compared to other STB previously surveyed. Stichopathes spp. had higher densities at three banks (2.04-5.48 ind/m2) than what was recorded in a study by Rodriguez et al. (2018) on nearby STB, where Baker Bank (27° 45’ 00” N, 96° 14’ 00” W) had the highest density of Stichopathes spp. (1.41 ind/m2). Antipathes furcata was recorded in densities up to 1.04 ind/m2 at Harte Bank (26° 39’ 00” N, 96° 34’ 00” W) during a study by Rodriguez et al. (2018), which was greater than the highest recorded density in this study (Southern Bank with 0.65 ind/m2). The banks surveyed here and in Rodriguez et al. (2018) all showed low scleractinian coral densities relative to other benthic fauna typically found in a mesophotic coral ecosystem (Kahng et al., 2010; Lesser et al., 2018; Lesser et al., 2019). The nepheloid layer is likely to be the major contributor to this observed pattern, as higher relief banks, such as the Flower Garden Banks (FGB), that sit above the layer typically have higher scleractinian densities and cover (Clark et al., 2014). The scleractinians most commonly observed were agariciid corals, which are typically found at mesophotic depths and considered to be depth specialists (Bongaerts et al., 2017). Very few depth generalist corals (e.g., Montastraea cavernosa or oribicellid corals) were observed. Although these MCEs could act as refuges for a very limited group of scleractinian corals, they provide a unique habitat that can provide a genetic reservoir for a diverse array of antipatharians and octocorals in the GOM. Not only are these habitats unique in their own right but in the GOM they provide crucial habitat for a variety of economically and ecologically important fish species (Hicks et al., 2014).
South Texas banks benthic assemblages compared to those of other GOM bank complexes
In 2008, the Gulf of Mexico Science Forum discussed the National Oceanic and Atmospheric Administration (NOAA)’s “Island in the Stream” concept, which identified the STB as a possible site of a Marine Protected Area (MPA) (Ritchie et al., 2008). This concept considers the connectivity of the entire GOM via the loop current and aims to protect the productivity of the GOM by targeting “islands” of high biodiversity. Given the diversity and abundances reported here and by Rodriguez et al. (2018), the STBs now warrant consideration for increased protection beyond some of the bank’s statuses as habitat areasof particular concern (HAPC) (Harte and Southern) or at minimum, adding Hospital and North Hospital as HAPCs. Such protections on the STBs with the highest biodiversity, such as Southern, North Hospital and Hospital are particularly pertinent as many of the benthic species found on these banks were observed to be damaged at mesophotic sites affected by the Deepwater Horizon oil spill (Etnoyer et al., 2016) or could be easily affected by trawling disturbances (physical damage or sedimentation) which HAPC status restricts. Furthermore these banks may be important sources of propagules as it has been shown that mesophotic coral larvae may travel considerable distances (up to 1000km), as observed in Studivan and Voss (2018), This dispersal pattern is of note as many of the species the STB may be an important source of propagules for the eastern GOM at banks such as the FGB and surrounding low relief habitat areas (Nuttall et al., 2022), based on prevailing currents such as the Mexico current (Studivan and Voss, 2018). The Louisiana Coastal Current also travels in a southerly direction so it is also possible these reefs may seed mesophotic reefs along the Mexican coastline as well (Studivan and Voss, 2018).
The species found at the banks in this study have been reported previously at other STB by Rezak et al. (1985) and Rodriguez et al. (2018) and at mesophotic depths of the nearby Flower Garden Banks National Marine Sanctuary (Clark et al., 2014). However, there are noticeable differences that distinguish the STB from the well-known FGB and the Pulley Ridge Reefs (PRR), which are crucial MCEs in the GOM (Rezak et al., 1985; Clark et al., 2014; Reed et al., 2019). The most notable difference is that the STB lacks the magnitude of hermatypic coral cover that dominates the FGB (Clark et al., 2014). These differences could be a result of higher particulate concentration in the waters around the STB because of the nepheloid layer (Shideler, 1981) due to their relatively low relief to the seafloor compared to the pinnacles of the FGB (Bright et al., 1985). Thus, the STB provide a more suitable habitat for azooxanthellate heterotrophic corals because of this turbidity and associated reduction in PAR.
At comparable depths (50–90 m) percentage cover of antipatharians was similar at PRR, FGB, and STB but cover differs depending on the type of substrate surveyed. On deep reefs (classified as hard substrates without coralline algal cover below 85m in Clark et al. (2014)) at the FGB the cover of antipatharians was 0–1.6% and 0–4.5% on coralline algal substrates (Clark et al., 2014). At the PRR, antipatharian cover was lower than the STB, observed to be 0.1–0.3% (Reed et al., 2019). Interestingly, the FGB had higher cover of octocorals on the deep reefs and coralline algal substrates (0.26–1.10%) relative to the STB, except for North Hospital Bank (0.04–0.12%) (Table 2). The PRR had comparable octocoral cover to most of the STB with cover ranging from 0.1–0.3% (Reed et al., 2019)… The STB and the FGB also have relatively low sponge cover compared to the Caribbean at comparable depths (20–80%) (Lesser & Slattery, 2018; Macartney et al., 2020; Macartney et al., 2021).
While most studies at the FGB have focused on biodiversity of the high relief, dome-shaped salt diapir structures (which are typically above the nepheloid layer), a recent study by Nuttall et al. (2022) focused on low-relief hard-bottom habitat within the FGB. The α diversity (Shannon’s H’) was similar to that of the STB surveyed in this study (0.12 – 1.51), and the communities were comprised primarily of antipatharians and octocorals (Nuttall et al., 2022). The similarities between the STB and these low-relief structures found in the FGBNMS suggest that future studies of the STB should incorporate exploration of any adjacent low-relief habitat observed around individual STB.
MaxEnt habitat suitability models illustrate the importance of GOM raised hard-bottom habitat
Given the difficulty and level of effort required to survey the banks thoroughly, modelling habitat suitability can provide valuable information in the form of a predictive value of potential habitat that is highly suited for coral communities. The use of MaxEnt in this study illustrates how crucial raised hard-bottom habitat is in the GOM. Depth was the most important factor for Southern, North Hospital and Hospital banks and broad-scale BPI, representing elevation from the ocean floor, was the most important variable for Big Adam and Mysterious Banks. Hard-bottom features (e.g., small reef crests or outcrops) appear more important in relatively featureless areas such as Big Adam and Mysterious banks, which have lower overall relief compared to the other banks. The most parsimonious explanation for this pattern is that the highest reef crests, where species presence probabilities were predicted to be highest, are elevated above the persistent nepheloid layer or produce turbulence at the bank edges which may prevent subsurface currents depositing sediments over the reef crests. These factorstherefore prevent smothering from sediment deposition, provide crucial settlement areas for holdfast development, and allow increased light for photoautotrophic species. Additionally, these reef crests may also be exposed to higher flow rates, therefore increasing the ability of passive suspension feeders, such as antipatharians, to capture particulate matter. The importance of substrate type and geomorphology in predicting coral presence was also illustrated for the eastern GOM by Silva & MacDonald (2017) and Western GOM by Etnoyer et al. (2018) who found most of their suitable habitat was hard substrate with higher relief relative to the seafloor. While there are limitations to our modelling approach due to relatively limited sample sizes and variables, these approaches are still useful as starting points for further exploration of the STB.
The MaxEnt habitat suitability modelling found a substantial amount of habitat was considered highly suitable for the coral groups in this study. While these predictions are critical for assigning protections to these specific areas, which are typically the higher relief areas of the banks (i.e., hard-bottom coral algal crests), they can potentially be useful for getting a rough estimate of total individuals that may be present at the bank. Using Southern Bank as an example, one can estimate the potential density of individuals based on survey counts and the “high probability” habitat areas produced by MaxEnt. For Stichopathes spp., the density of individuals from the surveys was 2.04 ind/m2 and 0.05 km2 was found to be highly suitable habitat. If we assume that all of the 0.05 km2 is at the maximum habitat suitability value of one and that the number of individuals in the surveyed area is representative of the entire bank area, we find that there could be ~100,000 colonies of Stichopathes spp. at Southern Bank alone. Along these same lines, at North Hospital Bank, 84,000 individual colonies of Agaracia fragilis might be found and thus could be an important population source for other banks that may share characteristics with North Hospital (such as Southern Bank or Baker Bank). If we consider the five banks from this study as a whole, we can predict that there are approximately 1,000,000 colonies of Stichopathes spp., 319,000 octocoral colonies, 206,000 antipatharian colonies and 85,000 scleractinian colonies (mostly consisting of agariciids) that could represent substantial genetic reservoirs for these species. It is important to recognize that the variables and survey data that were used in the model are relatively limited in scope and we would encourage future or further studies of the STB to collect both abiotic and biotic variables, such as PAR, turbidity, particulate and dissolved matter concentrations, and temperature, to increase model reliability. This information will allow for a better understanding of the drivers of diversity and species’ distributions on the STB, particularly the effect of the nepheloid layer.
Conclusion
In the past, mesophotic zones in the northwestern GOM were studied primarily to learn about the geology of the area in the interest of oil exploration (Nash et al., 2013). Recently, the decline in healthy shallow-water coral reef ecosystems around the world has rekindled interest in mesophotic reefs for their natural protection from anthropogenic stressors and disturbances (Lesser et al., 2009; Bongaerts et al., 2017). The biological information from this study provides critical insight regarding the range of diversity across five STB and provides crucial predictions of habitat suitability, indicating the potential for the presence of a large number of corals at the banks. Although the benthic community composition is unique to these banks, the STB may be important for producing propagules for a variety of corals and may play a significant role as genetic reservoirs for other mesophotic reefs in the GOM, which provides important justification for further protections on these banks. Further studies of the STB should focus on increased benthic ROV surveys with higher resolution photogrammetry equipment, genetic connectivity between banks and other reef complexes, and the reproductive biology of antipatharians and octocorals. These targets are key in further understanding the connectivity of these banks with other bank complexes in the GOM while also providing further information on the benthic communities found on the STB. With the paucity of information regarding mesophotic reefs both on a global and regional scale, data gathered in future explorations will be critical to the protection of these unique environments and the important ecosystem services that they provide.
Data availability statement
The raw data supporting the conclusions of this article will be made available by the authors, without undue reservation.
Author contributions
DW and MB planned the study and conducted field work. MB reviewed and categorized video footage. DW, MB, EE and KM conducted statistical analyses. All authors contributed to the article and approved the submitted version.
Funding
This study formed part of the MSc thesis of M. Bollinger and was supported and monitored by the National Oceanic and Atmospheric Administration (NOAA) under the Environmental Cooperative Science Center (ECSC) Grant #NA11SEC4810001. This publication was also made possible by the NOAA Office of Education Educational Partnership Program award (NA16SEC4810009) under the Center for Coastal and Marine Ecosystems (CCME). Any opinions, findings, conclusions, or recommendations expressed in this publication are those of the author(s) and do not necessarily reflect the view of the U.S. Department of Commerce, National Oceanic and Atmospheric Administration.
Acknowledgments
We thank Shelby Bessette, Michael Bollinger, Rob Figueroa-Downing, Catheline Froehlich, Andres Garcia, Kristen Kline, Seth Patterson, and the crew of the M/V Fling for their assistance in the field, and Rebekah Rodriguez, Linda Jordan, and Heather Otte, Ashley Moreno, Vanessa Trevino, Edna Araujo, and Carlos Perez for their assistance with associated lab work.
Conflict of interest
The authors declare that the research was conducted in the absence of any commercial or financial relationships that could be construed as a potential conflict of interest.
Publisher’s note
All claims expressed in this article are solely those of the authors and do not necessarily represent those of their affiliated organizations, or those of the publisher, the editors and the reviewers. Any product that may be evaluated in this article, or claim that may be made by its manufacturer, is not guaranteed or endorsed by the publisher.
Supplementary material
The Supplementary Material for this article can be found online at: https://www.frontiersin.org/articles/10.3389/fmars.2022.1026407/full#supplementary-material
References
Bongaerts P., Ridgway T., Sampayo E. M., Hoegh-Guldberg O. (2010). Assessing the ‘deep reef refugia’hypothesis: focus on Caribbean reefs. Coral reefs 29 (2), 309–327. doi: 10.1007/s00338-009-0581-x
Bongaerts P., Riginos C., Brunner R., Englebert N., Smith S. R., Hoegh-Guldberg O. (2017). Deep reefs are not universal refuges: reseeding potential varies among coral species. Sci. Adv. 3 (2), e1602373. doi: 10.1126/sciadv.1602373
Bright T. J., McGrail D. W., Rezak R., Boland G. S., Trippett A. R. (1985). The flower gardens: A compendium of information. OCS Study MMS 85-0024, 15–27. doi: 10.13140/2.1.1910.9449
Clark M. R., Althaus F., Schlacher T. A., Williams A., Bowden D. A., Rowden A. A. (2016). The impacts of deep-sea fisheries on benthic communities: a review. ICES J. Mar. Sci. 73 (Suppl 1), i51–i69. doi: 10.1093/icesjms/fsv123
Clarke K. R., Gorley R. N. (2015). Getting started with PRIMER v7. PRIMER-e: Plymouth, Plymouth marine laboratory. 20(1).
Clark R. D., Taylor J. C., Buckel C. A., Kracker L. M. (2014). Fish and benthic communities of the flower garden banks national marine sanctuary: Science to support sanctuary management . (Silver Spring, MD: NOAA Technical Memorandum NOS NCCOS 179), 317.
Deichmann E. (1936). The Alcyonaria of the western part of the Atlantic ocean. (Cambridge, U.S.A.: Illustrated catalogue of the Museum of Comparative Zoölogy), 106.
EIA (2021) Gulf of Mexico fact sheet. energy information administration. Available at: https://www.eia.gov/special/gulf_of_mexico/ (Accessed January 19, 2022).
Elith J., Phillips S. J., Hastie T., Dudík M., Chee Y. E., Yates C. J. (2011). A statistical explanation of MaxEnt for ecologists. Diversity distributions 17 (1), 43–57. doi: 10.1111/j.1472-4642.2010.00725.x
Etnoyer P. J., Wagner D., Fowle H. A., Poti M., Kinlan B., Georgian S. E., et al. (2018). Models of habitat suitability, size, and age-class structure for the deep-sea black coral Leiopathes glaberrima in the gulf of Mexico. Deep Sea Res. Part II: Topical Stud. Oceanogr. 150, 218–228. doi: 10.1016/j.dsr2.2017.10.008
Etnoyer P. J., Wickes L. N., Silva M., Dubick J. D., Balthis L., Salgado E., et al. (2016). Decline in condition of gorgonian octocorals on mesophotic reefs in the northern gulf of Mexico: before and after the deepwater horizon oil spill. Coral Reefs 35 (1), 77–90. doi: 10.1007/s00338-015-1363-2
Froese R., Pauly D. (Eds.) (2022). FishBase. Lutjanus campechanus (Poey, 1860). Accessed through: World Register of Marine Species. Available at: https://www.marinespecies.org/aphia.php?p=taxdetails&id=159795 on 2022-10-21.
Glynn P. W. (1996). Coral reef bleaching: facts, hypotheses and implications. Global Change Biol. 2 (6), 495–509. doi: 10.1111/j.1365-2486.1996.tb00063.x
Hernandez P. A., Graham C. H., Master L. L., Albert D. L. (2006). The effect of sample size and species characteristics on performance of different species distribution modeling methods. Ecography 29 (5), 773–785. doi: 10.1111/j.0906-7590.2006.04700.x
Hicks D., Lerma L., Le J., Shirley T. C., Tunnell J. W., Rodriguez R., et al. (2014). Assessing fish communities of six remnant coralgal reefs off the south Texas coast. In Proc. Gulf Caribbean Fish. Institute 66, 244–254.
Jordan L. M. (2016). Characterizing mesophotic reef fish communities at five south Texas relic coral-algal banks (Edinburg, TX: The University of Texas Rio Grande Valley).
Kahng S. E., Garcia-Sais J. R., Spalding H. L., Brokovich E., Wagner D., Weil E., et al. (2010). Community ecology of mesophotic coral reef ecosystems. Coral Reefs 29 (2), 255–275. doi: 10.1007/s00338-010-0593-6
Kamyo T., Asanok L. (2020). Modeling habitat suitability of dipterocarpus alatus (Dipterocarpaceae) using MaxEnt along the chao phraya river in central Thailand. For. Sci. Technol. 16 (1), 1–7. doi: 10.1080/21580103.2019.1687108
Laverick J. H., Piango S., Andradi-Brown D. A., Exton D. A., Bongaerts P., Bridge T. C., et al. (2018). To what extent do mesophotic coral ecosystems and shallow reefs share species of conservation interest? a systematic review. Environ. Evidence 7 (1), 1–13. doi: 10.1186/s13750-018-0127-1
Lesser M. P., Slattery M. (2018). Sponge density increases with depth throughout the Caribbean. Ecosphere 9 (12), e02525. doi: 10.1002/ecs2.2525
Lesser M. P., Slattery M. (2021). Mesophotic coral reef community structure: the constraints of imagery collected by unmanned vehicles. Mar. Ecol. Prog. Ser. 663, 229–236. doi: 10.3354/meps13650
Lesser M. P., Slattery M., Laverick J. H., Macartney K. J., Bridge T. C. (2019). Global community breaks at 60 m on mesophotic coral reefs. Global Ecol. Biogeogr. 28 (10), 1403–1416. doi: 10.1111/geb.12940
Lesser M. P., Slattery M., Leichter J. J. (2009). Ecology of mesophotic coral reefs. J. Exp. Mar. Biol. Ecol. 375 (1-2), 1–8. doi: 10.1016/j.jembe.2009.05.009
Lesser M. P., Slattery M., Mobley C. D. (2018). Biodiversity and functional ecology of mesophotic coral reefs. Annu. Rev. Ecol. Evolution Systematics 49, 49–71. doi: 10.1146/annurev-ecolsys-110617-062423
Loya Y., Eyal G., Treibitz T., Lesser M. P., Appeldoorn R. (2016). Theme section on mesophotic coral ecosystems: advances in knowledge and future perspectives Coral Reefs 35 (1), 1–9. doi: 10.1007/s00338-016-1410-7
Macartney K. J., Pankey M. S., Slattery M., Lesser M. P. (2020). Trophodynamics of the sclerosponge Ceratoporella nicholsoni along a shallow to mesophotic depth gradient. Coral Reefs 39 (6), 1829–1839. doi: 10.1007/s00338-020-02008-3
Macartney K. J., Slattery M., Lesser M. P. (2021). Trophic ecology of Caribbean sponges in the mesophotic zone. Limnol. Oceanogr. 66 (4), 1113–1124. doi: 10.1002/lno.11668
Merow C., Smith M. J., Silander J. A. Jr. (2013). A practical guide to MaxEnt for modeling species’ distributions: what it does, and why inputs and settings matter. Ecography 36 (10), 1058–1069. doi: 10.1111/j.1600-0587.2013.07872.x
Nash H. L., Furiness S. J., Tunnell J. W. Jr. (2013). What is known about species richness and distribution on the outer-shelf south Texas banks? Gulf Caribbean Res. 25 (1), 9–18. doi: 10.18785/gcr.2501.02
Nuttall M. F., Hickerson E. L., Blakeway R. D., Schmahl G. P., Sammarco P. W. (2022). Do oil and gas lease stipulations in the northwestern gulf of Mexico need expansion to better protect vulnerable coral communities? how low relief habitats support high coral biodiversity. Front. Mar. Sci. 8, 780248. doi: 10.3389/fmars.2021.780248
Phillips S. J., Anderson R. P., Schapire R. E. (2006). Maximum entropy modeling of species geographic distributions. Ecol. Model. 190 (3-4), 231–259. doi: 10.1016/j.ecolmodel.2005.03.026
Phillips S. J., Dudík M. (2008). Modeling of species distributions with maxent: new extensions and a comprehensive evaluation. Ecography 31 (2), 161–175. doi: 10.1111/j.0906-7590.2008.5203.x
Reed J. K., Farrington S., David A., Harter S., Pomponi S. A., Diaz M. C., et al. (2019). Pulley ridge, gulf of Mexico, USA. in mesophotic coral ecosystems (Cham: Springer), 57–69.
Rezak R., Bright T. J., McGrail D. W. (1985). Reefs and banks of the northwestern gulf of Mexico: Their geological, biological, and physical dynamics (Hoboken, NJ: Wiley).
Rezak R., Gittings S. R., Bright T. J. (1990). Biotic assemblages and ecological controls on reefs and banks of the northwest gulf of Mexico. Am. Zoologist 30 (1), 23–35. doi: 10.1093/icb/30.1.23
Ritchie K. B., Keller B. D., Estevez E. D. (2008). A scientific forum on the Gulf of Mexico: the islands in the stream concept. Mote Marine Lab. (Sarasota, FL: Mote Marine Laboratory).
Roark E. B., Guilderson T. P., Dunbar R. B., Fallon S. J., Mucciarone D. A. (2009). Extreme longevity in proteinaceous deep-sea corals. Proc. Natl. Acad. Sci. 106 (13), 5204–5208. doi: 10.1073/pnas.0810875106
Rodriguez R. E. (2015). Assessing coral assemblages inhabiting relic coral banks off the south Texas coast (Edinburg, TX: The University of Texas Rio Grande Valley).
Rodriguez R., Easton E. E., Shirley T. C., Tunnell J. W., Hicks D. (2018). Preliminary multivariate comparison of coral assemblages on carbonate banks in the Western gulf of Mexico. Gulf Caribbean Res. 29 (1), 23–33. doi: 10.18785/gcr.2901.11
Schmidt Ocean Institute. (2012). R/V falkor specifications. Available at: https://schmidtocean.org/rv-falkor/ship-specifications/ (Accessed October 20, 2022).
Shideler G. L. (1981). Development of the benethic nepheloid layer on the south Texas continental shelf, western gulf of Mexico. Mar. Geol. 41 (1-2), 37–61. doi: 10.1016/0025-3227(81)90103-1
Silva M., MacDonald I. R. (2017). Habitat suitability modeling for mesophotic coral in the northeastern gulf of Mexico. Mar. Ecol. Prog. Ser. 583, 121–136. doi: 10.3354/meps12336
Slattery M., Lesser M. P. (2021). Gorgonians are foundation species on sponge-dominated mesophotic coral reefs in the Caribbean. Front. Mar. Sci. 8, 304. doi: 10.3389/fmars.2021.654268
Studivan M. S., Voss J. D. (2018). Population connectivity among shallow and mesophotic montastraea cavernosa corals in the gulf of Mexico identifies potential for refugia. Coral Reefs 37 (4), 1183–1196. doi: 10.1007/s00338-018-1733-7
Tittensor D. P., Baco A. R., Brewin P. E., Clark M. R., Consalvey M., Hall-Spencer J., et al. (2009). Predicting global habitat suitability for stony corals on seamounts. J. Biogeogr. 36 (6), 1111–1128. doi: 10.1111/j.1365-2699.2008.02062.x
Wagner D., Luck D. G., Toonen R. J. (2012). The biology and ecology of black corals (Cnidaria: Anthozoa: Hexacorallia: Antipatharia). Adv. Mar. Biol. 63, 67–132. doi: 10.1016/B978-0-12-394282-1.00002-8
White H. K., Hsing P. Y., Cho W., Shank T. M., Cordes E. E., Quattrini A. M., et al. (2012). Impact of the deepwater horizon oil spill on a deep-water coral community in the gulf of Mexico. Proc. Natl. Acad. Sci. 109 (50), 20303–20308. doi: 10.1073/pnas.1118029109
Wright D. J., Pendleton M., Boulware J., Walbridge S., Gerlt B., Eslinger D, et al. (2012). ArcGIS benthic terrain modeler (BTM). envrionmental systems research institute. NoAA Coast. Service Center Massachussetts Office Coast. Zone Manage. Retrieved from: http://esriurl.com/5754
Keywords: antipatharia, octocoral, gorgonian, scleractinia, habitat suitability modelling, maxent, benthic communites
Citation: Bollinger M, Macartney KJ, Easton EE and Hicks DW (2022) Islands in the mud: The South Texas banks provide crucial mesophotic habitat for coral communities. Front. Mar. Sci. 9:1026407. doi: 10.3389/fmars.2022.1026407
Received: 23 August 2022; Accepted: 14 October 2022;
Published: 07 November 2022.
Edited by:
Charles Alan Jacoby, St. Johns River Water Management District, United StatesReviewed by:
Anthony Montgomery, United States Fish and Wildlife Service, United StatesRian Prasetia, Wildlife Conservation Society, Indonesia
Andrew Heyward, Australian Institute of Marine Science (AIMS), Australia
Copyright © 2022 Bollinger, Macartney, Easton and Hicks. This is an open-access article distributed under the terms of the Creative Commons Attribution License (CC BY). The use, distribution or reproduction in other forums is permitted, provided the original author(s) and the copyright owner(s) are credited and that the original publication in this journal is cited, in accordance with accepted academic practice. No use, distribution or reproduction is permitted which does not comply with these terms.
*Correspondence: David W. Hicks, ZGF2aWQuaGlja3NAdXRyZ3YuZWR1