 Young Baek Son
 Jong-Kuk Choi
- 1Jeju Marine Research Center, Korea Institute of Ocean Science and Technology, Jeju, South Korea
- 2Korea Ocean Satellite Center, Korea Institute of Ocean Science and Technology, Busan, South Korea
The Changjiang River loads freshwater into the East China Sea (ECS) and the Yellow Sea (YS). A low-salinity plume known as Changjiang Diluted Water (CDW) is formed by mixing with saline ambient waters; it disperses toward Jeju Island and the East/Japan Sea due to the dominant southerly wind and tide during summer. To map the offshore surface CDW in the ECS, a proxy was developed using surface water beam attenuation (c) and salinity from 18 annual summer cruises matched with synchronous Geostationary Ocean Color Imager (GOCI) satellite data. We followed a two-step empirical approach. First, a relationship between in situ salinity and c was obtained from hydrographic cruises (1998, 2003–2018, and 2021). Second, in situ c was matched with GOCI remote-sensing reflectance (Rrs) band ratios of all available blue-to-green wavelengths (2011–2018). Finally, satellite-derived surface salinity was determined directly by combining the two empirical relationships, providing a robust estimate over a range of salinities (22–34 psu). Our algorithm was then compared and validated with five previous satellite-derived salinity algorithms based on colored dissolved organic matter and particle concentrations. In the first step, surface salinity was matched and well correlated with c using an 18-year full conductivity–temperature–depth (CTD) dataset (N = 1,345, R2 = 0.93). In the second step, c was synchronously matched and well correlated with GOCI Rrs band ratios using an 8-year summer CTD dataset (N = 391, R2 = 0.93). The satellite-derived surface salinity based on the GOCI was compared with five other approaches and validated using an 8-year summer CTD dataset (2011–2018, N = 707, RMSE = 0.43, bias = 0.053, mean ratio = 1.002). We mapped satellite-derived surface salinity using monthly GOCI images during the summer from 2011 to 2020. The spatial patterns of the CDW were connected to the Changjiang River mouth and extended to the east–northeast during summer. Saline water was confined to the warm current and the upper slope in the eastern part of the study area. Anomalous dispersion of the CDW occurred in August 2016, 2017, and 2020, and limited dispersion occurred in August 2014 and 2019.
Introduction
The East China Sea (ECS) is a continental marginal sea in the Western Pacific that interacts with various surface water systems, including freshwater from the Changjiang River, Kuroshio, and Taiwan Warm Current. The Changjiang River (also called the Yangtze River) is the third largest river in the world based on length (6,300 km) and the fifth largest based on discharge (Beardslev et al., 1985). The Changjiang River Discharge (CRD) shows large seasonal and interannual changes. It discharges into the ECS and Yellow Sea (YS) as a major freshwater source and forms the Changjiang Diluted Water (CDW) by mixing with saline ambient waters. In winter, the CDW flows south or southeastward due to the dominant northeasterly wind. In summer, the CDW extends eastward from western Jeju Island to the Korea/Tsushima Strait due to the prevailing southerly wind and the increasing CRD (Chang and Isobe, 2003; Lie et al., 2003; Senjyu et al., 2006), which takes 1–2 months to travel from the Changjiang River mouth to the Korea/Tsushima Strait (Kim et al., 2009b; Yamaguchi et al., 2012). In August 1996, the CDW (< 20 psu) passed about 50 km west of Jeju Island, causing widespread death of coastal wildlife (economic damage: US$600 million). In August 2016, abnormally low-salinity and high sea surface temperature waters were observed along the coast of Jeju Island (Moh et al., 2018; Moon et al., 2019). Anomalous sea surface warming during the summer in the ECS is associated with the dispersion of the CDW, forming a boundary layer that enhances vertical stratification and reduces vertical mixing (Park et al., 2011; Park et al., 2015; Moh et al., 2018; Moon et al., 2019). However, the CDW plays an important role in sea surface warming (Park et al., 2011; Park et al., 2015; Moon et al., 2019) and exerts a considerable effect on the oceanographic and ecological environment in the ECS, including the coast of Jeju Island, Korea. Previous studies have found that the extensive CDW corresponds with higher particle concentrations during summer, suggesting the possibility of determining the relationship between the CDW and the particle load from field measurements and satellite data (Kim et al., 2009b; Moh et al., 2018).
The ability to determine surface salinity from satellite data may significantly aid physical, chemical, and biological oceanography research. Salinity generates no optical signal and is therefore difficult to measure using ocean color satellite images. The Aquarius satellite is designed to measure salinity from space using microwave sensing (Wentz and LeVine, 2012). After the launch of the Aquarius, many satellite sensors, including the Soil Moisture and Ocean Salinity (SMOS) and Soil Moisture Active Passive (SMAP) sensors, were developed to improve salinity estimates from space. Although this was a major step forward, the spatial and temporal resolutions (25–100 km, 5–7 days) were too coarse to observe small mesoscale features, the sensors could not be used close to land, and the data had to be calibrated using in situ measurements. The spatial and temporal coarseness of measurements has limited our ability to monitor the rapidly changing ocean environment in the ECS.
In many previous studies, colored dissolved organic matter (CDOM) signals provided a reliable indicator of river plumes and low-salinity water conditions in coastal areas (Binding and Bowers, 2003; Ahn et al., 2008; Sasaki et al., 2008; Bai et al., 2013). The optical parameters derived from satellite-based remote-sensing reflectances (Rrs), such as CDOM and detritus, are difficult to quantify individually but provide a c response term when combined (absorption coefficient of detritus/gelbstoff (adg)) (Roesler and Boss, 2005; Siegel et al., 2005b). Particles and CDOM may be useful proxies for detecting low-salinity water. However, particulate matter (PM) and CDOM in the water column cause light attenuation due to absorption and scattering and can be used to detect and monitor river plumes or water quality based on in situ observations and ocean color satellite studies (Binding and Bowers, 2003; Ahn et al., 2008; Sasaki et al., 2008; Choi et al., 2012; Son et al., 2012; Bai et al., 2013; Moh et al., 2018; Choi et al., 2021). Several previous studies have shown a correlation between salinity and CDOM (Binding and Bowers, 2003; Ahn et al., 2008; Sasaki et al., 2008; Bai et al., 2013) and between salinity and particles or chlorophyll-a (Kim et al., 2009b; Son et al., 2012; Choi et al., 2021), thus allowing the estimation of satellite-derived salinity. Moh et al. (2018) observed a loaded sediment plume extending eastward along the shelf from the Changjiang River to Jeju Island via in situ and satellite data obtained within the CDW. Beam attenuation due to particles has been studied using in-water transmissometer measurements (Gardner et al., 1993; Chung et al., 1998); it is well correlated with PM and particulate organic carbon (POC), and thus with satellite observations (Mishonov et al., 2003; Gardner et al., 2006; Son et al., 2009a; Son et al., 2009b; Son et al., 2012). Detecting salinity using PM (including organic and inorganic matter and perhaps CDOM) is more useful for tracing the CDW in the offshore ECS than focusing solely on the relationship between CDOM and low-salinity water.
In the present study, we identified the limitations of previous approaches for detecting the CDW, including their use of different satellite sensors, regions, and/or salinity ranges. We aimed to develop an effective salinity detection algorithm in the ECS based on satellite data (e.g., Geostationary Ocean Color Imager (GOCI) data) by comparing salinity estimates with in situ measurements and compared our approach with five existing salinity algorithms.
Material and methods
Shipboard data
Surface salinity and temperature data obtained from conductivity–temperature–depth (CTD) casting were collected from the National Institute of Fisheries Science (NIFS, http://www.nifs.go.kr/kodc.eng/eng_soo_list.kodc). Data were collected during the serial hydrographic cruises carried out around the ECS four to six times per year and during the hydrographic cruises by the Korea Institute of Ocean Science and Technology (KIOST) in the ECS (Table 1). Both full hydrographic datasets were collected by a SeaBird CTD sensor at each station (Figure 1). During each CTD cast of the KIOST research survey, the optical beam attenuation (c) was observed synchronously. The c due to particles was measured in the red spectral band (660 ± 10 nm) with a SeaTech 25-cm path length transmissometer using standard protocols (Gardner et al., 2006). The percent transmission (T) was determined and converted to the total beam attenuation coefficient (c) by c = (ln(T))/r, where r is the path length of the transmissometer.
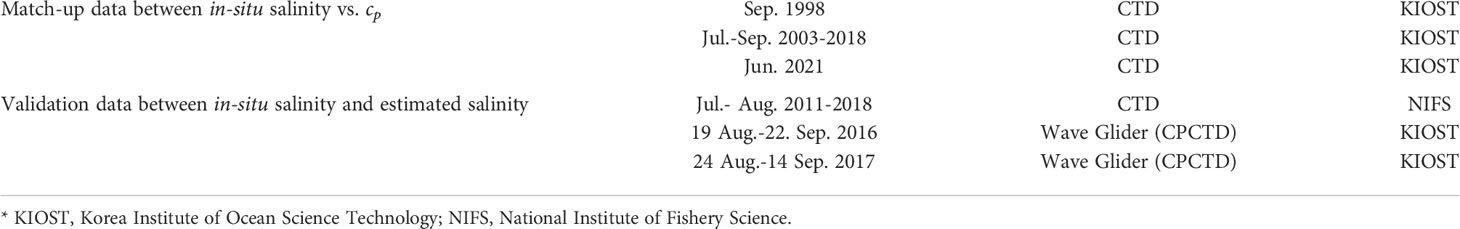
Table 1 In-situ measurement data collected from KIOST and NIFS research cruise.
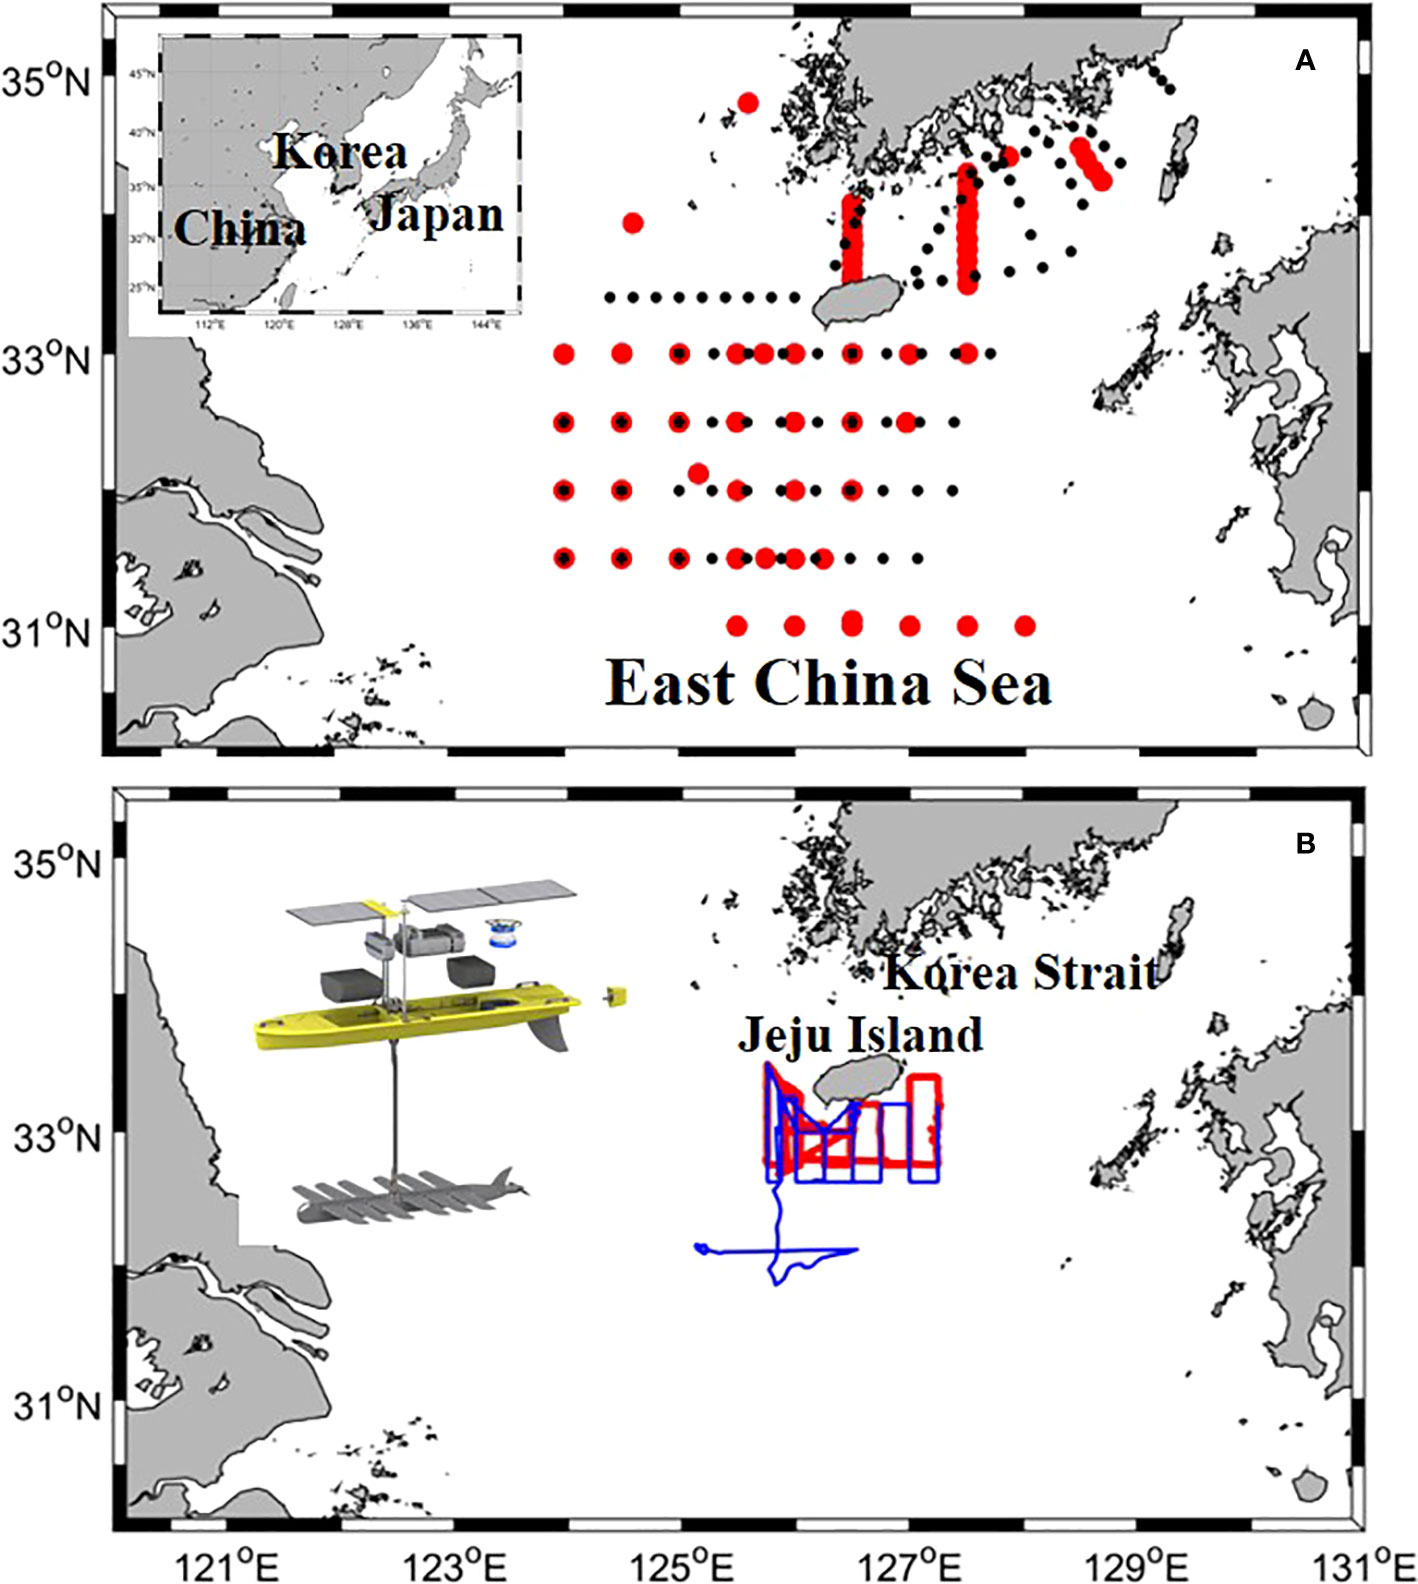
Figure 1 Study area and sampling stations of summer cruises conducted in 1998, 2003–2018, and 2021. (A) Red dots indicate matched in situ and satellite data sampling points; black dots indicate sampling points for validating the model and in situ data. (B) Red and blue lines indicate the sampling lines used for algorithm validation, as observed by wave gliders during the summer of 2016 and 2017.
Both surface salinity datasets used the climatological mean value to understand the spatial distribution of summer salinity in the study area. The surface salinity and c data of KIOST cruises were collected in September 1998, July–September in the period 2003–2018, and June 2021. The surface datasets collected from KIOST research cruises were used to develop a satellite-derived salinity algorithm. The surface salinity data obtained from NIFS cruises in the summer season from 2011 to 2018 were used to validate each method. Another surface salinity validation dataset was collected using a Liquid Robotics Wave Glider SV3 (Moh et al., 2018; Son et al., 2020). A SeaBird Electronics CTD was mounted on a submersible glider at depths of 0 and 8 m. Temperature and salinity were recorded at 30-min intervals and transferred to the Wave Glider management system via the Wave Glider’s Iridium satellite link. The Wave Glider was directed from the west region (low-salinity and high-turbidity water) to the east region of Jeju Island, Korea (high-salinity and low-turbidity water). The Wave Glider was launched from the south of Jeju Island from 19 August to 22 September 2016 and from 24 August to 14 September 2017 (Figure 1). The surface salinity data from NIFS cruises and both Wave Glider deployments were used to validate the satellite-derived salinity algorithm.
Changjiang river discharge
The daily flow rate of the Changjiang River measured at Datong Station (1998–2021) was collected (www.cjh.com.cn) and converted to monthly discharge to understand its variations during summer (Figure 2). The climatological mean values in summer were 40,849 (June), 50,752 (July), and 43,867 (August) m3/s.
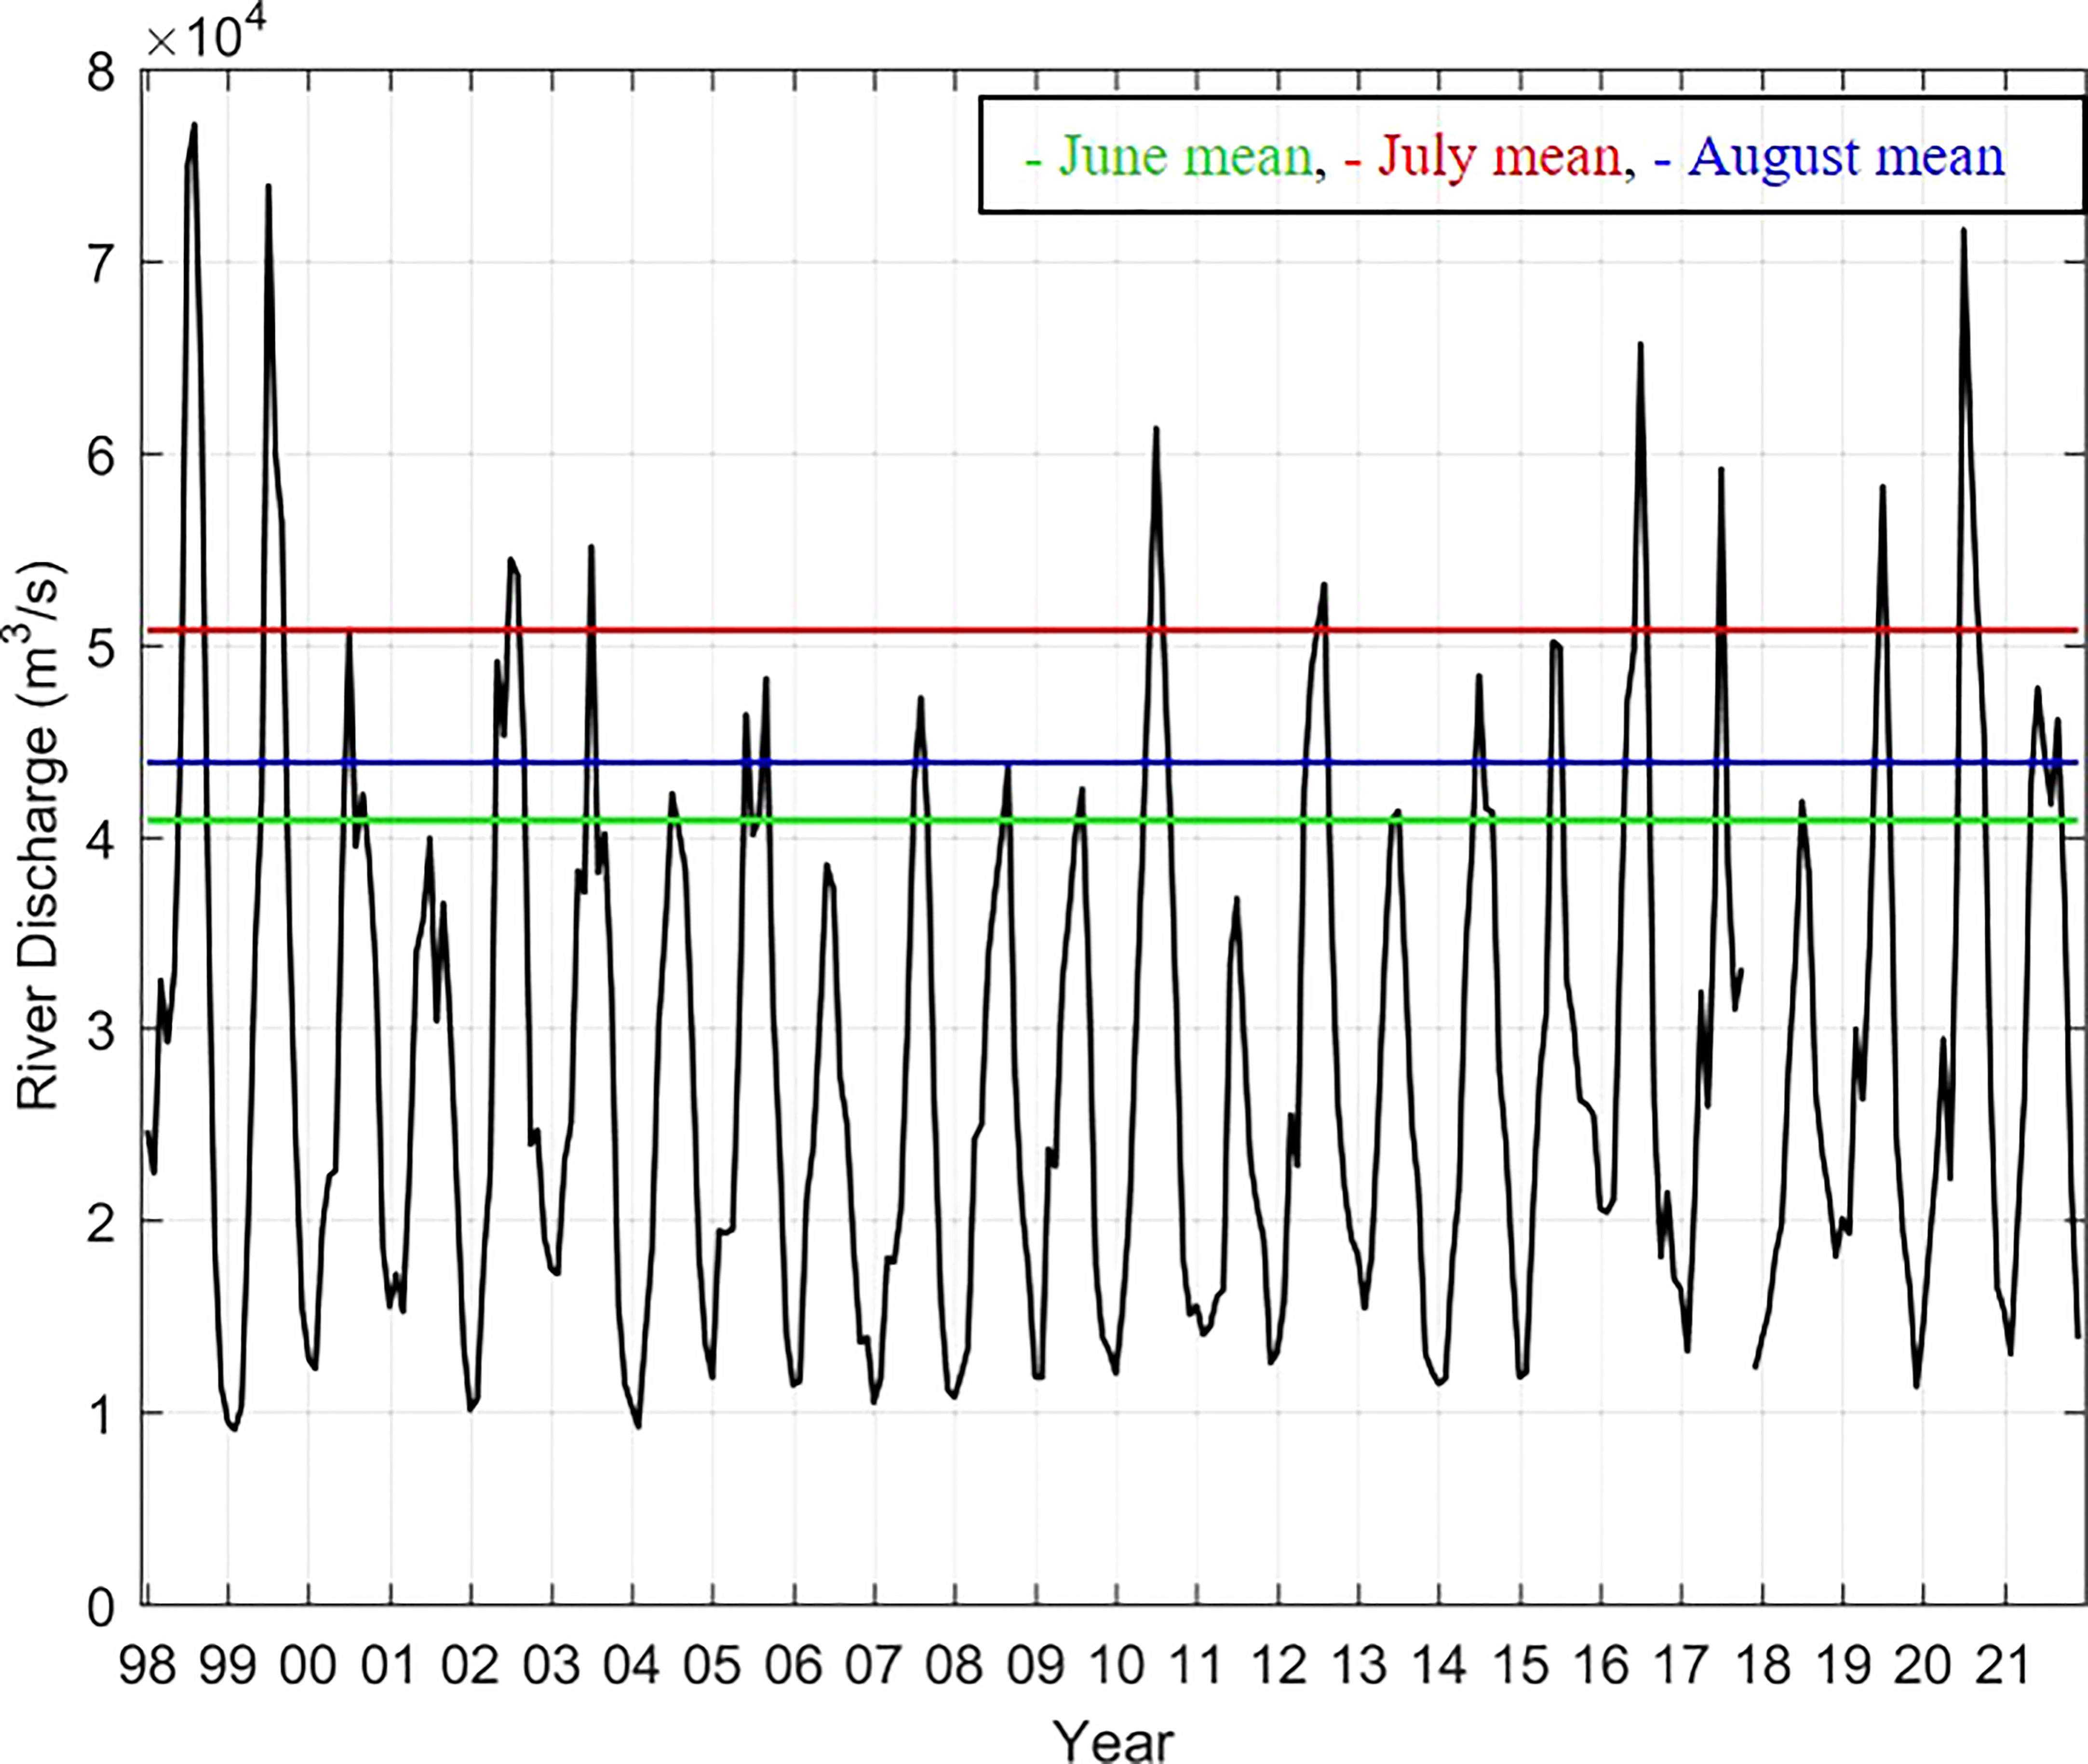
Figure 2 Monthly Changjiang River Discharge (CRD) from 1998 to 2021 (obtained by averaged daily observations).
Satellite data
The Moderate Resolution Imaging Spectroradiometer (MODIS) climatological monthly means (2003–2021, level 3) of the chlorophyll-a and PM covering the ECS were obtained from the NASA Ocean Biology Processing Group (http://oceancolor.gsfc.nasa.gov/) and remapped with a 9-km resolution.
The daily Quick SCATterometer (QuickSCAT) and Advanced SCATterometer (ASCAT) sea surface wind (SSW) data were downloaded from PO.DAAC (http://podaac.jpl.nasa.gov/), and monthly mean values were calculated.
The GOCI, the world’s first geostationary ocean color satellite, was developed to monitor the marine environment and provide prompt and timely warnings of marine hazards. It has six visible bands (412, 443, 490, 555, 660, and 680 nm) and two near-infrared (NIR) bands (745 and 865 nm), and provides images with a 500-m spatial resolution at hourly intervals up to eight times per day in the Northeast Asian region (Ryu and Ishizaka, 2012). Daily GOCI data (level 1b) were collected from the Korea Ocean Satellite Center (KOSC, http://kosc.kiost.ac.kr/) on 1 June and 31 September from 2011 to 2020 (eight images from 09:00 to 16:00 local time each day). GOCI Rrs(λ) data were derived from level 1b data using the standard atmospheric correction algorithm embedded in the GOCI data processing software (GDPS) (Ryu et al., 2012).
A dataset matching in situ c and synchronously obtained GOCI Rrs(λ) was generated. To ensure reasonable matches, Bailey and Werdell (2006) and Son et al. (2009a; 2009b; 2012) suggested that SeaWiFS data be extracted for the locations of ship stations when in situ and satellite measurements are made within a ± 3-h window of local noon (09:00–15:00 local time). However, GOCI provided eight images during the daytime (09:00 to 16:00 local time). In this study, we matched the synchronous time without using a ± 3-h window. Additional conditions for the satellite data were that the matrix size did not significantly degrade the geophysical homogeneity among the pixels used and that >50% of the pixels were free of clouds and other sources of error. A 5 × 5 pixel grid provided sufficient pixels for confidence in the average value, without being so large as to cross parameter gradients. Using these criteria, 391 subsamples (~29.1% of the 1,345 total samples) were matched with GOCI spectral data. GOCI Rrs(λ) was used to determine c and was then correlated with surface salinity using empirical approaches. For error assessment of the present and previous approaches, we used 707 subsamples (391 matched subsamples and 316 surface-salinity subsamples from NIFS and Wave Glider surface salinity).
To develop our satellite-derived salinity estimates in the ECS, we used ocean color data derived from apparent optical properties (remote-sensing reflectance), and then we computed the forward or inverse correlation of the data with in-water constituents. We used a two-step approach to estimate the surface salinity from ocean color satellite data (Binding and Bowers, 2003; Ahn et al., 2008; Sasaki et al., 2008; Son et al., 2012; Bai et al., 2013). The first step was to correlate in situ salinity with in situ parameters (c). The second step was to correlate Rrs band ratios with c, which had a much stronger correlation than PM, POC, and chlorophyll-a (Son et al., 2012). Satellite-derived salinity was then determined by combining these two relationships. A multiple-wavelength approach was used to determine c. Son et al. (2009b) demonstrated that when the surface particle concentration increased, the radiance peak shifted toward longer wave bands. They proposed the maximum normalized difference carbon index (MNDCI), which uses the maximum band ratio among 412, 443, or 490 over 555 nm for SeaWiFS data and regresses the results with the surface concentrations of POC. We used the maximum band ratio among 412, 443, or 490 over 555 nm for GOCI data. Salinity was also calculated from previous studies to provide an error assessment with 707 subsamples (NIFS and Wave Glider CTD data). Five previous approaches for estimating salinity relied on Rrs data to estimate CDOM absorption and particles and then estimated empirical relationships with salinity. Two studies were performed in different parts of the ocean [the Clyde Sea, Scotland (Binding and Bowers, 2003) and the Gulf of Mexico (Son et al., 2012)], and three were conducted in the ECS (Ahn et al., 2008; Sasaki et al., 2008; Bai et al., 2013). The Sasaki et al. (2008) approach used CDOM absorption and total chlorophyll-a (under high and low chlorophyll-a concentration conditions; chl-a > 1.3 and< 1.3 mg m−3) to estimate salinity. Binding and Bowers (2003); Ahn et al. (2008), and Bai et al. (2013) used CDOM absorption, and Son et al. (2012) used particle concentration. However, all previous and new algorithms used two-step approaches for deriving satellites from satellite images. The measurement error of all salinity algorithms was given by the root mean square error (RMSE), the bias, and the mean ratio.
Finally, to determine the offshore CDW in the ECS during the summer season, maps of satellite-derived surface salinity were created and compared in terms of in situ surface salinity and GOCI-derived salinity. Monthly climatological satellite images of salinity were used to understand the annual and interannual variation of the CDW in the ECS over the summer season.
Results and discussion
The spatiotemporal oceanic environment in the ECS
We focused on the summer season (June–August) to examine the temporal and spatial development of the CDW. The MODIS climatological monthly means (2003–2021) of surface chlorophyll-a and PM estimates were used to create distribution maps of the summer seasons for the ECS (Figure 3). The highest chlorophyll-a and PM values were consistently seen on the inner shelf and diminished offshore. During August, moderate chlorophyll-a and PM patches extended into Jeju Island with east- or northeastward plumes. A CDW patch with elevated surface chlorophyll-a and PM values stretched over the shelf from the Changjiang River mouth in the northeast direction. This was related to the increasing river discharge (Figure 2) and change in wind direction (from northerly in winter to southerly and/or southeasterly in summer). The CDW is dispersed in the eastward direction, and salinity gradually increases through mixing with saline ambient waters (Lie et al., 2003; Chang and Isobe, 2005; Senjyu et al., 2006; Kim et al., 2009b; Moon et al., 2019).
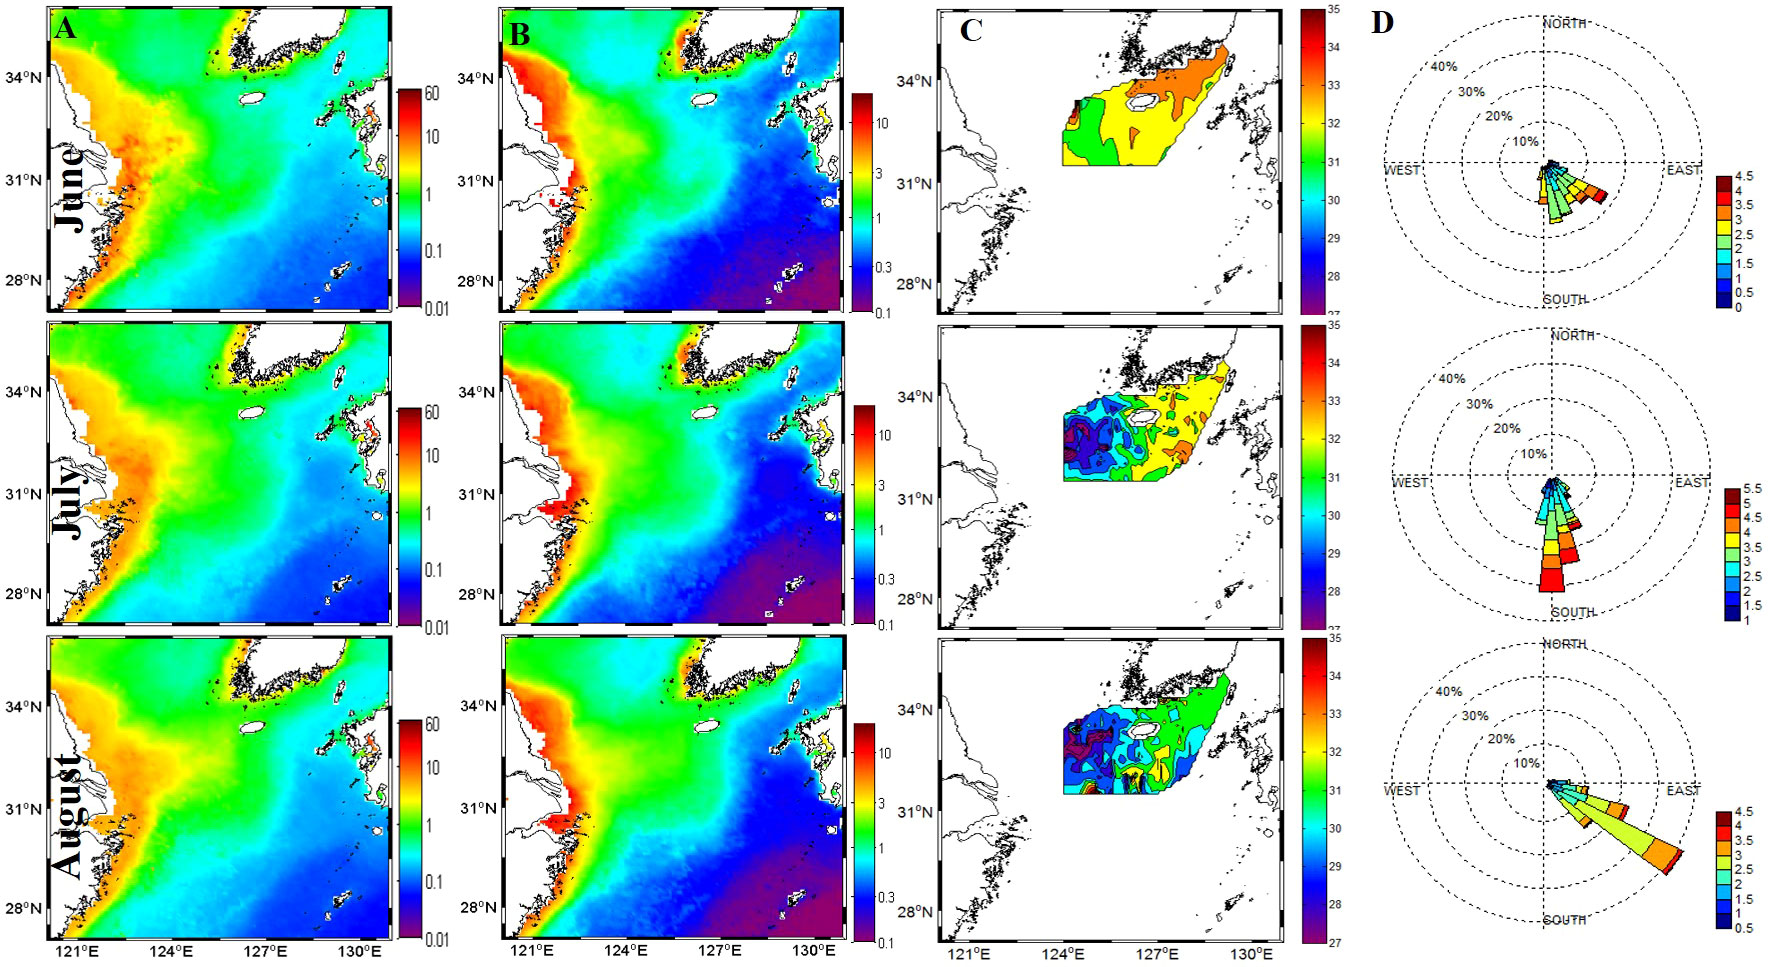
Figure 3 Distributions of (A) chlorophyll-a (mg/m3), (B) particulate matter (g/m3), (C) in situ surface salinity (psu), and (D) sea surface wind (m/s) in the East China Sea in summer.
The CRD showed distinct seasonal variations that peaked in July and reached a minimum in January (Figure 2). The CRD was at its highest during summer in 1998–1999, which is related to flooding events (Delcroix and Murtugudde, 2002). The CRD was at its lowest during the summers of 2006 and 2011, with decreased seasonal variation; these events may have been related to extreme drought conditions and the second impounding of the Three Gorges Dam (TGD) (Dai et al., 2008). The CRD continuously decreased until 2009, following the completion of the TGD, and then slightly increased during July 2010. However, the CRD was at its highest during the summer of 2016 since 1999, although the freshwater was controlled by the TGD. Extreme flooding occurred in mainland China, which increased suddenly in early July and reached >70,000 m3/s. During August 2016, the CRD was also larger than the mean value. Delcroix and Murtugudde (2002) suggested that the anomalous riverine input is linked to anomalous precipitation over large areas of China, resulting in a change in sea surface salinity of about 6 psu and transportation of freshwater over 500 km in the ECS. To determine the influence of the CDW in the ECS, especially the middle ECS and Jeju Island (Figure 1), we used summertime-series data to develop the satellite-derived salinity results.
Validation of a two-step approach based on in situ data
The CRD showed distinct annual cycles, with the highest flow occurring in the summer and the lowest in the winter (Figure 2). The wide range of the CRD led to seasonal variation in the transport of particles to shelf and coastal regions (Figure 3). The fate of surface PM released to the shelf area in the ECS is controlled by wind and physical forcing (Kim et al., 2009b; Moh et al., 2018; Moon et al., 2019). We followed a two-step approach to develop a reliable method for detecting the offshore CDW, focusing especially on the summer seasons and the middle ECS.
Figure 4A shows the relationship between surface salinity and c obtained via 18 yearly summer cruises (in 1998, 2003–2018, and 2021). There were 1,345 data points from >100 sampling stations in the ECS. The surface salinity ranged from 22 to 34 psu, and c from 0.01 to 1.5 m−1, during all summer cruises. The mean, maximum, and minimum salinity values were 30, 34.4, and 22 psu, respectively; those of c were 0.7, 1.5, and 0.01 m−1, respectively. Gong et al. (1996) and Kim et al. (2009a) suggested a definition of the CDW based on water-type classification below 31 psu. We followed this definition in the present study, and qualifying data points comprised ~48% of the total dataset.
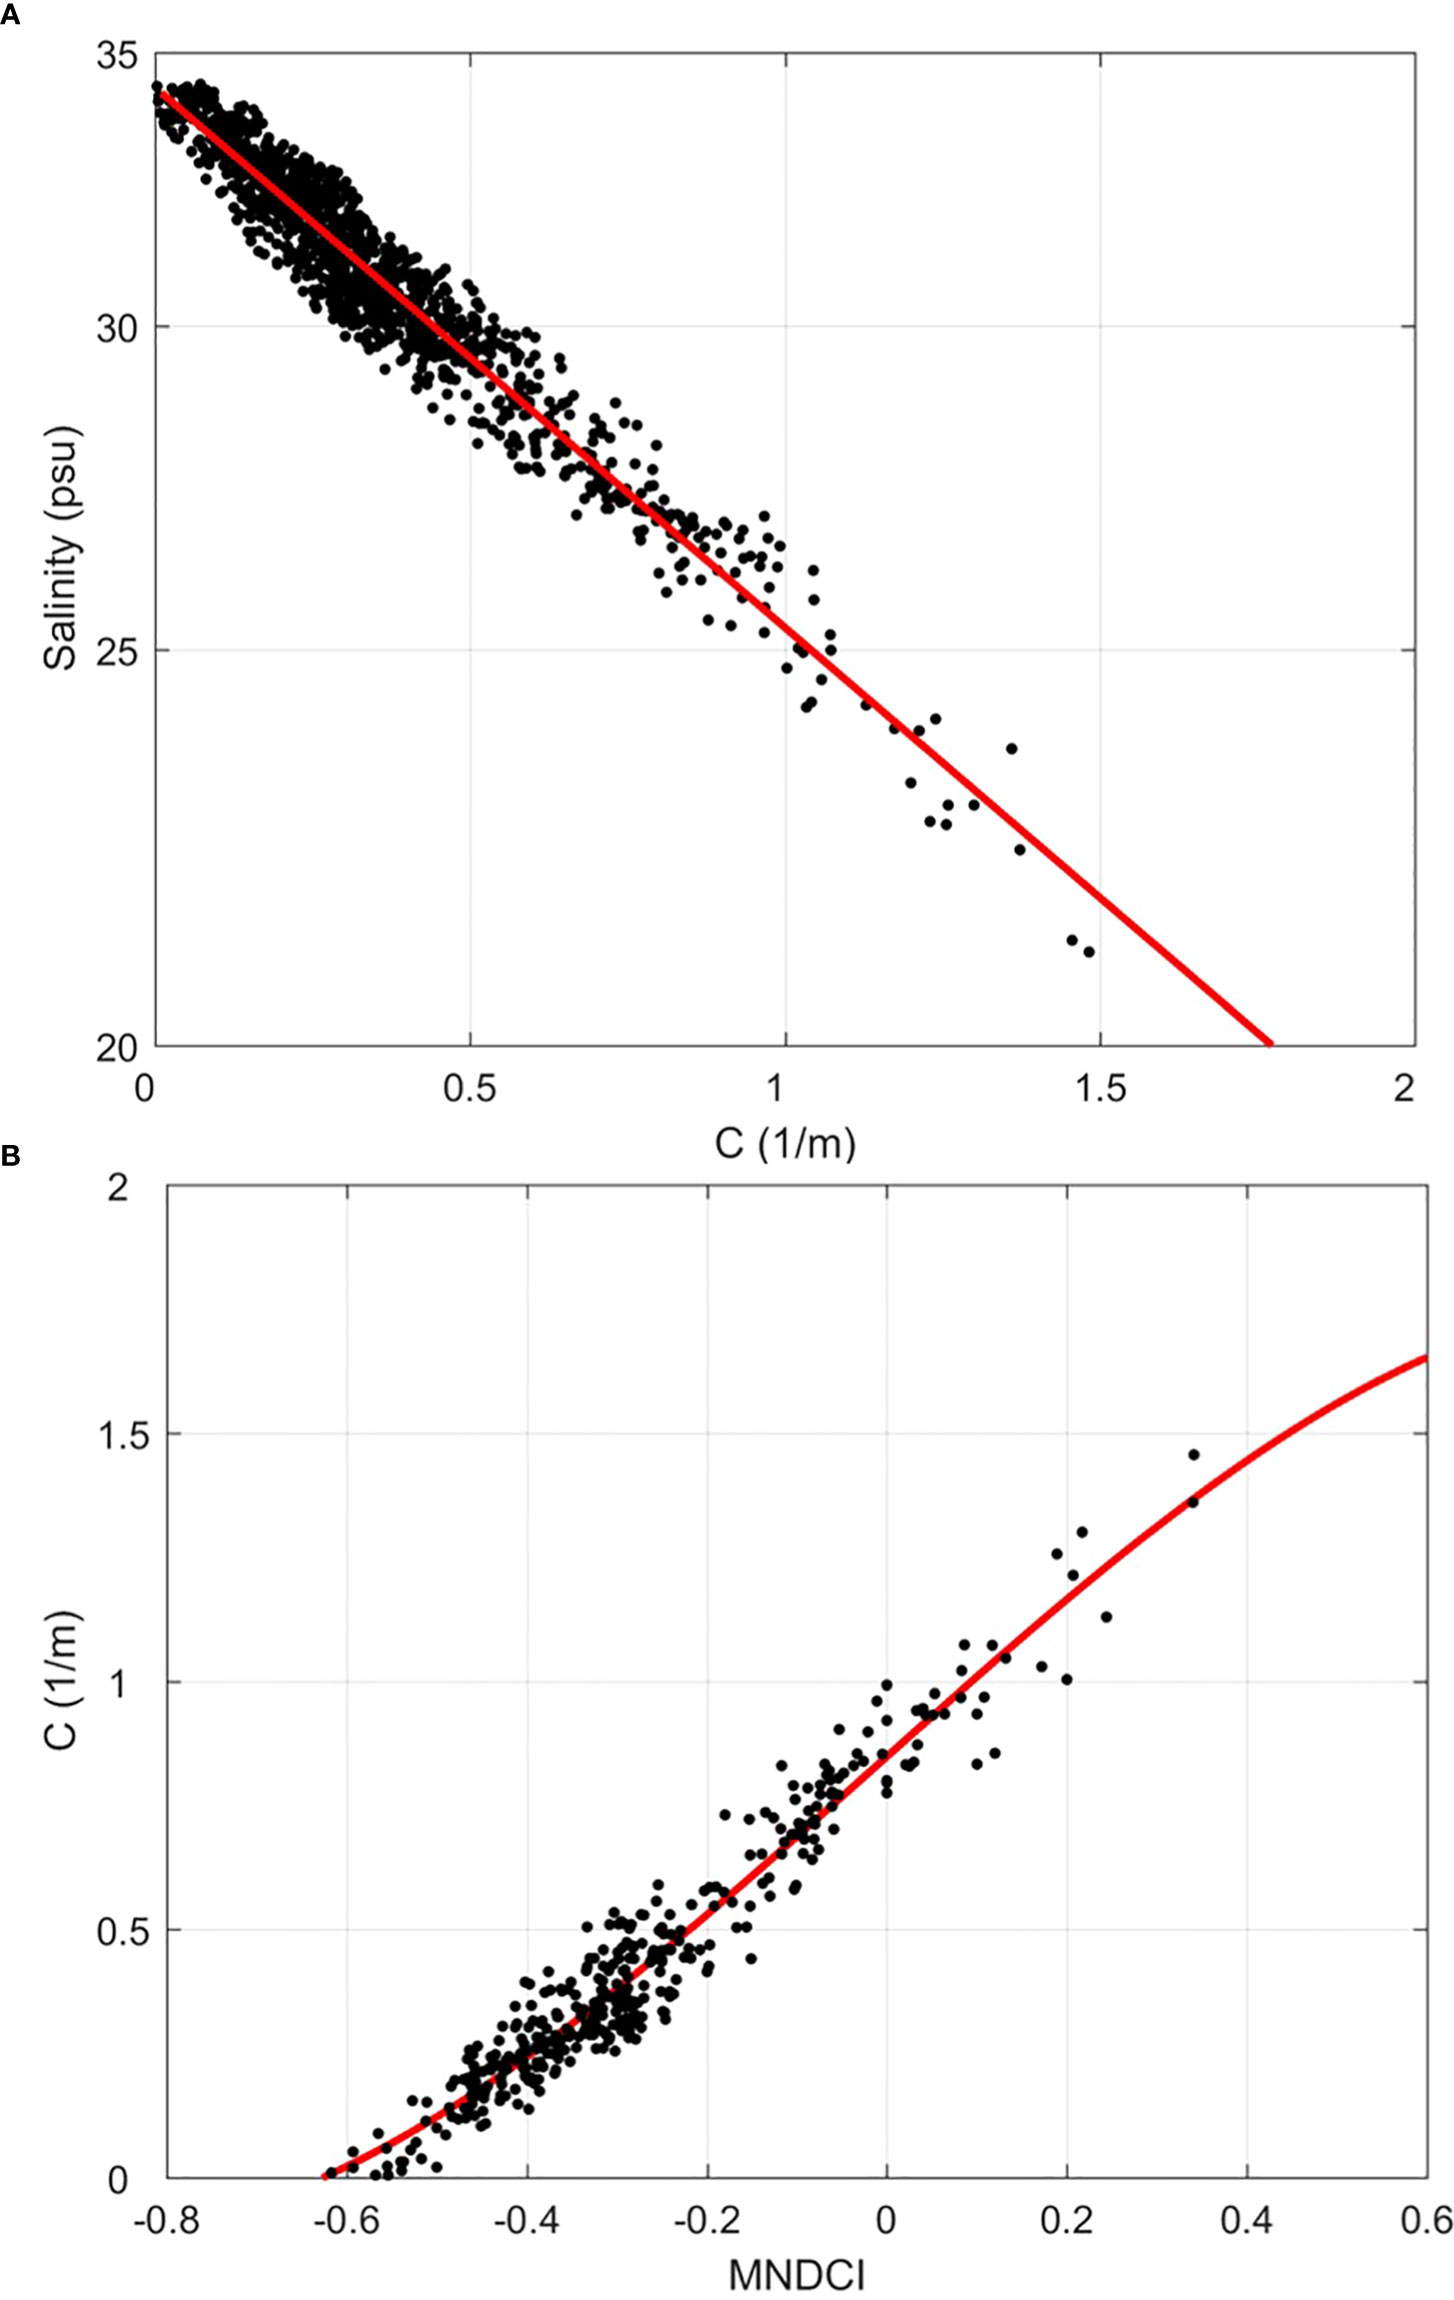
Figure 4 (A) Surface salinity as a linear function of beam attenuation, obtained by analyzing data from 1,345 sampling points during KIOST summer cruises. (B) Least-squares regression between beam attenuation coefficient and the maximum normalized difference carbon index (MNDCI). The MNDCI was calculated from the GOCI Rrs(λ) band ratio within the matched dataset in situ beam attenuation and synchronously obtained GOCI satellite data.
From the 18-year dataset of ECS summer cruises, we were able to assess the relationship between surface c and salinity over a wide range of summer water conditions (22–34 psu). To determine the spatial coverage of this correlation, c and salinity data were used from the middle of the ECS to the south coast of Korea. The resulting regression (Figure 4A) using a logarithmic fit is
Surface salinity was proportional to beam attenuation (Figure 4A, F = 53.9, p< 0.01, R2 = 0.93, N = 1,345). Saline water was accompanied by a lower c, and the CDW was inversely correlated with c during these cruises. The correlations between a proxy of particle concentration (c) and salinity suggested that the concentration of particle-laden water could provide a useful estimate of salinity from space (Kim et al., 2009b; Son et al., 2012). Particle components (PM, POC, and chlorophyll-a) are determined by applying empirical, semianalytical, and/or modeling approaches to ocean color products (Mishonov et al., 2003; Gardner et al., 2006; Son et al., 2009a; Son et al., 2009b). It is reasonable to expect c and salinity to vary widely in the area of the ECS (Figures 3, 4) because the Changjiang River delivers a large mass of particles to the shelf environment, and particulate plumes are widely dispersed along and across the shelf (Moh et al., 2018). Although c varies as a function of the particle size and shape and the index of refraction, as long as the average bulk particle properties remain similar, c is linearly correlated with total PM and/or POC concentrations (Baker and Lavelle, 1984; Chung et al., 1998; Gardner et al., 2006). PM and/or POC sink in the water column individually or through aggregation/feeding. The results of the present study do not distinguish between the salinity of the water with which the plume mixes and the particle concentration of the mixing water. However, the correlation between c and PM showed that the CDW has a higher particle concentration than saline waters (Figure 4A). This suggested that the CDW continued to deliver a fairly homogeneous mix of particles even though their concentrations may vary with the annual- and interannual differences in the CRD (Sasaki et al., 2008; Moh et al., 2018). The sea surface temperature of the CDW in the offshore ECS is increased by sunlight, resulting in a highly stable water column due to the enhanced buoyancy of the low-density surface water and the enhanced stratification of the water column (Moh et al., 2018; Moon et al., 2019). The relationship between the surface in situ c and salinity reflects a linear decrease in particle concentration and a logarithmic decrease in salinity (Figure 4A).
Figure 4B shows the results of a regression between Rrs band ratios versus c, which used a multiple-wavelength approach to produce the MNDCI (Son et al., 2009b; Son et al., 2012, Eq. 2).
The MNDCI uses the band with the highest radiance among 412, 443, and 490 nm to calculate the band ratio, similar to the normalized difference vegetation index (NDVI) for land plants. The use of multiple wavelengths improves the likelihood of distinguishing multiple or shifting radiance peaks resulting from diverse particle types in the water column, thereby strengthening the correlation between the radiance ratio and c. Son et al. (2009b; 2012) compared the MNDCI values to the data from sampling stations where profiles were collected within a ±3-h window of local noon. In the present study, we matched the GOCI Rrs and c data obtained during the daytime without using a time-averaged window. Figure 4B plots the relationship between c and the MNDCI. The CDW covered 60% of the matched dataset, and the regression equation is given as follows:
The multiple band ratio provides a robust means for distinguishing bio-optical regimes according to the concentration range over which each band is dominant (Son et al., 2009b; Son et al., 2012). In this study, the values were directly (but not linearly) proportional to beam attenuation and were fitted with a cubic polynomial (Figure 4B, F = 61.4, p< 0.01, R2 = 0.93, N = 391).
Finally, c was derived for each pixel by using the MNDCI in Eq. 3 and inserting the data into Eq. 1 to estimate salinity. Equation 4 is the combined equation for GOCI-derived surface salinity:
Comparison of the two-step approach with previous salinity remote-sensing algorithms
We calculated the correlations and errors between the measured in situ salinity and the salinity estimated from our analysis and five previous methods using data from stations in the ECS where well-matched c and satellite data were available (Figure 5; Table 2). The RMSE, bias, and mean ratio between the in situ and the estimated salinity were calculated for a quantitative evaluation (Table 2).
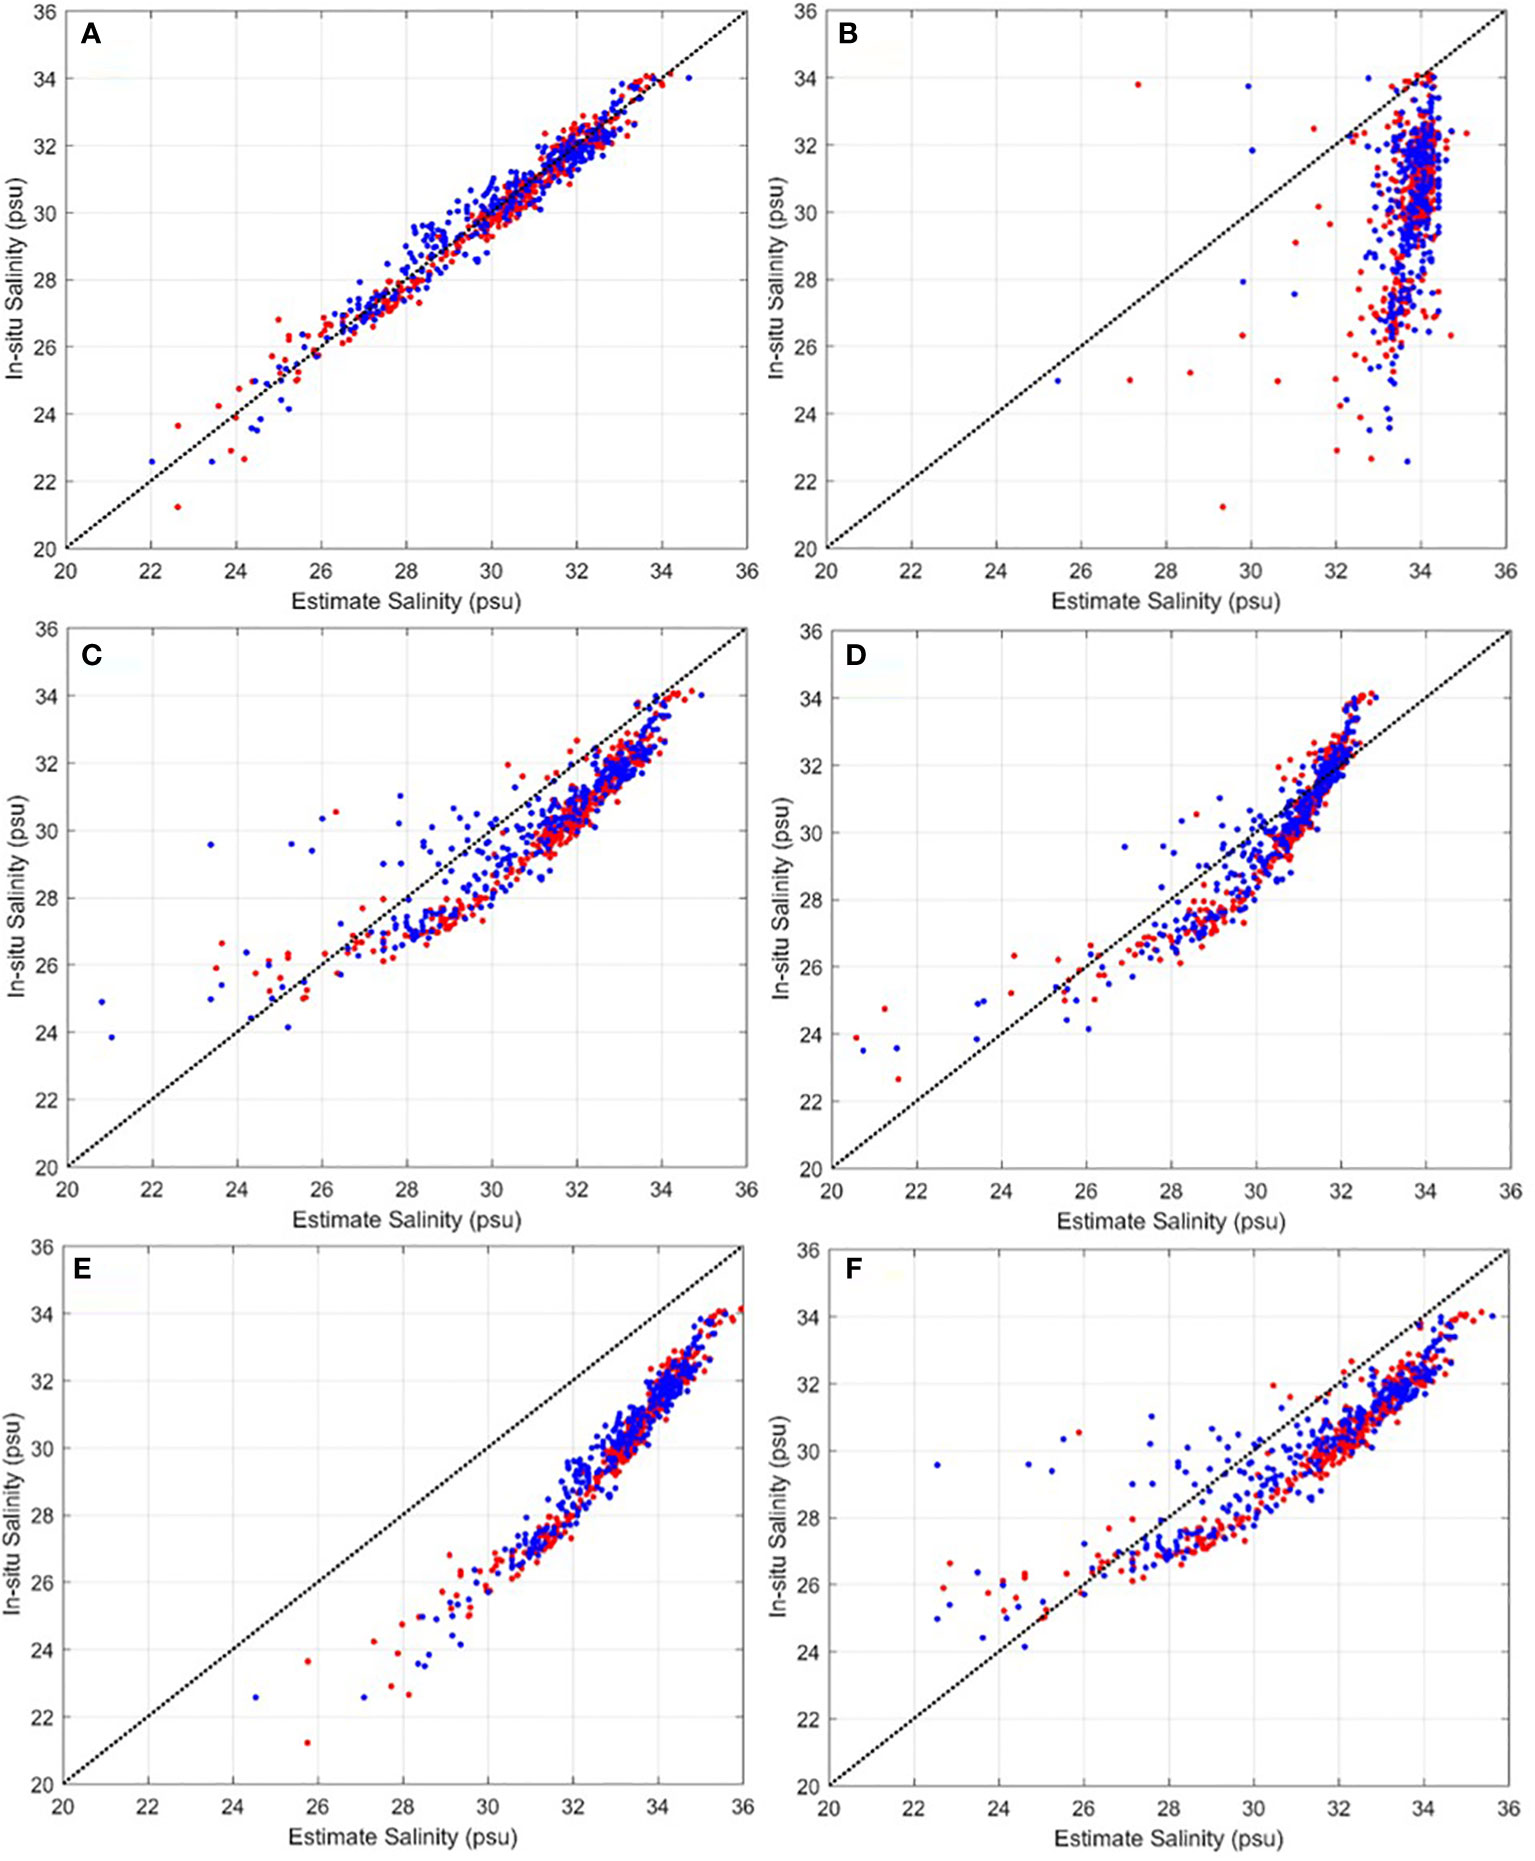
Figure 5 Comparison between in situ salinity and satellite-derived salinity estimated using (A) Eq. 4 and the methods of (B) Binding and Bowers (2003), (C) Ahn et al. (2008), (D) Sasaki et al. (2008), (E) Son et al. (2012), and (F) Bai et al. (2013). Red dots indicate the matched dataset (Figure 4); blue dots indicate the validation dataset, comprising data collected during NIFS and KIOST cruises (Figure 1).
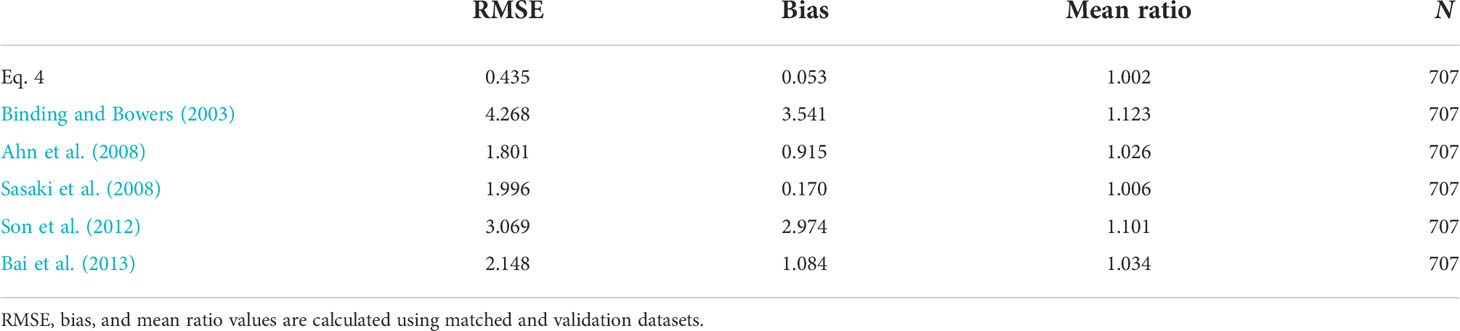
Table 2 Error of in situ and satellite-derived estimated salinity: comparison between the proposed two-step approach and five other approaches.
Using c, the result of Eq. 4 was in strong agreement with in situ data over the various ranges of measured salinity (Figure 5A). The approaches of Binding and Bowers (2003); Ahn et al. (2008); Son et al. (2012), and Bai et al. (2013) overestimated salinity, especially that of Binding and Bowers (2003) at lower salinities in the ECS (Figures 5B, C, E, F). The approach used by Sasaki et al. (2008) underestimated salinity at higher levels and overestimated it at lower levels (Figure 5D). Binding and Bowers (2003) and Son et al. (2012) carried out studies under different regional salinity conditions (in the Clyde Sea, Scotland, and the Gulf of Mexico) and with different satellite sensors. Although Ahn et al. (2008) and Bai et al. (2013) carried out their studies in the ECS, they used different satellite sensors (SeaWiFS and MODIS satellites) and developed their algorithms using coastal data. Sasaki et al. (2008) covered similar regions to the present study but used different satellite sensors (MODIS). Our proposed two-step approach shows that the correlation between salinity and c was much stronger than that between salinity and CDOM or the chlorophyll-a concentration.
The difference between the in situ and estimated salinity is greater in low-salinity waters, which occur in optically complex ocean environments under particle-laden conditions and/or under the influence of CDOM (Baker and Lavelle, 1984; Siegel et al., 2005a; Ahn et al., 2008; Son et al., 2009b; Son et al., 2012). Although CDOM was inversely calculated from ocean color parameters, the correlation with CDOM was not relevant to the present study owing to the lack of in situ CDOM data. An increase in particles leads to increased scatter at visible and NIR bands, whereas an increase in CDOM, chlorophyll-a, or nonliving carbon particles results in decreased radiance at blue wavelengths with little change in scattering, thereby altering the spectral reflectance ratio (Carder et al., 1999; Siegel et al., 2005a). The satellite-derived salinity estimates in the complex ECS were obtained with Eq. 4. GOCI-derived surface salinity estimated by the simple two-step approach exhibits no discontinuities in complex surface salinity conditions (Figure 5; Table 2). The results obtained using c suggest that the use of multiple band ratios was effective in optically complex waters and met the criteria of the proposed two-step algorithm.
The empirical salinity algorithms of the previous and present studies were applied to average GOCI Rrs values during summer cruise periods (16–19 August 2016) to map surface salinity (Figure 6) and a longitudinal line at 33° N (Figure 7). The surface water in the summer of 2016 was loaded with freshwater due to the increased CRD (Figure 2) (Moh et al., 2018; Moon et al., 2019). Cross- and along-shelf export of the CDW from the Changjiang River mouth manifested as patches/plumes, with salinity increasing to the northeast from 26 to 31 psu. Salinities< 25 psu were seen along the Changjiang River estuary, and persistent patches of the CDW extended over Jeju Island, South Korea.
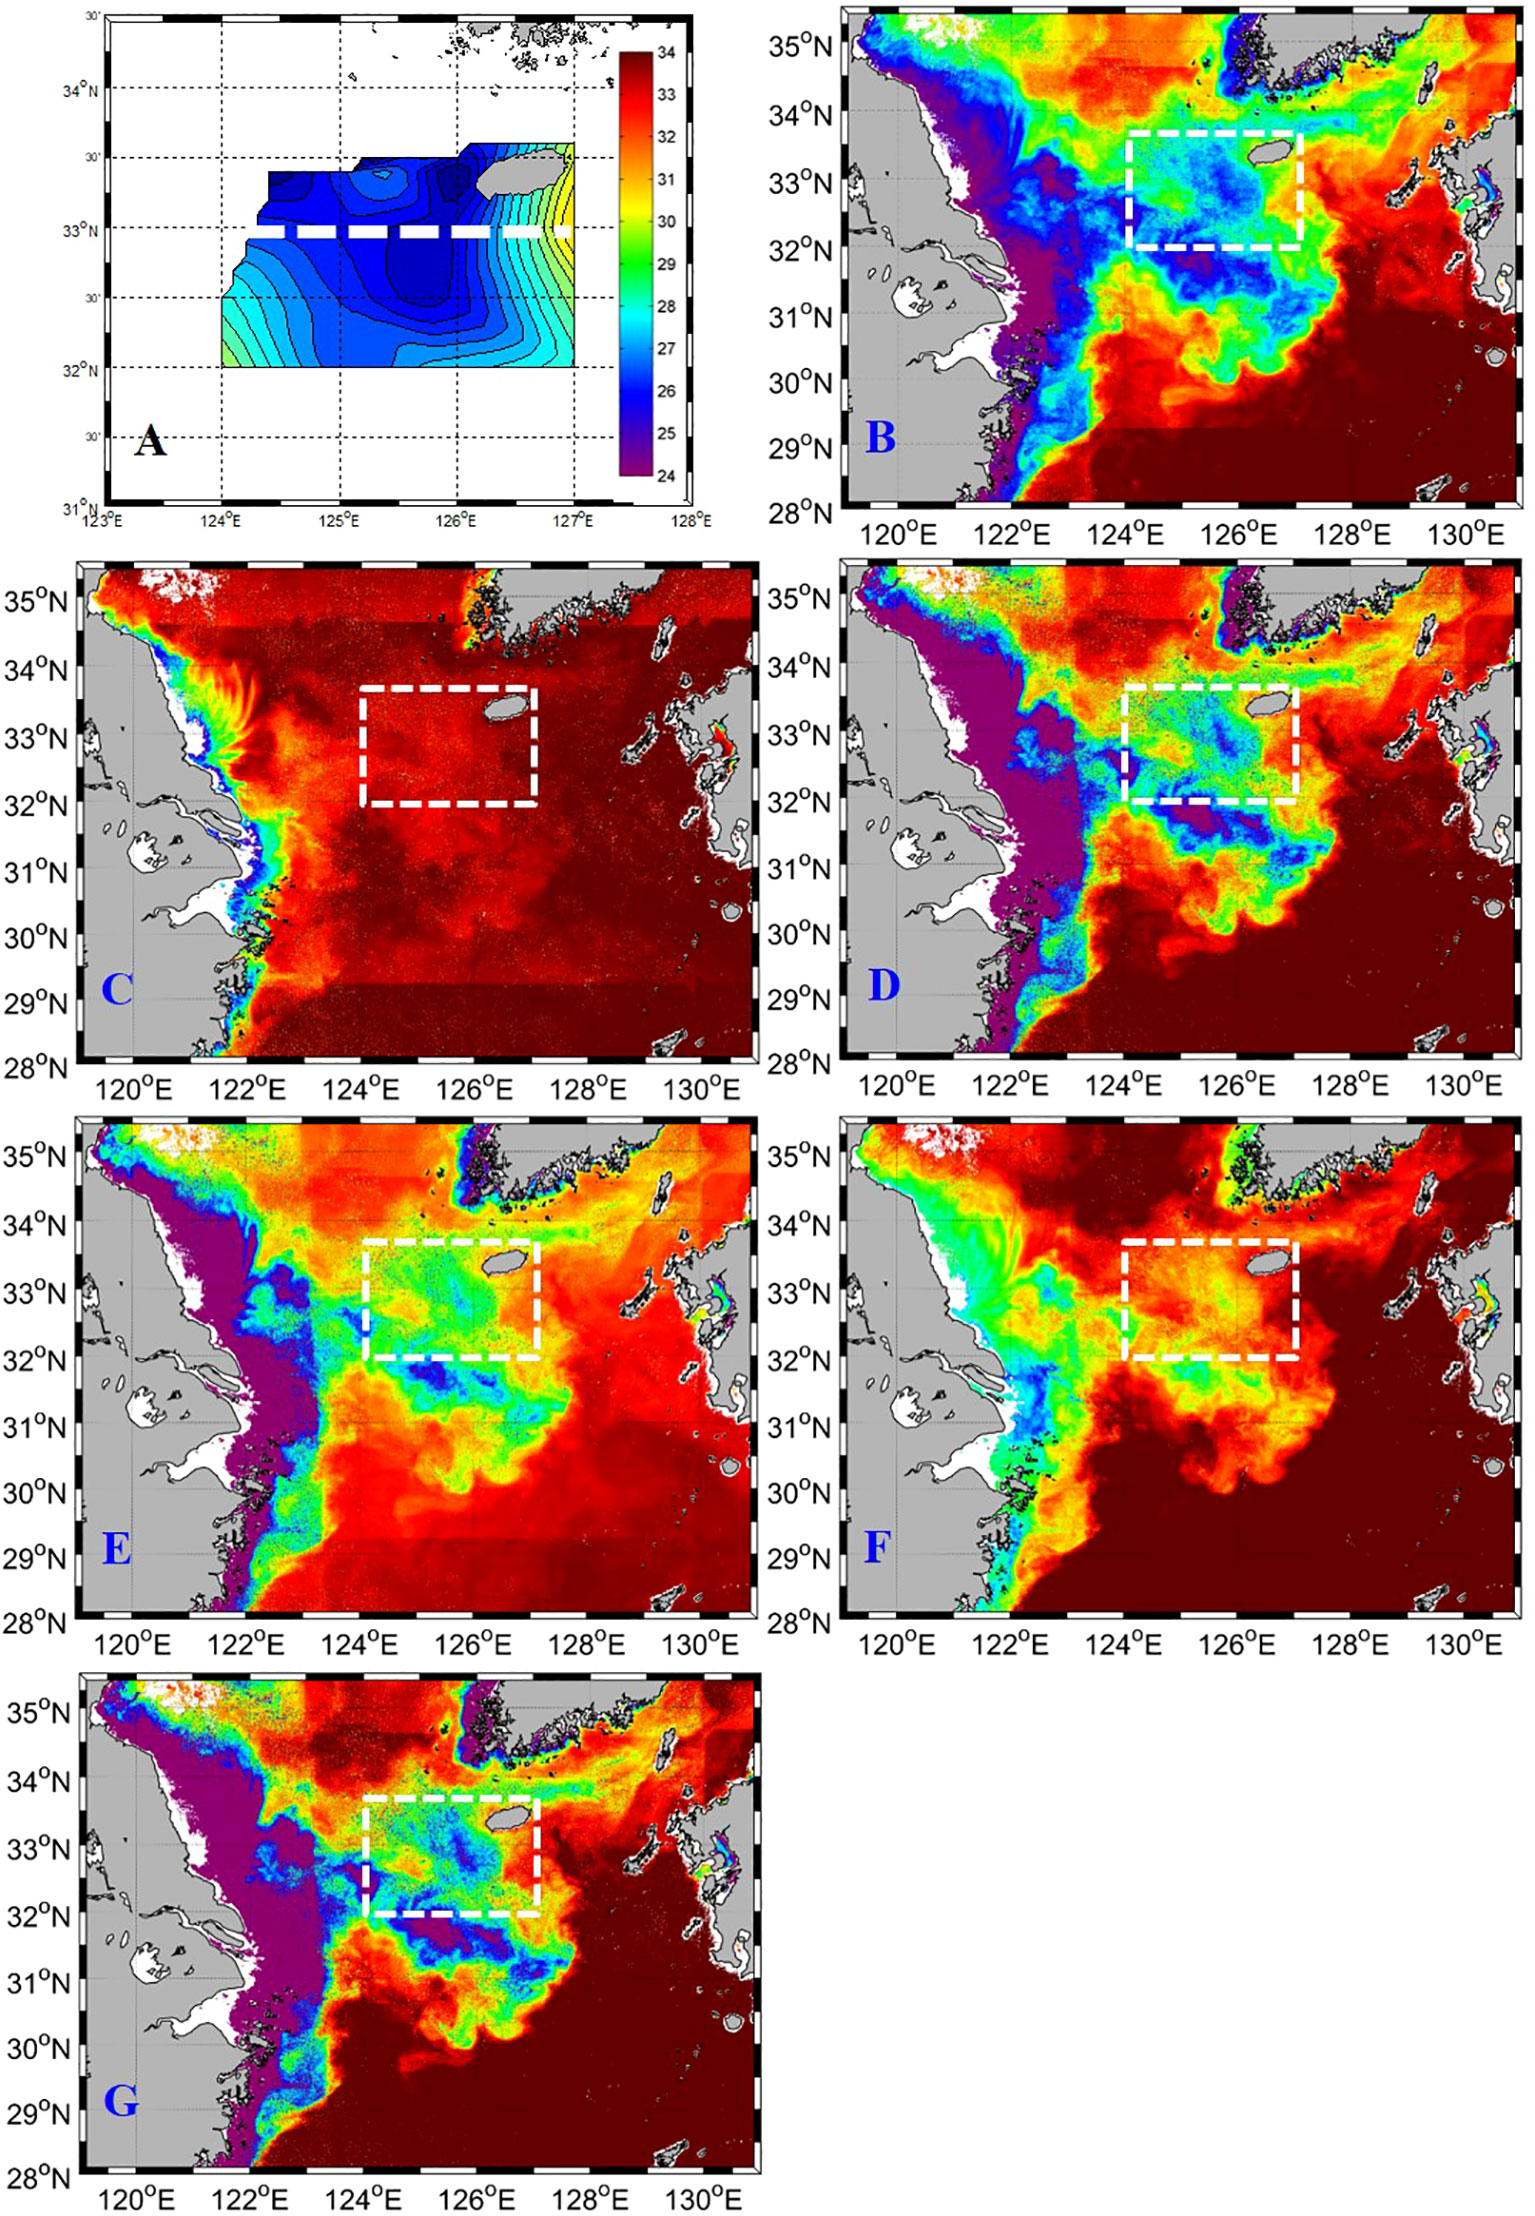
Figure 6 (A) Sea surface salinity (psu) calculated from CTD data obtained during the period 16–19 August 2016. (B–G) Satellite images from which salinity (psu) was calculated using the (B) proposed two-step approach (Eq. 4), as well as the methods of (C) Binding and Bowers (2003), (D) Ahn et al. (2008), (E) Sasaki et al. (2008), (F) Son et al. (2012), and (G) Bai et al. (2013). Data obtained during a 4-day cruise were averaged.
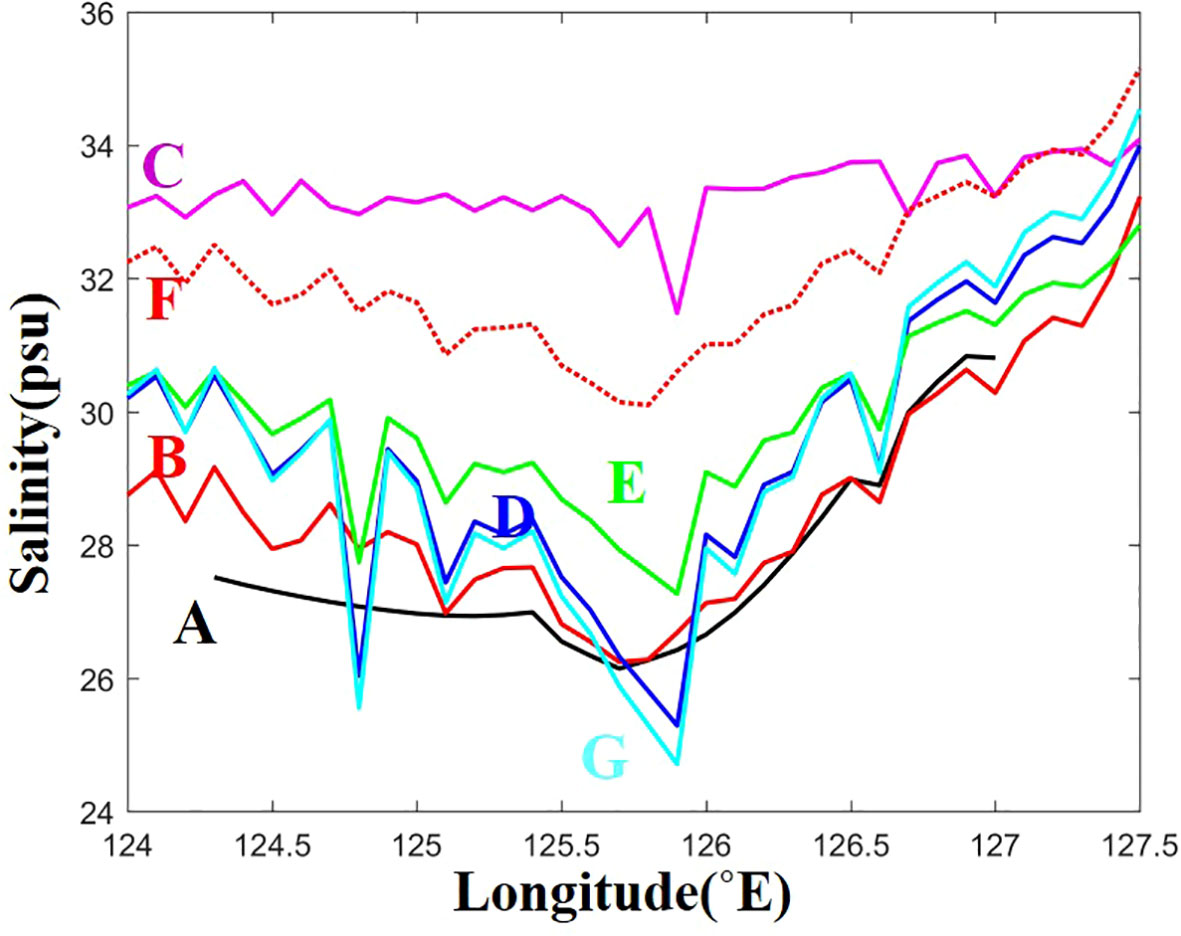
Figure 7 Longitudinal transects of in situ (A) and satellite-derived salinities obtained along 33° N during the 2016 summer cruise (longitudinal lines are shown in (A). (A) In situ salinity and (B) results of the proposed two-step approach (Eq. 4) and methods of (C) Binding and Bowers (2003), (D) Ahn et al. (2008), (E) Sasaki et al. (2008), (F) Son et al. (2012), and (G) Bai et al. (2013). Data were averaged over a 4-day cruise (16–19 August 2016).
All approaches showed similar spatial patterns, but the surface salinity ranges were quite different. Most approaches captured the offshore CDW and clearly showed distinct variations over wide ranges of salinities. The results generated using the approaches of Binding and Bowers (2003) and Son et al. (2012) showed an overestimation of salinity (Figures 6C, F). Surface salinity ranges in the ECS studies (Ahn et al., 2008; Sasaki et al., 2008; Bai et al., 2013) were well correlated with in situ data but slightly overestimated salinity (Figures 6, 7). The present study showed similar spatial patterns to previous methods, but the results were closely correlated with in situ salinity (Figures 6B, 7). From comparison images and crosslines created by the previous and present methods, this study demonstrated that the CDW can be identified using GOCI ocean color data in a two-step approach based on in situ observation data (Figures 6B, 7).
The proposed two-step approach assumed that the particle-loaded plume consisted of low-salinity water, and that clear water had high salinity. The loaded sediment plume determined by satellite and in situ observations was persistent around the Korean and Chinese coasts. Both coastal areas were characterized by variations between low- and high-salinity conditions. Moreover, the settling particles in coastal water and/or offshore water below the mixed layer were not reflected in the surface water column. This influenced the results because satellites observed only the ocean surface and therefore did not provide information on the water below the mixed surface layer. It is difficult to distinguish well-mixed surface water from a low-salinity plume. Therefore, the proposed two-step approach may be less accurate for estimating salinity conditions in coastal regions and well-mixed water. We assumed that there was no particle input from bottom sediment or biogenic production. During summer in our study area, the thermocline was shallow, and biogenic production was low due to a strong stratification. Although satellite-derived data can estimate salinity in coastal areas beyond shipboard stations, we used salinity conditions in the middle of the ECS to obtain matched data to develop the algorithm.
The CDW variability in the period 2011–2020
To elucidate the spatial and temporal variation in the CDW in the ECS, monthly satellite-derived surface salinity maps for the summer season from 2011 to 2020 were derived using Eq. 4. Figure 8 shows the climatological mean value of the satellite-derived surface salinity, which was used to map salinity in the ECS over the summer season. Low-salinity values were found on the inner shelf and near the Changjiang River estuary. When southerly winds prevailed during the summer, the CDW tended to move northeast in the Chinese coastal area and then separated from the coastal zone to travel eastward across the western shelf, reaching the vicinity of Jeju Island. Numerical simulation results also indicated that, during the southerly monsoon in summer, the CDW extends offshore and moves northeastward near Jeju Island to the Korea/Tsushima Strait, whereas about 70% of the CRD flows through the Korea/Tsushima Strait (Chang and Isobe, 2003; Lie et al., 2003; Chang and Isobe, 2005; Senjyu et al., 2006; Moon et al., 2019). The depth of the mixed layer increased from 5 to 15 m with the enhanced water column stratification (Chang et al., 2003; Lie et al., 2003). Park et al. (2011; 2015) noted that the CDW moves into the upper layer of the thermocline during the summer and is enhanced by the formation of a strong barrier layer. In this process, the increase in sea surface temperature was greater as the stratification was enhanced by surrounding waters. Moh et al. (2018) reported that the CDW maintains the particle-loaded water within the mixed layer and those sinking particles are related to the depth of the mixed layer. The spatial distributions of the CDW were similar to those of chlorophyll-a and PM (Figures 3, 8).

Figure 8 Satellite-derived salinities (psu) in (A) June, (B) July, and (C) August calculated using Eq. 4.
Figure 9 shows maps of the monthly satellite-derived surface salinity during the summer in the period 2011–2020. The CDW was present in the middle of the ECS in all years and was mainly transported eastward and northeastward (Figure 9). The dispersion patterns of the CDW might be related to changing wind systems. Chang et al. (2005) and Yamaguchi et al. (2012) noted that the east and northeast movement was driven by the dominant southerly wind and that the south and southeast dispersion was caused by the prevailing northerly wind. The dispersion patterns of the CDW varied from eastward to southeastward in the summers of 2015, 2016, 2018, and 2020, which might be related to changing wind systems.
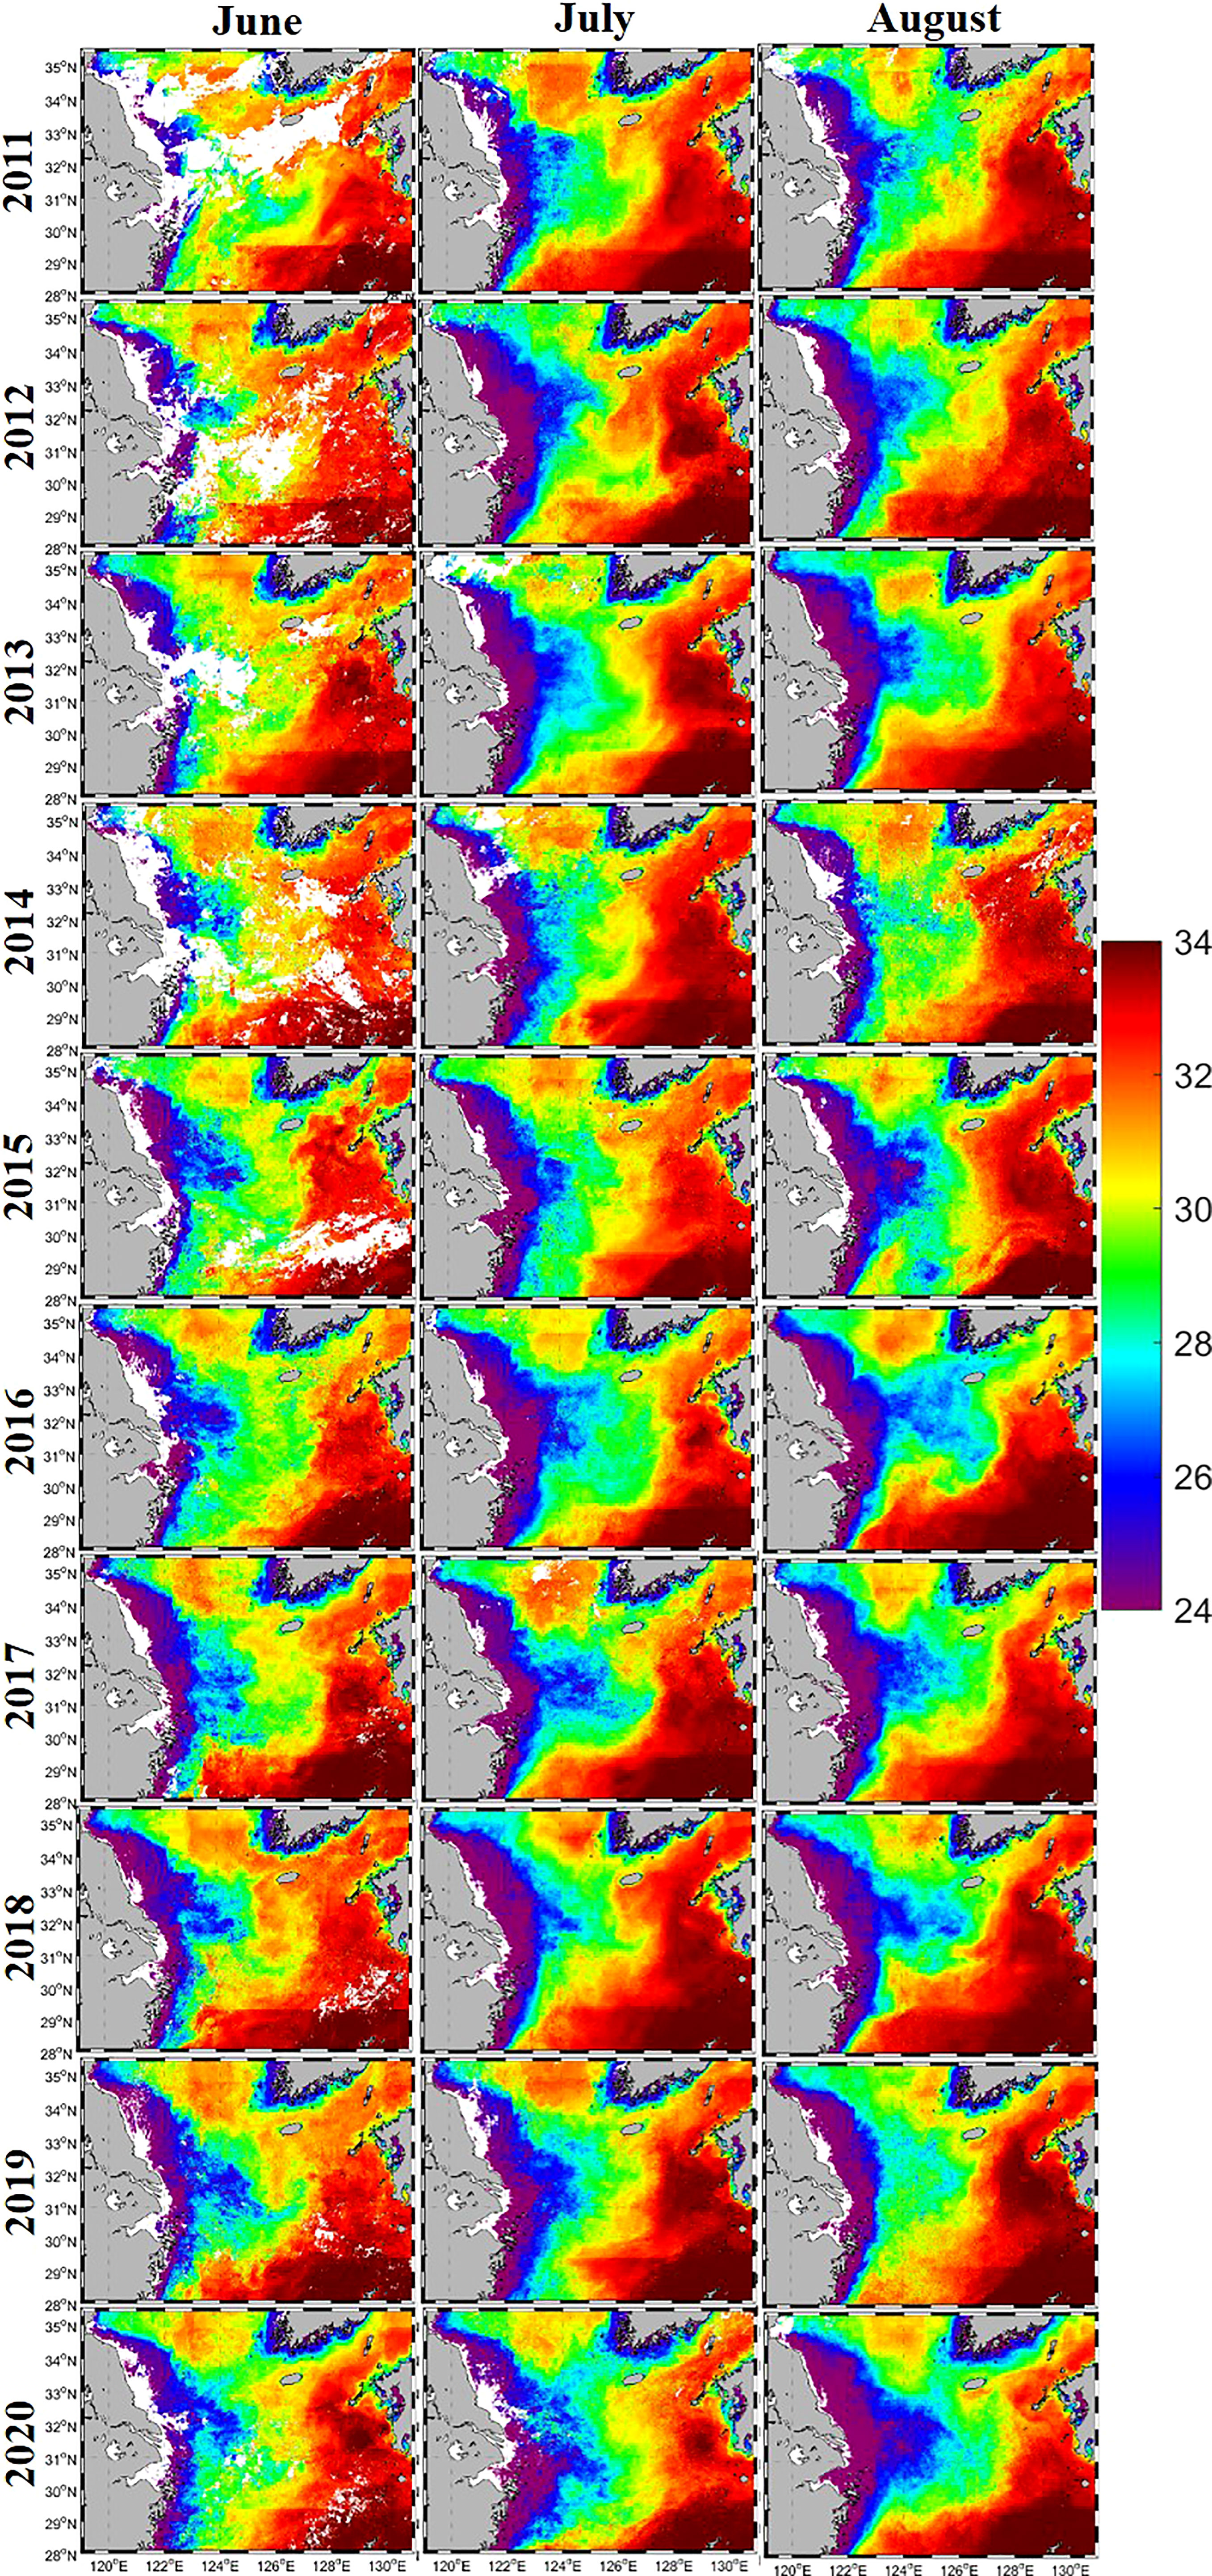
Figure 9 Salinity (psu) calculated from monthly GOCI images using Eq. 4 during summer in the period 2011–2020.
Figure 10 shows the satellite-derived salinity values and anomalies relative to the August mean along 125° E and 127° E from 29° N to 33.5° N. The eastward extension of the CDW appeared in June with increasing CRD and reached Jeju Island and the south coast of Korea after 1–2 months. The CDW dispersed along 125° E in all years (Figure 10A, B), but its dispersal varied along 127° E (Figures 10C, D). Figures 10B, D show that the anomalous CDW in the summers of 2016, 2017, and 2020 loaded freshwater into the offshore ECS, especially in July (Figure 2) (Moh et al., 2018; Moon et al., 2019). These abnormal periods may have been affected by climatological variables (e.g., the El Niño Southern Oscillation (ENSO), East Asia Monsoon, Pacific Decadal Oscillation (PDO), etc.). The ENSO and PDO can increase the summer precipitation and modulate the CRD in the ECS (Park et al., 2011; Park et al., 2015; Wang et al., 2022). Park et al. (2015) supported this premise by establishing a link between summer SST variation and sea surface salinity variation in the ECS, which is known as ENSO-related precipitation. The increased sea surface temperature in August 2016 and 2017 was associated with an absence of typhoons (Moh et al., 2018; Moon et al., 2019; Park et al., 2020; Son et al., 2020). Sea surface temperatures in August 2016 and 2017 were 1.5°C and 1°C higher than normal August temperatures in the ECS, respectively (Park et al., 2020). The CRD had its highest discharge in 2020 within the past 10 years, followed by 2016 and 2017 (Figure 2). Park et al. (2011) suggested that an increased CRD may increase the SST around the Changjiang River mouth. During the summer of 2016, Moh et al. (2018) and Moon et al. (2019) found that the low-salinity plume was linked to increasing sea surface temperature. The increasing CRD might be influenced by the ENSO and PDO and contributed to the extension of the CDW.
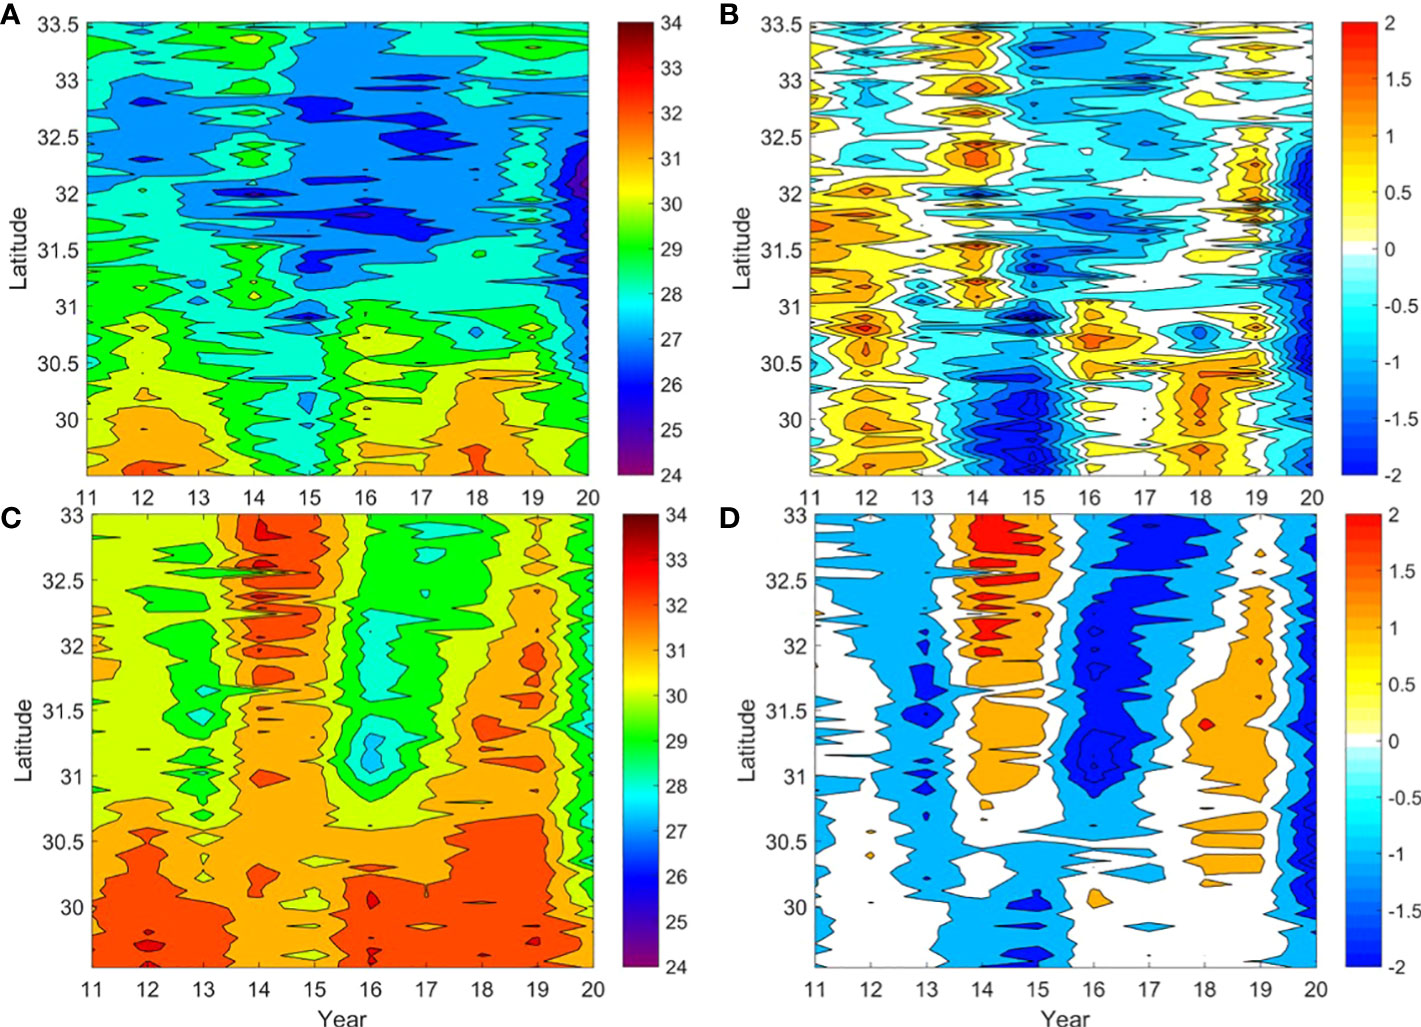
Figure 10 Time series of satellite-derived salinity (pus) (A, C) and anomalous salinity (B, D). Mean values for August in the period 2011–2020 are shown along 125° E (A, B) and 127° E, (C, D) and from 29° N to 33.5° N, as a function of year and longitude. Mean and anomalous values are shown across years to emphasize the annual variation.
The positive anomaly periods in August 2014 and 2019 might be associated with climatological effects and atmospheric forcing (e.g., ENSO, typhoons, and/or the presence of cold air masses). The increase in sea surface salinity during summer in the ECS may be influenced by decreased CRD and/or increasing vertical mixing. Park et al. (2015) showed that the CRD in summer is relatively low in La Niña years compared to the following El Niño year. Park et al. (2020) noted that abnormal surface cooling in August 2014 leads not only to the expansion of the Okhotsk High (low East Asia Monsoon index) but also to passing typhoons. The expansion of the Okhotsk High is caused by a weakening of the northeasterly wind field (Yu et al., 2004). Passing typhoons also cause strong vertical/horizontal advection and cold-water upwelling along the trajectory of the typhoon (Moon and Kwon, 2012; Son et al., 2020). Strong winds increase mixing in saline ambient water and temporally suppress the expansion of the CDW. The combination of climatological and atmospheric effects may limit the dispersion of the CDW in the offshore ECS. In the present study, we ignore interannual variations in the CDW. Recent climatological studies have found that significantly increased precipitation in Chinese territory is related to an interaction between ENSO and the East Asia Summer Monsoon (Gong and Ho, 2003; Yu et al., 2004; Park et al., 2015; Birkinshaw et al., 2017; Wang et al., 2022). The increasing riverine input is linked to abnormal precipitation over large areas of China, which might change the surface salinity over the offshore ECS (Delcroix and Murtugudde, 2002). Further studies are required to understand the relationship between the presence of the CDW and physical factors and the climatological effects of the CRD.
Conclusions
Ocean color remote-sensing studies can provide useful temporal and spatial information on PM, as well as surface salinity in the surface ocean. The GOCI satellite was developed to measure changes in the marine environment eight times per day (with a 500-m spatial resolution) in our study area (Ryu and Ishizaka, 2012). To detect a recurrent low-salinity plume in the ECS, a simple two-step empirical algorithm using GOCI Rrs(λ) was developed based on a large 18-year in situ dataset of satellite-derived surface salinity (in situ salinity and c values). The algorithm showed continuity across salinities of 24–34 psu in the middle of the ECS. The proposed two-step approach was then compared with five other salinity methods based on CDOM and particle concentrations. The errors of previous and present methods were estimated and compared using a matched dataset of in situ salinity and GOCI Rrs values. Previous approaches captured the CDW in the middle of the ECS, but salinity was over- or underestimated. These differences might be due to the different study areas and/or satellite sensors used. Our method was more reliable and sensitive for deriving the correlation between c and multiple spectra of Rrs in the ECS environment than previous methods.
We mapped salinity based on ocean color remote-sensing data, clearly reproducing the distribution of the regional low-salinity plume. Although the satellite-based approach with a regionally tuned algorithm estimated the offshore surface salinity conditions only during the summer, this approach aids the interpretation of salinity patterns in dynamic waters. Our approach enables surface salinity in the middle of the ECS to be monitored hourly. Monthly maps of satellite-derived surface salinity from 2011 to 2020 outlined the interannual motion of the CDW, extending from the coast of China to the shelf in the ECS. Although the presence and dispersion of the CDW were affected by various complex physical factors, regional mapping of summer salinity based on remote-sensing data was useful for understanding and monitoring the dynamics of salinity in the ECS.
Data availability statement
The original contributions presented in the study are included in the article/supplementary material. Further inquiries can be directed to the corresponding author.
Author contributions
Conceptualization: YS and J-KC. Methodology: YS. Data analysis: YS and J-KC. Writing—original draft preparation: YS. Supervision: J-KC. Funding acquisition: YS. and J-KC. All authors contributed to the article and approved the submitted version.
Funding
This research was supported by the Korea Institute of Marine Science and Technology Promotion (KIMIST) funded by the Ministry of Oceans and Fisheries of Korea (Grant Number: PM63010, 2022, and 20220546 (PM63170)) and the “Biogeochemical cycling and marine environmental change studies” funded by the Korea Institute of Ocean Science and Technology (KIOST Grant Number: PEA0012).
Conflict of interest
The authors declare that the research was conducted in the absence of any commercial or financial relationships that could be construed as a potential conflict of interest.
Publisher’s note
All claims expressed in this article are solely those of the authors and do not necessarily represent those of their affiliated organizations, or those of the publisher, the editors and the reviewers. Any product that may be evaluated in this article, or claim that may be made by its manufacturer, is not guaranteed or endorsed by the publisher.
References
Ahn Y. H., Shanmugam P., Moon J. E., Ryu J. H. (2008). Satellite remote sensing of a low-salinity plume in the East China Sea. Ann. Geophys. 26, 2019–2035. doi: 10.5194/angeo-26-2019-2008
Bailey S. W., Werdell P. J. (2006). A multi-sensor approach for the on-orbit validation of ocean color satellite data products. Remote Sens. Environ. 102, 12–23. doi: 10.1016/j.rse.2006.01.015
Bai Y., Pan D. L., Cai W. J., He X. Q., Wang D. F., Tao B. Y., et al. (2013). Remote sensing of salinity from satellite-derived CDOM in the changjiang river dominated East China Sea. J. Geophys. Res. Oceans. 118, 227–243. doi: 10.1029/2012JC008467
Baker E. T., Lavelle J. W. (1984). The effect of particle size on the light attenuation coefficient of natural suspensions. J. Geophys. Res. 89, 8197–8203. doi: 10.1029/JC089iC05p08197
Beardslev R. C., Limeburner R., Yu H., Cannon G. A. (1985). Discharge of the changjiang (Yangtze river) into the East China Sea. Cont. Shelf. Res. 4 (1-2), 57–76. doi: 10.1016/0278-4343(85)90022-6
Binding C. E., Bowers D. G. (2003). Measuring the salinity of the Clyde Sea from remotely sensed ocean color. Est. Coast. Shelf. Sci. 57, 605–611. doi: 10.1016/S0272-7714(02)00399-2
Birkinshaw S. J., Guerreiro S. B., Nicholson A., Liang Q., Quinn P., Zhang L., et al. (2017). Climate change impacts on Yangtze river discharge at the three gorges dam. Hydrol. Earth Syst. Sci. 21, 1911–1927. doi: 10.5194/hess-21-1911-2017
Carder K. L., Chen F. R., Lee Z. P., Hawes S. K., Kamykowski D. (1999). Semianalytic moderate-resolution imaging spectrometer algorithms for chlorophyll-a and absorption with bio-optical domains based on nitrate-depletion temperatures. J. Geophys. Res. 104, 5403–5421. doi: 10.1029/1998JC900082
Chang P. H., Isobe A. (2003). A numerical study on the changjiang diluted water in the yellow and East China seas. J. Geophys. Res. 108 (C9), 3299. doi: 10.1029/2002JC001749
Chang P.-H., Isobe A. (2005). Interannual variation of freshwater in the yellow and East China Sea: roles of the changjiang discharge and wind forcing. J. Oceanogr. 61, 817–834. doi: 10.1007/s10872-006-0002-5
Choi J.-K., Park Y. J., Ahn J. H., Lim H.-S., Eom J., Ryu J.-H. (2012). GOCI, the world’s first geostationary ocean color observation satellite, for the monitoring of temporal variability in coastal water turbidity. J. Geophys. Res. Oceans. 117. doi: 10.1029/2012JC008046
Choi J.-K., Son Y. B., Park M. S., Hwang D. J., Ahn J. H., Park Y. G. (2021). The application of the geostationary ocean color imager to the mapping of sea surface salinity in the East China Sea. Remote Sens. 13 (4), 2676. doi: 10.3390/rs13142676
Chung S. P., Gardner W. D., Landry M. R., Richardson M. J., Walsh I. D. (1998). Beam attenuation by microorganism and detrital particles in the equatorial pacific. J. Geophys. Res. 103, 12669–12681. doi: 10.1029/98JC00608
Dai Z., Du J., Li J., Li W., Chen J. (2008). Runoff characteristics of the changjiang river during 2006: Effect of extreme drought and the impounding of the three gorges dam. Geophys. Res. Lett. 35, L07406. doi: 10.1029/2008GL033456
Delcroix T., Murtugudde R. (2002). Sea Surface salinity changes in the East China Sea during 1997–2001: Influence of the Yangtze river. J. Geophys. Res. Oceans. 2002, 107(C12). doi: 10.1029/2001JC000893
Gardner W. D., Mishonov A. V., Richardson M. J. (2006). Global POC concentrations from in-situ and satellite data. Deep. Sea. Res. II. 53, 718–740. doi: 10.1016/j.dsr2.2006.01.029
Gardner W. D., Walsh I. D., Richardson M. J. (1993). Biophysical forcing of particle production and distribution during a spring bloom in the north Atlantic. Deep. Sea. Res. II. 40, 171–195. doi: 10.1016/0967-0645(93)90012-C
Gong G.-C., Chen Y.-L., Liu K.-K. (1996). Chemical hydrography and chlorophyll-a distribution in the East China Sea in summer: implications in nutrient dynamics. Cont. Shelf. Res. 16, 1561–1515. doi: 10.1016/0278-4343(96)00005-2
Gong D.-A., Ho C.-H. (2003). Artic oscillation signals in the East Asian summer monsoon. J. Geophy. Res. 108 (D2), 4066. doi: 10.1029/2002JD002193
Kim D., Choi S. H., Kim K. H., Shim J. H., Yoo S., Kim C. H. (2009a). Spatial and temporal variations in nutrient and chlorophyll-a concentration in the northern East China Sea surrounding cheju island. Cont. Shelf. Res. 29 (11-12), 1426–1436. doi: 10.1016/j.csr.2009.03.012
Kim H.-C., Yamaguchi H., Yoo S. J., Zhu J., Okamura K., Kiyomoto Y., et al. (2009b). Distribution of changjiang diluted water detected by satellite chlorophyll-a and its interannual variation during 1998-2007. J. Oceanogr. 65, 129–135. doi: 10.1007/s10872-009-0013-0
Lie H.-J., Cho C.-H., Lee J.-H., Lee S. (2003). Structure and eastward extension of the changjiang river plume in the East China Sea. J. Geophys. Res. 108 (C3). doi: 10.1029/2001JC001194
Mishonov A. V., Gardner W. D., Richardson M. J. (2003). Remote sensing and surface POC concentration in the south Atlantic. Deep. Sea. Res. II. 50, 2997–3015. doi: 10.1016/j.dsr2.2003.07.007
Moh T., Cho J. H., Jung S.-K., Kim S.-H., Son Y. B. (2018). Monitoring of the changjiang river plume in the East China Sea using a wave glider. J. Coast. Res. 85, 26–30. doi: 10.2112/SI85-006.1
Moon J. H., Kim T., Son Y. B., Hong J. S., Lee J. H., Lee J. H., et al. (2019). Contribution of low-salinity water to sea surface warming of the East China Sea in the summer of 2016. Prog. Oceanogr. 175, 68–80. doi: 10.1016/j.pocean.2019.03.012
Moon J. H., Kwon S. J. (2012). Impact of upper-ocean thermal structure on the intensity of Korean peninsular landfall typhoons. Prog. Oceanogr. 105, 61–66. doi: 10.1016/j.pocean.2012.04.008
Park T., Jang C. J., Jungclaus J. H., Haak H., Park W., Oh I. S. (2011). Effects of the changjiang river discharge on sea surface warming in the yellow and East China seas in summer. Cont. Shelf. Res. 31, 15–22. doi: 10.1016/j.csr.2010.10.012
Park T., Jang C. J., Kwon M., Na H., Kim K. Y. (2015). An effect of ENSO on summer surface salinity in the yellow and East China seas. J. Mar. Sys. 141, 122–127. doi: 10.1016/j.jmarsys.2014.03.017
Park G. S., Lee T., Min S.-H., Jung S.-K., Son Y. B. (2020). Abnormal sea surface warming and cooling in the East China Sea during summer. J. Coast. Res. 95, 1505–1509. doi: 10.2112/SI95-290.1
Roesler C. S., Boss E. (2005). Spectral beam attenuation coefficient retrieved from ocean color inversion. Geophys. Res. Lett. 30, 1468. doi: 10.1029/2002GL016185
Ryu J. H., Han H. J., Cho S., Park Y. J., Ahn Y. H. (2012). Overview of geostationary ocean color imager (GOCI) and GOCI data processing system (GDPS). Ocean. Sci. J. 47 (3), 223–233. doi: 10.1007/s12601-012-0024-4
Ryu J. H., Ishizaka J. (2012). GOCI data processing and ocean applications. Ocean. Sci. J. 47 (3), 221. doi: 10.1007/s12601-012-0023-5
Sasaki H., Siswanto E., Nishiuchi K., Tanaka K., Hasegawa T., Ishizaka J. (2008). Mapping the low salinity changjiang diluted water using satellite retrieved colored dissolved organic matter (CDOM) in the East China Sea during high river flow season. Geophys. Res. Lett. 35, L04604. doi: 10.1029/2007GL032637
Senjyu T., Enomoto H., Matsuno T., Matsui S. (2006). Interannual salinity variations in the tsushima strait and its relation to the changjiang discharge. J. Oceanogr. 62 (5), 81–692. doi: 10.1007/s10872-006-0086-y
Siegel D. A., Maritorena S., Nel N. B., Behrenfeld M. J. (2005a). Independence and interdependencies among global ocean color properties: Reassessing the bio-optical assumption. J. Geophys. Res. 110, C07011. doi: 10.1029/2004JC002527
Siegel D. A., Maritorena S., Nelson N., Behrenfedl M. J., McCalin C. R. (2005b). Colored dissolved organic matter and its influence on the satellite-based characterization of the ocean biosphere. Geophys. Res. Lett. 32, L20605. doi: 10.1029/2005GL024310
Son Y. B., Gardner W. D., Mishonov A. V., Richardson M. J. (2009a). Model-based remote sensing algorithms for particulate organic carbon (POC) in the northeastern gulf of Mexico. J. Earth Sys. Sci. 1, 1–10. doi: 10.1007/s12040-009-0001-1
Son Y. B., Gardner W. D., Mishonov A. V., Richardson M. J. (2009b). Multispectral remote-sensing algorithms for particulate organic carbon (POC): The gulf of Mexico. Remote Sens. Environ. 113, 50–61. doi: 10.1016/j.rse.2008.08.011
Son Y. B., Gardner W. D., Richardson M. J., Ishizaka J., Ryu J. H., Kim S. H., et al. (2012). Tracing offshore low-salinity plumes in the northeastern gulf of Mexico during the summer season by use of multispectral remote-sensing data. J. Oceanogr. 68 (5), 743–760. doi: 10.1007/s10872-012-0131-y
Son Y. B., Jung S.-K., Cho J. H., Moh T. (2020). Monitoring of the surface ocean environment under a passing typhoon using a wave glider. J. Coast. Res. 95, 168–172. doi: 10.2112/SI95-033.1
Wang Y., Liu S., Chen J., Zhou Z., Shi H. (2022). Investigating the spatiotemporal variations of extreme rainfall and its potential driving factors with improved partial wavelet coherence. Front. Environ. Sci. 10. doi: 10.3389/fenvs.2022.951468
Wentz F. J., LeVine D. (2012). Algorithm theoretical basis document (version 2). Aquarius RSS Technical Report 082912, Aquarius Ground Segment, Goddard Space Flight Center, August 2012. Available at: https://podaac-tools.jpl.nasa.gov/drive/files/allData/aquarius/docs/v2/AQ-014-PS-0017_AquariusATBD_Level2.pdf
Yamaguchi H., Kim H. C., Son Y. B., Kim S. W., Okamura K., Kiyomoto Y., et al. (2012). Seasonal and summer interannual variations of SeaWiFS chlorophyll a in the yellow Sea and East China Sea. Pro. Oceanogr. 105, 22–29. doi: 10.1016/j.pocean.2012.04.004
Keywords: Changjiang Diluted Water (CDW)1, East China Sea2, GOCI3, satellite-derived surface salinity4, Changjiang river discharge5
Citation: Son YB and Choi J-K (2022) Mapping the Changjiang Diluted Water in the East China Sea during summer over a 10-year period using GOCI satellite sensor data. Front. Mar. Sci. 9:1024306. doi: 10.3389/fmars.2022.1024306
Received: 21 August 2022; Accepted: 28 October 2022;
Published: 17 November 2022.
Edited by:
Michael Hartnett, University of Galway, IrelandReviewed by:
Shengqiang Wang, Nanjing University of Information Science and Technology, ChinaKui Wang, Zhejiang University, China
Copyright © 2022 Son and Choi. This is an open-access article distributed under the terms of the Creative Commons Attribution License (CC BY). The use, distribution or reproduction in other forums is permitted, provided the original author(s) and the copyright owner(s) are credited and that the original publication in this journal is cited, in accordance with accepted academic practice. No use, distribution or reproduction is permitted which does not comply with these terms.
*Correspondence: Jong-Kuk Choi, amtjaG9pQGtpb3N0LmFjLmty