 Yunlong Chen
 Xiujuan Shan
 Qingpeng Han
 Harry Gorfine
 Fangqun Dai1
95% of researchers rate our articles as excellent or good
Learn more about the work of our research integrity team to safeguard the quality of each article we publish.
Find out more
ORIGINAL RESEARCH article
Front. Mar. Sci. , 17 October 2022
Sec. Marine Fisheries, Aquaculture and Living Resources
Volume 9 - 2022 | https://doi.org/10.3389/fmars.2022.1024086
Tanaka’s snailfish (Liparis tanakae) is a low-economic but ecologically important fish in the Yellow Sea, which is one of the most threatened marine ecosystems in the world due to environmental changes and human activities. Although it serves as both a dominant species and an apex predator, our knowledge about the long-term changes in the spatio-temporal distribution of this snailfish remains limited in the threatened ecosystem. In this study, by developing eight alternative vector autoregressive spatio-temporal (VAST) models including various combinations of sea surface temperature (SST), fishing pressure (FP) and the density of the prey (DP), we investigated the spatio-temporal distribution patterns of snailfish based on fishery-independent surveys conducted between 2003 and 2019 and examined the relative importance of different covariates. We found that SST was the most important factor in explaining variation in encounter probability and DP was the most important factor in explaining temporal variation in biomass density of snailfish. Surprisingly, incorporation of FP in the spatio-temporal models neither improved explanation of the variance in encounter probability nor biomass density. Based on Akaike’s information criterion, we selected a spatio-temporal model with SST in preference to seven alternative models. The inter-annual distribution range of snailfish was relatively stable whereas the spatial patterns varied over time. In 2003–2006 and 2011, the hotspots of snailfish were widely distributed throughout almost the entire Yellow Sea area. In contrast, in other survey years, especially in 2007–2009, 2015–2016 and 2019, the distribution was more concentrated within the central Yellow Sea. No significant shift in centers of gravity (COGs) was detected for the population. The estimated effective area occupied correlated significantly with biomass density of snailfish (r = -0.71, P< 0.05). Outputs from this study enhanced our understanding of how and the extent to which multiple pressures influence the observed long-term changes in spatio-temporal distribution of snailfish in the Yellow Sea.
Spatio-temporal distribution of biota is of great importance for fully understanding changes in population and community structure, and is particularly vital in developing fishery management and conservation measures (Granger et al., 2015; Kidé et al., 2015; Canales et al., 2018; Shelton et al., 2021). Up to now, most of the studies addressing this issue have focused on economically valued species such as the Atlantic bluefin tuna (Thunnus thynnus, Fromentin et al., 2014); protected/endangered species such as the loggerhead sea turtle (Caretta caretta, Casale et al., 2020) and smalltooth sawfish (Pristis pectinata, Waters et al., 2014); and important forage species such as anchovy (Engraulis ringens, Canales et al., 2018) and the Pacific herring (Clupea pallasi, Godefroid et al., 2019). However, the long-term spatio-temporal distributions of low-economic species in the ecosystem have long been neglected, while changes in these species may have potentially significant effects on population dynamics, community composition, function and biodiversity of the entire ecosystem.
Overfishing, climate change, habitat degradation and pollution are currently important threats to marine ecosystems, leading to a widespread decline in global fishery resources (Gaines et al., 2018; Wilson et al., 2018; Carozza et al., 2019). It is possible that overfishing leads to long-term changes like size reduction, earlier onset of reproductive maturity, and alters population structure, whereas environmental changes impact the distribution and movement of marine species over differing spatiotemporal scales (Issifu et al., 2022). For instance, in the 1960s-1970s extreme spring SST negatively affected the biomass of Pacific herring off the West Coast of Vancouver Island (Godefroid et al., 2019), whereas both overfishing and oceanographic changes impaired rebuilding of the western stock of Atlantic bluefin tuna in the Atlantic Ocean (Fromentin et al., 2014). A study of two species in Mauritanian waters showed that the main influencing variables for sardinella were SST and the upwelling index, whereas chlorophyll-a (Chl-a) concentration, upwelling index, and SST were major factors affecting sardine (Bacha et al., 2017). And there may exist unidentified factors that result in the distribution shift of summer flounder on the Northest U.S. shelf aside from fishing, environmental factors and abundance (Perretti and Thorson, 2019). In general, previous research that focuses on the impacts of multiple pressures on the spatio-temporal distribution of marine species demonstrated distinct region-specific and species-specific characteristics. Considering the differences in geographic areas, ecological properties of species and relative strength of influencing factors, it is necessary to identify and quantify the relative contributions of different influencing factors affecting the spatio-temporal distribution patterns.
As an important fishing region, the Yellow Sea has a diversity of productive fish species, such as the small yellow croaker (Larimichthys polyactis), largehead hairtail (Trichiurus lepturus), Pacific cod (Gadus macrocephalus) and plaice (Cleisthenes herzensteini, Chen et al., 2018). It is also particularly affected by contemporary environmental changes and substantial fishing pressure. For instance, the SST of the Yellow Sea increased by 0.67°C between 1982 and 2006, with an average elevation rate higher than the global average (Belkin, 2009). The concentration of inorganic nitrogen continued to rise, while that of dissolved oxygen decreased (Lin et al., 2005; Li et al., 2015). According to the China fishery statistical yearbooks, the total power of fishing vessels increased steadily from 3.41×10⁶ kW in 2003 to 4.15×10⁶ kW in 2015 after which it began to decrease, reducing to 3.75×10⁶ kW in 2019 (MARA 2003–2020). It is noteworthy that high powered fishing vessels (above 441 kW) accounted for an increasing proportion of total vessel power, especially after 2013, which may exacerbate the adverse effects of environmental impacts on fish population in the Yellow Sea. The Yellow Sea ecosystem has showed rapid responses to the multiple pressures mentioned above, particularly a continual change in fish community structure with frequent replacement of dominant species (Jin and Tang, 1996; Xu and Jin, 2005; Chen et al., 2018). In contrast, Tanaka’s snailfish (Liparis tanakae) has been a dominant species since the 1980s with a relatively stable population size (Chen et al., 2018).
Tanaka’s snailfish is from among the 350 demersal species belonging to the family Liparidae, and grows rapidly to 40 cm TL attaining a weight of 1 kg at one year old (Tomiyama et al., 2013), with individual specimens reaching 56.3 cm and 1.7 kg. It’s of medium resilience with a population doubling time of 1.4–4.4 years (https://www.fishbase.de/summary/Liparis-tanakae accessed on 1-Sep-2022). Oceanodromanous, this snailfish inhabits muddy bottom regions at depths of 50−90 m. In the Yellow Sea, snailfish mainly congregate in waters near Haizhou Bay during summer; migrate to shallower waters inshore for feeding during autumn; then move to deeper offshore regions in the central and southern Yellow Sea for overwintering (Zhou et al., 2012). Scholars have conducted ecological research focusing on seasonal changes in biological characteristics and resource distribution (Tomiyama et al., 2013; Myoung et al., 2016; Chen et al., 2022), trophic level (Zhang et al., 2007), feeding ecology (Zhang et al., 2011), helminth parasites (Guo et al., 2014) and complete mitochondrial genome (Liu et al., 2022). As one of the top predators in the Yellow Sea ecosystem, the snailfish feeds on more than 60 species and plays an important ecological role in regulating the biomass of other species through a top-down effect (Zhang et al., 2011; Lin et al., 2013). It was in this context that a long-term study on the changes in snailfish populations was needed, the absence of which hindered understanding of the functional ecological mechanisms facilitating persistence of its population abundance.
In this study, we sought to answer two main questions about the long-term changes in the snailfish population in the Yellow Sea: (1) ‘What has happened to the spatio-temporal distribution patterns of snailfish under fishing and environmental changes?’, and (2) ‘Among the potential influencing factors, which one is driving the spatio-temporal distribution patterns of snailfish?’. To answer these two questions, we firstly developed eight alternative spatio-temporal models including sea surface temperature (SST), fishing pressure (FP) and density of prey (DP) as explanatory variables, by applying the models to Yellow Sea bottom trawl data from fishery-independent surveys conducted during 2003–2019. The relative importance of SST, FP and DP were evaluated, and the most parsimonious model was identified for further analysis. Next, we explored the spatial patterns of the population, including changes of the centers of gravity (COGs) and effective area occupied (EAU) using the selected spatio-temporal model. Results of this study provide insights about the long-term changes in the spatio-temporal distribution of other low-economic but ecological importantly species in the Yellow Sea under multiple pressures, and can be extended to provide scientific foundations for further conservation and utilization of fish species in similar temperate waters.
Winter was chosen as the study period to effectively reduce the impacts of migration activities of snailfish on the results. Fishery-independent surveys were conducted by the Yellow Sea Fisheries Research Institute (YSFRI) in the Yellow Sea area (123.5°–127°E, 30°–39°N) during winter of 2003–2011, 2015–2017 and 2019. Survey sites were set at a spatial scale of 0.5×0.5 degrees (Figure 1). The number of survey sites varied among years, but with high sampling coverage throughout the Yellow Sea (see Supplementary Table 1). Different survey vessels were involved during the study periods. The research vessel R/V Beidou (56.2 m in length, 12.5 m in width, 5.1 m in draft limitation, 1165 tons in gross tonnage and 2250 horsepower in engine power) was used to conduct the surveys in 2003–2011 and 2015–2017, while the R/V Lanhai 101 (84.5 m in length, 15.0 m in width, 5.0 m in draft limitation, 2783 tons in gross tonnage and 2720 horsepower in engine power) was employed in 2019. The differences in sampling efficiency caused by different vessels were considered in further analysis. The same bottom (demersal) trawl net (836 mesh×12 cm circumference net and a 24-mm cod-end mesh size) was deployed at each site and towed at an average speed of 3 n mile/h for 1 hour in every instance. Snailfish from each site were individually weighed to the nearest gram along with other species in the sample. The biomass density in this paper was defined as the catch in grams per square kilometer (kg/km2) using a swept area method (Teng et al., 2021).
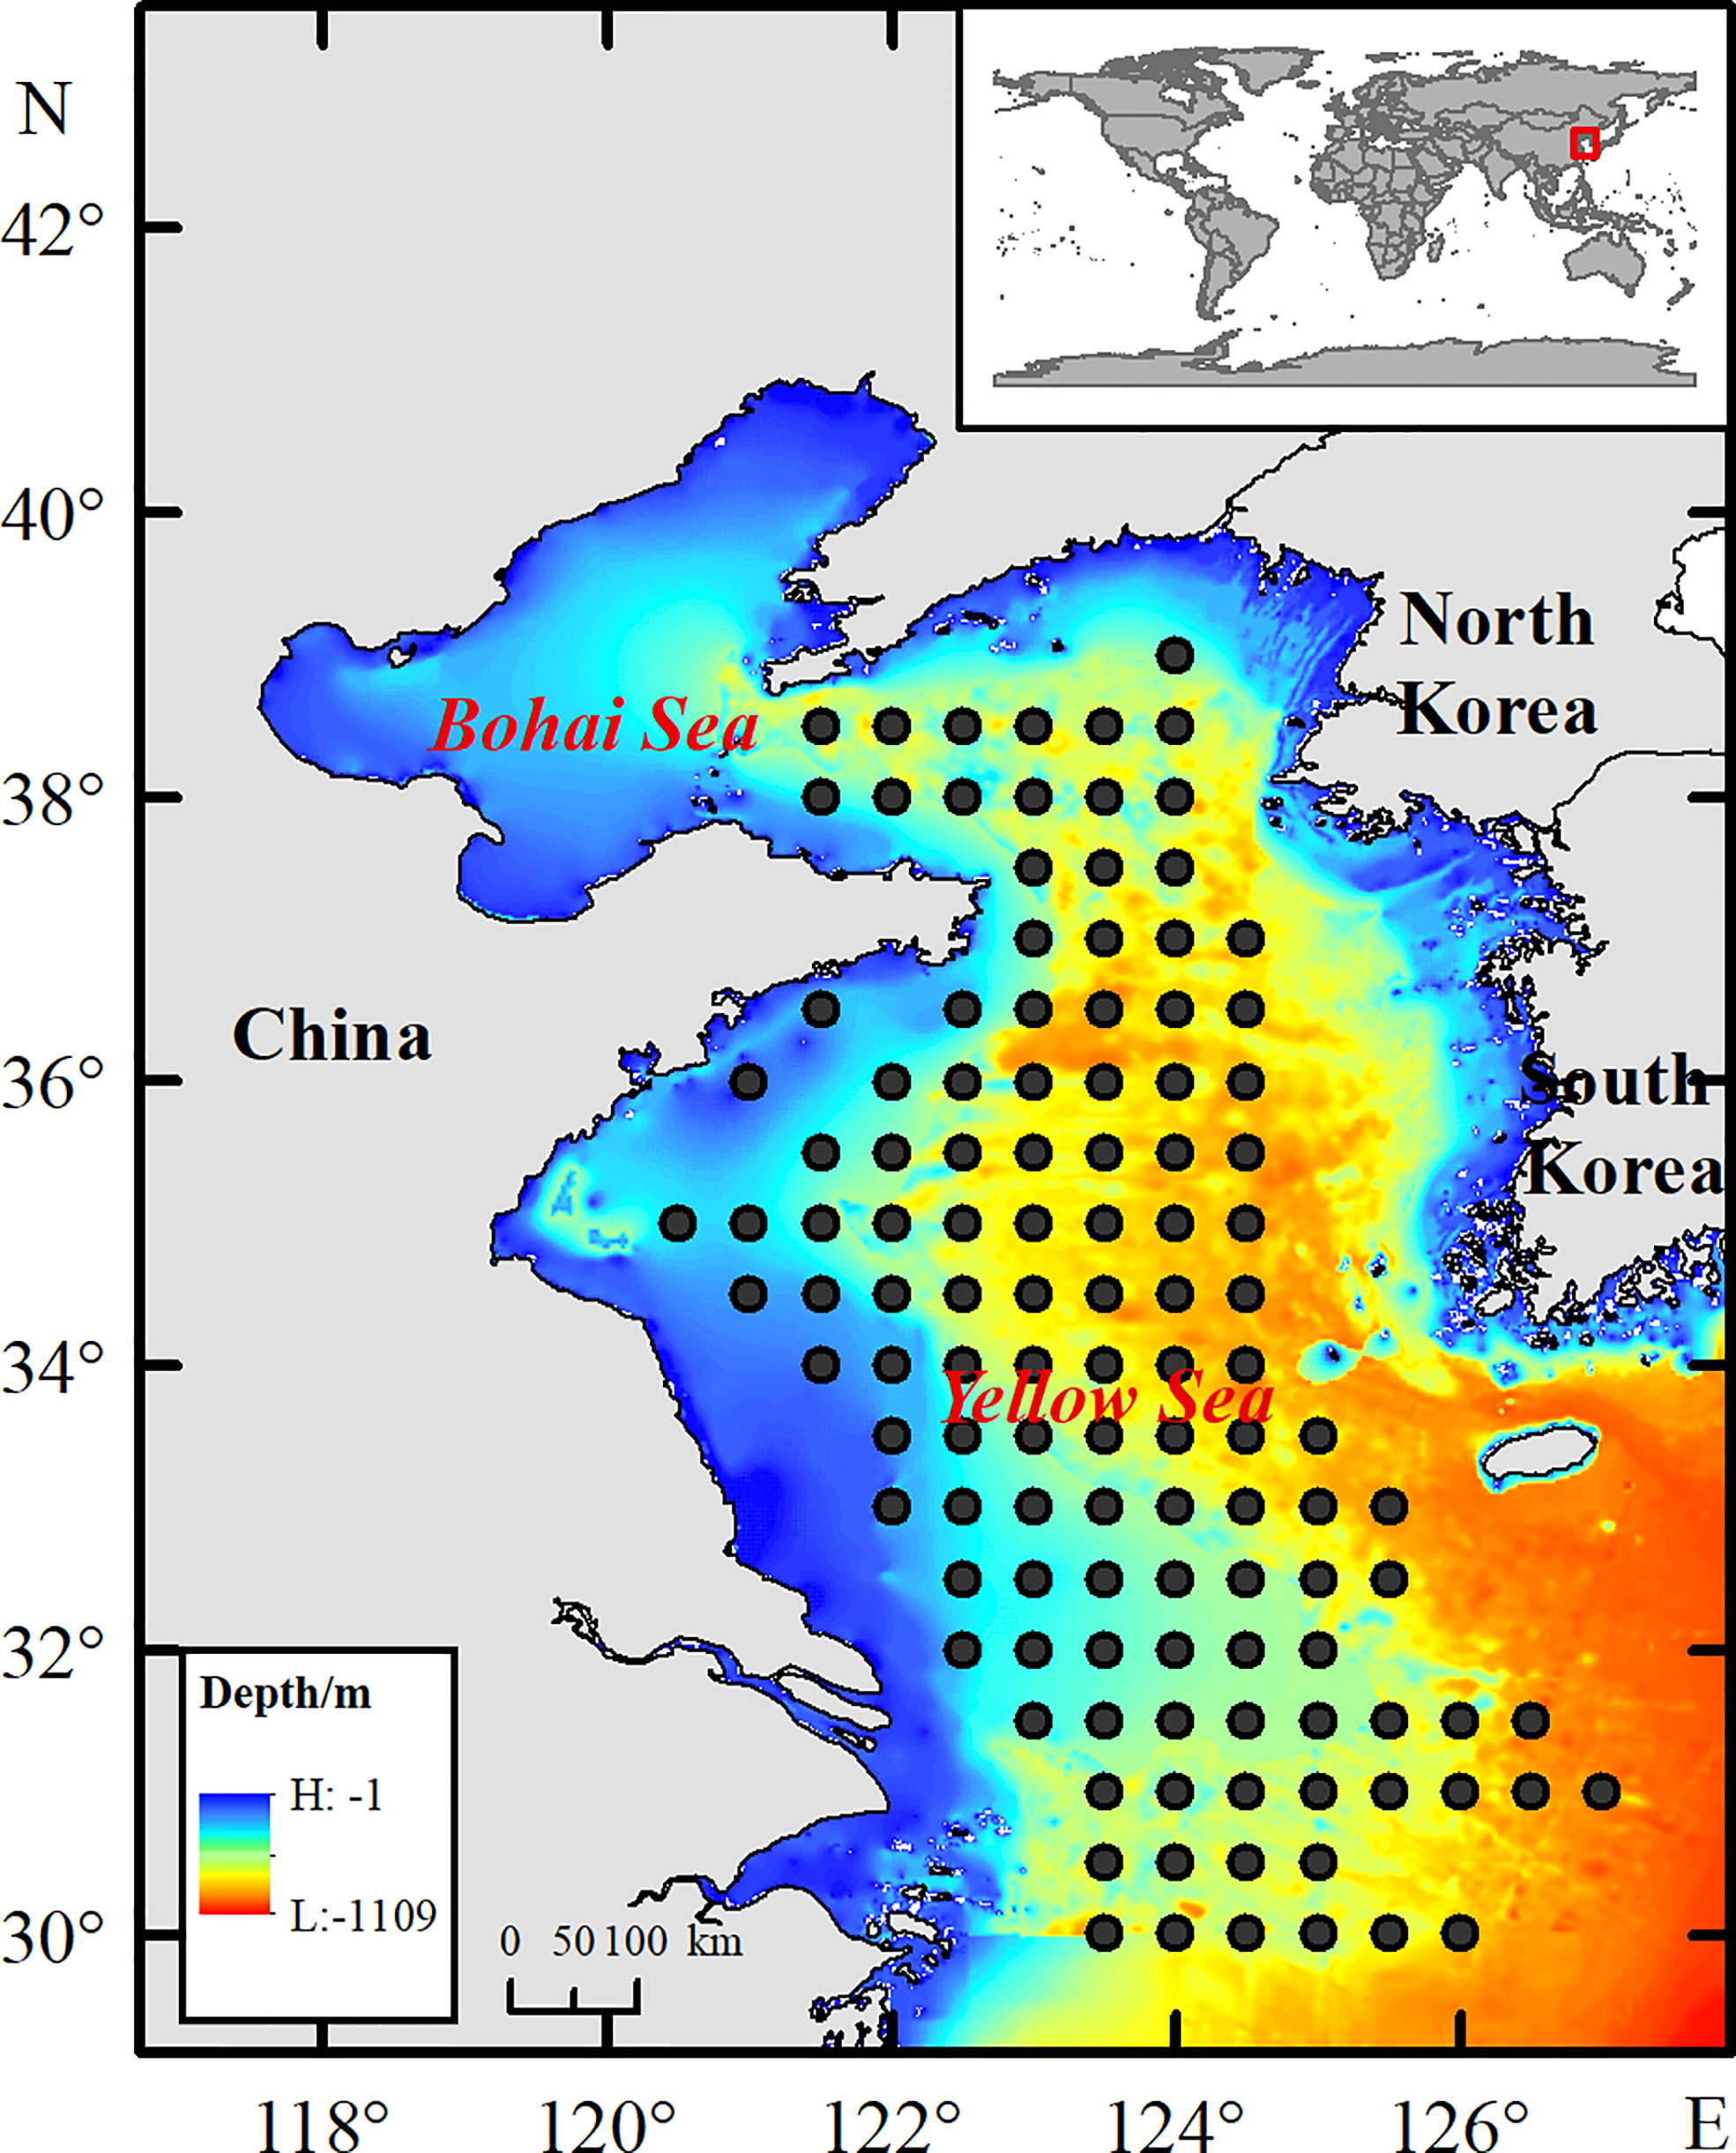
Figure 1 Schematic illustration of the survey sites in the Yellow Sea.
Three covariates (SST, FP and DP), were included in our study to explore their effects on the long-term changes in the spatio-temporal distribution of snailfish. SST data were selected because during winter, the Yellow Sea Warm Current flows through the Yellow Sea Trough area, leading to vertical mixing that eliminates temperature gradients and stratification in the water column (Zhang et al., 2008). Monthly SST were derived from MODIS-Aqua data at 4 km spatial resolution over the periods of 2003−2019 from https://oceandata.sci.gsfc.nasa.gov/directaccess/MODIS-Aqua/Mapped/Monthly/4km/sst/. Following the implementation of a double control system on fishing vessels in China, the number of fishing vessels decreased and the rate of increase in total horsepower reduced. However, the rate of increase in fishing pressure had greater impact despite the reduced rate of increase in total horsepower due to technological innovation and increased fishing efficiency (Han et al., 2022). In view of this, we chose the highest power group to represent the strength of FP, which was calculated by summing the total horsepower of active fishing vessels above 441 kW, including those from Shandong, Jiangsu, Hebei, and Liaoning Provinces, and Tianjin City recorded in the China fishery statistical yearbooks (MARA, 2003–2020). Japanese anchovy (Engraulis japonicus) and sand shrimp (Crangon affinis) have been identified as the main prey of snailfish during winter (Zhang et al., 2011), so we selected the sum of the biomass density of these two prey species to represent the prey status for snailfish. Prey data were obtained for the same periods from the aforementioned fishery-independent surveys conducted by YSFRI.
We used a vector autoregressive spatio-temporal (VAST) model (Thorson and Barnett, 2017; Thorson, 2019a) to estimate the long-term spatio-temporal variation in biomass density of snailfish in the Yellow Sea. Two types of variation were included in the VAST model, spatial variation relates to variation that is assumed to remain constant over time for the biomass density of snailfish in the Yellow Sea. Spatio-temporal variation relates to the interannual variation in biomass density of the snailfish population. The VAST model is considered to have excellent performance by accounting for spatio-temporal changes in the sampling efforts and survey design in each survey year (Thorson, 2019a). The model consists of two components, one is the binomial-GLMM which determines the encounter probability (Snailfish does not necessarily occur at each survey site), the other is the Gamma-GLMM which indicated the positive density for each encounter (the expected biomass density at a given sampling site when snailfish occurs). The final biomass density of snailfish was estimated by multiplying the encounter probability by the positive density (Grüss et al., 2019; Han et al., 2021). We developed 8 spatio-temporal models which varied in their combinations of SST, FP and DP as explanatory variables, to explore the potential effects that different covariates may have on the snailfish population. Akaike’s Information Criterion (AIC) was used to evaluate model performance and choose the most parsimonious model among the eight alternatives (Akaike, 1974). The details of each model were as follows: M1 does not include any covariates; M2: SST; M3: FP; M4: DP; M5: FP and SST; M6: DP and SST; M7: FP and DP; and M8: FP, DP and SST. It should be noted that although M1 included no covariates, it still contained the spatial and spatio-temporal terms representing the unmeasured temporal variability. We used the spatially-varying coefficient model (SVC, Thorson, 2019b) to represent the effects of annual covariates such as FP and DP. As M1-M8 have a similar model structure, here we illustrate the general model structure by describing the most complex alternative M8 (including 3 covariates). The encounter probability of snailfish pi at sampling site s(i) was estimated by the binomial-GLMM with a logit link function with linear predictors. Two Gaussian Markov random fields were introduced to reflect the spatial and spatio-temporal variations in encounter probability:
where is the intercept of the encounter probability for year t, is the unmeasured spatial variation in encounter probability for sampling site s(i) which is constant over years, is the time-varying unmeasured spatial variation in encounter probability for site s(i) in year t; represents the relative fishing efficiency for the vth survey vessel for site s(i) in year t; is the linear effect of SST on encounter probability for site s(i) in year t; is the spatially-varying effect of the FP on encounter probability for site s(i) in year t; and is the spatially-varying effect of DP of encounter probability for site s(i) in year t.
Among the model components, the intercept and the linear effect of SST are regarded as fixed effects. The spatial variation ω(p) , the spatio-temporal variation , the spatially-varying effects of FP and DP are random and assumed to follow a multivariate normal distribution. A random-walk temporal process was applied to estimate the spatio-temporal variation with reference to the methods described by Thorson et al. (2016) and Han et al. (2021).
The positive density of snailfish ri at site s(i) was estimated by the Gamma GLMM with a log link function and linear predictors, including two Gaussian Markov random fields representing spatial and spatio-temporal variations in positive density, respectively:
where the parameters on the right side of Eq. (2) are defined in the same way as those on the right side of Eq. (1), except that they apply to the log-biomass density of snailfish.
VAST uses a predictive statistical process in which spatial variables are defined at each of a series of knots (topological embedding of closed non-self-intersecting curves in 3D Euclidean space; see https://mathworld.wolfram.com/Knot.html accessed on 16-Sep-2022) located to minimize their average distance from samples. The spatial resolution of the analysis is determined by the number of knots specified a priori by the user (Thorson, 2019a). Extrapolation grids with 0.25°× 0.25°(arc-degrees) spatial resolution were constructed for the present study to allow for the production of maps (Figure 2). To improve the computational efficiency, we finally identified 100 knots with a k-means algorithm using the INLA package in R 4.1.3 (Thorson et al., 2015; R Core Team, 2022). The number of knots was set to 100 to balance computational speed with predictive accuracy, and similar results were obtained when a greater number of knots was added. This was also established by a previous study in the Yellow Sea (Han et al., 2021). We then calculated the values of spatial and spatio-temporal variation terms at each knot using the spatio-temporal model (Grüss et al., 2020). Finally, the biomass density of snailfish in year t, , was predicted as follows:
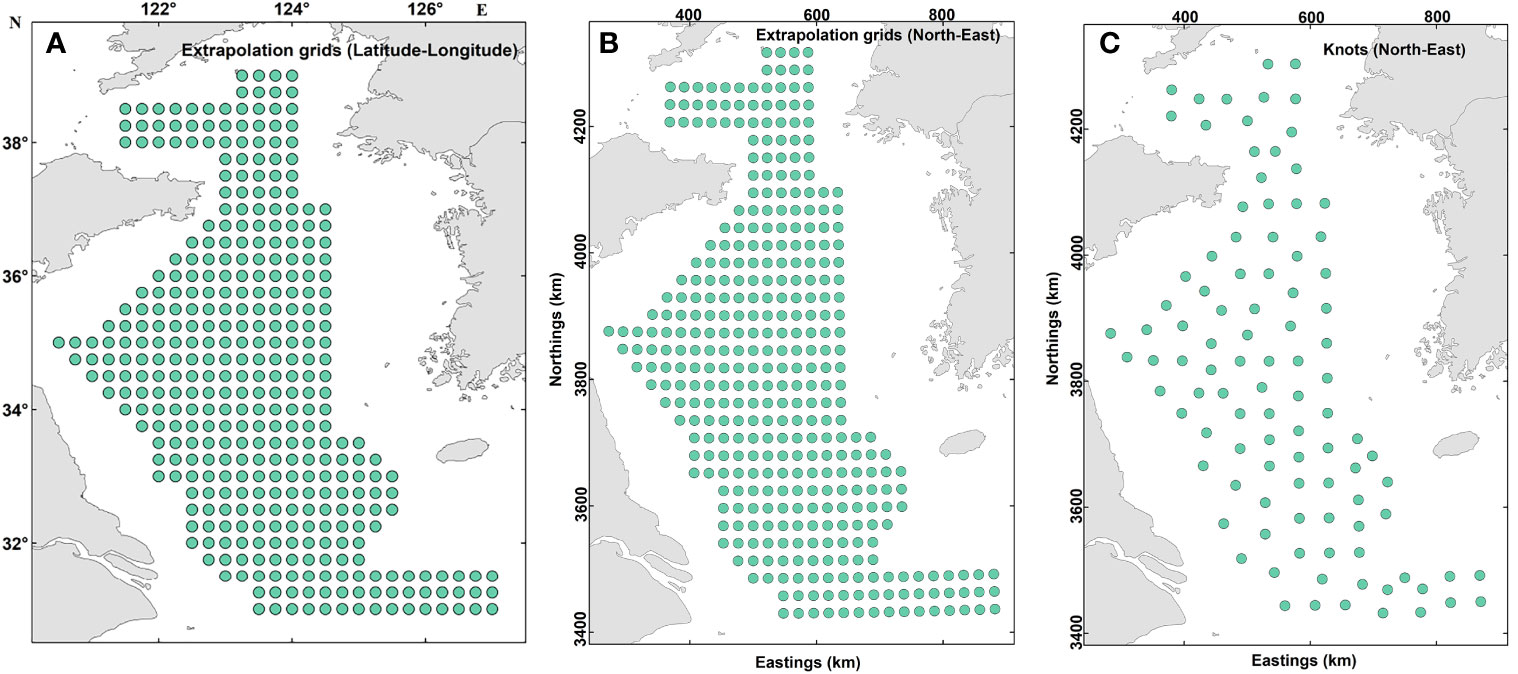
Figure 2 Maps showing the barycenter of extrapolation grid cells and of the “knots” used within the spatio-temporal models. The extrapolation grid consists of 375 cells and the locations are shown in latitude-longitude using the World Geodetic System 1984 (A) and northings-eastings using Universal Transverse Mercator projection (B). For computational efficiency, 100 “knots” was specified to approximate the variation terms of the spatio-temporal models developed and the locations of these knots are shown in (C).
where Aj is the area of knot j in km²; nj is the number of knots; , , and represent fixed effects estimated by maximum likelihood; and , , , , , , and are random effects set to the value that maximizes the joint likelihood, conditional on the estimated value of fixed effects (Thorson et al., 2015). A model was confirmed as convergent if the following two conditions were met: (1) the absolute values of the final gradient of the marginal log-likelihood was less than 0.0001, and (2) the Hessian matrix of the log-likelihood function was positive definite (Perretti and Thorson, 2019).
To examine the long-term changes of distribution patterns of snailfish in the Yellow Sea, three indicators including longitudinal displacement in the centers of gravity (COGs), latitudinal displacement in COGs, and effective area occupied (EAU) were estimated in 2003–2019. The COGs were estimated as:
Where NEt is the COG of snailfish in year t, nej represents the value of northings or eastings (in km) in knot j, and represents the predicted biomass in year t.
EAU in each year was calculated using the predicted biomass in year t, , divided by the average biomass density Dt in the corresponding year. The formula was showed below:
Where Dt means the average biomass density in year t of snailfish, and represents the predicted biomass in year t.
We performed the Mann-Kendall Trend Test to determine the existence trends in the time series of longitudinal COGs, latitudinal COGs and EAU (McLeod, 2015). The Mann-Kendall Trend Test is a non-parametric test, which has no underlying assumption about the normality of the data. The hypotheses for the test were as follows: H0 (null hypothesis) that no trend is present in the data, whereas H1 (alternative hypothesis) that a positive or negative trend is present in the data. Kendall’s tau value demonstrated the strength of the trend and the p-value reflected its significance. The Mann-Kendall Trend Test was conducted using the Kendall package in R 4.1.3.
According to previous studies, SST and DP are considered to be important factors influencing the snailfish population in the Yellow Sea (Zhang et al., 2011; Chen et al., 2022). Although snailfish belongs to the category of large demersal species in the Yellow Sea ecosystem, how FP acts on this species and the magnitude of its effects remains unclear. Among the eight alternative models we tested, a factor would be regarded as contributing to the distribution of snailfish biomass if its incorporation to the spatio-temporal model reduced the variation in either or both the encounter probability and positive density. Here, variation refers to the sum of the spatial variation terms or and of the spatio-temporal variation terms , or in equation 1 and equation 3, reflecting the unmeasured variation in encounter probability (estimated by the binomial component of the model) or positive density (estimated by the Gamma component of the model). Further details of this method are described in Thorson et al. (2015) and Han et al. (2021). Estimations of geostatistical delta-GLMMs parameters and the changes of spatial indicators reflecting the long-term distribution patterns of snailfish were conducted using the VAST package (Thorson et al., 2015; Thorson, 2019a) in R 4.1.3.
All eight spatio-temporal models converged. SST was the most important factor accounting for the variation in encounter probability (Table 1). The inclusion of SST caused a large decrease in the residual variation in encounter probability over time. Compared to a model without covariates, incorporating FP did not improve the fit of the spatio-temporal model, and the inclusion of DP led to a negligible reduction in the variance in encounter probability. On the other hand, DP was found to be the most important factor in explaining the variation in positive density, causing a large decrease in the residual variation over time. In other instances, incorporating SST led to a slight reduction (9.74%) of the variance in positive density, and including FP still showed no reduction of the residual variation over time for positive density (Table 1).
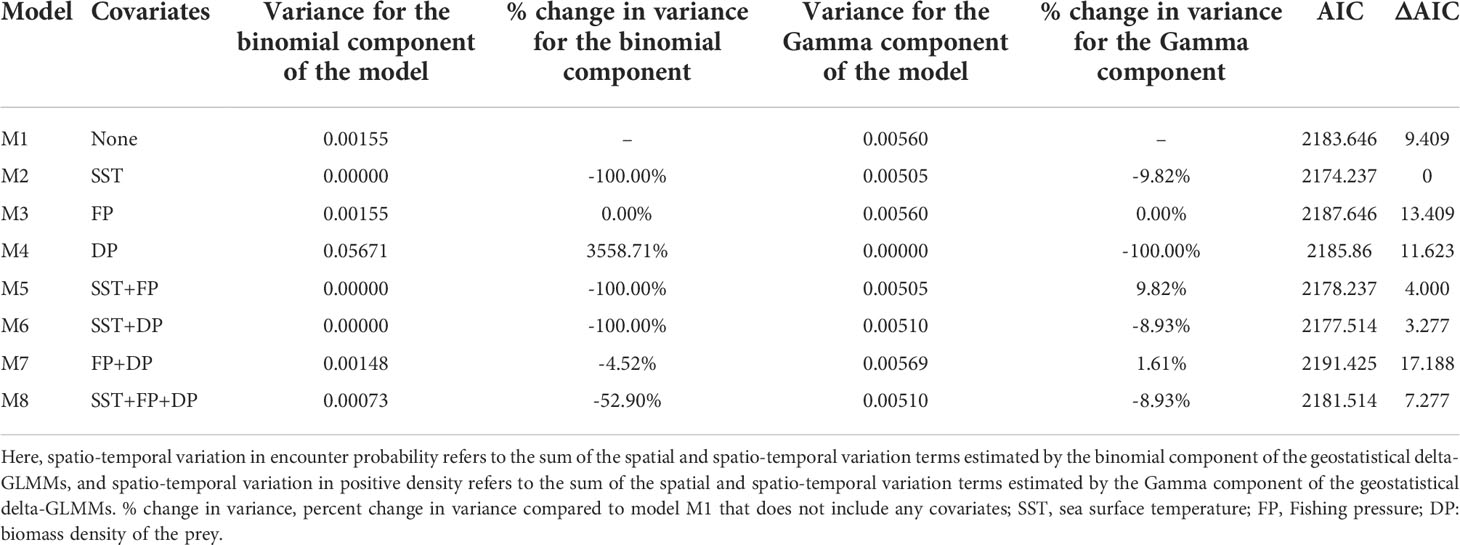
Table 1 Estimates of the variances and model performance based on Akaike’s Information Criterion (AIC) for the eight candidate geostatistical delta-GLMMs (M1–M8) developed in this study.
According to the AIC analysis, the spatio-temporal model with SST (M2) was the most parsimonious with a lower AIC value than the other seven models (Table 1). We conducted a set of standard model diagnostics to confirm that the model was reasonable (see Supplementary Figures 1, 2). Therefore, model M2 was selected for the follow-up analysis. Spatio-temporal models that included SST and/or FP and/or DP, performed better than model M1 with only spatial and spatio-temporal terms and no covariates. Other models including FP (M3), DP (M4) and both (M7) degraded model parsimony below that of model M1.
The spatial patterns of log-density of snailfish in the period 2003–2019 predicted by M2 (with SST) are illustrated in Figure 3. In general, the Yellow Sea was an important habitat for snailfish, the inter-annual distribution range was relatively stable while the spatial patterns differed over time. In 2003–2006, snailfish showed high density in almost all the Yellow Sea area. Since 2007, the spatial patterns of snailfish demonstrated inter-annual changes, the density was relative low in 2007–2009, 2015–2016 and 2019, with the concentration area distributed more in the central Yellow Sea (Figures 3, 4). While in 2011, the density of snailfish had the highest value in the period 2003–2019 (Figure 4). It is worth noting that in 2019, there was a rapid decrease in the biomass density of snailfish compared to other survey years, with an obvious shrinkage of the concentration area. Hotspots in the northern and southern Yellow Sea became more sporadic and the overall distribution moved further offshore into the deep-water area in the domain.
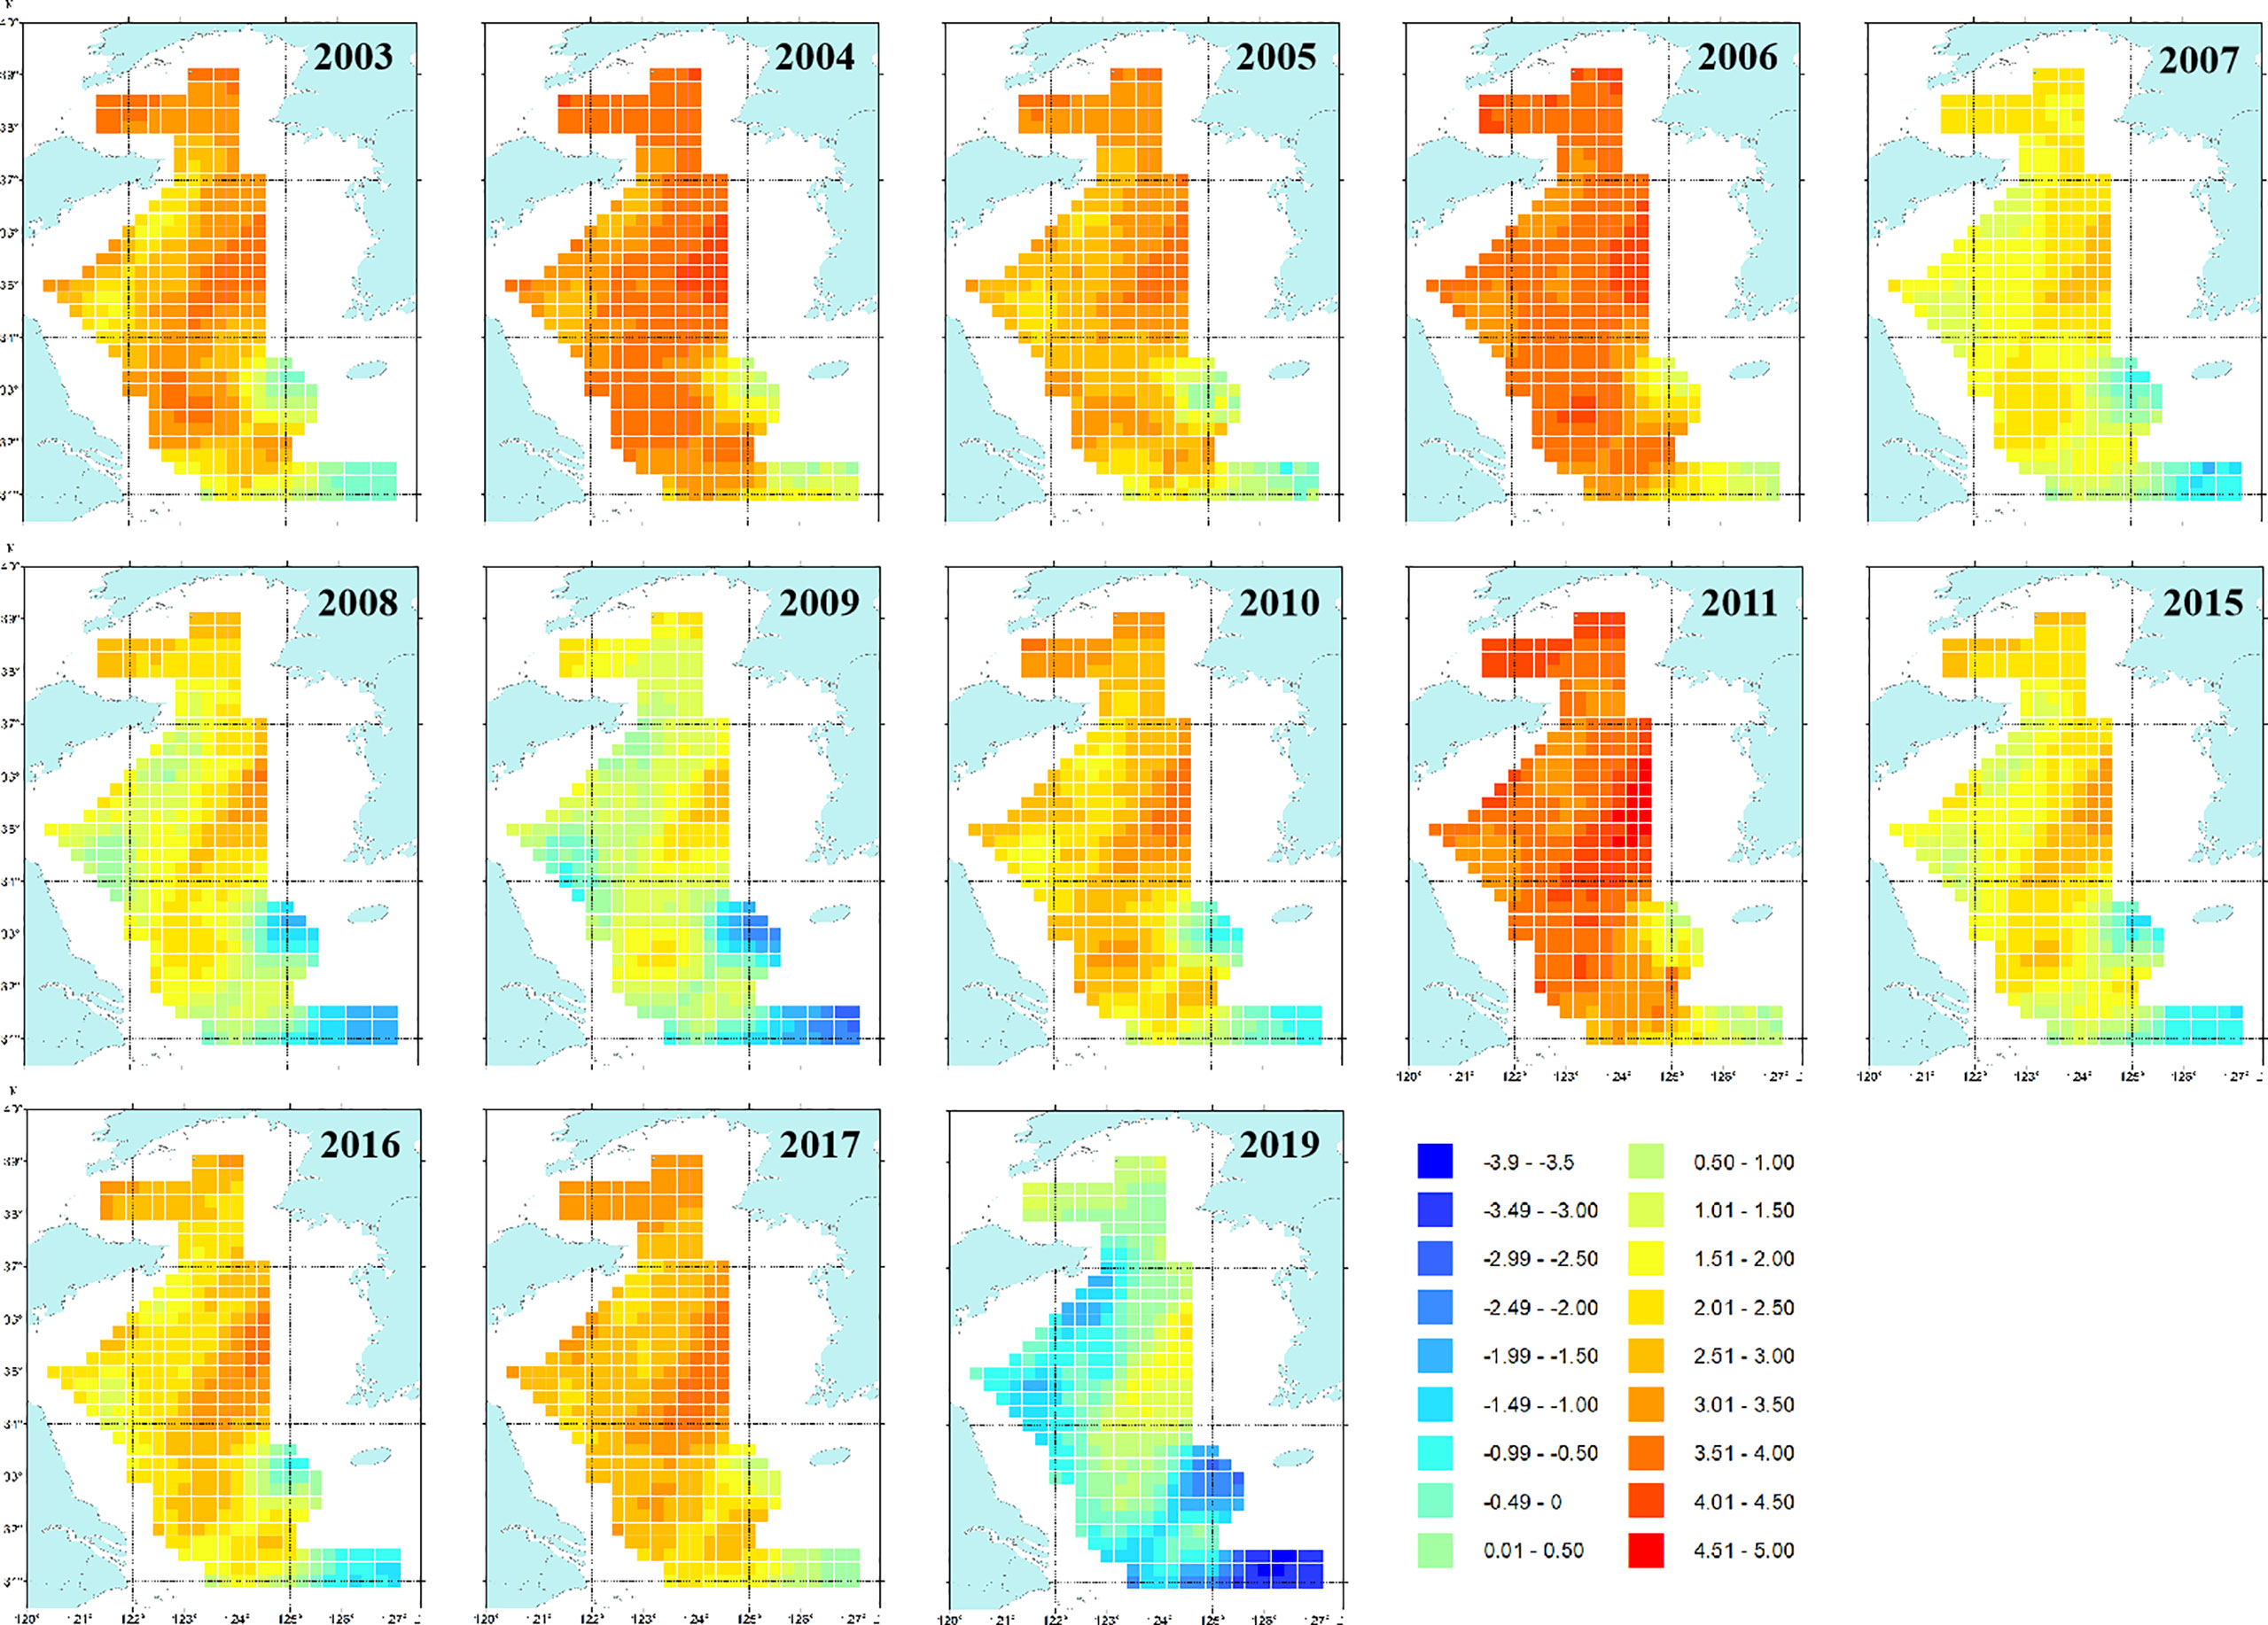
Figure 3 Maps showing spatial patterns of log-density by the AIC-selected spatio-temporal model (M2) for snailfish in the Yellow Sea in 2003–2019. The units of the color legend is ln(kg/km2). It is noted that only estimations for those years where biomass trawl survey data (i.e., 2003–2011, 2015–2017 and 2019) available for snailfish were shown.
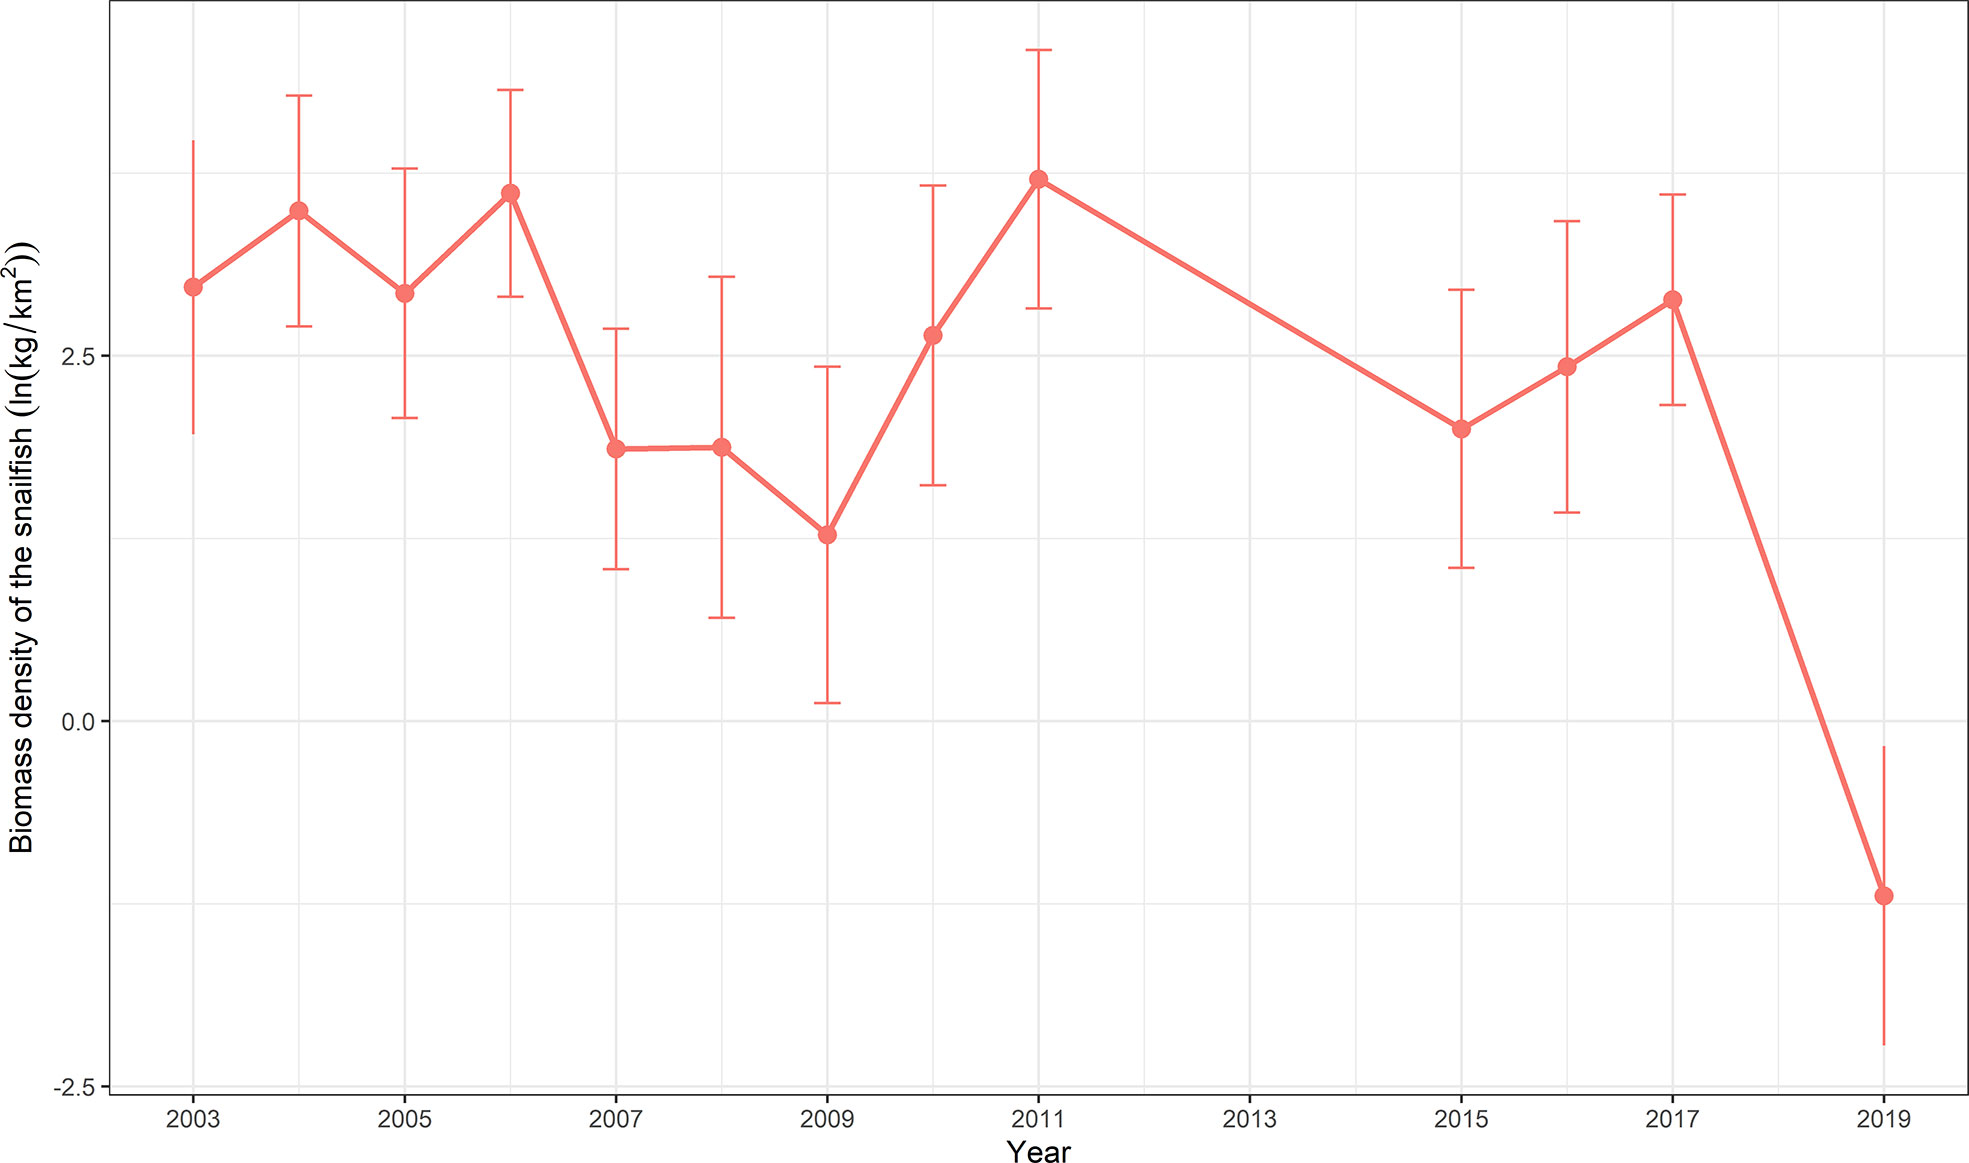
Figure 4 Biomass density (ln(kg/km2)) time series generated by VAST for snailfish in the Yellow Sea in 2003–2019. Data are expressed with mean ± standard deviation.
Three distributional indicators (EAU and COGs) of the spatial characteristics of snailfish are shown in Figure 5. Results of EAU showed that no range contraction/expansion for snailfish was detected during the entire study period (Kendall’s tau = -0.25, p-value > 0.05). In contrast, the estimated EAU was significantly correlated with the biomass density of snailfish (r = -0.71, p-value< 0.05). For instance, EAU was low in 2008, 2009 and 2019, corresponding to the low density of snailfish in these years. The population exhibited a narrow eastward change, but no significant shift (Kendall’s tau = 0.24, p-value > 0.05) of COGs in 2003–2019. No significant northward shift (Kendall’s tau = 0.13, p-value > 0.05) of COGs was detected for the population compared to its long-term average. The inter-annual fluctuation range of northward COGs was 59.54 km, a little higher than what it was for the eastward direction.
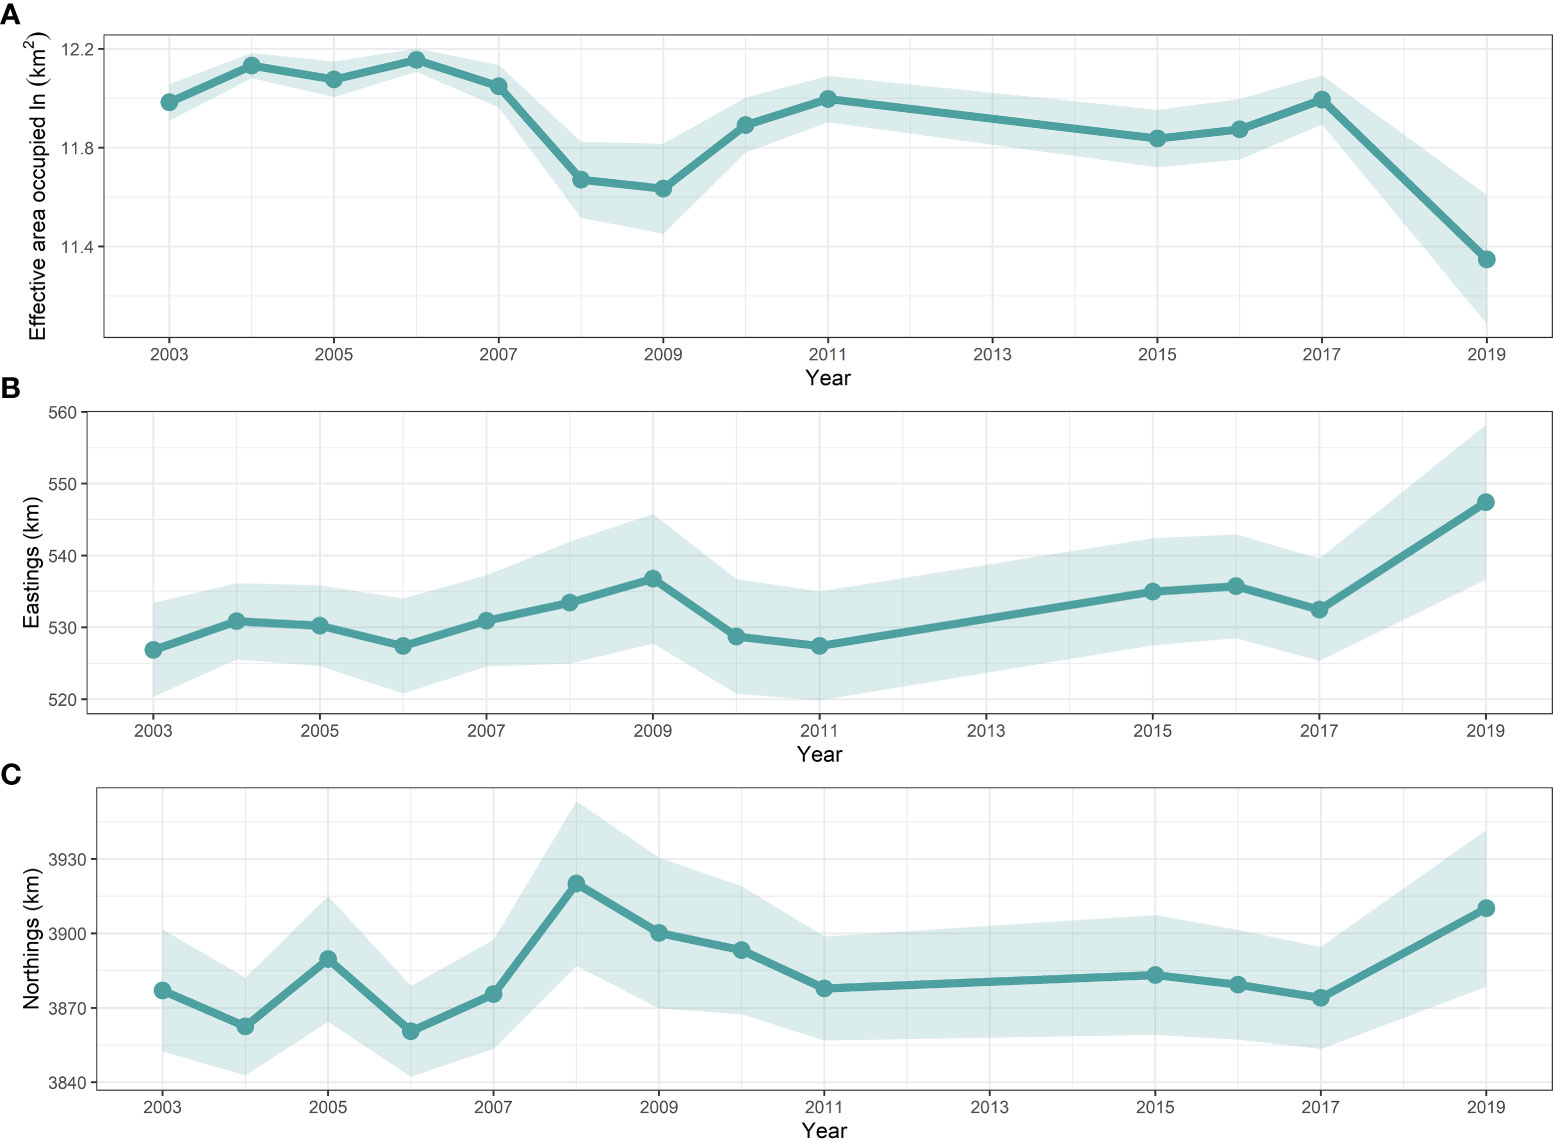
Figure 5 Temporal trend with 95% confidence intervals (shaded areas) in the effective area occupied (ln(km2)) estimated by the AIC-selected spatio-temporal model (M2) for snailfish in the Yellow Sea in 2003–2019. It is noted that only estimations for those years where biomass trawl survey data (i.e., 2003–2011, 2015–2017 and 2019) available for snailfish were shown.
Using bottom trawl survey data collected from 2003 to 2019, the present study successfully developed eight geostatistical delta-GLMMs for snailfish in the Yellow Sea with different combinations of covariates. Developed by Thorson et al. (2015; 2016), the geostatistical delta-GLMM takes into account the spatial variation of the sampling effort to collect survey data in each year, and is better suited towards accommodating long time series than traditional methods (Thorson, 2019a). This approach improves the accuracy of abundance estimation by introducing spatio-temporal effects, vessel effects, vessel-year effects and spatial anisotropy into the model in contrast with traditional non-spatial models such as generalized linear mixed models. Furthermore, the fishery-independent survey data we used in this study had high proportions (> 70%) of zero values in some years, such as 2008, 2009 and 2019. We found that the geostatistical delta-GLMMs performed well in dealing with the zero values by separately processing zero and non-zero data. Moreover, it should be noted that the factors influencing encounter probability and positive catch rates differed. SST has important impacts on the probability of having non-zero catches, whereas biomass density of the prey critically explains the positive catch rates. Thus, the two-step method is highly recommended. This also has relevance for biomass estimation of other species in the Yellow Sea and the northwest Pacific where frequency of occurrence and biomass density may be dominated by different influencing factors.
Environmental changes coupled with high fishing pressure in the Yellow Sea has produced a general decline in biomass with frequent turnover of dominant species, however, in contrast to most of the exploited species, Tanaka’s snailfish has remained a dominant species since the 1980s (Xu and Jin, 2005; Chen et al., 2018). However, long-term changes in the spatio-temporal distribution of snailfish in the face of increased fishing pressure and adverse environmental changes has received scant attention. Results of this study indicate that the biomass density of snailfish was relatively stable during the entire survey period. This finding is consistent with a previous study on fish community structure and diversity in the domain from 2003 to 2015 when multivariate analysis of the fish assemblage diversity indices showed a high level of similarity among years without clear trends, despite some fluctuations in these measures (Chen et al., 2018). As both the dominant and key species in the ecosystem, the snailfish makes considerable contributions to maintain the relative stability of the fish community. The rapidly decreasing density and contraction of the area in which snailfish concentrated in 2019 warranted further exploration. In general, our results revealed that long-term changes in the fine-scale spatio-temporal distribution of snailfish can provide a scientific basis for understanding the structure and function of the Yellow Sea ecosystem in terms of its interspecific relationships.
Previous studies of cold-temperate fishes in the Yellow Sea showed that relative to 1959, the distribution of Pacific cod shifted by about 0.5°C to 35°N during the early 21st century, which may be a response of cold-temperate fish to climate change (Li et al., 2012). Plaice (Cleisthenes herzensteini), another cold-temperate fish species, was shown to have narrowed its high-density area and shifted more towards the north and offshore from 1985–2010 (Shan et al., 2012). Unlike the above studies using multi-decadal data, we used data for as many consecutive years as possible to enable investigation of long-term changes in the spatio-temporal distribution of snailfish. The three distributional indicators we chose, namely effective area occupied, eastward center of gravity and northward center of gravity, comprehensively reflected the patterns of spatial distribution of snailfish. In similarity with its biomass density, snailfish also experienced a relatively stable spatio-temporal distribution pattern in 2003–2019, which may also be helpful in maintaining the stability of entire ecosystem.
This study firstly investigated the quantitative spatio-temporal characteristics of snailfish during 2003–2019 in relation to changes in SST, DP, and FP. SST explained most of the variation in encounter probability and DP was the most important factor in explaining the variation in positive density. Surprisingly, including FP in the geostatistical delta-GLMMs led to no improvement in accounting for the spatio-temporal variation in both encounter probability and positive density. In other words, SST and DP are the candidate variables for scientific assessments of the risks to fish species under multiple pressures in the Yellow Sea.
Temperature is the most important external environmental factor for fishes, directly affecting the activity of digestive enzymes in their gut, food availability, and habitat selectivity (Volkoff and Rønnestad, 2020; Freitas et al., 2021). Tanaka’s snailfish is a demersal cold-temperature species, with limited long-distance mobility and as such is endemic to the Yellow Sea ecosystem (Chen et al., 2022). Our study showed that SST has two significant implications for the snailfish population. One is the substantial proportion of variation in encounter probability attributable to SST in the spatio-temporal models. Another is that inclusion of SST in the geostatistical delta-GLMMs led to a moderate reduction in the spatio-temporal variation in positive density. In this regard, the temperature effects on recruitment dynamics of snailfish and the relationship between SST and biomass of the population warrant further exploration.
Previously, temperature was identified as the dominant variable in explaining the overwintering distribution of snailfish, although other possibly important biotic variables include spawning and feeding activities (Chen et al., 2022). January was identified as one of the two intra-annual feeding peaks for snailfish along with August when high feeding intensity was also observed (Zhang et al., 2011). Tanaka’s snailfish is regarded as omnivorous with broad feeding preferences. Stomach contents analysis has indicated that it feeds on more than 60 species, among which Japanese anchovy and sand shrimp are the major prey (Zhang et al., 2011). Taking the combined biomass density of Japanese anchovy and sand shrimp as the indicator of prey, our results showed that it was the most important factor explaining variation in positive density. However, including DP in models resulted in negligible reduction in the spatio-temporal variation of encounter probability. This may be related to the biological and ecological characteristics of the prey species. For instance, the Japanese anchovy and sand shrimp are both important forage species in the Yellow Sea ecosystem and are preyed upon by many species besides snailfish (Tang, 2009; Lin et al., 2013). They also have a widespread distribution across the Yellow Sea (Jin et al., 2010; Niu and Wang, 2017). In addition, prey density may change rapidly over time and unlike SST which is relatively stable, the dynamic nature of the two main prey species may cause snailfish to switch to alternative prey in areas where one or both of the preferred species are in low abundance.
Fishing activities, especially overfishing, directly reduce the abundance of large-size fish, changing the composition and age structure of fish stocks, and affecting the non-fished species via food webs (Issifu et al., 2022). These changes can lead to reductions in community resilience and stability, and may affect the structure and function of an entire ecosystem (Colloca et al., 2017). In general, the population dynamics of pelagic species are closely linked to large-scale environment conditions such as climate change, while those of demersal species tend to be more vulnerable to localized fishing activities (Bianchi et al., 2000; Lindegren et al., 2013; Canales et al., 2018). However, including FP in the spatio-temporal models we applied in our study did not enhance the explanation of variance in encounter probability and positive density. This may be a reflection of two circumstances. Firstly, snailfish is a species with low economic value (Chen et al., 2022), subjected to limited fishing pressure compared to economically valuable species in the Yellow Sea, such as the small yellow croaker, the largehead hairtail and the Japanese Spanish mackerel. Secondly, we used the winter survey data of snailfish to study its long-term changes in population. Most surveys were undertaken in January, close to the traditional Chinese New Year when fishing pressure is relatively low compared to other months during the year. It should be noted that the inferior role of FP in modelling does not imply it is of low influence on the population dynamics of snailfish. In our study, the annual fishing pressure data were analyzed without considering their intra-annual temporal distribution. If sufficient intra-annual survey data become available in future, then spatial and temporal effects of fishing pressure should be further exploration because of their potential to substantially influence the population dynamics of snailfish.
For the first time, our study provides insights about long-term changes in spatio-temporal distribution patterns of snailfish in the Yellow Sea based on standardized data from fishery-independent scientific trawl surveys. We found that the geostatistical delta-GLMMs had excellent performance in dealing with the zero values, and the spatio-temporal model with SST was selected as the best model based on AIC analysis. Relative importance analysis of three covariates indicated that SST and DP were the most important factors explaining the residual variation in encounter probability and positive density over time, respectively. An unexpected finding was that FP showed no reduction in residual variation for both encounter probability and positive density, which implies that fishing pressure may not be a useful indicator of the long-term changes in snailfish population. Identifying more explicitly the intra-annual spatial and temporal patterns of fishing pressure in geostatistical delta-GLMMs would be necessary to confirm our preliminary results. In terms of distribution patterns of snailfish, the hotspot area in the central Yellow Sea was consistently identified during all survey years. Inter-annual fluctuations in biomass density were evident: high density occurred in 2003–2006 and 2011, while relative low density years were 2007–2009, 2015–2016 and 2019. Why a rapid decrease in the density and shrinkage in the concentration area of snailfish occurred in 2019 and whether this situation is persistent warrant further exploration. No significant shift of COGs was detected for the population during the study periods. The estimated EAU correlated significantly with the biomass density of snailfish.
The raw data supporting the conclusions of this article will be made available by the authors, without undue reservation.
YC: Conceptualization, Methodology, Formal analysis, Visualization, Writing-original draft. XS: Data curation, Writing-review & editing, Supervision, Funding acquisition. QH: Methodology, Visualization, Validation. HG: Writing -review & editing. FD: Investigation, Resources. XJ: Supervision, Writing-review & editing. All authors contributed to the article and approved the submitted version.
This work was funded by the National Key R&D Program of China [2018YFD0900906]; the Marine S&T Fund of Shandong Province for Pilot National Laboratory for Marine Science and Technology (Qingdao) [2021QNLM050103-3]; Central Public-interest Scientific Institution Basal Research Fund, YSFRI, CAFS [20603022022022]; the Innovation Team of Fishery Resources and Ecology in the Yellow Sea and Bohai Sea [2021TD01].
We are grateful to the crew of R/V Beidou for their supporting efforts in field sampling. We also thank the editor and two reviewers for their valuable comments on the manuscript.
The authors declare that the research was conducted in the absence of any commercial or financial relationships that could be construed as a potential conflict of interest.
All claims expressed in this article are solely those of the authors and do not necessarily represent those of their affiliated organizations, or those of the publisher, the editors and the reviewers. Any product that may be evaluated in this article, or claim that may be made by its manufacturer, is not guaranteed or endorsed by the publisher.
The Supplementary Material for this article can be found online at: https://www.frontiersin.org/articles/10.3389/fmars.2022.1024086/full#supplementary-material
Akaike H. (1974). A new look at the statistical model identification. IEEE Trans. Automat. Contr. 19 (6), 716–723. doi: 10.1007/978-1-4612-1694-016
Bacha M., Jeyid M. A., Vantrepotte V., Dessailly D., Amara R. (2017). Environmental effects on the spatio-temporal patterns of abundance and distribution of Sardina pilchardus and sardinella off the Mauritanian coast (North-West Africa). Fish. Oceanogr. 26 (3), 282–298. doi: 10.1111/fog.12192
Belkin I. M. (2009). Rapid warming of large marine ecosystems. Prog. Oceanogr. 81 (1–4), 207–213. doi: 10.1016/j.pocean.2009.04.011
Bianchi G., Gislason H., Graham K., Hill L., Jin X., Koranteng K., et al. (2000). Impact of fishing on size composition and diversity of demersal fish communities. ICES J. Mar. Sci. 57 (3), 558–571. doi: 10.1006/jmsc.2000.0727
Canales C. M., Adasme N. A., Cubillos L. A., Cuevas M. J., Sánchez N. (2018). Long-time spatio-temporal variations in anchovy (Engraulis ringens) biological traits off northern Chile: an adaptive response to long-term environmental change? ICES J. Mar. Sci. 75 (6), 1908–1923. doi: 10.1093/icesjms/fsy082
Carozza D. A., Bianchi D., Galbraith E. D. (2019). Metabolic impacts of climate change on marine ecosystems: Implications for fish communities and fisheries. Glob. Ecol. Biogeogr. 28 (2), 158–169. doi: 10.1111/geb.12832
Casale P., Ciccocioppo A., Vagnoli G., Rigoli A., Freggi D., Tolve L., et al. (2020). Citizen science helps assessing spatio-temporal distribution of sea turtles in foraging areas. Aquat. Conserv. 30 (1), 123–130. doi: 10.1002/aqc.3228
Chen Y., Shan X., Jin X., Johannessen A., Yang T., Dai F. (2018). Changes in fish diversity and community structure in the central and southern Yellow Sea from 2003 to 2015. J. Oceanol. Limnol. 36 (3), 805–817. doi: 10.1007/s00343-018-6287-6
Chen Y., Shan X., Zeng D., Gorfine H., Xu Y., Wu Q., et al. (2022). Estimating seasonal habitat suitability for migratory species in the Bohai Sea and Yellow Sea: A case study of tanaka’s snailfish (Liparis tanakae). Acta Oceanol. Sin. 41 (6), 22–30. doi: 10.1007/s13131-021-1912-1
Colloca F., Scarcella G., Libralato S. (2017). Recent trends and impacts of fisheries exploitation on Mediterranean stocks and ecosystems. Front. Mar. Sci. 4. doi: 10.3389/fmars.2017.00244
Freitas C., Villegas-Ríos D., Moland E., Olsen E. M. (2021). Sea Temperature effects on depth use and habitat selection in a marine fish community. J. Anim. Ecol. 90 (7), 1787–1800. doi: 10.1111/1365-2656.13497
Fromentin J. M., Reygondeau G., Bonhommeau S., Beaugrand G. (2014). Oceanographic changes and exploitation drive the spatio-temporal dynamics of Atlantic bluefin tuna (Thunnus thynnus). Fish. Oceanogr. 23 (2), 147–156. doi: 10.1111/fog.12050
Gaines S. D., Costello C., Owashi B., Mangin T., Bone J., Molinos J. G., et al. (2018). Improved fisheries management could offset many negative effects of climate change. Sci. Adv. 4 (8), eaao1378. doi: 10.1126/sciadv.aao137
Godefroid M., Boldt J. L., Thorson J. T., Forrest R., Gauthier S., Flostrand L., et al. (2019). Spatio-temporal models provide new insights on the biotic and abiotic drivers shaping pacific herring (Clupea pallasi) distribution. Prog. Oceanogr. 178, 102198. doi: 10.1016/j.pocean.2019.102198
Granger V., Fromentin J. M., Bez N., Relini G., Meynard C. N., Gaertner J. C., et al. (2015). Large-Scale spatio-temporal monitoring highlights hotspots of demersal fish diversity in the Mediterranean Sea. Prog. Oceanogr. 130, 65–74. doi: 10.1016/j.pocean.2014.10.002
Grüss A., Gao J., Thorson J. T., Rooper C. N., Thompson G., Boldt J. L., et al. (2020). Estimating synchronous changes in condition and density in eastern Bering Sea fishes. Mar. Ecol. Prog. Ser. 635, 169–185. doi: 10.3354/meps13213
Grüss A., Walter J. F. III, Babcock E. A., Forrestal F. C., Thorson J. T., Lauretta M. V., et al. (2019). Evaluation of the impacts of different treatments of spatio-temporal variation in catch-per-unit-effort standardization models. Fish. Res. 213, 75–93. doi: 10.1016/j.fishres.2019.01.008
Guo Y. N., Xu Z., Zhang L. P., Hu Y. H., Li L. (2014). Occurrence of Hysterothylacium and Anisakis nematodes (Ascaridida: Ascaridoidea) in the tanaka’s snailfish Liparis tanakae (Gilbert & Burke)(Scorpaeniformes: Liparidae). Parasitol. Res. 113 (4), 1289–1300. doi: 10.1007/s00436-014-3767-2
Han Q., Grüss A., Shan X., Jin X., Thorson J. T. (2021). Understanding patterns of distribution shifts and range expansion/contraction for small Yellow croaker (Larimichthys polyactis) in the Yellow Sea. Fish. Oceanogr. 30 (1), 69–84. doi: 10.1111/fog.12503
Han Q., Shan X., Jin X., Gorfine H., Chen Y., Su C. (2022). Changes in distribution patterns for larimichthys polyactis in response to multiple pressures in the bohai sea over the past four decades. Front. Mar. Sci, 9, 941045. doi: 10.3389/fmars.2022.941045
Issifu I., Alava J. J., Lam V. W., Sumaila U. R. (2022). Impact of ocean warming, overfishing and mercury on European fisheries: A risk assessment and policy solution framework. Front. Mar. Sci. 8, 770805. doi: 10.3389/fmars.2021.770805
Jin X., Tang Q. (1996). Changes in fish species diversity and dominant species composition in the Yellow Sea. Fish. Res. 26 (3–4), 337–352. doi: 10.1016/0165-7836(95)00422-X
Jin X., Zhang B., Xue Y. (2010). The response of the diets of four carnivorous fishes to variations in the Yellow Sea ecosystem. Deep Sea Res. Part II. Top. Stud. Oceanogr. 57 (11–12), 996–1000. doi: 10.1016/j.dsr2.2010.02.001
Kidé S. O., Manté C., Dubroca L., Demarcq H., Mérigot B. (2015). Spatio-temporal dynamics of exploited groundfish species assemblages faced to environmental and fishing forcings: Insights from the mauritanian exclusive economic zone. PloS One 10 (10), e0141566. doi: 10.1371/journal.pone.0141566
Li Z., Jin X., Zhang B., Zhou Z., Shan X., Dai F. (2012). Interannual variations in the population characteristics of the pacific cod Gadus macrocephalus in the Yellow Sea. Oceanol. Limnol. Sinica. 43 (5), 924–931. doi: CNKI:SUN:HYFZ.0.2012-05-009
Lindegren M., Checkley D. M. Jr., Rouyer T., MacCall A. D., Stenseth N. C., et al. (2013). Climate, fishing, and fluctuations of sardine and anchovy in the California current. Proc. Natl. Acad. Sci. U.S.A. 110 (33), 13672–13677. doi: 10.1073/pnas.1305733110
Lin Q., Jin X., Zhang B. (2013). Trophic interactions, ecosystem structure and function in the southern Yellow Sea. Chin. J. Ocean. Limnol. 31, 46–58. doi: 10.1007/s00343-013-2013-6
Lin C. L., Ning X. R., Su J. L., Lin Y., Xu B. (2005). Environmental changes and the responses of the ecosystems of the Yellow Sea during 1976–2000. J. Mar. Syst. 55 (3-4), 223–234. doi: 10.1016/j.jmarsys.2004.08.001
Liu R, Chen L, Luo S, Zhu X, Jiang Z, et al. (2022). The complete mitochondrial genome of snailfish Liparis tanakae Gilbert & Burke 1912 (Perciformes: Cottioidei: Liparidae). Mitochondrial. DNA B. 7 (4), 649–651. doi: 10.1080/23802359.2022.2060767
Li H. M., Zhang C. S., Han X. R., Shi X. Y., et al. (2015). Changes in concentrations of oxygen, dissolved nitrogen, phosphate, and silicate in the southern Yellow Sea 1980–2012: sources and seaward gradients. Estuar. Coast. Shelf Sci. 163, 44–55. doi: 10.1016/j.ecss.2014.12.013
McLeod A. I. (2015) Kendall. Available at: https://cran.r-project.org/web/packages/Kendall/Kendall.pdf.
Myoung S. H., Ban T. W., Kim J. K. (2016). Population structure of Liparis tanakae (PISCES, liparidae) from Korea based on morphological and molecular traits. Korean J. Fish. Aquat. Sci. 49 (2), 198–207. doi: 10.5657/KFAS.2016.0198
Niu M., Wang J. (2017). Variation in the distribution of wintering anchovy Engraulis japonicus and its relationship with water temperature in the central and southern Yellow Sea. Chin. J. Oceanol. Limnol. 35 (5), 1134–1143. doi: 10.1007/s00343-017-6134-1
Perretti C. T., Thorson J. T. (2019). Spatio-temporal dynamics of summer flounder (Paralichthys dentatus) on the northeast US shelf. Fish. Res. 215, 62–68. doi: 10.1016/j.fishres.2019.03.006
R Core Team (2022). R: A language and environment for statistical computing (Vienna, Austria: R Foundation for Statistical Computing).
Shan X., Jin X., Zhou Z., Dai F. (2012). Stock dynamics of cleisthenes herzensteini in the central and southern Yellow Sea. Sheng Tai Xue Bao 32 (5), 244–252. doi: 10.1016/j.chnaes.2012.07.010
Shelton A. O., Sullaway G. H., Ward E. J., Feist B. E., Somers K. A., Tuttle V. J., et al. (2021). Redistribution of salmon populations in the northeast Pacific ocean in response to climate. Fish Fish 22(3), 503–517. doi: 10.1111/faf.12530
Tang Q. (2009). “Changing states of the Yellow Sea Large marine ecosystem: anthropogenic forcing and climate impacts,” in Sustaining the world’s large marine ecosystems. Eds. Sherman K., Aquarone M. C., Adams S. (Gland, Switzerland: IUCN), 77–88.
Teng G., Shan X., Jin X., Yang T. (2021). Marine litter on the seafloors of the Bohai Sea, Yellow Sea and northern East China Sea. Mar. pollut. Bull. 169, 112516. doi: 10.1016/j.marpolbul.2021.112516
Thorson J. T. (2019a). Guidance for decisions using the vector autoregressive spatio-temporal (VAST) package in stock, ecosystem, habitat and climate assessments. Fish. Res. 210, 143–161. doi: 10.1016/j.fishres.2018.10.013
Thorson J. T. (2019b). Measuring the impact of oceanographic indices on species distribution shifts: The spatially varying effect of cold-pool extent in the eastern Bering Sea. Limnol. Oceanogr. 64 (6), 2632–2645. doi: 10.1002/lno.11238
Thorson J. T., Barnett L. A. K. (2017). Comparing estimates of abundance trends and distribution shifts using single-and multispecies models of fishes and biogenic habitat. ICES J. Mar. Sci. 74, 1311–1321. doi: 10.1093/icesjms/fsw193
Thorson J. T., Pinsky M. L., Ward E. J. (2016). Model-based inference for estimating shifts in species distribution, area occupied and centre of gravity. Methods Ecol. Evol. 7 (8), 990–1002. doi: 10.1111/2041-210X.12567
Thorson J. T., Shelton A. O., Ward E. J., Skaug H. J. (2015). Geostatistical delta-generalized linear mixed models improve precision for estimated abundance indices for West coast groundfishes. ICES J. Mar. Sci. 72 (5), 1297–1310. doi: 10.1093/icesjms/fsu243
Tomiyama T., Yamada M., Yoshida T. (2013). Seasonal migration of the snailfish Liparis tanakae and their habitat overlap with 0-year-old Japanese flounder Paralichthys olivaceus. J. Mar. Biolog. Assoc. U. K. 93 (7), 1981–1987. doi: 10.1017/S0025315413000544
Volkoff H., Rønnestad I. (2020). Effects of temperature on feeding and digestive processes in fish. Temperature 7 (4), 307–320. doi: 10.1080/23328940.2020.1765950
Waters J. D., Coelho R., Fernandez-Carvalho J., Timmers A. A., Wiley T., Seitz J. C., et al. (2014). Use of encounter data to model spatio-temporal distribution patterns of endangered smalltooth sawfish, Pristis pectinata, in the western atlantic. Aquatic conservation: Marine and freshwater ecosystems. Aquat. Conserv. 24 (6), 760–776. doi: 10.1002/aqc.2461
Wilson J. R., Lomonico S., Bradley D., Sievanen L., Dempsey T., Bell M., et al. (2018). Adaptive comanagement to achieve climate-ready fisheries. Conserv. Lett. 11 (6), e12452. doi: 10.1111/conl.12452
Xu B., Jin X. (2005). Variations in fish community structure during winter in the southern Yellow Sea over the period 1985–2002. Fish. Res. 71 (1), 79–91. doi: 10.1016/j.fishres.2004.07.011
Zhang B., Jin X., Dai F. (2011). Feeding habits and their variation of seasnail (Liparis tanakae) in the central and southern Yellow Sea. Shuichan Xuebao 35 (8), 1199–1207. doi: 10.3724/SP.J.1231.2011.17505
Zhang B., Tang Q., Jin X. (2007). Decadal-scale variations of trophic levels at high trophic levels in the Yellow Sea and the Bohai Sea ecosystem. J. Mar. Syst. 67 (3-4), 304–311. doi: 10.1016/j.jmarsys.2006.04.015
Zhang S. W., Wang Q. Y., Lü Y., Cui H., Yuan Y. L. (2008). Observation of the seasonal evolution of the Yellow Sea cold water mass in 1996–1998. Cont. Shelf Res. 28 (3), 442–457. doi: 10.1016/j.csr.2007.10.002
Keywords: exploitation pressure, prey density, sea surface temperature, hotpots, vector autoregressive spatio-temporal model
Citation: Chen Y, Shan X, Han Q, Gorfine H, Dai F and Jin X (2022) Long-term changes in the spatio-temporal distribution of snailfish Liparis tanakae in the Yellow Sea under fishing and environmental changes. Front. Mar. Sci. 9:1024086. doi: 10.3389/fmars.2022.1024086
Received: 21 August 2022; Accepted: 22 September 2022;
Published: 17 October 2022.
Edited by:
Hui Zhang, Institute of Oceanology (CAS), ChinaCopyright © 2022 Chen, Shan, Han, Gorfine, Dai and Jin. This is an open-access article distributed under the terms of the Creative Commons Attribution License (CC BY). The use, distribution or reproduction in other forums is permitted, provided the original author(s) and the copyright owner(s) are credited and that the original publication in this journal is cited, in accordance with accepted academic practice. No use, distribution or reproduction is permitted which does not comply with these terms.
*Correspondence: Xiujuan Shan, c2hhbnhqQHlzZnJpLmFjLmNu
Disclaimer: All claims expressed in this article are solely those of the authors and do not necessarily represent those of their affiliated organizations, or those of the publisher, the editors and the reviewers. Any product that may be evaluated in this article or claim that may be made by its manufacturer is not guaranteed or endorsed by the publisher.
Research integrity at Frontiers
Learn more about the work of our research integrity team to safeguard the quality of each article we publish.