 Chao Ying
 Yunze Yang1*
 Yongchao Liu
- 1School of Civil & Environmental Engineering and Geography Science, Ningbo University, Ningbo, China
- 2Donghai Academy, Ningbo University, Ningbo, China
Introduction: Large-scale and high-intensity marine resource exploitation activities have brought irreversible influences on the marine resource environment and ecosystem. As an important index to evaluate the state of marine development, the marine resource environmental carrying capacity (MRECC) is vital to the sustainable development of the sea areas.
Methods: In this study, an evaluation index system was established based on the PS-DR-DP (Pressure and Support-Destructiveness and Resilience- Degradation and Promotion) theoretical model. The MRECC in Zhejiang Province from 2004 to 2018 was evaluated through the categorical arrangement polygon representation. Moreover, the coordination degree of the MRECC system was analyzed by using the coupling harmonious degree model.
Results and Discussion: Results demonstrated the following from 2004 to 2018: 1) The MRECC level in Zhejiang Province increased firstly, then decreased slightly, and finally presented a slow increasing trend. 2) The mean contributions of the acting forces in the MRECC system in Zhejiang Province fluctuate between 0.64 and 0.68. It was in the high-speed unsteady growth and tended to be the ideal carrying state. The positive force tends to increase, while the negative force is generally stable or only slightly increased except for the degradation force. 3) The coupling degree and degree of coupling coordination of the acting force subsystems in the marine resource environmental system in Zhejiang Province presented a rising trend. The coupling degree ranged between 0.50 and 0.80 except for those in 2004, 2006, and 2007. The acting force subsystems in the marine resource environmental system in Zhejiang Province were generally running-in during the study period. The coupling degree type changed from mild imbalance to moderate coordination.
Introduction
The marine resource environmental carrying capacity (MRECC) refers to the ability or limit of resources and environmental capacity within certain sea areas to afford human economic activities and social development (Stojanovic and Farmer, 2013). It is an important index to measure whether the sea area is in the sustainable development state. The global marine economy has been developing quickly since the 21st century, and it has become a new growth point of national economy in coastal regions. Meanwhile, the increasing marine development degree brings greater and greater pressures over marine resources and marine ecological environment, resulting in a series of problems, such as exhaustion of marine resources, degradation of sea water quality, and reduction of marine biodiversity. It is urgent to determine the man–marine relationship again. Man–marine sustainable development has become a key concern of the whole world and the focus of sustainable development (Batty, 2000; Liu et al., 2018). Therefore, evaluating the MRECC is conducive to reasonable development of marine resources and achievement of man–marine sustainable development.
The term carrying capacity originated from mechanics, and it is derived from the theory of “population boom” (Malthus, 1872). In 1921, Park applied carrying capacity to the ecological field for the first time (Park and Burgess, 1970). Subsequently, the concept of carrying capacity began to propagate continuously, and it was applied to various fields, such as economics, sociology, and environmental science. At the end of the 1980s, the theoretical connotations of carrying capacity increased gradually after the concept of sustainable development was proposed on World commission on Environment and Development (WECD). The research scope has been expanding continuously from the single solid concept (Hadwen and Palmer, 1922; Cohen, 1995; Young, 1998) (e.g., population carrying capacity, community carrying capacity, resource carrying capacity, environmental carrying capacity, and ecological carrying capacity) to the more general comprehensive concept (Liu et al., 2020; Shi et al., 2020) (e.g., regional carrying capacity, resource environmental carrying capacity, and social ecological carrying capacity). The early resource environmental carrying capacity was proposed under the background of global resource environmental crisis in the 1960s~1970s. It mainly discusses economic and social development problems of human beings under resource environmental restrictions. Specifically, The Limits to Growth published by the Club of Rome in 1972 had the most significant influences. It evaluated global resource environments (including lands, water, food, and minerals) and human activities by using the system dynamics model. A “World Model” was constructed, and it predicted that global economic growth would reach the upper limit in the middle of the 21st century (Meadows and Randers, 2012). As studies deepened continuously, Arrow et al. (1995) published Economic growth, carrying capacity, and the environment in Ecological Economics in 1995. This not only expanded the concept and theory of resource environmental carrying capacity but also promoted the development of quantitative methods from single indexes to multi-indexes (Arrow et al., 1995) and raised the research tide on resource environmental carrying capacity.
The MRECC evaluation can be viewed as the application and practice of resource environmental carrying capacity evaluation at the marine areas. The concept of the MRECC was firstly proposed in the field of seafood aquaculture, which refers to the aquaculture intensity and scale that can be carried under the specific marine biophysical environment (Dame and Prins, 1997; Luo et al., 2001). It was originally concentrated in studies on carrying capacity and sustainable development threshold of fishes, shellfishes, and other resources (Dame and Prins, 1997; Vasconcellos and Gasalla, 2001). With the continuous exploitation and utilization of marine resources and environment, the concept of the MRECC gradually extended to the study of other single marine elements, such as carrying capacity of beach resources (Silva and Ferreira, 2013; Zhang and Niu, 2021), carrying capacity of marine tourism resources (Coccossis and Mexa, 2017), and carrying capacity of marine fishing resources (Agmour et al., 2018). Later, as resource constraints become tighter, environmental pollution intensifies, ecosystem degradation and other issues continue to emerge, people gradually pay attention to the marine resources and environment of coastal economic and social development with great support. Therefore, the MRECC began to turn to the concept of comprehensive carrying capacity including resources, environment, and social economy, that is, in a certain period and regional scope, under the condition that maintaining the structure of marine resources meets the needs of sustainable development, and the marine ecological environment function still has the ability to maintain its steady effect, the regional marine resources and environment system can carry all kinds of human social and economic activities. Most of the existing studies mainly focus on the introduction to the concept of the MRECC, operation mechanism, and single-element carrying capacity evaluation (Ariani et al., 2020; Bui and Tran, 2022; Wu et al., 2022). However, single-element carrying capacity often cannot reflect the marine resource environmental conditions accurately, and it cannot meet requirements on scientific protection and marine management. Compared to the development history of the resource carrying capacity development like water, land, and forest, the MRECC has a short development history and it is still not mature enough, which is why it is rare to use systematic and comprehensive methods to evaluate the MRECC. Although the relationship and role of the marine resources and environment system with the external environment in the complex system of “resources environment socio-economic” have been highlighted (Du and Wang, 2021; Yang et al., 2022), the quantitative criteria for the carrier (marine resources and environment system) and the carrier (socioeconomic activities involving the sea) need to be verified. Hence, it is still necessary to strengthen studies on the MRECC continuously to improve the quantitative evaluation, analysis, and dynamic study methods of the MRECC.
At present, state-space method (Di et al., 2007; Wu et al., 2022), supply-demand analytical method (Wang, 2008; Di et al., 2015), system dynamics method (Ying et al., 2022), and comprehensive evaluation method (Song and Ning, 2020; Wang et al., 2021b) are major methods to evaluate the MRECC. State-space method can express logic relations among variables relatively comprehensively, and it is applicable to regions with a relatively complicated resource environmental system. However, quantitative calculation of the state-space method is relatively complicated, and there is no uniform quantitation standard to determine some ideal values. It is easy to be influenced by subjective cognition, thus resulting in poor accuracy of the evaluation results. Since resource environmental carrying state often can be judged according to supply-demand conditions of the resource environment, supply-demand analytical method can evaluate the resource environmental carrying capacity by using energy as the medium to measure the supply-demand conditions. It mainly includes the common ecological footprint model (Du and Wang, 2021), Aggregate demand-Aggregate supply (AD-AS) model (Su et al., 2014), and difference method (Wang et al., 2021c). Although these models and methods are easy and feasible in calculation, they easily ignore mutual influences of the elements. As a result, the evaluation results of supply-demand analytical method cannot reflect the carrying state accurately. The system dynamics method simulates the resource environmental carrying capacity through operation and outputs to represent the driving relationship between the social and resource environment and development. It is a system suitable to process multivariables and multifeedbacks. However, it is easy to have problems in model design due to difficulties in reference variable setting and geographic restrictions. A comprehensive evaluation method is used mostly extensively to evaluate the resource environmental carrying capacity at present. It generally selects indexes comprehensively and provides clear evaluation results with strong logics. Nevertheless, it still has some problems, such as big necessary data size and easily ignoring two-way dynamic relations among indexes. All of the above four evaluation methods ignore openness and dynamics of the marine system and lack discussions on ultimate carrying capacity based on the stable man–marine system, thus getting smaller results than practical carrying capacity. Hence, based on the existing evaluation methods and considering the principles of “growth limit” and “structural stability,” this paper divides the MRECC into six interrelated and interpenetrating forces to better reflect the bidirectional dynamic relationship among indicators and realize the construction of the PS-DR-DP (Pressure-support; Destructiveness-resilience; Degradation-promotion) model. The full array polygon graphic method and multidimensional multiplier method are used to evaluate the MRECC, which not only retain the advantages of clear and logical evaluation results of the comprehensive evaluation method but also dynamically represent the changes in the MRECC by filling the regular hexagon model. In addition, the method just needs to determine the upper and lower limits to carry out the evaluation, reduces the impact of human subjective will in the evaluation process, and improves the accuracy of the evaluation.
Marine sustainable development has become an important principle for development in coastal regions. In the Second Global Marine Assessment published in 2021, it clearly pointed out that people shall pay more attention to marine ecological environmental protection and sustainable development. Moreover, coastal countries and regions have to strengthen the assessment of the carrying capacity continuously to determine the marine state. As a marine economic demonstration zone in China, Zhejiang Province is located at the intersection of the Yangtze River Development Axis and China’s coastal development axis. It plays an important strategic role in the development of the national marine economy, and it is an important regional unit to promote marine economic development and participate in global competition. In 2020, Zhejiang’s marine Gross Domestic Produc(GDP) will reach 920 billion yuan, accounting for about 14% of the province’s GDP, 4%–5% higher than the national average, making significant contributions to the regional economy. At the same time, the rapid development of the marine economy has also led to serious degradation of the marine resources and environment, making it one of the most polluted and damaged sea areas in China (Hu et al., 2019). There is an urgent need for resource and environmental protection and restoration. In 2017, Zhejiang Province issued the Building and Implementation Scheme of a Marine Ecological Construction Demonstration Base, which determined resource environmental protection as an important goal of the ecological construction demonstration base. Therefore, studying the MRECC in Zhejiang Province not only is conducive to promote Zhejiang Province to develop as a “strong marine province” but also has long-term strategic significance and regional representativeness.
In this study, a theoretical model of the MRECC that combines social economy, ecological environment, and energy resources was proposed according to the principle of growth limit and based on comprehensive considerations to the man–marine system stability. This model was used to divide, evaluate, and analyze levels and states of the MRECC in Zhejiang Province from 2004 to 2018. The coupling degree of the MRECC system was measured by combining the coupling harmonious degree model. This study is expected to provide theoretical references for Zhejiang Province to develop as a strong marine province and form the economic development mode corresponding to the resource environment. Moreover, it is a beneficial exploration to evaluate the MRECC.
Materials and methods
Study area
Zhejiang Province is located in the southeast coastal regions of China. There is a small land area (only 105,500 km2) but an extensive sea area (including the exclusive economic zone and continental shelf, reaching 260,000 km2). It contains six bays, including Hangzhou Bay, Xiangshan Bay, Sanmen Bay, Taizhou Bay, Leqing Bay, and Wenzhou Bay. There are abundant marine resources, and the coastal line is about 6,486 km long (including 2,254 km continental coastal line and 4,232 km island coastal line), which accounts for about 20.31% of the total coastal line in China, ranking top in China. Meanwhile, Zhejiang Province has over 3,000 islands, and it is the province with the most islands in China. As one of the important provinces in China’s strategic development of “a maritime power,” Zhejiang Province undertakes the important mission of maintaining sustainable and high-efficiency development of the man–marine resource environment, and it is the core zone of the economic belt and urban agglomeration in the Yangtze River Delta. Now, the marine economic development in Zhejiang Province is in the optimization and updating stage. Key attention is paid to strengthen the marine ecological civilization construction and try to facilitate the transition from the extensive production mode of marine resources to the intensive production mode. The total marine output of Zhejiang Province in 2020 reached 920 billion yuan, which accounted for about 14% of the GDP of the province. It had considerable contributions to regional economy. However, it has to be noted that with the marine economic development, marine resources and environmental problems become increasingly prominent, and it is urgent to evaluate the MRECC.
The MRECC is proposed based on the stable man–marine relationship. The research object is the complicated marine-man-land system. Human activities in the coastal regions that are closely related to the sea areas also may influence the marine-man-land system significantly. Hence, the research scope of the MRECC should include not only the resources, environment, and human activities in marine areas but also the land areas connected with them. Based on the availability of data and complexity of the MRECC, the sea areas within the jurisdiction of Zhejiang Province and the relevant provincial administrative district were chosen as the study area.
Pressure-support and destructiveness-resilience and degradation-promotion theoretical model
The PSR (Pressure-State-Response) and DPSIR (Driving Force-Pressure-State-Influence-Response) models are often used to simulate the MRECC at present. The PSR model is composed of pressure, state, and response. Specifically, pressure is caused by social economic activities of human beings. State describes the ecological environmental condition and natural resource conditions. Response refers to measures that people adopt to relieve the resource environmental pressure caused by changes in the state. The PSR model can well express the causal relationship between pressure and degradation. It is usually used to study ecological environmental resources (Cheng et al., 2012), evaluate ecological safety (Li et al., 2021), and evaluate urban ecological health (Xie et al., 2021). However, it emphasizes more on ecological environment and lacks corresponding economic indexes. Moreover, it relies too much on subjective experiences of research during data acquisition. Hence, the PSR model is unsuitable for complicated systems (Wang and Li, 2020). The DPSIR model is built based on the PSR model. It is composed of five components, including driving force, pressure, state, influence, and response. Specifically, driving force is the potential cause of environmental changes. Pressure is a direct pressure factor of environment, and it induces environmental changes through long-term direct acting on the environmental system through the driving force. State refers to various environmental changes under the action of pressure, and it shows the status of the environmental system. Influence refers to effects of the natural system status on social and economic development structure. Response is the countermeasure that people adopt to cope with the influences of the environmental changes (Kelble et al., 2013; Wang, 2016). The DPSIR model can well express the causal relationship between the environment and the economy by emphasizing the equal importance of the economy and the environment. However, it emphasizes on state indexes too much, ignoring the relationship between state changes and the environment. Moreover, both the PSR model and the DPSIR model are simple linear causal relationships. They only reflect the philosophy of resource environmental protection under the traditional “response” mode but lack an oriented evaluation process of resource environmental alarming (Cao, 2005). After deep comparison and model analysis, a PS-DR-DP theoretical model for the MRECC evaluation was built in this study based on the PSR model and the DPSIR model according to the marine resource environmental characteristics in Zhejiang Province.
The PS-DR-DP theoretical model decomposes the MRECC into several resultant forces that form two-layer embedding of triangles and hexagons. The PS-DR-DP theoretical model simulates changes in the MRECC by embedding triangles into regular hexagons (Figure 1), thus forming the evaluation model. This model decomposes the MRECC into three parts: resource utilization conditions, environmental capacity and disaster resistance, and resource environmental degradation and development from three perspectives of marine resources, natural environment and disasters, and society and technology. These three parts are further decomposed into the three pairs of correlated and mutually restricted resultant forces: pressure and supporting force, destructive force and resilience force, and degradation force and promotion force. The resultant force of pressure and supporting force expresses the resource utilization condition. The resultant force of destructive force and resilience force expresses environmental capacity and disaster resistance. The resultant force of degradation force and promotion force expresses the positive promotion of social technological development to the resource development. The dynamic development process of the resource environmental carrying capacity level was simulated by filling in the regular hexagon model. In this way, a monitoring and alarming model of the resource environmental carrying state was constructed, which accomplished the alarming-oriented evaluation of the resource environment.
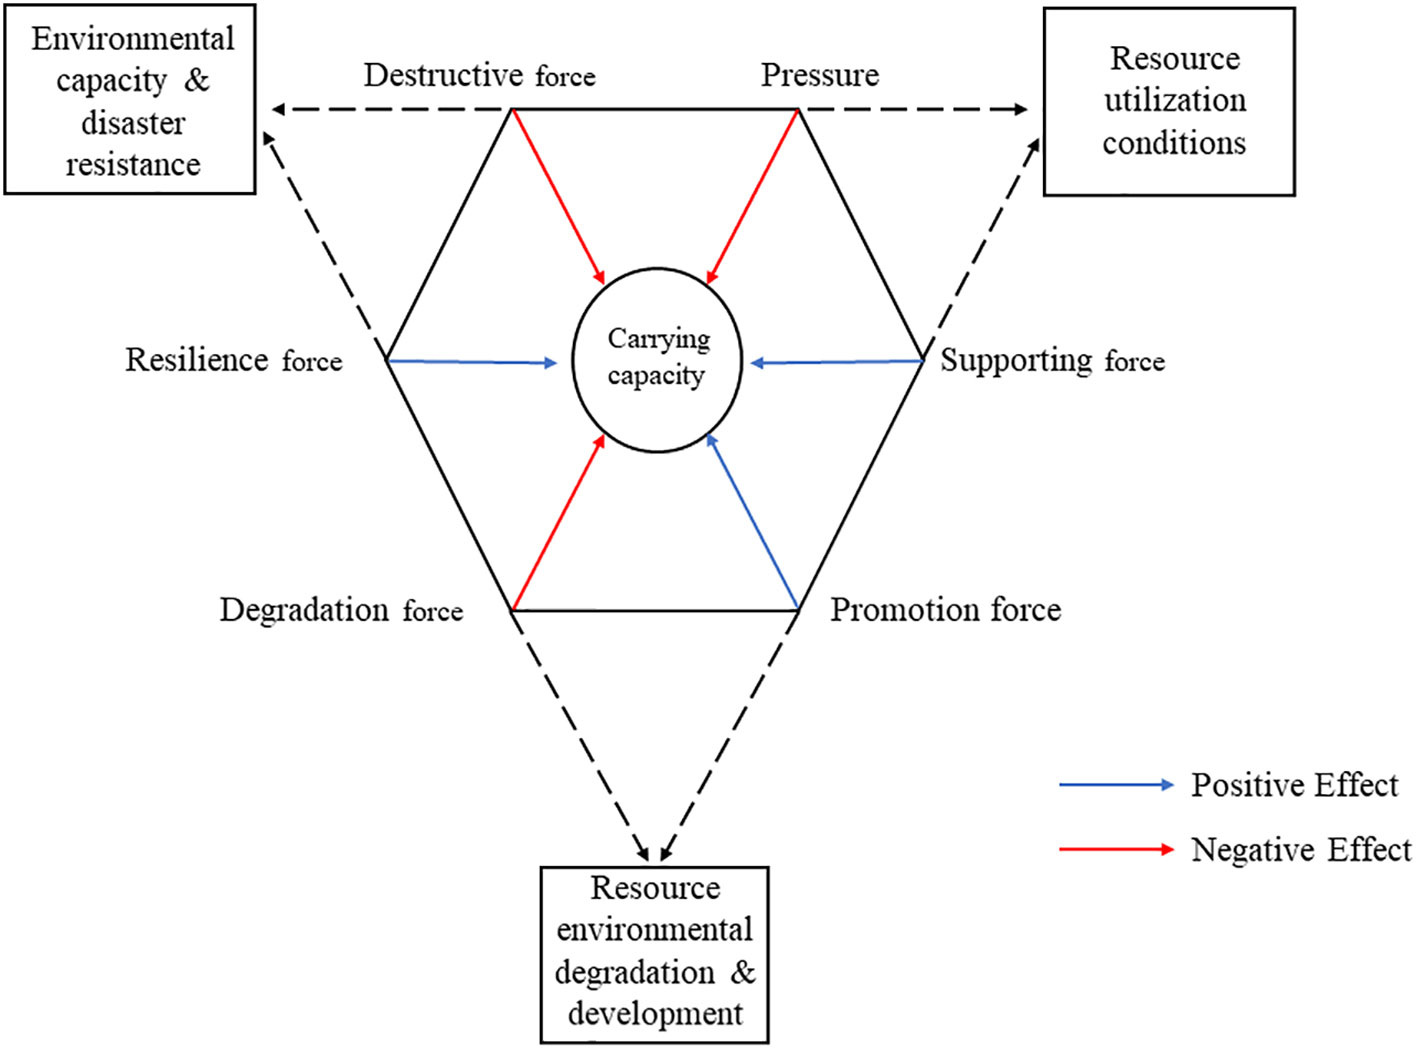
Figure 1 The Pressure-Support and Destructiveness-Resilience and Degradation-Promotion theoretical model of marine resource and environmental carrying capacity.
In the built PS-DR-DP model, Pressure (P) represents the total resource consumption of people for social and economic activities. Supporting force (S) represents the potential resources available under the current scientific technological conditions. Destructive force (D) represents the environmental pollution and damages caused by human social and economic activities as well as damages to human development caused by large disasters. Resilience force (R) refers to the ability in environmental governance, ecological restoration, and disaster risk control to maintain the marine environment. Degradation force (D) represents the state after the resource and natural environmental degradation. Promotion force (P) means that human beings relieve or inhibit the degradation speed by improving the scientific technological level and implementing social policy protection, thus realizing the sustainable development of the sea areas.
Establishment of the evaluation index system
Building an index system is the core in the MRECC evaluation, and it has crucial influences on the reliability of the evaluation results. The MRECC is the comprehensive performance of the resource carrying capacity and environmental carrying capacity. Due to the large number of relevant indicators and their respective regional characteristics, it is impossible to establish a unified evaluation indicator system. Therefore, this paper is based on the Technical Guidelines for Evaluation of Resources Environmental Carrying Capacity and Territory Space Development Suitability (Trial) issued by the Ministry of Natural Resources and the four levels of pressure, development and utilization, pollutants, and health status included in the basic evaluation in the Several Opinions on the Establishment of a Long-Term Monitoring and Early Warning Mechanism for Resources and Environment Carrying Capacity issued by the Central Committee of the Communist Party of China. With references to existing associated studies (Gou et al., 2018; Wang and Liu, 2019; Du et al., 2020; Huang et al., 2021) and combining with practical social, economic, and marine resource environmental conditions in Zhejiang Province, an evaluation index system for the MRECC in Zhejiang Province was built in this study based on the PS theoretical model by observing the basic principles of science, comprehensiveness, representativeness, dynamics, openness, and operability. Finally, the evaluation index system (Table 1) is composed of 47 specific indexes, 14 level-2 indexes, six level-1 indexes, and three criteria layers.
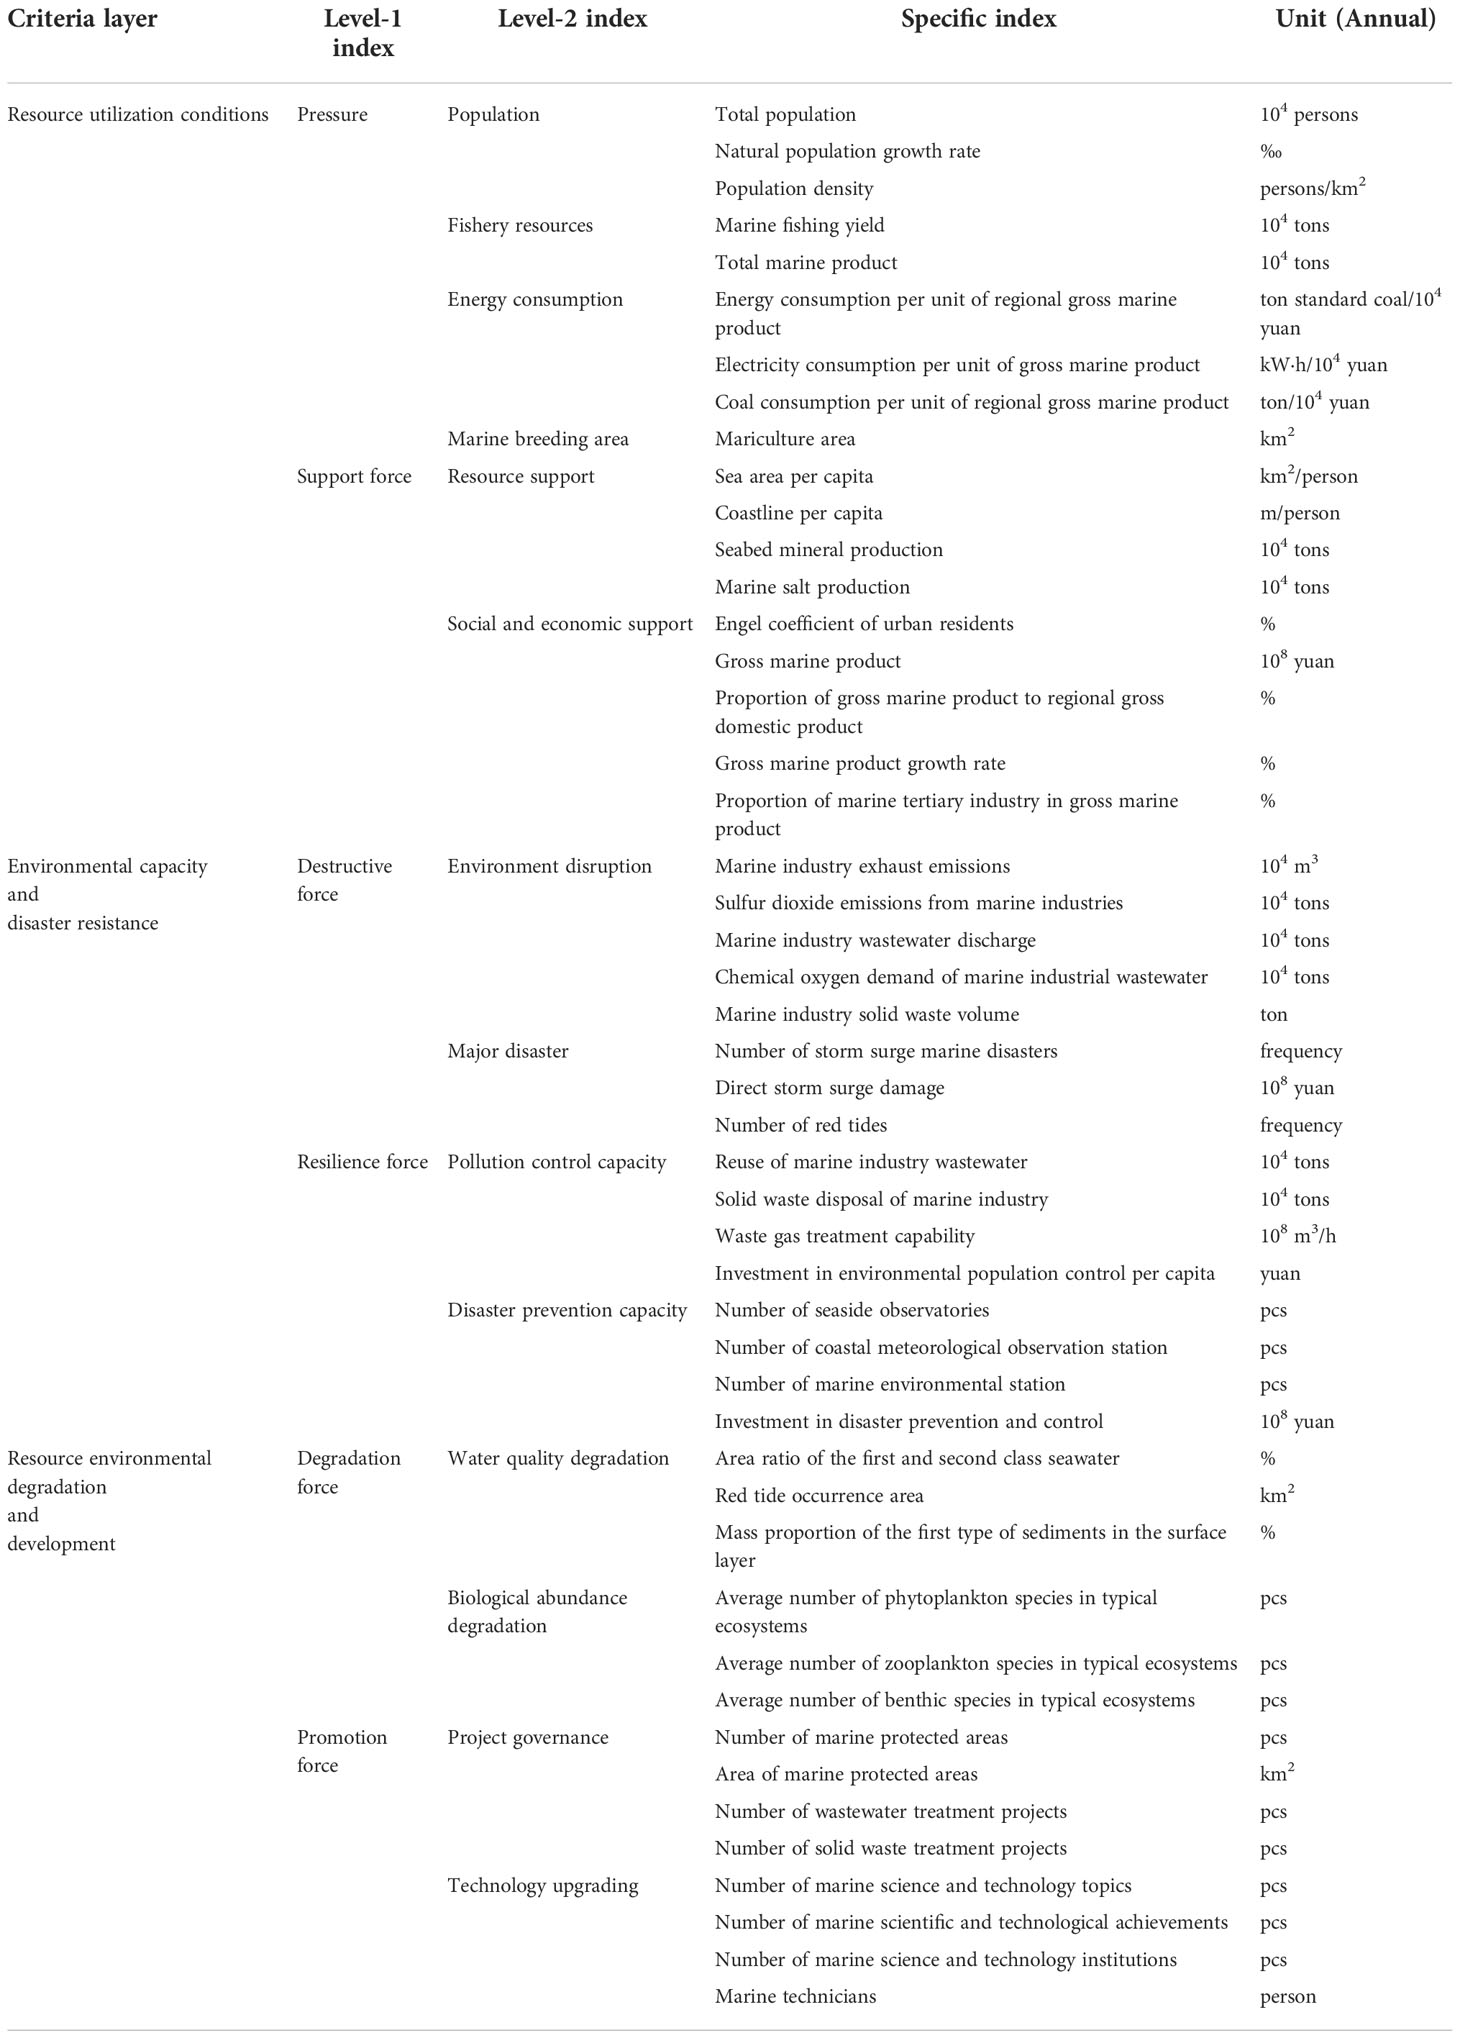
Table 1 Evaluation index system of the marine resources and environmental carrying capacity.
Data collection
Data were collected according to the evaluation index system in Table 1. Specifically, the economic social data came from the Statistical Yearbook of Zhejiang Province and Statistical Bulletin of National Economic and Social Development of Zhejiang Province from 2004 to 2018. Energy consumption data were from the China Energy Statistical Yearbook from 2004 to 2018. Marine environmental data and environmental governance data came from the China Ocean Yearbook, China Marine Economic Statistical Yearbook, China Environmental Statistics Yearbook, Environmental State Bulletin of Zhejiang Province, and Marine Environment Bulletin of Zhejiang Province from 2004 to 2018. Some data were collected from the Zhejiang Natural Resources and Environment Statistics Yearbook from 2008 to 2018 and Zhejiang Provincial Marine Disaster Bulletin from 2011 to 2018.
Research methods
The research ideas of this paper are mainly shown in Figure 2.
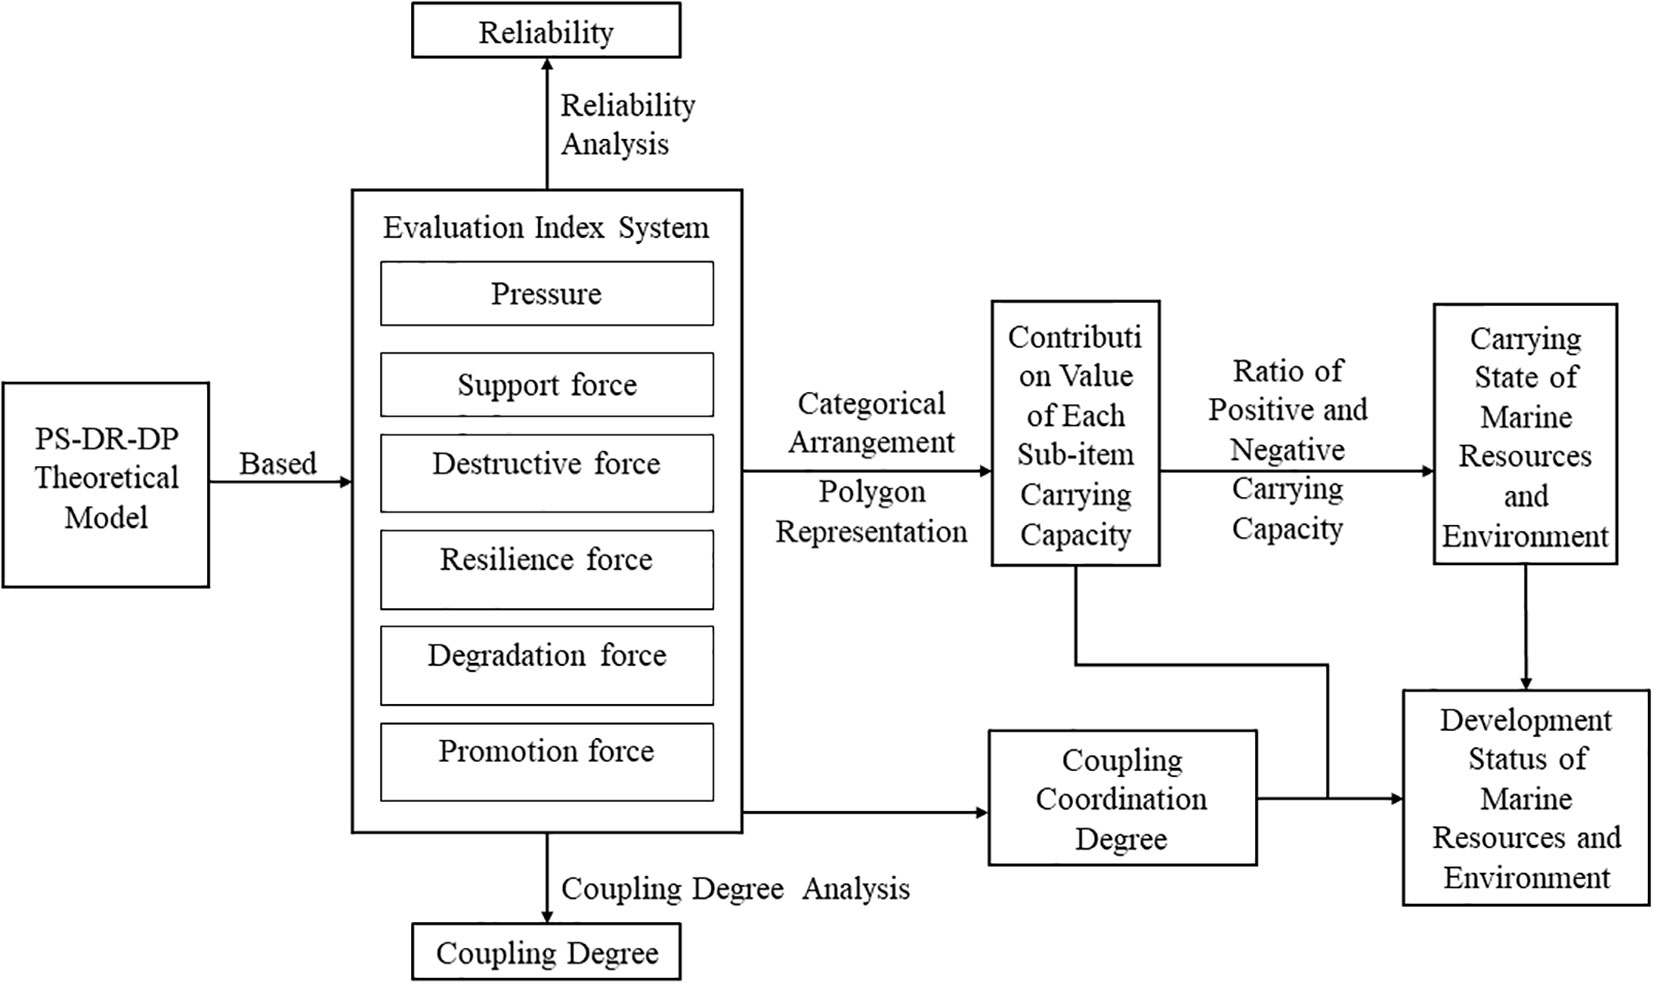
Figure 2 General idea of the marine resource environmental carrying capacity evaluation.
Reliability analysis of indexes
Reliability is the manifestation of credibility and consistency of test results. The higher reliability coefficient indicates that the test results are more reliable. In this study, the common reliability coefficient Cronbach’s α was applied to evaluate the consistency of the index system, and its equation is as follows (Mangi et al., 2007):
In the equation, α is the reliability coefficient, n is the number of variables in the index system, ∑ s2 is the variance sum within each variable group, s2 is the total variance of the index variable, is the variable value of index i in the m-th index system, and km is the mean of the variables in the m-th index system.
Original data were normalized by the min-max method, and reliability was analyzed by SPSS 15.0 software. The reliability coefficient Cronbach’s α of indexes was higher than 0.90 according to the control table of Cronbach’s α; this index system can evaluate the marine resource environmental carrying state well, so it can carry out subsequent research.
Calculation of the contributions to the marine resource environmental carrying capacity
Based on the full permutation polygonal graphical index evaluation method used in ecological assessment (Wu et al., 2005), a polygon was plotted by using the origin O as the center and the standardized upper limit (1) as the radius according to number of standardized indexes. A standard polygon was formed. Values of different indexes were between O and vertexes of the polygon. Irregular N-polygons were formed by connecting the values of the indexes. According to the principle of categorical permutation multiplication, the N indexes could form (N-1)!/2 irregular N-polygons. The ratio between the mean area of each irregular N-polygon and the standardized polygon area was defined as the contributions of different components to the MRECC, and its equation is as follows (Wang and Liu, 2019):
In the equation, C is the contribution value of each sub-item carrying capacity; N is the number of specific indicators; ki、kj is the index i and j in the specific index layer; S is the carrying state of marine resources and environment; is the contribution value of the i-th positive carrying capacity in the first-level index layer; and is the contribution value of the j-th negative carrying capacity in the first-level index layer.
Influencing factors of the MRECC interact mutually and have complicated relationships. Evaluation results based on the “short board principle” alone are not scientific and accurate enough. Hence, the marine resource environmental carrying state (S) was expressed by the ratio between the sum of the positive carrying capacities and the sum of the negative carrying capacities. When S ≥ 1, the marine resource environmental carrying state is good and the higher value indicates the better carrying state. When S < 1, the marine resource environment is in the overloading state and alarms shall be given.
Determination of the evaluation index grading standards
For better analysis of the interannual variations of the carrying capacity and variations and correlations of indexes under different carrying states, this study divided the MRECC into four grades with references to Technological Guidelines for Evaluation of Resource Environmental Carrying Capacity and Territory Space Development Suitability (Trial), Monitoring and Alarming Technical Methods for Resource Environmental Carrying Capacity (Trial), Technical Norms for Ecological Environmental Evaluation(HJ192-2015), and other relevant technological studies. 1) When 0 < C ≤ 0.30, the MRECC is at the low-level balance and approximately stable. 2) When 0.30 < C ≤ 0.70, the MRECC shows high-speed growth and it is unstable. 3) When 0.70 < C ≤ 0.85, the MRECC is in the ideal state and it is approximately stable. 4) When C > 0.85, the MRECC is under the full carrying state and it tends to be unsteady.
The mode to judge marine resource environmental carrying potentials was further proposed by combining with mean contributions of different components (C) and different carrying states. When mean C ≤ 0.30 and S < 1, the current marine resource environment is relatively poor and has small potentials. It is in the low-level overloading state, and a low-level irreversible carrying alarm shall be sent. When mean C ≤ 0.30 and S ≥ 1, the marine resource environment is in the low-level balance and people shall take the initiative to promote the development of positive acting forces. When mean C is 0.30–0.70 and S < 1, the contradiction between human economic activities and resource environment is intensifying gradually and there is a small space available in resource environmental potentials. The marine resource environment is in the moderate overloading state. When mean C is 0.30–0.70 and S ≥ 1, the marine resource environment is in the moderate balance and attention shall be paid to prevent increasing negative acting forces to the high-level irreversible carrying state (>0.85). When mean C is 0.70–0.85 and S < 1, the marine resource environment is in the high-level overloading state. Although the development level is relatively high, there is a deficit in resource environmental potentials. Causes of deficit shall be found out and solved positively. When the mean C is 0.70–0.85 and S ≥ 1, the marine resource environment is in the high-level balance state and it is the ideal development state that shall be kept continuously. When mean C > 0.85 and S < 1, the marine resource environment is in the high-level irreversible state, which is going to cause economic recession, resource exhaustion, and environmental degradation. When mean C > 0.85 and S ≥ 1, the marine resource environment is in the extremely high development level and it still has some potentials. However, the influences of the negative acting force must be decreased as soon as possible to prevent a high-level irreversible state.
Coupling degree model
The coupling degree is an index that describes interaction and mutual influences among systems. The MRECC is just the manifestation of the coupling relationship between natural factor background of the “sea area” and the carrier of “human activities” in the man–marine system. In the PS-DR-DP theoretical model, the MRECC is divided into six forces that interact and influence mutually, including pressure, supporting force, destructive force, resilience force, degradation force, and promotion force. These six acting forces were viewed as the six subsystems of the MRECC, and the coupling degree model was applied among them.
Since the traditional coupling degree model is not a mean distribution function in the interval of [0,1], it often may influence the using validity of the model. The coupling degree model was corrected based on the original formula. In this study, it tried to make C within [0,1] to increase discrimination, and its equation is as follows (Wang et al., 2021):
In the equation, C is the coupling degree, Cϵ[0,1]; Ui and Uj are the values of the i-th and j-th subsystems, Ui and Ujϵ[0,1]; n is the number of subsystems; m is the number of pairwise coupled systems; when each subsystem is more discrete, the C value is lower, and vice versa, the C value is higher.
Coupling harmonious degree model
Calculating the coupling degree alone cannot describe the harmonious development level between two systems. Hence, the coupling harmonious degree model was introduced to reflect the overall development conditions among systems, and its equation is as follows (Wang et al., 2021a):
In the equation, T is the comprehensive coordination index, αi is the undetermined coefficient of the i-th subsystem, n is the number of subsystems, and D is the coupling coordination degree. In this study, pressure, support force, degradation force, lifting force, destructive force, and recovery force are all equally important, so αi =1/6.
For better judgment of the coupling degree types and coupling harmonious states of the subsystems, the marine resource environmental carrying states were divided with references to previous research results (Wang et al., 2020; Xiao and Guo, 2021; Deng et al., 2022) (Table 2).
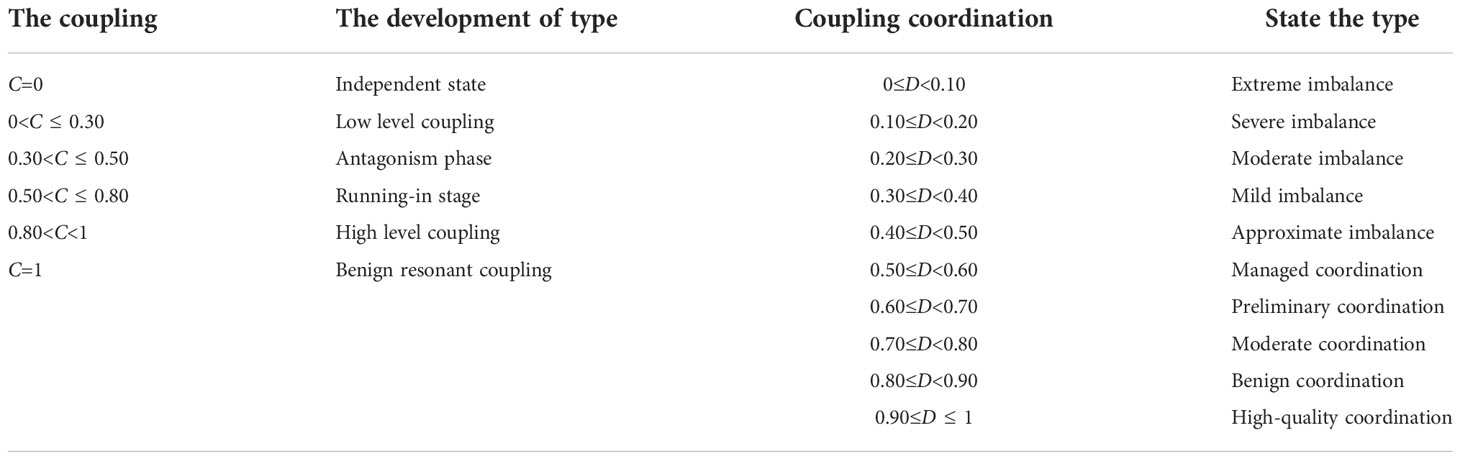
Table 2 Classification of the coupling degree and coupling coordination degree.
Results and analysis
Evaluation results of the resource environmental carrying capacity
After normalization of specific data, the evaluation values and states of the MRECC in Zhejiang Province from 2004 to 2018 were gained based on Equations 3 and 4. Specific results are shown in Table 3. A broken line graph was plotted according to the results (Figure 3). In the interval of 0.64–0.68, the mean C of the acting forces presented a slow fluctuating growth trend in 15 years. In other words, the MRECC in Zhejiang Province was generally in an unsteady state of high-speed growth, but it tended to develop toward the ideal carrying mode. The value of the marine resource environmental carrying state (S) in Zhejiang Province generally presented a rising trend. It changed from the overloading state after 2006 to a benign state, accompanied by continuous growth. Combined with the mean C and S, the contradiction between human economic activities and resource environment in the sea areas in Zhejiang province was intensified gradually from 2004 to 2005. Moreover, there is a small space for the available resource environmental potentials. The MRECC in Zhejiang Province was in the moderate overloading state. With increasing attention of the state and local government to resource environmental governance, restoration, and protection, the marine resource environmental carrying state in Zhejiang Province changed after 2006 and it was kept in the moderate balance since then. Moreover, it was developing toward the high-level balance.
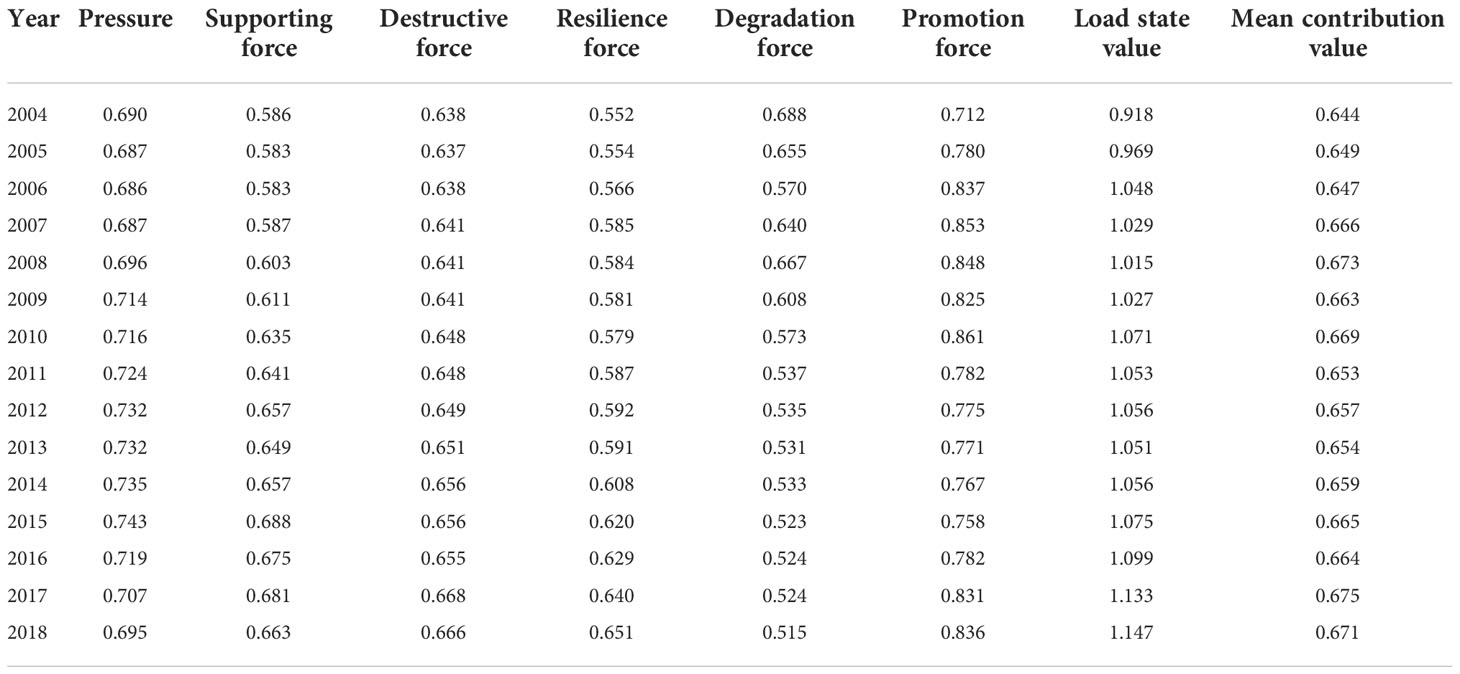
Table 3 The carrying status of the marine resources and environment in Zhejiang Province.
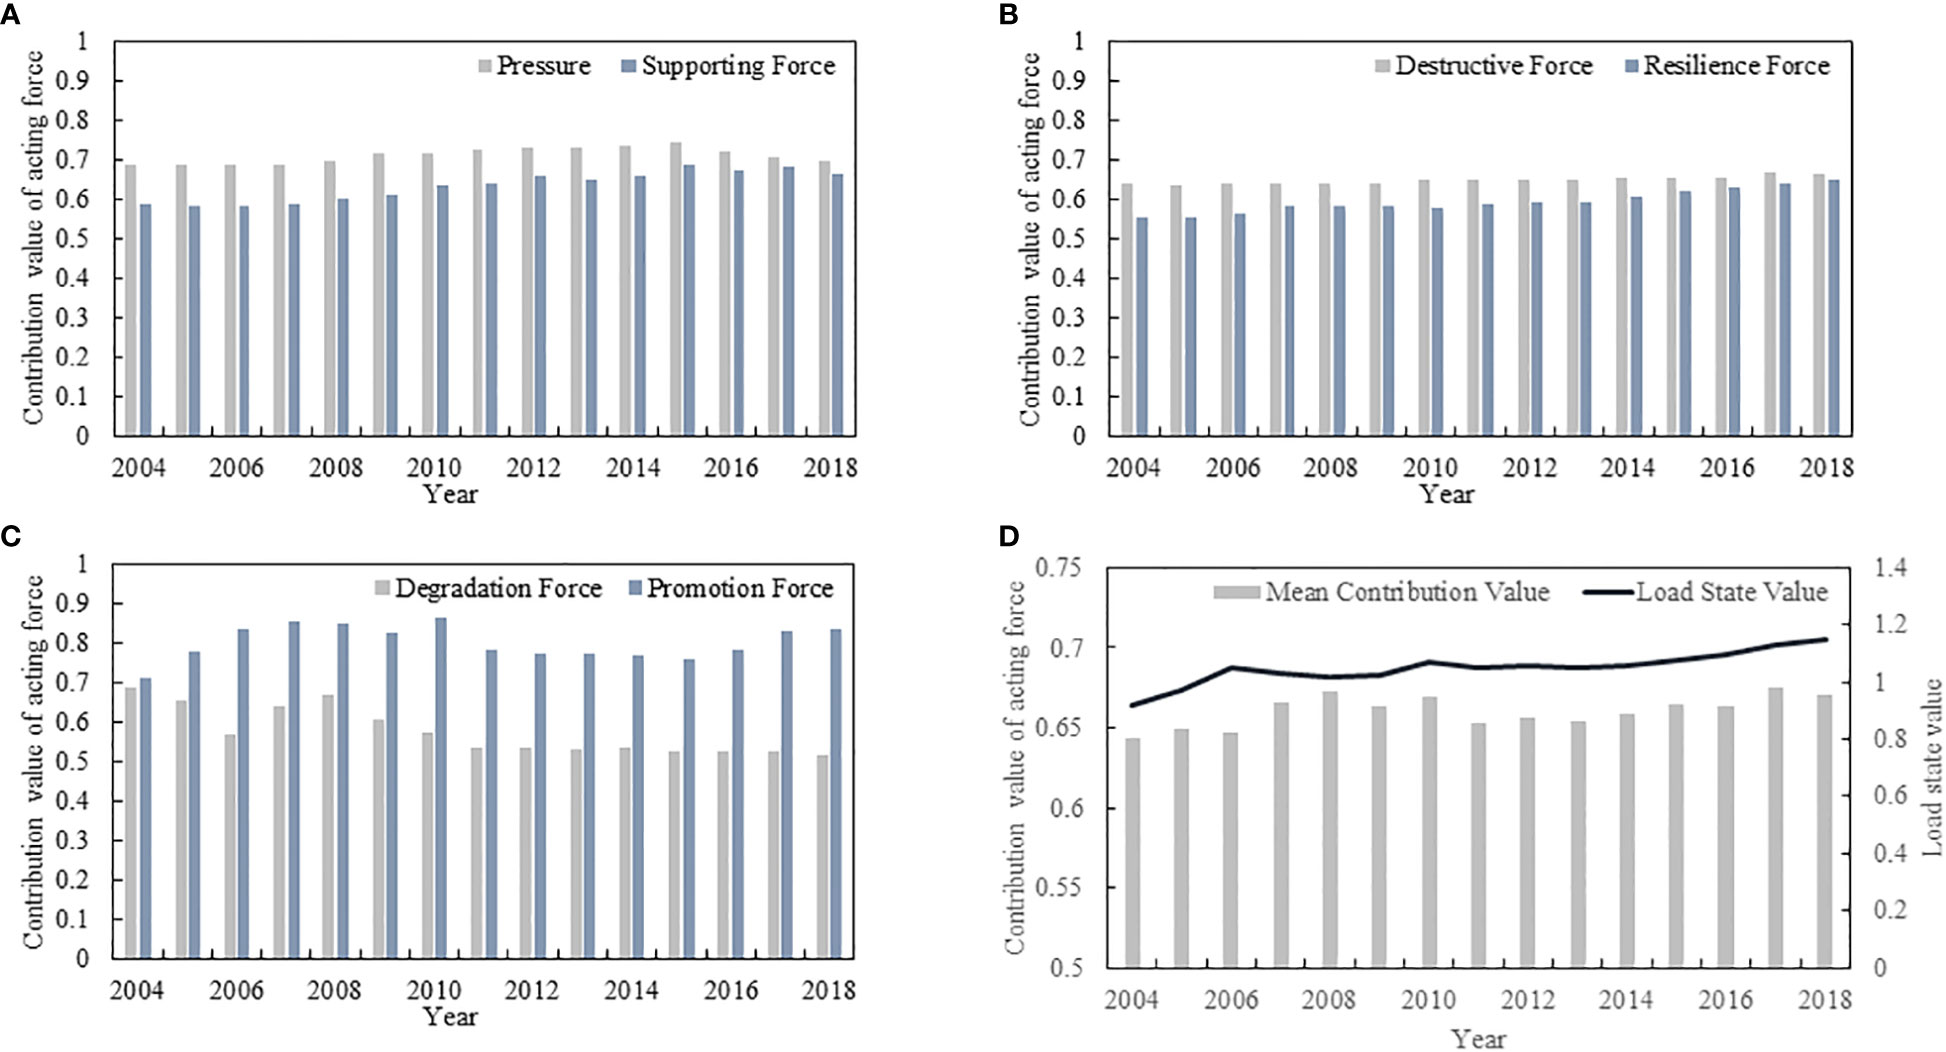
Figure 3 Changes of various forces and load state value in marine resource environmental carrying capacity in Zhejiang Province. (A) Pressure and supporting force changes, (B) Destructive force and resilience force changes, (C) Degradation force and promotion force changes, and (D) Mean contribution value of all component forces and load state value of marine resource environmental carrying capacity changes.
Additionally, the variation of the S values in Zhejiang Province presented some stages. From 2004 to 2006, the MRECC was increasing continuously and presented good development status. This was closely related to the decreasing degradation force and increasing carrying capacity. At the same time, the red tide area in Zhejiang Province decreased from 16,000 to 3,000 km2. The average number of categories of typical ecosystem phytoplankton, zooplankter, and benthos increased from 49, 35, and 21 to 62, 73, and 45, respectively. The marine environmental state and biodiversity were improved, thus decreasing the degradation force continuously. In addition, the number of wastewater and solid waste management projects increased from 163 and 1 to 533 and 10, respectively. The number of marine technological topics and achievements increased from 245 and 44 to 315 and 56, respectively. The improved government governance and scientific technological developments facilitated continuous growth of the promotion force and improvement of the marine resource environmental carrying level.
From 2007 to 2009, the MRECC in Zhejiang Province generally decreased continuously. In particular, the marine economic development suffered great impacts after the global financial crisis in 2008. The marine industrial structure changed accordingly. The proportion of the marine tertiary industry decreased from 49.50% to 47.00%. The marine first and secondary industrial development relied more on marine resources. For example, the marine fishing output increased from 2,344,200 tons to 2,666,400 tons and the total seafood output increased from 3,174,000 tons to 3,431,000 tons. The emissions of “waste gas, waste water and industrial residue” in the marine industry also increased, thus increasing the pressure in the MRECC continuously. The marine environmental governance level declined during the economic recession. For example, the per capita investment to environmental pollution control decreased from 72.50 yuan to 56.00 yuan, and the expenditure for disaster control decreased from 197 million yuan to 185 million yuan. Consequently, the resilience force and promotion force decreased to different degrees.
From 2010 to 2015, the influences of the global financial crisis weakened gradually and the marine economy in Zhejiang Province began to be restored gradually. However, dependence on the marine resources and environmental destructive force increased. The marine fishing output increased from 2.99 million tons to 3.98 million tons, and the waste gas emissions of marine industries increased from 28.22 million m3 to 33.69 million m3, thus increasing the pressure and destructive force continuously. At the same time, the state and local government paid more attention to strategic positions of the ocean and issued a series of policies related to the marine resource environment. For example, the State Council officially approved the Plan for Marine Economic Development Demonstration Base in Zhejiang Province in 2011, which symbolized that the marine economic development in Zhejiang Province was uplifted to a national development strategy. Since then, the marine economic strength of Zhejiang Province increased continuously. In 2012, the total marine outputs of Zhejiang Province reached 494.81 billion yuan, which was about 33.00% higher compared to that in 2010 and nearly 10.00% higher than that in 2011. It accounted for 10.00% of the national marine outputs. This policy strengthened the driving effect of marine economy to land economy. In the same year, the State Council officially approved to build a New Zhoushan Island Region in Zhejiang Province. Zhoushan became the first new national region themed at marine economy. It tried to become the transferring, processing, and trade center of bulk commodity in China and an important open sea gateway in Eastern China to drive the rapid development of the marine economy in Zhejiang Province. In 2013, the 12th Five-Year Plan of National Marine Industrial Development was issued, which emphasized to strengthen marine environmental monitoring and evaluation as well as improve marine ecological protection and restoration, thus facilitating the benign development of the marine resource environment. Based on the above policy backgrounds, the supporting force to the marine economy in Zhejiang Province increased continuously, accompanied by continuous improvement of the environmental governance level. The fast scientific technological development facilitated the increase of the promotion force in the MRECC, finally increasing the supporting force, resilience force, and carrying capacity to different states. These offset the negative influences of the pressure and destructive force on the MRECC. Therefore, the MRECC in Zhejiang Province was basically stable in this period.
From 2015 to 2018, the MRECC in Zhejiang Province increased gradually. The central government pointed out clearly in the “13th Five-Year Plan” in 2015 to “expand the blue economic space.” The Zhejiang Provincial government made positive responses to the policy and achieved great fruits. The total marine outputs of Zhejiang Province reached 752.41 billion yuan in 2018, which was about 25.13% higher than that in 2015. The marine industrial development of Zhejiang Province facilitated the development of the economic supporting force. In the same year, the State Oceanic Administration officially issued the Marine Ecological Civilization Construction and Implementation Scheme of the State Oceanic Administration and Opinions for Comprehensive Construction and Implementation of Marine Ecological Red Line System, which facilitated the marine ecological civilization construction and realized basic division and control in the marine resource consumption and development. Moreover, these two policies strengthened marine environmental protection and restoration, increased the resilience force and promotion force, and inhibited the negative effects of the destructive force and degradation force, thus facilitating the development of the MRECC.
The contributions of the positive acting forces in the MRECC generally increased in 15 years. Although the contributions of the negative forces fluctuated greatly in the study period except for a sharp reduction of the degradation force, they were generally stable or increased slightly. Specifically, pressure increased firstly and then decreased continuously, indicating that the marine resource consumption by human activities changed from the rising trend to the decreasing trend. The energy consumption per 10,000 yuan of total marine outputs decreased from 7.31 tons of standard coals in 2004 to 2.90 tons in 2018, while electricity consumption per 10,000 yuan of total marine outputs decreased from 9,537 kW·h in 2004 to 6,025 kW·h in 2018. Increasing energy utilization decreased the pressure over resources. Although the supporting force kept increasing, the reduction of per capita sea area, seabed mineral output, and marine salt output weakened the driving effect of the supporting force. This sounded an alarm for marine resource exploitation efficiency in Zhejiang Province. Trends of pressure and supporting force reflected that marine resource utilization in Zhejiang Province generally developed toward good directions. However, attention has to be paid to efficiency and sustainability of resource utilization.
The destructive force generally increased to a small extent. This was closely related to changes in emissions of waste gas, SO2, wastewater, and solid wastes in marine industries. From 2004 to 2018, waste gas and solid waste emissions in marine industries increased from 11,119,800 m3 and 2.21 million tons to 31,037,800 m3 and 5.62 million tons, respectively. Such significant growth of waste gas and solid waste emissions intensified environmental damages. On the contrary, the SO2 and wastewater emissions from marine industries decreased from 75,000 tons and 1,507.11 million tons to 14,000 tons and 130.60 million tons, respectively. Such reduction of SO2 and wastewater emissions weakened the environmental destructive forces of waste gas and solid wastes. Consequently, the destructive force only presented a small increasing state. The reduction of some waste emissions from marine industries proved indirectly that people have increased control over environmental pollution, but there is still great space for improvement. The resilience force increased year by year, which was closely related to reuse efficiency of wastewater, solid waste disposal rate, and waste gas governance level. At the same time, people strengthened the resistance to natural disasters by increasing monitoring and alarming continuously, thus intensifying the rising trend of the resilience force. The slight growth of the destructive force and sharp growth of the resilience force proved that people’s resistance to environmental pollution and risk disasters generally increased. However, it is still necessary to further strengthen environmental protection and restoration based on a guarantee to resource development, such as formulating pollutant discharge standards for different industries and regions, strictly controlling the discharge of land source pollutants, and reducing the pollution of coastal industrial and domestic sewage to the marine environment. At the same time, accelerating the marine ecological construction through the construction of marine protected areas and reasonable division of marine functional areas improved the environmental resilience.
Degradation force generally presents a decreasing trend, indicating that occurrences of resource and ecological environmental degradation were decreasing continuously. This was attributed to the improvement of water quality and increasing biodiversity. The proportions of Class-1 and Class-2 seawater areas in Zhejiang Province increased significantly (by 50.00%) in 15 years, while the red tide area decreased dramatically by 1,396.73% from 16,000 km2 in 2004 to 1,069 km2 in 2018. With the continuous improvement of water quality, the abundance of phytoplankton, zooplankter, and benthos in the marine ecosystem all increased continuously, thus decelerating the sea area degradation gradually. The promotion force generally presented a fluctuating rising trend. With the increasing attention to ocean and deepening studies on ocean in the past 15 years, the annual number of marine science and technological topics increased from 245 to 711, and the annual number of marine science and technological achievements increased from 44 to 103. The annual number of marine science and technological staffs increased from 721 to 2,926. The continuous marine science and technological development facilitates the improvement in the resource protection and restoration ability, thus increasing the promotion force. The reduction of the degradation force and the increase of the promotion force reflect that Zhejiang Province had proper control in the marine resource environmental governance and ecological protection. However, marine scientific and technological innovation still needs to be strengthened. Through market mechanism and policy guidance, we should establish a strategic alliance for marine scientific and technological innovation that combines industry, school, academy, government, and enterprise, tackle major marine scientific and technological problems, speed up marine ecological restoration, and timely translate scientific and technological achievements into practice to enhance the improvement of the resources and environment.
Coupling harmonious degree analysis of the marine resource environmental carrying capacity system in Zhejiang Province
According to contribution values (C) of the six acting forces in the MRECC in Zhejiang Province from 2004 to 2018, the coupling degrees and coupling harmonious degrees of the six acting forces in 15 years were calculated according to Equations 5–7 and Table 4. A broken line graph was plotted to further show the variation trend of the coupling harmonious degree (Figure 4). In the past 15 years, the coupling degree generally presented a rising trend. The coupling degree generally ranged between 0.50 and 0.80 except for those in 2004, 2006, and 2007 (0.40–0.50). It was in the running-in stage, and it tended to develop to the high-level coupling stage. Additionally, the development of the coupling degree could be divided into several stages. From 2006 to 2010, the coupling degree presented a continuous rising trend. From 2010 to 2013, the coupling degree presented a fluctuating rising trend. From 2013 to 2016, the coupling degree increased year by year. The coupling degree tended to be stable from 2016 to 2018. Such variation trend proved that Zhejiang Province has achieved some fruits preliminarily in the marine resource environmental protection and development.

Table 4 Classification of the coupling degree and coordination degree of the marine resources and environmental carrying capacity systems in Zhejiang Province from 2004 to 2018.
Figure 4 The coupling and coordination paths of various forces in the marine resources and environmental carrying capacity.
The numerical value of the coupling harmonious degree generally presented a rising trend in 15 years. It increased from 0.31 in 2004 to 0.72 in 2018. The coupling harmonious degree changed from mild imbalance to moderate coordination. Such variation of the coupling harmonious degree can be divided into five stages in time: 1) 2004–2007: mild imbalance; 2) 2008–2011: approximate imbalance; 3) 2012–2015: managed coordination; 4) 2016: preliminary coordination; 5) 2017–2018: moderate coordination. The variation trend of the coupling harmonious degree was basically the same as that of the coupling degree. It generally increased in the fluctuating manner and then tended to be stable. However, the variation amplitude of the coupling harmonious degree is greater than that of the coupling degree. This indicates that the interaction among the six acting forces in the MRECC system intensified gradually and the internal coordination of the system also improved continuously. However, the increasing rate of the coupling harmonious degree varied in different years. This might be closely related to great fluctuations in the development levels of the internal six acting force subsystems. Therefore, attention shall be paid to stable development and realize the high-level coupling of the six acting forces when decreasing the pressure, destructive force, and degradation force as well as increasing the supporting force, resilience force, and promotion force continuously.
Discussion
Suitability of the pressure and support-destructiveness and resilience-degradation and promotion theoretical model to the marine resource environmental carrying capacity evaluation
Different sea areas have unique natural environment and special resource endowment. Hence, the accurate assessment of the MRECC has become a challenge. Although previous studies have provided different methods to evaluate the MRECC (Li, 2014; Di et al., 2015; Song and Ning, 2020), their reasonability and universality to the sea areas still have to be further explored and improved. The PSR model and the DPSIR model provide a framework to build the evaluation index system. However, both the PSR model and the DPSIR model are simple linear causal relations and lack an oriented evaluation process of resource environmental alarm. Compared with these two models, the PS-DR-DP theoretical model decomposes the MRECC into several resultant forces in two-layer embedding of triangles and hexagons from the original concept: pressure, supporting force, destructive force, resilience force, degradation force, and promotion force. These six resultant forces corresponded to resource utilization condition, environmental capacity and disaster resistance, and resource environmental degradation and development. They can well express the marine resource environmental elements (resource carrying capacity, ecological environmental resilience force, and human activity) and have corresponding relations with pressure, state, and response in the PSR model (Li, 2014). According to changes in the hexagonal shape and areas caused by variations in the acting forces, the contribution values and states of the MRECC were expressed by the area index and area proportion. In this way, dynamic evaluation of resource environmental carrying capacity was realized. The marine resource environmental alarm was further provided according to the contribution values and carrying state. It provides a new way to understand the interaction between the social economy subsystem and the resource environment subsystem.
Most of the associated studies calculated the weights of the built indexes by using the entropy evaluation method (Tian et al., 2020; Wu et al., 2022), analytic hierarchy process (AHP) (Li, 2014; Zhang, 2017), and principal component analysis (PCA) (Du et al., 2020; Sun et al., 2022) when evaluating the MRECC by using the comprehensive evaluation method. However, it is inevitable to have errors in the final calculated results due to the subjectivity of humans or the fuzziness of principal components. According to other associated studies (Zhang et al., 2014; Wang and Liu, 2019), the MRECC could be evaluated only by determining appropriate upper and lower limits by using the polygonal graphic method and multidimensional multiplication method. This decreased errors in the calculation process of weights and increased the accuracy of the evaluation. Therefore, a complete set of evaluation method was formed by choosing the PS-DR-DP theoretical model, polygonal graphic method, and multidimensional multiplication method. It provides new insights to further improve the evaluation method for the MRECC (Chen et al., 2020).
In addition, there are similarities and differences between the MRECC results of Zhejiang case and the MRECC results calculated by Huang et al. (2021) using the DPSIR model, which is mainly reflected in the rapid rising trend of the MRECC obtained by Huang from 2010 to 2015, while the MRECC in this paper shows a relatively stable or slow rising trend. The reason may be that the DPSIR model overemphasizes the causal relationship between the economy and the environment and ignores the changes in the state of the sea environment. In general, the similar development trend still indicates that this evaluation method is feasible for the comprehensive evaluation of the MRECC. As a strong marine province in China, Zhejiang Province actively responds to or even surpasses the relevant national marine policies and plays a strong leading role in the development of the MRECC in coastal cities across the country. Therefore, the MRECC change trend of Zhejiang Province can reflect the development trend of China’s MRECC to a certain extent, and the results calculated in this paper are similar to the national MRECC change trend obtained by Yu et al. (2015) and Yu and Hu (2020). Moreover, this research method can be extended to different scales, such as prefecture-level cities and counties, so as to better reveal the spatial and temporal heterogeneity of the MRECC at different spatial scales.
Variation stages of the marine resource environmental carrying capacity and its correlation with marine policies
In this study, the variations of the MRECC in Zhejiang Province were measured comprehensively. It found that the MRECC generally presented a rising trend in the study period. Specifically, from 2004 to 2006, the marine pressure and degradation force decreased continuously, while the supporting force, resilience force, and promotion force increased to different extents. As a result, the MRECC in Zhejiang Province increased continuously and presented a good development trend. This was relatively consistent with the research results of Huang et al. (2021). The marine economy of Zhejiang Province was affected after 2007, especially after the global financial crisis in 2008. The resource utilization mode became more and more extensive, thus decreasing the MRECC in Zhejiang Province significantly. It began to be restored in 2010. This variation trend was relatively consistent with the previously observed reduction trend in other regions in China (Ma et al., 2017; Han et al., 2018). From 2010 to 2015, the pressure and destructive force both increased to some extent, indicating that human activities were intensifying damages to the marine resource environment continuously. Meanwhile, the resilience force and supporting force got rid of influences of the financial crisis under the support of national policies. They began to increase, thus offsetting the negative effects of the pressure and destructive force on the marine resource environment. Hence, the MRECC in Zhejiang Province was basically stable. The MRECC in Zhejiang Province presented a rising trend after 2015. This was mainly because the negative effects of the pressure, destructive force, and degradation force began to decrease gradually, while the supporting force, resilience force, and promotion force kept increasing continuously. Under the collaborative effect of the above six forces, the MRECC increased. This was consistent with previous research results (Li, 2020).
Additionally, we can find that national policies have great influences on variations of the MRECC. After the outburst of the global financial crisis, China’s marine economy was influenced to some extent. To recover and accelerate the marine economic development, the State Council issued the Guideline for National Marine Industrial Development Plan in 2008, which regulated to “develop marine economy vigorously” and provided policy guarantee to building a new development pattern of the marine economy. However, the marine industrial formation and development mainly depended on marine resources at that time, accelerating the marine economic development implied increasing the utilization of the marine resource environment. Consequently, the negative effects of the pressure and destructive force on marine resources were strengthening continuously, thus decreasing the MRECC. In 2010, the Central Committee of the Communist Party of China emphasized the strategic deployment of “developing marine economy” again on the Fifth Plenary Session of the 17th CPC Central Committee. This implied that China’s goal of developing the marine economy was more explicit. However, the problem of low marine industrial level has not been solved completely. China still achieved rapid marine economic development at the consumption of abundant marine resources. The pressure and destructive force of the marine resource environment were still increasing. However, the Central Committee of the Communist Party of China also pointed out “to improve marine development ability and strengthen marine control and comprehensive management ability.” This promotes the local government to strengthen the marine environmental governance and marine resource control, promote improvements of the resilience force and supporting force, and decelerate the reduction of the MRECC significantly. In 2012, it pointed out in the report of the 18th Party Congress to “improve marine resource exploitation ability, develop marine economy, protect marine ecological environment and build a marine power.” In other words, the government has realized the negative influences of human activities on the marine ecological environment, began to pay attention to the resource environmental conditions of the sea areas, and strengthened the marine resource environmental protection and governance. Hence, the pressure and destructive force were increasing slowly from 2010 to 2015, while the resilience force and supporting force increased continuously. In 2015, the State Oceanic Administration issued the Marine Ecological Civilization Construction and Implementation Scheme of the State Oceanic Administration and Opinions for Comprehensive Construction and Implementation of Marine Ecological Red Line System, which realized the basic division and control in marine resource consumption and development and facilitated the marine resource environmental protection and restoration. In the same year, Zhejiang Province revised the Regulations on Marine Environmental Protection in Zhejiang Province, which strengthened the marine resource environmental protection. Supported by these policies, the negative acting forces decreased, but the positive acting forces were improving continuously. Consequently, the MRECC was improved. In addition to the national and provincial policies, the relevant marine policies of prefecture-level cities have also played an important role in the development of the MRECC in Zhejiang Province. For example, Ningbo, a strong marine city in Zhejiang Province, issued the Ningbo Marine Economic Development Plan in 2011, pointing out that Ningbo should accelerate the transformation of its marine economic development mode and build a leading area for marine ecological civilization construction, providing impetus for the development of resilience and support in the MRECC of Zhejiang Province after 2011. In 2016, Ningbo Oceanographic Bureau formulated and issued the Several Provisions on the Governance and Restoration of Ningbo Marine Ecological Environment, which standardized the governance and restoration of the marine ecological environment. In the same year, Ningbo completed the Implementation Plan of Ningbo Blue Bay Renovation Action, accelerating the marine ecological environment governance and island ecological protection and contributing to the rapid improvement of the Zhejiang MRECC after 2016. In general, the variations of the MRECC in Zhejiang Province were relatively consistent with the target of national policies. This was consistent with the conclusion of Sun et al. (2022) and Li and Wang (2022) that policy support was crucial to the sustainable marine resource environmental development.
Coupling harmonious mechanism of acting forces in the marine resource environmental carrying capacity
The MRECC not only is a quantitative evaluation index that can judge whether the man–marine relationship is in the sustainable development state but also reflects the coupling relationship between the natural background of the “sea area” and the carrier of “human activities” in the man–marine system. In the PS-DR-DP model, the interaction between human activities and marine resource environment can be extracted as mutual influences and causal path among pressure, supporting force, destructive force, resilience force, degradation force, and promotion force (Figure 4). The pressure caused by human social economic activities to the marine resource environment is the general coordination mechanism, thus resulting in changes in the marine resource supply states. On the one hand, the pressure inhibits the growth of the MRECC. On the other hand, resource exhaustion can facilitate the marine ecosystem damages and environmental degradation, thus increasing the destructive force and degradation force. Moreover, human social economic activities may cause strong destructive forces to the marine ecological environment and thereby exert negative influences on the MRECC. Influenced by the pressure and destructive force together, the marine resource environment degraded to some extent, thus producing the degradation force. Increasing the degradation force often may decrease the MRECC. Resource environmental damages and degradation also may not only cause damages to human economic activities and life health but also often attract attention. Therefore, people increased the resilience force of the sea area and facilitated the development of the MRECC through direct environmental pollution governance. Moreover, increasing the resilience force is conducive to restore potential resources, thus facilitating the increase of the supporting force. Additionally, with the continuous social economic development, people also may increase the resource utilization, decrease the potential resource consumption, and facilitate the development of the supporting force by improving the production technology. Moreover, pollution control and restoration and risk resistance are strengthened, and the resource environmental degradation is decelerated by using advanced technologies. This increases not only the promotion force but also the resilience force of the marine resource environment indirectly, thus facilitating the development of the MRECC. Influenced by the promotion force and the resilience force together, the available resource utilization and consumption value both decreased to some extent, thus causing positive effects on the MRECC.
Conclusions
In order to make the MRECC evaluation more scientific and accurate, this paper constructed the PS-DR-DP theoretical model based on the review of the concept and evaluation methods of the MRECC, which decomposed the MRECC into six forces: pressure, support force, destructive force, resilience force, degradation force, and promotion force. The contributions and states of the MRECC were expressed by the area index and the area ratio using the categorical arrangement polygonal graphic method. Finally, coordination of the six acting forces in the MRECC was evaluated by the coupling degree and coupling harmonious degree. Results demonstrated the following:
1) The MRECC of Zhejiang Province showed an overall upward trend in 15 years, which was increased firstly, then decreased slightly, and finally presented a slow increasing trend. Moreover, variations of the MRECC were relatively consistent with targets of national policies. This reflected indirectly that policy supports had positive effects on the sustainable development of the marine resource environment.
2) In the past 15 years, the carrying state of the MRECC in Zhejiang Province showed an overall upward trend. It was kept at a good state and increasing after changing the overloading state in 2006. The mean contributions of the different acting forces in the MRECC of Zhejiang Province have been in the medium-level equilibrium stage since 2006 and gradually tends to develop toward the high-level equilibrium stage, except in the medium-level overload state from 2004 to 2005.
3) The mean contributions of the different acting forces fluctuated between 0.64 and 0.68, which is in the high-speed unsteady increasing state and tended to develop toward the ideal carrying mode. Moreover, contributions of the positive acting forces generally increased. Although the contributions of all negative acting forces fluctuated greatly except the sharp reduction of degradation force, they were basically stable or increased slightly. In other words, there is moderate control over the marine resource utilization, environmental governance, and ecological protection in Zhejiang Province.
4) The coupling degrees among the six acting forces in the MRECC in Zhejiang Province generally presented a rising trend in 15 years. The coupling degree was between 0.50 and 0.80 throughout the study period except in 2004, 2006, and 2007 (0.40–0.50), which was in the running-in stage. The numerical value of the coupling harmonious also presented a rising trend. The type of the coupling harmonious degree changed from mild imbalance to moderate coordination. Moreover, the variation trends of the coupling harmonious degree, coupling degree, and resource environmental carrying capacity were basically the same. They increased in the fluctuating manner firstly and then tended to be stable.
Data availability statement
The original contributions presented in the study are included in the article/supplementary material. Further inquiries can be directed to the corresponding authors.
Author contributions
CY collected and analyzed the data and wrote the manuscript. YY conceived, design, supervised and edited the study. YL analyzed the data and revised the manuscript. All authors contributed to the article and approved the submitted version.
Funding
This study is supported by the National Natural Science Foundation of China (71874091, 41976209, 42206236).
Conflict of interest
The authors declare that the research was conducted in the absence of any commercial or financial relationships that could be construed as a potential conflict of interest.
The reviewer JL declared a shared affiliation with the authors to the handling editor at time of review.
Publisher’s note
All claims expressed in this article are solely those of the authors and do not necessarily represent those of their affiliated organizations, or those of the publisher, the editors and the reviewers. Any product that may be evaluated in this article, or claim that may be made by its manufacturer, is not guaranteed or endorsed by the publisher.
References
Agmour I., Achtaich N., El Foutayeni Y. (2018). Carrying capacity influence on the incomes of seiners exploiting marine species in the Atlantic coast of Morocco. Mathematical Biosciences 305, 10–17. doi: 10.1016/j.mbs.2018.08.012
Ariani F., Rahimah I., Sipahutar R., Yanti E.-S., Paradini A. (2020). Suitability and carrying capacity analyses for marine ecotourism development of the medang deras subdistrict, batubara district, province of north sumatera. IOP Conf. Series: Earth Environ. Sci. 584 (1), 12010. doi: 10.1088/1755-1315/584/1/012010
Arrow K., Bolin B., Costanza R., Dasgupta P., Folke C., Holling C. S., et al. (1995). Economic growth, carrying capacity, and the environment. Ecol. econ 15 (2), 91–95. doi: 10.1016/0921-8009(95)00074-7
Batty M. (2000). Less is more, more is different: complexity, morphology, cities, and emergence. Environ. Plann. B: Plann. Des. 27 (2), 167–168. doi: 10.1068/b2702ed
Bui L. T., Tran D. L. T. (2022). Assessing marine environmental carrying capacity in semi-enclosed coastal areas–models and related databases. Sci. Total Environ. 2022, 156043. doi: 10.1016/j.scitotenv.2022.156043
Cao H. J. (2005). An initial study on DPSIR model. Environ. Sci. Technol. S1), 110–111+126. doi: 10.19672/j.cnki.1003-6504.2005.s1.050
Cheng Q., Zhou L. F., Zhang Y. L. (2012). Ecological environment evaluation of liaohe delta wetland based on PSR model. Adv. Mater. Res. 1793 (518-523), 1133–1136. doi: 10.4028/www.scientific.net/AMR.518-523.1133
Chen X.-P., Wu C.-F., Fang K. (2020). Differentiation and comparison of the paradigms for the carrying capacity of resources and the environment. China Land Sci. 34 (12), 17–24. doi: 10.11994/zgtdkx.20201118.142131
Coccossis H., Mexa A. (2017). The challenge of tourism carrying capacity assessment: Theory and practice (London: Routledge).
Cohen J. E. (1995). Population growth and earth's human carrying capacity. Science 269 (5222), 341–346. doi: 10.1126/science.7618100
Dame R. F., Prins T. C. (1997). Bivalve carrying capacity in coastal ecosystems. Aquat. Ecol. 31 (4), 409–421. doi: 10.1023/A:1009997011583
Deng M., Chen J., Tao F., Zhu J., Wang M. (2022). On the coupling and coordination development between environment and economy: A case study in the Yangtze river delta of China. Int. J. Environ. Res. Public Health 19, 586. doi: 10.3390/ijerph19010586
Di Q. B., Han Y. X., Gao Q. (2015). Comprehensive loading capacity of china’s oceanic ecology based on improved AD-AS model. Resour. Industries 17 (01), 74–78. doi: 10.13776/j.cnki.resourcesindustries.20141203.007
Di Q. B., Han Z., Liu G. C., Chang H. W. (2007). Carrying capacity of marine region in liaoning province. Chin. Geogr. Sci. 17 (3), 229–235. doi: 10.1007/s11769-007-0229-0
Du Y. W., Li B. Y., Quan X. J. (2020). Construction and application of DPPD model for evaluating marine resources and environment carrying capacity in China. J. Cleaner Product. 252 (C), 119655–119655. doi: 10.1016/j.jclepro.2019.119655
Du Y. W., Wang Y. C. (2021). Evaluation of marine ranching resources and environmental carrying capacity from the pressure-and-support perspective: A case study of yantai. Ecol. Indic. 126, 107688. doi: 10.1016/j.ecolind.2021.107688
Gou L. F., Wang Y. T., Jin W. B. (2018). Empirical study about the carrying capacity evaluation of marine resources and environment based on the entropy-weight TOPSIS model. Mar. Environ. Sci. 37 (04), 586–594. doi: 10.13634/j.cnki.mes.2018.04.016
Han Y., Wei F. Y., Ye. G. Q., Yang S. Y., Ma P. P., Hu W. J. (2018). A study on evaluation the marine carrying capacity in guangxi province, China. Mar. Policy 91, 66–74. doi: 10.1016/j.marpol.2018.02.003
Huang H., Hu Q. G., Ma J. T. (2021). Evaluation analysis of marine carrying capacity in zhejiang province based on DPSIR model. Econ. Geogr. 41 (11), 48–55. doi: 10.15957/j.cnki.jjdl.2021.11.006
Hu Q., Shen W., Chen Q. (2019). On the institutional roots of marine ecological damage and its countermeasures. Agric. Econ. 07, 113–122. doi: 10.13246/j.cnki.iae.2019.07.012
Kelble C.-R., Loomis D.-K., Lovelace S., Nuttle W.-K., Ortner P.-B., Fletcher P., et al. (2013). The EBM-DPSER conceptual model: integrating ecosystem services into the DPSIR framework. PloS One 8 (8), e70766. doi: 10.1371/journal.pone.0070766
Li Y. F. (2014). An integrated methodology for assessment of marine eco-environment carrying capacity in Shandong peninsula (Beijing: University of Chinese Academy of Science).
Li H. (2020). Evaluation and prediction of marine comprehensive bearing capacity in zhejiang province (Zhoushan: Zhejiang Ocean University).
Liu R., Pu L., Zhu M., Huang S., Jiang Y. (2020). Coastal resource-environmental carrying capacity assessment: A comprehensive and trade-off analysis of the case study in jiangsu coastal zone, eastern China. Ocean Coast. Manage. 186, 105092. doi: 10.1016/j.ocecoaman.2020.105092
Liu T. K., Weng T. H., Sheu H. Y. (2018). Exploring the environmental impact assessment commissioners' perspectives on the development of the seawater desalination project. Desalination 428, 108–115. doi: 10.1016/j.desal.2017.11.031
Li Q., Wang Y. (2022). Intergovernmental cooperation in marine environmental governance in shanghai, jiangsu and zhejiang regions: A quantitative analysis based on policy texts. Trans. Oceanol. Limnol. 44 (04), 166–175. doi: 10.13984/j.cnki.cn37-1141.2022.04.022
Li X. Z., Xu Z. G., Fu Y. Y., Jin Q., Zhao Y. L., Xiong N. N. (2021). Ecological security evaluation algorithm for resource-exhausted cities based on the PSR model. Computers Mater. Continua. 69 (1), 985–1001. doi: 10.32604/CMC.2021.017357
Luo J., Hartman K., Brandt S., Cerco C., Rippetoe T. (2001). A spatially-explicit approach for estimating carrying capacity: An application for the Atlantic menhaden (Brevoortia tyrannus) in Chesapeake bay. Estuar. Coasts 24 (4), 545–556. doi: 10.2307/1353256
Mangi S.-C., Roberts C.-M., Rodwell L.-D. (2007). Reef fisheries management in Kenya: Preliminary approach using the driver–pressure–state–impacts–response (DPSIR) scheme of indicators. Ocean Coast. Manage. 50 (5-6), 463–480. doi: 10.1016/j.ocecoaman.2006.10.003
Ma P. P., Ye G. Q., Peng X., Liu J. F., Qi J. G., Jia S. G. (2017). Development of an index system for evaluation of ecological carrying capacity of marine ecosystems. Ocean Coast. Manage. 144, 23–30. doi: 10.1016/j.ocecoaman.2017.04.012
Park R. E., Burgess E.W. (1970). Introduction to the science of sociology (Chicago: University of Chicago Press).
Shi S., Hu B., Yan Y., Li X., Zhou K., Tang C., et al. (2020). Dynamic evolution of the ecological carrying capacity of poverty-stricken karst counties based on ecological footprints: A case study in northwestern guangxi, China. Int. J. Environ. Res. Public Health 17, 991. doi: 10.3390/IJERPH17030991
Silva S. F., Ferreira J. C. (2013). Beach carrying capacity: The physical and social analysis at Costa de caparica, Portugal. J. Coast. Res. 65 (10065), 1039–1044. doi: 10.2112/SI65-176.1
Song Z. M., Ning L. (2020). Evaluation and obstacle factors of marine resources and environment carrying capacity of coastal provinces and cities in China based on DPSIR-TOPSIS model. Ecol. Econ. 36 (08), 154–160.
Stojanovic T. A., Farmer C. J. Q. (2013). The development of world oceans & coasts and concepts of sustainability. Mar. Policy 42, 157–165. doi: 10.1016/j.marpol.2013.02.005
Sun J., Miao J., Mu H., Xu J., Zhai N. (2022). Sustainable development in marine economy: Assessing carrying capacity of Shandong province in China. Ocean Coast. Manage. 216, 105981. doi: 10.1016/j.ocecoaman.2021.105981
Su P. P., Ye S. F., Guo Z. Y., Song T. (2014). Assessing synthetic carrying capacity based on AD-AS model. Acta Ecol. Sinica. 34 (3), 718–726. doi: 10.5846/stxb201211091573
Tian R., Shao Q., Wu F. (2020). Four-dimensional evaluation and forecasting of marine carrying capacity in China: Empirical analysis based on the entropy method and grey verhulst model. Mar. pollut. Bull. 160, 111675. doi: 10.1016/j.marpolbul.2020.111675
Vasconcellos M., Gasalla M. A. (2001). Fisheries catches and the carrying capacity of marine ecosystems in southern Brazil. Fish. Res. 50 (3), 279–295. doi: 10.1016/S0165-7836(00)00217-4
Wang R. F. (2008). Study on the difference of marine ecological footprints between xiamen and luoyuan bays (Xiamen: Xiamen University).
Wang Y. (2016). Ecological risk assessment on aeolian desertification in horqiu sandy land using multi-source data fusion and DPSIR model (Changchun: Northeast Normal University).
Wang S. J., Kong W., Ren L., Ye D., Dai B. (2021a). Research on misuses and modification of coupling coordination degree model in China. J. Natural Resour. 36 (03), 793–810. doi: 10.31497/zrzyxb.20210319
Wang Q., Li W. (2020). Research progress and prospect of regional resources and environment carrying capacity evaluation. Ecol. Environ. Sci. 29 (07), 1487–1498. doi: 10.16258/j.cnki.1674-5906.2020.07.024
Wang Z. F., Li T., Gao W. M. (2021b). Coupling analysis of marine resources and environment carrying capacity and economic development level in coastal area of hebei province. Trans. Oceanol. Limnol. 43 (06), 58–65. doi: 10.13984/j.cnki.cn37-1141.2021.06.009
Wang Y. S., Li Y. H., Jie X. M., Li Y. L., Li G. J., Wang W. T. (2020). Coupling between marine technology, economy and environment systems in China. China Popul,Res. Environ. 30 (08), 168–176. doi: 10.12062/cpre.20200312
Wang L., Liu H. (2019). The comprehensive evaluation of regional resources and environmental carrying capacity based on PS-DR-DP theoretical model. J. Geogr. Sci. 74 (02), 340–352. doi: 10.11821/dlxb201902010
Wang G., Xiao C., Qi Z., Liang X., Meng F., Sun Y. (2021). Water resource carrying capacity based on water demand prediction in Chang-ji economic circle. Water 13, 16. doi: 10.3390/w13010016
Wu K., Chen K., Gao Y., Jiang S., Huang H. (2022). Applying a set of potential methods for the integrated assessment of the marine eco-environmental carrying capacity in coastal areas. Sustainability 14 (8), 4416. doi: 10.3390/su14084416
Wu Q. R., Wang R. S., Li H. Q., Xu X. B. (2005). The indices and the evaluation method of eco-city. Acta Ecol. Sinica. 08, 2090–2095. doi: 10.3321/j.issn:1000-0933.2005.08.037
Xiao J. H., Guo S. H. (2021). Analysis on the coordinated development of marine economy and ecological environment coupling in guangdong province. J. Phys.: Conf. Series 1774 (1), 012011. doi: 10.1088/1742-6596/1774/1/012011
Xie X., Fang B., Li X., He S. S. (2021). Urban ecosystem health assessment and obstacle factor diagnosis using a comprehensive assessment model for nanjing, China. Growth Change 52 (3), 1938–1954. doi: 10.1111/GROW.12492
Yang S., Ren L., Gou L. (2022). An empirical study on the environmental carrying capacity of marine resources based on the entropy-weight TOPSIS model. J. Coast. Res. 21, 160. doi: 10.2112/jcoastres-d-21-00160.1
Ying H., Chen S., Mao Y. (2022). Research on marine ecological carrying capacity of ningbo city in China based on system dynamics. Sustainability 14 (8), 4568–4568. doi: 10.3390/su14084568
Young C. C. (1998). Defining the range: The development of carrying capacity in management practice. J. Hist. Biol. 1998, 61–83. doi: 10.1023/a:1004205522191
Yu X., Hu Q. (2020). Analysis of spatial difference and its convergence of china’s marine carrying capacity. Ocean Dev. Manage. 37 (07), 23–32. doi: 10.20016/j.cnki.hykfygl.2020.07.004
Yu J., Liu X., Ji R. (2015). Evaluation of the carrying capacity of china’s offshore water based on projection pursuit model. J. Dalian Univ. Technol. 36 (01), 1–6. doi: 10.19525/j.issn1008-407x.2015.01.001
Zhang P. (2017). Research on marine ecological carrying capacity in nantong province (Shanghai Ocean University: Shanghai).
Zhang T., Niu X. (2021). Analysis on the utilization and carrying capacity of coastal tidal flat in bays around the bohai Sea. Ocean Coast. Manage. 203, 105449. doi: 10.1016/j.ocecoaman.2020.105449
Keywords: PS-DR-DP theoretical model, coupling coordination degree model, marine resources and environmental carrying capacity, sustainable development, Zhejiang Province
Citation: Ying C, Yang Y and Liu Y (2022) Analysis of the marine resource environmental carrying capacity in Zhejiang Province based on the Pressure-Support and Destructiveness-Resilience and Degradation-Promotion (PS-DR-DP) model. Front. Mar. Sci. 9:1023769. doi: 10.3389/fmars.2022.1023769
Received: 20 August 2022; Accepted: 26 October 2022;
Published: 22 November 2022.
Edited by:
Tieyu Wang, Shantou University, ChinaReviewed by:
Jialin Li, Ningbo University, ChinaSong Jin, Yantai Institute of Coastal Zone Research (CAS), China
Yongyong Song, Shanxi Normal University, China
Copyright © 2022 Ying, Yang and Liu. This is an open-access article distributed under the terms of the Creative Commons Attribution License (CC BY). The use, distribution or reproduction in other forums is permitted, provided the original author(s) and the copyright owner(s) are credited and that the original publication in this journal is cited, in accordance with accepted academic practice. No use, distribution or reproduction is permitted which does not comply with these terms.
*Correspondence: Yunze Yang, eWFuZ195dW56ZUAxNjMuY29t; Yongchao Liu, bGl1eW9uZ2NoYW9AbmJ1LmVkdS5jbg==