
94% of researchers rate our articles as excellent or good
Learn more about the work of our research integrity team to safeguard the quality of each article we publish.
Find out more
ORIGINAL RESEARCH article
Front. Mar. Sci., 22 November 2022
Sec. Marine Fisheries, Aquaculture and Living Resources
Volume 9 - 2022 | https://doi.org/10.3389/fmars.2022.1021467
This article is part of the Research TopicInnovations in Fishing Technology Aimed at Achieving Sustainable FishingView all 23 articles
 Chryssi Mytilineou1,2*
 Bent Herrmann3,4,5
 Christopher J. Smith1
 Danai Mantopoulou-Palouka1†
 Aikaterini Anastasopoulou1
 Apostolos Siapatis1
 Antonello Sala6
 Persefoni Megalofonou2
 Nadia Papadopoulou1
 Vassiliki Vassilopoulou1Caterina Stamouli1
 Stefanos Kavadas1
 Evgenia Lefkaditou1Artemis Nicolaidou2
Fisheries have important impacts on marine biodiversity. In this work, combined information on the abundance, species richness, diversity indices, species composition, trophic level and vulnerability index were examined for the first-time to detect differences in five units related to trawl fishing: the fish assemblage entering the trawl codend, and the escaping, retained, discarded and landed fractions, derived by the gear and fisher selection practices. The work was based on a case study conducted in the Mediterranean Sea, using three different meshes in the trawl codend (40mm-40D and 50mm-50D diamond meshes, and 40 mm-40S square meshes) and a cover of the codends with small mesh size. In general, trawl fishing produces an escaping fraction that was always lower in abundance, richness, and vulnerability index, similar in diversity indices and trophic level, and different in species composition compared to the fish assemblage entering the codend. In almost all cases, fishers selected as landings a fraction that was the lowest in diversity indices, and the highest in trophic level. In contrast, fishers discarded a fraction that was the highest in diversity and vulnerability index, and the lowest in trophic level. Although the three codends did not differ significantly in the fraction of escapees in terms of diversity indices, trophic level, and vulnerability index, the 40S codend showed a significantly higher percentage in the escaping number of species and individuals, and less differences in the species composition; in addition, lower percentage in abundance of discards and higher of landings in the retained catch (0.6:1) than did the other two codends (0.9:1). It was suggested that an urgent modification of the trawl for the elimination of the discarded highly vulnerable species (e.g. Elasmobranchs) is needed, and that trawl species-selectivity should be improved by allowing escape or avoiding catch of the discarded fraction to minimize biodiversity losses.
Biodiversity is a key element in ecosystem functioning and viability, and in guaranteeing that nature will continue to provide the essential services that we depend upon. It is defined in a broad sense as “the collection of genome, species and ecosystems occurring in a definite region” (Boehlert, 1996). It is widely recognized nowadays that fisheries may have a severe impact on target and non-target species, lead to changes in the structure of marine habitats, influence diversity, composition, biomass and productivity of the associated biota, trigger indirect effects in marine populations and communities, and alter the structure and functioning of marine ecosystems (Boehlert, 1996; Jennings and Kaiser, 1998; Pauly et al., 2002; de Juan et al., 2007; Coll et al., 2008a; Coll et al., 2008b; Zhou et al., 2010; de Juan et al., 2020; Trindade-Santos et al., 2020). An example of this is the decline in Elasmobrach species in the Mediterranean and worldwide, and the high risk of their extinction due to fishing activities (Bradai et al., 2018; Dulvy et al., 2021; Walls and Dulvy, 2021); and similarly, the effects on benthic species and communities (de Juan et al., 2007; Coll et al., 2010; Clark et al., 2016). Fishing, even at sustainable levels, may cause significant biodiversity losses if compared to the status of unexploited conditions (Jennings, 2007; Collie et al., 2013 and references therein). Thus, overfishing is considered as one of the main threats to global biodiversity (Zhou et al., 2010; Trindade-Santos et al., 2020).
Biodiversity maintenance is very important for fisheries since there are positive relationships between diversity and ecosystem functions and services, while biodiversity loss decreases the resiliency of species, communities, and ecosystems to respond to and recover from perturbations, impairing the ocean’s capacity to provide food. It is evident that the long-term sustainability of fisheries is dependent on the diversity that these fisheries are changing (Boehlert, 1996; Worm et al., 2006), and it is critical to design management strategies that will improve the ecological status. The need for ecosystem-based fishery management has been recognised over the years and the Ecosystem Approach to Fisheries (EAF) has been adopted and included in fisheries policy and governance worldwide (FAO, 2003) as well as more specifically in Europe under Common Fishery Policy (COM, 2008).
Under the framework of EAF, several theoretical studies have dealt with the impact of fisheries selectivity on communities, suggesting that moderate fishing mortality across a wide range of species and sizes may better conserve biodiversity (Garcia et al., 2012 and references therein). However, further studies, suggested that neither selective nor non-selective fishing can be proposed to be preferable for conserving biodiversity since community responses depend on fisheries selectivity, but also on the particular species composition and size structure of the community under study (Rochet et al., 2011; Rochet et al., 2013). Furthermore, Coll et al. (2008a), based on selectivity data and an Ecopath modelling approach, predicted positive changes for the top predators in the Catalan Sea (W. Mediterranean) due to enhanced trawl selectivity. Based on a similar approach, Saygu et al. (2020) found that the improvement in trawl codend selectivity by using the currently legislated mesh sizes for the EU Mediterranean countries, would have a positive impact on the ecosystem as a whole and on some stocks status in Mersin Bay (E. Mediterranean). Positive effects have also been predicted by the use of a bycatch reduction device (BRD) in Colombian waters (Criales-Hernandez et al., 2006).
It is recognized worldwide that the bottom trawl is a low-selective fishing gear with large fractions of bycatch, causing habitat and benthic community disturbance and altering the ecosystem structure and functioning (Coleman and Williams, 2002; Collie et al., 2013; de Juan et al., 2020 and references therein). To the best of our knowledge, no previous study, based on onboard selectivity directed research, has evaluated the changes that take place in the total fish assemblage, which after entering the trawl codend will end up initially as two fractions (escapees and retained catch) due to the trawl selectivity; and subsequently, two further fractions due to the fisher selection (landings and discards). In the past, Tsagarakis et al. (2008) compared the diversity and the trophic level between landings and discards, but this was in relation to the retained catch, and with a historical small codend mesh size.
To quantify the effects of fishing on biodiversity at the levels of population, fish assemblage, community or ecosystem, a plethora of indices have been proposed and used (Bianchi et al., 2000; Pauly et al., 2000; Rochet and Trenkel, 2003; Blanchard et al., 2004; Coll et al., 2008b; Rochet et al., 2011; de Juan and Demestre, 2012; Rochet and Benoît, 2012; Collie et al., 2013; Shannon et al., 2014; de Juan et al., 2020; Trindade-Santos et al., 2020). In this work, to detect the effects of trawl fishing (gear and fisher selection processes), various properties of the fish assemblage entering the trawl codend and the derived fractions (escapees, retained catch, landings and discards) were studied. The properties encompassed abundance, species richness, diversity indices (entropy, evenness and dominance) and species composition. Additional descriptors related to functional characteristics of the communities in terms of trophic level (Pauly et al., 1998; Pauly et al., 2000) and vulnerability (de Juan et al., 2020) were also studied. Different trawl codends relevant to current management strategies were also tested. The case study included important trawl fishing grounds in the South Aegean Sea (Eastern Mediterranean). The overall aim was to understand the effects on, and consequences for, biodiversity related to the interaction of trawling with the encountered fish assemblage and the consequent implications in the Mediterranean trawl fishery and relevant current policies.
Data were collected during an experimental fishing survey conducted in the fishing grounds of the South Aegean Sea (E. Mediterranean) (Figure 1) during May and June 2015. The survey focused initially on the study of the selectivity of the bottom trawl codend, however, data for the present work were also collected, using the two currently in-use codend meshes, 40 mm square mesh (40S) and 50 mm diamond mesh (50D) (REC.CM-GFCM/33/2009/2; Council Regulation (EC) No 1967/2006; Regulation (EU) 2019/1241). The historical 40 mm diamond mesh (40D) codend was also tested although this is prohibited in the EU Mediterranean countries, but similar or smaller diamond meshes are still in use in other Mediterranean countries (Ragheb et al., 2019; Saygu et al., 2020). A total of 60 hauls were carried out with the three different codends (20 alternating hauls per codend in the same locations). Each haul lasted 1 h, with trawling speed 2.8 knots. Trawl performance was checked with a SCANMAR trawl monitoring system. All the hauls were located in commercial fishing grounds, mainly targeting hake (Merluccius merluccius), red mullet (Mullus barbatus), stripped mullet (Mullus surmuletus), and rose shrimp (Parapenaeus longirostris). Fishing depth ranged between 50-310 m, a good representation of the depths for the South Aegean Sea commercial trawl fishery. A commercial trawler, equipped with a commercial gear set-up, was chartered. The actual size of the mesh used in each tested codend during the experimental fishing was: (i) 40S: 43.2 6 ± 0.6 mm (mean mesh size ± standard error), (ii) 50D: 51.1 ± 0.7 mm, and (iii) 40D: 43.2 ± 0.6 mm. The three knotless codends were similar in dimension (5.6 m in length in all cases) and in material (single twine multifilament nylon-polyamide (PA), 2.8 mm thickness), and in circumferential length at sea (almost 4.3 m in all cases). For the selectivity study purposes, the cover-codend method (Wileman et al., 1996) was applied, using a net of small mesh size (20 mm) around each codend to collect the escapees as designed by Sala et al. (2015) (for details see Mytilineou et al., 2018a).
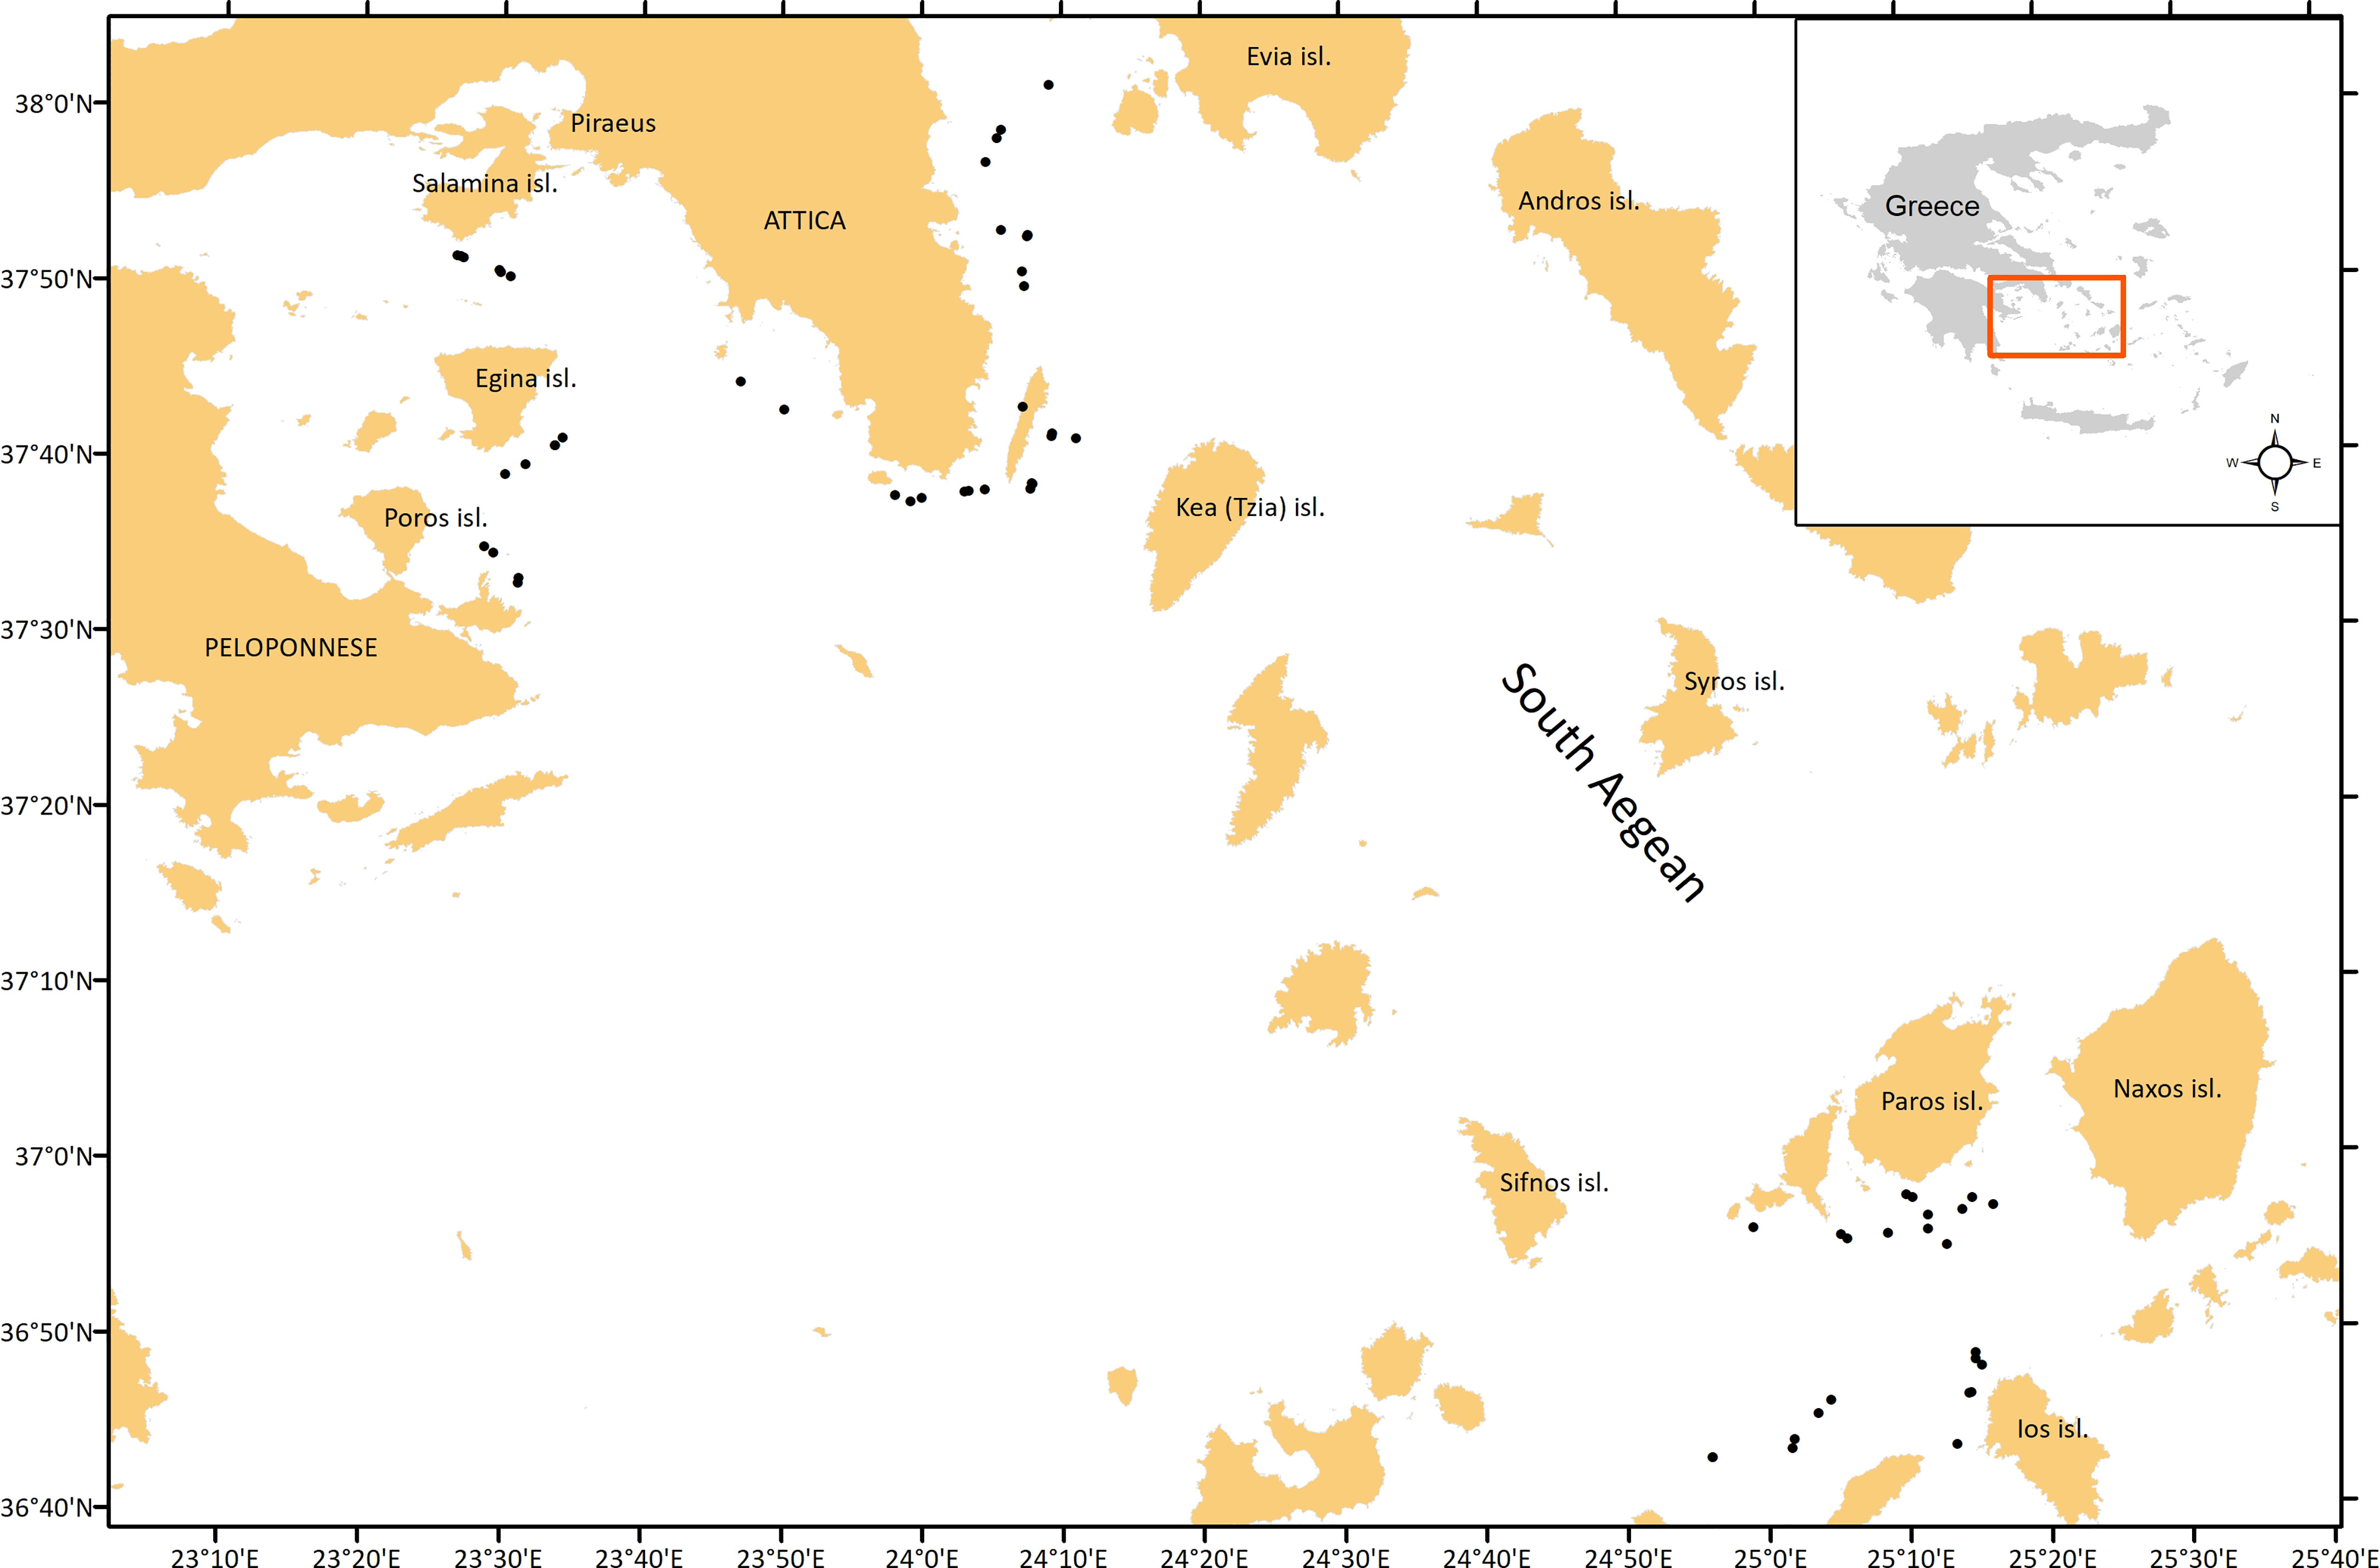
Figure 1 Map of the study area indicating the hauls of the experimental fishing.
Sampling was based on the three-fractions design including escapees, discards, and landings as described in Mytilineou et al. (2018a); Mytilineou et al. (2021a). In each fraction, all specimens were identified to the species level or the lowest possible taxonomic level (taxon namely as species hereafter), counted, and weighed. In cases of numerous individuals of a particular species, in any of the three fractions, a random subsample was used to calculate its total number. The three different codends were comparable as the alternating hauls approach was used (with the three codends used alternatively in each location), and with the same trawling duration at each sampling location.
All analyses were performed for five units of analysis: the total entering the trawl codend fish assemblage (T), escapees (E), retained catch (R), landings (L) and discards (D) of each tested codend. Based on the 3-fraction sampling scheme, landings (L) and discards (D) allowed the estimation of the retained catch (R= D+L), while the use of the cover provided the data for the escapees (E), and in sum the data for the total fish assemblage entering the codend (T= E+L+D). T was assumed to be a representative sample of the community in the sea, even if the mesh of the cover allowed very small individuals/organisms to escape. Although pelagic species are not generally representatively caught during bottom trawling, the pelagic species encountered were also included in the analysis since a part of their populations are affected by this practice (some of them escape or are caught in important quantities). In addition, since these species were incorporated in all the units of analysis of this study, we assumed that no particular bias was encountered in the analysis.
Various indicators targeting the assessment of fisheries effects on several components of the ecosystems can be found in the literature. Nevertheless, it is recognized that, the complex and multidimensional concept of biodiversity make the effectiveness and suitability of each index highly dependent on each particular case study (Daly et al., 2018). This study was based on the key diversity features for fish assemblages: abundance (N), species richness (S), entropy by means of Shannon-Wiener Index H (Shannon, 1948), evenness by means Pielou Index J (Pielou, 1966), dominance by means of the Simpson Dominance Index SDI (Simpson, 1949). The ratio of the abundance or species richness of each unit to the total assemblage entering each codend (T) (expressed as percentages: PN-T or PS-T) and the ratio of the abundance N and species richness S of the discarded or landed fractions to the retained catch (R) (expressed as percentages: PN-R or PS-R) were also examined. The indices and their formulas used to quantify these features are described in detail in Appendix A.
The interpretation of the indices mentioned above always requires looking in detail at species composition, which is another straightforward measure of a fish assemblage (Rochet and Trenkel, 2003). Because of the high number of species included in the units of analysis (Table S1 in the Supplementary Material), the results presented refer to those species with >2% contribution in abundance. This resulted in a total of 25 species from all the units of analysis, which represented >85% of the total assemblage entering each codend (T). These 25 species are shown in Table 1. Furthermore, although the contribution of all Elasmobranch species in the fish assemblage entering the codend as percentage of abundance was negligible, their exceptional vulnerability and the critical ecological status of many of them (Dulvy et al., 2021, Table S2 in the Supplementary Material) make their study of particular importance. As a result, the total Elasmobranch percentage in abundance in each unit of analysis was also reported. Similarly, the percentage in abundance of the non-commercial benthic species, including Porifera, Annelida, Echinodermata, Brachiura, Stomatopoda, Bivalvia and Gastropoda, known also for their high presence in the bycatch of trawl fishing and their vulnerability (de Juan et al., 2020), was also examined in each unit of analysis. The formulas for the percentages in abundance of each species Pi, the Elasmobrachs PElasm, and the benthic species Pbenth are also presented in Appendix A.
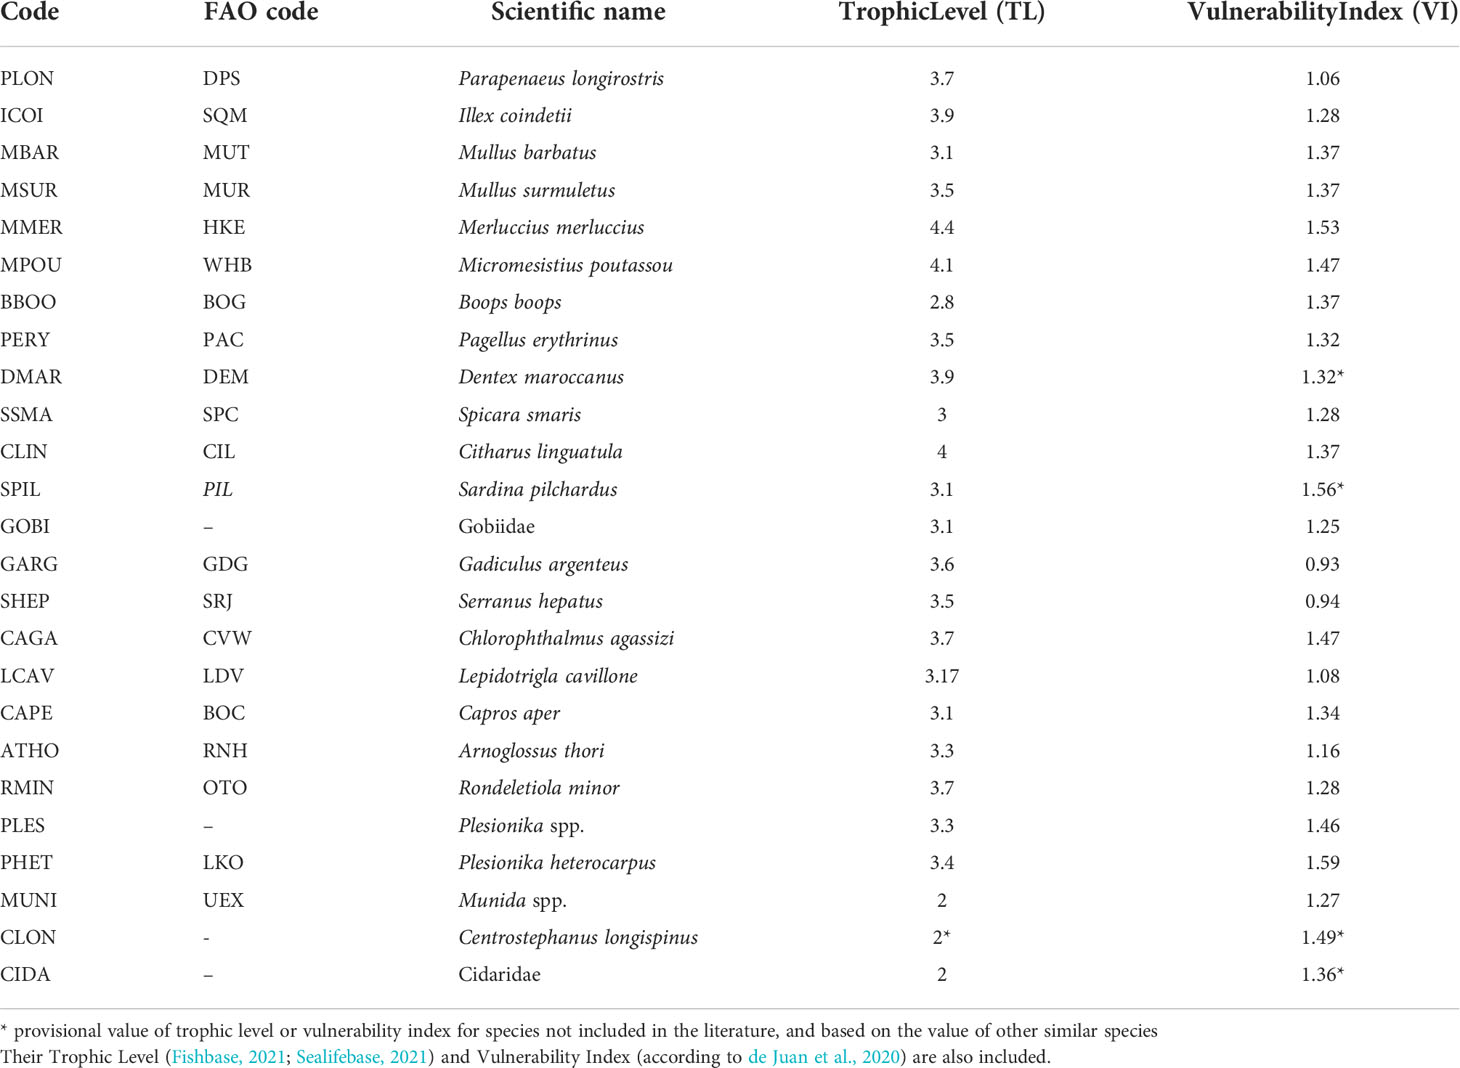
Table 1 Name code, FAO code, and scientific name of the 25 most abundant taxa in the three tested codends.
Although the work focussed on the species diversity, a study of other properties of biodiversity and ecosystem status, related to more functional features of a community, was also undertaken. Many researchers have pointed to the importance of trophic interactions in communities and ecosystems as mediators in the complex responses of communities to biodiversity losses (Pauly et al., 2000; Worm and Duffy, 2003; de Juan et al., 2007; Coll et al., 2008b; Rochet et al., 2013; Shannon et al., 2014). Furthermore, mitigation of trawling effects on the ecosystem needs to be underpinned by detailed information on vulnerable species, and understanding vulnerability as the susceptibility of either an individual, species, population, community, habitat or ecosystem (de Juan et al., 2020). The present work uses the trophic level of each species as defined by Pauly et al. (1998); Pauly et al. (2000), and the vulnerability index of each species as defined by de Juan et al. (2020), to describe, respectively, the mean trophic level and the mean vulnerability index of the units of analysis of this study (T, E, R, L, D). The trophic level (TL) of many species is available in FishBase (Froese and Pauly, 2021) and SeaLifeBase (Palomares and Pauly, 2021), while the Vulnerability Index (VI) of many species is available in de Juan et al. (2020). Since these measures are not available for all the species-taxa identified in the present work, the analysis was based on the 25 most abundant species-taxa, defined by the analysis of species composition. The trophic level and vulnerability index values of each of the 25 species are shown in Table 1. In the case of absence of the TL or VI for a species (taxon), the value of a similar species (taxon) was used (e.g. VI for Dentex maroccanus as VI for Pagellus erythrinus). The formulas for the mean trophic level (TLm)and the mean vulnerability index (VIm) are also presented in Appendix A.
To estimate the uncertainty (Efron percentile 95% confidence intervals; Efron, 1982) of the above-mentioned indices the method presented by Herrmann et al. (2022) was used (see Appendix A for details).
The difference Δ (Herrmann et al., 2022) was applied for pair-wise comparisons of each index, i) between the various units of analysis (T, E, R, D, L) of each codend, and ii) for the same unit of analysis between the tested codends (see Appendix A for details).
From the 60 hauls conducted in this study using the three different trawl codends (40D, 40S, 50D) with cover, a dataset of 25032 specimens was collected, which included 300 taxa in total. These taxa comprised 253 identified Species, 200 Genera, 155 Families, 80 Orders, and 18 Classes that belonged to 10 Phyla. They included 103 Osteichthyes, 16 Elasmobranchii, 56 Crustacea, 27 Cephalopoda, 7 Ascidiacea, 25 Echinodermata, 10 Bivalvia, 15 Gastropoda, five Annelida, two other Invertebrata, nine Cnidaria, 20 Porifera, one Angiospermae, and five Algae. The taxa and their taxonomic classification are presented in the Supplementary Material (Table S1).
The results for the various biodiversity features used in this work, described separately for the three tested codends (40D, 40S, 50D) and for the five units of analysis (T, E, R, L, D), are presented in detail below.
In each tested codend, the total abundance N of the fish assemblage entering the trawl codend (T) was always statistically significantly higher than the derived fractions (Figure 2A, Table 2), as a result of the gear and fisher selection processes. The lowest N was found for the discards (D). No statistically significant differences were identified for the T between the three tested gears in terms of abundance N (see Table S3 in the Supplementary Material).
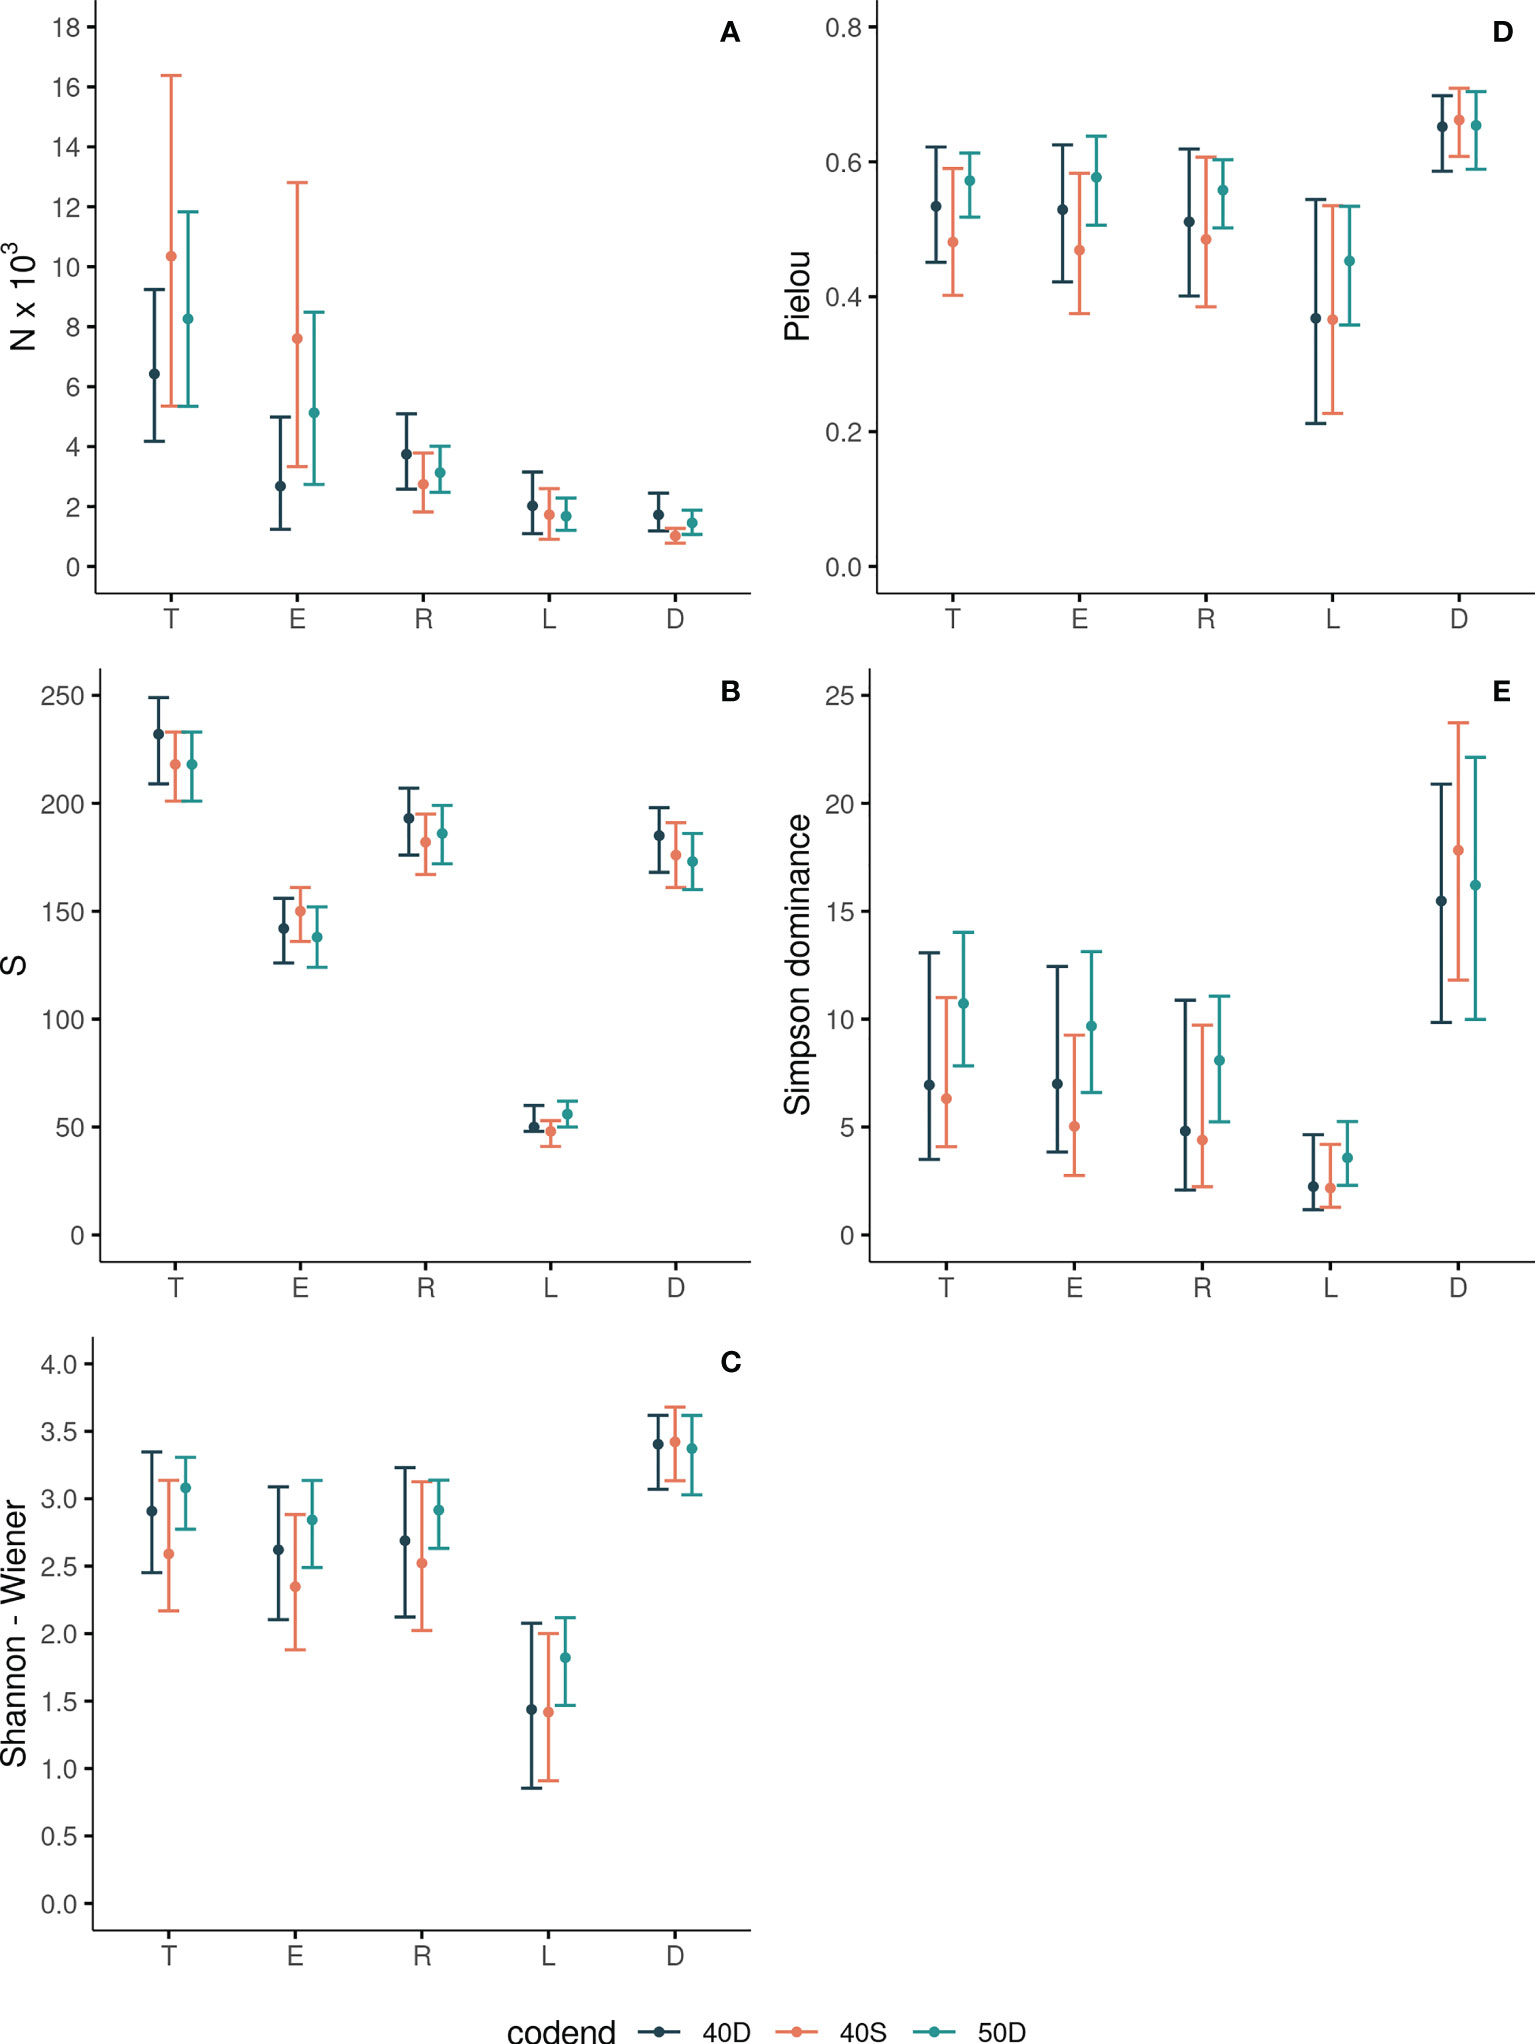
Figure 2 Abundance N (A), Species Richness S (B), Shannon-Wiener (C), Pielou (D) and Simpson Dominance (E) indices for the total assemblage entering the codend (T), escapees (E), retained catch (R), landings (L) and discards (D) for each tested codend (40D, 40S, 50D). The 95% CI are also shown with bars.
Table 2 Significance of the difference Δ in Abundance, Richness, Shannon-Wiener, Pielou, and Simpson Dominance indices between the total assemblage entering the trawl codend (T), escapees (E), retained catch (R), landings (L), and discards (D) for each tested codend (40D, 40S, 50D).
The abundance N of the escapees (E) was significantly higher compared to that of the retained catch (R) only in the case of the 40S codend (Figure 2A, Table 2). The results for the percentage PN_T of the escapees (E) revealed that more than 73% and 61% of the total assemblage (T) entering in the 40S and 50D codends, respectively, escaped; <43% for the 40D (Figure 3A). The percentage PN_T of the retained catch (R) in relation to the total assemblage (T) was ~27%, 38% and 58% in 40S, 50D and 40D, respectively (Figure 3A). The percentage of escapees (E) was statistically significantly higher than that of the retained catch (R) in both the 40S and 50D codends, with the 40S exhibiting a higher than 30% difference, while the 50D lower than 5% (see Table S4 in the Supplementary Material). Comparison between the three codends revealed statistically significant higher percentage PN_T for the escapees (E) in the 40S or 50D than the 40D, while no difference was found between the 40S and 50D codends; in contrast, higher PN_T of the retained catch (R) in the 40D (Table S3 in the Supplementary Material). Thus, depending on the codend used, a considerable part of the total assemblage entering can escape, with higher values for the 40S codend.
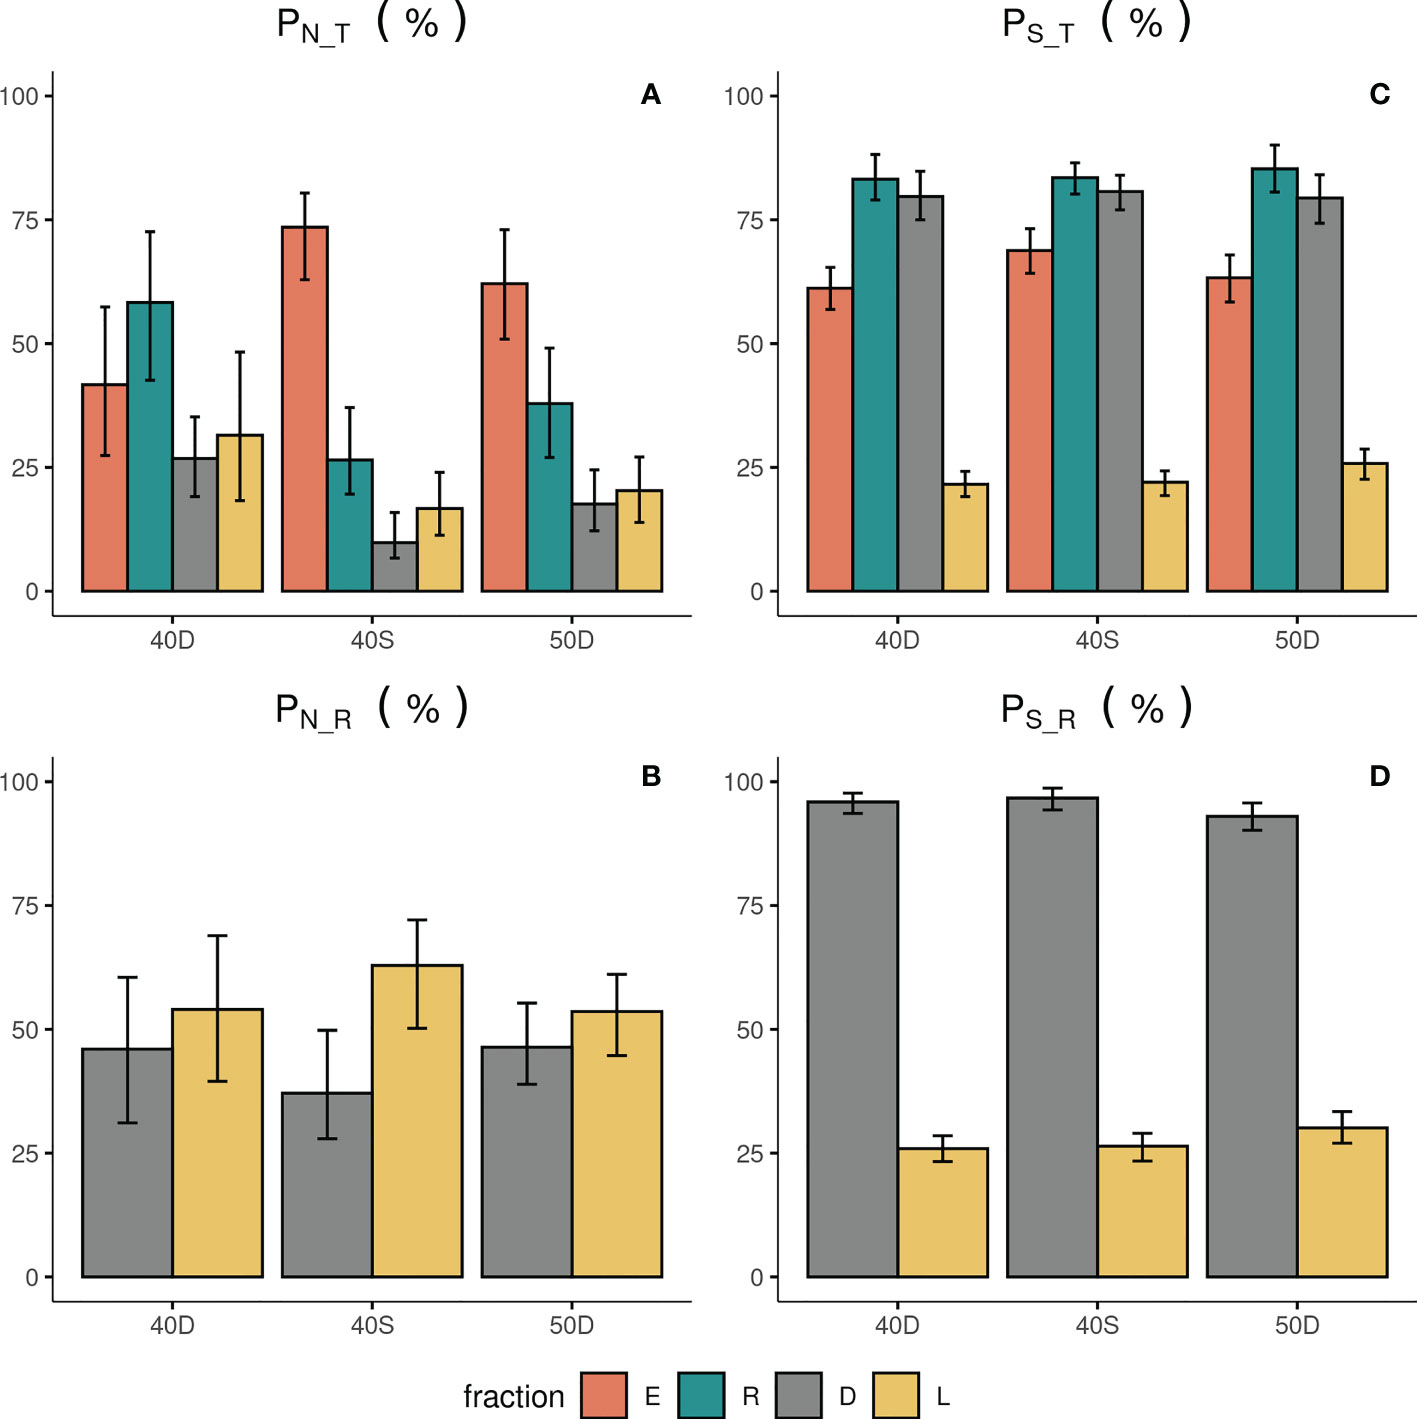
Figure 3 Percentage in Abundance PN_T (A) and Species Richness PS_T (C) in relation to the total assemblage entering each codend (T), and percentage in abundance PN_R (B) and Species richness PS_R (D) in relation to the retained catch (R) for the escapees (E), retained catch (R), landings (L) and discards (D). 40D, 40S, 50D: tested codends; the 95% CI are also shown with bars.
The N of the landings (L) and discards (D) showed higher values for the former fraction in all the tested codends, but without significant differences (Figure 2A, Table 2). For the 40S, 50D and 40D, the percentage PN_T for the L and D was 17%, 20%, 32%, and 10%, 18%, 27%, respectively (Figure 3A). Significantly higher was the PN_T of the 40D than that of the 40S for both the discards and landings (Table S3 in the Supplementary Material). In relation to the retained catch, fisher almost consistently selected about 60% as landings, while they discarded 40% (Figure 3B). No significant difference was found in the percentage PN_R between the three codends for both the L and D (Table S3 in the Supplementary Material). However, in the case of the 40S, the discards showed significantly lower percentage (D: 37%) than the landings (L: 63%) (Figure 3A, Table S4 in the Supplementary Material).
In each tested codend, the species richness S of the total fish assemblage entering the codend (T) decreased significantly in all the derived fractions, with lower values in the escapees (E), and much lower in the landings (L) (Figure 2B, Table 2). The S of the total assemblage (T) ranged between 219 and 232 species depending on the codend; that of the escapees (E) between 138 - 150, the retained catch (R) between 182 - 193, the landings (L) between 48 - 56, and the discards (D) between 173 - 185 (Figure 2B). No statistically significant differences were identified for T between the three tested gears in terms of species richness S (Table S3 in the Supplementary Material).
The S of the escapees (E) was in all the cases significantly lower compared to that of the retained catch (R) and discards (D), whilst higher than that of the landings (L) (Figure 2B, Table 2). The percentage of S in relation to T (PS_T) in the escapees was estimated at 69%, 63% and 61% for the 40S, 50D and 40D codends, respectively (Figure 3C), with statistically significant higher percentage for the 40S compared to the 40D codend (Table S3 in the Supplementary Material). Thus, it seems that in general, the trawl codend let escape a low percentage of the number of species entering depending on the codend used, with higher value for the 40S than the 40D codend. The majority (84%) of the species of the fish assemblage entering the codend (T) was retained independently of the type of the codend (Figure 3B, Table S3 in Supplementary Material).
The landings (L) always showed the lowest S in all the codends (Figure 2B). From the total number of ~220 species entering each codend a very low number of them (~50) was finally exploited (Figure 2B). The S (and the percentages PS_T or PS_R) of the discards (D) was always higher than that of the landings (L) in all cases (Figures 2B, 3C, 3D; Table 2, and Table S4 in the Supplementary Material). In relation to the total number of species entering, the percentage PS_T for the number of species landed was ~23% and for the number of species discarded ~80% (Figure 3C). In relation to the retained catch, the percentage PS_R for the number of species landed and discarded ranged between 26-30% and 93–97%, respectively, depending on the codend used (Figure 3D). Thus, almost all species of the retained catch were included in the discards, and species richness was always higher in the discards than in the escapees and the landings; the latter including a very low number of species.
The estimated Shannon-Wiener Index H for the five units of analysis in each codend is presented in Figure 2C. The H values of the escapees E was lower than that of the total assemblage entering the codend T (but not significantly different in 40D) (Table 2). No significant differences in H were found between the retained catch R and the total assemblage entering T. The H value was significantly higher in the discards D than all other units (but no significantly different in 50D in T) (Table 2). The landings (L) always presented significantly lower H than all other units of analysis (Figure 2C, Table 2). No statistically significant differences were identified for the same unit of analysis between the three tested gears in terms of entropy H (Table S3 in the Supplementary Material). Thus, the escapees showed lower entropy than the total fish assemblage entering except in the 40D codend. The landings always exhibited the lowest entropy, while the discards almost always the highest compared to all other units of analysis.
The estimated Pielou Index J values for the five units of analysis in each codend are presented in Figure 2D. There was no difference in J between the total assemblage entering T, the escapees E, and the retained catch R in each tested codend (Figure 2D, Table 2). This index was higher in the discards D than in other units (but not significantly different than the T and E in 50D). The landings L exhibited lower J values than the other units of analysis, but not always with statistically significant differences (Figure 2D, Table 2). For the same unit of analysis, no differences were identified between the three tested gears in terms of evenness J (Table S3 in the Supplementary Material). Thus, the escapees and the retained catch presented the same evenness with the total fish assemblage entering the trawl codend. Higher evenness was almost always exhibited for the discards and lowest for the landings in all tested gears.
The Simpson Dominance Index SDI for the five units of analysis in each codend is presented in Figure 2E. The SDI of the total entering assemblage T was always similar to that of the escapees E. The SDI was higher in the discards D than all other units of analysis (but no significantly different from T in the 50D). The landings L showed the lowest SDI (Figure 2E, Table 2), indicating higher dominance of some species. No statistically significant differences were identified for the same unit of analysis between the three tested gears in terms of dominance (Table S3 in the Supplementary Material). Thus, the escapees presented the same dominance values with the total fish assemblage entering the trawl codend in all cases. Higher dominance values were always apparent in the landings, while lower in the discards in almost all cases.
The results for the 40D codend indicated that from the 232 species of the fish assemblage entering the codend (T), 25 species represented ≥90.0% in abundance, with the rose shrimp Parapenaeus longirostris (33.9%) and the silvery pout Gadiculus argenteus (13.1%) dominating the total assemblage (Figure 4). The 90.0% of the escapees (E) included 16 species, which showed that less species, and in different proportions, escaped from the 40D codend compared to what is entering. Although the same dominant species were found in the total assemblage entering T and the escapees E, these changed their contribution, with G. argenteus being the principal species (29.0%), followed by P. longirostris (19.8%) (Figure 4). The pairwise comparison of their percentages between the E and the T revealed very high differences, being positive for the former and negative for the latter species (~ ± 15.0%) (Table S5 in the Supplementary Material). The comparisons between the rest of the 25 studied species showed significant difference (>1.0%) for 10 of the species. These differences and those between the retained catch (R) and the total assemblage entering (T) showed that the small-sized species had a significantly lower percentage in the R, but higher in the E, compared to the T (Table S5). This indicated that they benefit in their escape probability because of their body traits (Table S5: e.g. Gobiidae, G. argenteus). Only six species of the landings (L) constituted ≥90.0% of the abundance of this fraction; the most dominant being P. longirostris (65.4%) followed by the picarel Spicara smaris, red mullet M. barbatus, hake M. merluccius, and the shortfin squid Illex coindetii (Figure 4). Finally, from the 185 species of the discards (D), 33 species represented ≥90.0% of their abundance, with P. longirostris showing the highest value (18.7%) (Figure 4). In the discards, 44.3% of the abundance corresponded to commercial species, but probably because of their small non-marketable size, these were discarded. This was obvious for hake, for which its percentage in the landings (L) was comparable to that in discards (D) (Table S5). Similar results were found for the shortfin squid (I. coindetii), while the blue whiting (M. poutassou) presented significantly higher percentage in the discards than in the landings (Table S5).
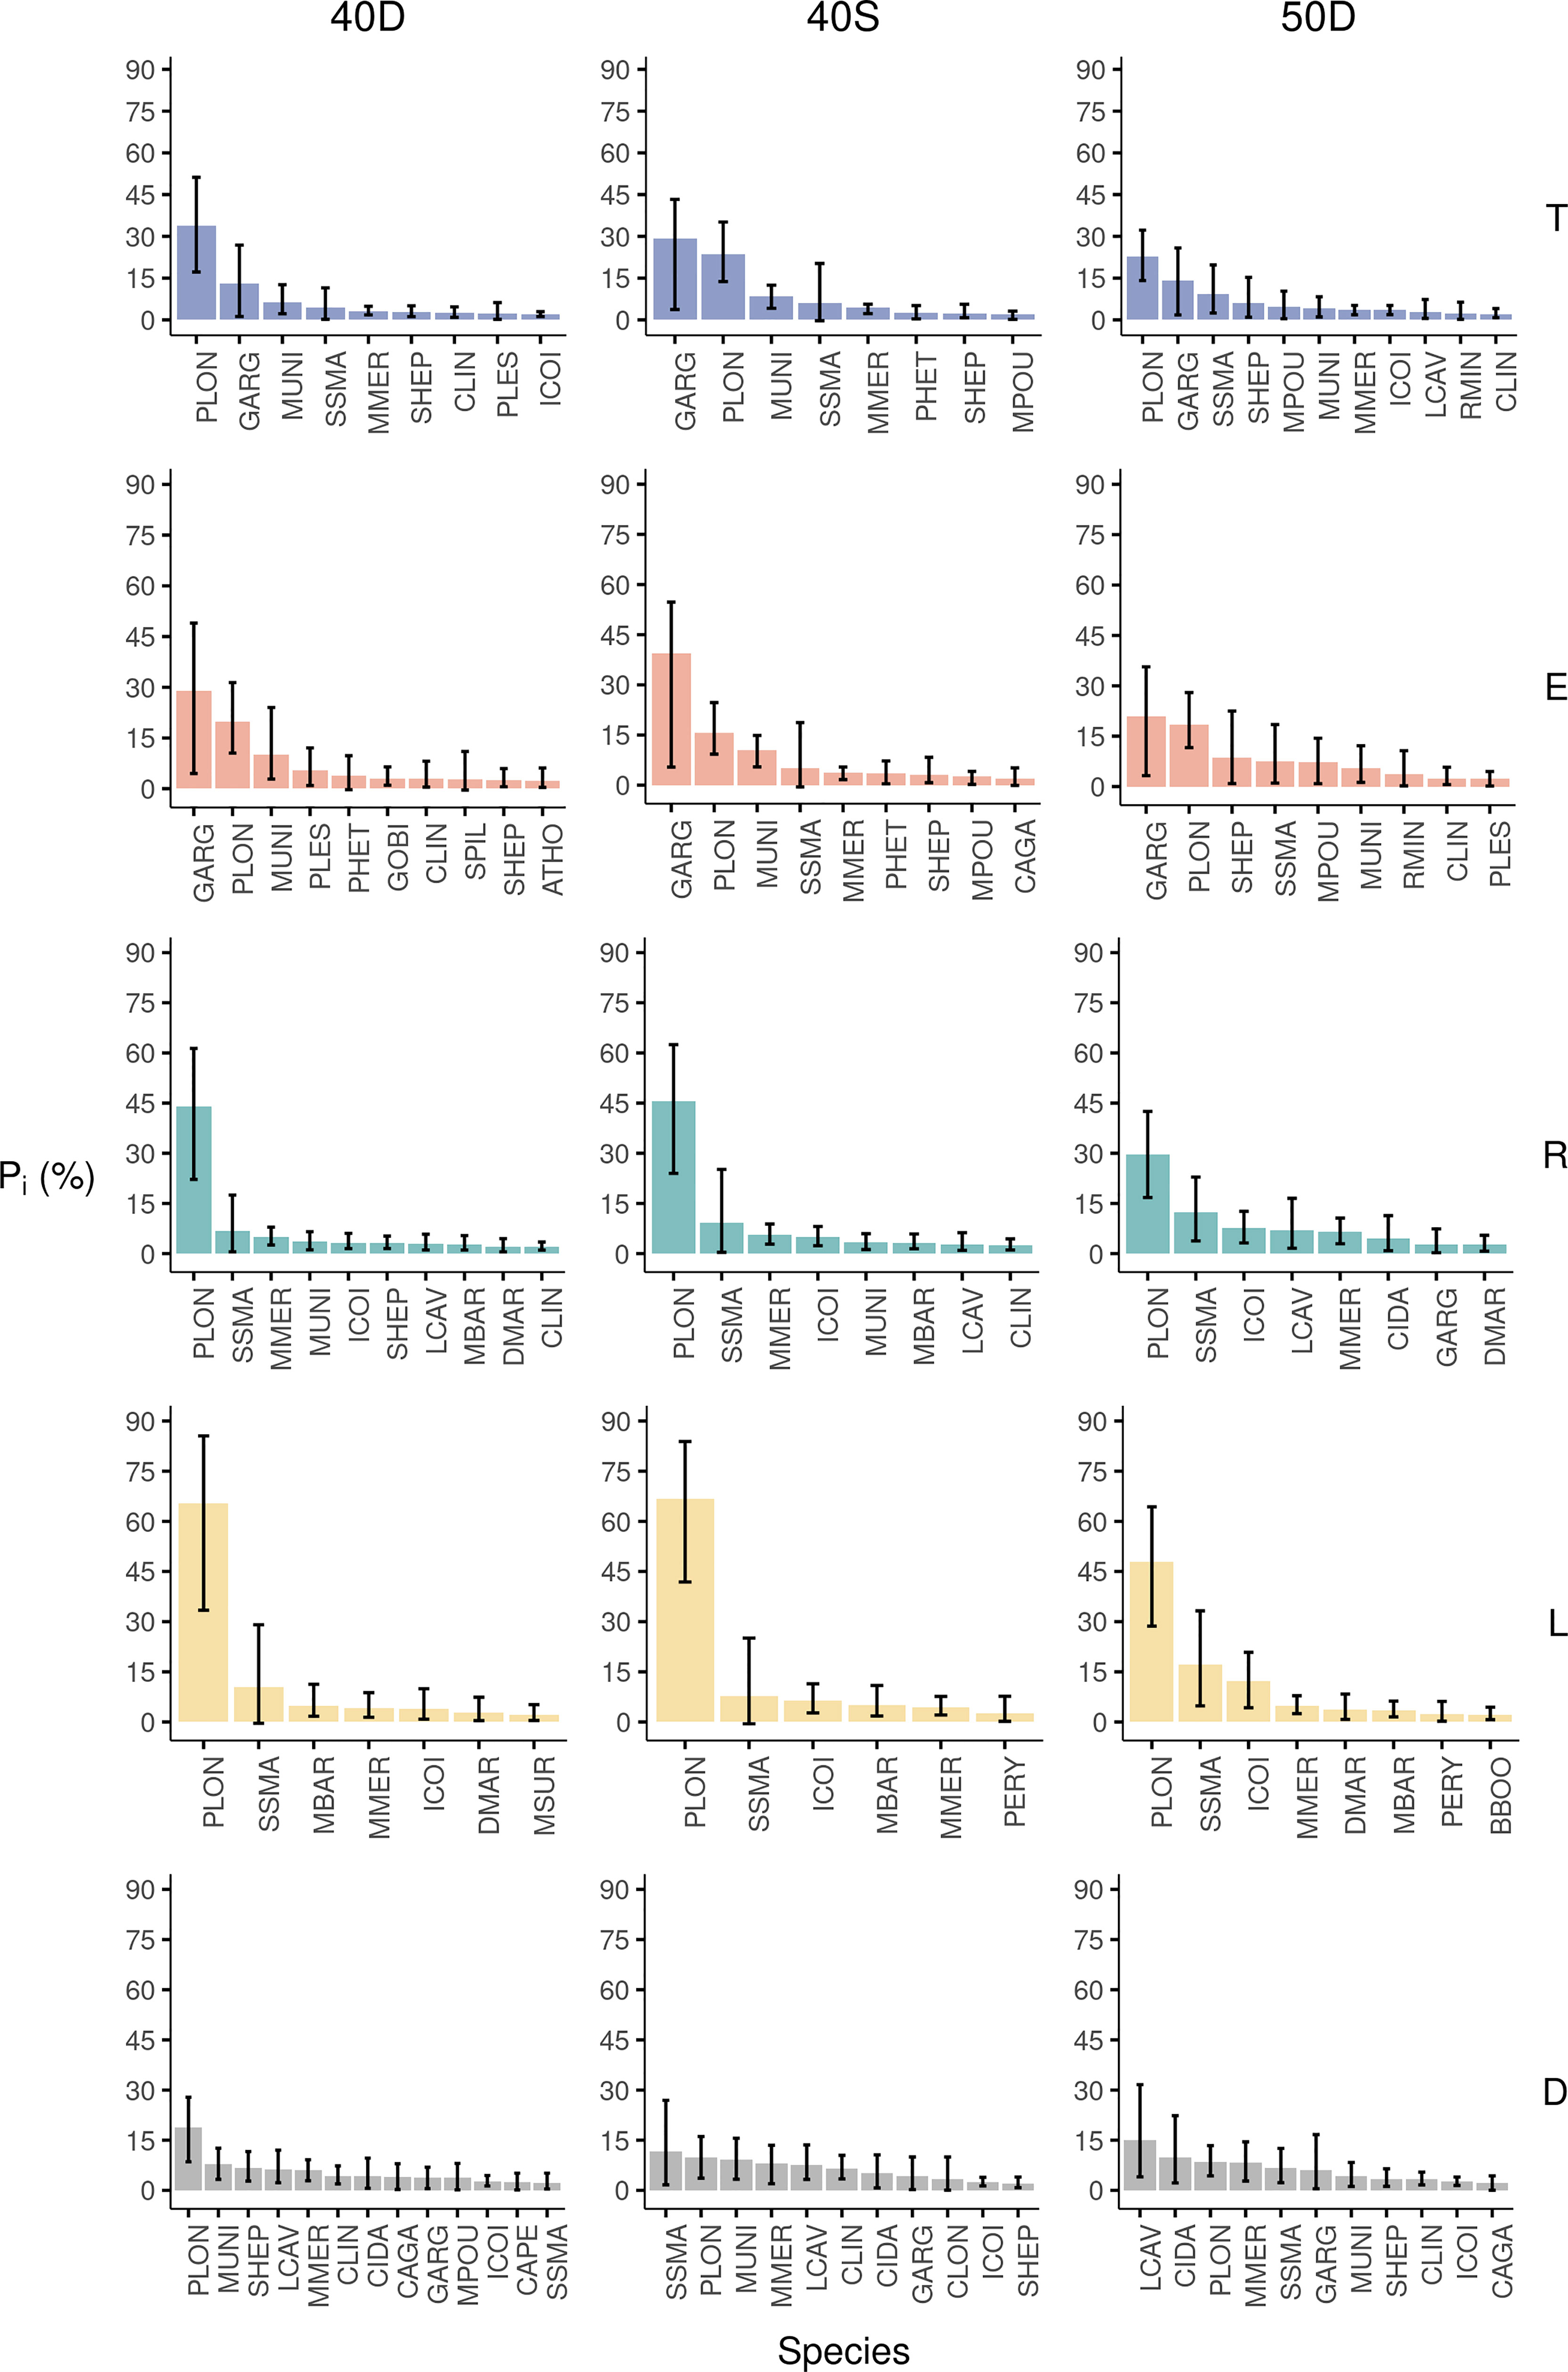
Figure 4 Percentage in Abundance (Pi%) of the most abundant species for the total assemblage entering the trawl codend (T), escapees (E), retained catch (R), landings (L), and discards (D) for each tested codend (40D, 40S, 50D). The 95% CI are also shown with bars.
The analysis for the 40S codend showed that from the 218 species of the total fish assemblage entering the codend (T), 18 species represented ≥90.0% of the total abundance. G. argenteus (29.3%) and P. longirostris (23.6%) dominated the T (Figure 4). The 90% of the abundance of the escapees (E) included 14 species, with the same dominant species, but in different proportions (G. argenteus: 39.4%, P. longirostris: 15.7%) (Figure 4). The pairwise comparison of their percentages between the E and T revealed large differences, being positive for G. argenteus (~10.0%) and negative (~-8.0%) for P. longirostris (Table S5 in the Supplementary Material). From the 25 studied species only five species showed a substantial difference >1.0% (Table S5). The small-sized species entering in this codend also benefited in escapes (e.g. G. argenteus) as well as squat lobsters Munida spp. (Table S5). Only five species of the landings (L) of the 40S constituted ≥90.0% of the abundance of this fraction; the most dominant being P. longirostris followed by S. smaris, I. coindetii, M. barbatus, and M. merluccius as was in the case of the 40D, indicating a consistent fisher behaviour (Figure 4). Finally, from the 176 species of the discards (D), 33 species represented ≥90.0% of their abundance, with S. smaris presenting the highest value (11.7%), followed by P. longirostris (9.8%) (Figure 4). About 48.4% of the discards (D) corresponded to commercial species. Among them hake showed similar percentage in the discards (D) and landings (L) (Figure 4, Table S5). Finally, the two flatfish, Citharus linguatula and Arnoglossus thorii, presented significantly higher percentages in the discards (D) than in the escapees (E) in the case of the 40S codend (but no difference in the 40D, and lower in the 50D codend) (Table S5).
The results for the 50D codend showed that from the 218 species entering this codend, 25 species represented ≥90.0% of the total abundance, with again P. longirostris (22.6%) and G. argenteus (14.0%) dominating the whole assemblage (Figure 4). The 90.0% of the abundance of the escapees (E) included 19 species; G. argenteus being the most dominant followed by P. longirostris (Figure 4). The pairwise comparison between their percentages in the escapees (E) and the assemblage entering the codend (T) revealed positive difference for the former (6.0%) and negative for the latter species (~-4.0%) (Table S5 in the Supplementary Material). From the 25 studied species, eight showed significant differences >1.0%). In this codend, it was also obvious that the small body-sized species presented a higher percentage in the escapees (E) and a lower in the retained catch (R) compared to the fish assemblage entering (T) (Tale S5). Only seven species in the landings (L) constituted ≥90.0% of the abundance of this fraction; the most abundant being P. longirostris (47.9%), followed by S. smaris, I. coindetii, and M. merluccius (Figure 4). Finally, from the 173 species of the discards (D), 32 species represented ≥90% of the abundance of this fraction with higher percentage for Lepidotrigla cavillone (15.1%) (Figure 4). In the discards (D), 35.4% of the abundance corresponded to commercial species. Hake showed no difference between landings (L) and discards (D), but higher percentage in the discards than in the escapees (Table S5). In contrast, the two flatfish C. linguatula and A. thorii benefit in their probability to escape through this codend with a percentage higher in the escapees (E) than in the discards (D) (Table S5).
In all codends, among the five units of analysis, the percentage in abundance of all Elasmobranch species PElasm was negligible in the escapees (E) and highest in the discards (D) (Table 3, and Table S6 in the Supplementary Material). Similarly, the percentage of the benthic non-commercial species Pbenth presented the highest values in the discards (19.48-26.21% depending on the gear) (Table 3 and Table S6 in the Supplementary Material). It should be noted, that from the 13 species of Elasmobranchs in total only two were found in the escapees, and almost all were included in the discards; similarly, from the 95 non-commercial benthic species in total, the majority (74) were included in the discards. In general, from the whole number of species entering in each codend, the most small-body sized cephalopods, shrimps, polychaetes, and fish commonly escaped, while most of the Elasmobranchii, Asteroidea, Echinoidea, Ascidiacea, Crinoidea, Anthozoa and Porifera were commonly retained in the trawl codend (see Table S7 in the Supplementary Material).
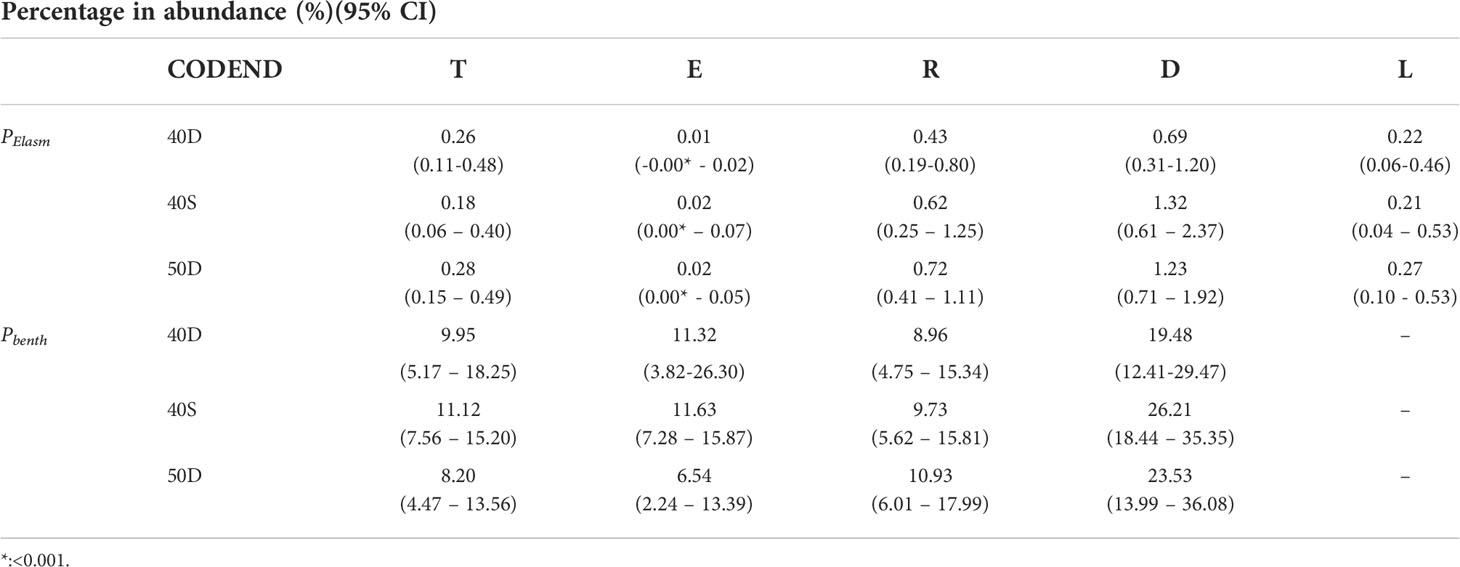
Table 3 Percentage in abundance (%) of Elasmobranchs (PElasm) and non-commercial benthic species (Pbenth) with their 95% confidence intervals (95% CI) in the fish assemblage entering the codend (T), escapees (E), retained catch (R), discards (D), and landings (L) in each of the tested codends (40D, 40S, 50D).
Comparisons among the three tested gears revealed a significantly lower escape probability for hake, the small-sized fish Serranus hepatus, and the small-sized shrimp Plesionika heterocarpus for the 40D codend (Table S8 of the Supplementary Material).
The estimated mean Trophic Level TLm and mean Vulnerability Index VIm of each unit of analysis for the most abundant 25 species (taxa) are shown in Table 4. No statistically significant difference was detected for the TLm between the fish assemblage entering the codend (T) and the escapees (E) for each tested codend, although this was lower in the E for the 40D and 40S codends; similarly, no significant differences were identified between T and the retained catch (R) and between E and R (Table S9 in the Supplementary Material). In most of the cases, the TLm of the landings (L) was significantly higher than that of all other fractions indicating the higher proportion of organisms of higher trophic level in this fraction (e.g. P. longirostris, I. coindetii, M. merluccius, M. barbatus, etc.). In most of cases, the discards (D) showed a significantly lower TLm than all other fractions (Table 4), indicating the higher contribution of organisms of lower trophic level in this fraction (e.g. Munida spp., Centrostephanus longispinus etc.).
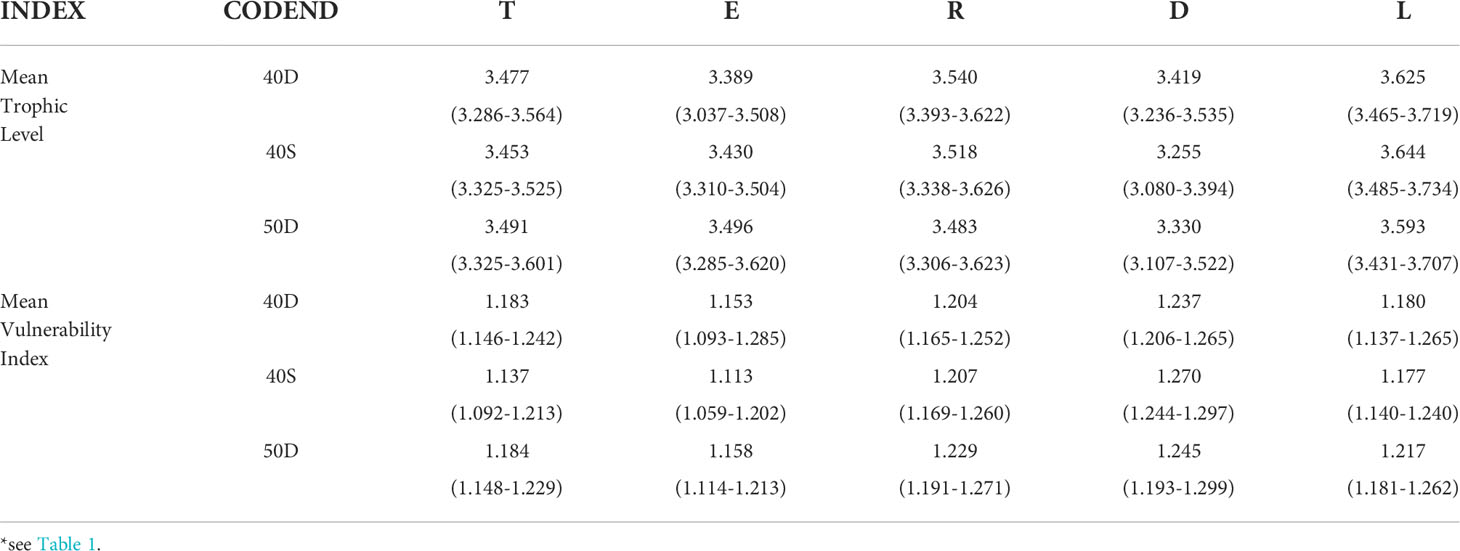
Table 4 Mean Trophic level and mean Vulnerability Index (Efron percentile 95% confidence intervals in parenthesis) of the total fish assemblage entering the codend (T), escapees (E), retained catch (R), discards (D), and landings (L) for the most abundant 25 taxa* of the total assemblage entering each of the tested codends (40D, 40S, 50D).
The VIm (Table 4) was always lower in the escapees (E) and higher in the retained catch (R), and particularly in the discards (D), which indicated that the most vulnerable taxa were retained and discarded. However, it seems that there were no statistically significant differences among the units of analysis of the 40D codend, while in the case of the 40S and 50D codends the VIm in the escapees E was lower than in the total assemblage entering T; higher in R than T (Table S9 in the Supplementary Material). This indicated the escape of less vulnerable species through these two codends, probably related to the higher escape of small-sized species and individuals (e.g. G. argenteus, S. hepatus).
No statistically significant differences were detected for the same unit of analysis between the three codends, although the TLm of the escapees (E) was lower in the 40D codend and that of the discards (D) was lower in the 40S codend (Table 4). Similarly, no significant differences were found in the VIm between the three codends. Some differences observed seemed to be related more to the fish assemblage entering each gear than to differences between the codends.
In this work, various indicators were investigated to identify the ecological footprint related to trawl fishing. Combined information on the abundance, species richness, entropy, evenness, dominance, species composition, trophic level and vulnerability was used to detect, for the first time, the sequential effects of gear and fisher selection practices on diversity: from the total fish assemblage entering the trawl codend, to the escaped, retained, discarded and landed fractions. The diversity features were quantified based on a case study conducted in the Mediterranean Sea, and using different meshes in the trawl codend.
The results of this work clearly showed the high multispecies feature of the Mediterranean bottom trawl fishery. However, from the large number of species entering (>200) and retained (~180, >80% of the species entering) in the trawl codend, only a small fraction (~50,<30% of species entering) was selected by the fisher as landings. With a constant fisher pattern, almost all of the retained species were represented in the discards, and so, species richness was always higher in this fraction than in the escapees and the landings. In terms of abundance, fishers selected as landings about 60% of the retained catch, which corresponded to a small part of the entering assemblage (17-32% depending on the gear). These results lead to questions about the effectiveness of the trawl in the Mediterranean ecosystem as only a few of the large number of species and individuals entering the trawl codend are utilizable and marketable and even if a large part escape, particularly with 40S, survival is unknown.
Comparison between the three tested codends showed that the 40S presented the highest percentage of escapees, but not statistically different from that of the 50D codend. The 40S retained significantly less discards and less landings (10% and 17%, respectively) than the 40D (27% and 32%, respectively) in relation to what is entering in each codend. It is suggested that the 40D higher percentage in landings was related to the higher retained part of the low economic value picarel (as also shown by the findings of Ordines et al., 2006, and those of Mytilineou et al., 2021a), and to illegal undersized individuals of species such as hake included in the landings (as also shown by Mytilineou et al., 2018a; Mytilineou et al., 2020). It should also be noted that the difference between the proportion of the landings and discards in the retained catch (an indication of the discard ratio) was in favour of the landings (1:0.6) only in the 40S codend, whereas no difference was detected for both diamond mesh codends (1:0.9). Thus, it seems that the 40S codend produced a retained catch with less discards and more legal landings, as has also been shown for some species in the published literature (e.g. Mytilineou et al., 2018a, Mytilineou et al., 2021a; Mytilineou et al., 2021b), and which is more in line with the current regulations on discard mitigation (Regulation (EU) No 1380/2013), and the legislated minimum reference conservation sizes of some species (Regulation (EU) 2019/1241).
With respect to the diversity indices, the escape and the retained by the trawl codend fractions seemed to be quite similar in diversity to the total assemblage entering. Therefore, in general, trawl fishing did not seem to release a statistically significantly less diverse fraction compared to what was entering the codend. However, the always lower values of all the diversity indices of the escapees in all codends may indicate a gradual and long-term effect on the total entering assemblage, not easy to presently detect. To test this, it would be necessary to know the diversity from when the fishing grounds were in a pristine condition in the past or to compare with the diversity over a long-term period using the same methodology as this study. Tsagarakis et al. (2008), investigating data from a 10-year period, found a decreasing trend in the species richness and other diversity indices for the discarded fraction, but not for the whole retained catch, which may be explained by the shortness of the time-period. In the present study, it was also surprising that the Shannon-Wiener index in the escapees of the 40S and 50D, the two more selective codends (Mytilineou et al., 2018a; Mytilineou et al., 2021a; Mytilineou et al., 2021b), presented significantly lower values than the total assemblage entering, which was not the case for the less selective 40D codend. This could be explained by the fact that more individuals of some species can escape through the 40S and 50D codends, which may reduce their entropy. However, we would also expect in this case a decrease in evenness and an increase in dominance that was not evident from the results. It seems that no very clear conclusions can be drawn based on the diversity indices, and this confirms the comments of Rochet and Trenkel (2003) that diversity indices are not such adequate indicators to assess the effects of fishing on communities.
Besides the above-mentioned inconclusive findings, the results of the diversity indices for the landings and the discards were very clear. In all the cases, landings showed the lowest diversity compared to all other units of analysis, and discards the highest (except in some cases of the 50D codend), even significantly higher than the total assemblage entering. This is in accordance with the findings of Tsagarakis et al. (2008), using a diamond 28 mm mesh. It is evident that the fraction of the fish assemblage with the highest diversity is being discarded. Taking also into account that the discards have a very low survival rate, even if thrown back to the sea (Tsagarakis et al., 2018), it is clear that the part with the highest diversity is damaged without being used for any marketable reason. Managers and fishing technology engineers should therefore critically consider the processing of this highly diverse fraction, if biodiversity conservation in the Mediterranean is a target under the EAF. It should also be noted that among the diversity indices of the three codends, no statistically significant differences were identified for the same unit of analysis. Thus, another inference was that the change of the codend mesh size from the less selective 40D to the more selective 40S or 50D did not improve the diversity of the escaping fraction. It is suggested that in the future, investigation should not focus on just increasing the codend mesh size but more on gear modifications that support the escape or avoid catching the discarded fraction.
The results for the species composition showed a considerable change between the total assemblage entering the codend and that of the escapees for several species. Most small-body sized organisms (G. argenteus, Gobiidae, shrimps, polychaetes) escaped, while most large-sized organisms or organisms with specific characteristics (Elasmobranchii, Echinodermata, Anthozoa, Porifera) were retained in the trawl codend. This indicated that small-sized species benefit against the large-sized species. Furthermore, it is already known that trawl fishing retains the largest individuals of the species entering the codend as a result of the size-selection of this gear (Wileman et al., 1996), which has also been shown in the area by several selectivity studies of Mytilineou et al. (2018a); Mytilineou et al. (2021a); Mytilineou et al. (2021b). This constant escape of small-sized species and small-sized individuals of some larger species, along with the simultaneous removal of the large-sized species and individuals, which are potential predators of the small-sized ones, firstly may support the dominance of the latter, changing community species composition and functionality, and secondly, may produce increased food requirements for them, which, if not available, may result in a ecological cascade (Coll et al., 2008b). These processes may affect biodiversity at the genetic, species or ecosystem level (Boehlert, 1996). More pronounced changes (> ± 1%) in the species composition from the total assemblage entering the codend to that of the escapees were detected in the case of the 40D; less in the 50D and even less in the 40S codends.
The estimated mean trophic level did not show statistically significant differences between escapees, retained catch and total fish assemblage entering the codend, as was also found for the diversity indices. It should be noted that the trophic level used in this study was unique for each species, but not available for different size groups for the studied species in this work. It is therefore expected that the trophic level of escapees maybe overestimated. In contrast, landings always exhibited the highest values, indicating that they consisted mostly of high trophic level species. This is in line with the findings of Tsagarakis et al. (2008).
The study of the vulnerability index indicated the lowest values for the escapees and the highest for the discards, with statistically significant differences mainly detected in some units of analysis of the 40S and 50D codends. It is important to note here, that the Elasmobrach species caught in the present study (known for their vulnerability; Dulvy et al., 2021) indicated almost zero escape, which was also shown by the findings of Mytilineou et al. (2018b). Their highest percentage was found in the discards. Similarly, the non-commercial benthic species (including various vulnerable species; de Juan et al., 2020), also showed the highest percentage in the discards. Thus, although the vulnerable species, and particularly some of them (such as the Elasmobranchs Mustelus mustelus, Oxynotus centrina, Raja radula, the gastropod Tonna galea, and the echinoid Centrostephanus longispinus) need protection, these are removed and eliminated from the community. This requires an urgent action, since this effect is currently very pronounced.
The present study had the advantage of identifying and enumerating all organisms caught under conditions very close to those of the commercial fishing, resulting in a great number of identified taxa for each unit of analysis. Some weaknesses in our approach can be related to the one-hour hauls, single vessel, and single sampling period with a lack of time-series data. However, our results were in line with those derived from observations on commercial fishing vessels (Damalas and Vasilopoulou, 2013; Tsagarakis et al., 2017; Damalas et al., 2018).
In summary, by using various indicators, this work tried to gather several estimates to support general patterns and more holistic approaches on the effects of trawling on the fish assemblage entering the trawl codend. The following inferences can be concluded:
Trawl fishing in the Mediterranean does allow escapes through the codend that have been shown always to be lower in abundance, species richness, and vulnerability index, similar in diversity indices and trophic level, and different in species composition compared to the total fish assemblage entering the codend, all of which have implications on the local biodiversity. Fishers select a landing fraction that was always the lowest in species richness and diversity indices and the highest in trophic level, whilst discarding a fraction that was always the highest in diversity and vulnerability index, and the lowest in trophic level. The results suggested an urgent need for trawl modifications for the mitigation of the catch of highly vulnerable species. The comparison of the three codends did not reveal significant differences. However, the 40S codend showed a significantly higher percentage in the number of escaping species and individuals, and less differences in species composition compared to the total assemblage entering the codend. It also exhibited a lower percentage in abundance of discards. It has been found that this codend can only ensure the sustainability of some species (Mytilineou et al., 2018a; Mytilineou et al., 2021a; Mytilineou et al., 2021b), but if the whole fish assemblage is considered (this study), no improvement in diversity is expected in its use. It seems that modifications should focus principally on the release or avoidance of the discards. Attempts in this direction have been made by some researchers focusing on the escape of sea turtles or Elasmobranchs (Sala et al., 2011; Brčic´ et al., 2015; Fakioğlu et al., 2018; Lucchetti et al., 2019), but more studies are needed to verify their suitability and applicability and the mitigation of the impacts on the total fish assemblage. Other management measures may also be suggested (e.g. protection of VMEs) including stakeholders involvement and participation in management (Santiago et al., 2015). Historical data to establish reference points or at least future studies to allow comparisons to be made are also important. Size spectrum and biomass data could also help the outcome of conclusions. Finally, the effectiveness of this fishing gear in the Mediterranean environment is under question. These are all issues for further investigation since size-selectivity improvements, a mainstream feature in research and policy to date, seem insufficient to fully support biodiversity conservation.
The data underlying this article will be shared on request to the corresponding author.
Ethical review and approval was not required for the animal study because the followed procedure was the common procedure in fisheries and selectivity studies.
CM contributed to conception, design, and data collection, performed the statistical analyses, and wrote the first draft of the manuscript. BH contributed to conception and preliminary version of the manuscript, and developed the software for the statistical analysis. CSm contributed to conception, collection of data, and preliminary version of the manuscript. DM-P contributed to data collection, preliminary version of the manuscript, and prepared the files used in analyses, and the figures. AA contributed to data collection, selection of diversity indices, and species’ trophic level. ASi contributed to data collection and selection of diversity indices, and checked their values with those of other software. ASa contributed to the sampling design of the study, and offered the data of DISCATCH. PM contributed to conception and design of this study. KP contributed to data collection and identification of benthic organisms. VV offered the data of DISCATCH. CSt contributed to data collection and storage, identification of benthic species, and species’ vulnerability index. SK contributed to data collection, and organized the database. EL contributed to data collection and identification of cephalopods. AN contributed to conception and design of this study. All authors contributed to the article and approved the submitted version.
This work is part of the first author PhD thesis at the NKUA. The authors would like to express their gratitude to the HCMR staff involved in the field and data processing work, funded under the EPILEXIS project (EPAL, Metro 3.5, code: 185365) and DISCATCH project (DG MARE/2012/24) as well the fishing vessel captain and crew involved in the field work.
The authors declare that the research was conducted in the absence of any commercial or financial relationships that could be construed as a potential conflict of interest.
All claims expressed in this article are solely those of the authors and do not necessarily represent those of their affiliated organizations, or those of the publisher, the editors and the reviewers. Any product that may be evaluated in this article, or claim that may be made by its manufacturer, is not guaranteed or endorsed by the publisher.
The Supplementary Material for this article can be found online at: https://www.frontiersin.org/articles/10.3389/fmars.2022.1021467/full#supplementary-material
Bianchi G., Gislason H., Graham K., Hill L., Jin X., Koranteng K., et al. (2000). Impact of fishing on size composition and diversity of demersal fish communities. ICES J. Mar. Sci. 57, 558–571. doi: 10.1006/jmsc.2000.0727
Blanchard F., LeLoc’h F., Hily C., Boucher J. (2004). Fishing effects on diversity, size and community structure of the benthic invertebrate and fish megafauna on the bay of Biscay coast of France. Mar. Ecol. Prog. Ser. 280, 249–260. doi: 10.3354/meps280249
Boehlert G. (1996). Biodiversity and the sustainability of marine fisheries. Oceanography 9 (1), 28–35. doi: 10.5670/oceanog.1996.24
Bradai M. N., Saidi B., Enajjar S. (2018). “Overview on Mediterranean shark’s fisheries: Impact on the biodiversity,” in Marine ecology-biotic and abiotic interactions. Ed. Turkoglu M. (IntechOpen, Open Access book), 211–230. doi: 10.5772/intechopen.74923
Brčic´ J., Herrmann B., De Carlo F., Sala A. (2015). Selective characteristics of a shark-excluding grid device in a Mediterranean trawl. Fish. Res. 172, 352–360. doi: 10.1016/j.fishres.2015.07.035
Chernick M. (2008). Bootstrap methods: a guide for researchers and practitioners (New York, USA: John Wiley & Sons), 400.
Clark M. R., Althaus F., Schlacher T. A., Williams A., Bowden D. A., Rowden A. A. (2016). The impacts of deep-sea fisheries on benthic communities: a review. ICES J. Mar. Sci. 73, i51–i69. doi: 10.1093/icesjms/fsv123
Coleman F. C., Williams S. L. (2002). Overexploiting marine ecosystem engineers: potential consequences for biodiversity. Trends Ecol. Evol. 17, 40–44. doi: 10.1016/S0169-5347(01)02330-8
Coll M., Bahamon N., Sardà F., Palomera I., Tudela S., Suuronen P. (2008a). Improved trawl selectivity: effects on ecosystems in the south Catalan Sea (NW Mediterranean). Mar. Ecol. Prog. Ser. 355, 131–147. doi: 10.3354/meps07183
Collie J., Rochet M.-J., Bell R. (2013). Rebuilding fish communities: the ghost of fisheries past and the virtue of patience. Ecol. Appl. 23, 374–391. doi: 10.1890/12-0877.1
Coll M., Libralato S., Tudela S., Palomera I., Pranovi F. (2008b). Ecosystem overfishing in the ocean. PloS One 3 (12), e3881. doi: 10.1371/journal.pone.0003881
Coll M., Piroddi C., Steenbeek J., Kaschner K., Ben Rais Lasram Fy., Aguzzi J., et al. (2010). The biodiversity of the Mediterranean Sea: Estimates, patterns, and threats. PloS One 5 (8), e11842. doi: 10.1371/journal.pone.0011842
COM (2008). Communication from the commission to the council and the European parliament. the role of the CFP in implementing an ecosystem approach to marine management [SEC(2008) 449] (Brussels, Commission of The European Communities).
Council Regulation (EC) No 1967/2006. of 21 December 2006, concerning management measures for the sustainable exploitation of fishery resources in the Mediterranean Sea, amending Regulation (EEC) no 2847/93 and repealing Regulation (EC) no 1626/94., 2006. Off. J. Eur. Union L 409.
Criales-Hernandez M. I., Duarte L. O., García C. B., Manjarrés L. (2006). Ecosystem impacts of the introduction of bycatch reduction devices in a tropical shrimp trawl fishery: insights through simulation. Fish. Res. 77, 333–342. doi: 10.1016/j.fishres.2005.10.005
Daly A. J., Baetens J. M., De Baets B. (2018). Ecological diversity: Measuring the unmeasurable. Mathematics 6, 119. doi: 10.3390/math6070119
Damalas D., Ligas A., Tsagarakis K., Vassilopoulou V., Stergiou K., Kallianiotis A., et al. (2018). The “discard problem” in Mediterranean fisheries, in the face of the European union landing obligation: the case of bottom trawl fishery and implications for management. Med. Mar. Sci. 19, 459–476. doi: 10.12681/mms.14195
Damalas D., Vasilopoulou V. (2013). Slack regulation compliance in the Mediterranean fisheries: a paradigm from the Greek Aegean Sea demersal trawl fishery, modelling discard ogives. Fish. Manage. Ecol. 20, 21–33. doi: 10.1111/j.1365-2400.2012.00860.x
de Juan S., Demestre M. (2012). A trawl disturbance indicator to quantify large scale fishing impact on benthic ecosystems. Ecol. Ind. 18, 183–190. doi: 10.1016/j.ecolind.2011.11.020
de Juan S., Hinz H., Sartor P., Vitale S., Bentes L., Bellido J. M., et al. (2020). Vulnerability of demersal fish assemblages to trawling activities: A traits-based index. Front. Mar. Sci. 7. doi: 10.3389/fmars.2020.00044
de Juan S., Thrush S. F., Demestre M. (2007). Functional changes as indicators of trawling disturbance on a benthic community located in a fishing ground (NW Mediterranean Sea). Mar. Ecol. Prog. Ser. 334, 117–129. doi: 10.3354/meps334117
Dulvy N. K., Pacoureau N., Rigby C. L., Pollom R. A., Jabado R. W., Ebert D. A., et al. (2021). Overfishing drives over one-third of all sharks and rays toward a global extinction crisis. Curr. Biol. 31, 4773–4787. doi: 10.1016/j.cub.2021.08.062
Efron B. (1982). The jackknife, the bootstrap and other resampling plans. Conference Series in Applied Mathematics, Monograph (SIAM, Philadelphia). doi: 10.1093/icesjms/fsv099
Fakıoğlu Y. E., Özbilgin H., Gökçe G., Kalecik E., Demir O., Özbilgin Y., et al. (2018). “A simple groundgear modification to reduce bycatch of elasmobranchs in the Mediterranean trawl fishery,” in ICES Report of the ICES-FAO Working Group on Fishing Technology and Fish Behaviour (WGFTFB), ICES WGFTFB 2018 meeting. Hirtshals, Denmark, ICES: ICES.
FAO (2003). The ecosystem approach to fisheries. issues, terminology, principles, institutional foundations, implementation and outlook Vol. 2003 (Rome: FAO), 71. FAO Fisheries Technical Paper. No. 443.
FishBase (2021). World Wide Web electronic publications. Available at: https://www.fishbase.se/search.php [Accessed October 26, 2021].
Garcia S. M., Kolding J., Rice J., Rochet M.-J., Zhou S., Arimoto T., et al. (2012). Reconsidering the consequences of selective fisheries. Science 335, 1045–1047. doi: 10.1126/science.1214594
Herrmann B., Cerbule K., Grimaldo E., Geoffroy M., Daase M., Berge J. (2022). Accounting for uncertainties in biodiversity estimations: a new 2 methodology and its application to the mesopelagic sound 3 scattering layer of the high Arctic. Front. Ecol. Evol 10, 775759. doi: 10.3389/fevo.2022.775759
Herrmann B., Mieske B., Stepputtis D., Krag L. A., Madsen N., Noack T. (2013). Modelling towing and haul-back escape patterns during the fishing processHirtshals: A case study for cod, plaice, and flounder in the demersal Baltic Sea cod fishery. ICES J. Mar. Sci. 70, 850–863. doi: 10.1093/icesjms/fst032
Herrmann B., Sistiaga M. B., Larsen R. B., Brinkhof J. (2019). Effect of three different codend designs on the size selectivity of juvenile cod in the barents Sea shrimp trawl fishery. Fish. Res. 219. doi: 10.1016/j.fishres.2019.105337
Herrmann B., Sistiaga M. B., Nielsen K. N., Larsen R. B. (2012). Understanding the size selectivity of redfish (Sebastes spp.) in north Atlantic trawl codends. J. Northwest Atl. Fish. Sci. 44, 1–13. doi: 10.2960/J.v44.m680
Jennings S. (2007). Reporting and advising on the effects of fishing. Fish Fish. 8, 269–276. doi: 10.1111/j.1467-2679.2007.00250.x
Jennings S., Kaiser M. J. (1998). The effects of fishing on marine ecosystems. Adv. Mar. Biol. 34, 201–351. doi: 10.1016/S0065-2881(08)60212-6
Kanieski M. R., Longhi S. J., Soares R. C. (2017). “Methods for biodiversity assessment: Case study in an area of Atlantic forest in southern brazil. open access peer-reviewed chapter,” in Selected studies in biodiversity. Ed. Şen B. (London: IntechOpen). doi: 10.5772/intechopen.71824
Larsen R. B., Sistiaga M., Herrmann B., Brinkhof J., Tatone I., Santos J. (2018). The effect of nordmøre grid length and angle on codend entry of bycatch fish species and shrimp catches. Can. J. Fish. Aquat. Sci. 76, 308–319. doi: 10.1139/cjfas-2018-0069
Lucchetti A., Bargione G., Petetta A., Vasapollo C., Virgili M. (2019). Reducing Sea turtle bycatch in the Mediterranean mixed demersal fisheries. Front. Mar. Sci. 6. doi: 10.3389/fmars.2019.00387
Melli V., Krag L. A., Herrmann B., Karlsen J. D. (2018). Investigating fish behavioural responses to LED lights in trawls and potential applications for bycatch reduction in the nephrops-directed fishery. ICES J. Mar. Sci. 75 (5), 1682–1692. doi: 10.1093/icesjms/fsy048
Mytilineou C., Herrmann B., Kavadas S., Smith C., Megalofonou P. (2018b). “Elasmobranch selectivity in the Mediterranean bottom trawl fishery,” in ASC abstracts & CM-documents 2018 (online), Theme session N: Technical approaches to reduce the environmental impact of fishing, CM Code: N:539, ICES 2018 Annual Conference. Hamburg, Germany: ICES. Available at: https://www.ices.dk/sites/pub/ASC2018/Shared%20Documents.
Mytilineou C., Herrmann B., Kavadas S., Smith C., Megalofonou P. (2020). Combining selection models and population structures to inform fisheries management: a case study on hake in the Mediterranean bottom trawl fishery. Mediterr. Mar. Sci. 21, 360–371. doi: 10.12681/mms.22191
Mytilineou C., Herrmann B., Mantopoulou-Palouka D., Sala A., Megalofonou P. (2018a). Modelling gear and fishers size selection for escapees, discards, and landings: a case study in Mediterranean trawl fisheries. ICES J. Mar. Sci. 75, 1693–1709. doi: 10.1093/icesjms/fsy047
Mytilineou C., Herrmann B., Mantopoulou-Palouka D., Sala A., Megalofonou P. (2021a). Escape, discard, and landing probability in multispecies Mediterranean bottom-trawl fishery. ICES J. Mar. Sci. doi: 10.1093/icesjms/fsab
Mytilineou C., Herrmann B., Sala A., Mantopoulou-Palouka D., Megalofonou P. (2021b). Estimating overall size-selection pattern in the bottom trawl fishery for four economically important fish species in the Mediterranean Sea. Ocean Coast. Manage. 209. doi: 10.1016/j.ocecoaman.2021.105653
Ordines F., Massuti E., Guijarro B., Mas R. (2006). Diamond vs. square mesh codend in a multi-species trawl fishery of the western Mediterranean: Effects on catch composition, yield, size selectivity and discards. Aquat. Living Resour. 19, 329–338. doi: 10.1051/alr:2007003
Pauly D., Christensen V., Dalsgaard J., Froese R., Torres F. (1998). Fishing down marine food webs. Science 279, 860–863. doi: 10.1126/science.279.5352.860
Pauly D., Christensen V., Froese R., Palomares M. (2000). Fishing down aquatic food webs. Am. Sci. 88, 46–51. doi: 10.1511/2000.1.46
Pauly D., Christensen V., Guenette S., Pitcher T. J., Sumaila U. R., Walters C. J., et al. (2002). Towards sustainability in world fisheries. Nature 418, 689–695. doi: 10.1038/nature01017
Pielou E. C. (1966). The measurement of diversity in different types of biological collections. J. Theor. Biol. 13, 131–144. doi: 10.1016/0022-5193(66)90013-0
Ragheb E., Akel S., Kh E., Rizkall S. I. (2019). Analyses of the non-target catch from the Egyptian Mediterranean trawlers, off port said. Egypt. J. Aquat. Res. 45, 239–246. doi: 10.1016/j.ejar.2019.07.003
Regulation (EU) 2019/1241. of the European Parliament And Of The Council of 20 June 2019 on the conservation of fisheries resources and the protection of marine ecosystems through technical measures, amending Council Regulations (EC) No 1967/2006, (EC) No 1224/2009 and Regulations (EU) No 1380/2013, (EU) 2016/1139, (EU) 2018/973, (EU) 2019/472 and (EU) 2019/1022 of the European Parliament and of the Council, and repealing Council Regulations (EC) No 894/97, (EC) No 850/98, (EC) No 2549/2000, (EC) No 254/2002, (EC) No 812/2004 and (EC) No 2187/2005.
Regulation (EU) No 1380/2013. of the European Parliament and of the Council on the Common Fisheries Policy, amending Council Regulations (EC) No 1954/2003 and (EC) No 1224/2009 and repealing Council Regulations (EC) No 2371/2002 and (EC) No 639/2004 and Council Decision 2004/585/EC, [2013] OJ L354/22, Recital 13.
Rochet M. J., Benoît E. (2012). Fishing destabilizes the biomass flow in the marine size spectrum. Proc. R. Soc B 279, 284–292. doi: 10.1098/rspb.2011.0893
Rochet M. J., Collie J. S., Jennings S., Hall S. J. (2011). Does selective fishing conserve community biodiversity? predictions from a length-based multispecies model. Can. J. Fish. Aquat. Sci. 68, 469–486. doi: 10.1139/F10-159
Rochet M.-J., Collie J. S., Trenkel V. M. (2013). How do fishing and environmental effects propagate among and within functional groups? Bull. Mar. Sci. 89 (1), 285–315. doi: 10.5343/bms.2011.1138
Rochet M. J., Trenkel V. M. (2003). Which community indicators can measure the impact of fishing? A review and proposals. Can. J. Fish. Aquat. Sci. 60, 86–99. doi: 10.1139/f02-164
Sala A., Lucchetti A., Affronte M. (2011). Effects of turtle excluder devices on bycatch and discard reduction in the demersal fisheries of Mediterranean Sea. Aquat. Living Resour. 24, 183–192. doi: 10.1051/alr/2011109
Sala A., Lucchetti A., Perdichizzi A., Herrmann B., Rinelli P. (2015). Is square-mesh better selective than larger mesh? a perspective on the management for Mediterranean trawl fisheries. Fish. Res. 161, 182–190. doi: 10.1016/j.fishres.2014.07.011
Santiago J. L., Ballesteros M. A., Chapela R., Silva C., Nielsen K. N., Rangel M., et al. (2015). Is Europe ready for a results-based approach to fisheries management? the voice of stakeholders. Mar. Policy 56, 86–97. doi: 10.1016/j.marpol.2015.02.006
Santos J. (2021). Bycatch reduction and alternative exploitation patterns in demersal trawl fisheries of the Baltic Sea and the north Sea. [dissertation thesis]. (Tromsø, Norway: The Arctic University of Norway). Available at: https://hdl.handle.net/10037/23186.
Saygu I., Heymans J. J., Fox C., Özbilgin H., Bentley J. W., Eryaşar A. R., et al. (2020). Community-level impacts of trawl selectivity in the Eastern Mediterranean Sea assessed using an ecosystem modelling approach. ICES J. Mar. Sci 77(7–8), 2918–2932. doi: 10.1093/icesjms/fsaa167
SeaLifeBase (2021). World Wide Web electronic publications. Available at: https://www.sealifebase.ca/ [Accessed October 26, 2021].
Shannon C. E. (1948). The mathematical theory of communication. Bell System Tech. J. 27, 379–423. doi: 10.1002/j.1538-7305.1948.tb01338.x
Shannon L., Coll M., Bundy A., Gascuel D., Heymans J. J., Kleisner K., et al. (2014). Trophic level-based indicators to track fishing impacts across marine ecosystems. Mar. Ecol. Prog. Ser. 512, 115–140. doi: 10.3354/meps10821
Trindade-Santos I., Moyes F., Magurran A. E. (2020). Global change in the functional diversity of marine fisheries exploitation over the past 65 years. Proc. R. Soc B 287, 20200889. doi: 10.1098/rspb.2020.0889
Tsagarakis K., Carbonell A., Brčić J., Bellido J. M., Carbonara P., Casciaro L., et al. (2017). Old info for a new fisheries policy: Discard ratios and lengths at discarding in EU Mediterranean bottom trawl fisheries. Front. Mar. Sci. 4, 99. doi': 10.3389/fmars.2017.00099
Tsagarakis K., Machias A., Giannoulaki M., Somarakis S., Karakassis I. (2008). Seasonal and temporal trends in metrics of fish community for otter-trawl discards in a Mediterranean ecosystem. ICES J. Mar. Sci. 65, 539–550. doi: 10.1093/icesjms/fsn023
Tsagarakis K., Nikolioudakis N., Papandroulakis N., Vassilopoulou V., Machias A. (2018). Preliminary assessment of discards survival in a multi-species Mediterranean bottom trawl fishery. J. Appl. Ichthyol. 34, 842–849. doi: 10.1111/jai.13691
Walls R. H. L., Dulvy N. K. (2021). Tracking the rising extinction risk of sharks and rays in the northeast Atlantic ocean and Mediterranean Sea. Sci. Rep. 11, 15397. doi: 10.1038/s41598-021-94632-4
Wileman D., Ferro R. S. T., Fonteyne R., Millar R. B. (1996). Manual of methods of measuring the selectivity of towed fishing gear (Copenhagen, Denmark: ICES Cooperative Research), 126 p. Report No. 215.
Worm B., Barbier E. B., Beaumont N., Duffy J. E., Folke C., Halpern B. S., et al. (2006). Impacts on biodiversity loss on ocean ecosystem services. Science 314, 787–790. doi: 10.1016/j.tree.2003.09.003
Worm B., Duffy J. E. (2003). Biodiversity, productivity and stability in real food webs. Trends Ecol. Evol. 18 (12), 628–632. doi: 10.1016/j.tree.2003.09.003
Zhou S., Smith A. D. M., Punt A. E., Richardson A. J., Gibbs M., Fulton E. A., et al. (2010). Ecosystem-based fisheries management requires a change to the selective fishing philosophy. Proc. Natl. Acad. Sci. 107, 9485–9489.doi: 10.1073/pnas.0912771107
This section provides a description of the different indices used for the study of the biodiversity in each unit of analysis. All these analyses were implemented using the software tool SELNET (Herrmann et al., 2012; Herrmann et al., 2013; Herrmann et al., 2022).
In this study, let Q denote the total number of species considered in each haul. For each haul j, the abundance of all species i is:
where Nij is the abundance of the species i in the haul j.
For each haul, the fishing duration was 1 hour, thus, the abundance index corresponded to the abundance per fishing hour (named abundance in the text). Let Z be the total number of hauls. The total abundance N summed for all the hauls is estimated as follows:
Species richness is the number of species that are present in each unit of analysis, which is the most straightforward component of diversity, being a simple enumeration of the different entities present in a community (Daly et al., 2018). This definition is underlined by the assumption that for the classification into classes, each class (species or taxon in our case) is equally distinct. In our study, in some cases, we combined taxa of similar characteristics, which could not be easily identified onboard the survey, into a major group (such as Plesionika spp., Munida spp., Gobiidae, Cidaridae etc.), considered in the analyses as distinct taxa (namely species) (see Table S1 in the Supplementary Material for the list of the identified organisms).
The index H (Shannon, 1948) is a measure of entropy or disorder, meaning uncertainty in the outcome of a sampling process in the unit of analysis (Daly et al., 2018). The index equals zero in the case of only one species, but generally varies between 1.3 and 3.5 (Kanieski et al., 2017) with higher value indicating higher entropy and therefore higher diversity. In a unit of analysis of our study, for each haul j, the Hj was estimated as follows:
[for Nij and Nj see the above-mentioned formula (1)].
The index J (Pielou, 1966) is a measure of the evenness, equity or uniformity of the unit of analysis, and shows how the number of individuals is distributed among the species (Kanieski et al., 2017); when 1, this indicates that all species are equally abundant. It is based on the Shannon-Wiener index, and in a unit of analysis of our study, for each haul j, the Jj was estimated as follows:
where Sj the richness of the haul j; for Hj: see the above-mentioned formula (3).
The index SDI (Simpson, 1949) is a measure of the dominance of some species within the unit of analysis, since its formulation gives more weight to common species than to rare ones, as it is the reciprocal of Simpson’s original index (i.e. 1/Simpson index) (Daly et al., 2018). Higher values of SDI imply lower dominance among the species (the opposite of what is indicating the original Simpson index), and thus higher diversity. In a unit of analysis of our study, for each haul j, the SDIj was estimated as follows:
[for Nij and Nj see the above-mentioned formula (1)].
The study of the species composition of each unit of analysis was based on the percentage in abundance of each species Pi in all the hauls j of the group Z of each unit of interest.
where Nij is the abundance of the species i in the haul j, and N is the abundance of all species in the group Z of hauls j [see the above-mentioned formula (2)].
The total Elasmobranch percentage in abundance PElasm in each unit of analysis was also reported as follows:
where Nij is the abundance of all the Elasmobranch species i of a group of Elasmobranchs (i ∈ [K1,…, K2]) in a haul j, and Z a group of hauls j in the unit of analysis.
The percentage in abundance of the non-commercial benthic species Pbenth, including Porifera, Annelida, Echinodermata, Brachiura, Stomatopoda, Bivalvia and Gastropoda, was also reported as follows:
where Nij is the abundance of all the non-commercial benthic species i of a group of non-commercial benthic species (i ∈ [F1,…, F2]) in a haul j, and Z is the group of hauls j in the unit of analysis.
In each unit of analysis, the mean value of the Trophic Level TLm and Vulnerability Index VIm was based on the weighted contribution of each one of the 25 species examined i.e. the relative abundance Pi of each one of them, and the total abundance of these 25 species in each unit of analysis as follows:
where TLi is the trophic level of the species i, VIi is the vulnerability index of the species i, Pi is the percentage in abundance of the species i in each unit of analysis, and i ∈ [G1,…, G2].
To estimate the uncertainty of each index according to the method presented by Herrmann et al. (2022), in each haul, the uncertainty of the finite number Nj [see equation (1)] was estimated by using a resampling method with replacement (Chernick, 2008) and by performing 1000 resamplings, which gave a population of 1000 values for each indicator. These values can be used to estimate the Efron percentile 95% confidence intervals (Efron, 1982) for each indicator for each haul j.
To estimate the uncertainty of an index for a group of hauls, accounting for between and within haul variation, an “outer” (among the hauls) resampling method with replacement was applied that resamples Z΄ new hauls over the Z hauls initially considered. For each haul selected, an “inner” resampling was conducted accounting for the finite Nj of the specific haul as described above. This nested resampling technique (bootstrapping technique) was applied 1000 times, leading to 1000 sets of data that gave the estimates of the indicators and their Efron 95% percentile confidence intervals (CI) for the group of Z hauls.
The same nested bootstrapping technique was used for the estimation of the uncertainty of the diversity indices S, H, J and SDI as well that of the percentages Pi, PElasm, Pbenth and the estimates of the TLm or VIm of the formulas (3) – (10).
For the pair-wise comparison of an index O, the difference Δ for an index between two units x and y was estimated as presented by Herrmann et al. (2022):
The 95% confidence intervals for Δ were predicted based on the uncertainties of Ox and Oy, estimated as described above by applying the nested bootstrap method. Since these uncertainties were obtained independently for each index, a new bootstrap population of results for each Δ was created with 1000 repetitions, as described by several researchers (Larsen et al., 2018; Melli et al., 2018; Herrmann et al., 2019; Mytilineou et al., 2020; Mytilineou et al., 2021a; Mytilineou et al., 2021b; Santos, 2021), to obtain the Efron percentile 95% CI for the difference Δ. If the value 0.0 is not included within the predicted 95% CI of the difference Δ, then the difference Δ is statistically significant.
Keywords: bottom trawl, selectivity, escapees, discards, biodiversity impacts, trophic level, vulnerability, Mediterranean
Citation: Mytilineou C, Herrmann B, Smith CJ, Mantopoulou-Palouka D, Anastasopoulou A, Siapatis A, Sala A, Megalofonou P, Papadopoulou N, Vassilopoulou V, Stamouli C, Kavadas S, Lefkaditou E and Nicolaidou A (2022) Impacts on biodiversity from codend and fisher selection in bottom trawl fishing. Front. Mar. Sci. 9:1021467. doi: 10.3389/fmars.2022.1021467
Received: 17 August 2022; Accepted: 27 October 2022;
Published: 22 November 2022.
Edited by:
Valentina Melli, Technical University of Denmark, DenmarkReviewed by:
Aylin Ulman, Mersea Marine Consulting, TurkeyCopyright © 2022 Mytilineou, Herrmann, Smith, Mantopoulou-Palouka, Anastasopoulou, Siapatis, Sala, Megalofonou, Papadopoulou, Vassilopoulou, Stamouli, Kavadas, Lefkaditou and Nicolaidou. This is an open-access article distributed under the terms of the Creative Commons Attribution License (CC BY). The use, distribution or reproduction in other forums is permitted, provided the original author(s) and the copyright owner(s) are credited and that the original publication in this journal is cited, in accordance with accepted academic practice. No use, distribution or reproduction is permitted which does not comply with these terms.
*Correspondence: Chryssi Mytilineou, Y2hyeXNzaUBoY21yLmdy
†Present address: Danai Mantopoulou-Palouka, Aristotle University of Thessaloniki, School of Biology, Thessaloniki, Greecea
Disclaimer: All claims expressed in this article are solely those of the authors and do not necessarily represent those of their affiliated organizations, or those of the publisher, the editors and the reviewers. Any product that may be evaluated in this article or claim that may be made by its manufacturer is not guaranteed or endorsed by the publisher.
Research integrity at Frontiers
Learn more about the work of our research integrity team to safeguard the quality of each article we publish.