 John Ugoretz
 Elizabeth A. Hellmers
 Julia H. Coates1
94% of researchers rate our articles as excellent or good
Learn more about the work of our research integrity team to safeguard the quality of each article we publish.
Find out more
ORIGINAL RESEARCH article
Front. Mar. Sci., 15 December 2022
Sec. Marine Megafauna
Volume 9 - 2022 | https://doi.org/10.3389/fmars.2022.1020187
Many reports have categorized the frequency, circumstances, and causes for interactions between sharks and humans, often using the behaviorally inaccurate term “attack.” The California Department of Fish and Wildlife (Department) instead uses the term “incident,” defined as interactions where a shark touches a person, their board, or kayak, without provocation and with or without causing injury. We created a comprehensive database of California shark incidents by reviewing, verifying, and updating past records, and examined the frequency of confirmed incidents, updated reports with new information, and examined similarities and differences in incident circumstances. Two hundred and one incidents were verified in California waters between 1950 and 2021, with 107 causing injury and 15 resulting in fatalities. The vast majority (178) involved White Sharks (Carcharodon carcharias). Contrary to past reports of White Shark incidents being concentrated in a portion of northern California, incidents have occurred statewide, with some of the highest numbers in Southern California. While total reported incidents are increasing, the annual number of incidents resulting in injuries or fatalities remains low. Frequency of incidents was not found to be greater around the full moon, dawn, or dusk but was greater during summer and fall months, as expected.
The terminology used to describe interactions between sharks and humans is important. For the purposes of tracking and verification, when possible, the California Department of Fish and Wildlife (Department) considers a shark “incident” to include any documented case where a shark approached and touched a person in the water or a person’s surfboard, kayak, paddleboard, etc. Incidents are further categorized by those resulting in no injury to the person, injuries, or fatalities. Shark sightings where no contact occurred, incidents where sharks made contact with larger boats, or cases where hooked or otherwise baited or provoked sharks interacted with humans are not considered incidents in our database.
The term “attack” has been widely used to describe instances where sharks bite or bump people, however, there is no scientific evidence to support the theory that sharks hunt people. A recent study concluded that, based on similarities to pinnipeds or other prey when viewed from below, the poor spatial resolving power of the shark retina may result in bites on humans due to mistaken identity or ambiguous visual cues (Ryan et al., 2021). While other reports support this theory of mistaken identity (Tricas and McCosker, 1984; McCosker and Lea, 2006; Curtis et al., 2012), Ritter and Quester (2016) conclude that these incidents are more likely investigatory in nature, but still not intentional predatory attacks on humans. White Sharks (Carcharodon carcharias) have been observed biting many non-food items, including kelp, floating debris, and other inanimate objects, and are known to make exploratory bites when investigating their environment (Miller and Collier, 1981; Lea and Miller, 1985; Collier et al., 1996). Regardless, if either, or both, the mistaken identity and exploratory bite theories are correct, the term “attack” is not the most accurate description of these events. Neff and Hueter (2013) suggest a similar system that more specifically classifies the nature of the event – sightings, encounters, bites, and fatal bites. This type of classification more appropriately categorizes the events based on the scenario involved.
Thus, given the broad range of interactions between sharks and people, the term “attack” is no longer used by the Department as it is not biologically or behaviorally accurate and implies intent on the part of the shark to either knowingly harm or consume the person. The Department has adopted the term incident when describing interactions where physical contact occurs between sharks and people, as it allows specific events to be categorized based on the details, similar to the classifications suggested by Neff and Hueter (2013). Here, we compare non-injury incidents to those where injuries to the person occurred and those that resulted in fatalities, to assess whether severity of interaction correlates to environmental factors such as season, time of day, or moon phase. The comparison helps to demonstrate the changes in frequency of non-injury incidents, which is significantly different than changes in frequency of injuries and fatalities.
Past reports on the number of shark incidents in California and on the west coast of North America have been compiled for 1926 through 2003. Miller and Collier (1981) reviewed known shark “attacks” (their terminology) in California between 1926 and 1979. Lea and Miller (1985) added information from California and Oregon between 1980 and 1984, and Collier (1993) provided additional descriptions of these incidents. McCosker and Lea (1996 and McCosker and Lea, 2006) more comprehensively reviewed the history, human activity, and shark activity involved with unprovoked “attacks” by White Sharks in the eastern North Pacific Ocean through 1993 and offshore California, Oregon, and Washington through 2003, respectively. Countless media reports have postulated that the frequency of shark incidents may be increasing, often referencing statistics from the International Shark Attack File (FLMNH, 2022a).
Since these past reports were published, the availability of and access to original information from newspapers and other primary sources has greatly increased through searchable online databases and websites. Past Department records and the publications listed above were reviewed, and attempts were made to locate original news reports or other documentation for each incident. Through this effort, additional incidents were discovered, and some previously reported incidents were determined to either have not involved sharks or been incorrectly identified as an incident under the Department’s current definition.
Since 2017, the Department has also maintained records of all shark incidents reported to the Department or documented in media or other reports. The numbers of incidents, along with a basic summary of the locations, shark species, and human activities involved are included as supplemental information here and are posted on the Department’s website (https://wildlife.ca.gov/Conservation/Marine/White-Shark). This web page is updated as soon as possible after each new incident is documented. In this analysis, we include all shark incidents occurring in California waters between 1 January 1950 and 31 December 2021, regardless of shark species.
We attempted to acquire primary source information and verification for all previously reported incidents between 1 January 1950 and 31 December 2021 using the California Digital Newspaper Collection, a project of the Center for Bibliographical Studies and Research at the University of California, Riverside. The collection contains more than 650,000 issues comprising nearly 8 million pages and more than 45 million articles, going back to 1807 (UCR, 2022). The year 1950 was selected as the initial year in the Department’s updated dataset due to limited primary source information found for shark incidents prior to that date.
Each previously reported incident was searched for in the archive using the incident date, name of the person involved (when available), location, and other details in attempts to find primary source verification. Additionally, searches were conducted for previously unreported incidents using the search terms “shark” and “shark attack.” Documented incidents were also compared with those included in the Global Shark Attack File (GSAF), an online downloadable database with many first-hand accounts of shark incidents worldwide (SRI, 2022). Finally, general internet searches were conducted for any incident where primary source verification could not be obtained through the California Digital Newspaper Collection, again using incident date, name of the person involved, and terms like “shark” and “shark attack.” Wherever possible, digital copies of source materials were made and stored in the Department’s electronic shark incident files.
Incidents previously documented in publications, Department records, and the GSAF database were included in the updated list, unless primary source information indicated the incident did not involve a shark or did not fit the Department’s current definition of shark incidents (e.g., the shark had been hooked or otherwise provoked). Incidents occurring since 2017 were compiled and included in the updated database as they were reported, with verifying documents added to the Department’s electronic files.
California shark incidents were reviewed to determine if the frequency of incidents has changed and if any relationship was apparent between incidents and the human activity during the incident, time of day, month, or lunar illumination. Additionally, incidents were mapped to examine regional differences and incident concentrations by coastal county. When a categorical variable is recorded according to frequency of occurrence, a chi-square test is appropriate. Fit to the chi-square distribution is used to test whether frequency is consistent with expectations. This omnibus test does not indicate which of the two or more categories in the scenarios does not meet expectations. We therefore use post-hoc testing and examination of the residuals within cells of the contingency table. Calculation of a z-score for each category allows comparison to a critical value to assess significance. We used this approach for each frequency analysis with application of a Bonferroni adjustment to the standard critical value of 1.96 to account for a larger number of cells in the contingency tables (Sharpe, 2015).
Given the obvious increase in the frequency of reported incidents from the period of 1950-2003 to 2004-2021, a single tailed t-test was used to determine the significance of the change over time by comparing the average annual numbers of non-injury and injury/mortality incidents from 2004-2021 to the annual averages from 1950-2003. Chi-squared Goodness-of-fit tests were used to determine if time of day or seasonality (month) significantly predicted the occurrence of an incident. For time of day, we only included hours between the earliest and latest reported incidents (6:00-23:00), as human activity in the ocean during nighttime hours is minimal and past reports indicate a prevalence around dawn and dusk.
We present the number of incidents within primary human activity categories (swimming, surfing/boarding, freediving, kayaking/canoeing, scuba/hookah diving, or paddleboarding) but did not perform statistics due to the lack of available data characterizing frequency of participation in these activities. It is important to consider potentially confounding factors when interpreting the results of these analyses, such as the fact that there are vastly more people in the ocean during daylight hours and during summer and fall months and that human ocean activities and use patterns have changed over time. In addition, given the relatively low number of incidents for each category, statistical power is limited.
Analyses were also conducted to determine if incidents correlated to lunar phase. French et al. (2021) concluded that global shark incidents may be related to lunar phase, with an increased number occurring around the “full moon.” Weltz et al. (2013) also found that white shark sightings were more common around the full and new moon, though did not analyze interactions with humans. To analyze lunar phase correlation in the Department data set, we attempted to replicate the French et al. (2021) analysis and performed Chi-squared Goodness-of-fit tests, examining a single factor at a time across 10 illumination deciles. Similar to the time of day and month analyses, we used a Z-score approach to assess the adjusted residuals from our chi-squared tests for each lunar illumination phase.
The United States Naval Observatory’s Astronomical Applications Department’s data service (Fraction of the Moon Illuminated) data for 2021 and Pacific Standard Time (PST) with a reference time of noon were used to calculate the fraction of time the moon spent in each illumination decile during a month (USN, 2022, Figure 1). These proportions were used to calculate the expected values in the analysis to account for the non-uniform temporal distribution of lunar illumination.
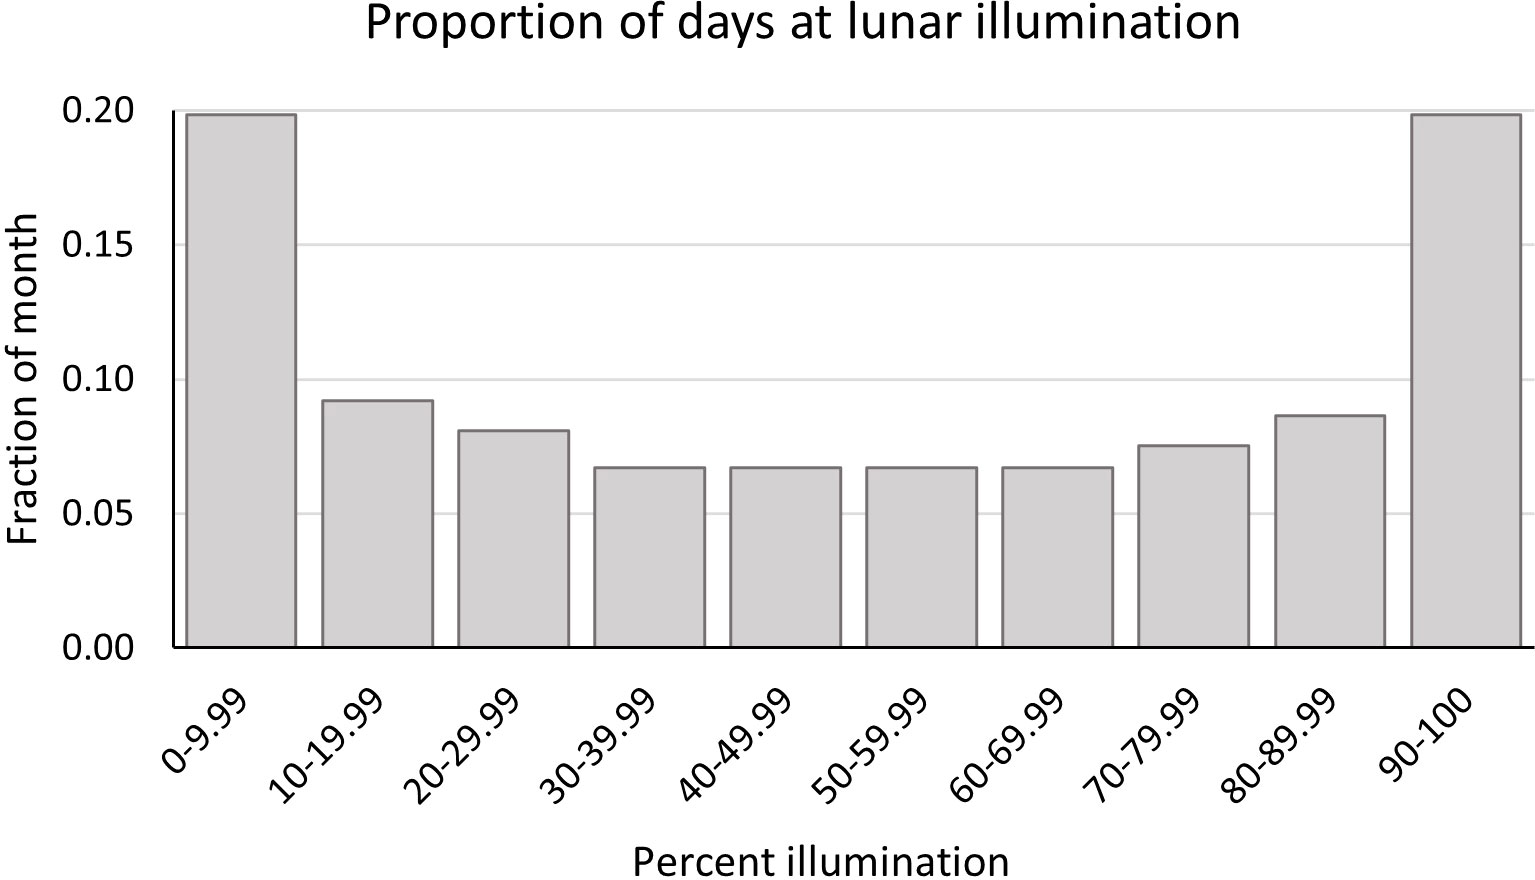
Figure 1 Proportion of days each month at lunar illumination split by decile based on 2021 data (USN 2022).
French et al. (2021) looked at four different groupings of their data (continent, species, “attack” outcome, and United States regions), with “attack” outcome (n = 2,156), United States regions (west coast, including California, Oregon, and Washington; n = 128), and species (n = 375) being the only components applicable to our data set. However, their analysis did not run multi-factor Chi-squared tests due to sample size limitations. The Department’s data set allows for a combination of these groupings and a unique opportunity to analyze a California-specific subset. Our analysis examined: 1) incident outcome for all species combined, including No Injury (n = 79) and Injury/Fatality (n = 122), and 2) incident outcome for White Sharks, including No Injury (n = 74) and Injury/Fatality (n = 104). An analysis was not performed for other species groupings due to the small sample size of incidents for other/unknown species.
Species identification came primarily from eyewitness accounts of the shark involved and, where possible, examination of bite marks and tooth fragments. In many cases, the species identification was based on a combination of witness statements, other eyewitness reports, or assumptions based on the location and size of the shark involved. It is possible that some of these identifications are incorrect, and that the species was also misidentified in cases where other species were implicated.
The Department’s Wildlife Forensic Laboratory can identify shark species from DNA samples taken from the shark itself. When shark tissue samples are available, the laboratory can identify a variety of species, including White Shark, Blue Shark (Prionace glauca), Shortfin Mako (Isurus oxyrinchus), Longfin Mako (I. paucus), Scalloped Hammerhead (Sphyrna lewini), Smooth Hammerhead (S. zygaena), and Broadnose Sevengill Shark (Notorynchus cepedianus), among others. Since 2017, the laboratory has also examined DNA samples from California shark incidents when swabs or other samples were taken from a bite and made available. In those cases, when enough DNA is present, the laboratory can identify the species involved.
The Department’s review of available information confirmed 201 shark incidents in California waters between 1 January 1950 and 31 December 2021, with 107 causing non-fatal injuries and 15 resulting in fatalities (Supplementary Material). Three incidents that were previously included in the Department database and past publications were removed during our review (numbers 22, 27, and 96 in Supplementary Material).
In two cases, incidents were removed as they most likely involved orcas (Orcinus orca, incident number 22 on 20 July 1969 at Pigeon Point, San Mateo County and incident number 27 on 9 September 1972 at Point Sur, Monterey County). In the 1969 incident, reports in four newspapers (Monterey Peninsula Herald, The Progress Bulletin, San Bernadino Sun, and Santa Cruz Sentinel) indicated that the individual’s foot was “crushed” and that, while there were lacerations and severed blood vessels, the wounds lacked serrated damage that may have indicated a shark bite. The reports indicate that Dr. Earl Herald, then Director of the Steinhardt Aquarium in San Francisco, concluded the wound was more consistent with that of an orca bite. In the 1972 incident, firsthand accounts from the person involved in three newspapers (Monterey Peninsula Herald, Santa Cruz Sentinel and Desert Sun) helped to identify that the incident involved an orca. The person involved stated he saw “…a glossy black head…” approaching. The animal was described as black with white spots, a horizontal tail, and 15 to 20 ft long. The description, along with the later identification based on photos shown to the person involved, confirmed that the incident involved an orca. To our knowledge, these are the only two known incidents involving orcas in the ocean off California.
A third incident was removed that purportedly involved a shark, but where conflicting reports indicated a lack of evidence to confirm a shark, or any animal, was involved (incident number 96 on 09 January 2001 at Sunset Cliffs, San Diego County). In this incident, McCosker and Lea (2006) stated that conversations with R.H. Rosenblatt of the Scripps Institution of Oceanography and newspaper articles in the San Diego Union Tribune and the San Diego Peninsula Beacon did not provide evidence that the incident involved a shark. The person involved did not sustain injuries, nor were there cuts on his surfboard or leash that were supposedly bitten.
On average, there were fewer than three incidents annually, ranging from no incidents in ten of the years to nine incidents in one year, 2007 (M = 2.8, SD ± 2.41, Figure 2). The average annual number of incidents resulting in injury was less than two (M = 1.5, SD ± 1.33) and the average annual number resulting in fatalities was far less than one (M = 0.2, SD ± 0.44, Figure 2). The largest number of incidents resulting in injuries occurred in 1974 with seven confirmed, followed by 2005 with five and 1995 with four (Figure 2). No other years in the 72-year series had more than three injuries reported. Fatalities occurred in 14 years and only one year, 1959, had more than one fatality reported (Figure 2).
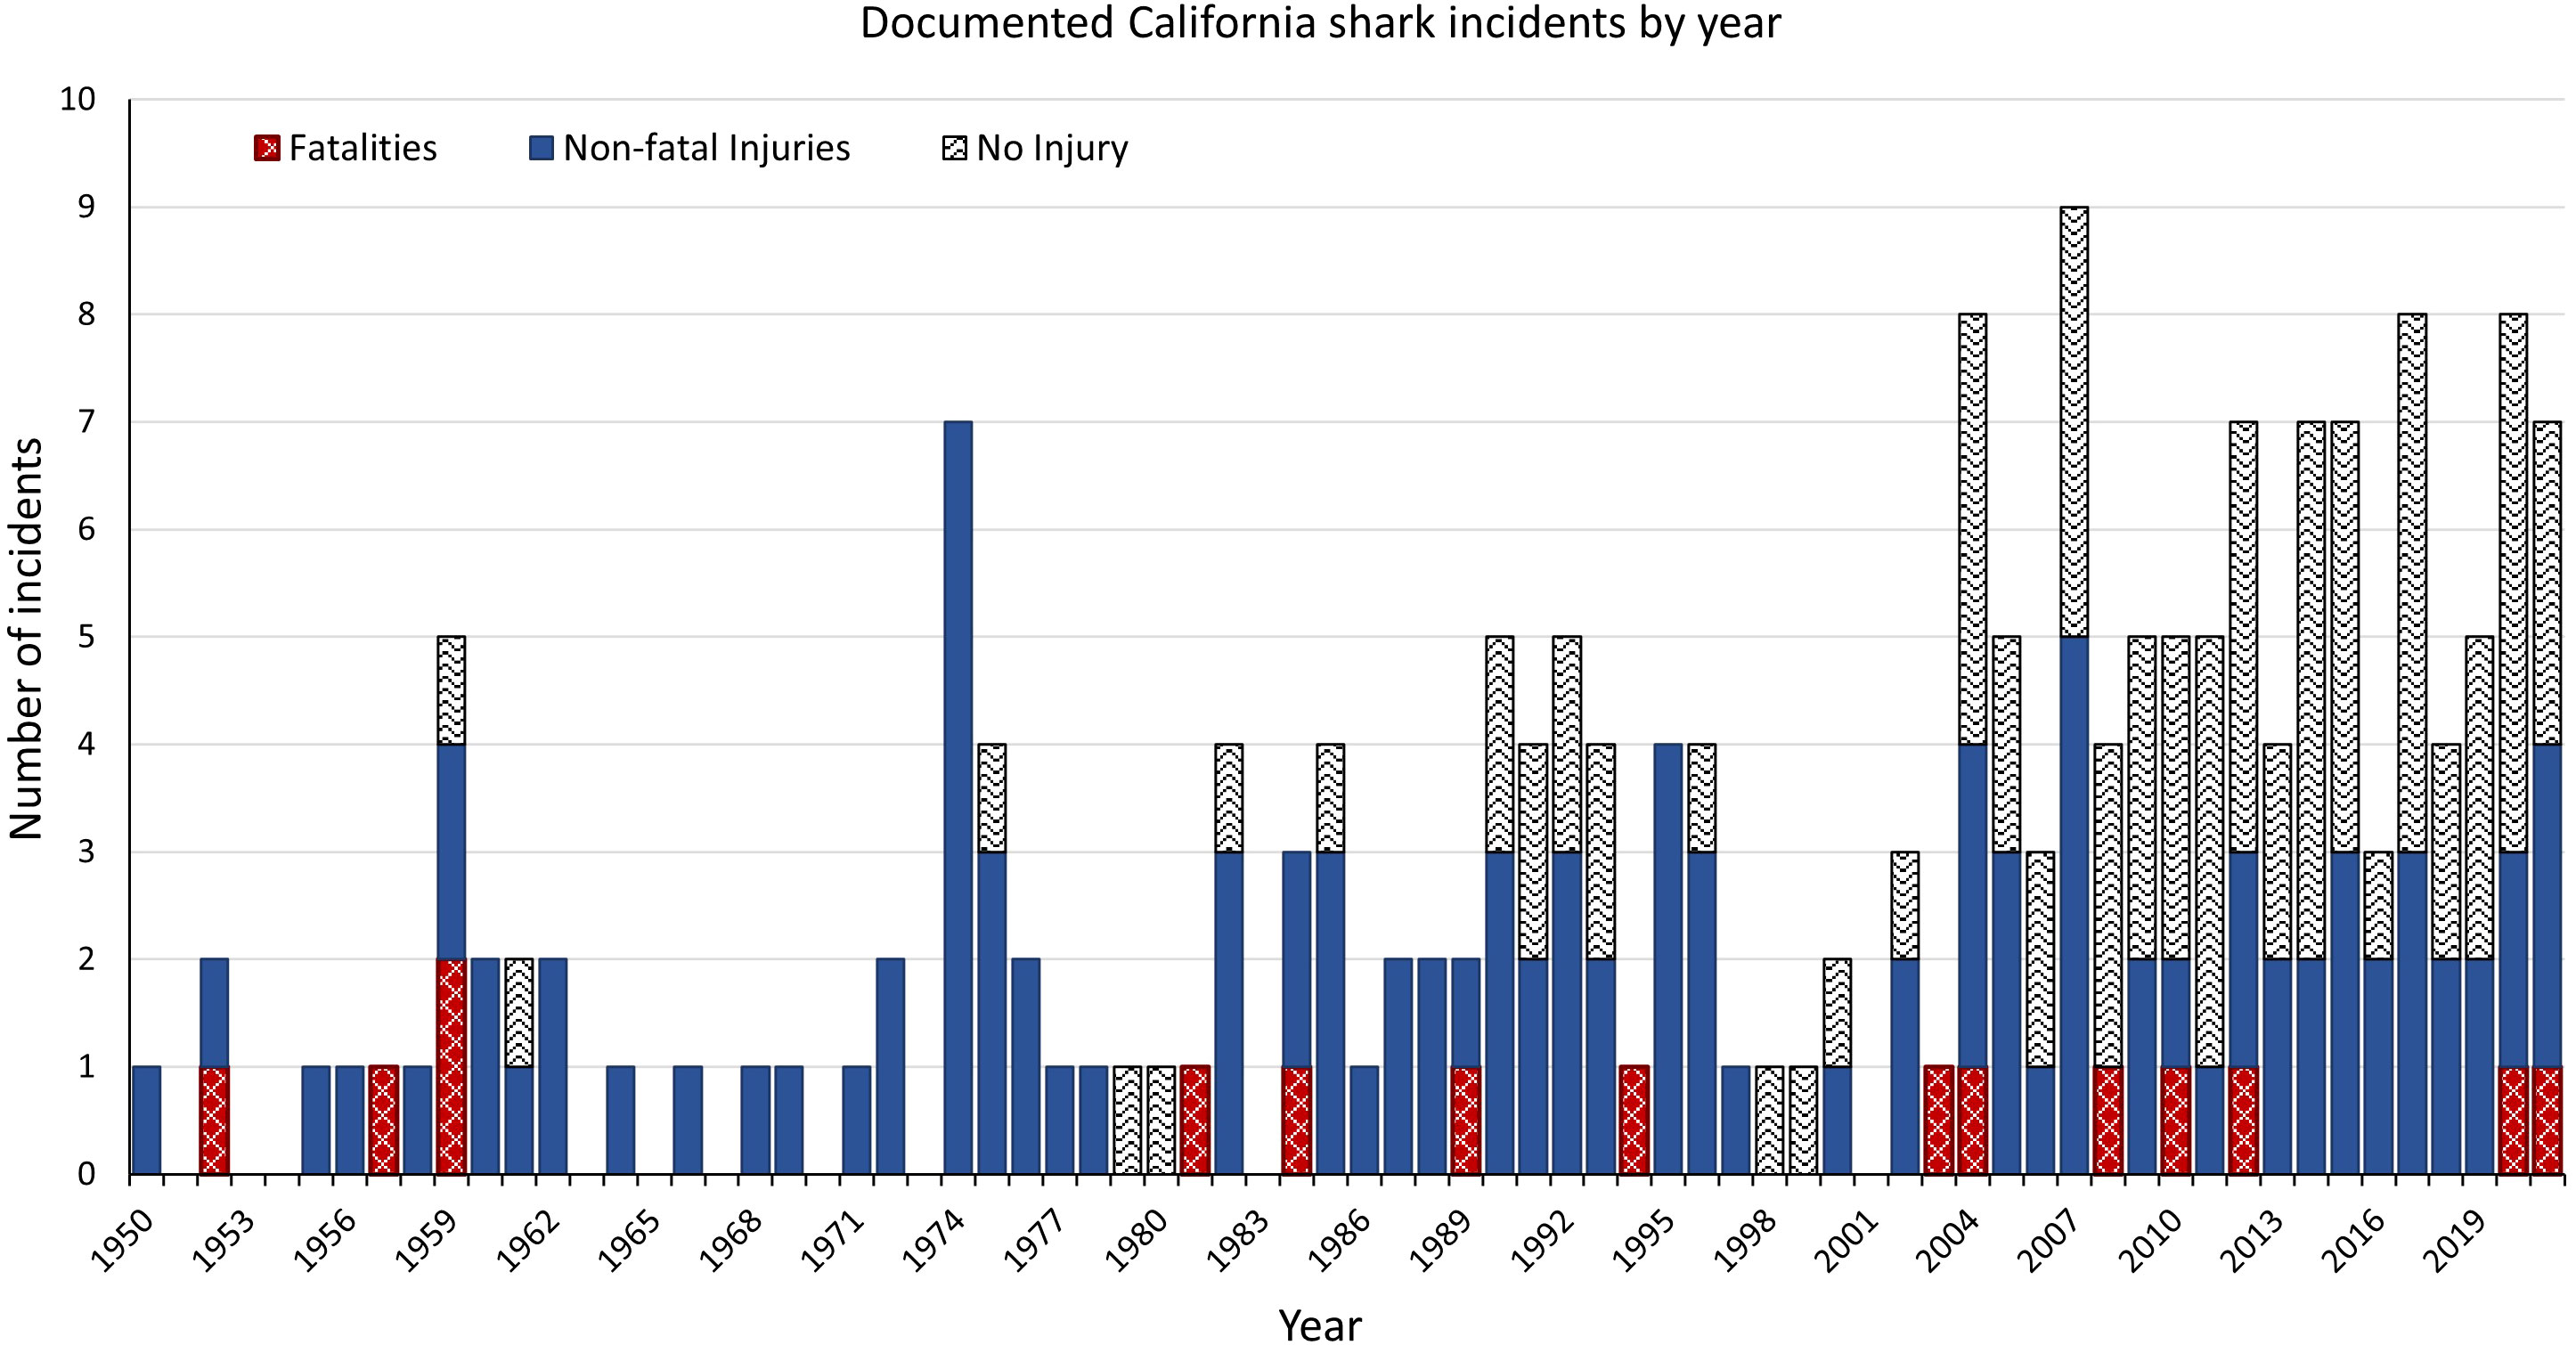
Figure 2 Documented California shark incidents in California by year, 1950 to 2021.
Prior to 2004, there were only 20 non-injury incidents reported, compared to 77 injuries and fatalities combined, with annual averages of 0.4 (SD ± 0.62) and 1.4 (SD ± 1.35), respectively (Figure 2). Starting in 2004, there was a significant, almost nine-fold increase in the annual average of well documented non-injury incidents (with either witness confirmations or bite marks on boards/kayaks), often two or more times the number of injuries and fatalities (M = 3.3; SD ± 2.06; t(18) = 2.5, p = 0.0223, Figure 2 and Supplementary Material). In the 54 years prior to 2004, only four years, 1990-1993, had more than one non-injury incident reported, each of those with two. Between 2004 and 2021, however, all but one year had more than two non-injury incidents reported, and eight years had more than three reported (Figure 2 and Supplementary Material).
Incidents resulting in injuries are also significantly increasing, though this change began much earlier. Comparing the same timeframe as the change in non-injury incidents, there was a significant 1.7-fold increase in the average number of injury incidents per year from 2004-2021 than the previous 54 years (M = 2.2 and M = 1.3, respectively; SD ± 0.64; t(18) = 6.16, p = 0.00001). In the 1950s and 1960s the average rate of injury incidents was less than 1 per year (Table 1). The rate increased to between 1.4 and 2 per year in the 1970s through 2010s (Table 1). In contrast to the shift in non-injury incidents in 2004, the shift in injuries appears to occur in 1974 with an annual average of 1.8 for 1974 to 2021, more than twice the annual average of 0.8 (SD ± 0.72) prior to 1974 (M = 1.8; SD ± 0.74; t(48) = 5.61, p = 1.03E-6; Figure 2).
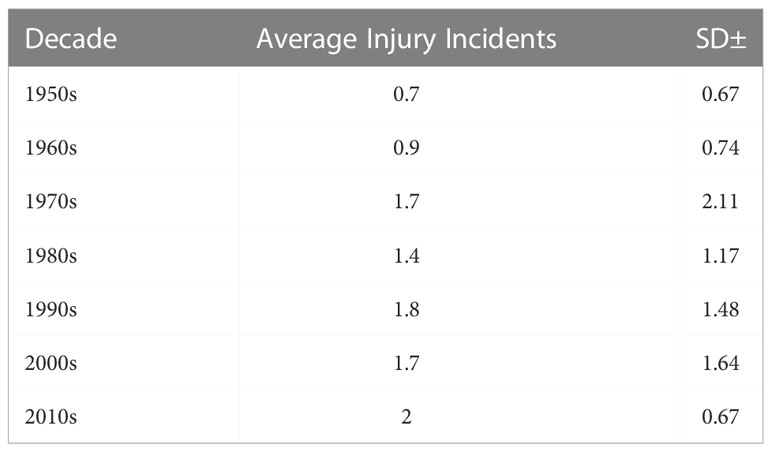
Table 1 Average annual number of California shark incidents resulting in injuries by decade, 1950s-2010s.
The public and media often refer to Northern California as the “Red Triangle” due to a purportedly higher number of shark incidents along this section of coastline (UCR, 2022). The area has been variously described as spanning from as far north as the California/Oregon border, to as far south as the southern extent of Monterey County. Most current media references use a boundary spanning from Bodega Bay in the north, west to the Farallon Islands, and south to Point Sur, which we use in our analysis. Curtis et al. (2012) found that only three incidents involving white sharks occurred in Southern California, that 80% of “attacks” occurred from Humboldt County south to Monterey County, and 62% within the “Red Triangle” (which they defined as Marin County to Monterey County and out to the Farallon Islands). However, our analysis indicates that counties in the “Red Triangle” only account for 73 out of the 201 total incidents (36%) and 46 of the 122 injuries and fatalities (38%, Supplementary Material). While incidents from Monterey County north to the Oregon border do account for the majority of incidents (approximately 57%), only 40% of fatalities statewide occurred in this area. This review demonstrates that not only do shark incidents occur statewide, but that the two counties with the highest number of incidents since 1950 are both in Southern California: Santa Barbara and San Diego counties, 26 and 23 respectively (including islands within each county, Figure 3). This is likely reflective not of the number of sharks or probability of incidents, but rather the fact that Southern California has substantially more open beach areas with generally calmer and warmer waters conducive to recreational water sports. When looking at injuries and fatalities, incidents are also spread throughout the state, with every coastal county having at least two incidents. There are between 12 and 16 occurring in Marin, Monterey, Santa Barbara (including six from San Miguel, Santa Rosa, and Santa Cruz islands) and San Diego counties and between six and nine occurring in Humboldt, Sonoma, San Francisco (including seven at the Farallon Islands), Santa Cruz, San Mateo, San Luis Obispo, and Los Angeles (including Catalina Island) counties (Figure 3). Fatalities, though infrequent, occurred statewide as well, with the greatest number (three each) in San Luis Obispo and Santa Barbra counties (Figure 3).
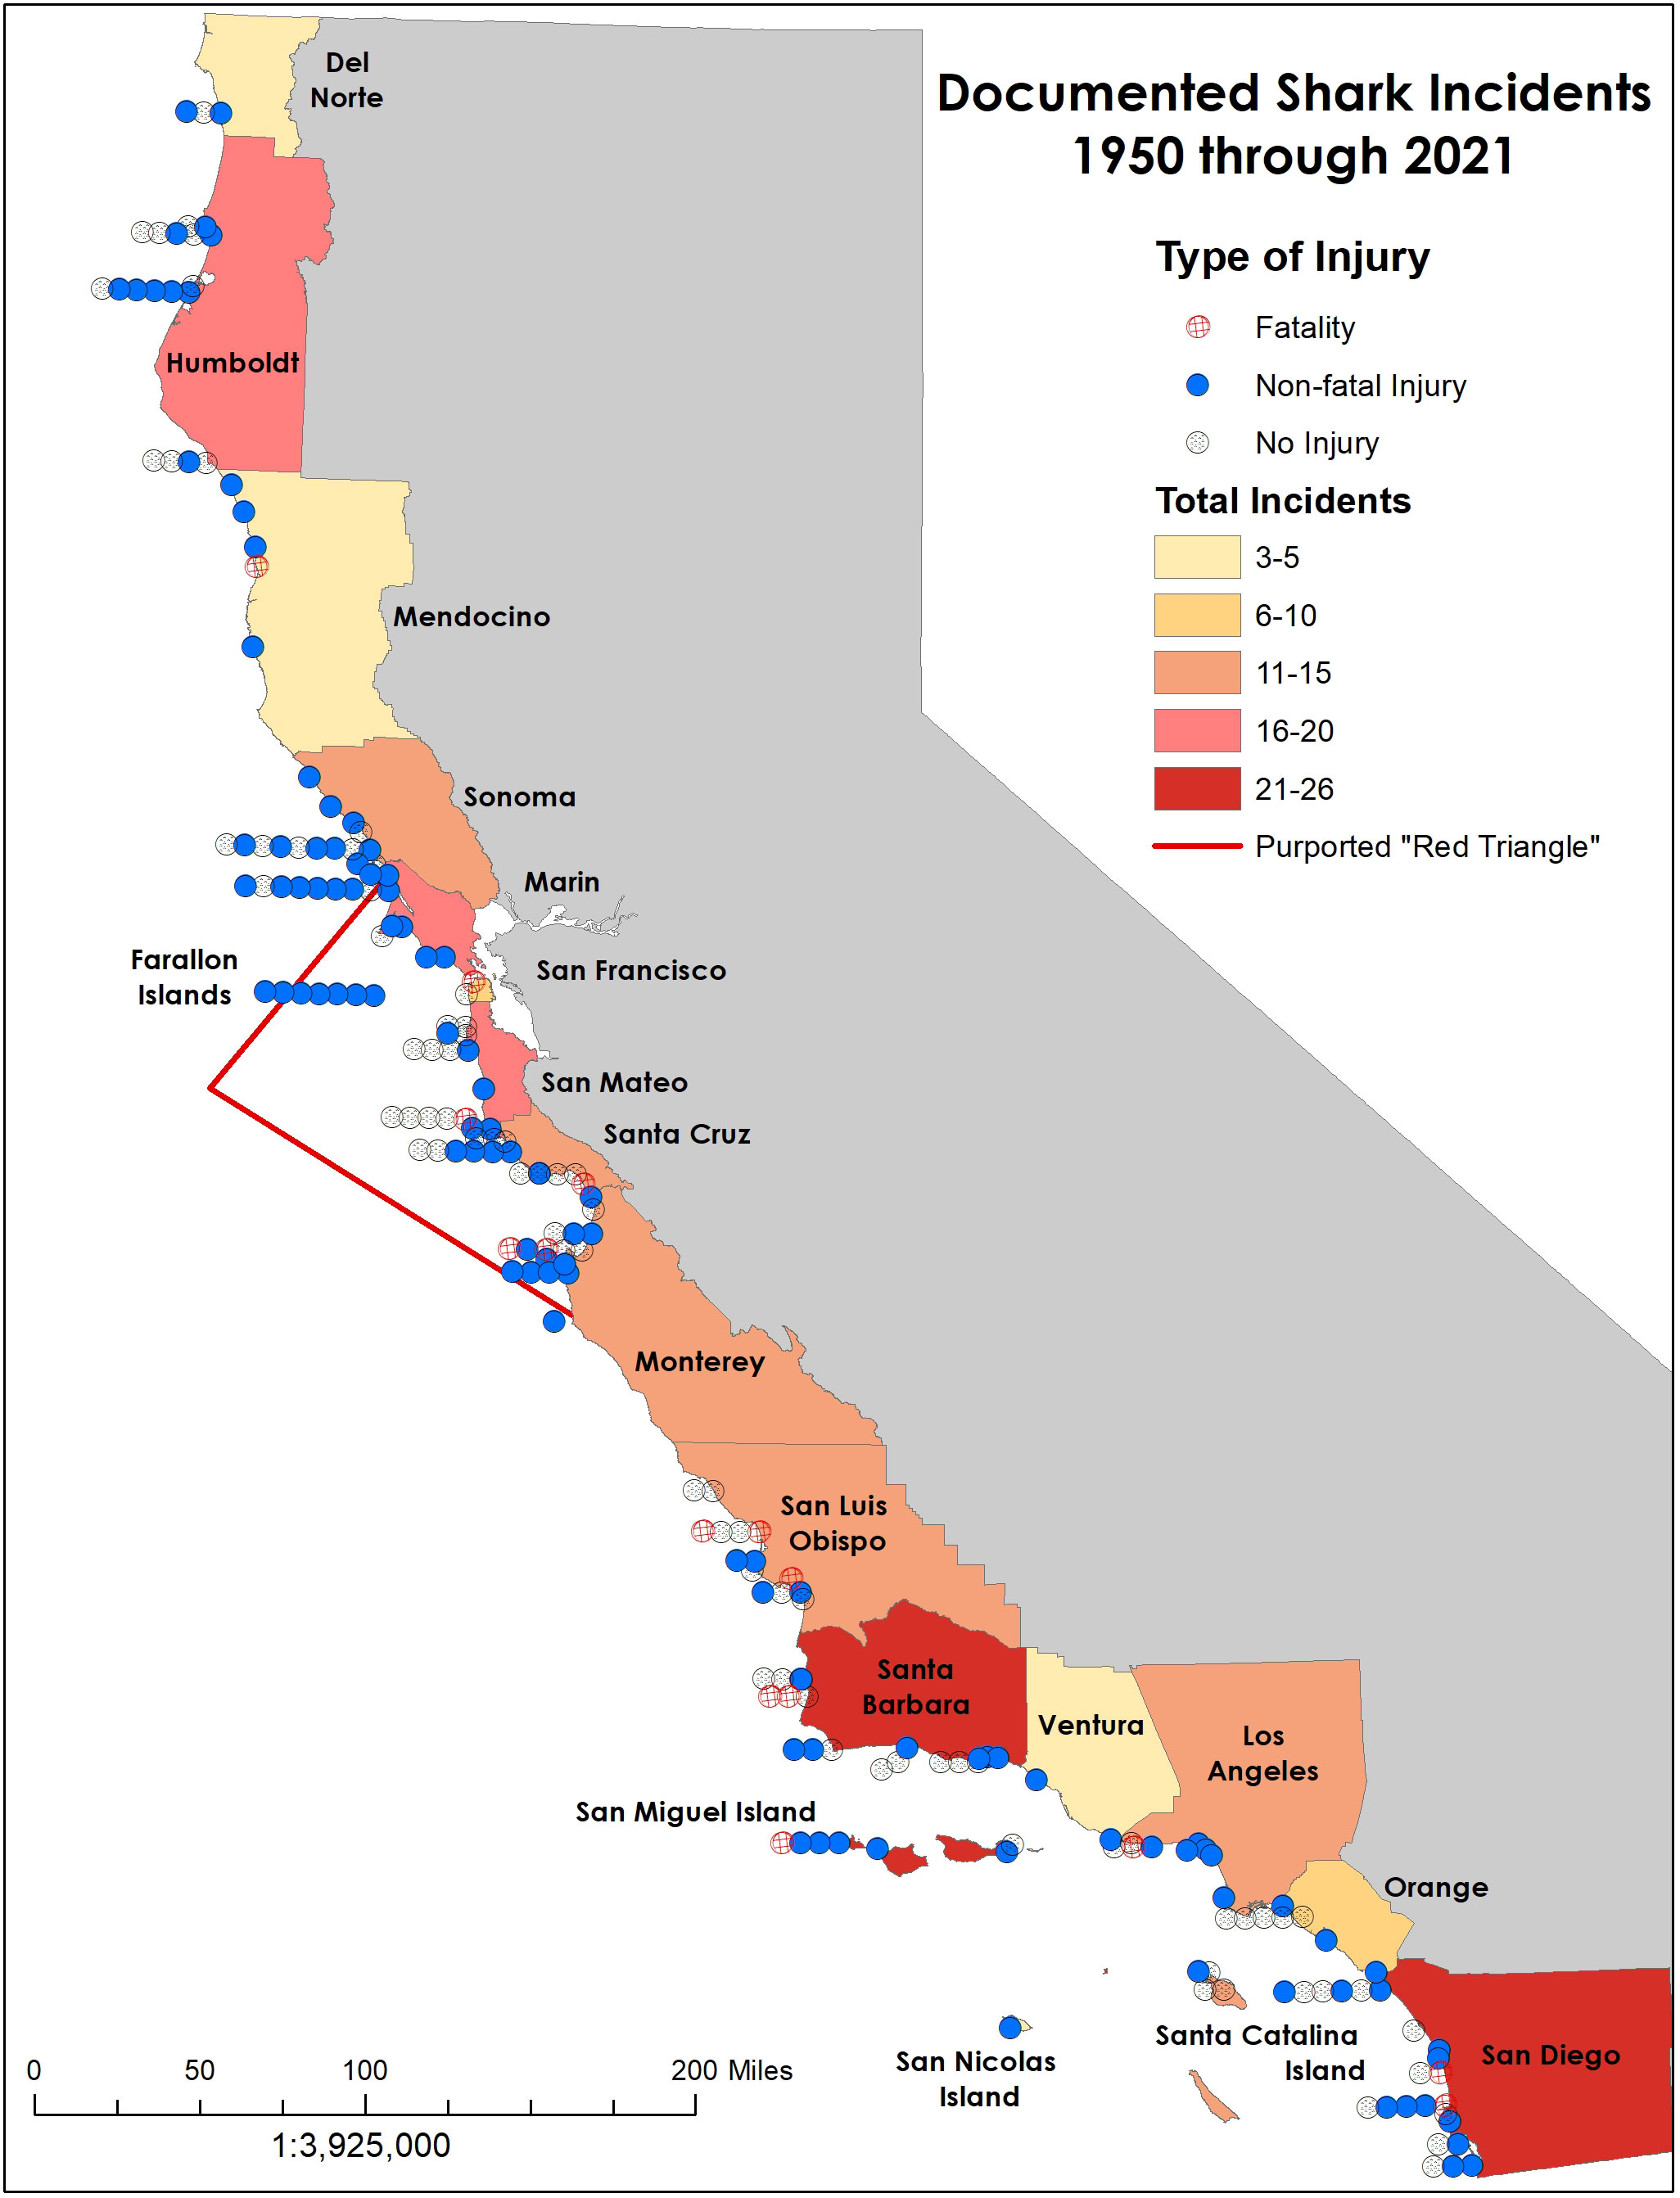
Figure 3 Map of documented shark incidents off California by injury type, and summarization of total incidents by coastal county (island totals are included within the county they are part of), 1950 to 2021.
California shark incidents have occurred during every month of the year. The frequency of incidents is higher from July through October (Figure 4), consistent with increased beach use during summer months and when water temperatures are warmest offshore California. For example, Dwight et al. (2007) found that 54% of beach attendance in Southern California occurs during these same months. Relative to an even distribution across the year, injury and fatality incidents were significantly more frequent than expected in August, September, and October and significantly less frequent than expected in February through April. These results correspond to patterns of human activities in the ocean which increase in the summer. Using a Z-score approach, we determined that residual values between -2.87 < x < 2.87 did not have observed values significantly different from the expected value (Figure 5).
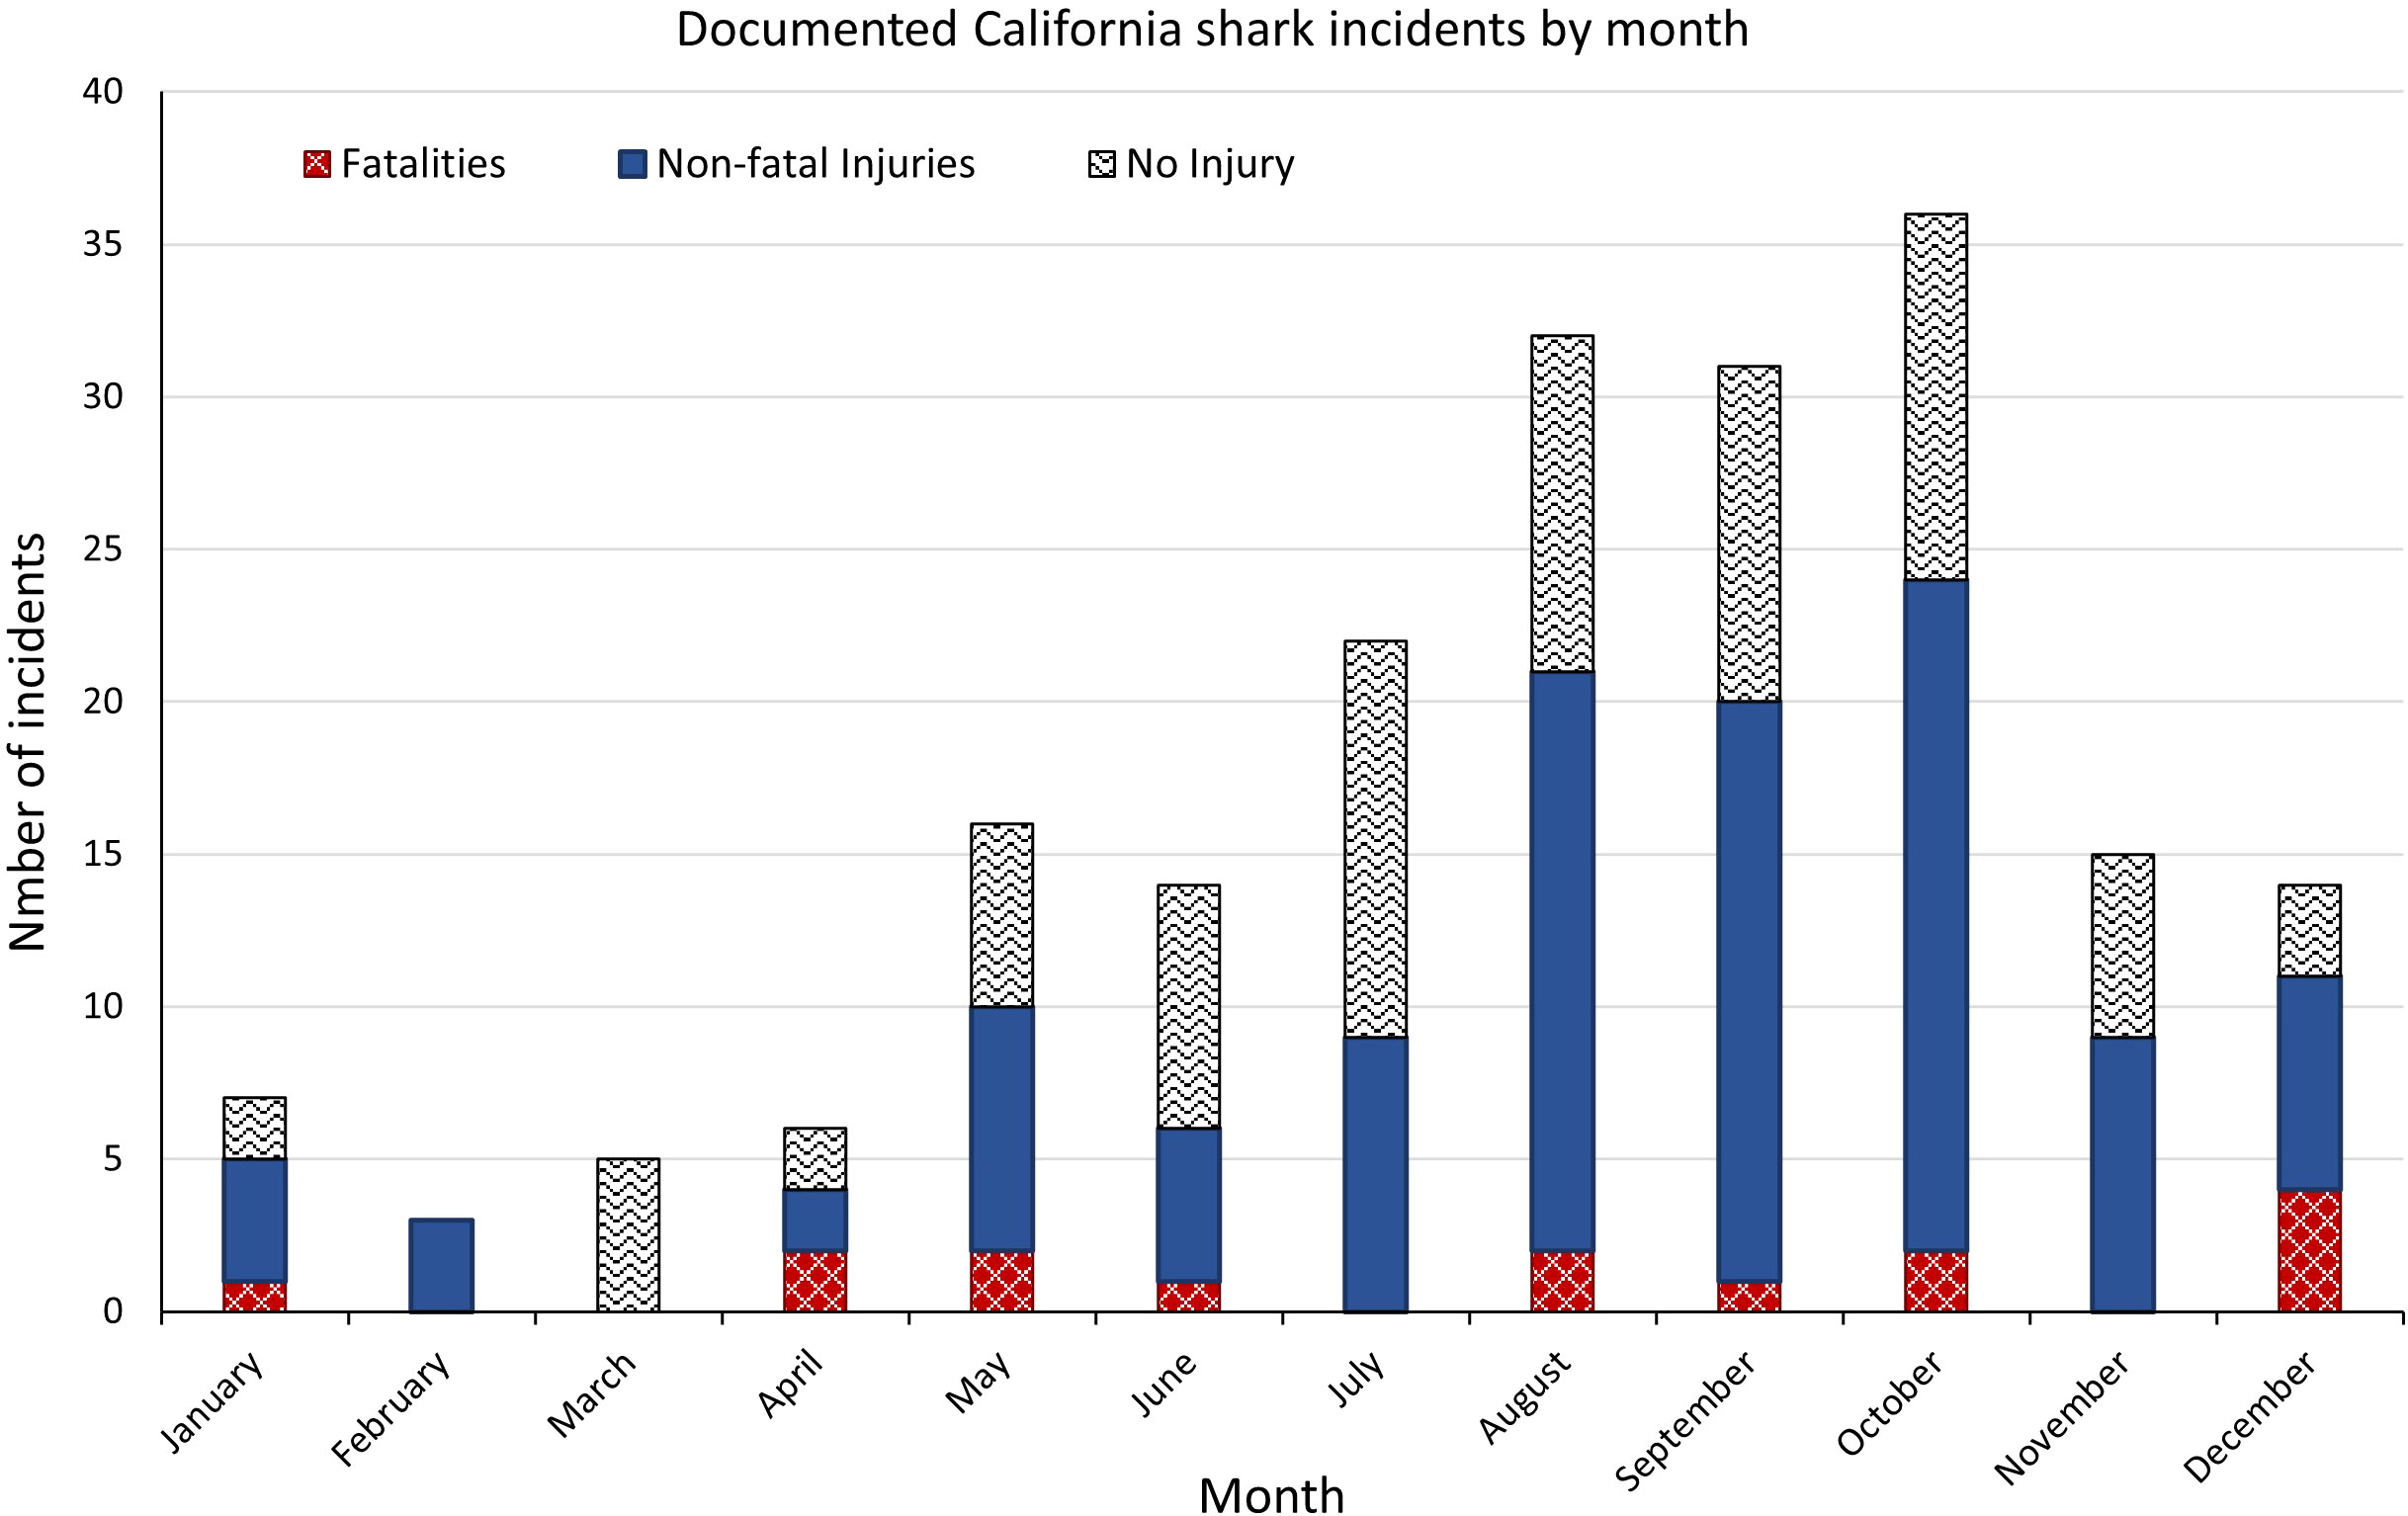
Figure 4 Documented California shark incidents by month and category: non-injury incidents, non-fatal injuries, and fatalities, 1950 to 2021.
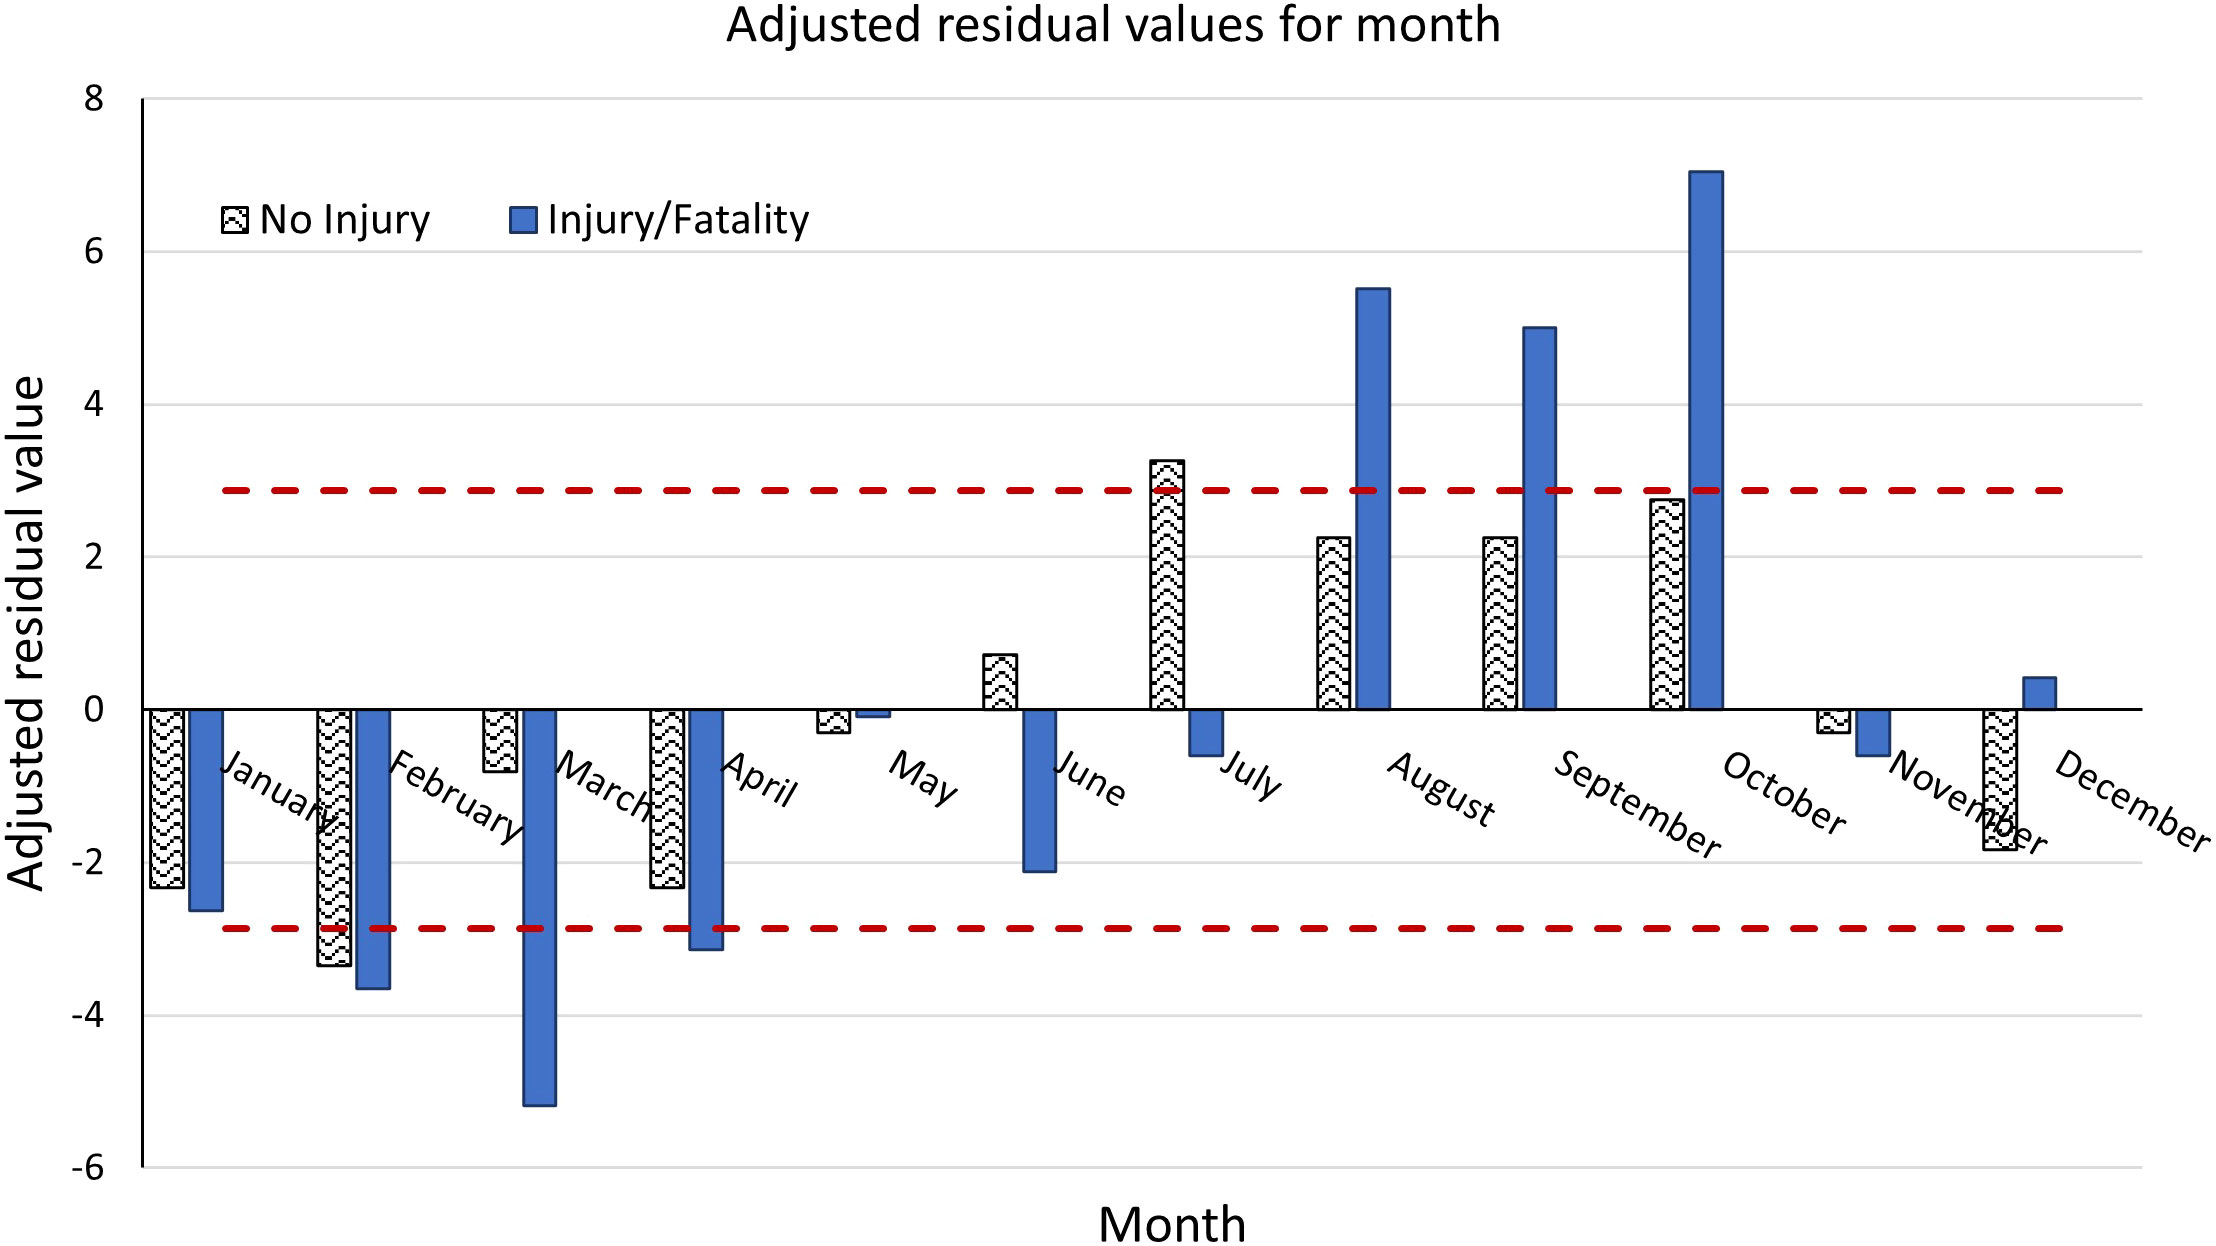
Figure 5 Adjusted residual values showing the direction and magnitude of difference between expected and documented number of shark incidents for all species by month, split by no injury and injury/fatality. The horizontal dashed red lines represent the cutoff for 95% significance. Bars that do not extend past the red horizontal dashed lines represent values that did not statistically differ from the expected count when analyzed with a Chi-squared test. Injury categories were tested separately but are presented together.
Consistent with Baldrige’s (1974) past analysis of time of day in California, incidents in our analysis were most frequent at mid-day, with no reported incidents occurring between midnight and six in the morning (Figure 6). Relative to an even distribution across hours between 6:00 and 23:00 (when incidents occurred), our analysis showed the frequency injury/fatality incidents was significantly greater than expected during the 9:00, 11:00, 14:00, and 17:00 hours, peaking around 11:00 (Figure 7). Adjusted residual values between -2.99 < x < 2.99 did not have observed values significantly different from the expected value. The daytime peaks and lack of reported events late at night are consistent with the times of greatest ocean use and nighttime beach closures in some locations. Data do not support a theory that incidents are more frequent at dawn and dusk “when sharks are most active and have a competitive sensory advantage” (FLMN, 2022b), as only the adjusted residual for 7:00, which is after dawn in summer months when incidents are most prevalent, showed a slightly significant number of incidents above what was expected, and the residuals for injury/mortality indicated that incidents were significantly less frequent at 6:00 and 18:00-20:00 than expected. Similarly, non-injury incidents were also less frequent than expected during these times, although not significantly so (Figure 7).
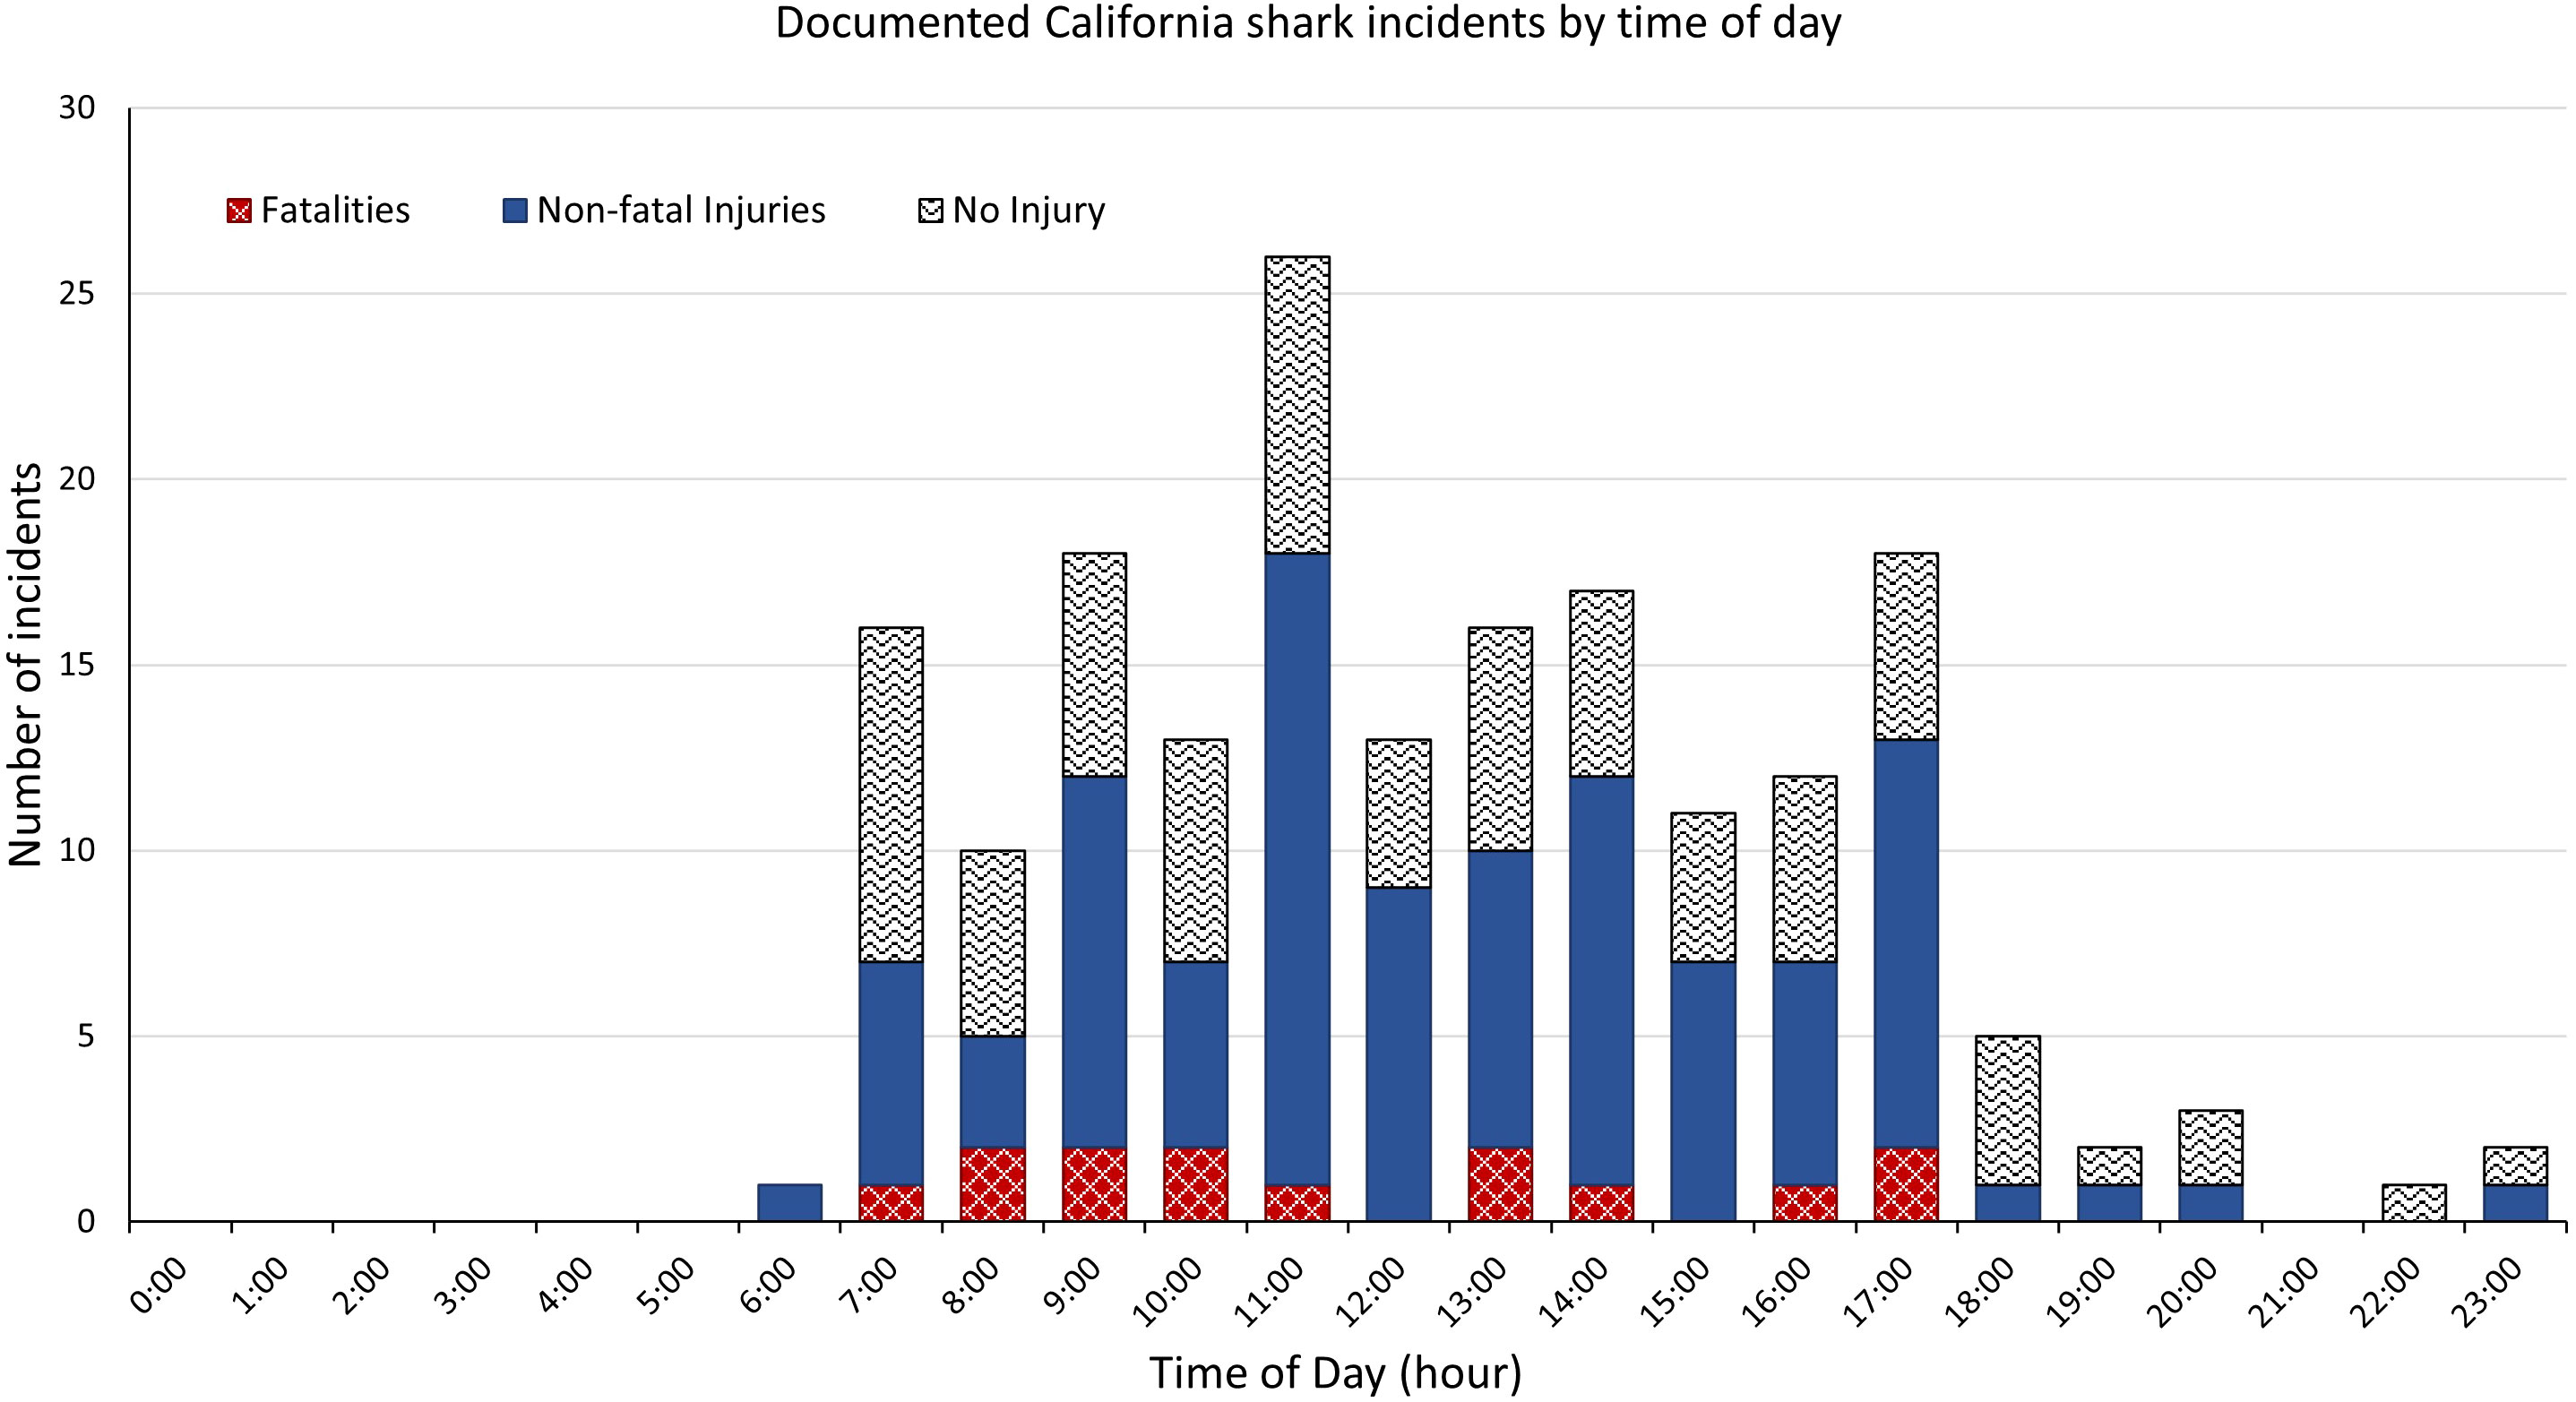
Figure 6 Time of day of documented California shark incidents by category, non-injury incidents, non-fatal injuries, and fatalities, 1950 to 2021.
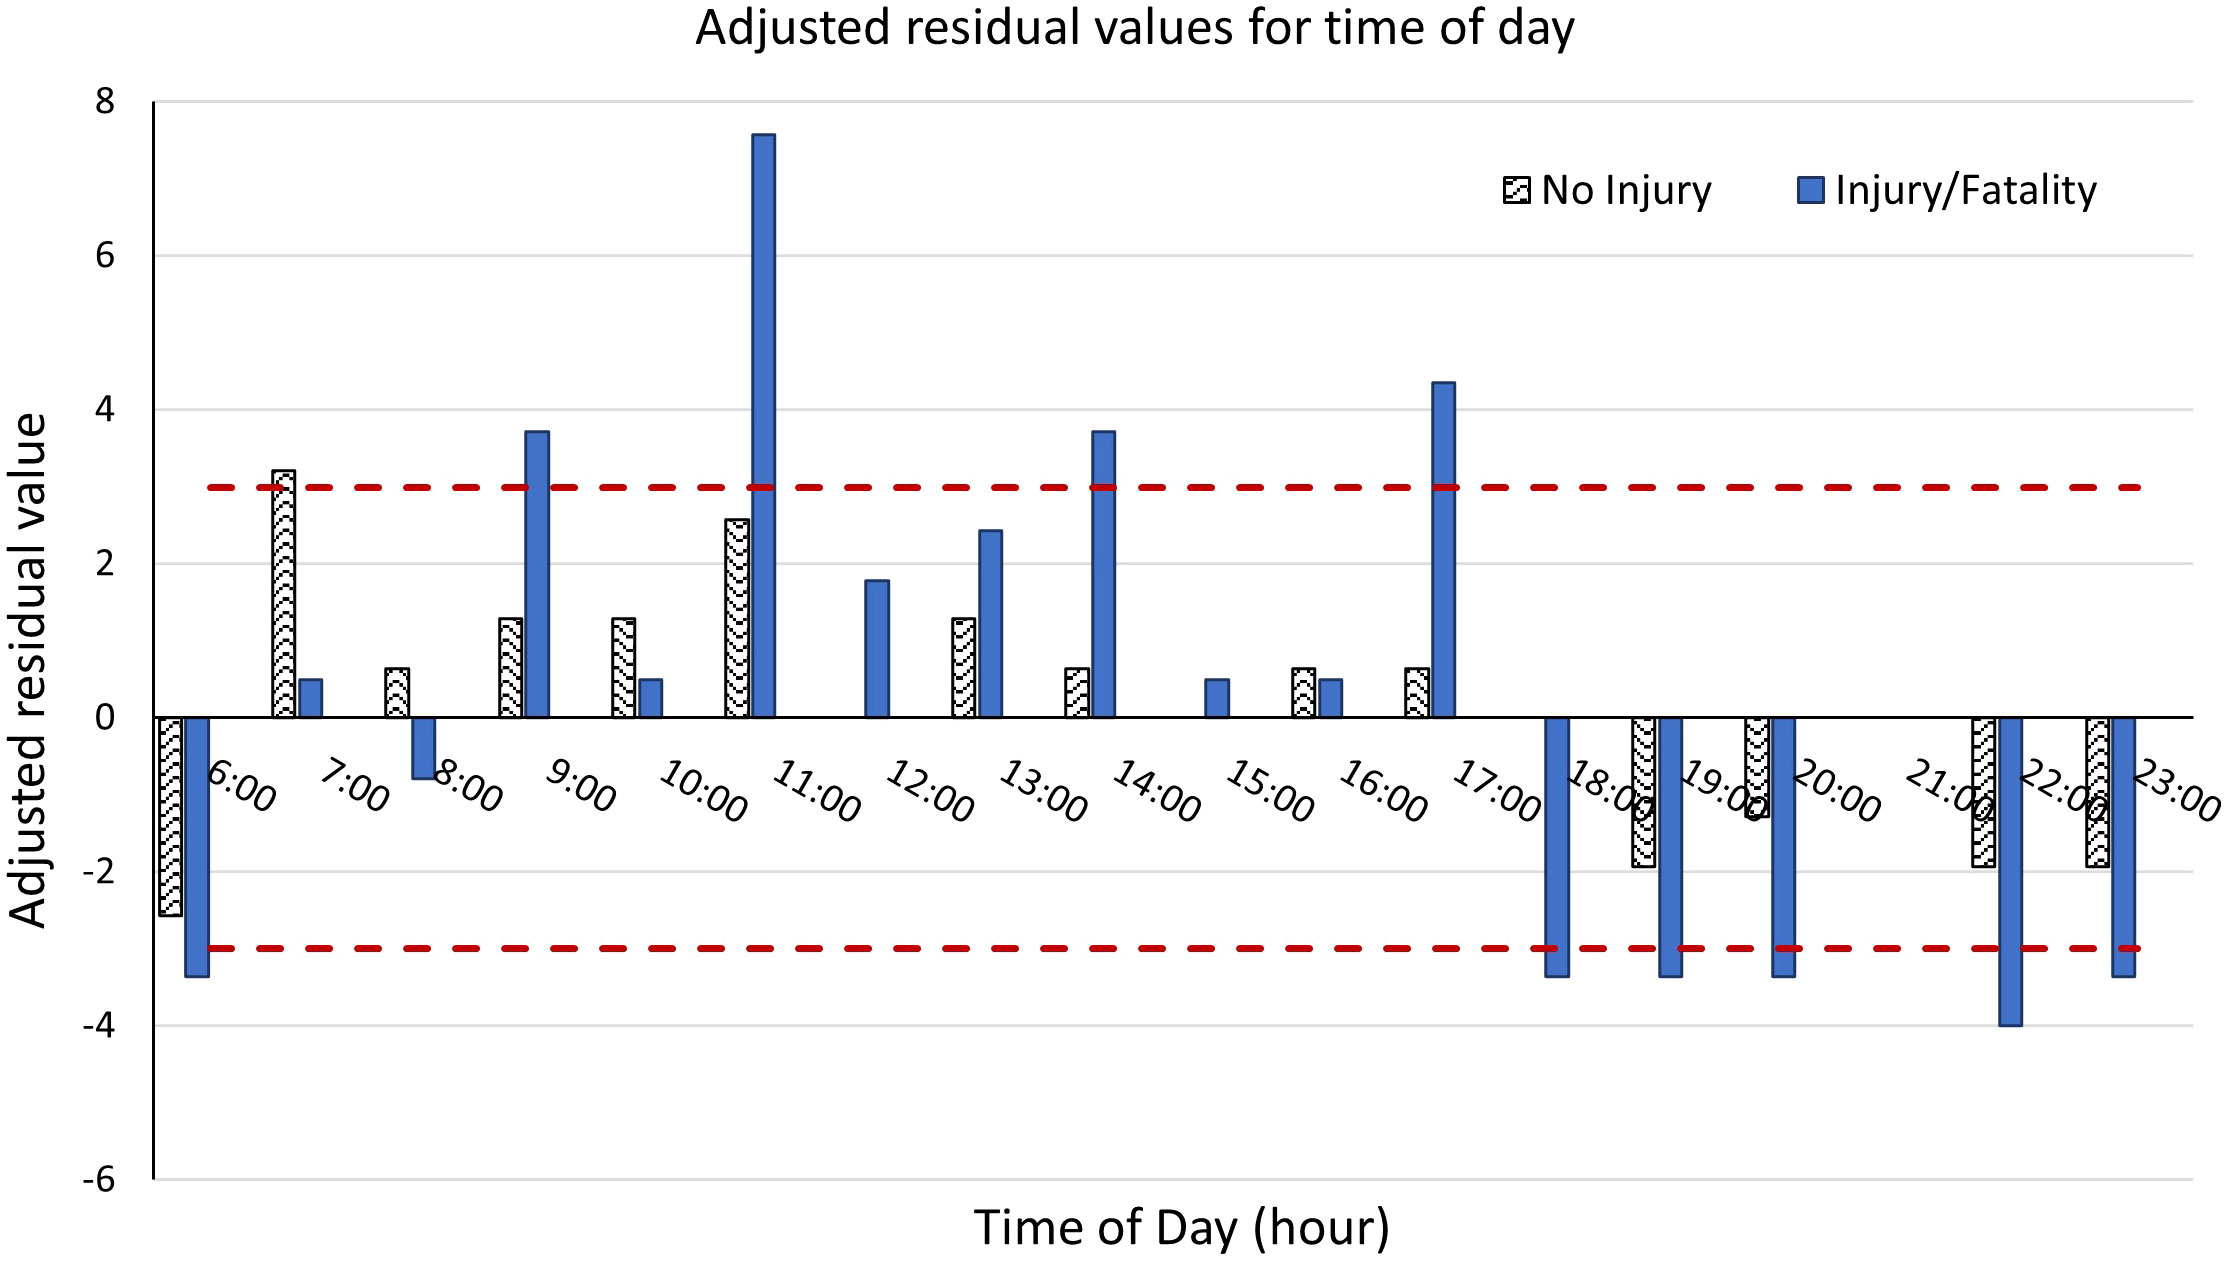
Figure 7 Adjusted residual values showing the direction and magnitude of difference between expected and documented number of shark incidents for all species by time of day (hour), split by no injury and injury/fatality. The horizontal dashed red lines represent the cutoff for 95% significance. Bars that do not extend past the red horizontal dashed lines represent values that did not statistically differ from the expected count when analyzed with a Chi-squared test. Injury categories were tested separately but are presented together.
The moon is full and new for approximately 20% of the days each month, using the top and bottom deciles to represent full and new (Figure 1). The remaining 60% of the month is relatively evenly split between the other phases. When comparing shark incident frequency to lunar phase, it is important to consider the frequency of events compared to the frequency of lunar phase. A straight comparison of the numbers of all incidents by lunar phase, shows a remarkably similar split with about 20% each occurring around the full and new moon phases and the remaining 60% evenly split among the other phases.
Similar to French et al. (2021), we assessed the residuals using a Z-score approach, and as with the month and time of day tests, applied a Bonferroni adjustment to determine that residual values between -2.81 < x < 2.81 did not have observed values significantly different from the expected value.
We calculated both SDRs and adjusted residuals for non-injury and injury/fatality incidents. There was little difference between results from the two residual evaluation methods and California data show that there is no statistical difference between the documented and expected number of incidents during any moon phase, with one exception (Figure 8). The number of non-injury incidents occurred more frequently than expected around the half-moon (50–59.9% illumination). While there are no statistically significant differences for injury and fatality incidents, the trends also do not support a conclusion that incidents occur more frequently around the full moon. In fact, there is a slight negative trend for incidents occurring around the full moon (Figure 9). In analyzing the data for only those incidents involving White Sharks, we found that the adjusted residual value for non-injury incidents around the half-moon is greater (Figure 10).

Figure 8 Lunar phase and number of documented California shark incidents by category: non-injury incidents, and non-fatal injuries and fatalities, 1950 to 2021. The yellow bar represents shark incident counts that were significantly greater than the expected number of counts for that given lunar illumination decile.
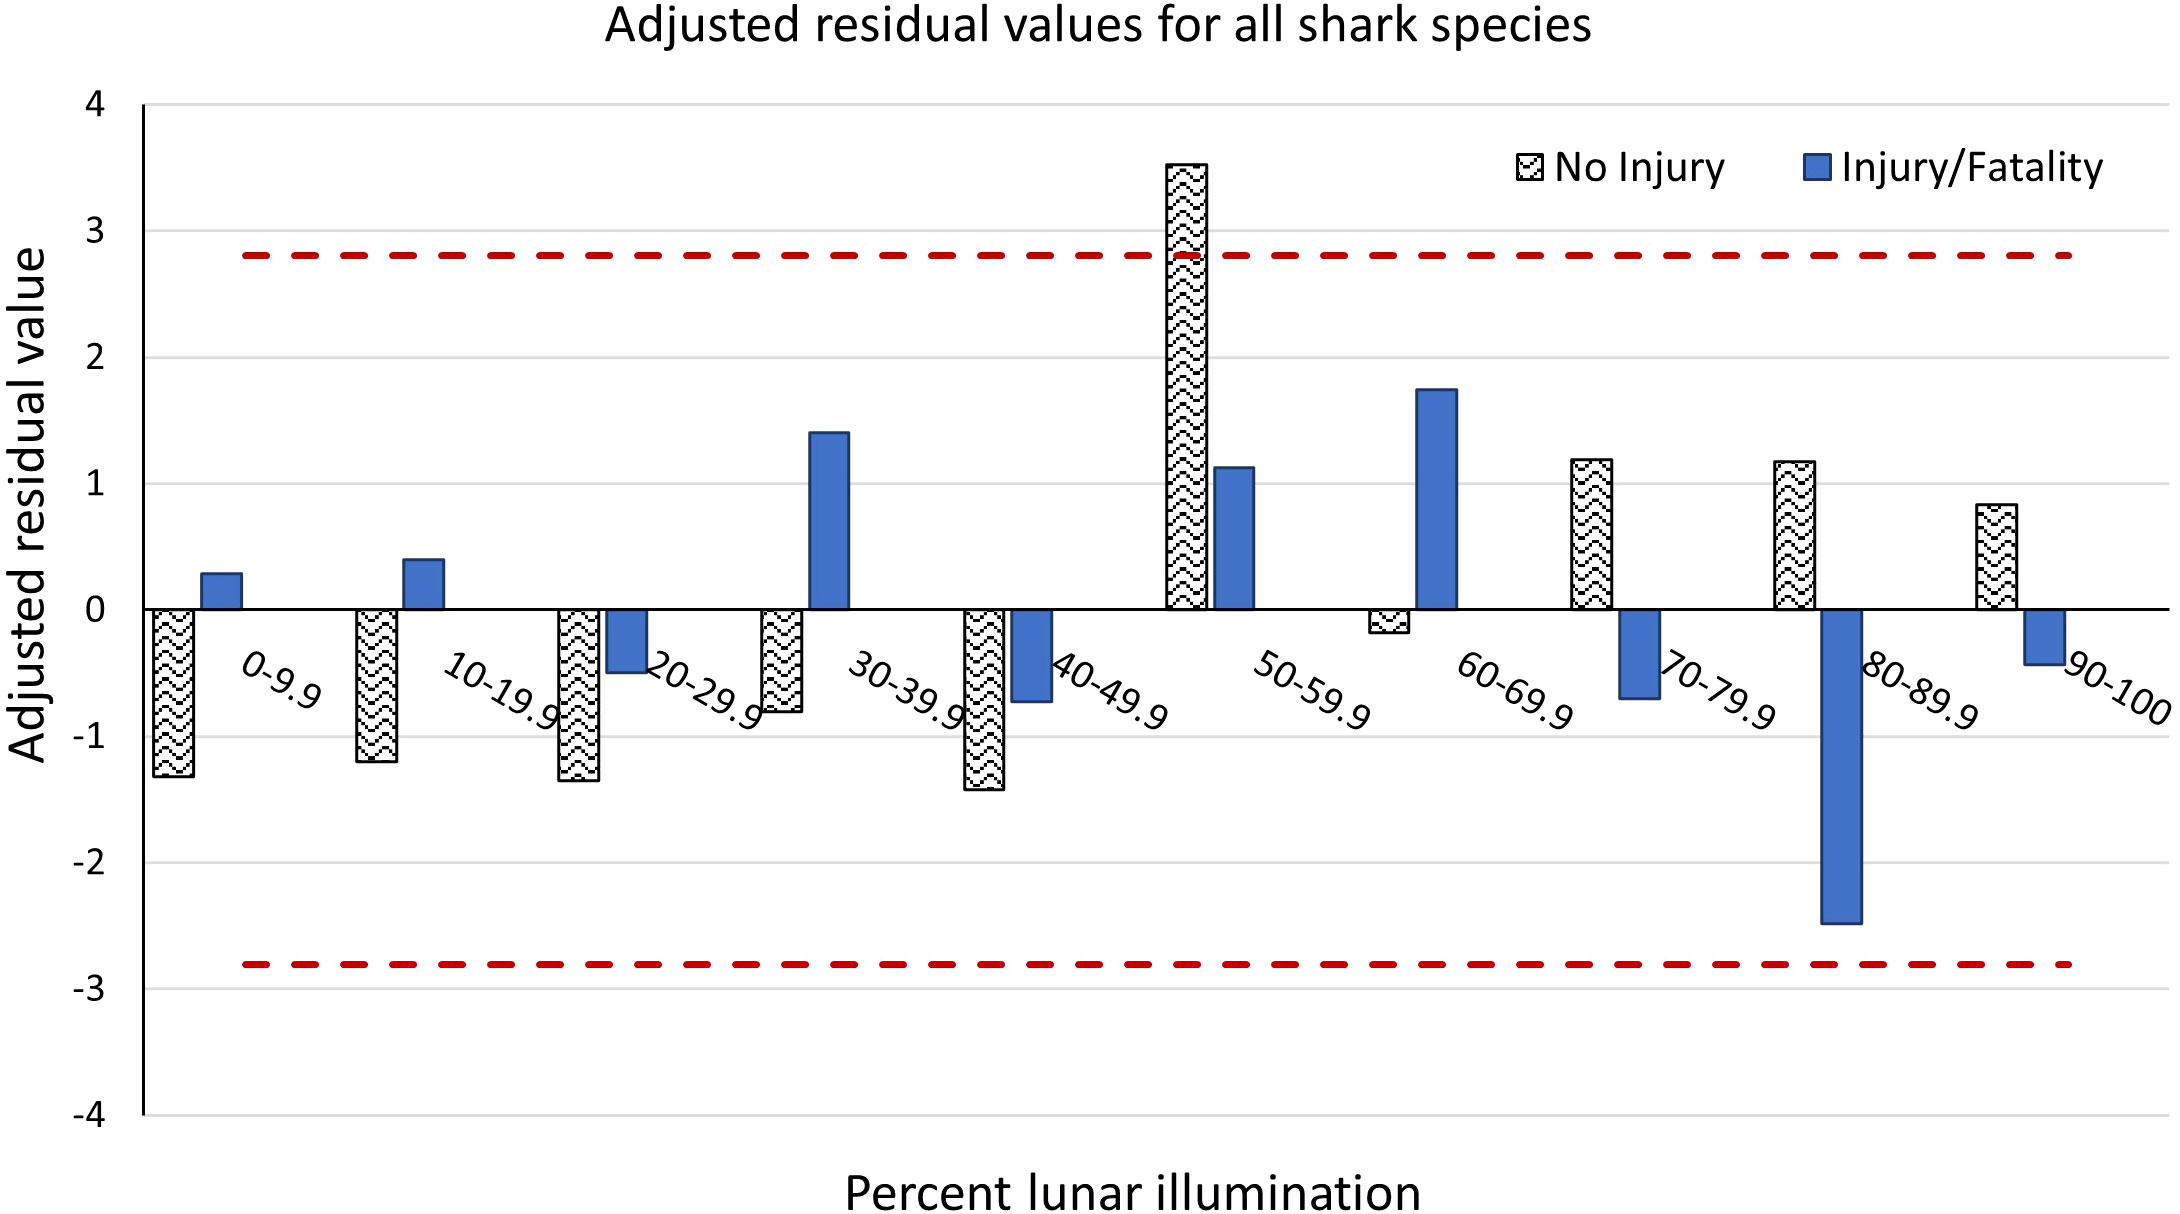
Figure 9 Adjusted residual values showing the direction and magnitude of difference between expected and documented number of shark incidents for all species by lunar illumination deciles, split by no injury and injury/fatality. The horizontal dashed red lines represent the cutoff for 95% significance. Bars that do not extend past the red horizontal dashed lines represent values that did not statistically differ from the expected count when analyzed with a Chi-squared test. Injury categories were tested separately but are presented together.
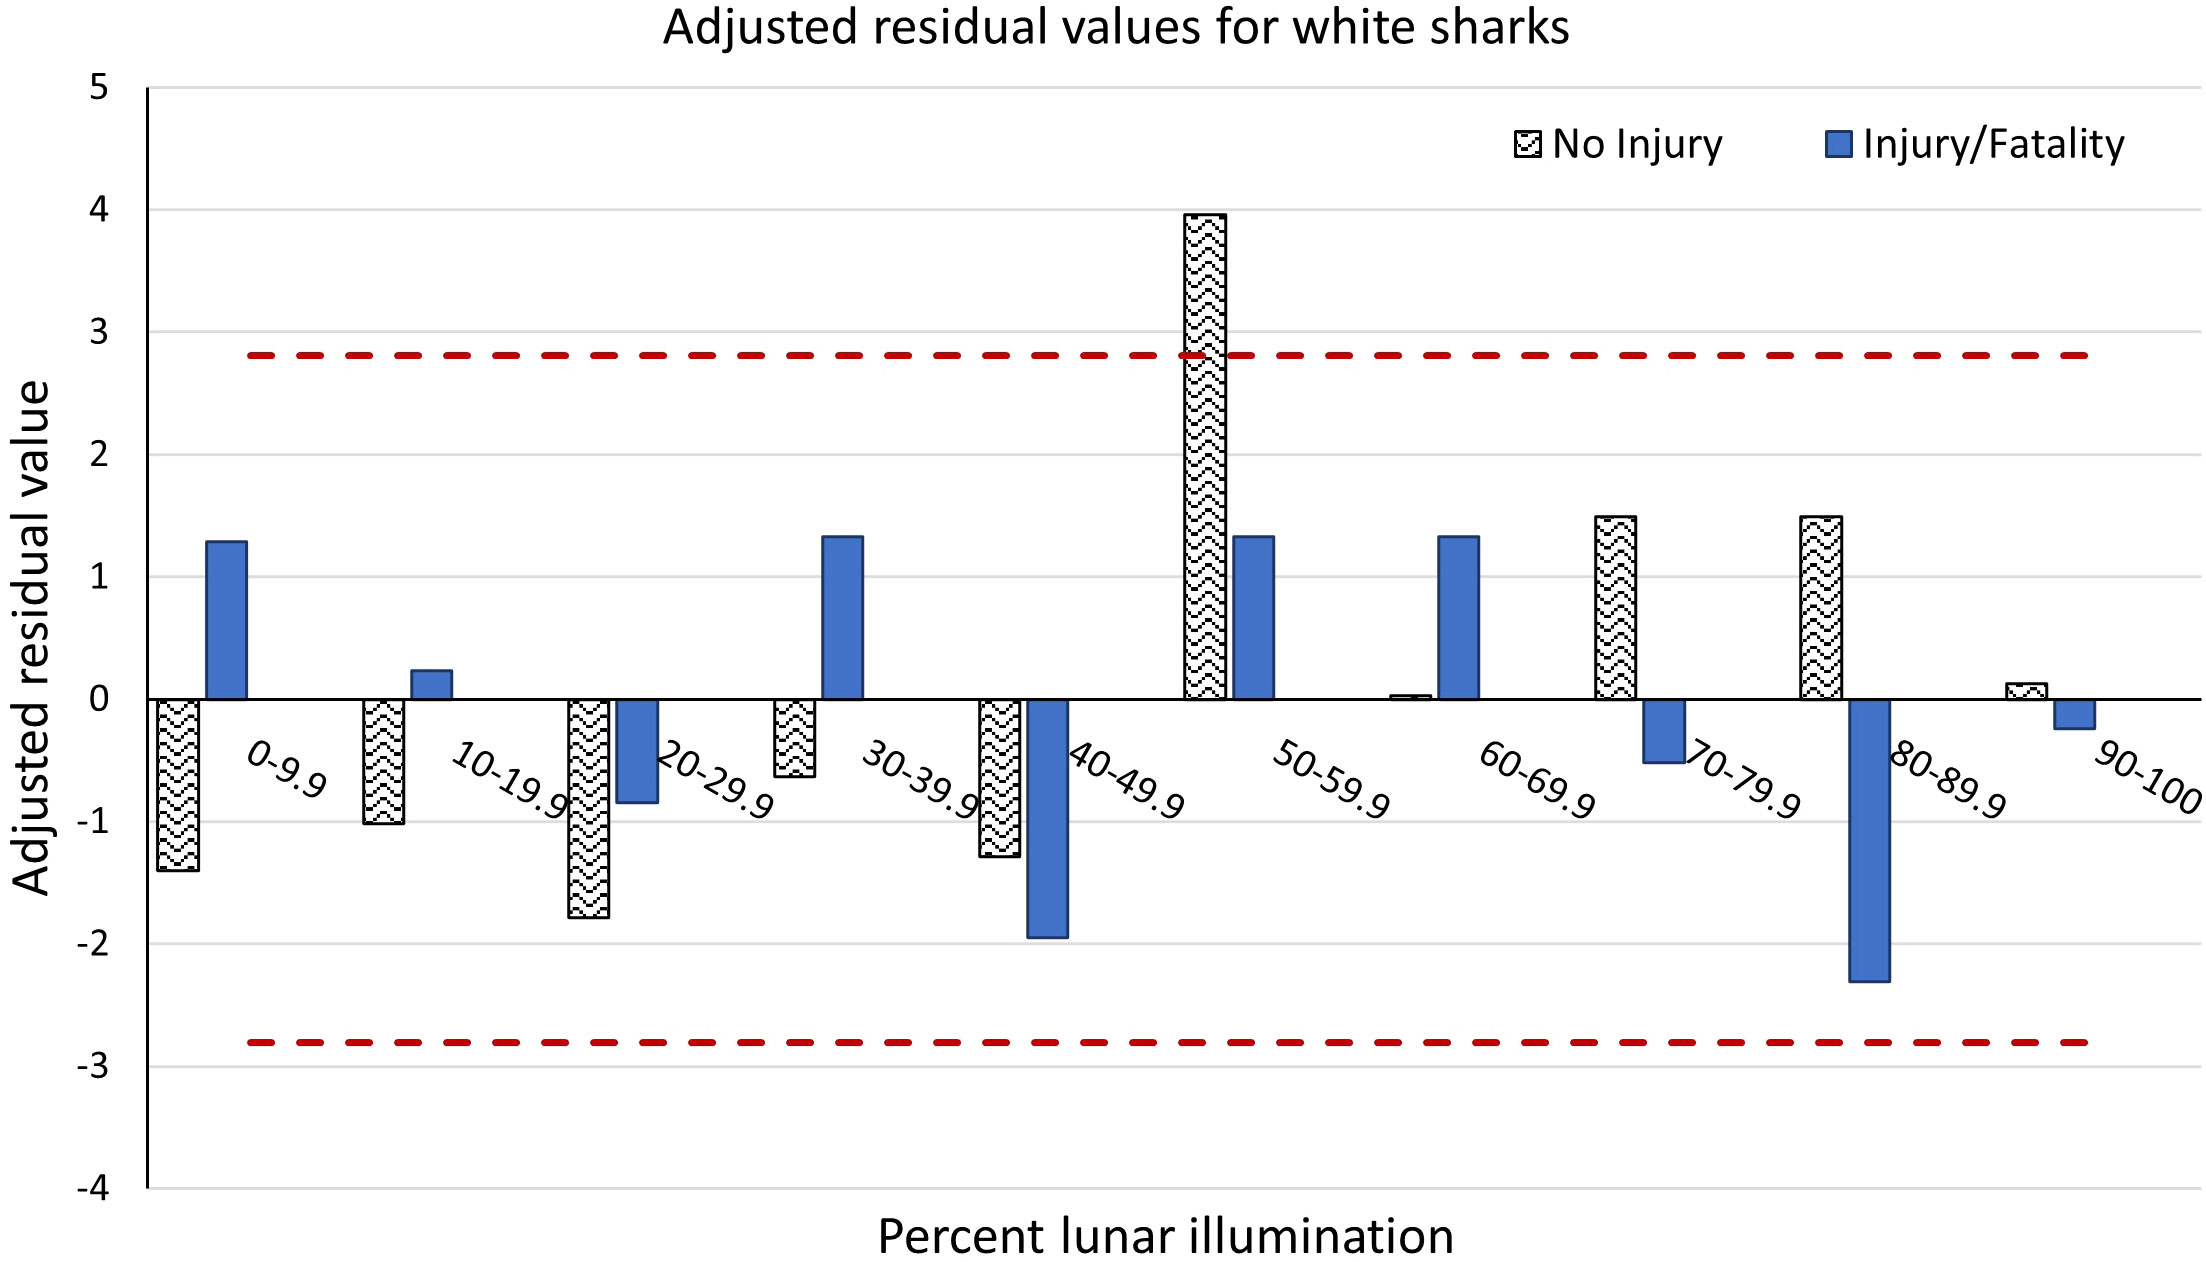
Figure 10 Adjusted residual values showing the direction and magnitude of difference between expected and documented number of White Shark incidents by lunar illumination deciles, split by no injury and injury/fatality. The horizontal dashed red lines represent the cutoff for 95% significance. Bars that do not extend past the red horizontal dashed lines represent values that did not statistically differ from the expected count when analyzed with a Chi-squared test. Injury categories were tested separately but are presented together.
The vast majority of incidents in California (178) are either verified to involve White Sharks or are assumed to have involved White Sharks based on descriptions and other information (Table 2). Three incidents involved hammerhead sharks (likely Smooth Hammerhead, as Scalloped Hammerheads are rare in southern California, with no known fishery landings or instances in federal observer data), two incidents involved Blue Sharks, and two involved Leopard Sharks (Triakis semifasciata, Table 2). Only 13 of the 201 incidents involved sharks where the species was completely unknown (Table 2 and Supplementary Material). Of nine cases submitted to the CDFW Wildlife Forensic Laboratory from 2017 to 2021, eight were confirmed to contain evidence of White Shark DNA.
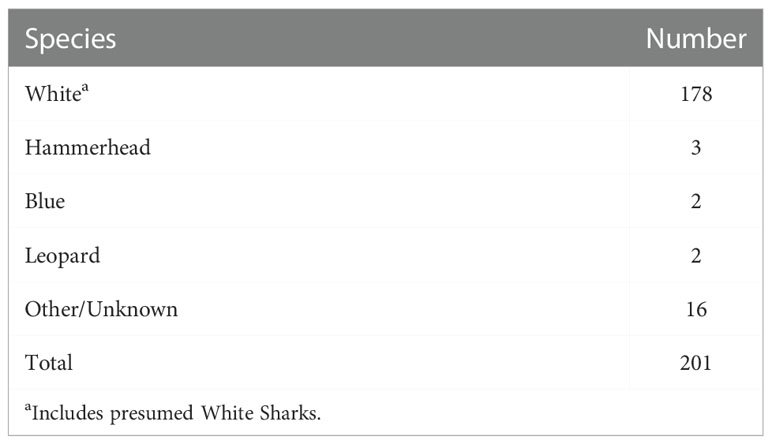
Table 2 Species composition of California shark incidents between 1950 and 2021.
The majority of shark incidents happened at the ocean surface, with 171 of the 201 incidents we documented (85%) occurring on the surface. Depth for incidents that were not at the surface, if known, was often estimated to have occurred between 1.5 and 24 m (Supplementary Material). This trend is consistent with the human activities involved, most of which occur at the surface.
The most frequent human activities involved during shark incidents were surfing and body boarding, with 80 documented incidents including these activities. This was followed by free diving and snorkeling, kayaking, scuba and hookah diving, and swimming, with 35, 29, 28, and 22 incidents respectively. The remaining seven incidents involved people on paddleboards.
Prior to 1970, the overwhelming majority of incidents (19 of 22) occurred when the individual was swimming or freediving (Figure 11). Between 1970 and 1999, surfing/body boarding and scuba/hookah diving each comprised about one third of the incidents (23 and 22 incidents respectively, Figure 11). Since 2000, slightly more than half of the incidents occurred while surfing (57 incidents), and slightly more than one fifth of the incidents occurred while kayaking (Figure 11).
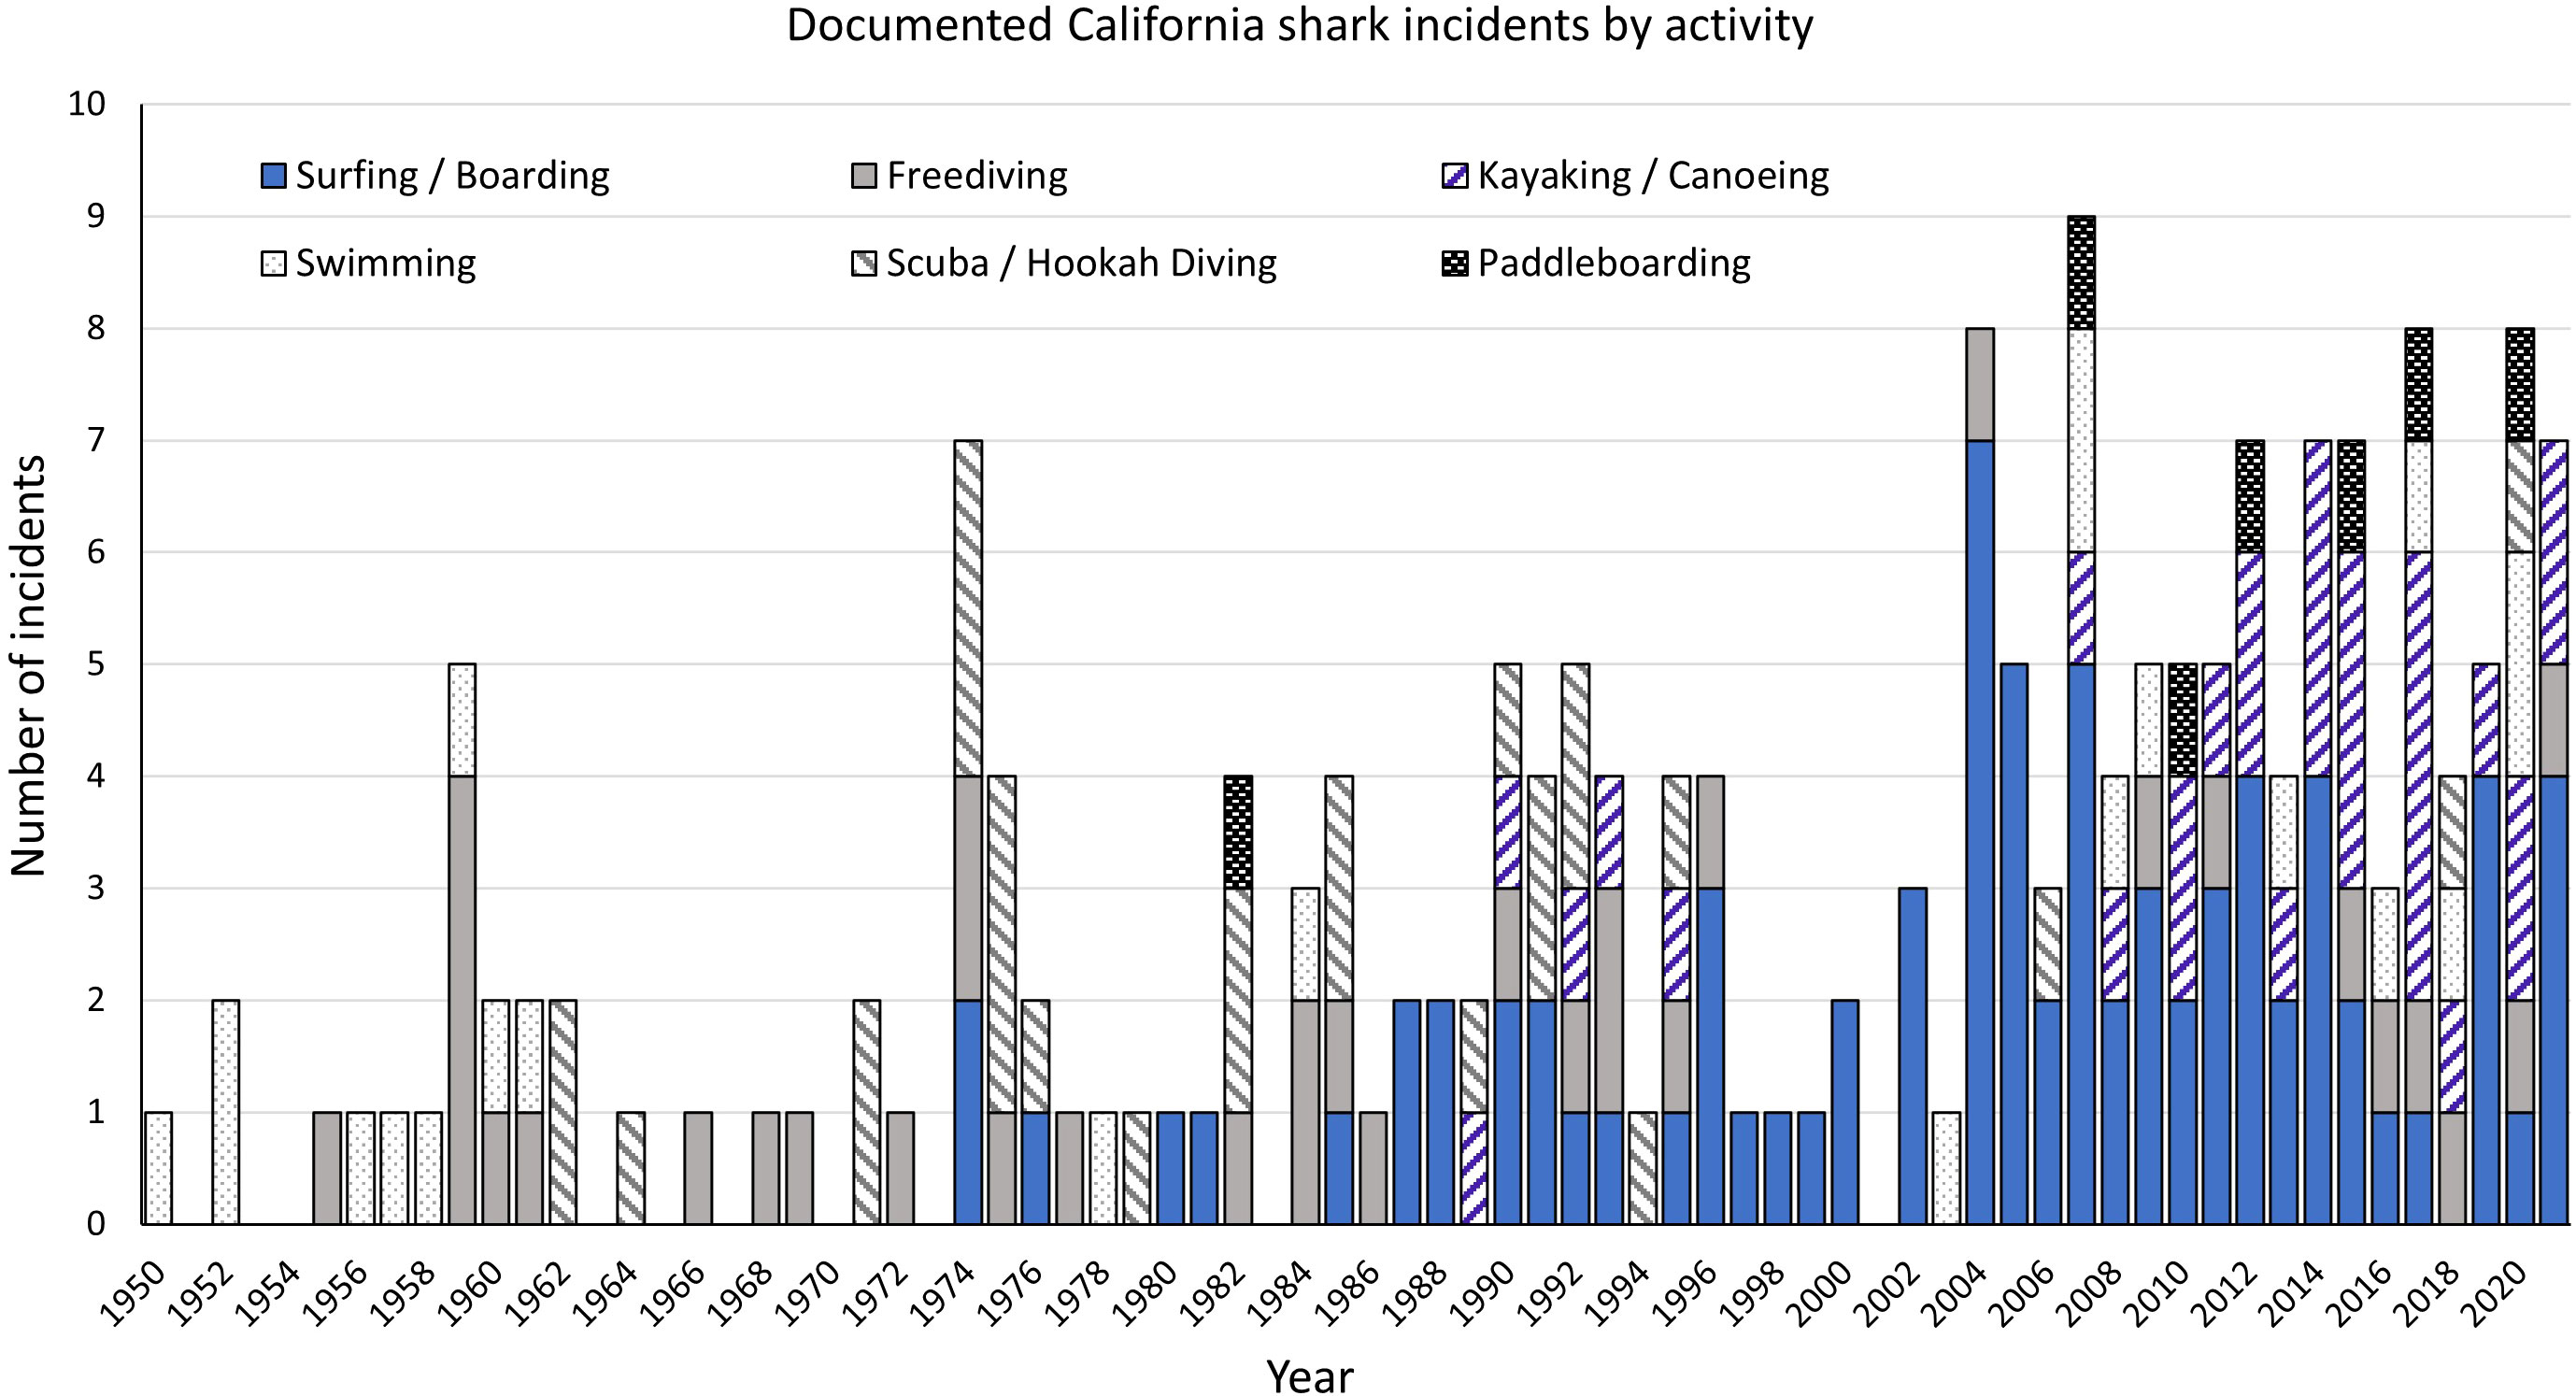
Figure 11 Documented California shark incidents by activity and year between 1950 and 2021.
While the annual number of reported shark incidents has increased since 2004, there does not appear to be an increased risk to ocean users. Importantly, our data show that the annual number of fatalities has remained extremely low since 1950 (Figure 2). Injury incidents increased over the timeframe, but that increase appears to have begun in 1974. While incidents and injuries have increased, this increase is likely offset by the increase in human ocean use over the same time period. Further research specifically accounting for human ocean use patterns is warranted.
Ferretti et al. (2015) analyzed GSAF data for California shark incidents that resulted in injuries between 1950 and 2013. They noted a similar increase in the rate of injuries from the 1950s to the 2000s. They compared these data, however, to both human population increases and estimated increases in ocean activities associated with shark incidents. They concluded that despite increasing records of White Shark incidents in California, the individual likelihood of experiencing a shark incident for ocean users has decreased by >91% between 1950 and 2013.
It is also possible that the increasing rates of non-injury incidents as well as non-fatal injury incidents could be caused by the apparent increase in the number of White Sharks off California or an increase in the amount of time juvenile White Sharks are remaining at certain California beaches (Lowe et al., 2012; Anderson et al., 2021a; Anderson et al., 2021b; Kanive et al., 2021; Tanaka et al., 2021). Lowe et al. (2012) reviewed catch records and other data and concluded that the White Shark population off California may be increasing. Tinker et al. (2016) postulated that an increase in the number of southern sea otters (Enhydra lutris nereis) bitten each year by White Sharks may reflect an increasing White Shark population. The number of juvenile White Shark sightings, in particular in Southern California, also appear to be on the rise. Kanive et al. (2021) found positive trends in abundance of juvenile White Sharks, though uncertainty in numbers prevented a strong inference. Tanaka et al. (2021) also found an increase in juvenile White Sharks from 2014 to 2019 in Monterey Bay that they attributed to changes in ocean temperature.
The increase in non-injury incidents since 2004 is also coincident with the increased use of social media, electronic photography, and the increasing availability of smart phones. The arguably largest social media platform in the 2000s, Facebook, was launched in February 2004. By the end of that year, the site had more than 1 million users (History.com, 2022). In 2005, only 5% of American adults used social media platforms, this increased to 72% by 2021 (Pew, 2022b).
Similarly, the use of various electronic photography and recording devices increased during this timeframe. For example, the GoPro 35mm HERO was introduced in September 2004, followed in 2006 by the first digital version. This device was one of many that increased in popularity throughout the mid- to late-2000s, especially for recording outdoor sports activities including surfing and other ocean watersports. These landmark events were followed by the introduction of the first iPhone in June 2007. In 2011, about 35% of American adults were using smart phones, by 2021 that had increased to 85% (Pew, 2022a).
While our analyses did not attempt to determine which incidents were first reported via social media, the increase in non-injury incident reports is highly coincidental. It is certainly possible that the increase in reported incidents is simply a factor of the ease of reporting and ease of viewing shared information online. A non-injury event where a shark bumped a surfer may have resulted in talk and stories between friends 20 years ago, but now is seen by millions online as information is shared on the internet.
French et al. (2021) concluded that shark incidents may be correlated to moon phase, based on potential behavioral changes related to tidal or electromagnetic influences, with a greater proportion occurring around the full moon, although their definition of “full moon” was quite broad and encompassed nearly half of the month. Also, their data for the U.S. West Coast documented a statistically greater number of incidents between 51 and 70% lunar illumination, as opposed to around the full moon (French et al., 2021). Our analyses show that in California there is no apparent correlation to the full moon and, in fact, the only significant difference in expected number of incidents falls around the half moon. Work in other locations, such as that by Weltz et al. (2013) has shown greater white shark sightings around the full and new moon. Additional analyses could be conducted to determine if this is true in California and what that means for the likelihood of incidents.
Additionally, the number of reported shark incidents is not generally greater than expected around dawn and dusk, but rather are significantly less than expected at most hours. News media often make recommendations on how to avoid shark incidents, commonly stating that people should avoid swimming at dusk and dawn due to supposed shark activity during these times. The International Shark Attack File recommends that swimmers avoid being in the water during darkness and twilight “when sharks are most active and have a competitive sensory advantage” (FLMN, 2022b). Curtis et al. (2012) also recommended “…simple and arguably effective guidelines for minimizing the chance of encounter…” including to “…not swim at dawn, dusk, or at night.” Baldrige (1974) concluded that, while data do not indicate a particular time of day as more hazardous, “…the feeding patterns of sharks strongly point to the wisdom of avoiding swimming at dusk or at night.” These types of recommendations may be appropriate for some shark species and in some locations, but not for others. Most California incidents, however, occur during the daytime, with peak incident occurrence around midday. Similarly, most California incidents occur in the summer and fall. Both peaks are consistent with human ocean use patterns, which are greater during the day and in the summer and fall. Data on the frequency of ocean use at different times of day, which would be required to determine whether the likelihood of incident per ocean user is greater at these times, however, are not available. While the human activities occurring during shark incidents appear to have shifted over time, this is also consistent with changes in the popularity of such activities.
Many have compared the likelihood of experiencing a shark incident with other events, including being struck by lightning, falling off ladders, or vehicle accidents, in an attempt to show the relatively small chance of experiencing one. In most cases, these comparisons are inappropriate, as people are exposed to these types of events at different frequencies. When considering the likelihood of experiencing a shark incident in California, the relative likelihood of other types of beach incidents is perhaps the most realistic comparison. The United States Lifesaving Association (USLA, 2019) collects data from lifeguards on estimated beach attendance, drownings, and other beach rescues. When compared to fatal shark incidents over the last decade, the likelihood of drowning at California beaches is more than 125 times greater than being killed by a shark, with an average of 38 drowning deaths per year in California. There are more than 50,000 California beach rescues per year on average, which is greater than 8,000 times the average number of shark incidents per year in the same time period (Table 3).
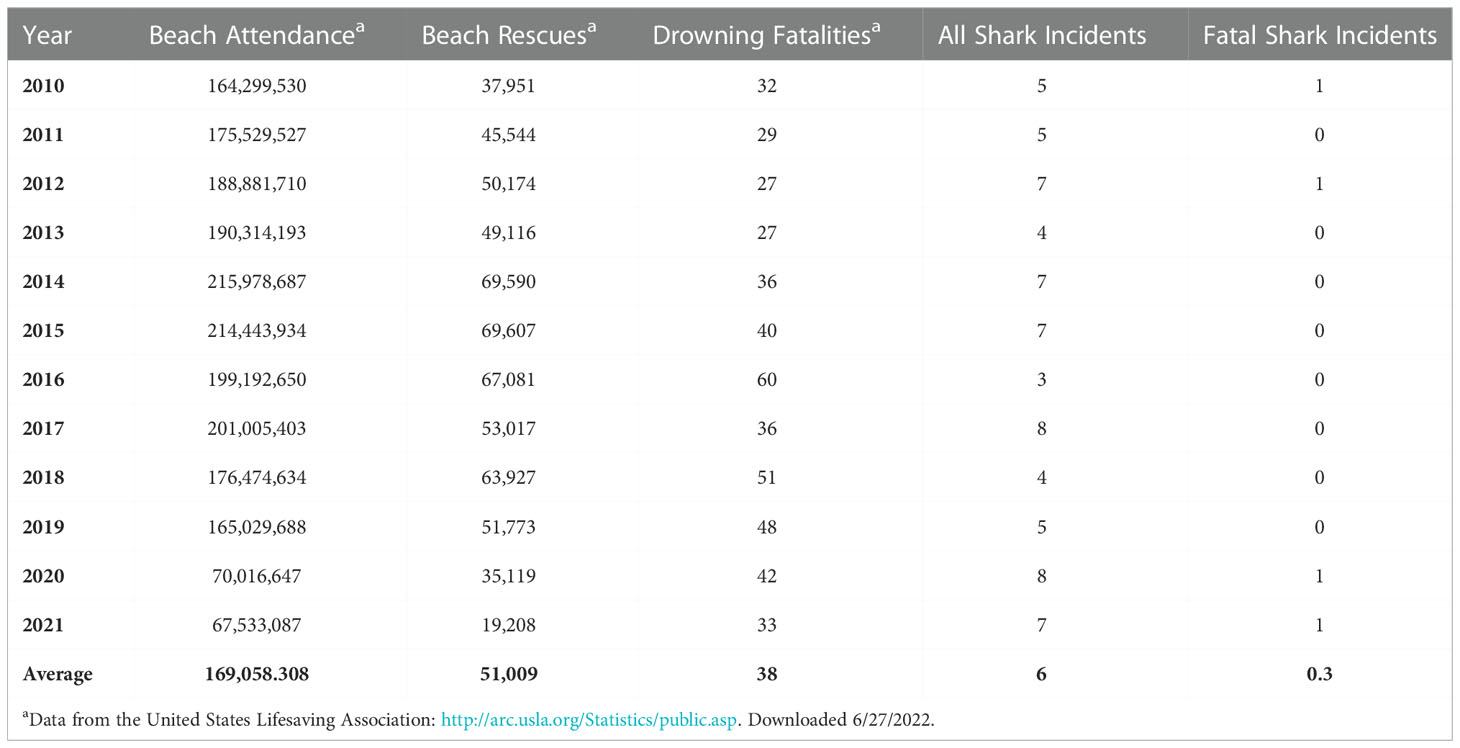
Table 3 California beach attendance and number of beach rescues, shark incidents, drowning fatalities, and shark incident fatalities per year, 2010 to 2021.
Shark incidents in California remain quite rare. Throughout the entire 72-year extent of the data examined here, there have been only 15 fatalities caused by sharks and 107 incidents resulting in other injuries. Shark incidents have occurred statewide and in all months. As with any wilderness activity, entering the ocean includes risks that must be weighed on an individual basis and given a variety of considerations.
The original contributions presented in the study are included in the article/Supplementary Material. Further inquiries can be directed to the corresponding author.
JU is the lead author and EH and JC contributed equally to the analyses of data and its statistical review. All authors contributed to the article and approved the submitted version.
All funding for this study was provided by the California Department of Fish and Wildlife through the annual budget of the State of California.
We thank B. Brady, T. Buck, M. Horeczko, C. Shuman, and A. Spicer, California Department of Fish and Wildlife, and Dr. C. Lowe, California State University Long Beach, for their thoughtful and thorough reviews of the draft manuscript.
The authors declare that the research was conducted in the absence of any commercial or financial relationships that could be construed as a potential conflict of interest.
All claims expressed in this article are solely those of the authors and do not necessarily represent those of their affiliated organizations, or those of the publisher, the editors and the reviewers. Any product that may be evaluated in this article, or claim that may be made by its manufacturer, is not guaranteed or endorsed by the publisher.
The Supplementary Material for this article can be found online at: https://www.frontiersin.org/articles/10.3389/fmars.2022.1020187/full#supplementary-material
Anderson J. M., Burns E. S., Meese E. N., Farrugia T. J., Stirling B. S., White C. F., et al. (2021a). Interannual nearshore habitat use of young of the year white sharks off southern California. Front. Mar. Sci. 8. doi: 10.3389/fmars.2021.645142
Anderson J. M., Clevenstine A. J., Stirling B. S., Burns E. S., Meese E. N., White C. F., et al. (2021b). Non-random Co-occurrence of juvenile white sharks (Carcharodon carcharias) at seasonal aggregation sites in southern California. Front. Mar. Sci. 8. doi: 10.3389/fmars.2021.688505
Baldrige H. D. (1974). “Shark attack,” in Berkeley Medallion books (New York, USA: Berkeley Publishing Corporation, New York).
Collier R. (1993). “Shark attacks off the California islands: review and update,” in Third California islands symposium. Ed. Hochberg F. G. (Santa Barbara, California, USA: Santa Barbara Museum of Natural History), 453–462.
Collier R. S., Marks M. A., Warner R. W. (1996). “White shark attacks on inanimate objects along the pacific coast of north America,” in Great white shark: The biology of carcharodon carcharias. Eds. Klimley A., Ainley D. G. (California, USA: Academic Press, San Diego), 217–222.
Curtis T. H., Bruce B. D., Cliff G., Dudley S. F. J., Klimley A. P., Kock A., et al. (2012). “Responding to the risk of white shark attack updated statistics, prevention, control methods, and recommendations,” in Global perspectives on the biology and life history of the white shark. Ed. Domeier M. L. (Florida, USA: CRC Press, Boca Raton), 477–509.
Dwight R. H., Brinks M. B., SharavanaKumar G., Semenza J. C. (2007). Beach attendance and bathing rates for southern California beaches. Ocean Coast. Manage. 50, 847–858. doi: 10.1016/j.ocecoaman.2007.04.002
Ferretti F., Jorgensen S., Chapple T. K., De Leo G., Micheli F. (2015). Reconciling predator conservation with public safety. Front. Ecol. Environ. 2015, e150109. doi: 10.1890/150109
Florida Museum of Natural History (FLMNH) (2022a) International shark attack file: Yearly worldwide shark attack summary. Available at: https://www.floridamuseum.ufl.edu/shark-attacks/yearly-worldwide-summary/ (Accessed 19 July 2022).
Florida Museum of Natural History (FLMNH) (2022b) International shark attack file: Advice to swimmers. Available at: https://www.floridamuseum.ufl.edu/shark-attacks/reduce-risk/swimmers/ (Accessed 8 August 2022).
French L. A., Midway S. R., Evans D. H., Burgess G. H. (2021). Shark side of the moon: Are shark attacks related to lunar phase? Front. Mar. Sci. 8. doi: 10.3389/fmars.2021.745221
History.com (2022) This day in history. Available at: https://www.history.com/this-day-in-history/facebook-launches-mark-zuckerberg#:~:text=On%20February%204%2C%202004%2C%20a,that%20was%20only%20the%20beginning (Accessed 27 June 2022).
Kanive P. E., Rotella J. J., Chapple T. K., Anderson S. D., White T. D., Block B. A., et al. (2021). Estimates of regional annual abundance and population growth rates of white sharks off central California. Biol. Conserv. 257, 1–9. doi: 10.1016/j.biocon.2021.109104
Lea R. N., Miller D. J. (1985). Shark attacks off the California and Oregon coasts: an update 1980–84. Memoirs South. California Acad. Sci. 9, 136–150. Available at: http://hdl.handle.net/1834/18408
Lowe C. G., Blasius M. E., Jarvis E. T., Mason T. J., Goodmanlowe G. D., O’Sullivan J. B. (2012). “Historic fishery interactions with white sharks in the southern California bight,” in Global perspectives on the biology and life history of the white shark. Ed. Domeier M. L. (New York, USA: CRC Press, Taylor and Francis Group, New York), 165–189.
McCosker J. E., Lea R. N. (1996). “White shark attacks in the eastern pacific ocean: an update and analysis,” in Great white sharks: The biology of carcharodon carcharias. Eds. Klimley A. P., Ainley D. G. (California, USA: Academic Press, San Diego), 419–434.
McCosker J. E., Lea R. N. (2006). White shark attacks upon humans in California and Oregon 1993–2003. Proc. California Acad. Sci. 57 (17), 479–501. Available at: https://www.calacademy.org/sites/default/files/assets/docs/pdf/mccoskerlea_5717_479-501_lr.pdf
Miller D. J., Collier R. S. (1981). Shark attacks in California and oregon 1926–1979. California Fish Game 67, 76–104. Available at: https://www.biodiversitylibrary.org/page/22279822
Neff C., Hueter R. (2013). Science, policy, and the public discourse of shark “attack”: a proposal for reclassifying human–shark interactions. J. Environ. Stud. Sci. 3, 65–73. doi: 10.1007/s13412-013-0107-2
Pew Research Center (Pew) (2022a) Mobile fact sheet. Available at: https://www.pewresearch.org/internet/fact-sheet/mobile/ (Accessed 27 June 2022).
Pew Research Center (Pew) (2022b) Social media fact sheet. Available at: https://www.pewresearch.org/internet/fact-sheet/social-media/ (Accessed 27 June 2022).
Ritter E., Quester A. (2016). Do white shark bites on surfers reflect their attack strategies on pinnipeds? J. Mar. Biol. 2016, 9539010. doi: 10.1155/2016/9539010
Ryan L. A., Slip D. J., Chapuis L., Collin S. P., Gennari E., Hemmi J. M., et al. (2021). A shark’s eye view: testing the ‘mistaken identity theory’ behind shark bites on humans. J. R. Soc. Interface 18, 20210533. doi: 10.1098/rsif.2021.0533
Shark Research Institute (SRI) (2022) Global shark attack file, incident log. Available at: https://www.sharkattackfile.net/incidentlog.htm (Accessed 20 February 2022).
Sharpe D. (2015). Chi-square test is statistically significant: Now what? Pract. Assessment Res. Eval. 20, 8. doi: 10.7275/tbfa-x148
Tanaka K. R., Van Houtan K. S., Mailander E., Dias B. S., Galginaitis C., O’Sullivan J., et al. (2021). North pacific warming shifts the juvenile range of a marine apex predator. Sci. Rep. 11, 3373. doi: 10.1038/s41598-021-82424-9
Tinker M. T., Hatfield B. B., Harris M. D., Ames J. A. (2016). Dramatic increase in sea otter mortality from white sharks in California. Mar. Mammal Sci. 32 (1), 309–326. doi: 10.1111/mms.12261
Tricas T. C., McCosker J. E. (1984). Predatory behavior of the white shark (Carcharodon carcharias), with notes on its biology. Proc. California Acad. Sci. 43, 221–238. Available at: https://www.biodiversitylibrary.org/page/15775541
United States Lifesaving Association (USLA) (2019) 2018 annual report. Available at: https://www.usla.org/page/ANNUALREPORTS (Accessed 27 June 2022).
United States Navy (USN) (2022) United states naval observatory’s astronomical applications department’s data service: Fraction of the moon illuminated. Available at: https://aa.usno.navy.mil/data/MoonFraction.
University of California, Riverside (UCR) (2022) Center for bibliographical studies and research, California digital newspaper collection. Available at: https://cdnc.ucr.edu/.
Keywords: Carcharodon carcharias, shark attack, shark incident, shark bite, White Shark
Citation: Ugoretz J, Hellmers EA and Coates JH (2022) Shark incidents in California 1950-2021; frequency and trends. Front. Mar. Sci. 9:1020187. doi: 10.3389/fmars.2022.1020187
Received: 15 August 2022; Accepted: 05 December 2022;
Published: 15 December 2022.
Edited by:
Charlie Huveneers, Flinders University, AustraliaReviewed by:
Yannis Peter Papastamatiou, Florida International University, United StatesCopyright © 2022 Ugoretz, Hellmers and Coates. This is an open-access article distributed under the terms of the Creative Commons Attribution License (CC BY). The use, distribution or reproduction in other forums is permitted, provided the original author(s) and the copyright owner(s) are credited and that the original publication in this journal is cited, in accordance with accepted academic practice. No use, distribution or reproduction is permitted which does not comply with these terms.
*Correspondence: John Ugoretz, Sm9obi51Z29yZXR6QHdpbGRsaWZlLmNhLmdvdg==
Disclaimer: All claims expressed in this article are solely those of the authors and do not necessarily represent those of their affiliated organizations, or those of the publisher, the editors and the reviewers. Any product that may be evaluated in this article or claim that may be made by its manufacturer is not guaranteed or endorsed by the publisher.
Research integrity at Frontiers
Learn more about the work of our research integrity team to safeguard the quality of each article we publish.