
94% of researchers rate our articles as excellent or good
Learn more about the work of our research integrity team to safeguard the quality of each article we publish.
Find out more
ORIGINAL RESEARCH article
Front. Mar. Sci., 17 October 2022
Sec. Marine Evolutionary Biology, Biogeography and Species Diversity
Volume 9 - 2022 | https://doi.org/10.3389/fmars.2022.1018864
 Cheng-He Sun1†
 Rodolphe Elie Gozlan2†
 Ting Wu1
 Dan Xue1
 Ye-Ling Lao1
 Jian-Feng Yu1
 Xiao-Shu Zeng1
 Sha Li3
 Emilie A. Hardouin4
 Demetra Andreou4
 Qun Zhang1*
Despite the apparent absence of physical barriers in the ocean to prevent dispersal, recent studies have highlighted the importance of biological, geographical, physical, and historical barriers in the genetic structuring of marine species populations. This representation is essential for the sustainable exploitation of natural marine resources and for the setup of efficient protected area networks for the conservation of marine species. In this study, we used extensive sampling of Sebastiscus marmoratus, a commercially important inshore rockfish with high site fidelity, to characterize their population genetic structure along the China–Japan coast and to determine the effect of past geological and current biological–physical barriers on the current genetic footprint. A 461-bp fragment of the mtDNA hypervariable portion control region was sequenced for 675 individuals from 15 geographical locations. A total of 292 haplotypes were identified. The population of S. marmoratus showed high haplotype and nucleotide diversity. Pairwise fixation index (FST) and analysis of molecular variance (AMOVA) revealed significant genetic differentiation among populations. The Bayesian skyline plots and neutrality statistics showed a sudden expansion of the S. marmoratus population around the Pleistocene. The Beibu Gulf group had the lowest mean number of pairwise differences, the lowest significant genetic differentiation, and the lowest haplotype and nucleotide diversity, and should be prioritized for protection in the future. Ocean currents, seascape discontinuity, geographical distance, and ecological characteristics may play an important role in shaping the contemporary phylogeographical patterns and population structures of S. marmoratus.
A central question in designing conservation plans for exploited marine species is whether the species is composed of one large metapopulation or multiple isolated subpopulations. Initial expectations, based on the apparent absence of physical barriers to dispersal in the sea, tended to support the concept of genetic homogenization across much of the range of marine species (Palumbi, 1994). This concept was later followed by that of marine species functioning as a metapopulation (Kritzer and Sale, 2006), which implicitly supports the existence of natural extinctions and re-colonization processes between species populations (Hanski, 1998). Ideally, this characterization would underpin a management plan for fishing quotas based on individual population sizes or be central to the design of marine protected area networks.
This expectation of spatially linked marine populations through regular larval immigration–emigration transfer, however, has been recently challenged, even for species with extensive pelagic larval phases (Lowe and Allendorf, 2010). Several recent studies have shown that significant genetic barriers between populations of marine species may result from behavioral or oceanographic constraints (Gilg and Hilbish, 2003; Gerlach et al., 2007). For example, benthic species with a small home range and that show strong site fidelity is generally more affected in their spatial larval dispersal by ocean current barriers than the larger pelagic species (Fujita and Kohda, 1998; Hess et al., 2011). These constraints could, in part, explain the different levels of genetic structure within the same seascape, as observed in benthic species such as the spottedtail goby Synechogobius ommaturus (Song et al., 2010), yellowtail rockfish Sebastes flavidus (Hess et al., 2011), or copper rockfish Sebastes caurinus (Johansson et al., 2008). However, variability in the life history traits of benthic species, and in particular the duration of their pelagic larval phase, still exists and has often been used as a proxy to predict the level of gene flow between marine fish populations (Roberts, 1997; Taylor and Hellberg, 2003) despite the lack of precision in gene flow estimates in natural marine fish populations (Bohonak, 1999). In addition to these current biological, geographical, and climatic constraints, other studies have also identified the role of ancestral habitat discontinuity in determining today’s genetic structure of modern marine species (Hewitt, 2000). This is particularly true for species in the northwestern Pacific along the Chinese coast, as several studies have identified the importance of sea-level fluctuations during the Plio–Pleistocene era in this region as a driver of the current distribution, abundance, and genetic structure of local marine species (Dynesius and Jansson, 2000; Hewitt, 2000; Liu et al., 2006; Song et al., 2010). The retreat of the sea during these geological periods caused the recurrent semi-closure of the South China Sea and the partial or total exposure of the East China and Yellow Seas (Hewitt, 1996; Wang, 1999), driving local marine species to extinction or to survive in regional glacial refuges.
The marbled rockfish Sebastiscus marmoratus (Cuvier, 1829) is a species of relatively small (maximum length, 30 cm) benthic ovoviviparous fishes belonging to the family Scorpaenidae and subfamily Sebastidae, of high commercial and economic value, distributed in the coastal waters of East Asia, including the Japanese islands south of Hokudai, the Korean Peninsula, and China. In this study, we looked at the effect of past and present conditions on the spatial genetic structure of S. marmoratus along the Chinese coast. Due to the narrow home range and high site fidelity and internal fertilization of this species, most of the dispersal potential occurs during the larval phase (Fujita and Kohda, 1998; Yatomi et al., 2005). This phase is likely to be strongly constrained by the local oceanic currents operating along this coast, which are very complex, as observed with the collision in the Taiwan Strait and Qiongzhou Strait of the South China current flowing north, the China coastal current flowing south, and the input from the Kuroshio Current bringing warm water from the southwestern Pacific (Shen et al., 2011).
Based on the strong spatial segregation of the marine species in this region during the Quaternary glacial cycles, as well as the presence of structuring ocean currents and the relatively limited dispersal potential of S. marmoratus adults, we hypothesized that exploited stocks should reveal a clear genetic structure of the population at least north and south of Taiwan, east and west of the Leizhou Peninsula. This information is crucial to our understanding of the sustainable exploitation of marbled rockfish along this coast, but beyond that, for a range of exploited benthic fish stocks as the patterns observed for S. marmoratus are likely to be typical.
A total of 675 specimens were collected from 15 geographical locations (hereafter referred to as populations) in most of China’s coastal waters in its southern range (Figure 1 and Table 1). The geographical barriers among the 15 geographical locations mainly include three straits (Korea Strait, Taiwan Strait, and Qiongzhou Strait) and five marginal seas (Sea of Japan, Yellow Sea, East China Sea, South China Sea, and Beibu Gulf). All specimens were caught locally (within 100 km) by professional fishermen and preserved in 95% ethanol at room temperature. Genomic DNA was isolated from the dorsal muscle tissue using the modified high salt method (Chowdhury et al., 2016) and dissolved in 100 μl of Tris–EDTA (TE) buffer.
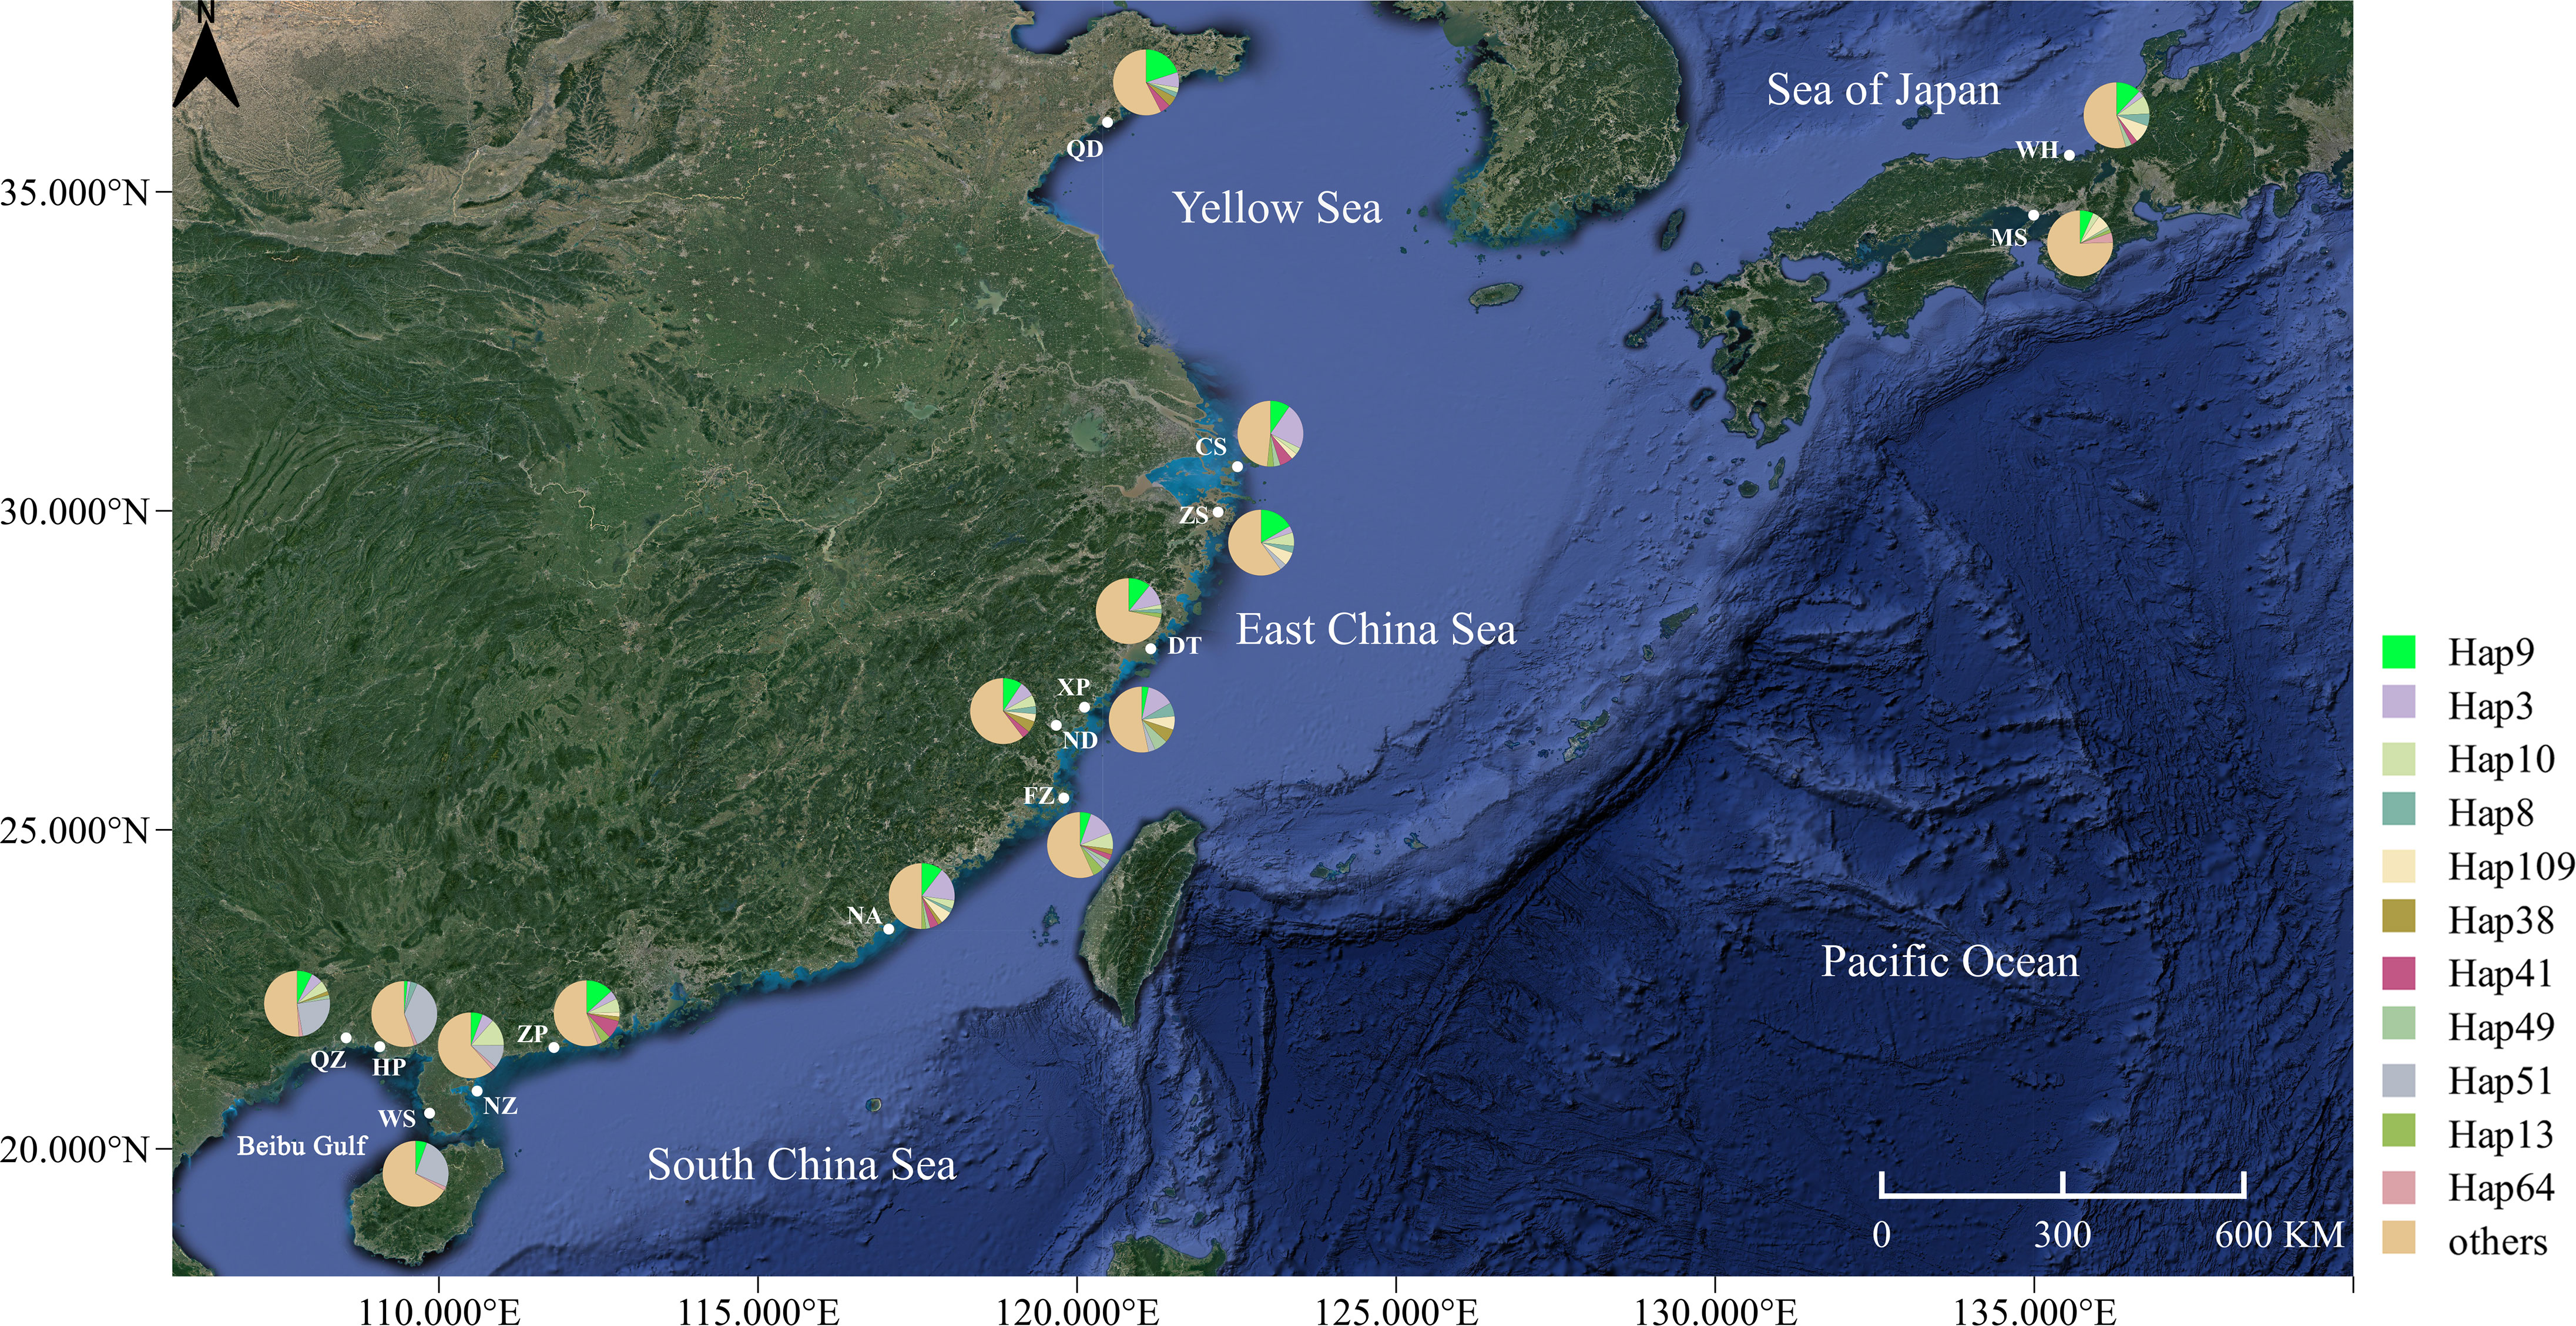
Figure 1 Map of the coastal waters of the China Sea, showing the sampling locations and phylogroup distributions of Sebastiscus marmoratus. The geographical location of the sampling sites in the study area is shown in Table 1.
An approximate 650-bp-long section of the mitochondrial DNA (mtDNA) control region was amplified using the primers SebMarCrF (5′-GAG GTT AAA ATC CTC CCT ACT GC-3′) and SebMarCrR (5′-TCC ATA GGA TGA TTC CCA CCT-3′), which were designed for this species by aligning the mtDNA control region sequences of available rockfish phylogenetically related to S. marmoratus (KF667491 and MT584656) using Primer 5.0. For each individual, polymerase chain reaction was performed in 30 μl reactions containing 5–10 ng of template DNA, 0.3 μM of each primer, 3.0 μl of 10× Ex Taq Buffer, 3.0 μl of 100 mM dNTP, 1.5 μl of 50-mM MgCl2, and 1 U of Taq polymerase (Takara Co., Shiga, Japan). The thermal cycles were set to an initial denaturation at 94°CC (5 min) and a final extension at 72°CC (10 min), with an intervening 35–40 cycles with denaturation at 94°CC (45 s), annealing at 55°CC (45 s), and extension at 72°CC (1 min). The amplification products were checked with agarose gel electrophoresis, and the resulting amplicons were excised and purified. DNA sequences were determined with fluorescent-labeled dideoxy terminators using forward primers on an ABI 3730xl genetic analyzer (Applied Biosystems, Waltham, MA, USA) at Beijing Genomics Institute.
All sequences in the control region were edited, screened, and aligned using DNAStar software (DNAStar Inc., Madison, WI, USA) with default parameters, and the quality of the alignments was manually checked. Standard genetic diversity indices, including the number of haplotypes, number of polymorphic sites, average number of pairwise differences, haplotype diversity, and nucleotide diversity were estimated for each population with Arlequin v3.1 (Excoffier et al., 1992). To visualize the relationships between the mtDNA control region haplotypes, intraspecific haplotype networks were constructed using HapView.
Pairwise genetic divergences were assessed with the fixation index, FST (Excoffier et al., 1992), in Arlequin based on the Kimura 2P substitution model (Kimura, 1980). The significance of the FST was calculated by 10,000 permutations for each pairwise comparison. The p-values were adjusted using the sequential Bonferroni procedure (Rice, 1989). We used hierarchical analysis of molecular variance (AMOVA) of the different gene pools to further examine the characterization of subdivisions (Excoffier et al., 1992) and population structure. The AMOVA based on four different gene pool classifications included a complete gene pool, two gene pools (the Chinese and Japanese coasts), three gene pools (the Northern group, South China Sea, and the Beibu Gulf), and five gene pools (the Sea of Japan, Inland Waters Japan, Yellow Sea, East China Sea, and South China Sea). The probabilities were estimated in Arlequin with a permutation analysis and 10,000 random permutations. In parallel, SAMOVA v2.0 (spatial analysis of molecular variation) was used to detect the geographical genetic structure of haplotypes. A genetic distance matrix (Sunde et al., 2022) was created based on the pairwise genetic divergence between populations, and the geographical distance and resistance were estimated to test the effect of isolation by resistance and distance (IBR and IBD, respectively) in R (R Core Team, 2012) with the geosphere package (Hijmans et al., 2019) and the vegan package (Oksanen et al., 2013). For the geographical distance, the straight line distance between populations was calculated by longitude and latitude. Resistance was calculated on partial and full seascape dispersal barriers (Sunde et al., 2022), with each population starting with a resistance score of 0, and penalties for seascape dispersal barriers were then added: 0.5 for partial barrier (marginal sea) or 1 for full barrier (strait or land). Geographical barriers were calculated with the Barrier v2.2 software based on the FST pairwise comparison matrix and the geographical distance.
To investigate the intraspecific phylogenetic relationship between mitochondrial haplotypes, the Bayesian inference (BI) and maximum likelihood (ML) methods were used for phylogenetic analysis. The best-fit substitution model was selected using ModelFinder (Kalyaanamoorthy et al., 2017) with the Akaike information criterion (Yamaoka et al., 1978). The ML phylogenies were inferred with IQ-TREE v.1.6.8 (Nguyen et al., 2015) with the TPM2+F+I+G4 model for 5,000 ultrafast bootstraps (Minh et al., 2013). Phylogenies by BI were inferred using MrBayes v3.2.6 (Ronquist et al., 2012) with the GTR+F+I+G4 model (two parallel runs, 8 × 10⁷ generations), in which the initial 25% of sampled data were discarded as burn-in. The evolutionary phylogenetic trees were visualized and edited with FigTree v1.4.0 (Rambaut, 2015). To better understand gene flow (Nm), Bayesian analyses were performed to estimate the historical migration patterns with Migrate-N v3.6.11 (Beerli and Palczewski, 2010). The runs were recorded every 100 steps for a total of 10,000 long-chain Markov chain Monte Carlo (MCMC) steps and a burn-in of 10,000 steps. To improve the efficiency of the MCMC search, a static heating scheme with four different temperatures (1, 1.5, 3.0, and 1,000,000) was used. The relation Nm = θM (Beerli, 2006; Beerli and Palczewski, 2010) was utilized to calculate the effective number of migrants.
The historical demographic expansions were examined using three different approaches, namely, mismatch analysis, neutrality statistics, and Bayesian skyline plots (BSPs). Populations that have a multimodal distribution of mismatches are expected to be in genetic equilibrium, while recent population expansions are expected to have a unimodal distribution of mismatches (Rogers and Harpending, 1992; Harpending, 1994). A neutrality test including Fu’s FS (Fu, 1997) and Tajima’s D (Tajima, 1989) was calculated for each population. The actual time since population expansion was estimated using the equation τ = 2μt (Song et al., 2014; Zhao et al., 2022), where τ is the peak of mismatch distribution, μ is the mutation rate for the entire DNA sequence studied, and t is the time estimated in years since expansion. The population expansion time was estimated using a 5%–10%/Myr (million years) divergence rate for the fish control region (Brunner et al., 2001; Song et al., 2010). Both the neutrality tests and mismatch analysis were calculated with Arlequin. The BSPs were estimated using BEAST v.2.6.6 (Drummond et al., 2012). To achieve effective convergence, a strict molecular clock and a stepwise skyline model with over 5 × 10⁸ generations for the MCMC were utilized to ensure a highly effective sample size (ESS, >200) in this study. The skyline plots (Rambaut et al., 2018) were then analyzed and constructed using Tracer v1.7.2.
A 461-bp segment was obtained, 124 polymorphic sites were detected, and 292 haplotypes were defined for 675 specimens (Table 1). The majority of haplotypes (218) were singletons (haplotypes with a single sequence in the sample). Of the remaining 74 haplotypes, 10 belonged to only one population, 11 were shared between more than five populations (with 275 individuals, representing 40.7% of all samples), and 53 were shared between two and four populations. The most common haplotype, Hap9, was present at all sites with 59 individuals, representing 8.7% of all samples (Figure 1). High levels of haplotype diversity and nucleotide diversity were observed in all populations. Haplotype diversity ranged from 0.862 to 0.981, while nucleotide diversity ranged from 0.012 to 0.024. The haplotype diversity values of the other populations were above 0.900, with the exception of the Hepu (HP) population. The nucleotide diversity and the mean number of pairwise differences showed the same trend, with the HP population being the lowest. The genetic diversity of the HP population was significantly lower than that of the other populations (Table 1).
The phylogenetic tree was reconstructed employing the BI and ML methods using 292 haplotypes with the outgroup Sebastiscus tertius (MZ902352). There were no clusters corresponding to the sampling localities or pedigree branches (Supplementary Figures S1 and S2). The haplotype network showed multiple star-like radiations with several common and ancestral haplotypes shared by most populations, and the evolutionary relationship showed that each geographical population had a mixed distribution pattern (Figure 2). The overall AMOVA showed that about 5.42% of the genetic variation was between populations (Table 2). Other clustering methods also indicated that most of the genetic variations were within populations rather than between groups and populations. The AMOVA of three gene pools indicated the existence of a population genetic structure between groups (ΦCT = 0.071, p = 0.001) with 7.08% of the variation. The hierarchical AMOVA of five marginal sea-based gene pools supported the genetic structure based on marginal seas (ΦCT = 0.043, p = 0.007). Of the genetic variation, 93.43% was observed within populations. According to the results of the SAMOVA (Table 2), 15 populations were divided into two groups, the Beibu Gulf group, and the other 12 populations. The proportion of variation between the two groups was 9.43%, and there was significant genetic differentiation between them (ΦCT = 0.094, p = 0.002).
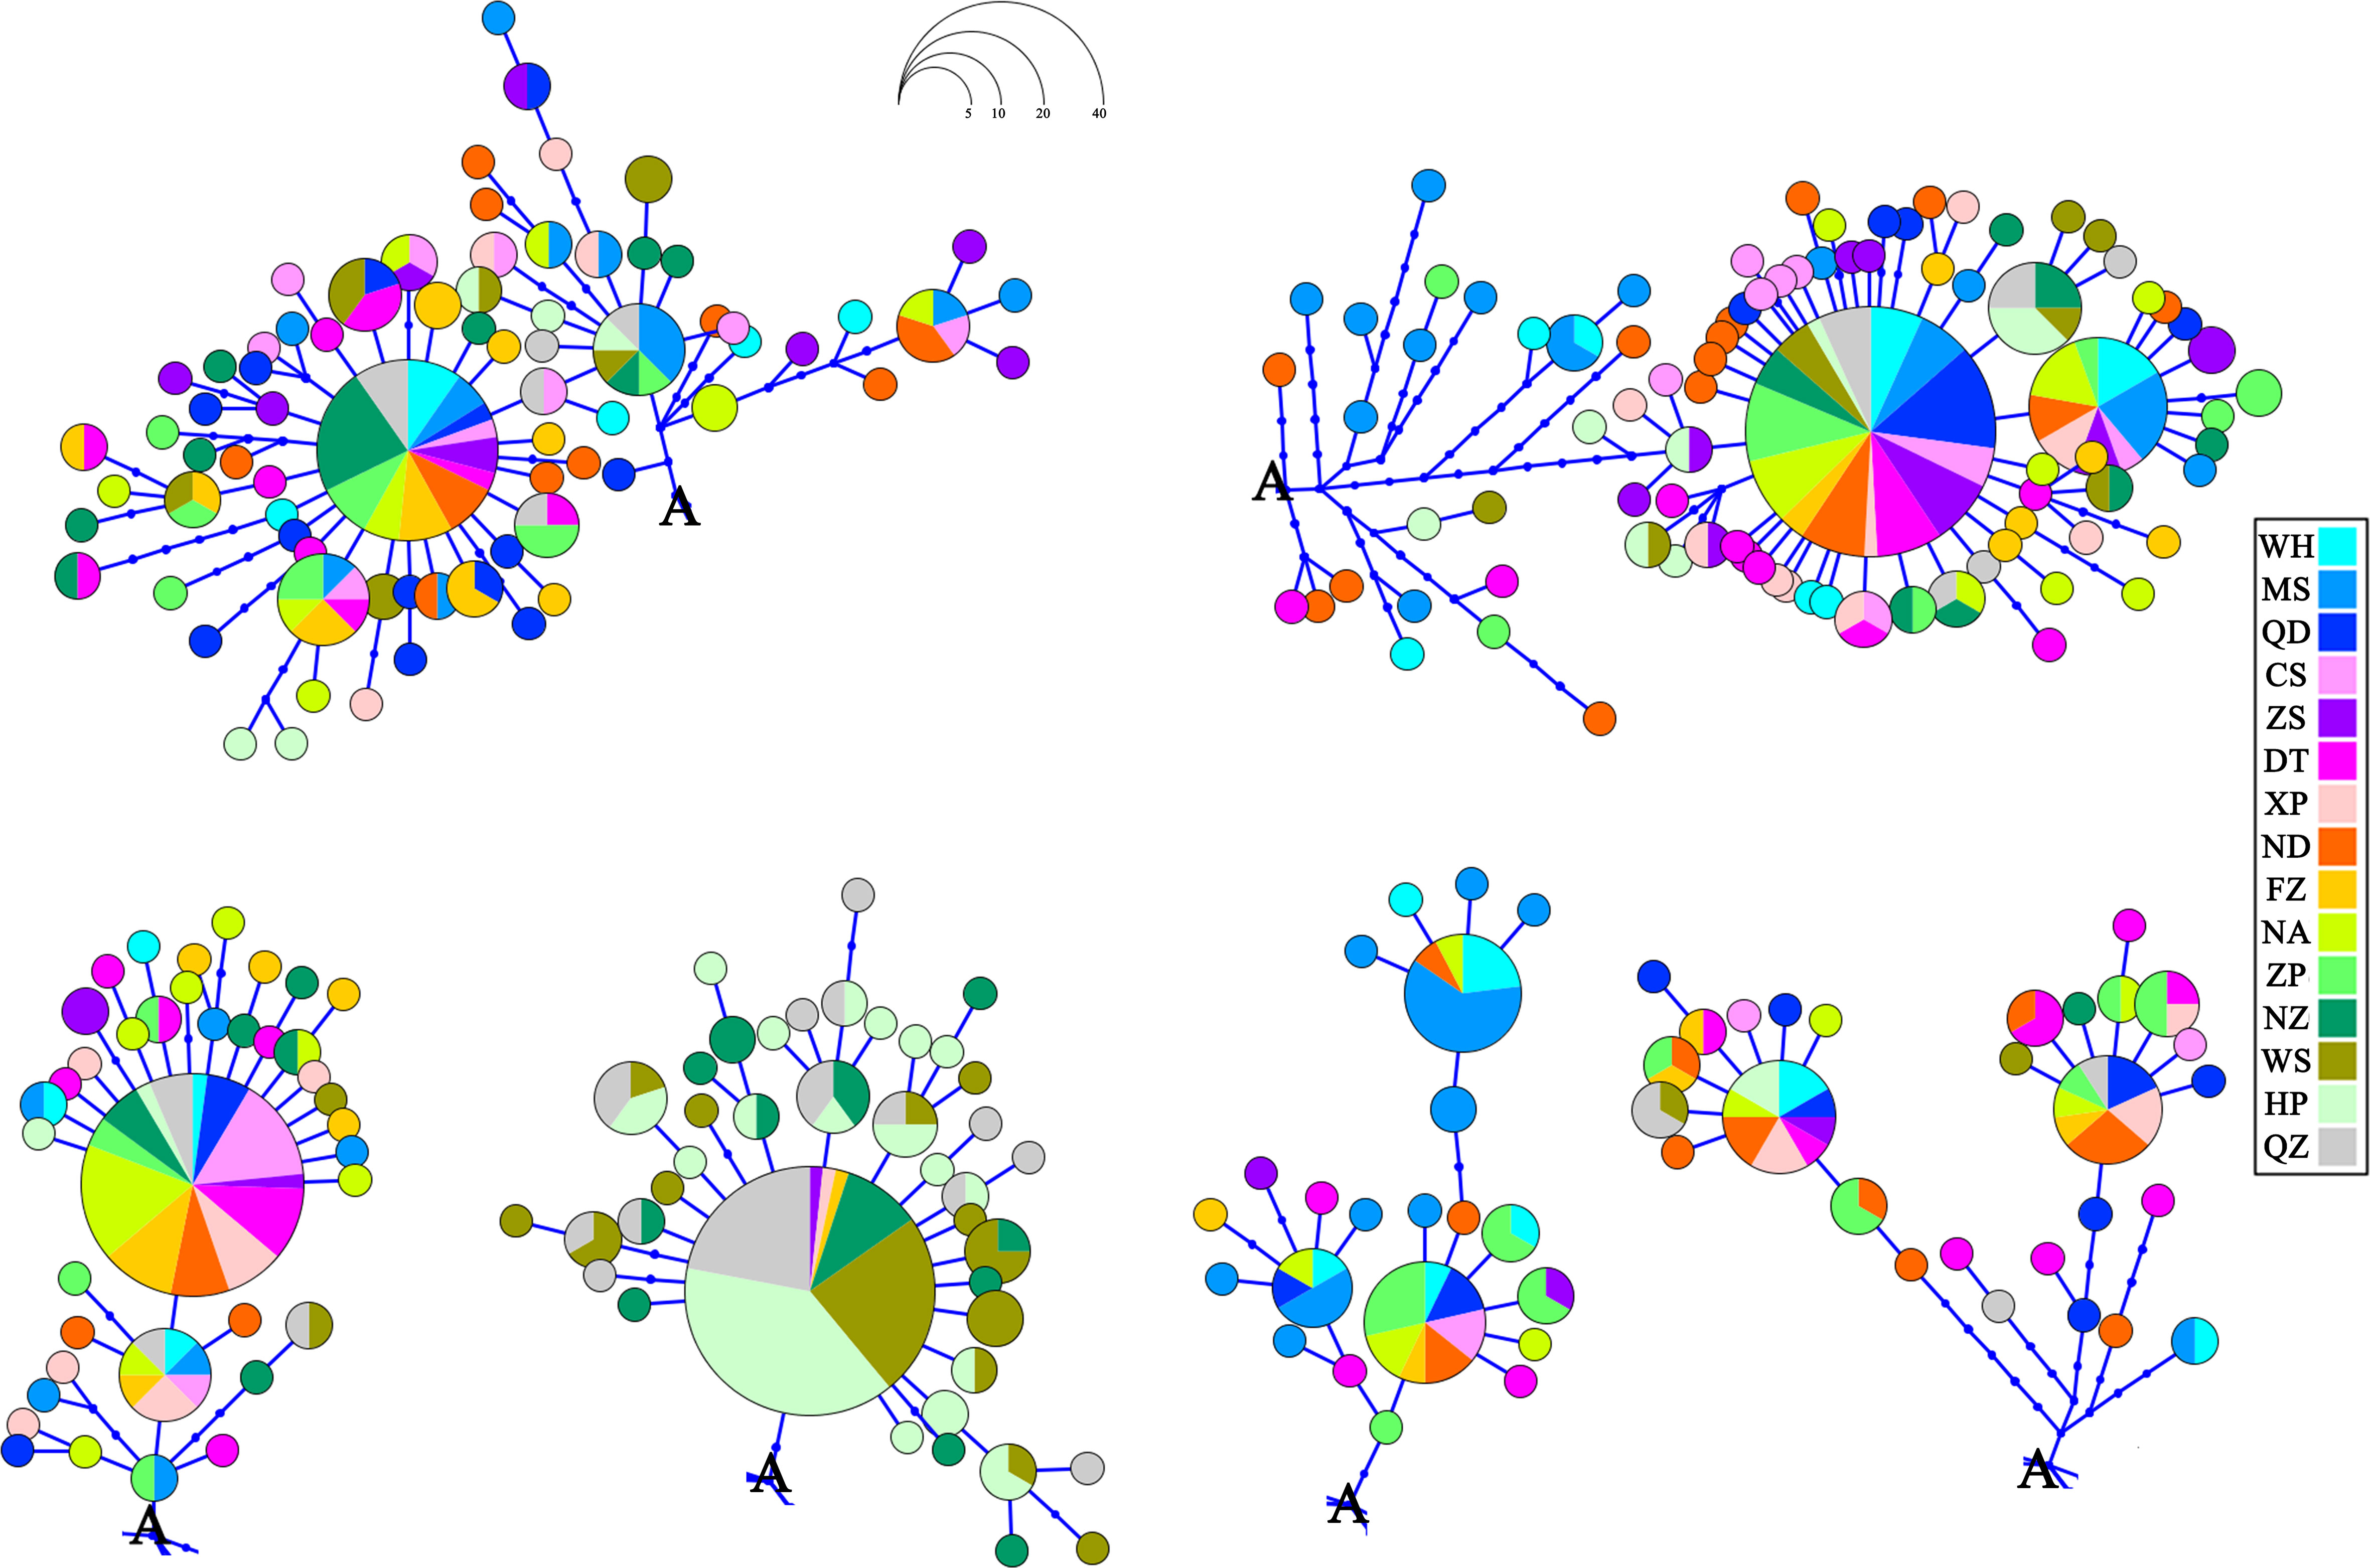
Figure 2 Haplotype network showing the haplotype connections and geographical frequency of occurrence for Sebastiscus marmoratus. Occurrences of the letter A in the figure denote the common point.
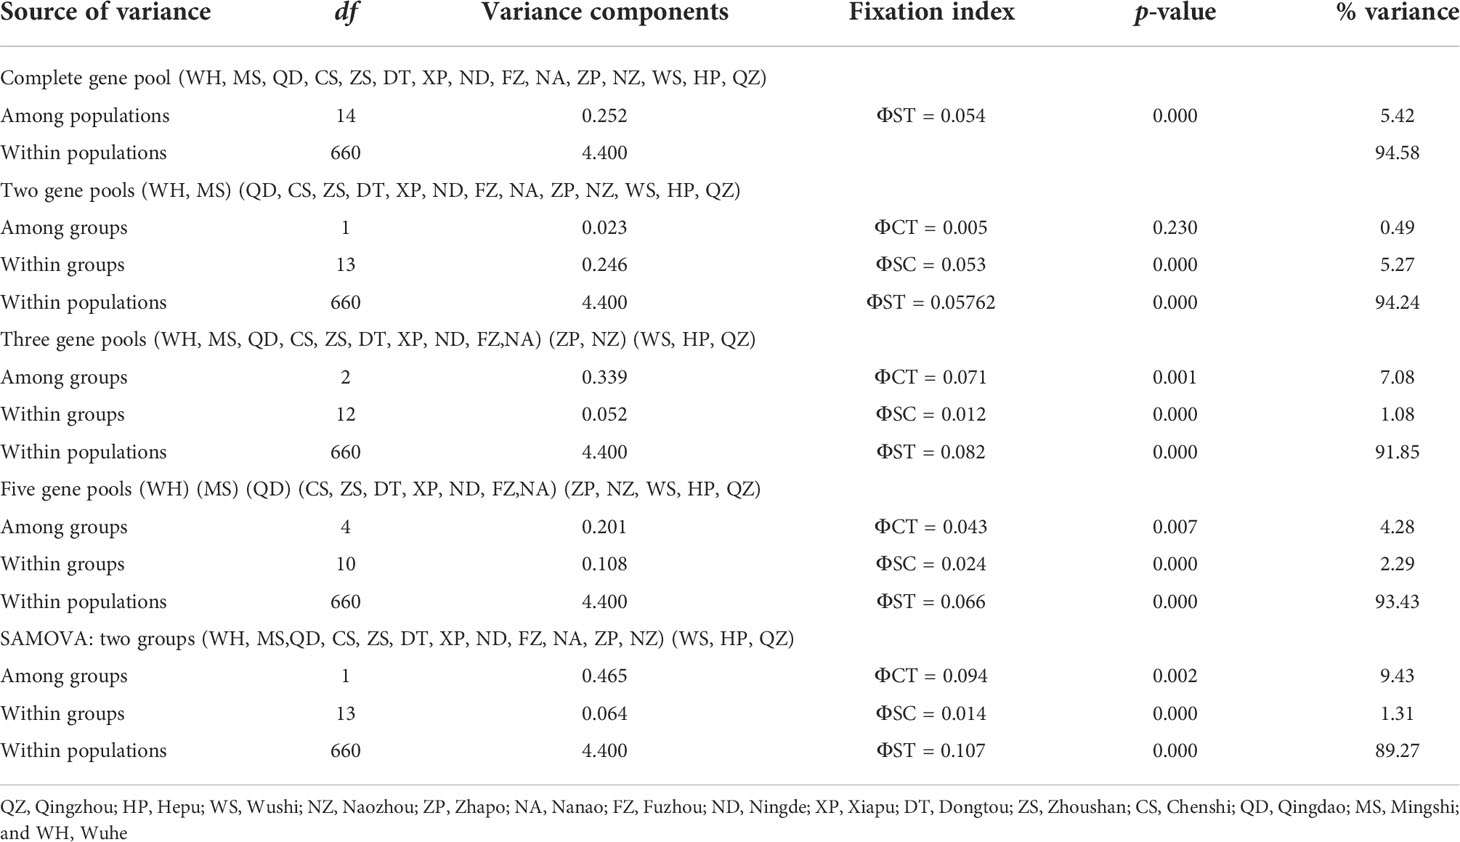
Table 2 Analysis of molecular variance (AMOVA) and spatial analysis of molecular variation (SAMOVA).
The pairwise population FST showed that the genetic differences between the 15 populations ranged from −0.020 to 0.231 (Table 3). Most of the pairwise FST values between populations did not show statistically significant differences after sequential Bonferroni correction. The largest difference was seen between HP and Zhoushan (FST = 0.231, p = 0.000). The three populations showed no genetic divergence (FST = −0.002 to 0.006) in the Beibu Gulf. However, the significant genetic differences occurring mainly between the Beibu Gulf group and the other populations were very strong (FST = 0.077–0.231) and were still significant after sequential Bonferroni correction. Some of the pairwise FST values were negative, indicating that the variation within a population was greater than that between populations. Examination of the IBR and IBD patterns with FST revealed significant differences in the population differentiation between the sampling sites (IBR Mantel test: r = 0.556, p = 0.000; IBD Mantel test: r = 0.337, p = 0.017). The results for the geographical barrier overlapped with the previous results (IBR) so that the priority barrier was observed between the Beibu Gulf and the other populations (Figure 3).
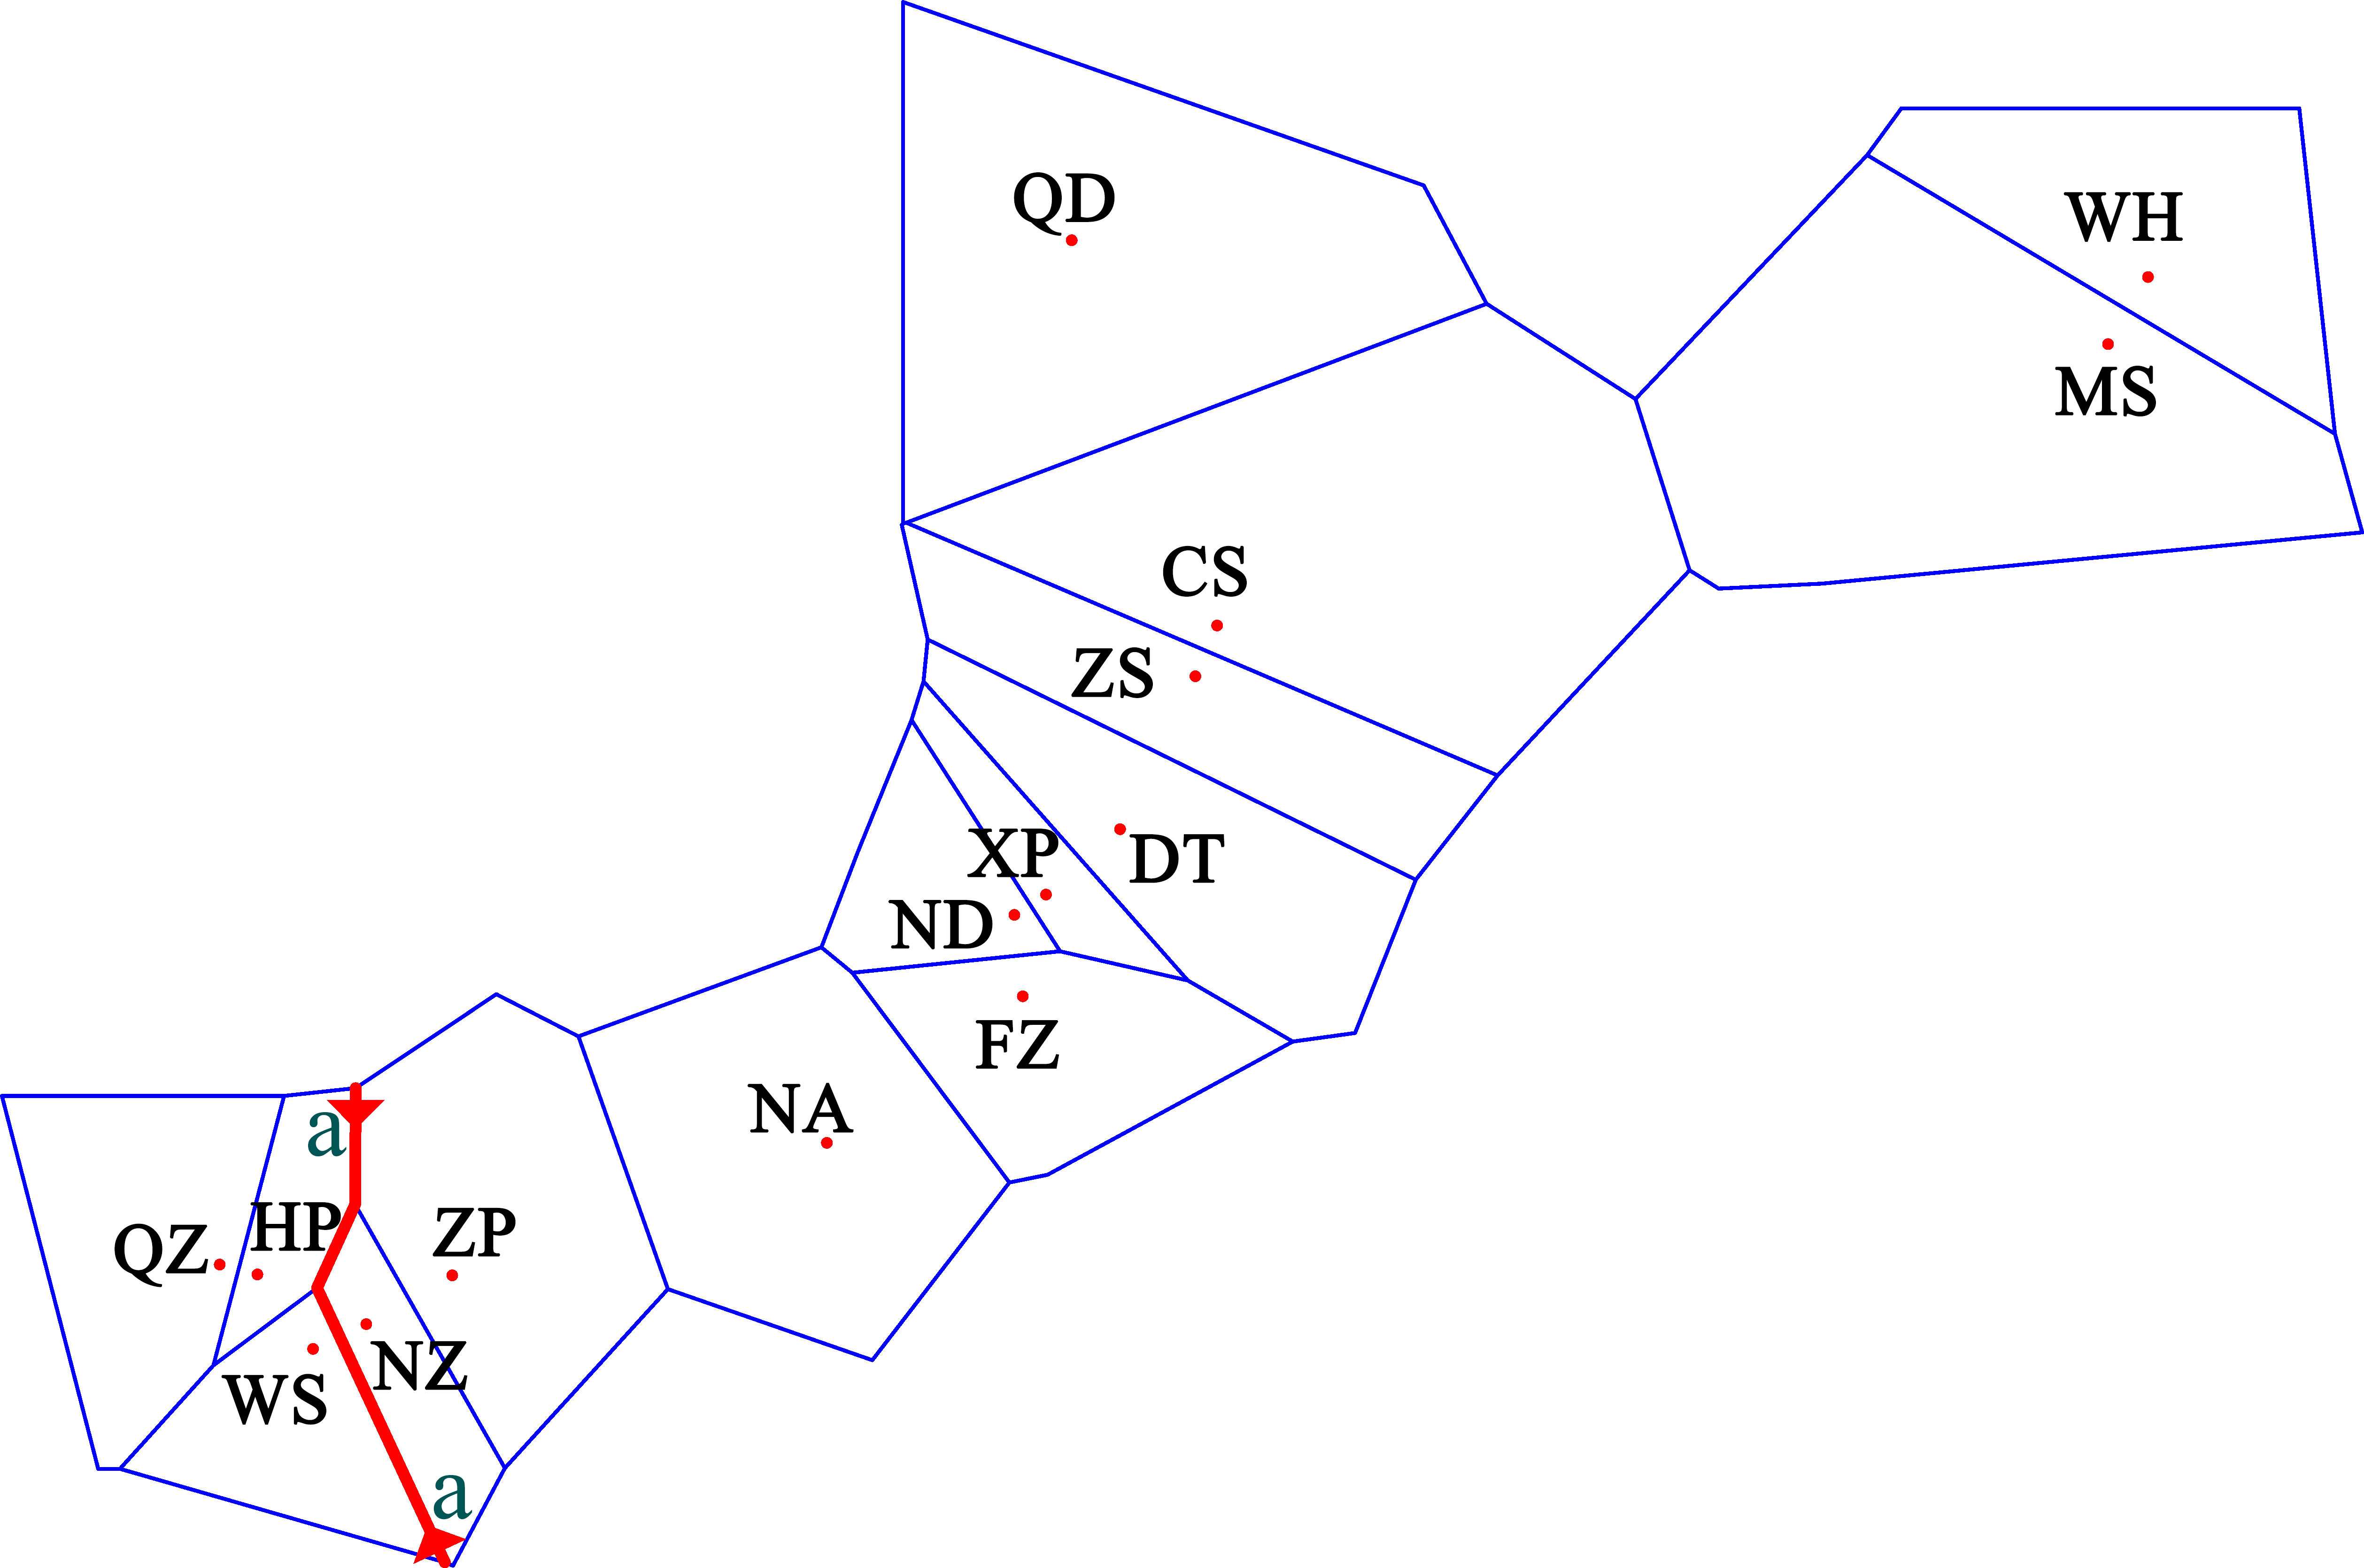
Figure 3 Results of the barrier analysis showing the spatial separation of populations of Sebastiscus marmoratus. Capital letters indicate populations. Lowercase letters indicate the order of the barrier found. Barriers are delimited by the small red line. QZ, Qingzhou; HP, Hepu; WS, Wushi; NZ, Naozhou; ZP, Zhapo; NA, Nanao; FZ, Fuzhou; ND, Ningde; XP, Xiapu; DT, Dongtou; ZS, Zhoushan; CS, Chenshi; QD, Qingdao; MS, Mingshi; and WH, Wuhe.
The mismatch distribution of S. marmoratus was bimodal (Figure 4), which could indicate populations at demographic equilibrium, but the non-significant and low sum of squared deviation (SSD) values (SSD = 0.0073, p > 0.05) indicated a sudden expansion event. The negative values obtained from Tajima’s D (D = −1.303, p = 0.065) and Fu’s Fs (Fs = −23.824, p = 0.003) statistics indicated a population expansion or a selective sweep for each population (Table 1). The τ value provides a rough estimate of when rapid population expansion began, which reflects the location of the peak of the mismatch distribution. The estimated expansion time for S. marmoratus, based on the age expansion parameter (τ), was 12.297 Myr, while the above rate for the control region and an average generation time of 2 years was 0.267–0.533 Mya. The colonization and population expansion of S. marmoratus in coastal China and Japan therefore took place during the Pleistocene. The BSPs for all samples showed the historical occurrence of the Late Pleistocene population expansion (about 126,000 years ago) and a continuous gradual increase in the effective size of the recent expansion (1,000–21,000 years ago) (Figure 5), which was consistent with the estimate in the mismatch distribution analysis.
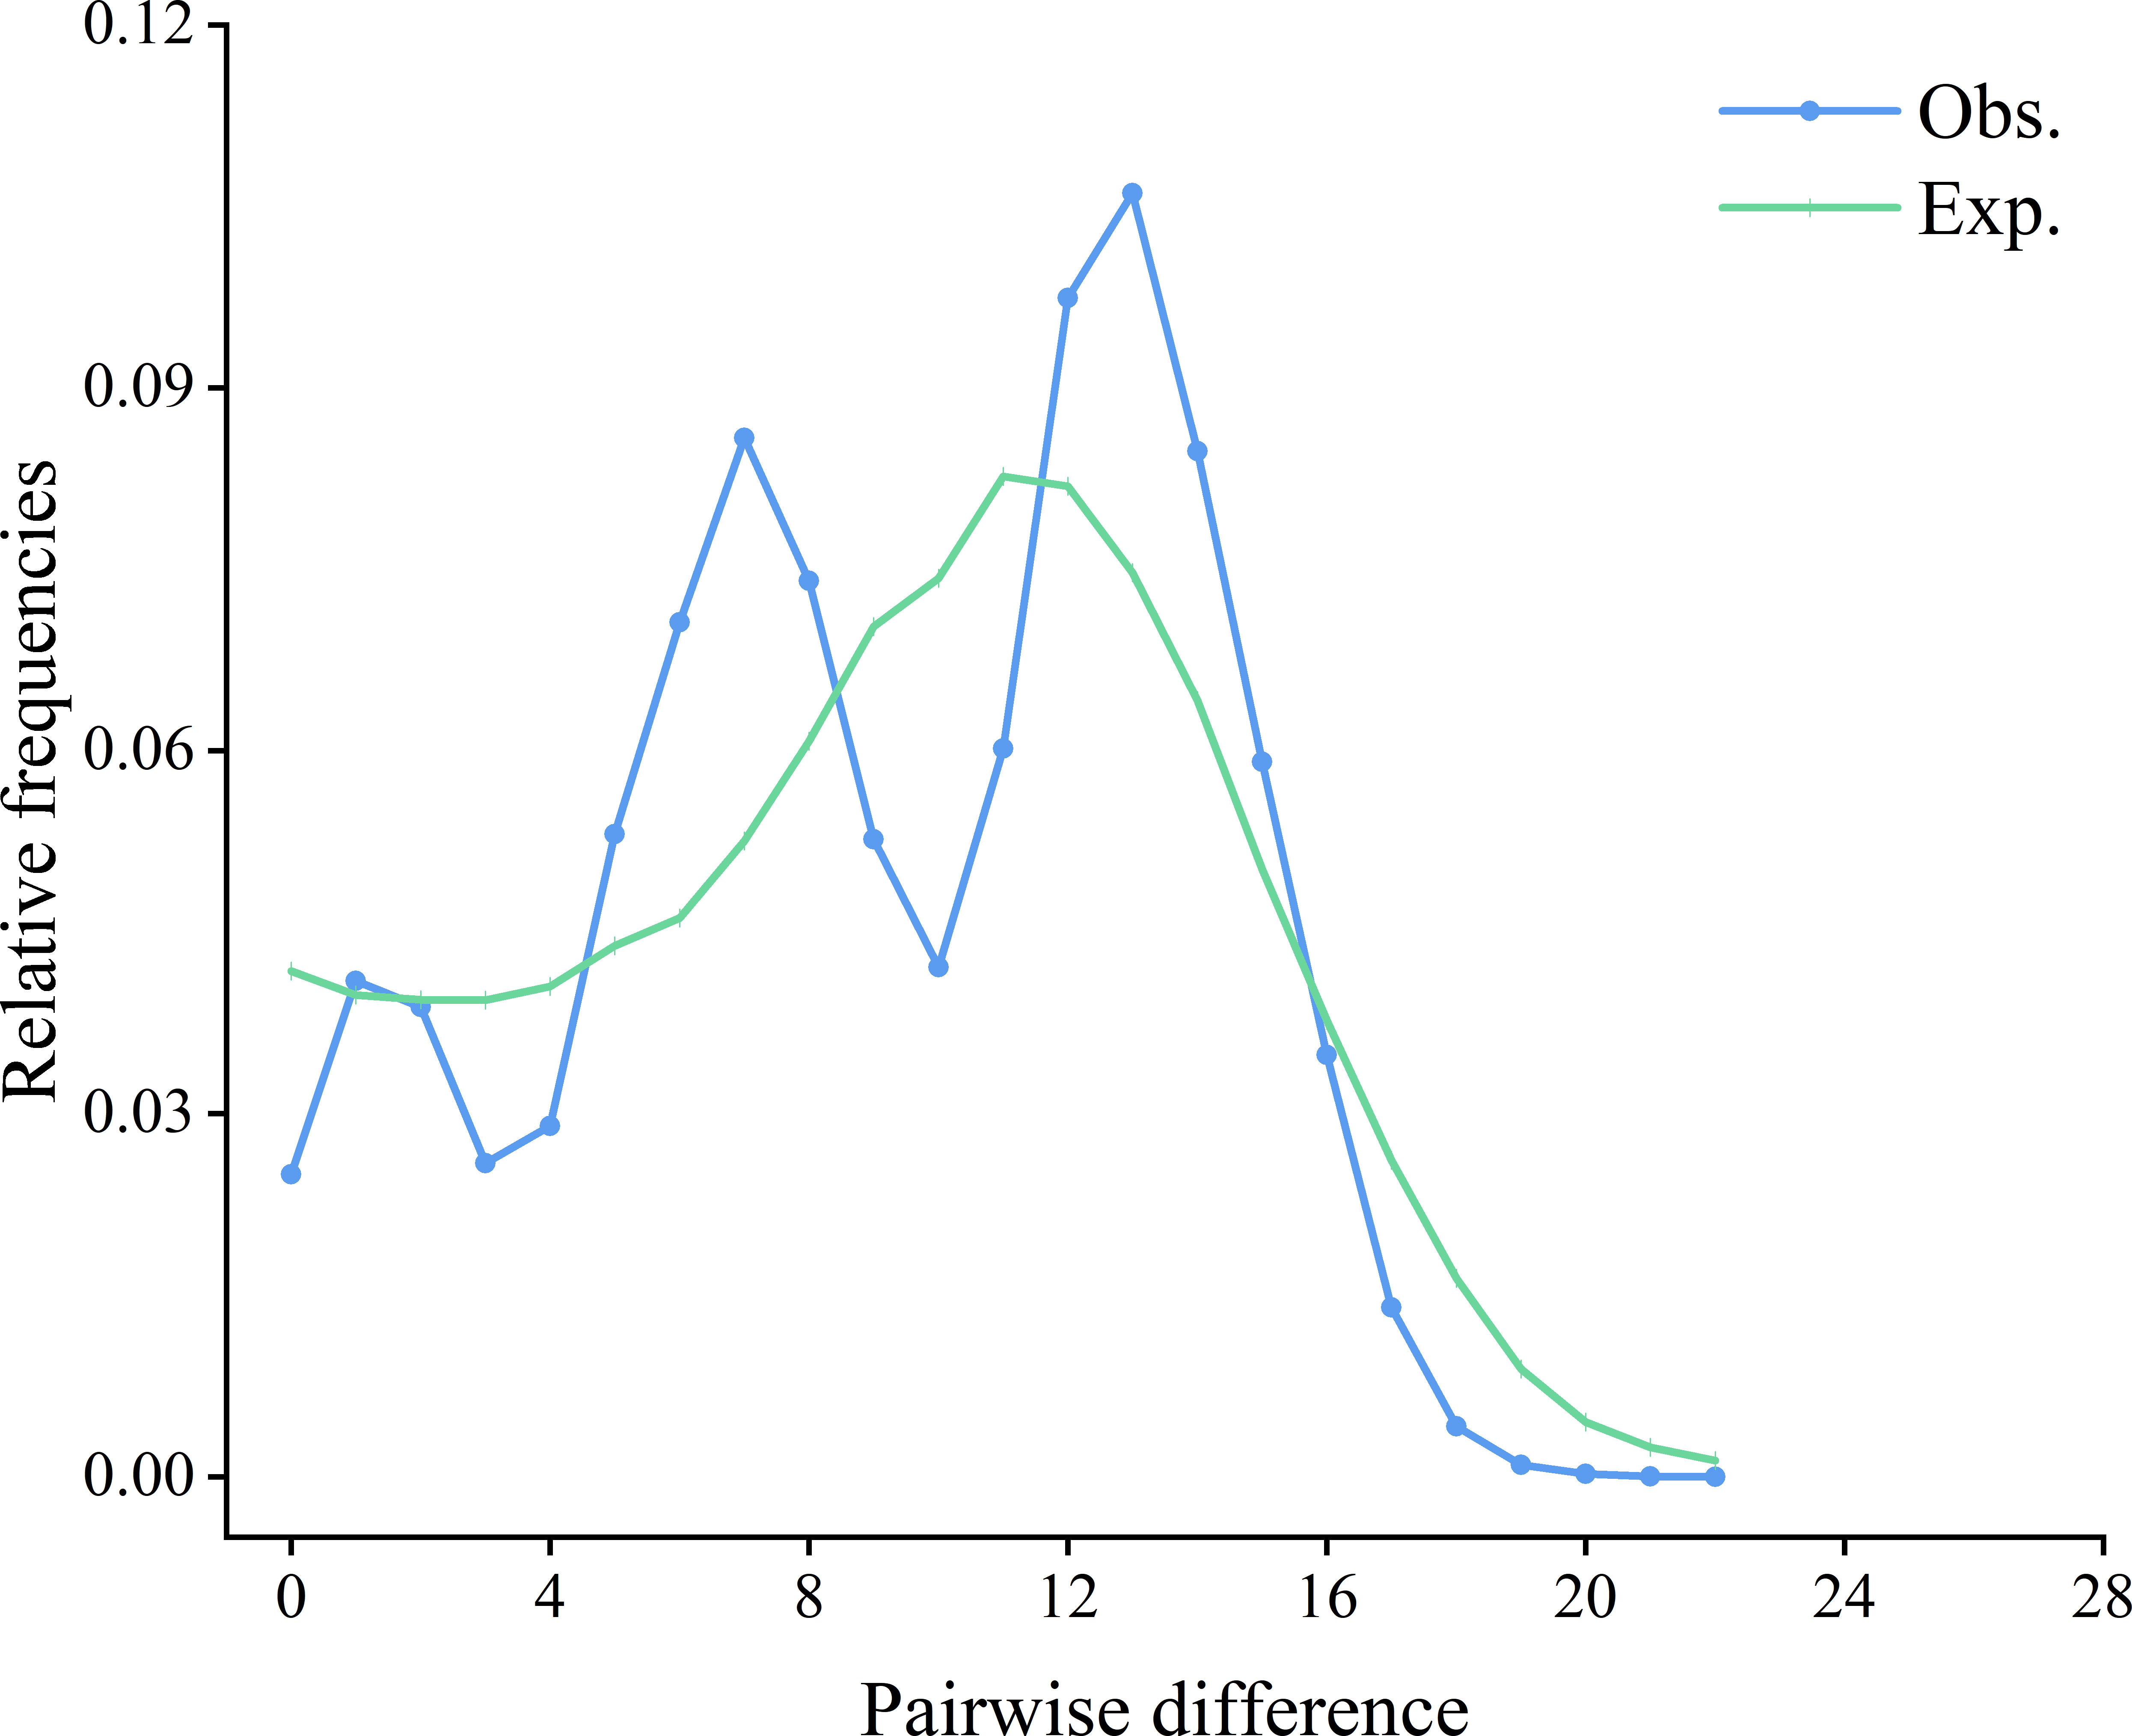
Figure 4 Observed (Obs.) pairwise differences and expected (Exp.) mismatch distributions under the sudden expansion model of the control region of Sebastiscus marmoratus haplotypes.
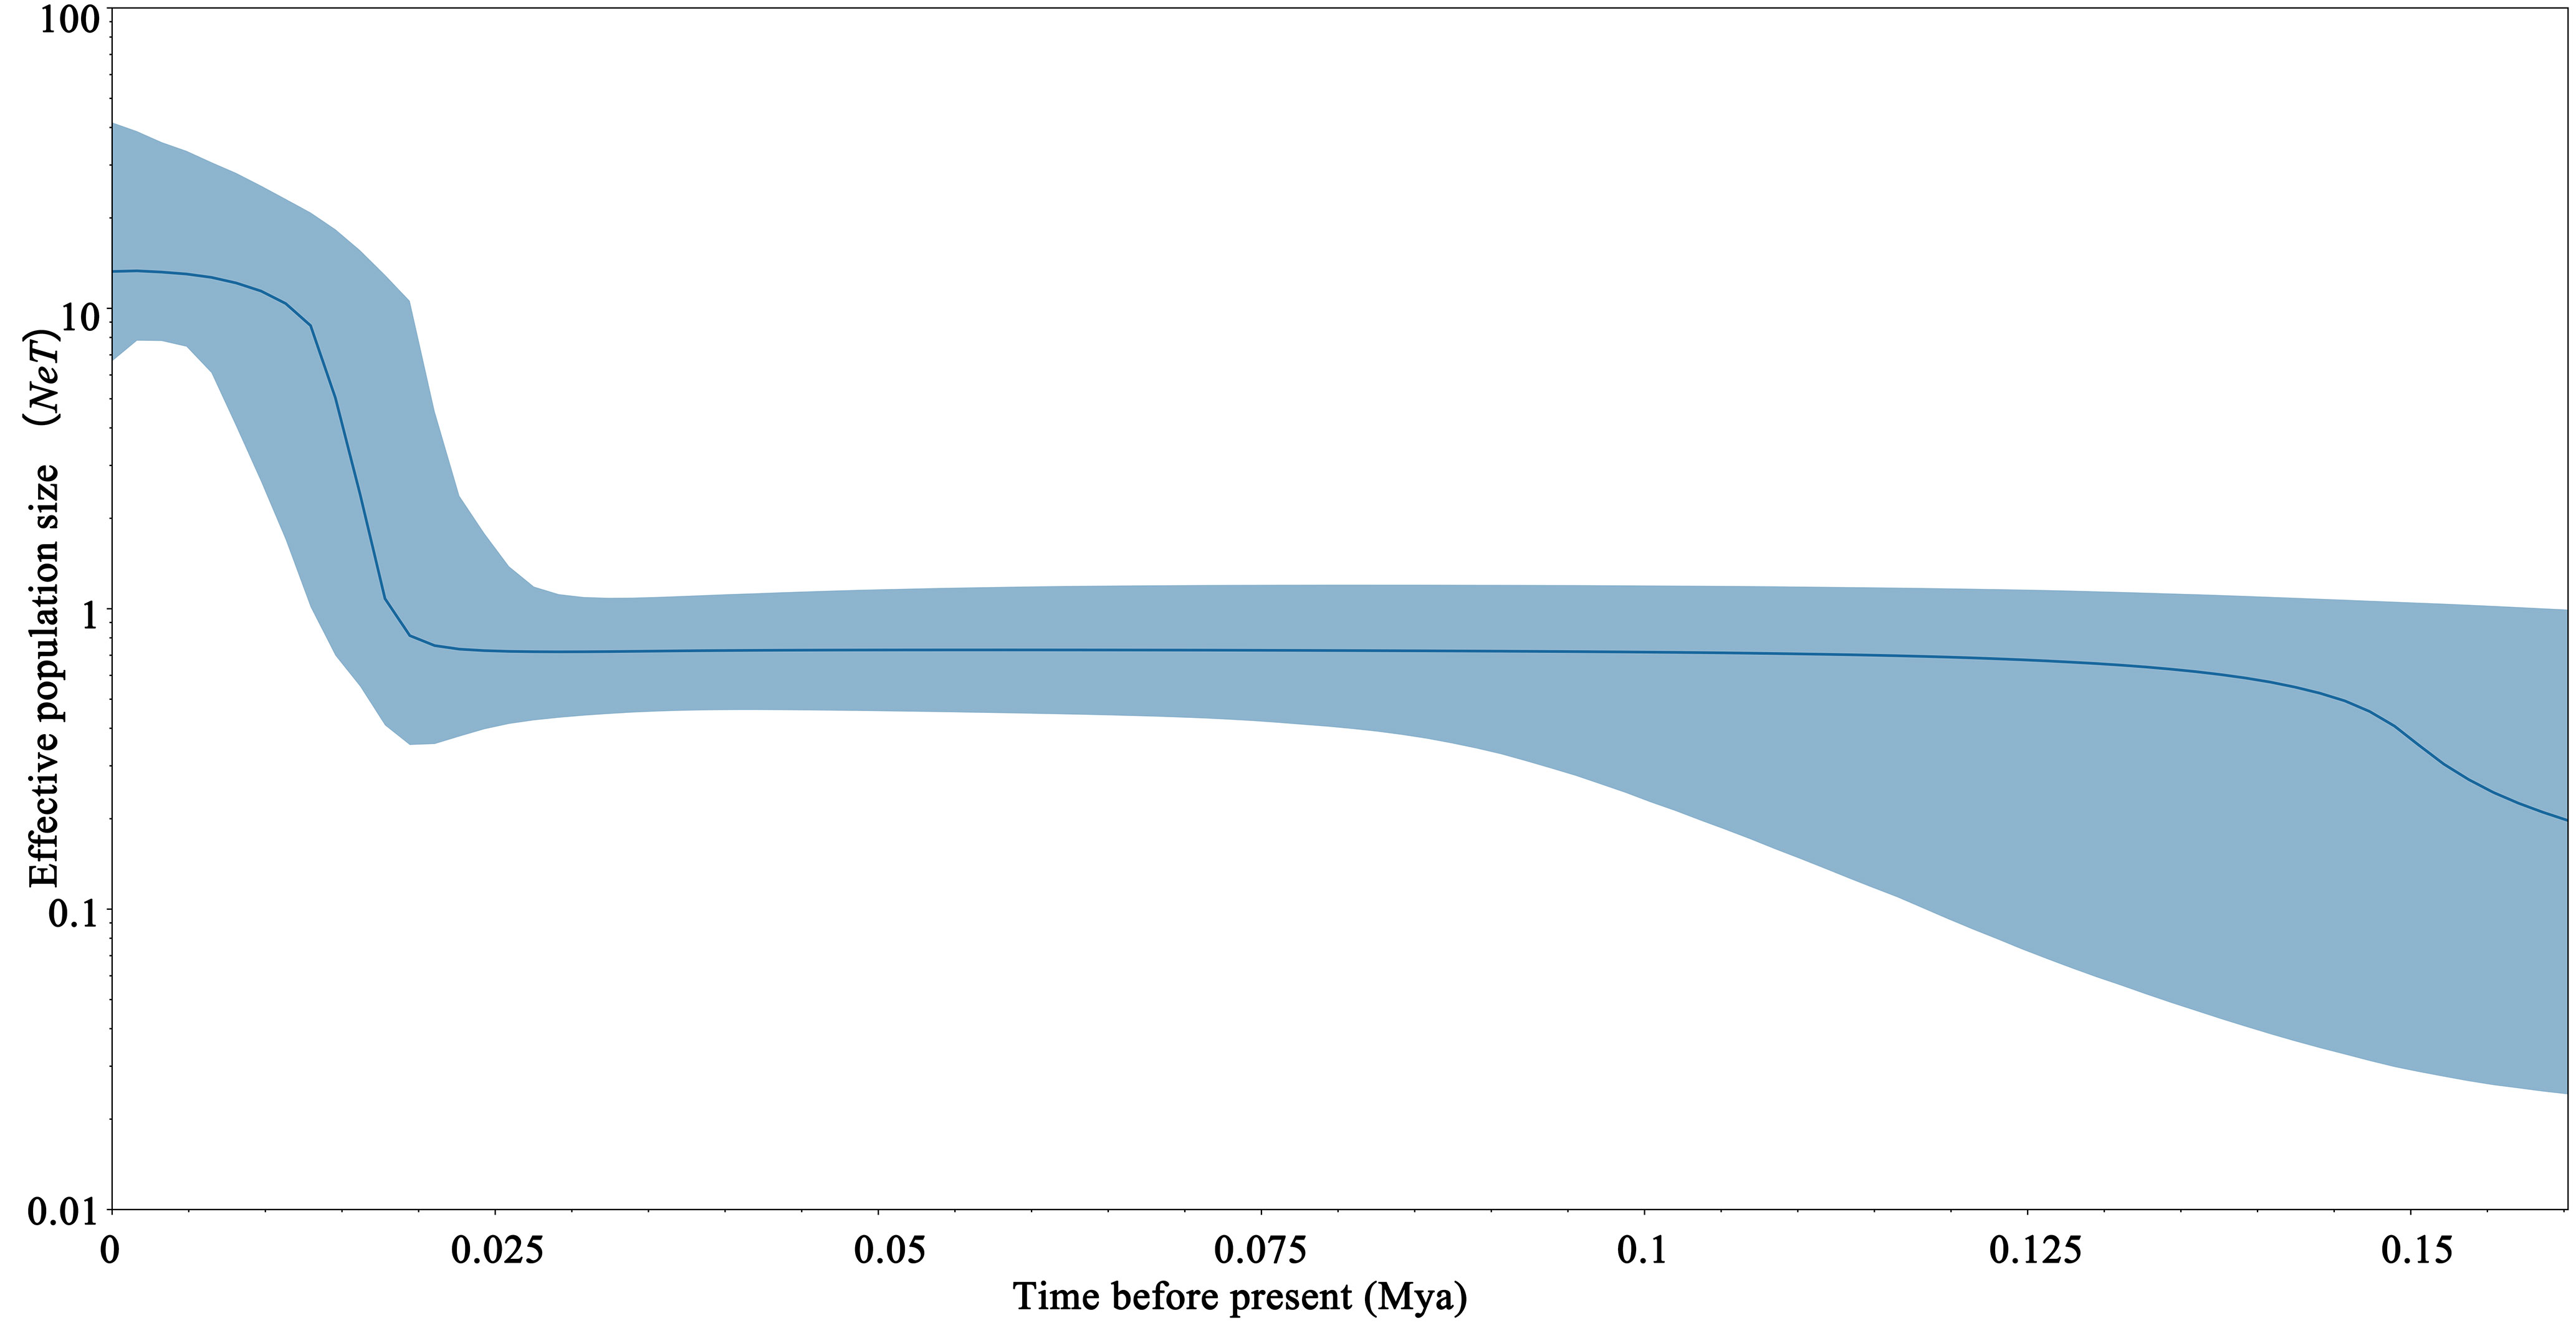
Figure 5 Bayesian skyline plots based on the mitochondrial DNA (mtDNA) control region sequences of Sebastiscus marmoratus.
The long-term average migration rates showed a strong variation across the range that was broadly consistent with contemporary gene flow patterns. The gene flow results (Figure 6A and Supplementary Table S1) for the five marginal seas and one inland water revealed the lowest levels of long-term unidirectional migration from other populations to the Beibu Gulf group (Nm = 3.15–9.44), the highest unidirectional gene flow for the South China Sea to the Beibu Gulf group [Wushi (WS), HP, and Qingzhou (QZ)] (Nm = 71.21), the unidirectional gene flow from the East China Sea to the Sea of Japan, which is the second highest (Nm = 63.68), and the bidirectional gene flow between the South China Sea and the East China Sea, which is high (Nm = 54.04 and 57.32). The gene flow results (Figure 6B and Supplementary Table S2) between the six South China populations showed the lowest unidirectional gene flow for the Zhapo (ZP) to the Naozhou (NZ) population (Nm = 2.38) and the highest unidirectional gene flow for the WS to the QZ population (Nm = 52.71).
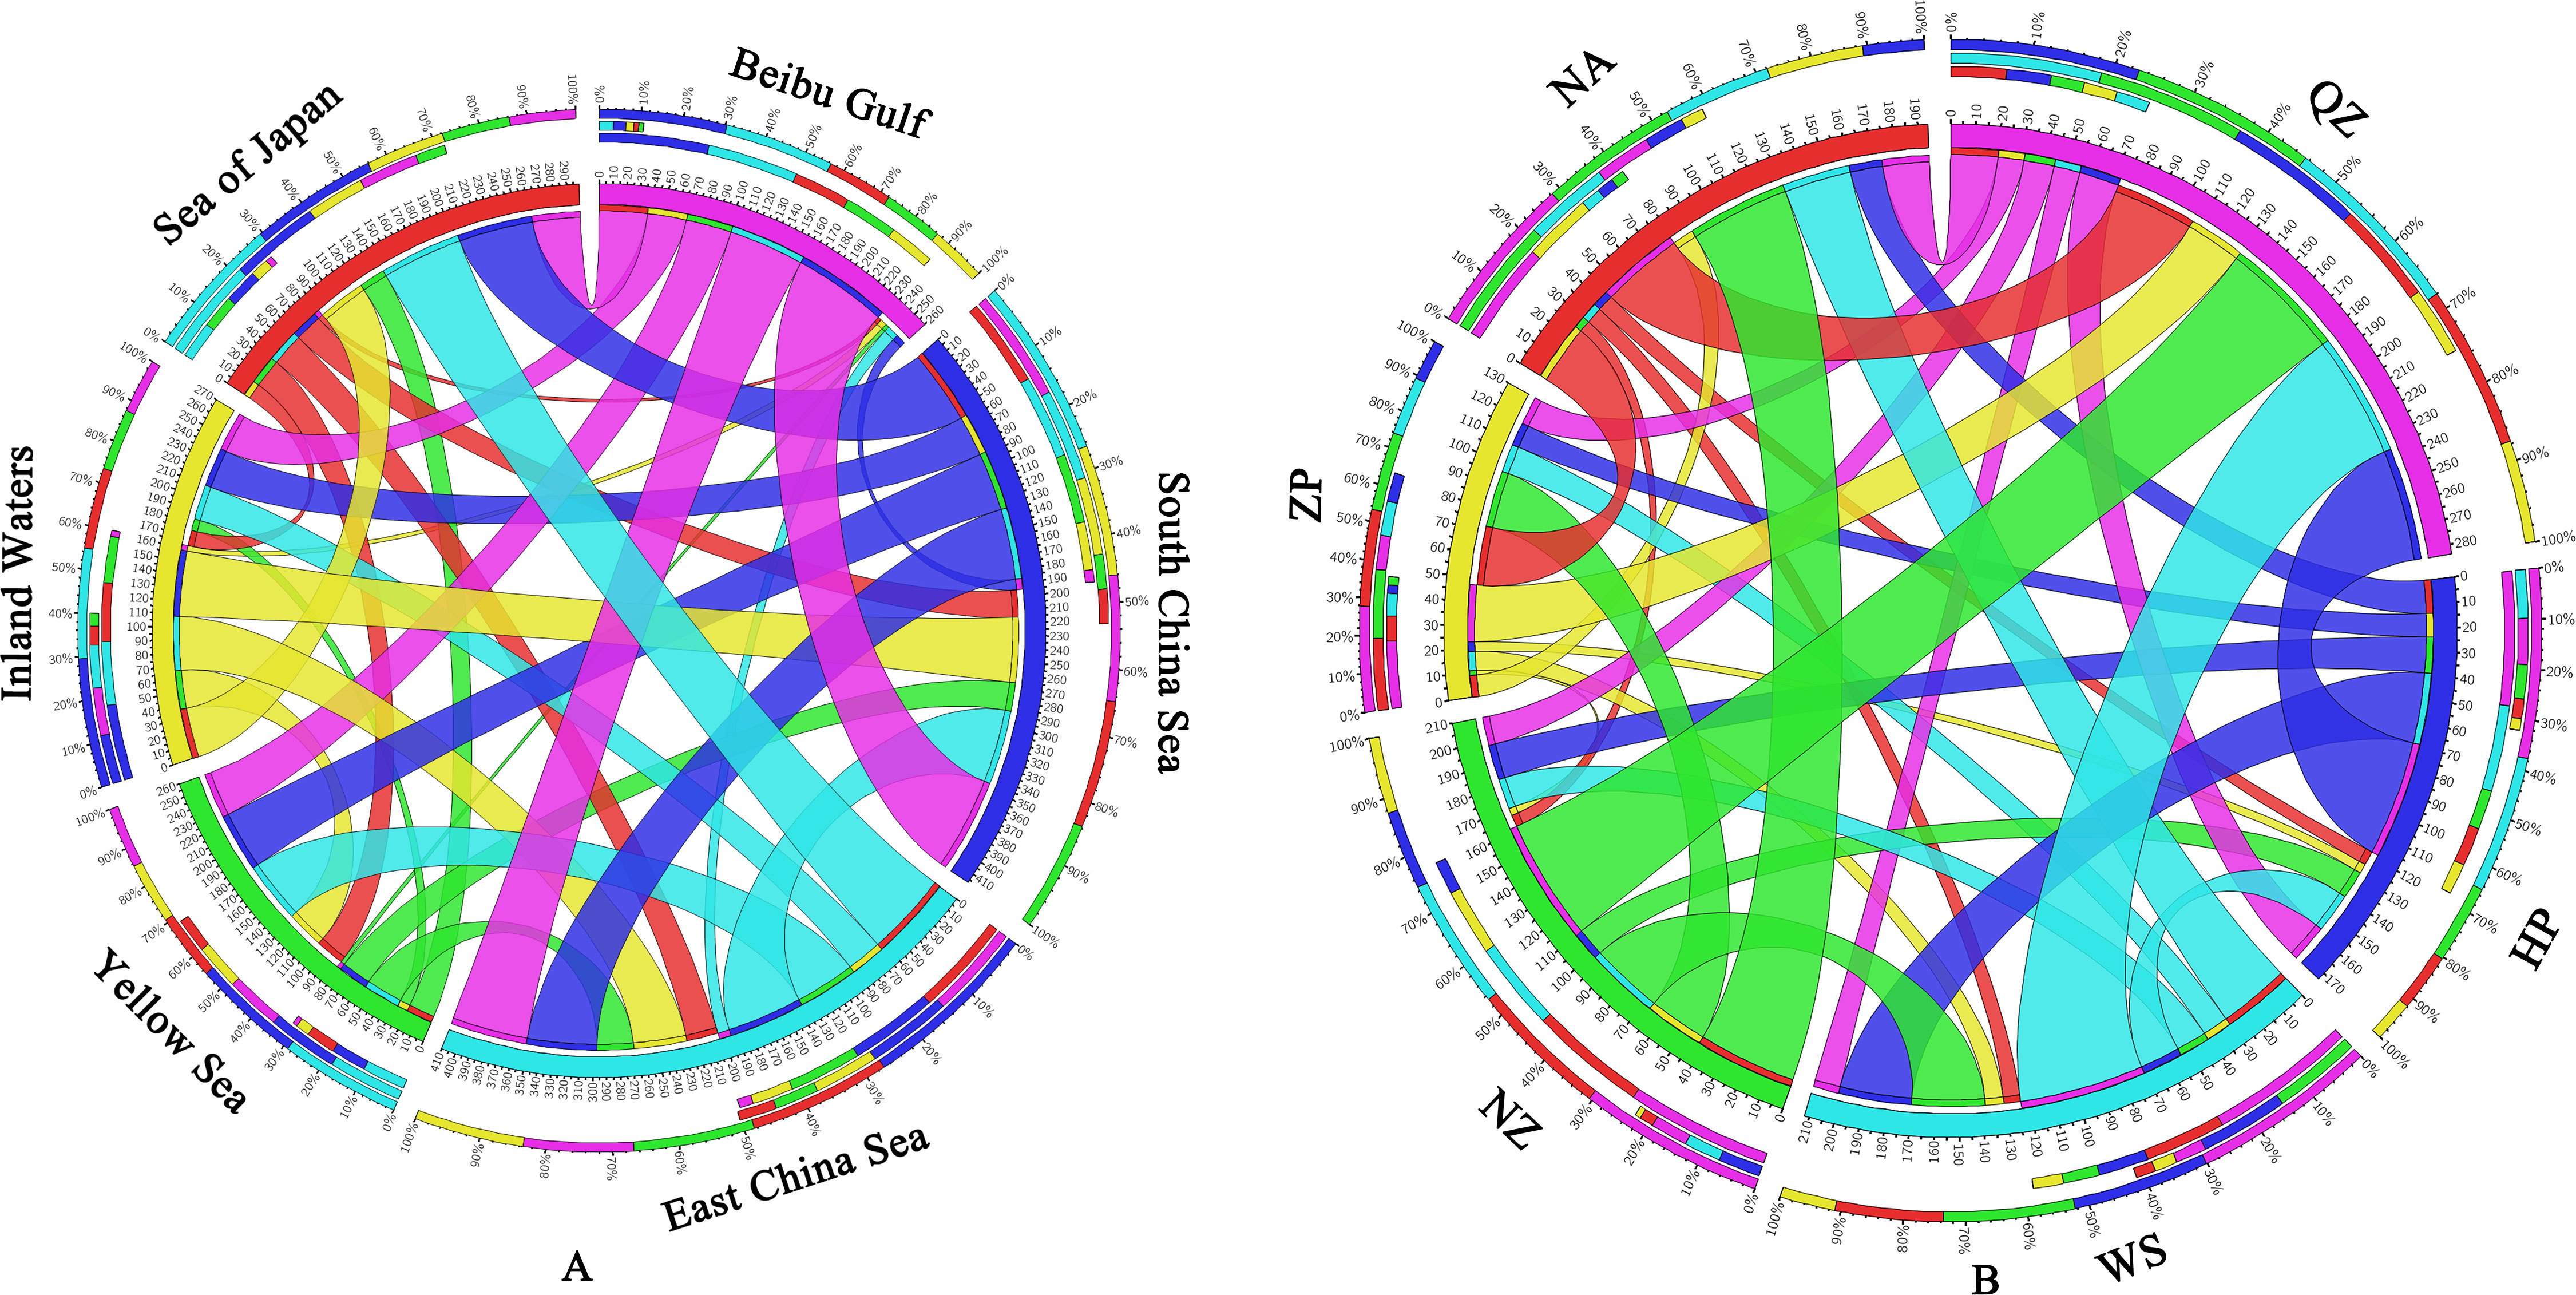
Figure 6 (A) Gene flow of Sebastiscus marmoratus populations across five marginal seas and one inland water. (B) Gene flow between six populations of S. marmoratus in southern China. Different colors represent different marginal seas (A) or populations (B). The thickness of the color bands indicates the extent of gene flow. QZ, Qingzhou; HP, Hepu; WS, Wushi; NZ, Naozhou; ZP, Zhapo; and NA, Nanao.
There are two important indicators to measure the genetic diversity of populations: haplotype and nucleotide (Liu et al., 2006; Song et al., 2014). Nucleotide diversity considers the number of different nucleotides between DNA sequences, so it is often more accurate to reflect the degree of genetic polymorphism in a population than to reflect the genetic distance (Shen et al., 2011; Liu et al., 2019). Overall, high haplotype diversity and nucleotide diversity were found in most populations of S. marmoratus. These results are consistent with those of other fish populations in the Northwest Pacific (Song et al., 2014; Liu et al., 2019). The two different reasons for the high genetic diversity may be the secondary contact between two independent subspecies or populations of the species and the other being that the population has undergone a long and stable evolution process with continuous development and expansion and has not experienced a bottleneck effect or a rapid population expansion in the process (Grant and Bowen, 1998). The results of this study support the second situation—that there is no lineage differentiation in the S. marmoratus population—and the high genetic diversity may have been caused by the large effective population size. Hap9 is the main haplotype, which is shared by all populations and has a high distribution frequency (Figures 1 and 2). It may be the ancestral haplotype of the S. marmoratus population. At the same time, each population has unique haplotypes, indicating that the population has a rich genetic diversity. In the management of germplasm resources, we should pay attention to the protection of unique haplotypes and keep them diverse (Liao et al., 2007).
Compared to migratory fish and freshwater fish, marine species generally have smaller genetic differences between geographical regions as they have a higher potential for transmission through floating drift of eggs, larvae, or adults, and there is no physical barrier (Liu et al., 2019). Genetic differentiation is affected by the geographical distance and barriers between populations, the life history of marine animals, human activities (such as transport), and other factors (Hellberg, 2009). The overall genetic differentiation index was 0.049, indicating that the genetic differentiation was generally low. Among the 15 populations, there was no genetic differentiation within the Beibu Gulf group, but there was moderate to high genetic differentiation with the other populations in China and Japan, which may be related to refuge formation (Consuegra et al., 2002). Some studies have shown that the general trend of the annual flow direction in the Qiongzhou Strait is from east to west (Yang et al., 2003; Chen et al., 2006), which has limited the migration of the Beibu Gulf populations. Due to the limited migration capacity, the geographical distance (IBD), and the natural barrier (IBR and the barrier analysis), the gene flow between the three Beibu Gulf populations and the other populations is blocked and the genetic differentiation is high. Liu et al. (2019) found that the Hyogo population has obvious genetic differentiation from the other populations in China and Japan. This study found that the HP population also has obvious genetic differentiation from the other populations in China and Japan. Considering the commonalities of the two populations, Liu’s conjecture was confirmed: The depth of inland waters and semi-open areas may have an impact on geographical isolation. The HP population may be the result of the recurrent semi-closure of the South China Sea in the Pleistocene.
The mismatch distribution analysis showed a unimodal distribution, and Tajima’s D (Tajima, 1989) deviated from the neutrality test, suggesting that the population has expanded in the past; on the contrary, the population size remained stable. In this study, the mismatch distribution showed a clear bimodal distribution, but Tajima’s D was −1.303. The significant Tajima’s D value in the neutrality statistical test may have been caused by the role of natural selection, population expansion, or the bottleneck effect (Nielsen, 2001). Fu’s FS test is very sensitive to group expansion, which usually produces negative Fs values with large absolute values (Fu, 1997). Both Fu’s Fs (−23.824, p = 0.003 < 0.05) and the star-like structure of the haplotype network confirmed that the S. marmoratus population is expanding. Regarding the τ value and the BSP, we estimated the same result as that of Liu et al. (2019), that the population of S. marmoratus expanded during the Pleistocene. Many studies found that the expansion of marine fish populations mostly occurred during this period (Liu et al., 2006; Song et al., 2014; Yamashita et al., 2021; Zhao et al., 2022). During the Pleistocene, six glacial periods and five interglacial periods were repeatedly experienced. Climate fluctuation occurred mainly in a cycle of about 100,000 years, which was characterized by the cooling of the climate and an obvious alternation of the glacial and interglacial periods (Imbrie et al., 1992; Wang, 1999; Lambeck et al., 2002), accompanied by climate changes in monsoon, ocean current, and temperature. Over the period from 500,000 to 130,000 years ago, several periods of glacial maximum occurred (Petit et al., 1999; Liu et al., 2006), which coincided with the periods of population expansion of S. marmoratus. S. marmoratus is a carnivorous fish that inhabits the warm water bottoms from the low tide zone to the 80-m depth at sea and often remains in rocky crevices of low-lying reefs (Yatomi et al., 2005; Liu et al., 2019). The sea level drop during the Ice Age will expose the continental shelf along the coast of China and isolate the eggs and juveniles of S. marmoratus in different sea areas in the corresponding marginal sea shelters, resulting in a different genetic differentiation.
A high gene flow occurred between the South China Sea and the Beibu Gulf, which provides evidence for the historical connectivity of the Qiongzhou Strait (Wan et al., 2012). The forward gene flow from NZ to WS and from NZ to QZ was greater than the backward gene flow, which is consistent with the direction of China’s coastal currents. This study (IBR) showed that the Leizhou Peninsula and Hainan Island are the main geographical barriers to gene flow between S. marmoratus populations. Geographical distance (IBD) and the low migration capacity played an important role in structuring the genetics of the S. marmoratus population. This study also showed that there is a very strong differentiation between the Beibu Gulf population and the other populations, that there is some barrier to gene flow, and that the genetic diversity of the Beibu Gulf population is the lowest. This phenomenon may have been due to the Qiongzhou Strait and coastal barriers having a great impact on the differentiation of the geographical structure of S. marmoratus (Liu et al., 2006). Human overfishing may have caused a sharp reduction in the population size of S. marmoratus in the Beibu Gulf, which then underwent the recent bottleneck effect, resulting in isolation and the obvious differentiation between the Beibu Gulf population and other populations. There is a great difference in the climate between the north and south coasts of China, and the East China Sea and Yellow Sea have a temperate marine climate, while the Beibu Gulf has a subtropical marine climate. To better protect the germplasm resources of S. marmoratus, it is suggested that the protection of the HP population is prioritized and that the Beibu Gulf group and the other groups be protected as management and protection units, respectively.
A clear genetic structure was found for the S. marmoratus population east and west of the Leizhou Peninsula. The seascape discontinuity and population expansion caused by the Pleistocene sea-level rise and fall, the geographical distance, ecological characteristics, and ocean currents may play an important role in shaping the current population structures and phylogeographical patterns of S. marmoratus. The results provide a scientific basis for the formulation and implementation of measures for the protection, development, and use of S. marmoratus.
The data sets presented in this study can be found in online repositories. The names of the repository/repositories and accession number(s) can be found below: https://www.ncbi.nlm.nih.gov/genbank/, ON784048-ON784339 https://figshare.com/,10.6084/m9.figshare.21069271.
The animal study was reviewed and approved by the Ethics Committee of Jinan University.
C-HS, RG, and QZ provided the study conception and design. C-HS, TW, Y-LL, SL, J-FY, and QZ contributed to species identification. TW, DX, X-SZ, and Y-LL performed material preparation and data collection. C-HS wrote the original draft. C-HS, RG, EH, DA, and QZ edited the manuscript. All authors read and approved the final manuscript. All authors contributed to the article and approved the submitted version.
This study was supported by the National Key R&D Program of China (grant no. 2018YFD0900802); Fishery Resources Survey of Guangxi Zhuang Autonomous Region (GXZC2022-G3-001062-ZHZB); and the Director’s Fund of the Hubei Key Laboratory of Three Gorges Project for Conservation of Fishes, China Three Gorges Corporation (0704157).
SL was employed by China Three Gorges Corporation.
The remaining authors declare that the research was conducted in the absence of any commercial or financial relationships that could be construed as a potential conflict of interest.
All claims expressed in this article are solely those of the authors and do not necessarily represent those of their affiliated organizations, or those of the publisher, the editors and the reviewers. Any product that may be evaluated in this article, or claim that may be made by its manufacturer, is not guaranteed or endorsed by the publisher.
The Supplementary Material for this article can be found online at: https://www.frontiersin.org/articles/10.3389/fmars.2022.1018864/full#supplementary-material
Beerli P. (2006). Comparison of Bayesian and maximum-likelihood inference of population genetic parameters. Bioinformatics 22, 341–345. doi: 10.1093/bioinformatics/bti803
Beerli P., Palczewski M. (2010). Unified framework to evaluate panmixia and migration direction among multiple sampling locations. Genetics 185, 313–326. doi: 10.1534/genetics.109.112532
Bohonak A. J. (1999). Dispersal, gene flow, and population structure. The Quarterly review of biology 74(1), 21–45.
Brunner P. C., Douglas M. R., Osinov A., Wilson C., Bernatchez L. (2001). Holarctic phylogeography of arctic charr (Salvelinus alpinus l.) inferred from mitochondrial DNA sequences. Evolution 55, 573–586. doi: 10.1111/j.0014-3820.2001.tb00790.x
Chen D. S., Chen B., Yan J. H., Xu H. F. (2006). The seasonal variation characteristics of residual currents in the qiongzhou strait. Trans. Oceanol. Limnol. 2, 12–17. doi: 10.13984/j.cnki.cn37-1141.2006.02.003
Chowdhury M. M., Rahman A. S., Nahar L., Rahman M., Al Reza H., Ahmed M. S. (2016). Efficiency of different DNA extraction methods for fish tissues: a comparative analysis. IOSR J. Pharm. Biol. Sci. 11, 11–15.
Consuegra S., García de Leániz C., Serdio A., González Morales M., Straus L. G., Knox D., et al. (2002). Mitochondrial DNA variation in pleistocene and modern Atlantic salmon from the Iberian glacial refugium. Mol. Ecol. 11, 2037–2048. doi: 10.1046/j.1365-294X.2002.01592.x
Drummond A. J., Suchard M. A., Xie D., Rambaut A. (2012). Bayesian Phylogenetics with BEAUti and the BEAST 1.7. Mol. Biol. Evol. 29, 1969–1973. doi: 10.1093/molbev/mss075
Dynesius M., Jansson R. (2000). Evolutionary consequences of changes in species’ geographical distributions driven by milankovitch climate oscillations. P. Natl. Acad. Sci. U.S.A. 97, 9115–9120. doi: 10.1073/pnas.97.16.9115
Excoffier L., Smouse P. E., Quattro J. M. (1992). Analysis of molecular variance inferred from metric distances among DNA haplotypes: application to human mitochondrial DNA restriction data. Genetics 131, 479–491. doi: 10.1093/genetics/131.2.479
Fu Y. X. (1997). Statistical tests of neutrality of mutations against population growth, hitchhiking and background selection. Genetics 147, 915–925. doi: 10.1093/genetics/147.2.915
Gerlach G., Atema J., Kingsford M. J., Black K. P., Miller-Sims V (2007). Smelling home can prevent dispersal of reef fish larvae. P Natl A Sci. 104 (3), 858–863. doi: 10.1890/02-0498
Gilg M. R., Hilbish T. J (2003). The geography of marine larval dispersal: coupling genetics with fine‐scale physical oceanography. Ecology 84 (11), 2989–2998. doi: 10.1890/02-0498
Fujita H., Kohda M. (1998). Timing and sites of parturition of the viviparous scorpionfish, sebastiscus marmoratus. Environ. Biol. Fish 52, 225–229. doi: 10.1023/A:1007471919373
Grant W. A. S., Bowen B. W. (1998). Shallow population histories in deep evolutionary lineages of marine fishes: insights from sardines and anchovies and lessons for conservation. J. Hered. 89, 415–426. doi: 10.1093/jhered/89.5.415
Harpending H. C. (1994). Signature of ancient population growth in a low-resolution mitochondrial DNA mismatch distribution. Hum. Biol. 66, 591–600. Available at: https://www.jstor.org/stable/41465371.
Hellberg M. E. (2009). Gene flow and isolation among populations of marine animals. Annu. Rev. Ecol. Evol. Syst. 40, 291–310. doi: 10.1146/annurev.ecolsys.110308.120223
Hess J. E., Vetter R. D., Moran P. (2011). A steep genetic cline in yellowtail rockfish, sebastes flavidus, suggests regional isolation across the cape mendocino faunal break. Can. J. Fish. Aquat. Sci. 68, 89–104. doi: 10.1139/F10-131
Hewitt G. M (1996). Some genetic consequences of ice ages, and their role in divergence and speciation. Biol. J. Linn. Soc. 58 (3), 247–276. doi: 10.1111/j.1095-8312.1996.tb01434.x
Hewitt G. (2000). The genetic legacy of the quaternary ice ages. Nature 405, 907–913. doi: 10.1038/35016000
Hijmans R. J. (2019). Introduction to the “Geosphere” Package (Version 1.4-3). Available online at: https://www.rdocumentation.org/packages/geosphere (accessed December, 2020).
Imbrie J., Boyle E. A., Clemens S. C., Duffy A., Howard W. R., Kukla G., et al. (1992). On the structure and origin of major glaciation cycles 1. linear responses to milankovitch forcing. Paleoceanography 7, 701–738. doi: 10.1029/92PA02253
Johansson M. L., Banks M. A., Glunt K. D., Hassel-Finnegan H. M., Buonaccorsi V. P. (2008). Influence of habitat discontinuity, geographical distance, and oceanography on fine-scale population genetic structure of copper rockfish (Sebastes caurinus). Mol. Ecol. 17, 3051–3061. doi: 10.1111/j.1365-294X.2008.03814.x
Kalyaanamoorthy S., Minh B. Q., Wong T. K., Von Haeseler A., Jermiin L. S. (2017). ModelFinder: fast model selection for accurate phylogenetic estimates. Nat. Methods 14, 587–589. doi: 10.1038/nmeth.4285
Kimura M. (1980). A simple method for estimating evolutionary rates of base substitutions through comparative studies of nucleotide sequences. J. Mol. Evol. 16, 111–120. doi: 10.1007/BF01731581
Kritzer J. P., Sale P. F. (2006). “The metapopulation ecology of coral reef fishes,” in Marine metapopulations. Eds. Kritzer J. P., Sale P. F. (Burlington, Mass: Elsevier Academic Press), 31–67.
Lambeck K., Esat T. M., Potter E. K. (2002). Links between climate and sea levels for the past three million years. Nature 419, 199–206. doi: 10.1038/nature01089
Liao P. C., Havanond S., Huang S. (2007). Phylogeography of ceriops tagal (Rhizophoraceae) in southeast Asia: the land barrier of the Malay peninsula has caused population differentiation between the Indian ocean and south China Sea. Conserv. Genet. 8, 89–98. doi: 10.1007/s10592-006-9151-8
Liu J. X., Gao T. X., Zhuang Z. M., Jin X. S., Yokogawa K., Zhang Y. P. (2006). Late pleistocene divergence and subsequent population expansion of two closely related fish species, Japanese anchovy (Engraulis japonicus) and Australian anchovy (Engraulis australis). Mol. Phylogenet. Evol. 40, 712–723. doi: 10.1016/j.ympev.2006.04.019
Liu L., Zhang X., Li C., Zhang H., Yanagimoto T., Song N., et al. (2019). Population genetic structure of marbled rockfish, Sebastiscus marmoratus (Cuvier 1829), in the northwestern pacific ocean. ZooKeys 830, 127. doi: 10.3897/zookeys.830.30586
Lowe W. H., Allendorf F. W. (2010). What can genetics tell us about population connectivity? Mol. Ecol. 19, 3038–3051. doi: 10.1111/j.1365-294X.2010.04688.x
Minh B. Q., Nguyen M. A. T., Von Haeseler A. (2013). Ultrafast approximation for phylogenetic bootstrap. Mol. Biol. Evol. 30, 1188–1195. doi: 10.1093/molbev/mst024
Nguyen L. T., Schmidt H. A., Von Haeseler A., Minh B. Q. (2015). IQ-TREE: a fast and effective stochastic algorithm for estimating maximum-likelihood phylogenies. Mol. Biol. Evol. 32, 268–274. doi: 10.1093/molbev/msu300
Nielsen R. (2001). Statistical tests of selective neutrality in the age of genomics. Heredity 86, 641–647. doi: 10.1046/j.1365-2540.2001.00895.x
Oksanen J., Blanchet F. G., Kindt R., Legendre P., Minchin P. R., O’hara R. B., et al. (2013). Package ‘vegan’. Community Ecol. package version 2 (9), 1–295. r-project.org/pub/R/web/packages/vegan/vegan.pdf
Palumbi S. R. (1994). Genetic divergence, reproductive isolation, and marine speciation. Annu. Rev. Ecol. S. 25, 547–572. doi: 10.1146/annurev.es.25.110194.002555
Petit J. R., Jouzel J., Raynaud D., Barkov N. I., Barnola J. M., Basile I., et al. (1999). Climate and atmospheric history of the past 420,000 years from the vostok ice core, Antarctica. Nature 399, 429–436. doi: 10.1038/20859
Rambaut A. (2015) FigTree, a graphical viewer of phylogenetic trees. Available at: http://tree.bio.ed.ac.uk/software/figtree (Accessed 24 July 2015).
Rambaut A., Drummond A. J., Xie D., Baele G., Suchard M. A. (2018). Posterior summarization in Bayesian phylogenetics using tracer 1.7. Syst. Biol. 67, 901–904. doi: 10.1093/sysbio/syy032
R Core Team (2012). R: A language and environment for statistical computing (Vienna, Austria: R Foundation for Statistical Computing). Available at: http://www.R-project.org/.
Rice W. R. (1989). Analyzing tables of statistical tests. Evolution 43, 223–225. doi: 10.2307/2409177
Roberts C. M. (1997). Connectivity and management of Caribbean coral reefs. Science 278, 1454–1457. doi: 10.1126/science.278.5342.1454
Rogers A. R., Harpending H. (1992). Population growth makes waves in the distribution of pairwise genetic differences. Mol. Biol. Evol. 9, 552–569. doi: 10.1093/oxfordjournals.molbev.a040727
Ronquist F., Teslenko M., van der Mark P., Ayres D. L., Darling A., Höhna S., et al. (2012). MrBayes 3.2: efficient Bayesian phylogenetic inference and model choice across a large model space. Syst. Biol. 61, 539–542. doi: 10.1093/sysbio/sys029
Shen K. N., Jamandre B. W., Hsu C. C., Tzeng W. N., Durand J. D. (2011). Plio-pleistocene sea level and temperature fluctuations in the northwestern pacific promoted speciation in the globally-distributed flathead mullet mugil cephalus. BMC Evol. Biol. 11, 1–17. doi: 10.1186/1471-2148-11-83
Song N., Ma G., Zhang X., Gao T., Sun D. (2014). Genetic structure and historical demography of collichthys lucidus inferred from mtDNA sequence analysis. Environ. Biol. Fish. 97, 69–77. doi: 10.1007/s10641-013-0124-8
Song N., Zhang X. M., Sun X. F., Yanagimoto T., Gao T. X. (2010). Population genetic structure and larval dispersal potential of spottedtail goby synechogobius ommaturus in the north-west pacific. J. Fish Biol. 77, 388–402. doi: 10.1111/j.1095-8649.2010.02694.x
Sunde J., Yıldırım Y., Tibblin P., Bekkevold D., Skov C., Nordahl O., et al. (2022). Drivers of neutral and adaptive differentiation in pike (Esox lucius) populations from contrasting environments. Mol. Ecol. 31, 1093–1110. doi: 10.1111/mec.16315
Tajima F. (1989). Statistical method for testing the neutral mutation hypothesis by DNA polymorphism. Genetics 123, 585–595. doi: 10.1093/genetics/123.3.585
Taylor M. S., Hellberg M. E. (2003). Genetic evidence for local retention of pelagic larvae in a Caribbean reef fish. Science 299, 107–109. doi: 10.1126/science.1079365
Wan X., Liu Y., Zhang B. (2012). Invasion history of the oriental fruit fly, Bactrocera dorsalis, in the Pacific-Asia region: two main invasion routes. PLoS One 7 (5), e36176. doi: 10.1371/journal.pone.0036176
Wang P. (1999). Response of Western pacific marginal seas to glacial cycles: paleoceanographic and sedimentological features. Mar. Geol. 156, 5–39. doi: 10.1016/S0025-3227(98)00172-8
Yamaoka K., Nakagawa T., Uno T. (1978). Application of akaike's information criterion (AIC) in the evaluation of linear pharmacokinetic equations. J. Pharmacokinet. Biopharma. 6, 165–175. doi: 10.1007/BF01117450
Yamashita Y., Sanchez G., Kawai K., Tomano S., Fujita H., Umino T. (2021). The role of the isolation of the marginal seas during the pleistocene in the genetic structure of black sea bream acanthopagrus schlegelii (Bleeker 1854) in the coastal waters of Japan. PeerJ 9, e11001. doi: 10.7717/peerj.11001
Yang S. Y., Bao X. W., Chen C. S., Chen F. (2003). Analysis on characteristics and mechanism of current system in west coast of guangdong province in the summer. Acta Oceanol. Sin. (in chinese) 25, 1–8.
Yatomi H., Miyagawa T., Akiba M. (2005). Ecological and genetic characteristics of common rockfish sebastiscus marmoratus in shimizu harbor, shizuoka [Japan]. J. School Mar. Sci. Technol.-Tokai Univ. (Japan) 3 (2), 21–38.
Keywords: Sebastiscus marmoratus, marine fisheries, Scorpaenidae, genetic, China
Citation: Sun C-H, Gozlan RE, Wu T, Xue D, Lao Y-L, Yu J-F, Zeng X-S, Li S, Hardouin EA, Andreou D and Zhang Q (2022) The role of ancestral seascape discontinuity and geographical distance in structuring rockfish populations in the Pacific Northwest. Front. Mar. Sci. 9:1018864. doi: 10.3389/fmars.2022.1018864
Received: 14 August 2022; Accepted: 26 September 2022;
Published: 17 October 2022.
Edited by:
Tianxiang Gao, Zhejiang Ocean University, ChinaReviewed by:
Yongshuang Xiao, Institute of Oceanology (CAS), ChinaCopyright © 2022 Sun, Gozlan, Wu, Xue, Lao, Yu, Zeng, Li, Hardouin, Andreou and Zhang. This is an open-access article distributed under the terms of the Creative Commons Attribution License (CC BY). The use, distribution or reproduction in other forums is permitted, provided the original author(s) and the copyright owner(s) are credited and that the original publication in this journal is cited, in accordance with accepted academic practice. No use, distribution or reproduction is permitted which does not comply with these terms.
*Correspondence: Qun Zhang, dHF6aGFuZ0BqbnUuZWR1LmNu
†These authors have contributed equally to this work
Disclaimer: All claims expressed in this article are solely those of the authors and do not necessarily represent those of their affiliated organizations, or those of the publisher, the editors and the reviewers. Any product that may be evaluated in this article or claim that may be made by its manufacturer is not guaranteed or endorsed by the publisher.
Research integrity at Frontiers

Learn more about the work of our research integrity team to safeguard the quality of each article we publish.