 Weifeng Yang
 Xiufeng Zhao
 Minfang Zheng
- 1State Key Laboratory of Marine Environmental Science, Xiamen University, Xiamen, China
- 2College of Ocean and Earth Sciences, Xiamen University, Xiamen, China
Coastal acidification has been widely investigated in terms of its rationale and ecological effects in the last decade. However, the driving mechanism for acidification in open seawater, especially in mesopelagic water, is still poorly understood. Here, the sinking velocity and flux attenuation of particulate organic carbon (POC) were examined based upon the radioactive 210Po-210Pb tracer to reveal the remineralization of POC in the mesopelagic zone in the northeastern South China Sea (SCS). Overall, the profiles of 210Po followed those of 210Pb, lending support to the particle sinking controlled top-down deficits of 210Po. Using an inverse model, the sinking velocity of particles, for the first time in the SCS, was estimated to vary from 3 to 34 m d-1 with the mean value of 15 ± 9 m d-1, indicating that the slow sinking particles largely contribute to the POC flux in the SCS. Beneath the euphotic zone, a consistent descending of the sinking speed implied continuous remineralization of sinking POC in the twilight zone. A preliminary estimate revealed that 1.9-5.4 mmol-C m-2 d-1 remineralized back to carbon dioxide within 100-500 m, representing about 70% of the exported autochthonous POC from the euphotic zone. In 100-1000 m, 2.4-6.6 mmol-C m-2 d-1 (i.e., 84%) remineralized. Thus, the upper twilight zone (i.e., 100-500 m) is the dominant layer of POC remineralization, and POC-induced acidification could be unneglectable there. These results provided insights into the POC-induced acidification mechanism in the mesopelagic water, especially in the upper mesopelagic layer.
Introduction
Ocean acidification has attracted attention in the past decade due to its significant environment effects, especially for calcifying organisms (e.g., shellfish) (Ekstrom et al., 2015; Fujii et al., 2021). Reports indicate that ocean acidification is associated with many factors, e.g., CO2 sequestration, organic degradation, biological respiration, upwelling, extreme events, etc. (Guo et al., 2022). On the global scale, the increase in atmospheric CO2 is the main forcing of ocean acidification while local processes (e.g., eutrophication and extreme events) sometimes dominate in regional seas (Cai et al., 2011; Niemi et al., 2021; Na et al., 2022). With the increase of CO2 in atmosphere, it is expected that ocean acidification would be enhanced in the near future via more sequestration of CO2 and stratification induced by global warming (Guo et al., 2022). To date, most studies of acidification focused geographically on coastal seas and shelf regions (Yamamoto-Kawai et al., 2021) because these areas are often subjected to enhanced acidification resulting from eutrophication-associated hypoxia (Cai et al., 2011; Song et al., 2020). With extensive investigations, the driving forcing and mechanisms of acidification in shallow seas are well understood (Guo et al., 2022). In contrast, ocean acidification in the open seawater offshore has been less examined though it probably occurs with the climate change. In fact, A few case studies reveal discernible acidification in open seawater, even mesopelagic and deep water. For example, acidification has been confined in the upper halocline and deep water of the Canada Basin and the Beaufort Sea as revealed by the declined aragonite saturation since the 1970s (Miller et al., 2014; Zhang et al., 2020) and was observed below 150 m in the Amundsen Gulf (Niemi et al., 2021). A recent study reported that the concentration of dissolved inorganic carbon increased by ~11 μmol kg-1 below 500 m since 1999 in the Japan Sea, showing fast acidification (Na et al., 2022). Thus, acidification research in open seawater is needed to improve our understanding of the ocean acidification in various oceanic settings.
Although acidification in the open oceans has already received attention, the driving forces, mechanisms, and temporal evolution are still poorly understood (Guo et al., 2022). The concurrently occurring increase in acidification and apparent oxygen utilization (AOU) indicate the organic matter decomposition-induced acidification in deep water of the Japan Sea (Na et al., 2022). Globally, the surface ocean exports a large amount of POC to the ocean interior (Buesseler et al., 2020). However, the worldwide deployment of sediment traps reveals that POC sinking into the lower mesopelagic and even abyssal waters were much less than the magnitude out of the euphotic zone (Lutz et al., 2002; Boyd and Trull, 2007). During settling, a part of POC remineralized or decomposed back into CO2 in the ocean interior (Kwon et al., 2009) as highlighted by the Martin curves (Martin et al., 1987). Thus, the remineralization or decomposition of sinking POC could enhance the acidification in the mesopelagic water in the open seas. Owing to the costs of sediment trap deployment, the big data set of trap-collected POC flux is usually limited to low vertical resolution (Boyd and Trull, 2007), which disapproves our evaluation of the acidification driven by POC remineralization in the ocean interior. Recently, an inverse model approach has been developed based upon the traditional 210Po-210Pb box model to constrain the relatively high-resolution sinking velocity of particles (Villa-Alfageme et al., 2014, 2016; De Soto et al., 2018). This approach set up a foundation for using 210Po-derived sinking speed to estimate the POC flux in the twilight zone.
210Po is a particle-active nuclide produced by 210Pb via the intermediate 210Bi in seawater with a little input from atmospheric deposition (Verdeny et al., 2009; Ma et al., 2017). With the sorption of both 210Po and 210Pb onto particles and successive sinking, parts of the two nuclides are carried to deeper water. Owing to the very short half-life of 210Po (t1/2 = 138.4d) comparing with 210Pb (t1/2 = 22.3 yr) and the stronger particle reactivity of 210Po (Yang et al., 2013), 210Po often showed deficit relative to 210Pb in the surface-mesopelagic waters (Yang et al., 2021). Usually, the extent of 210Po deficit is associated with the magnitude of particle sinking. Thus, the disequilibrium has been used to constrain particle-associated particle dynamic parameters, e.g., the sinking flux (Yang et al., 2021) and sinking velocity (Villa-Alfageme et al., 2014, 2016).
To preliminarily attest the application of 210Po-210Pb to constraining the sinking flux of POC in the mesopelagic water and the potential influence of POC remineralization on acidification in the ocean interior, here, POC, particulate black carbon (chemo-thermal oxidation, i.e., CTO-defined soot), 210Po, and 210Pb were examined at two stations in the northeastern SCS (Figure 1). The SCS is an oligotrophic marginal sea in the western Pacific Ocean with a well-constrained carbon budget in the surface layer (Liu et al., 2018). Our objectives are i) to attest the validity of the application of the inverse 210Po model to quantify the high-resolution sinking velocity of particles in the mesopelagic water in the SCS; ii) to quantify the sinking flux of POC in the mesopelagic zone, and iii) to preliminarily evaluate the remineralization or decomposition degree of autochthonous POC in the twilight zone.
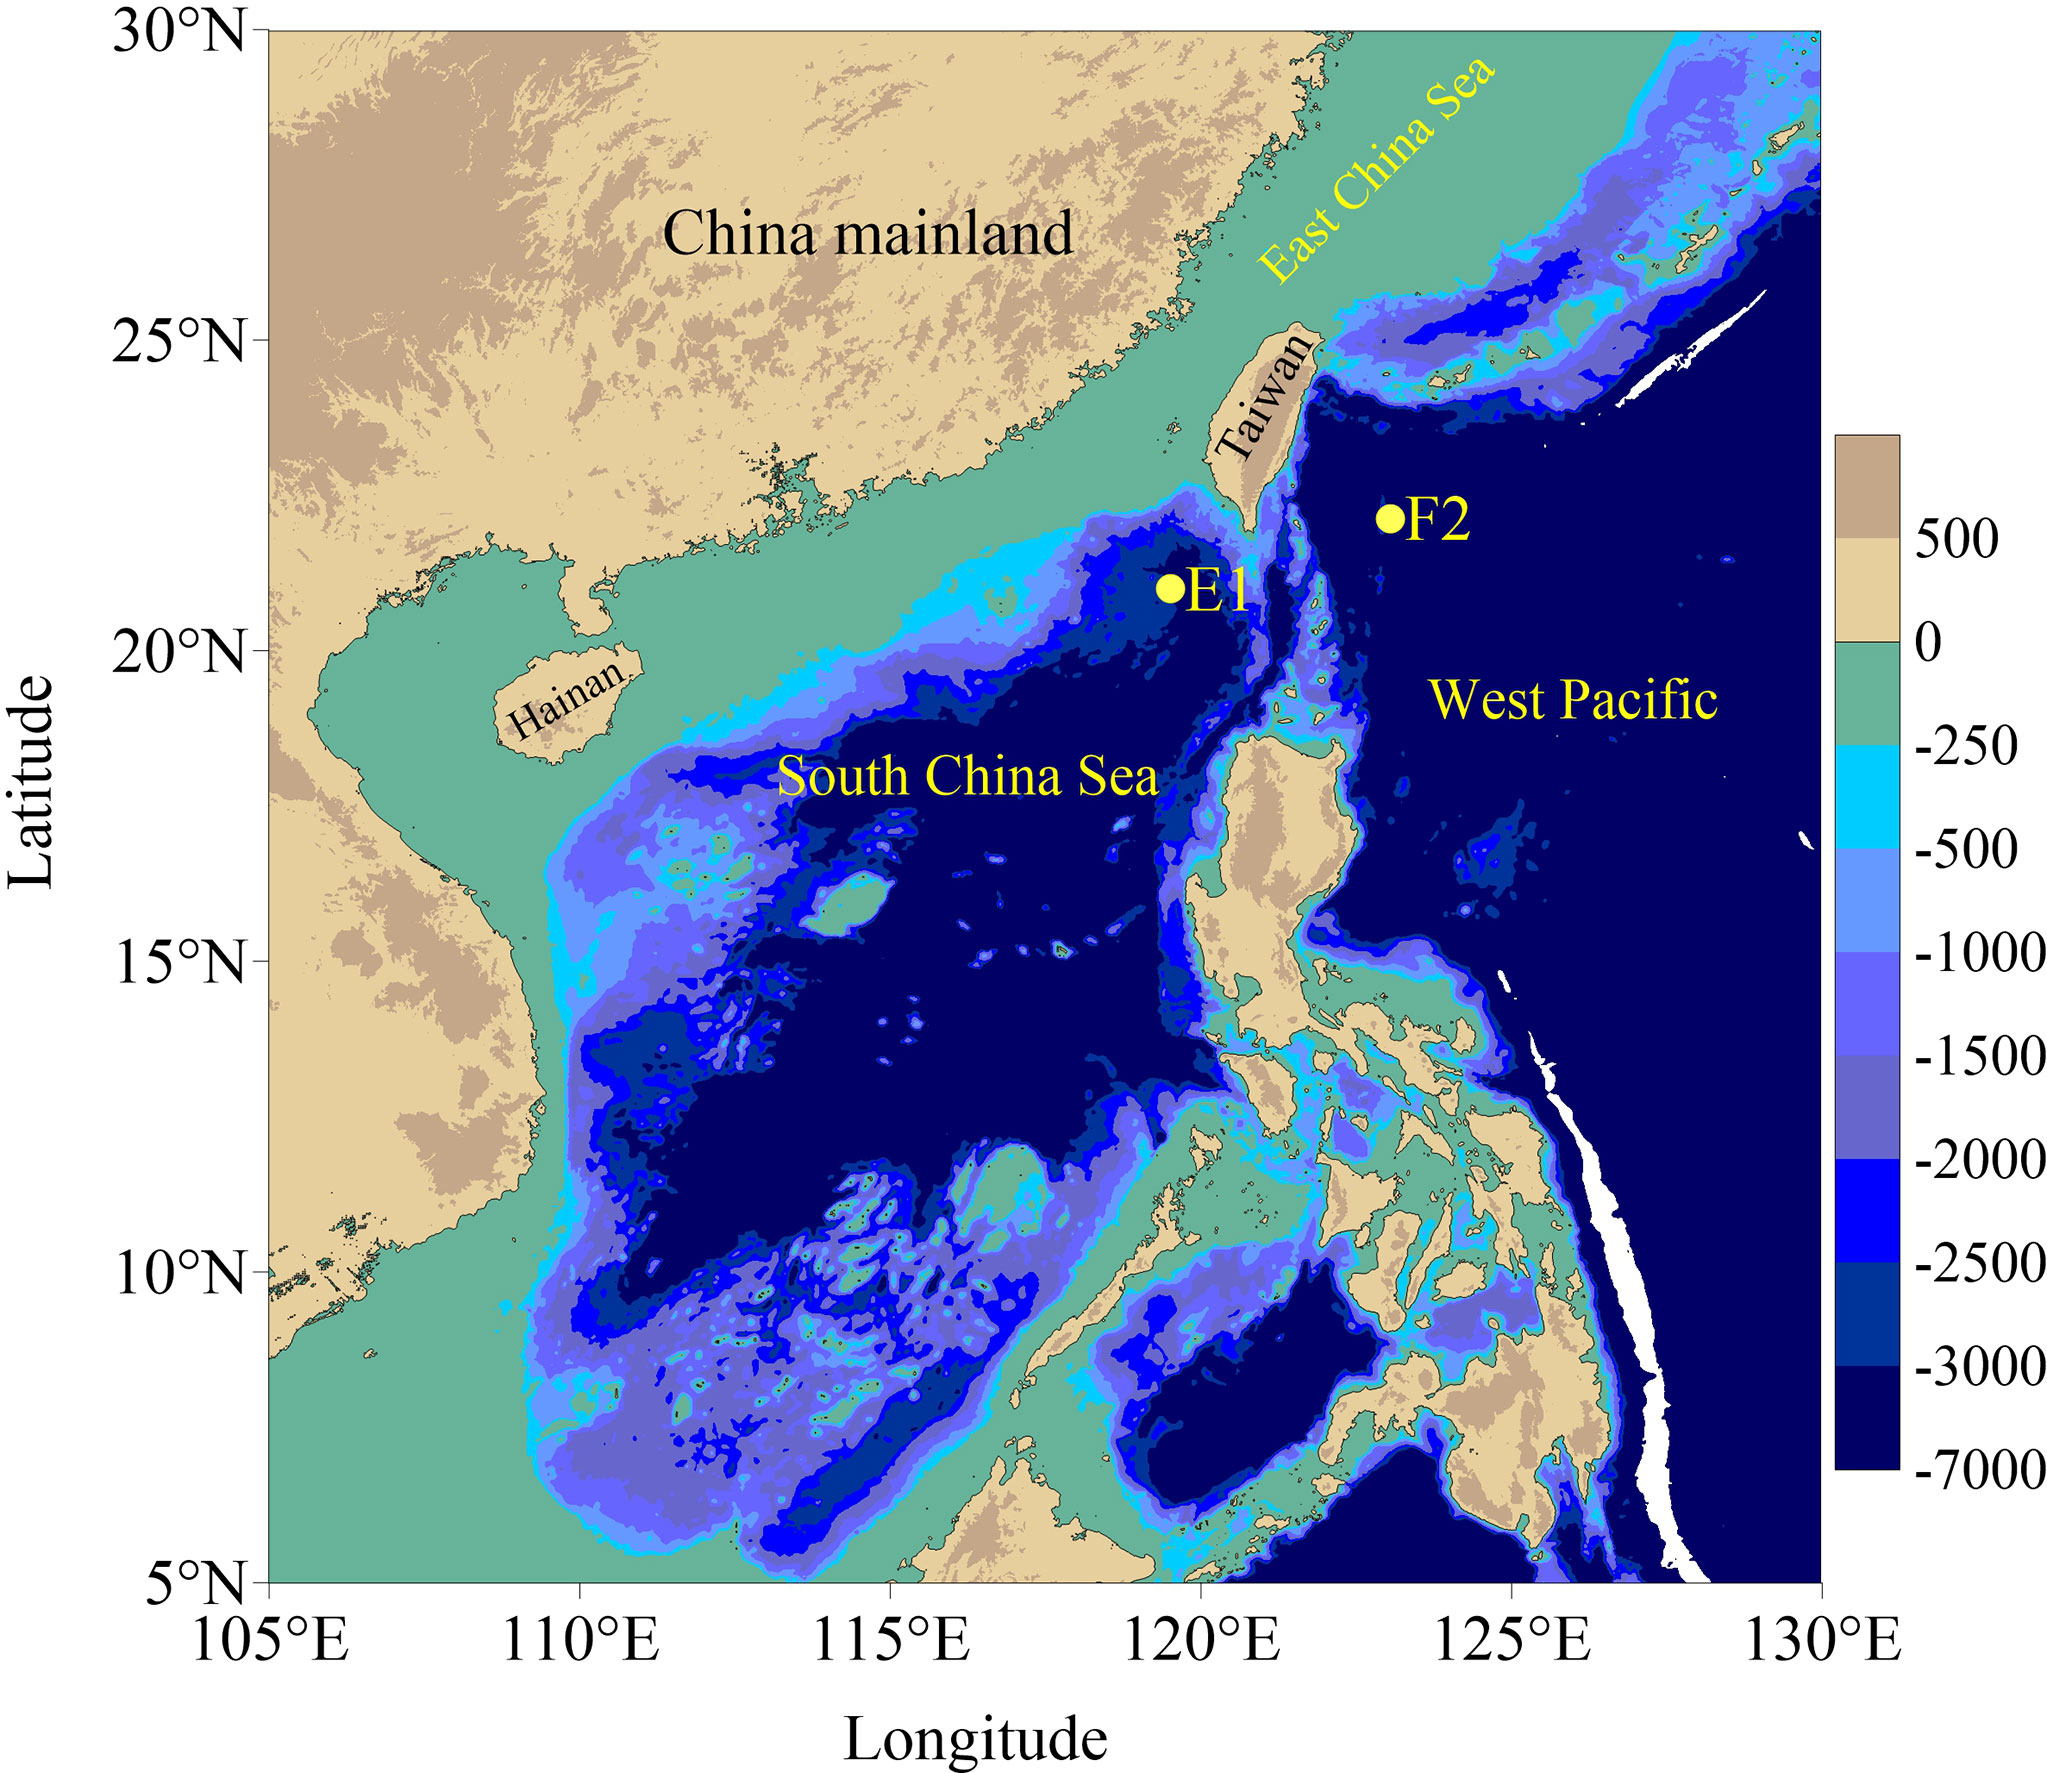
Figure 1 Sampling stations in the northeastern South China Sea (station E1) and western Pacific Ocean (station F2).
Materials and methods
Sampling
Seawater was collected at two stations, i.e., E1 and F2 (Figure 1). Station E1 is located in the northeastern South China Sea (SCS) with a water depth of 3110 m. Station F2 is located in the western Pacific near the SCS with a water depth of 4712 m. Both E1 and F2 represent the open oceanic settings. Seawater at different depths was collected using Niskin bottles attached to a Conductivity, Temperature, Depth (i.e., CTD) rosette system aboard the R/V Dongfanghong 2 from July 15 to 19, 2017, for the measurements of 210Po, 210Pb, total particulate matter (i.e., TPM), particulate black carbon (i.e., PBC, here it is CTO-defined soot), and POC. At each depth, 7-8 L of water was filtrated through a piece of pre-combusted (at 450°C) QMA filter (Whatman™), and POC collected on the filter was de-salted with Milli-Q water and kept at -18°C. 10 L of seawater was filtered through a polycarbonate membrane (Isopore™) to collect TPM and solution for particulate and dissolved 210Po and 210Pb analyses based on the protocols (Church et al., 2012; Rigaud et al., 2013). At selected depths (Table 1), >29 L of seawater was also filtrated through the QMA filters to collect soot samples as described in our previous studies (Yang and Guo, 2014; Yang et al., 2021).
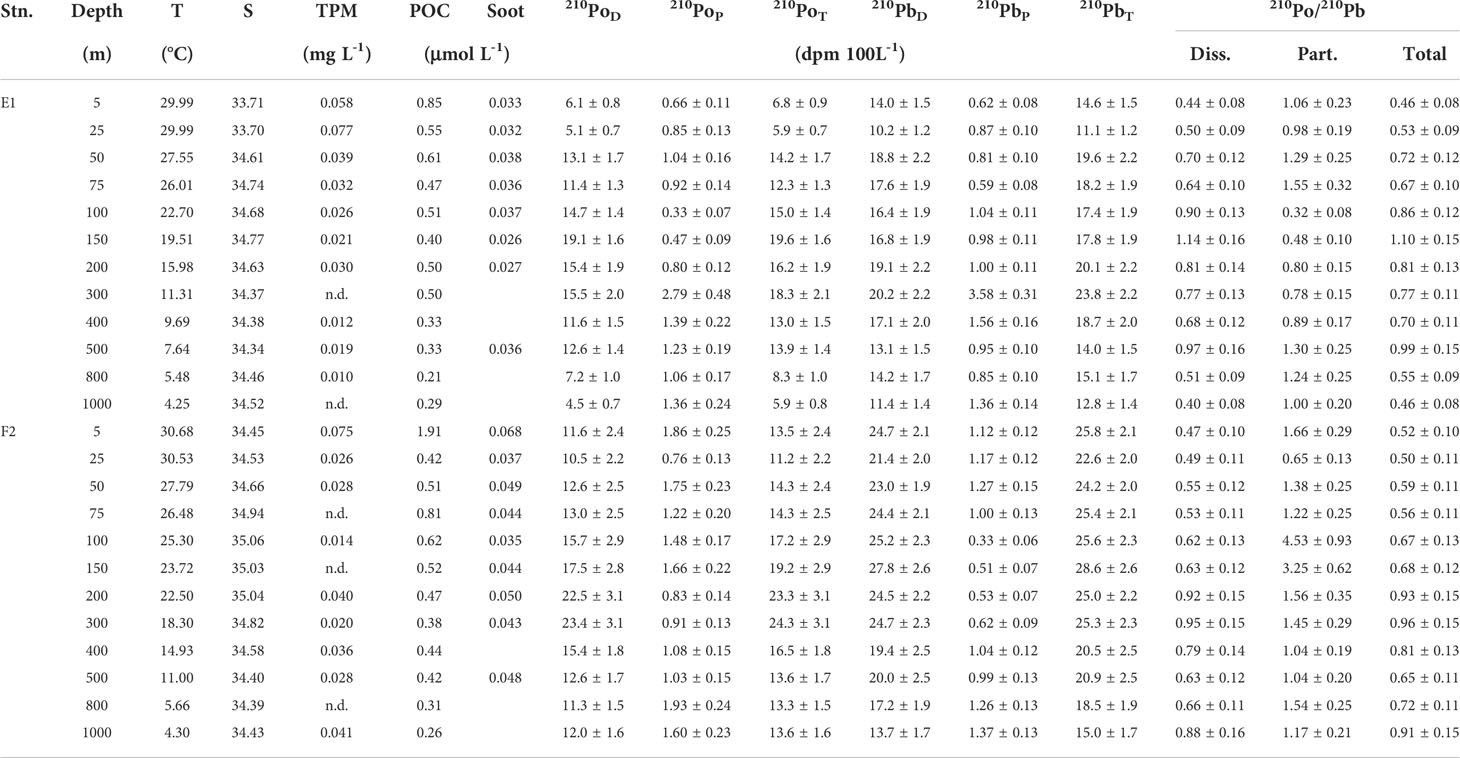
Table 1 Temperature (T) and salinity (S) at stations E1 and F2, concentrations of total particulate matter (TPM), particulate organic carbon (POC), and activity concentrations of dissolved, particulate, and total 210Po and 210Pb, as well as the activity ratios of 210Po to 210Pb.
Analyses of TPM, POC, and soot
All TPM samples (i.e., particulate 210Po samples) were de-salted with Milli-Q water and dried at 60°C to a constant weight. The contents of TPM are based on the difference in weight between blank membranes and membranes with TPM. The POC samples were fumigated using concentrated HCl to remove inorganic carbon. The POC content was measured using an elemental analyzer (Thermo-Fisher Scientific, 1112). The standard material used for POC and soot was IAEA-C8.
For soot measurements, the samples were de-salted and de-carbonated using Milli-Q water and HCl respectively like the POC samples. The contents of soot were determined using the CTO-375 method (Gustafsson et al., 1997, 2001), which has been validated to quantify soot in sediments (Elmquist et al., 2004; Lohmann et al., 2009) and TPM as reported in our previous studies (Yang and Guo, 2014). A NIST standard of 1941b was adopted to ensure data quality. In brief, de-carbonate samples were combusted at 375°C in the presence of air for 24 h to remove organic carbon except for soot. Then, soot on the filters was measured using the same elemental analyzer used for POC determination.
210Po and 210Pb analyses
Briefly, dissolved samples for 210Po and 210Pb analyses were added known amounts of 209Po and stable Pb (in PbNO3) as the chemical yield tracers of 210Po and 210Pb respectively and kept for 24 h to reach the isotopic partition equilibrium. Then, the pH values of the samples were adjusted to 8.0 by adding ammonium hydroxide to form Fe(OH)3 precipitates. After a day, the precipitates were collected via centrifugation. Po- and Pb-contained precipitates were dissolved in 0.5 mol L-1 HCl solution. Ascorbic acid and hydroxylamine hydrochloride were added to reduce Fe3+ and other metal ions and thus prevent the oxidation of silver discs. 209Po and 210Po were auto-plated onto a silver disc at 90°C for 4 h under stirring (Yang et al., 2013, 2015a). Po isotopes on the disc were counted using alpha-spectrometry (ORTEC) after drying.
Particulate samples for 210Po and 210Pb analyses were digested using the mixed HNO3-HClO4-HF after adding 209Po and stable Pb as the chemical yields. The solutions were evaporated to nearly dryness and re-dissolved in 0.5 mol L-1 HCl solution. Po isotopes were deposited onto the silver disc and counted like dissolved samples. 210Pb was determined via the in-growth 210Po 2 years later after the first plating of Po isotopes.
Stable Pb after Po plating was determined using atomic absorption spectrometry. The recoveries of 210Po and 210Pb were calculated through the measured 209Po and stable Pb to those of initially added amounts. The uncertainties for the presented data were propagated from the counting errors. The activity concentrations of 210Po and 210Pb were corrected to the sampling time.
Sinking speed calculation
Villa-Alfageme et al. (2014) developed an inverse modeling approach to constrain the sinking speed of particles based on the traditional 210Po-flux model (Verdeny et al., 2009; Ma et al., 2017). Here, we used this approach to preliminarily estimate the sinking speed of TPM in the marginal SCS. In the study area, the activity of 210Po is determined by its source terms (i.e., generation from in situ decay of 210Pb and sinking from above layer) and sinking terms (i.e., decay itself and sinking to deeper water). Thus, the variation in the total 210Po (APo,T) with time can be expressed as (Villa-Alfageme et al., 2014, 2016):
where APo,T(z,t) and APb,T(z,t) represent the total 210Po and 210Pb activity at the depth of z (in dpm 100L-1) at a specific time of t, respectively. λ is the decay constant of 210Po (in the unit of d-1). PPo,T(z,t) denotes the sinking flux of 210Po (in dpm m-2 d-1) at z depth and the time of t. For a specific depth of z, λPo·APb,T(z,t) and λPo·APo,T(z,t) are the generation rate of 210Po from 210Pb decay and the decay rate of 210Po, respectively. The term of dPPo(z,t)/dz is the net sinking rate of 210Po with particulate sinking, i.e., the difference between the input from the upper layer and output to the layer beneath. The flux of particles can also be quantified by its sinking speed (v in m d-1) multiplied by its concentration (Giering et al., 2016; De Soto et al., 2018), i.e.,
where APo,P(z,t) is the particulate 210Po (dpm 100 L-1), f(z) denotes the percentage of particulate 210Po in the total 210Po. Thus, at a steady state and with the replacement of derivative with a finite difference,
where (z+h) denotes the depth below the point at z with a distance of h. Defining
as proposed by Villa-Alfageme et al. (2014). Eq. (3) is thus converted into Eq. (5),
To obtain δ(z) from Eq. (5) and thus v(z) from Eq. (4), Villa-Alfageme et al. (2014) proposed an inverse utilization of this model. Using the measured APb,T(z) and appropriately tuned δ(z), we can simulate APo,T(z+h) (i.e., APo,T,mod(z+h)) by incorporating the initial value of APo,T(z), which is usually the data collected at the shallowest depth (Villa-Alfageme et al., 2014). When the model well simulates APo,T(z+h), the model-computed APo,T,mod(z+h) should follow Eq. (5), i.e.,
Modeled APo,T,mod(z+h) is calculated via the following equation,
Using a least squares method, the best δ(z) would be obtained when APo,T,mod fits the measured APo,T well with the least chi-square (Villa-Alfageme et al., 2014). Finally, the sinking velocity can be estimated through Eq. (4).
Carbon flux calculation
To convert the sinking velocity of TPM (i.e., v) to that of POC, the multi-variable relationship was adopted (Xiang et al., 2008) here,
where vPOM and vPIM represent the sinking velocities of particulate organic matter (i.e., POM) and inorganic matter besides POM (i.e., PIM), CPOM and CPIM are the contents of POM and PIM (in mg L-1), and CTPM is the concentration of TPM in mg L-1. POM was estimated using the content of POC and the conversion factor of 1.87 in the oceanic regimes with low organic matter (Anderson, 1995; Boyd and Trull, 2007). PIM content is estimated using the content of TPM subtracting POM. The earlier study reported that the sinking velocity of PIM is about 5.5 times that of POM (Xiang et al., 2008). Thus,
The fluxes of organic carbon components (i.e., POCtot, soot, and soot-subtracted POC of POCauto) were estimated using
where Fi and ci represent the flux and concentration of a specific carbon component i.
Results
Overall, E1 showed a comparable temperature (T) to that of F2 within the euphotic zone (0-100 m) (t-test, p>0.61) (Figure 2A). However, E1 was more influenced by river water discharged into the SCS than F2, as was illustrated by the salinity (S) of 33.70-34.74 at E1 and that of 34.45-35.06 at F2 in the euphotic zone (Table 1). In the upper mesopelagic zone (100-500 m), both T and S showed a discernible difference between E1 and F2, showing higher T and S at station F2 (Figure 2A). Below, T and S were consistent at E1 and F2.
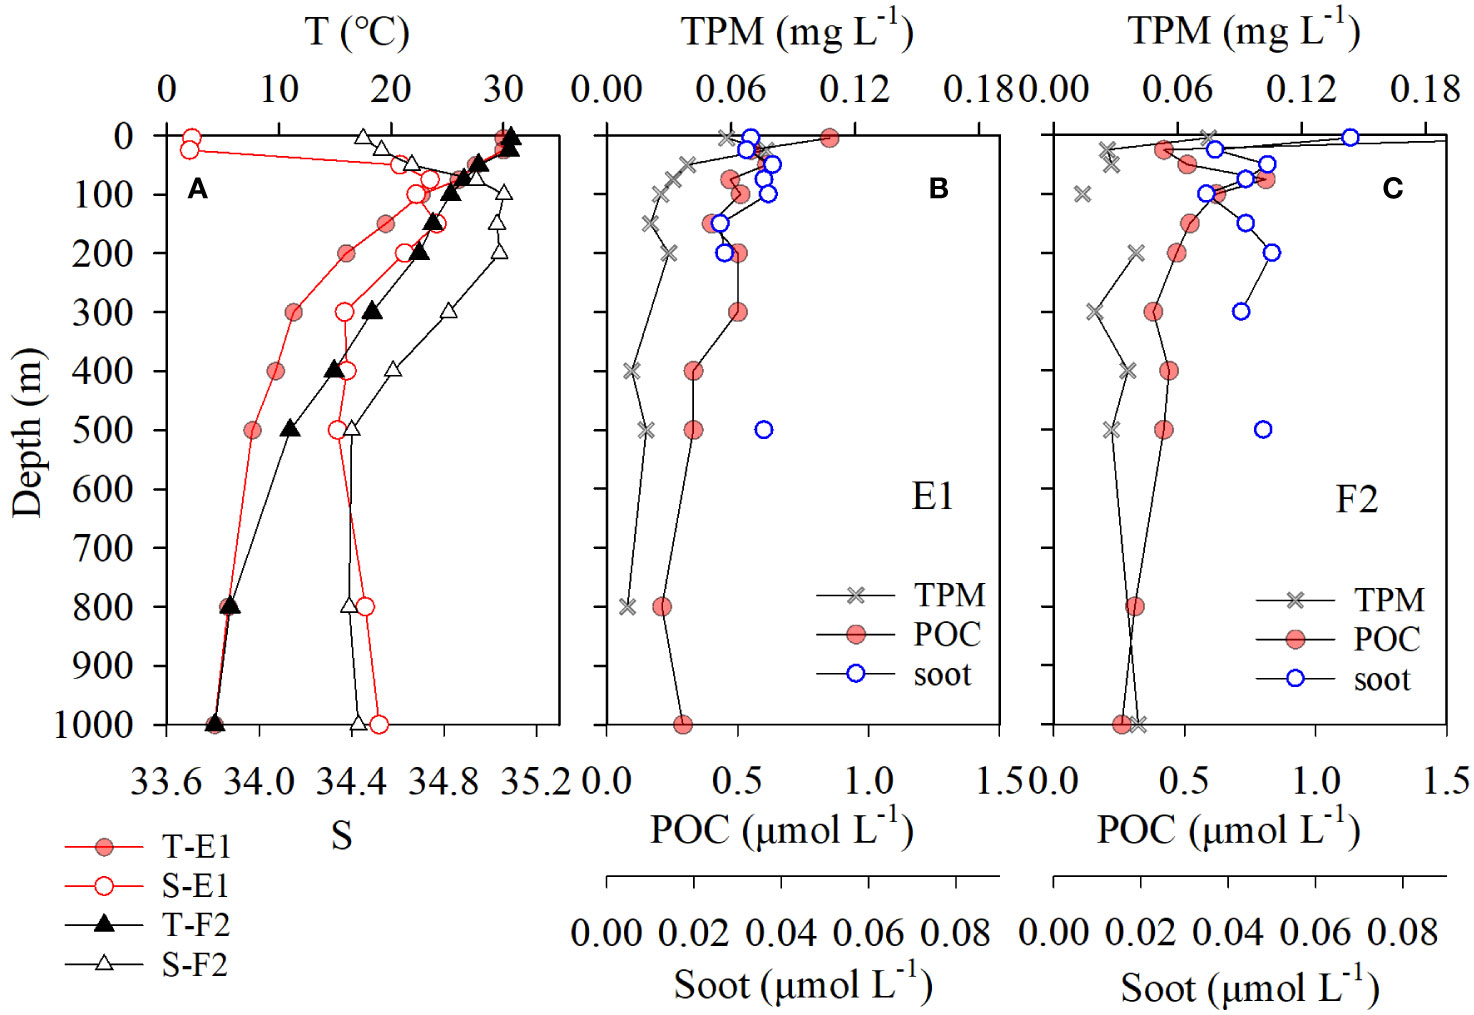
Figure 2 Profiles of T and S at stations E1 and F2 (A), and concentrations of TPM, POC, and soot at E1 (B) and F2 (C).
The total POC (POCtot) concentrations varied from 0.21 to 0.85 μmol-C L-1 at E1 (avg.: 0.46 ± 0.17 μmol-C L-1, mean ± sd) and from 0.26 to 1.91 μmol-C L-1 at F2 (avg.: 0.59 ± 0.44 μmol-C L-1) (Table 1), showing no difference between the two stations (t-test, p>0.36). Similar to other reports in adjacent northeastern SCS (Yang et al., 2021, 2022), high POC values were observed between 50 m and 75 m. Below the euphotic zone of ~100 m, POCtot decreased with depth, exhibiting a typical re-mineralization pattern. The soot concentrations varied from 0.026 to 0.038 μmol-C L-1 and from 0.035 to 0.068 μmol-C L-1 (Table 1) at E1 and F2, respectively. On average, E1 (avg.: 0.035 ± 0.007 μmol-C L-1) showed lower value than F2 (avg.: 0.046 ± 0.010 μmol-C L-1) (t-test, p<0.01). The soot contents were much lower than those of 0.064 to 0.165 μmol-C L-1 reported over the slope of the northeastern SCS (Yang et al., 2021), corresponding to the less influence of black carbon emission offshore. Overall, the soot concentration did not show a clear increase or decrease pattern with depth (Figures 2B, C), consistent with its refractory nature.
The total 210Po and 210Pb activity concentrations varied from 5.9 to 19.6 dpm100L-1 (avg.: 12.4 ± 4.7 dpm 100L-1) and from 11.1 to 23.8 dpm 100L-1 (avg.: 16.9 ± 3.5 dpm 100L-1) at E1, respectively (Table 1). At station F2, the total 210Po and 210Pb ranged from 11.2 to 24.3 dpm100L-1 (avg.: 16.2 ± 4.1 dpm 100L-1) and from 15.1 to 28.4 dpm 100L-1 (avg.: 22.9 ± 3.7 dpm 100L-1). At both E1 and F2, 210Po showed an overall deficit relative to 210Pb in the water column (Figure 3).
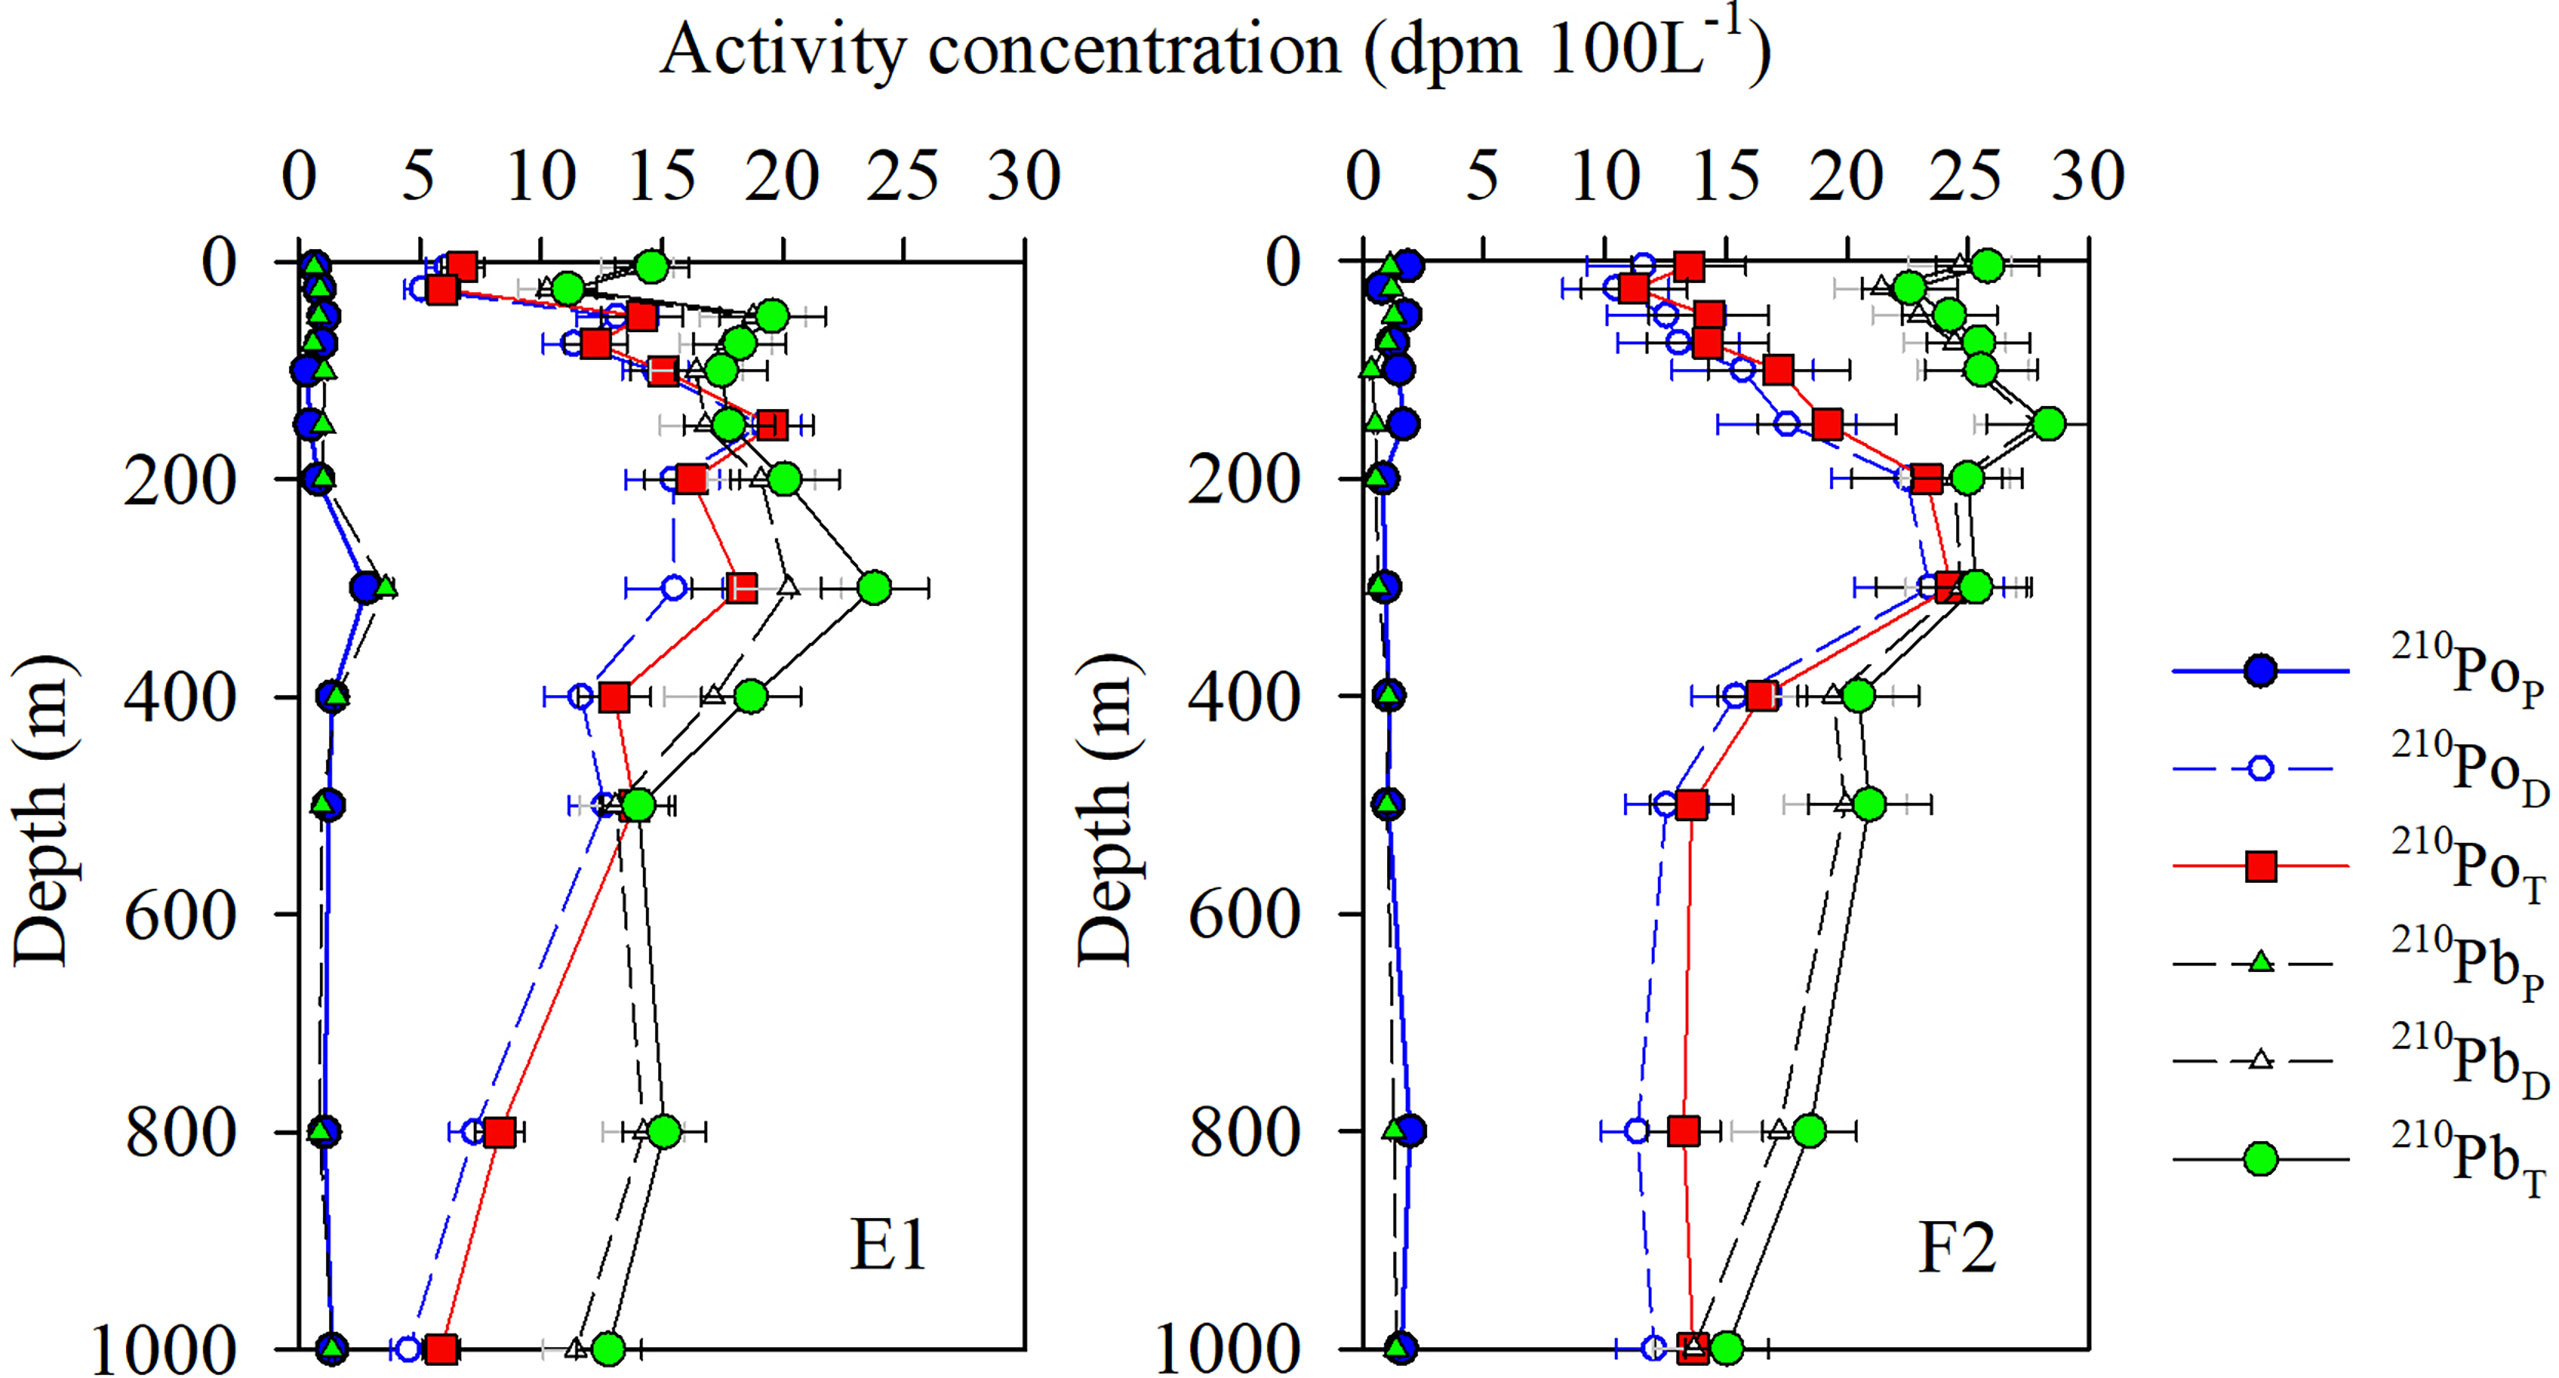
Figure 3 Profiles of in situ 210Po and 210Pb in dissolved (210PoD), particulate (210PoP), total fractions (210PoT), and the 210Po/210Pb ratios at stations E1 and F2.
The sinking velocity varied from 3 to 34 m d-1 with an average of 15 ± 9 m d-1, showing similar profiles at E1 and F2 (Figure 4). The sinking fluxes of POCtot showed descending patterns with depth (Figure 5), ranging from 0.42 ± 0.09 to 3.05 ± 0.73 mmol-C m-2 d-1 at E1 and from 0.82 ± 0.14 to 8.34 ± 1.71 mmol-C m-2 d-1 at F2. Soot showed little variation in the flux below the euphotic zone, averaging 0.107 ± 0.038 mmol-C m-2 d-1 and 0.363 ± 0.039 mmol-C m-2 d-1 at E1 and F2 respectively. By subtracting the allochthonous soot, the autochthonous POC (i.e., POCauto) flux exhibited classic decrease patterns with depth from the base of the euphotic zone (i.e., ~100 m) to the twilight zone (Figure 5). The POCauto fluxes were 2.83 ± 0.73 and 7.87 ± 1.72 mmol-C m-2 d-1 out of the euphotic zones of E1 and F2, respectively. In the twilight zones, E1 showed a POCauto flux range of 0.94-1.98 mmol-C m-2 d-1, and F2 showed a range of 2.47-3.28 mmol-C m-2 d-1 (Figure 5).
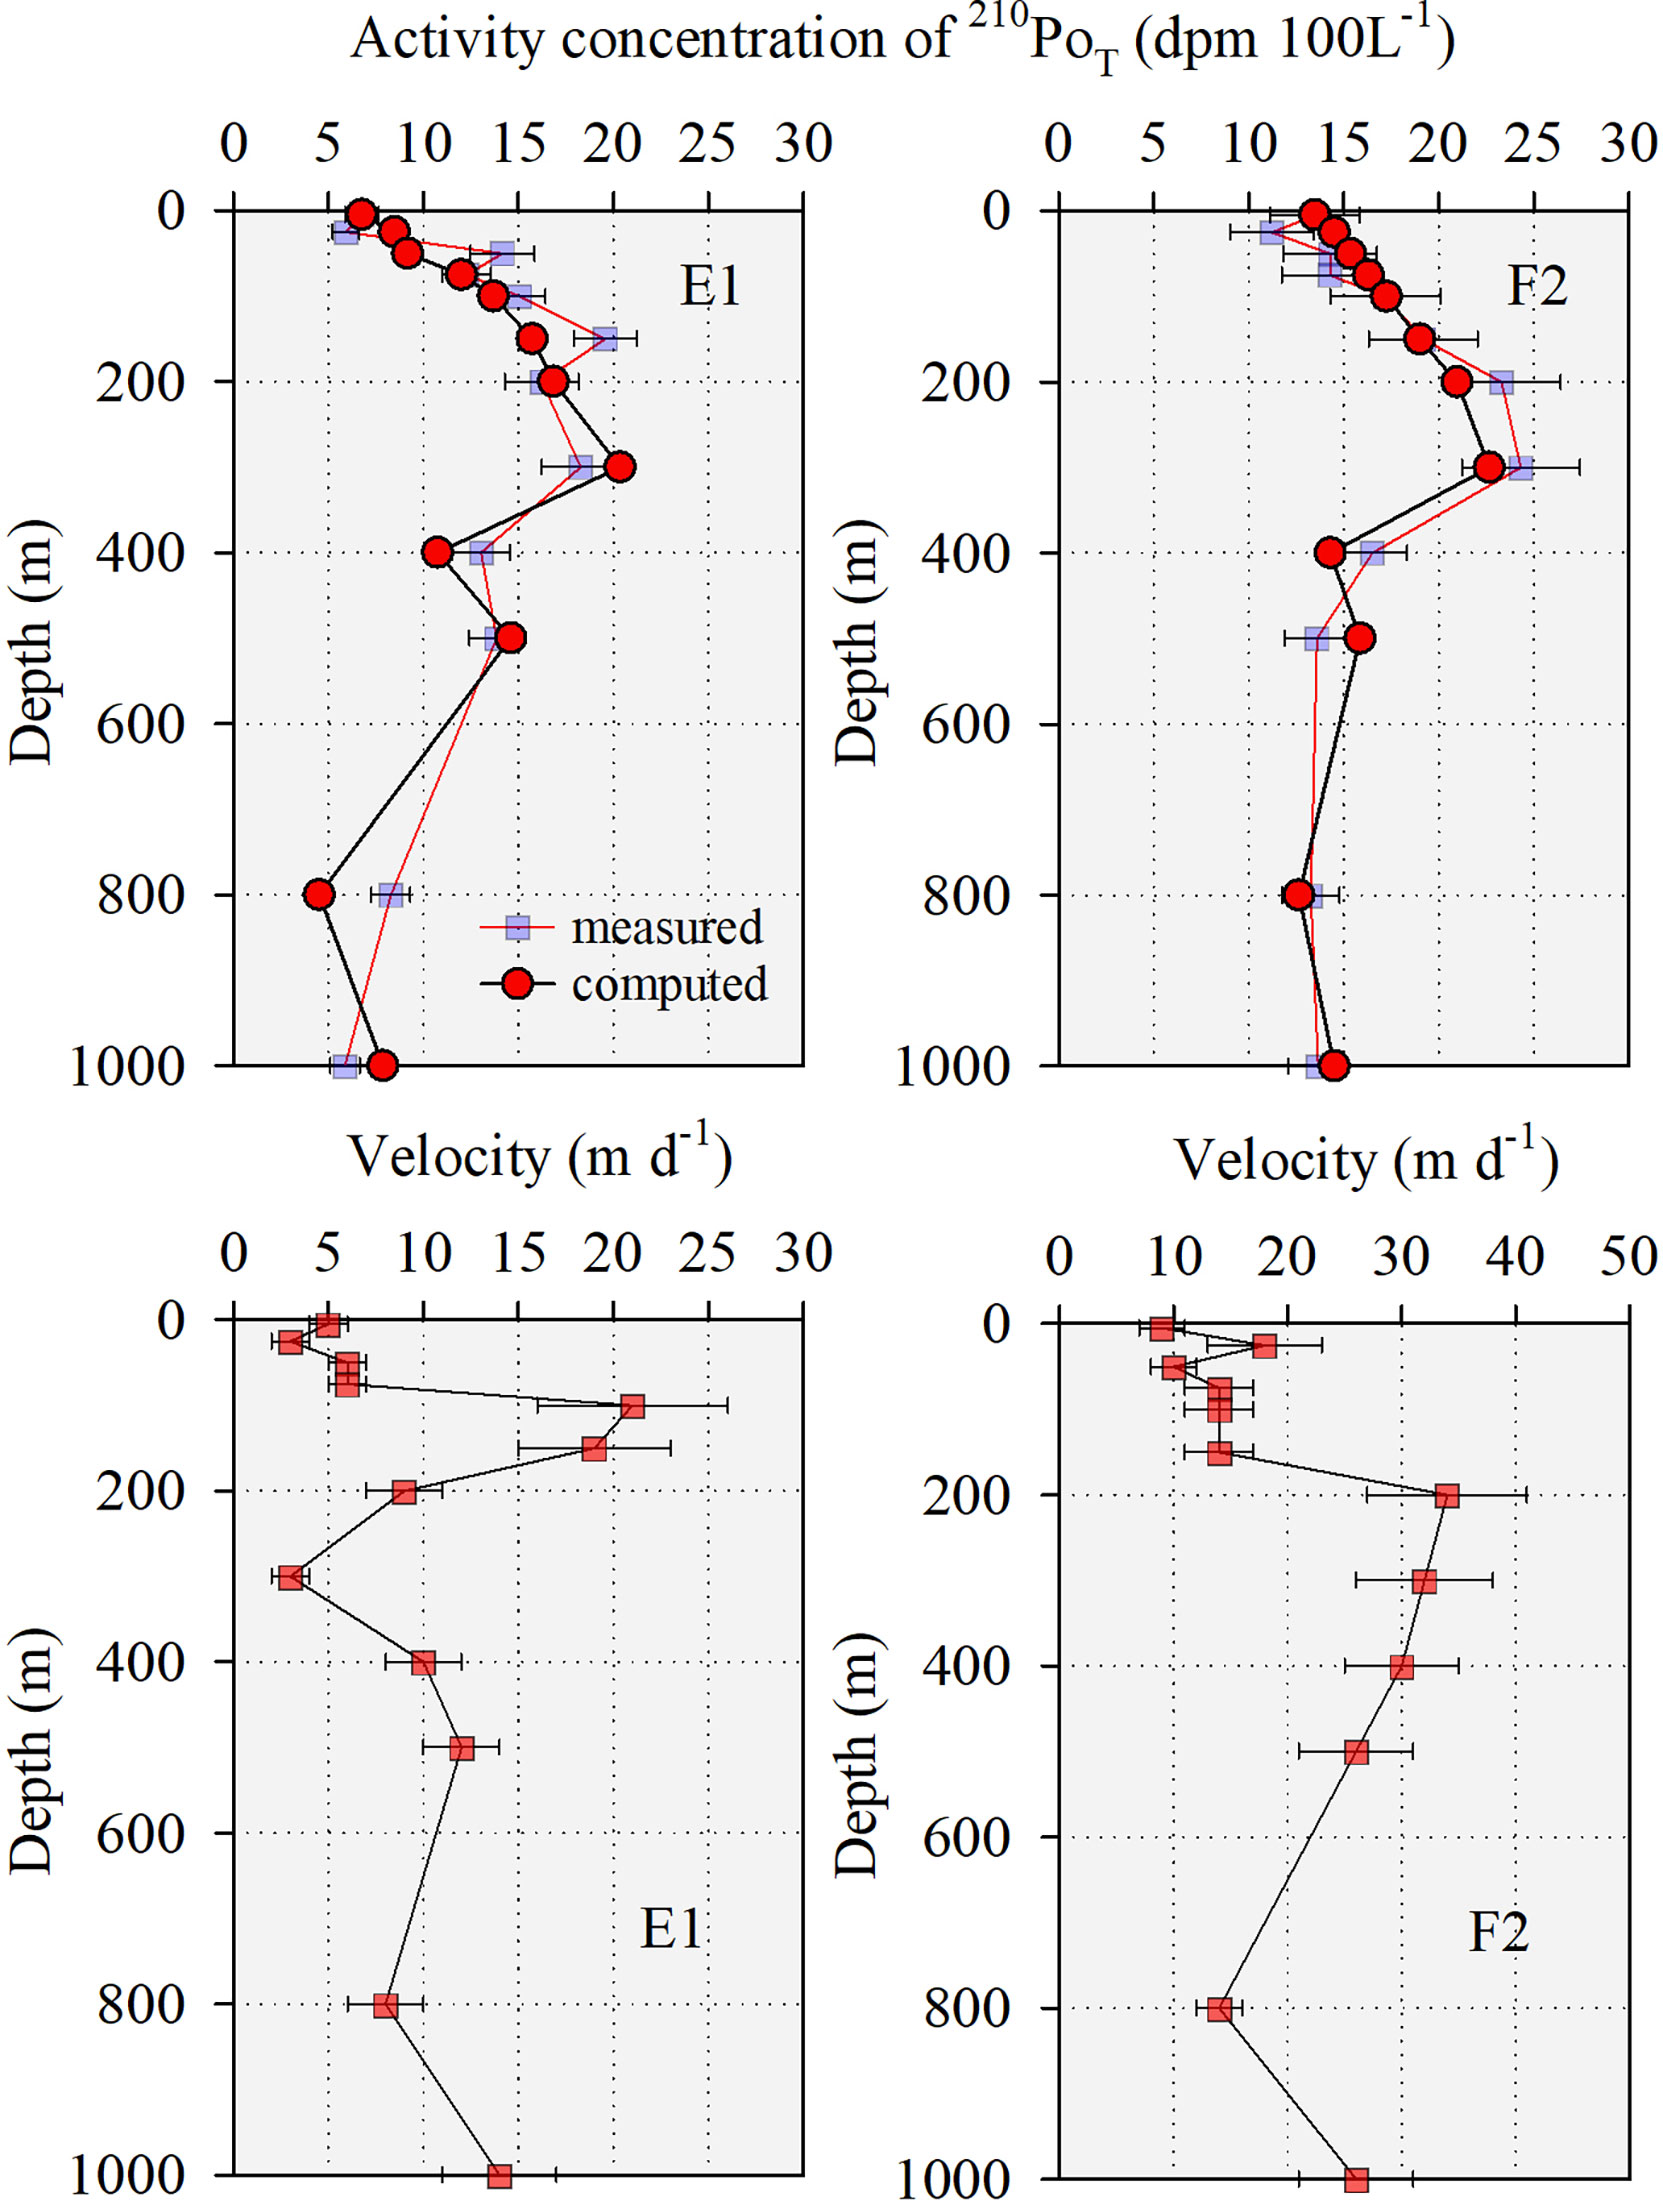
Figure 4 Comparisons between measured and model-computed total 210Po and 210Po-derived sinking velocity of TPM at stations E1 and F2.

Figure 5 Variations of POC and soot fluxes at stations E1 and F2.
Discussion
Control of 210Po deficits in the water column
As shown in Figure 3, the profiles of 210Po overall followed those of 210Pb in the whole water column at both E1 and F2 although the magnitudes of deficit, depending on the sinking intensity of 210Po with TPM, were different at various depths. Similar observations were reported in the SCS basin (Wei et al., 2014; Ma et al., 2017; Yang et al., 2021). These distribution patterns lent support to the application of 210Po-210Pb to constrain the sinking velocity of particles below the euphotic zone (Villa-Alfageme et al., 2014; De Soto et al., 2018). This scenario indicated that 210Po is dominantly from in situ decay of 210Pb, and that particle sinking largely controls the deficit of 210Po relative to 210Pb in the study basin. In fact, the profiles of different particulate components lent support to this view (Figure 2). For example, TPM showed a classical pattern with high contents in the productive euphotic zone and decreased with depth below. POCtot also exhibited an exponential descending below the euphotic zones (Figures 2B, C), showing characteristics of the open ocean. A series of recent investigations observed the cross-shelf disperse of benthic shelf/slope nepheloid into the northern SCS basin (Ma et al., 2017; Shih et al., 2019), as was verified by the elevated TPM and POCtot contents in the twilight water than the productive euphotic zones (Yang et al., 2021, 2022) and mechanically interpreted by the internal solitary waves (Jia et al., 2019). However, these phenomena were not observed at stations E1 and F2 (Figure 2), supporting little influence of shelf-basin interaction on the study area. In addition, soot did not show a discernible increase with depth at the two stations (Figure 2), further corroborating the view. Thus, all the vertical patterns of TPM, POCtot, and soot indicated that the deficits of 210Po in the study basin are dominantly controlled by the particle sinking, i.e., TPM-driven top-down control, which enabled us to evaluate the sinking speed of TPM using the 210Po-210Pb pair (Villa-Alfageme et al., 2014, 2016).
210Po-derived sinking speed of particles
As shown in Figure 4, model-computed 210Po well predicted the measured 210Po activity concentrations at both E1 and F2, lending support to the validity of the application of the inverse model approach to the SCS. The 210Po-derived sinking velocity of TPM ranged from 3 to 21 m d-1 at E1 and from 9 to 34 m d-1 at F2 (Figure 4), averaging 10 ± 6 m d-1 and 20 ± 9 m d-1, respectively. These values fell within the scope of the slow sinking particles, e.g., operationally termed 0.7-11 m d-1 (Alonso-González, et al., 2010),< 10 m d-1 (Riley et al., 2012; Villa-Alfageme et al., 2014), and< 20 m d-1 (Baker et al., 2017). The mooring-sediment traps at 1003 m and 3226 m depths estimated the sinking velocity of the diatom-related particles was ~30-50 m d-1 in the SCS basin (Ran et al., 2015). Based upon radioactive cesium (137Cs) collected by a time-series mooring sediment trap, particles showed the sinking velocity of about 50 m d-1 at station K2 in the northwestern Pacific Ocean (Honda and Kawakami, 2014). Usually, this type of traps collects fast sinking particles and diatom detritus have large sinking speed due to its ballasting effect (Boyd and Trull, 2007; Hung et al., 2012). Thus, the filter-collected particles in our study mainly represent the slow sinking particles.
The sinking velocity showed similar profiles at E1 and F2, i.e., lower values in the euphotic zones, maxima at the base of the euphotic zones or beneath, then a downward decrease to different depths, and an increasing pattern to deep water (Figure 4). The euphotic zones, characterized by active primary production, grazing, and water mixing, usually showed the lowest sinking velocity of particles as observed at the Porcupine Abyssal Plain (PAP) site in the North Atlantic (Villa-Alfageme et al., 2014). The euphotic zone is about 100 m in the SCS basin (Cai et al., 2015) and about 117 m determined at a station P4 close to F2 (Hung et al., 2012). The high primary production often occurs in the lower euphotic zone in the SCS (Cai et al., 2015; Yang et al., 2015b). Planktonic organisms can accelerate the aggregation of an individual particle by acting as nucleation and thus increase their sinking rate (Riley et al., 2012). In addition, our recent study found that the sticky transparent exopolymer particles (TEP) largely favor the formation of aggregates in the northern SCS (Ge et al., 2022). It is likely that the two factors jointly resulted in the maxima velocity beneath the euphotic zones at E1 and F2. In the upper mesopelagic zones, the sinking velocity decreased from 21 m d-1 (100 m) to 3 m d-1 (300 m) and from 34 m d-1 (200 m) to 14 m d-1 (800 m) at E1 and F2 (Figure 4), respectively. Given the lack of primary production, the net remineralization process could occur in the twilight zone. Results from the Indented Rotating Sphere (IRS) sediment traps indicate that fast sinking particles dominantly contribute to the abyssal POC flux (Alonso-González et al., 2010), supporting the large remineralization of slow sinking particles. Direct biomarker analysis (Riley et al., 2012), compiled from datasets (Lee et al., 2000; Sheridan et al., 2002) suggested that high bioavailability seems to be a general nature of the slowly settling particles (Riley et al., 2012). Probably, aggregates remineralized via the activity of microbes and zooplankton (Sheridan et al., 2002), as was supported by the concurrently descending POC contents (Figure 2) and the quick decrease in the diameter of sediment trap collected particles from 150 m to 300 m at station ALOHA (Cael and White, 2020). With the remineralization, the sinking velocity showed a downward decrease at both E1 and F2 in the upper mesopelagic zones (Figure 4). Owing to the larger speeds at F2, the remineralization spanned a longer distance than E1. When most of the labile components are remineralized, particles mainly consist of small minerals, which usually have higher densities and ballasting effects (Boyd et al., 2019; Li et al., 2022) and high sinking velocities. The increase in sinking velocity with depth in the twilight zone was first reported in the North Atlantic (Villa-Alfageme et al., 2014, 2016). Although the reason behind this pattern is unclear, Villa-Alfageme et al. (2016) suggested possible biogeochemical mechanisms, including shallow remineralization of slow sinking particles, preferential remineralization of POC of larger particles and aggregates, aggregation of ballasting biominerals, and repackaging of sinking matter. Which of the processes that control the downward decrease in the sinking velocity of TPM is a question we cannot address here and is an area for future investigation in the SCS.
Attenuation of the POC flux in the mesopelagic zone
Overall, the sinking fluxes of POCtot showed descending patterns with depth (Figure 5) at E1 and F2. Soot showed little variation in the flux below the euphotic zone, corresponding to its refractory nature in the aphotic zone as observed in our previous studies (Yang and Guo, 2014; Yang et al., 2021). The autochthonous POC (i.e., POCauto) flux showed classic decrease patterns with depth from the base of the euphotic zone (i.e., ~100 m) to the twilight zone (Figure 5). The magnitudes of POCauto flux were comparable to recent reports on the slope of the northern SCS (Yang et al., 2021, 2022) and the northwestern Pacific Ocean (Hung et al., 2012). In the twilight zones, the available POCauto fluxes varied from 1.87 ± 0.94 to 5.97 ± 0.55 mmol-C m-2 d-1 in the northern SCS (210Po-soot coupling method, Yang et al., 2021) and from 0.7 ± 0.3 to 6.0 ± 0.3 mmol-C m-2 d-1 at sites to the north of F2 (sediment trap method and calculated by the flux in mmol-C m-2 h-1 multiplied by 24 h) (Hung et al., 2012). Our results were comparable to these results, lending supports to the validity of using 210Po-derived sinking velocity to constrain the POC flux in the mesopelagic water in the SCS.
The profiles of POCauto flux at E1 and F2 enable us to evaluate the attenuation of autochthonous POC during settling in the study areas. By normalizing the POCauto flux at a specific depth in the twilight zone, we obtained the Martin curves of Fz/F100 = (z/100)-0.77 ± 0.09 (R2 = 0.79, p<0.05) at station E1 and Fz/F100 = (z/100)-0.80 ± 0.07 (R2 = 0.84, p<0.05) at F2 (Figure 6). The consistent b values of 0.77 ± 0.09 and 0.80 ± 0.07 at the two stations were seemingly comparable to 0.70 ± 0.01 observed in August on the slope of the northern SCS (Yang et al., 2021). They are smaller than the 1.33 ± 0.15 observed at station ALOHA (Buesseler et al., 2007), similar to 0.83 ± 0.04 evaluated using data at station BATS (Lutz et al., 2002), and lower than the global mean value of 0.9-1.0 (Kwon et al., 2009). Using the in situ b values, 1.9 ± 0.8 mmol-C m-2 d-1 and 5.4 ± 1.8 mmol-C m-2 d-1 were estimated to remineralize back to CO2 at E1 and F2 before POCauto settling to the mid-mesopelagic depth (i.e., 500 m), representing 68 ± 42% of the POCauto sinking flux out of the euphotic zone. At the bottom of the mesopelagic zone (i.e., 1000 m), the magnitude reached 2.4 ± 0.8 mmol-C m-2 d-1 at E1 and 6.6 ± 1.7 mmol-C m-2 d-1 at F2, i.e., 84 ± 43% of POCauto exported from the euphotic zone remineralized. Although we have not yet parameters to quantify the change in acidification of seawater induced by the POCauto remineralization during the settling in the twilight zone, these preliminary results highlighted that the acidification might mainly occur in the upper twilight layer and POC remineralization is an unneglectable mechanism for acidification in the subsurface ocean. In addition, our results could provide valuable data for further evaluation of the acidification via either modeling or in situ observation focusing on the upper twilight layer.
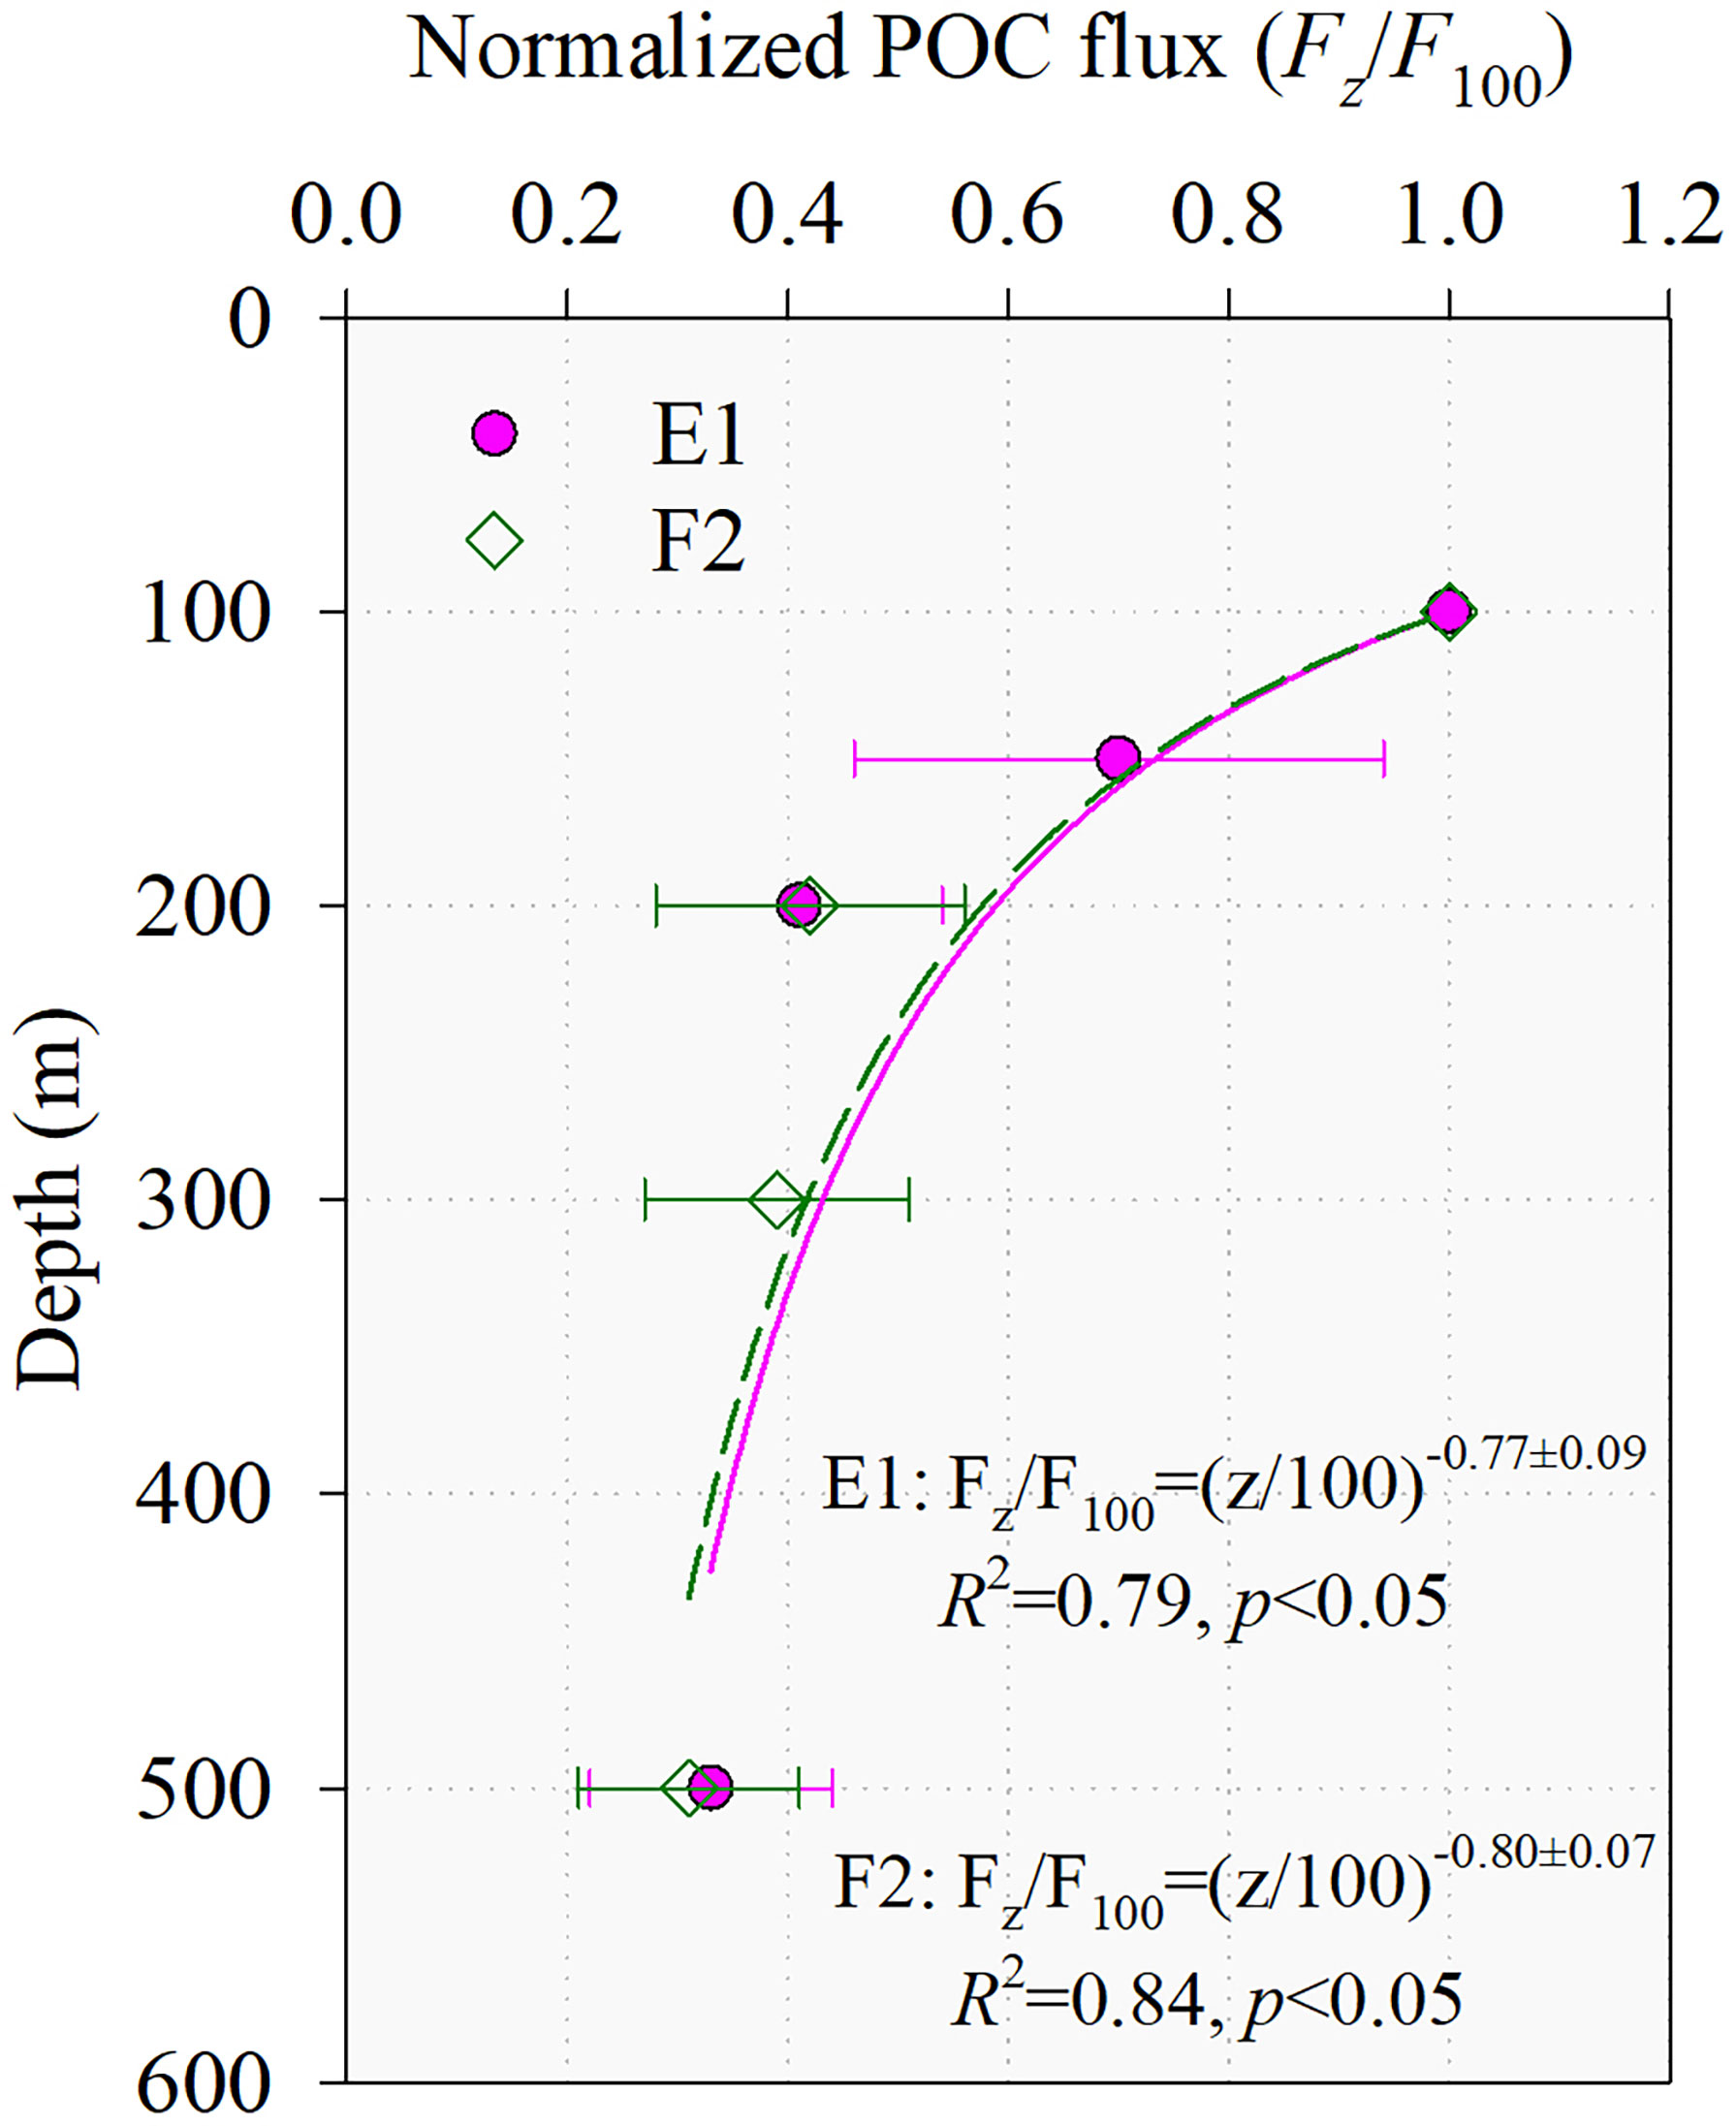
Figure 6 Profiles of normalized fluxes of POC and the Martin curves at stations E1 and F2.
Conclusion
The sinking velocity of particles was, for the first time, constrained in the northeastern SCS. The results indicated that the deficits of 210Po were controlled by particle settling in the basin of the northeastern SCS. The good match between the computed 210Po and in situ measured 210Po validated the application of the inverse-modeling approach to quantify the sinking speed of particles in the SCS. The sinking velocity implied that the filter-collected particulate matter is mainly slow sinking particles. The profiles of sinking velocity, closely relating to the POC aggregation and remineralization, showed the maxima around the base of the euphotic zone and a descending pattern beneath. Using the velocity, the sinking fluxes of autochthonous POC were estimated in the twilight and showed a power-law descending with depth, revealing that about 70% of POC exported from the euphotic zone remineralized to CO2 before settling to 500 m and 84% before reaching 1000 m. These preliminary results indicated that POC sinking and remineralization could play an important role in driving the acidification of seawater in the upper twilight zone in the SCS though extensive investigations are needed.
Data availability statement
The original contributions presented in the study are included in the article/Supplementary Material. Further inquiries can be directed to the corresponding author.
Author contributions
WY conceived and wrote the manuscript. XZ and MZ collected and analyzed the samples. All authors approved the submitted version.
Funding
This study was financially supported by the National Natural Science Foundation of China (Nos. 42076030 and 41476061 to WY). Data and samples were collected onboard R/V Dongfanghong 2 implementing the open research cruise NORC2017-05 supported by NSFC.
Acknowledgments
The authors thank the reviewers and editors for their constructive comments that improved the manuscript and the crew members of the R/V Dongfanghong 2 for their help during sample collection.
Conflict of interest
The authors declare that the research was conducted in the absence of any commercial or financial relationships that could be construed as a potential conflict of interest.
Publisher’s note
All claims expressed in this article are solely those of the authors and do not necessarily represent those of their affiliated organizations, or those of the publisher, the editors and the reviewers. Any product that may be evaluated in this article, or claim that may be made by its manufacturer, is not guaranteed or endorsed by the publisher.
References
Alonso-González I. J., Arístegui J., Lee D., Sanchez-Vidal A., Calafat A., Fabrés J., et al. (2010). Role of slowly settling particles in the ocean carbon cycle. Geophys. Res. Lett. 37, L13608. doi: 10.1029/2010GL043827
Anderson L. (1995). On the hydrogen and oxygen content of marine phytoplankton. Deep-Sea Res. I 42, 1675–1680. doi: 10.1016/0967-0637(95)00072-E
Baker C. A., Henson S. A., Cavan E. L., Giering S. L. C., Yool A., Gehlen M., et al. (2017). Slow-sinking particle organic carbon in the Atlantic ocean: Magnitude, flux, and potential controls. Glob. Biogeochem. Cy. 31, 1051v1065. doi: 10.1002/2017GB005638
Boyd P. W., Claustre H., Levy M., Siegel D. A., Weber T. (2019). Multi-faceted particle pumps drive carbon sequestration in the ocean. Nature 568, 327–335. doi: 10.1038/s41586-019-1098-2
Boyd P. W., Trull T. W. (2007). Understanding the export of biogenic particles in oceanic waters: Is there consensus? Prog. Oceanogr. 72, 276–312. doi: 10.1016/j.pocean.2006.10.007
Buesseler K. O., Benitez-Nelson C. R., Roca-Martí M., Wyatt A. M., Resplandy L., Clevenger S. J., et al. (2020). High-resolution spatial and temporal measurements of particulate organic carbon flux using 234Th in the northeast pacific ocean during the export processes in the ocean from RemoTe sensing field campaign. Elem. Sci. Anth. 8, 1. doi: 10.1525/elementa.030
Buesseler K. O., Lamborg C. H., Boyd P. W., Lam P. J., Trull T. W., Bidigare R. R., et al. (2007). Revisiting carbon flux through the ocean’s twilight zone. Science 316, 567–570. doi: 10.1126/science.1137959
Cael B. B., White A. E. (2020). Sinking versus suspended particle size distributions in the north pacific subtropical gyre. Geophys. Res. Lett. 47, e2020GL087825. doi: 10.1029/2020GL087825
Cai W.-J., Hu X., Huang W.-J., Murrell M. C., Lehrter J. C., Lohrenz S. E., et al. (2011). Acidification of subsurface coastal waters enhanced by eutrophication. Nat. Geosci. 4, 766–770. doi: 10.1038/ngeo1297
Cai P., Zhao D., Wang L., Huang B., Dai M. (2015). Role of particle stock and phytoplankton community structure in regulating particulate organic carbon export in a large marginal sea. J. Geophys. Res. Oceans 120, 2063–2095. doi: 10.1002/2014JC010432
Church T. M., Rigaud S., Baskaran M., Kumar A., Friedrich J., Masqué P., et al. (2012). Intercalibration studies of 210Po and 210Pb in dissolved and particulate seawater samples. Limnol. Oceanogr. Methods 10, 776–789. doi: 10.4319/lom.2012.10.776
De Soto F., Ceballos-Romero E., Villa-Alfageme M. (2018). A microscopic simulation of particle flux in ocean waters: Application to radioactive pair disequilibrium. Geochim. Cosmochim. Acta 239, 136–158. doi: 10.1016/j.gca.2018.07.031
Ekstrom J. A., Suatoni L., Cooley S. R., Pendleton L. H., Waldbusser G. G., Cinner J. E., et al. (2015). Vulnerability and adaptation of US shellfisheries to ocean acidification. Nat. Clim. Change 5, 207–214. doi: 10.1038/nclimate2508
Elmquist M., Gustafsson Ö, Andersson P. (2004). Quantification of sedimentary black carbon using the chemothermal oxidation method: An evaluation of ex situ pre-treatments and standard additions approaches. Limnol. Oceanogr. Methods 2, 417–427. doi: 10.4319/lom.2004.2.417
Fujii M., Takao S., Yamaka T., Akamatsu T., Fujita Y., Wakita M., et al. (2021). Continuous monitoring and future projection of ocean warming, acidification, and deoxygenation on the subarctic coast of Hokkaido, Japan. Front. Mar. Sci. 8, 590020. doi: 10.3389/fmars.2021.590020
Ge Z., Li Q. P., Yang W., Liu X., Wu Z. (2022). Transparent exopolymer particle dynamics along a shelf-to-sea gradient and impacts on the regional carbon cycle. Sci. Total Environ. 808, 152117. doi: 10.1016/j.scitotenv.2021.152117
Giering S. L. C., Sanders R., Martin A. P., Lindemann C., Möller K. O., Daniels C. J., et al. (2016). High export via small particles before the onset of the north Atlantic spring bloom. J. Geophys. Res. Oceans 121, 6929–6945. doi: 10.1002/2016JC012048
Guo X., Bednaršek N., Wang H., Feely R. A., Laurent A. (2022). Editorial: Acidification and hypoxia in marginal seas. Front. Mar. Sci. 9, 861850. doi: 10.3389/fmars.2022.861850
Gustafsson Ö, Bucheli T. D., Kukulska Z., Andersson M., Largeau C., Rouzaud J.-N., et al. (2001). Evaluation of a protocol for the quantification of black carbon in sediments. Glob. Biogeochem. Cy. 15, 881–890. doi: 10.1029/2000GB001380
Gustafsson Ö, Haghseta F., Chan C., Macfarlane J., Gschwend P. M. (1997). Quantification of the dilute sedimentary soot phase: Implications for PAH speciation and bioavailability. Environ. Sci. Technol. 31, 203–209. doi: 10.1021/es960317s
Honda M. C., Kawakami H. (2014). Sinking velocity of particulate radiocesium in the northwestern north pacific. Geophys. Res. Lett. 41, 3959–3965. doi: 10.1002/2014GL060126
Hung C.-C., Gong G.-C., Santschi H. (2012). 234Th in different size classes of sediment trap collected particles from the northwestern pacific ocean. Geochim. Cosmochim. Acta 91, 60–74. doi: 10.1016/j.gca.2012.05.017
Jia Y., Tian Z., Shi X., Liu J. P., Chen J., Liu X. (2019). Deep-sea sediment resuspension by internal solitary waves in the northern south China Sea. Sci. Rep. 9, 12137. doi: 10.1038/s41598-019-47886-y
Kwon E. Y., Primeau F., Sarmiento J. L. (2009). The impact of remineralization depth on the air-sea carbon balance. Nat. Geosci. 2, 630–635. doi: 10.1038/ngeo612
Lee C., Wakeham S. G., Hedges J. I. (2000). Composition and flux of particulate amino acids and chloropigments in equatorial pacific seawater and sediments. Deep Sea Res. I 47, 1535–1568. doi: 10.1016/S0967-0637(99)00116-8
Liu Q., Guo X., Yin Z., Zhou K., Robert E. G., Dai M. (2018). Carbon fluxes in China seas: An overview and perspective, Sci. China Earth Sci. 161, 1564–1582. doi: 10.1007/s11430-017-9267-4
Li H., Zhang J., Xuan J., Wu Z., Ran L., Wiesner M. G., et al. (2022). Asymmetric response of the biological carbon pump to the ENSO in the south China Sea. Geophys. Res. Lett. 49, e2021GL095254. doi: 10.1029/2021GL095254
Lohmann R., Bollinger K., Cantwell M., Feichter J., Fischer-Bruns I., Zabel M. (2009). Fluxes of soot black carbon to south Atlantic sediments. Glob. Biogeochem. Cy. 23, GB1015. doi: 10.1029/2008GB003253
Lutz M., Dunbar R., Caldeira K. (2002). Regional variability in the vertical flux of particulate organic carbon in the ocean interior. Glob. Biogeochem. Cy. 16, 1037. doi: 10.1029/2000GB001383
Martin J. H., Knauer G. A., Karl D. M., Broenkow W. W. (1987). VERTEX: Carbon cycling in the northeast pacific. Deep Sea Res. A 34, 267–285. doi: 10.1016/0198-0149(87)90086-0
Ma H., Yang W., Zhang L., Zhang R., Chen M., Qiu Y., et al. (2017). Utilizing 210Po deficit to constrain particle dynamics in mesopelagic water, western south China Sea. Geochem. Geophys. Geosyst. 18, 1594–1607. doi: 10.1002/2017GC006899
Miller L. A., Macdonald R. W., McLaughlin F., Mucci A., Yamamoto-Kawai M., Giesbrecht K. E., et al. (2014). Changes in the marine carbonate system of the western Arctic: Patterns in a rescued data set. Polar Res. 33, 20577. doi: 10.3402/polar.v33.20577
Na T., Hwang J., Kim S.-Y., Jeong S., Rho T. K., Lee T. (2022). Large Increase in dissolved inorganic carbon in the East Sea (Japan Sea) from 1999 to 2019. Front. Mar. Sci. 9, 825206. doi: 10.3389/fmars.2022.825206
Niemi A., Bednaršek N., Michel C., Feely R. A., Williams W., Azetsu-Scott K., et al. (2021). Biological impact of ocean acidification in the Canadian Arctic: Widespread severe pteropod shell dissolution in amundsen gulf. Front. Mar. Sci. 8, 600184. doi: 10.3389/fmars.2021.600184
Ran L., Chen J., Wiesner M. G., Ling Z., Lahajnar N., Yang Z., et al. (2015). Variability in the abundance and species composition of diatoms in sinking particles in the northern south China Sea: Results from time-series moored sediment traps. Deep-Sea Res. II 122, 15–24. doi: 10.1016/j.dsr2.2015.07.004
Rigaud S., Puigorbé V., Camara-Mor P., Casacuberta N., Roca-Martí M., GarciaOrellana J., et al. (2013). A methods assessment and recommendations for improving calculations and reducing uncertainties in the determination of 210Po and 210Pb activities in seawater. Limnol. Oceanogr. Methods 11, 561–571. doi: 10.4319/lom.2013.11.561
Riley J. S., Sanders R., Marsay C., Le Moigne F. A. C., Achterberg E. P., Poulton A. J. (2012). The relative contribution of fast and slow sinking particles to the ocean carbon export. Glob. Biogeochem. Cy. 26, GB1026. doi: 10.1029/2011GB004085
Sheridan C. C., Lee C., Wakeham S. G., Bishop J. K. B. (2002). Suspended particle organic composition and cycling in surface and midwaters of the equatorial pacific ocean. Deep Sea Res. Part I 49, 1983–2008. doi: 10.1016/S0967-0637(02)00118-8
Shih Y.-Y., Lin H.-H., Li D., Hsieh H.-H., Hung C.-C., Chen C.-T. A. (2019). Elevated carbon flux in deep waters of the south China Sea. Sci. Rep. 9, 1496. doi: 10.1038/s41598-018-37726-w
Song G., Zhao L., Chai F., Liu F., Li M., Xie H. (2020). Summertime oxygen depletion and acidification in Bohai Sea, China. Front. Mar. Sci. 7. doi: 10.3389/fmars.2020.00252
Verdeny E., Masqué P., Garcia-Orellana J., Hanfland C., Cochran J. K., Stewart G. M. (2009). POC export from ocean surface waters by means of 234Th/238U and 210Po/210Pb disequilibria: A review of the use of two radiotracer pairs. Deep-Sea Res. II 56, 1502–1518. doi: 10.1016/j.dsr2.2008.12.018
Villa-Alfageme M., de Soto F., Ceballos E., et al. (2016). Geographical, seasonal, and depth variation in sinking particle speeds in the north Atlantic. Geophys. Res. Lett. 43, 8609–8616. doi: 10.1002/2016GL069233
Villa-Alfageme M., de Soto F., Le Moigne F. A. C., Giering S. L. C., Sanders R., García-Tenorio R. (2014). Observations and modeling of slow-sinking particles in the twilight zone. Glob. Biogeochem. Cy. 28, 1327–1342. doi: 10.1002/2014GB004981
Wei C.-L., Yi M.-C., Lin S.-Y., Wen L.-S., Lee W.-H. (2014). Seasonal distributions and fluxes of 210Pb and 210Po in the northern South China Sea. Biogeosciences 11, 6813v6826. doi: 10.5194/bg-11-6813-2014
Xiang J., Pang Y., Li Y., Wei H., Wang P., Liu X. (2008). Hydrostatic settling suspended matter of large shallow lake. Adv. Water Sci. 19, 111–115. doi: 10.14042/j.cnki.32.1309.2008.01.008 (in Chinsese).
Yamamoto-Kawai M., Ito S., Kurihara H., Kanda J. (2021). Ocean acidification state in the highly eutrophic Tokyo bay, Japan: Controls on seasonal and interannual variability. Front. Mar. Sci. 8, 642041. doi: 10.3389/fmars.2021.642041
Yang W., Chen M., Zheng M., He Z., Zhang X., Qiu Y., et al. (2015b). Influence of a decaying cyclonic eddy on biogenic silica and particulate organic carbon in the tropical south China Sea based on 234Th-238U disequilibrium. PloS One 10, e0136948. doi: 10.1371/journal.pone.0136948
Yang W., Guo L. (2014). Abundance, distribution and isotopic composition of particulate black carbon in the northern gulf of Mexico. Geophys. Res. Lett. 41, 7619–7625. doi: 10.1002/2014GL061912
Yang W., Guo L., Chuang C. Y., et al. (2015a). Influence of organic matter on the adsorption of 210Pb, 210Po and 7Be and their fractionation on nanoparticles in seawater. Earth Planet. Sci. Lett. 423, 193–201. doi: 10.1016/j.epsl.2015.05.007
Yang W., Guo L., Chuang C. Y., Schumann D., Ayranov M., Santschi P. H. (2013). Adsorption characteristics of 210Pb, 210Po and 7Be onto micro-particle surfaces and the effects of macromolecular organic compounds. Geochim. Cosmochim. Acta 107, 47–64. doi: 10.1016/j.gca.2012.12.039
Yang W., Zhao X., Chen M., Qiu Y., Zheng M. (2022). Lagrangian Observation of 234Th and its application in constraining the sinking of particulate organic carbon on the slope of the northeastern south China Sea. Front. Mar. Sci. 9, 831937. doi: 10.3389/fmars.2022.831937
Yang W., Zhao X., Guo L., Huang B., Chen M., Fang Z., et al. (2021). Utilization of soot and 210Po-210Pb disequilibria to constrain POC fluxes in the northeastern south China Sea. Front. Mar. Sci. 8, 694428. doi: 10.3389/fmars.2021.694428
Keywords: ocean acidification, biological pump, POC export, sinking velocity, polonium-210
Citation: Yang W, Zhao X and Zheng M (2022) Slow-sinking particulate organic carbon and its attenuation in the mesopelagic water of the South China Sea. Front. Mar. Sci. 9:1018825. doi: 10.3389/fmars.2022.1018825
Received: 14 August 2022; Accepted: 05 September 2022;
Published: 20 September 2022.
Edited by:
Xiangbin Ran, Ministry of Natural Resources, ChinaReviewed by:
Wu Men, Nanjing University of Information Science and Technology, ChinaXueyan Jiang, Ocean University of China, China
Copyright © 2022 Yang, Zhao and Zheng. This is an open-access article distributed under the terms of the Creative Commons Attribution License (CC BY). The use, distribution or reproduction in other forums is permitted, provided the original author(s) and the copyright owner(s) are credited and that the original publication in this journal is cited, in accordance with accepted academic practice. No use, distribution or reproduction is permitted which does not comply with these terms.
*Correspondence: Weifeng Yang, d3lhbmdAeG11LmVkdS5jbg==