 Yuying Xu1,2
 Jianyu Chen1*
- 1State Key Laboratory of Satellite Ocean Environment Dynamics, Second Institute of Oceanography, Ministry of Natural Resources, Hangzhou, China
- 2Ocean College, Zhejiang University, Zhoushan, China
Nutrient concentrations and its limited statuses can affect phytoplankton community structure and marine primary productivity. Identifying limiting nutrients under different ocean conditions, the causes, and the nature of such limitations, has important implications for understanding ecosystem changes and interpretation of in situ data. However, there is still a lack of retrieval methods for nutrients in seawater, especially in coastal waters. We propose to characterize the spatiotemporal variability of phytoplankton and nutrient-limited status in the surface ocean with diurnal valuevs of chlorophyll concentration. In this paper, the sediment fronts and plume fronts are used as a reference to select the relative and absolute nutrient-limited status regions. The variance of the six times per day (9:30-14:30) is calculated to represent the diurnal variation of chlorophyll, and the diurnal variation and concentration of chlorophyll combined are used to analyze nutrient-limited status. The results indicate that the diurnal variation of chlorophyll is greater after the typhoon, and the nutrient-limited status is different following each typhoon passing by. The in situ data shows that the highest chlorophyll a concentration reached 20.7 mg/m3 after the typhoon in August 2011.
1 Introduction
The Yangtze River is one of the largest rivers in the world and has a total length of 6,397 kilometers. It delivers approximately 9.1 × 10¹¹ m3 of freshwater and more than 8 × 10⁷ tons of sediments into the East China Sea (ECS) every year from Yangtze Estuary (Dai et al., 2014, Luan et al., 2016). The current system in the area is complex with two major currents, the Changjiang diluted water (CDW) and Taiwan warm current (TWC). The abundant nitrogen and phosphorous loads from the rivers and TWC make ECS one of the most productive areas in the North Pacific (Chen et al., 1999). Nutrients can affect the phytoplankton community structure of the Yangtze Estuary, together with the suspended sediment. Further, nutrient-limited status can constrain the extent to which oceanic primary production influences global nutrient and carbon cycles (Moore et al., 2008). Establishing the limiting nutrient under different oceanographic conditions, and identifying the causes and nature of such limitation, has important consequences for understanding ecosystem changes and the interpretation of in situ data (Moore et al., 2008).
As non-optically sensitive substances, the retrieval of nutrients is gradually developing (Xu et al., 2010; Du et al., 2021). However, most of the current statistical models are applied to freshwater water bodies such as lakes, rivers, and reservoirs, and there are no effective approaches to large-area, long-term Case II water studies (Xu et al., 2011; Sun et al., 2014). Monitoring the nutrient-limited status on a large scale, and the high frequency of spatiotemporal distribution characteristics is a key way to understand the feedback relationship between marine biota and the ocean environment (Arrigo, 2005). A major challenge to observing the complex dynamic nutrient-limited status of the sea in time and space is the lack of tools to monitor the nutrient limitation variation, although some progress has been made to explore a temporal shift in nutrients concentrations using local in situ data (Martiny et al., 2016; Talarmin et al., 2016).
Remote sensing has emerged as an efficient approach for observing surface Chl a concentration on a regional or a global scale. GOCI-derived Chl a observations have been widely used to monitor near-coastal water quality with high spatial and temporal resolution (Matthews et al., 2010; Siswanto et al., 2013). Quite a several studies have shown that nutrient concentration has a good correlation with the concentration of Chl a (Song et al., 2012; Chen et al., 2015). Overall phytoplankton community biomass appears to be co-limited by nitrogen (N) and phosphorus (P). In the classical Redfield paradigm, where 16 mol N: 1 mol P is assumed to be optimal for phytoplankton growth (Falkowski, 1997; Tyrrell, 1999), the high N: P ratios (nutrient ratio) suggest P limitation (Moore et al., 2008). The consequences of variable biological N: P stoichiometry, caused by environmental changes, for phytoplankton growth remain to be elucidated.
At present, the research on the influencing factors of nutrient transport in the Yangtze Estuary mostly involves atmospheric wet deposition, the Yangtze River runoff, and upwelling. Water in the Yangtze Estuary is generally stratified most of the time in summer, and previous studies have demonstrated that storms and typhoons can break down the strong stratification and thus break the original balance of nutrient ratios (Chen et al., 2014; Chen et al., 2017). Coupled with the influence of the cold water mass in the north, the warm current in the southeast, and the effect of upwelling, the nutrient ratios in surface water response to typhoons have been a subject of both great scientific and practical significance (Wu and Chen, 2012; Guan et al., 2017; Li et al., 2021).
Previous papers have focused on observing changes in chlorophyll and suspended sediment concentration in the study region during typhoons, thus exploring physicochemical changes that occur in this area. The mature operation of the GOCI sensor allows us to simplify the observation of nutrient status. Instead of just applying the average value of chlorophyll at the intermediate time, in this paper, we designed a remote sensing based workflow to observe the changes in nutrients. Taking typhoon as a case study, we observed the changes of nutrient-limited status by judging the diurnal variations in chlorophyll a (Chl a). The information on the typhoons that affected the Yangtze Estuary was collected from 2011 to 2020. We combined the observation from remote sensing and mooring buoy to analyze the growth mechanism of chlorophyll before and after the typhoon in 2011. Sediment fronts and plume fronts can significantly affect the spatial distribution of materials in the Yangtze Estuary, which in turn affects the growth of phytoplankton. Bounded by nutrient-limited statuses, we analyzed the spatial distribution characteristics of chlorophyll a before and after the typhoon and explored the changes in the nutrient-limited status in different regions.
The paper is structured as follows. We introduce the background in Section 1 and describe the scientific hypothesis and whole procedure in Section2. Data resources and study areas are described in Section 3. Section 4 shows the main results and our viewpoints with figures and tables. Conclusions are provided in Section 5.
2 Research methods
2.1 Scientific hypothesis
Nutrient-limited statuses can be divided into two categories. One is absolute nutrient-limited (ANL) status, which always happens in the open sea with low nutrient concentration. The other is named relative nutrient-limited (RNL) status. It restricts the growth of phytoplankton in the eutrophication areas because the ratio of nutrients does not match that of phytoplankton uptake. However, influenced by runoff flow and currents field, as well as the extreme weather environment such as typhoon, the physicochemical environment of the Yangtze Estuary changes dynamically, and nutrient-limited status also changes.
As shown in (Figure 1A), the Yangtze Estuary enriched with nutrients tends to be in RNL status, while farther offshore areas tend to be in ANL status. In winter, the CDW forms a narrow freshwater band along China’s southeast coast; in spring, the intrusion of the nearshore Kuroshio branch current triggers stratification (Jiang et al., 2015). Thereafter, stratification is enhanced in summer and gradually expanded northward. At this time, the nutrients in the surface water mainly come from the CDW, without the supplementation of the bottom water. However, the movement of water masses and the change of stratification induced by typhoons or strong winds both influence the development of nutrient-limited statuses in waters (Figure 1B). The vertical mixing and upwelling can uplift the deeper Chl a to the surface and bring nutrients from intermediate depths into the euphotic zone (Wang and Zhang, 2021). The bottom waters of the open ocean contain higher nutrients than surface waters, thus altering the nutrient-limited status and stimulating phytoplankton communities and primary production; the opposite is true for nearshore (Figure 1C, D). When the water body reverts to a stratified state, the regions return to their original nutrient-limited statuses (Figure 1E).
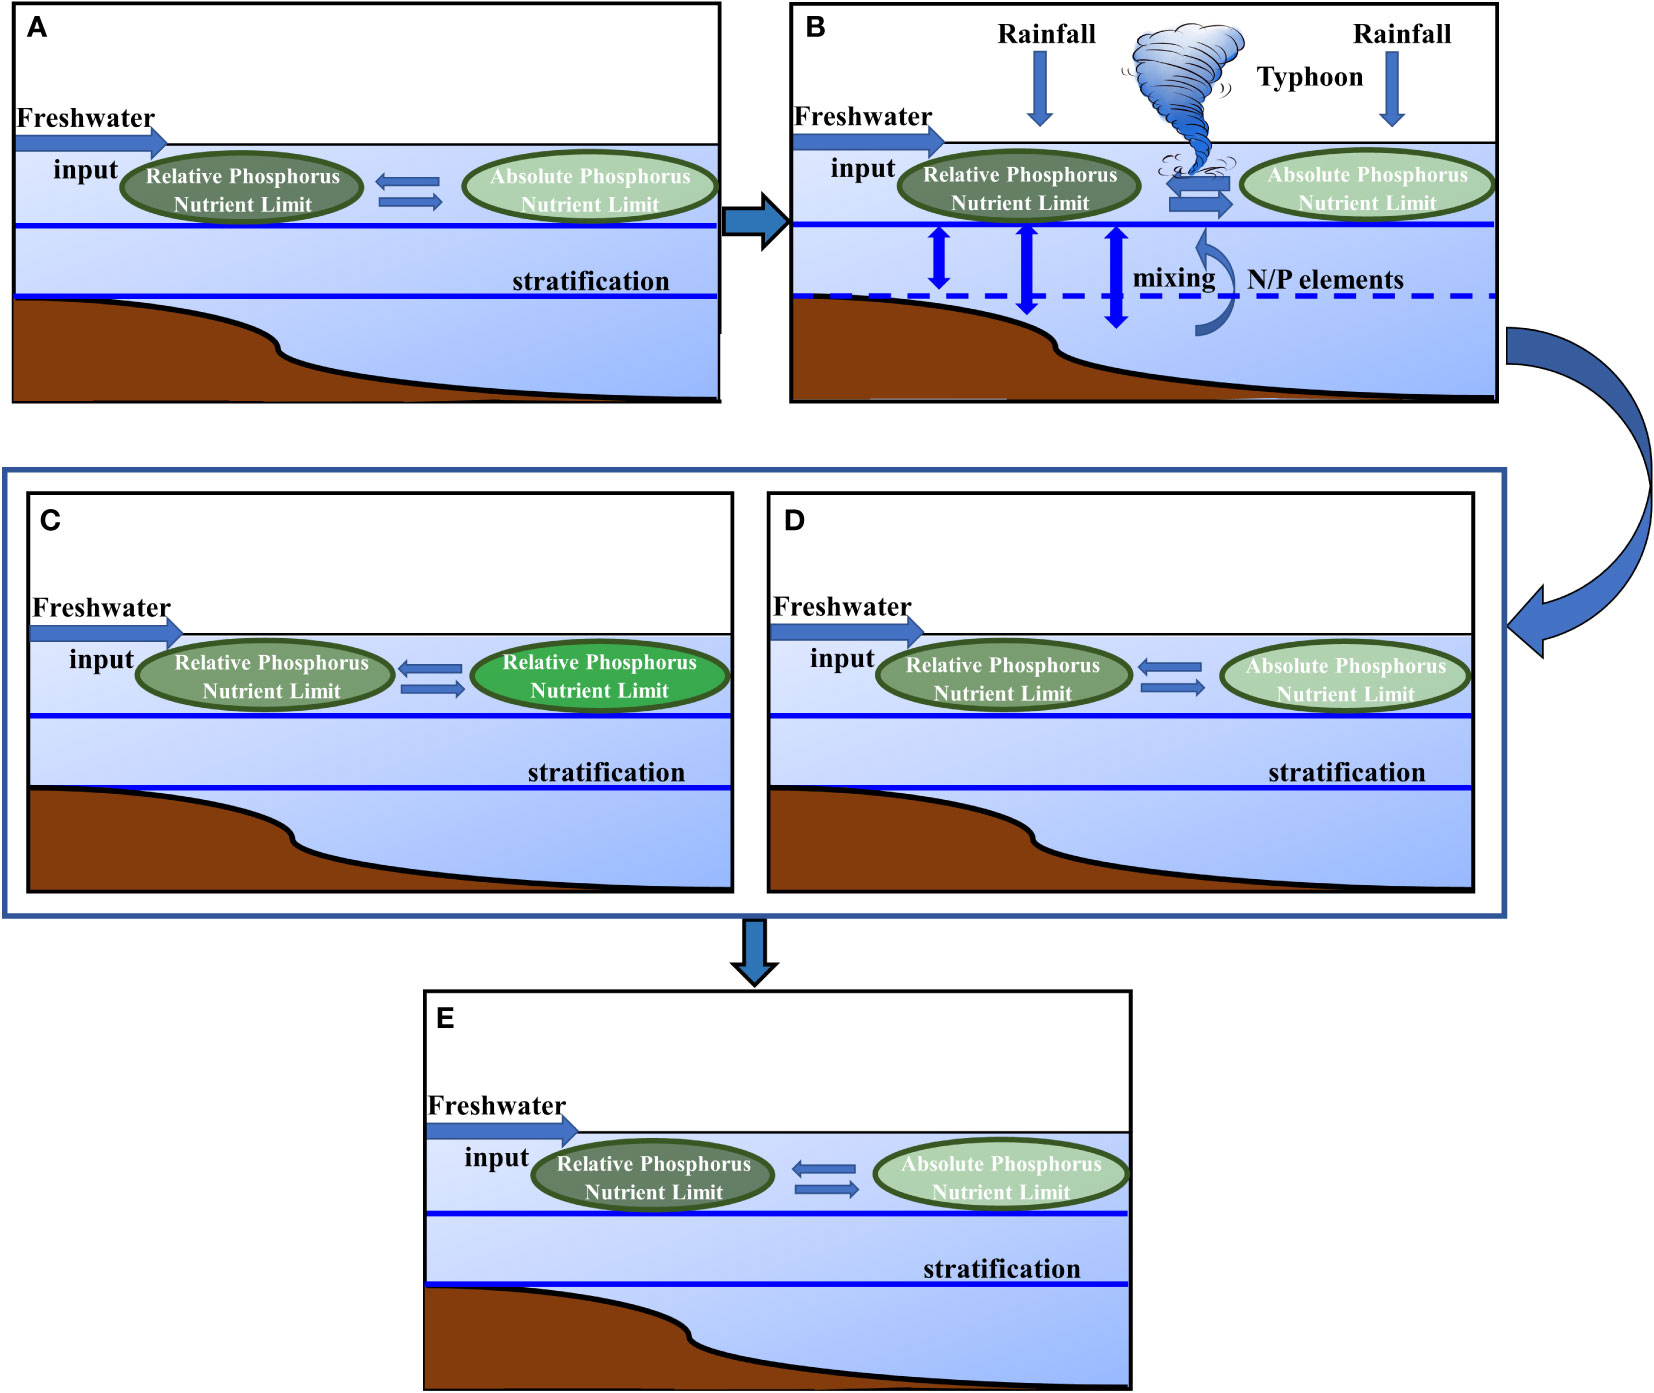
Figure 1 Schematic diagram of changes in nutrient status before the typhoon (A), during the typhoon (B), and after the typhoon (C–E). Among them, (C, D) show two kinds of statuses may occur within a short time after the typhoon passes by, and (E) shows the status after a period of time after the typhoon passes by.
At the same time as the nutrient-limited status changes, we guess that the concentration and diurnal variation of chlorophyll will vary as Figure 2 shows. Strong near-surface wind creates internal friction. The physical driving forces associated with typhoons or strong winds that modulate phytoplankton dynamics, such as the nutrient and phytoplankton transportation, result in greater diurnal variation of chlorophyll in both nearshore regions and open sea surface waters. However, the chlorophyll concentrations in the above two areas will vary differently.
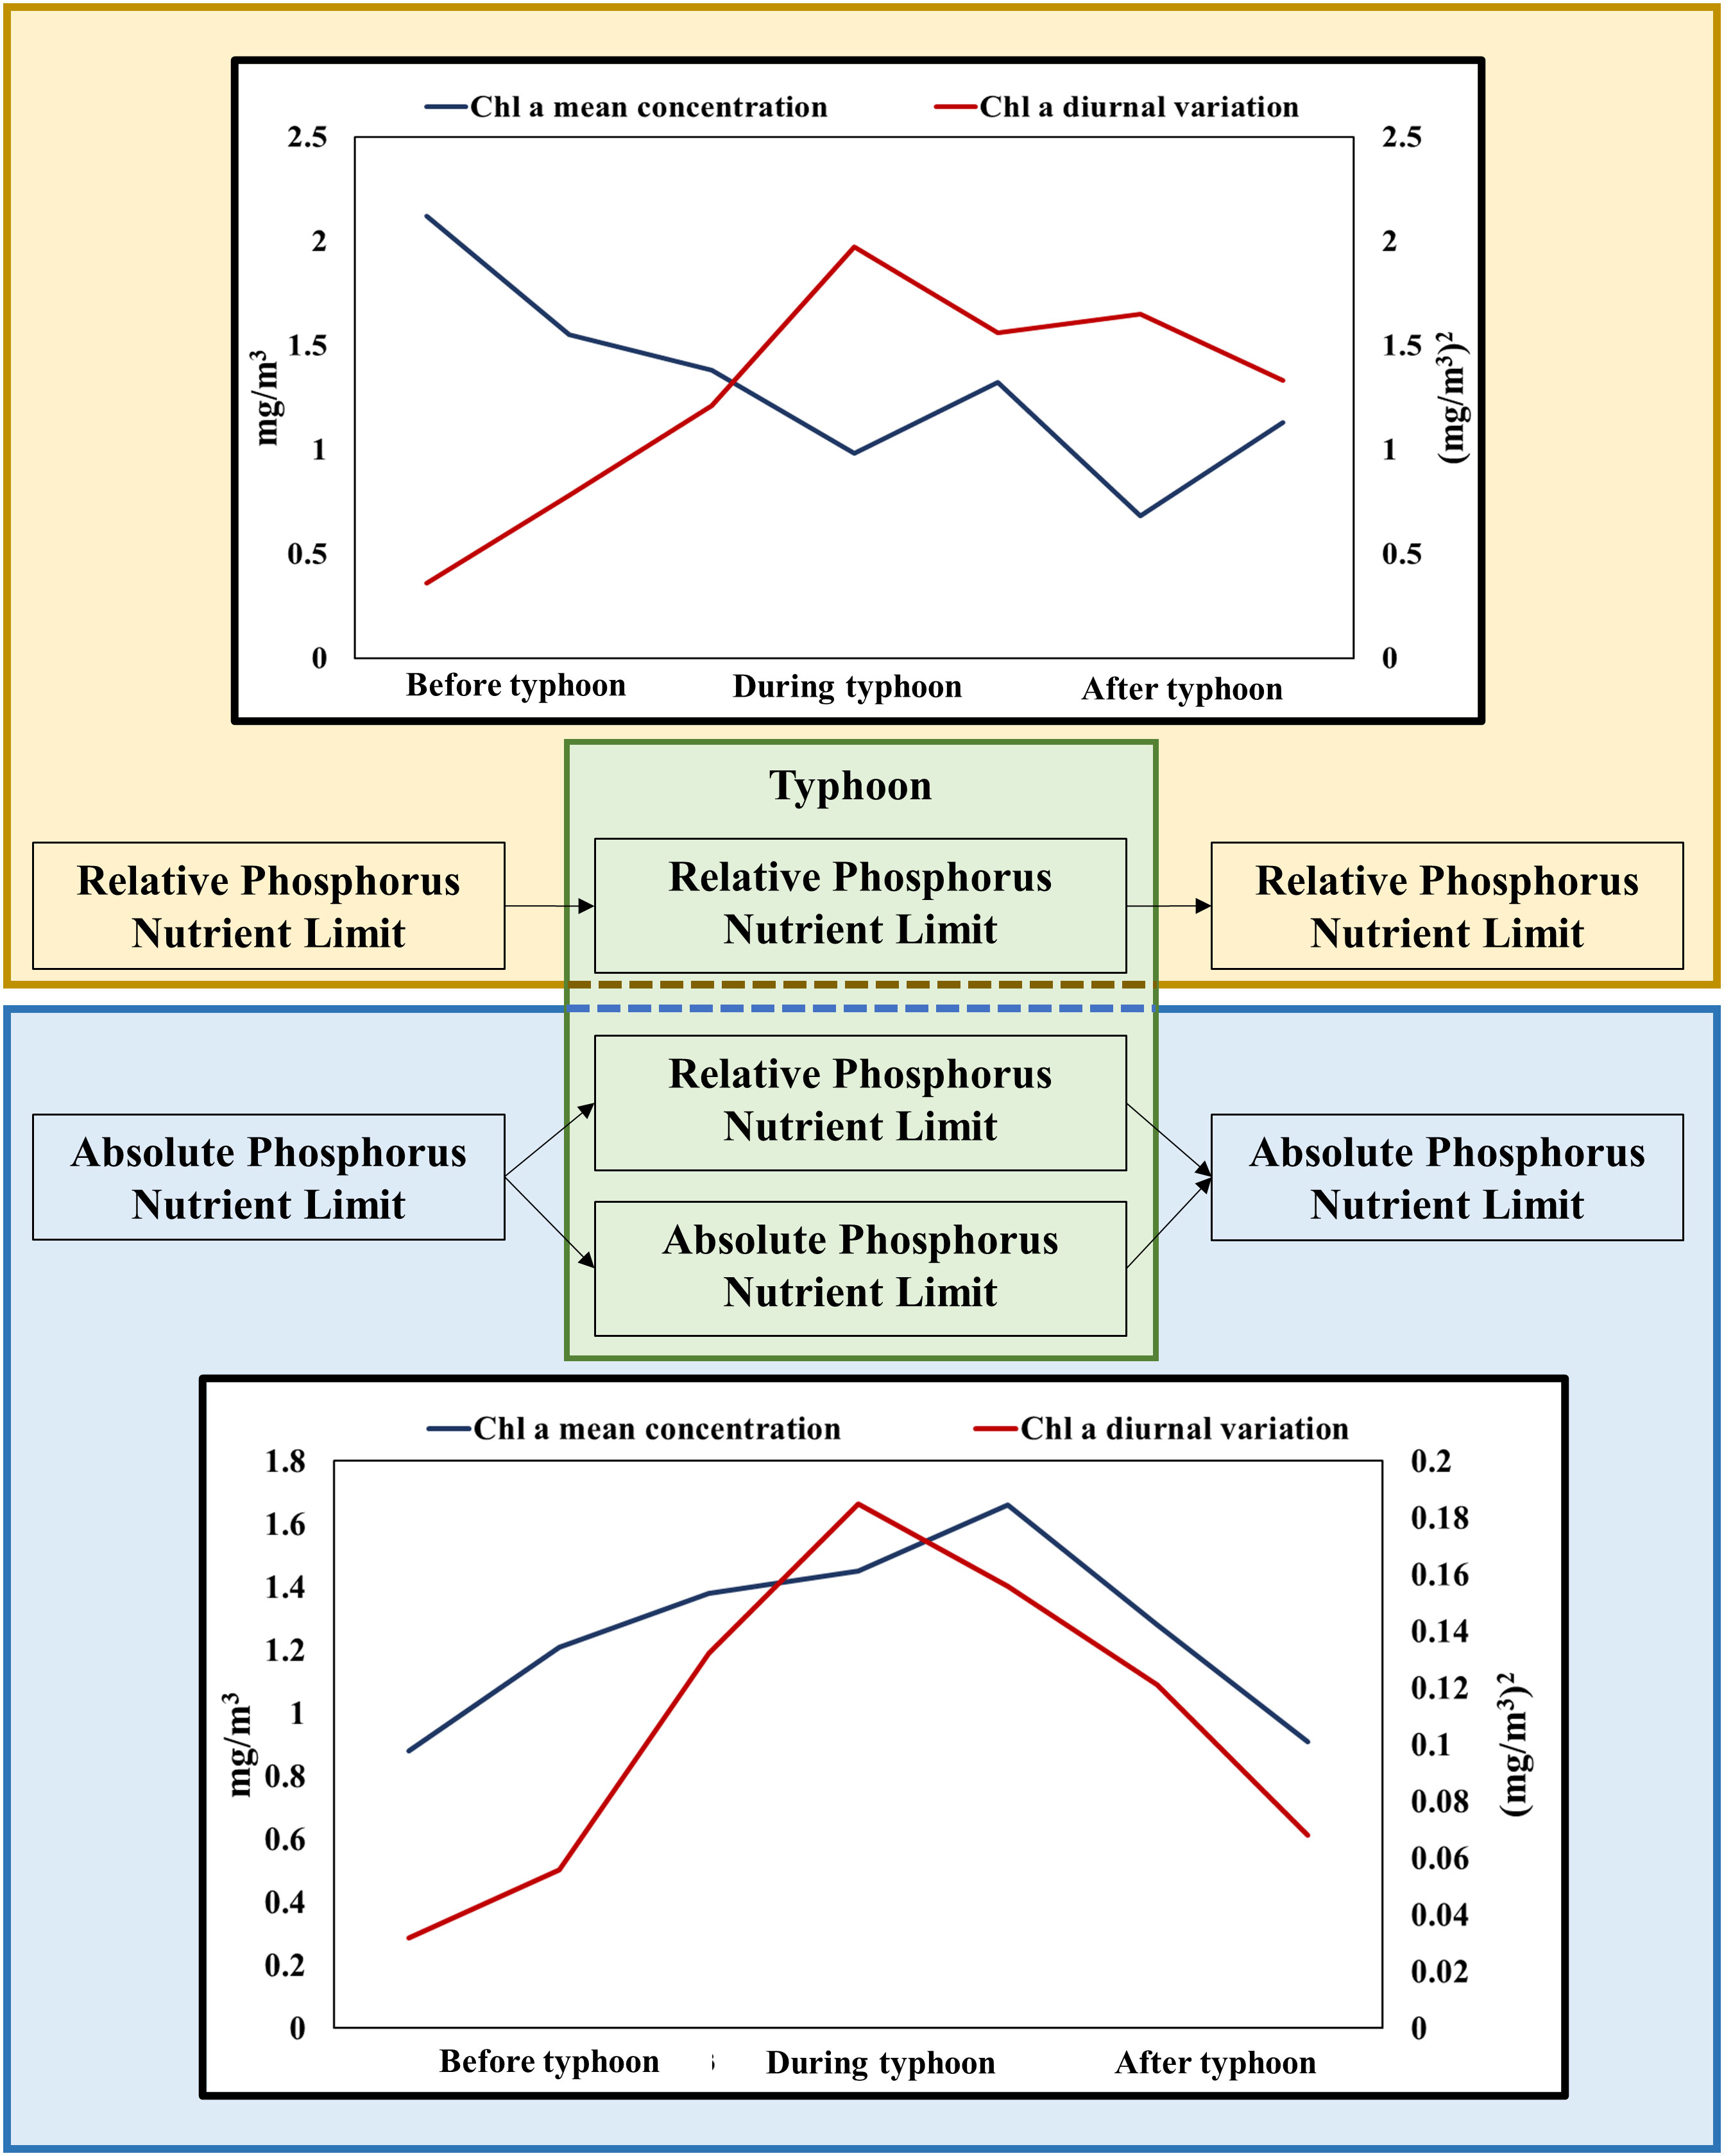
Figure 2 Scientific hypothesis of chlorophyll concentration and diurnal changes before and after typhoon. The large background boxes in yellow and blue represent the hypotheses of changes in two different nutrient-limited status regions.
In coastal water, the phytoplankton will decline attributed to the increase of water turbidity, accompanied by the vertical redistribution of phytoplankton with reduced nutrients. The Kuroshio intrusion water, with high salinity and few nutrients, may also play role in the phytoplankton decline. It can inhibit nutrient uplift driven by typhoon-induced vertical mixing and upwelling (Wang and Zhang, 2021).
In the open sea, nutrient-rich upwelling near the surface will provide an ideal environment for the growth of phytoplankton. So, the diurnal variation will reach its maximum while the nutrient limitation is the weakest, and the chlorophyll concentration maximum occurs after the diurnal variation maximum. The increase in chlorophyll concentration during the typhoon may be caused by the upwelling bringing the high concentration of chlorophyll a from the bottom to the upper water body. The increase of chlorophyll concentration in the post-typhoon stage may be due to the change in the nutrient-limited status, and it is precisely because of the change in the limited status that the chlorophyll concentration further increases and the diurnal variation is larger than it was before the typhoon. Therefore, conversely, if the concentration of chlorophyll a in the post-typhoon stage is larger than that before the typhoon, and the diurnal variation is large, we believe that the nutrient-limited status at this location has changed.
2.2 Processing approach
In situ observations were performed in the Yangtze Estuary during typhoons in 2011, including the collection of Chl a concentrations and physicochemical characteristics. Satellite remote sensing data covering the typhoon periods were also acquired, and the remotely sensed data were used to describe the key factors associated with typhoons that controlled phytoplankton dynamics, thereafter analyzing the effects of changes in nutrient ratios on short-term phytoplankton dynamics in and near the Yangtze Estuary. The whole procedure in the paper consists of three steps: determination of the study area, selection of typhoons, and analysis of nutrient-limited status.
Due to the characteristics of low salinity, a huge plume area is formed after the freshwater enters the sea from the Yangtze Estuary (Chen et al., 1999; Sun et al., 2014; Wu and Wu, 2018). Meanwhile, under the impact of the low-salinity plume and tidal mixing, a large number of suspended sediments brought by the flushing water settle in the estuary and form a sediment front because of the dynamics of vertical resuspension (Ge et al., 2020). Moreover, the transitional region between the sediment and plume fronts is wide, ranging from 122.5°E to 123.5°E eastward. Sediment and nutrients from freshwater input have a direct impact on underwater light field distribution and nutrient supply in the Yangtze Estuary, and further influence the spatial pattern of phytoplankton productivity (Zhao et al., 2004; Chai et al., 2006; Li et al., 2015). According to the peculiarities of the environment, we chose two regions to represent the relative and absolute nutrient-limited regions, the former region is located west of 123°E, and the latter is located outside the above two fronts. They were both described in Section 3.1.
As one of the major disastrous meteorological events, the typhoon is one of the top ten natural disasters in the world (Guan et al., 2018). From 2010 to 2020, about 25 typhoons were generated every year in the western Pacific, which is the region with the most active typhoon activities (Elsner and Liu, 2003). China is one of the countries most affected by typhoons, and typhoons pass through the Yangtze Estuary almost every year (Oey and Chou, 2016). We screened the typhoons with a seventh-level wind circle covering the Yangtze Estuary for analysis.
In addition to the diurnal variations in parameters, we divided all data into three time periods for mean analysis: before the typhoon, during the typhoon, and after the typhoon. The variance of 6-time (9:30-14:30) values per day is used to show the diurnal variation of Chl a. The diurnal variation and concentration of chlorophyll can be used to analyze the nutrient-limited status.
3 Research data
3.1 Study area
The Yangtze Estuary is the gateway for the river to go to sea and marine transportation. The interaction between the East Asian monsoon and various flows constitutes the unique hydrodynamic mechanism of the Yangtze Estuary (Figure 3).
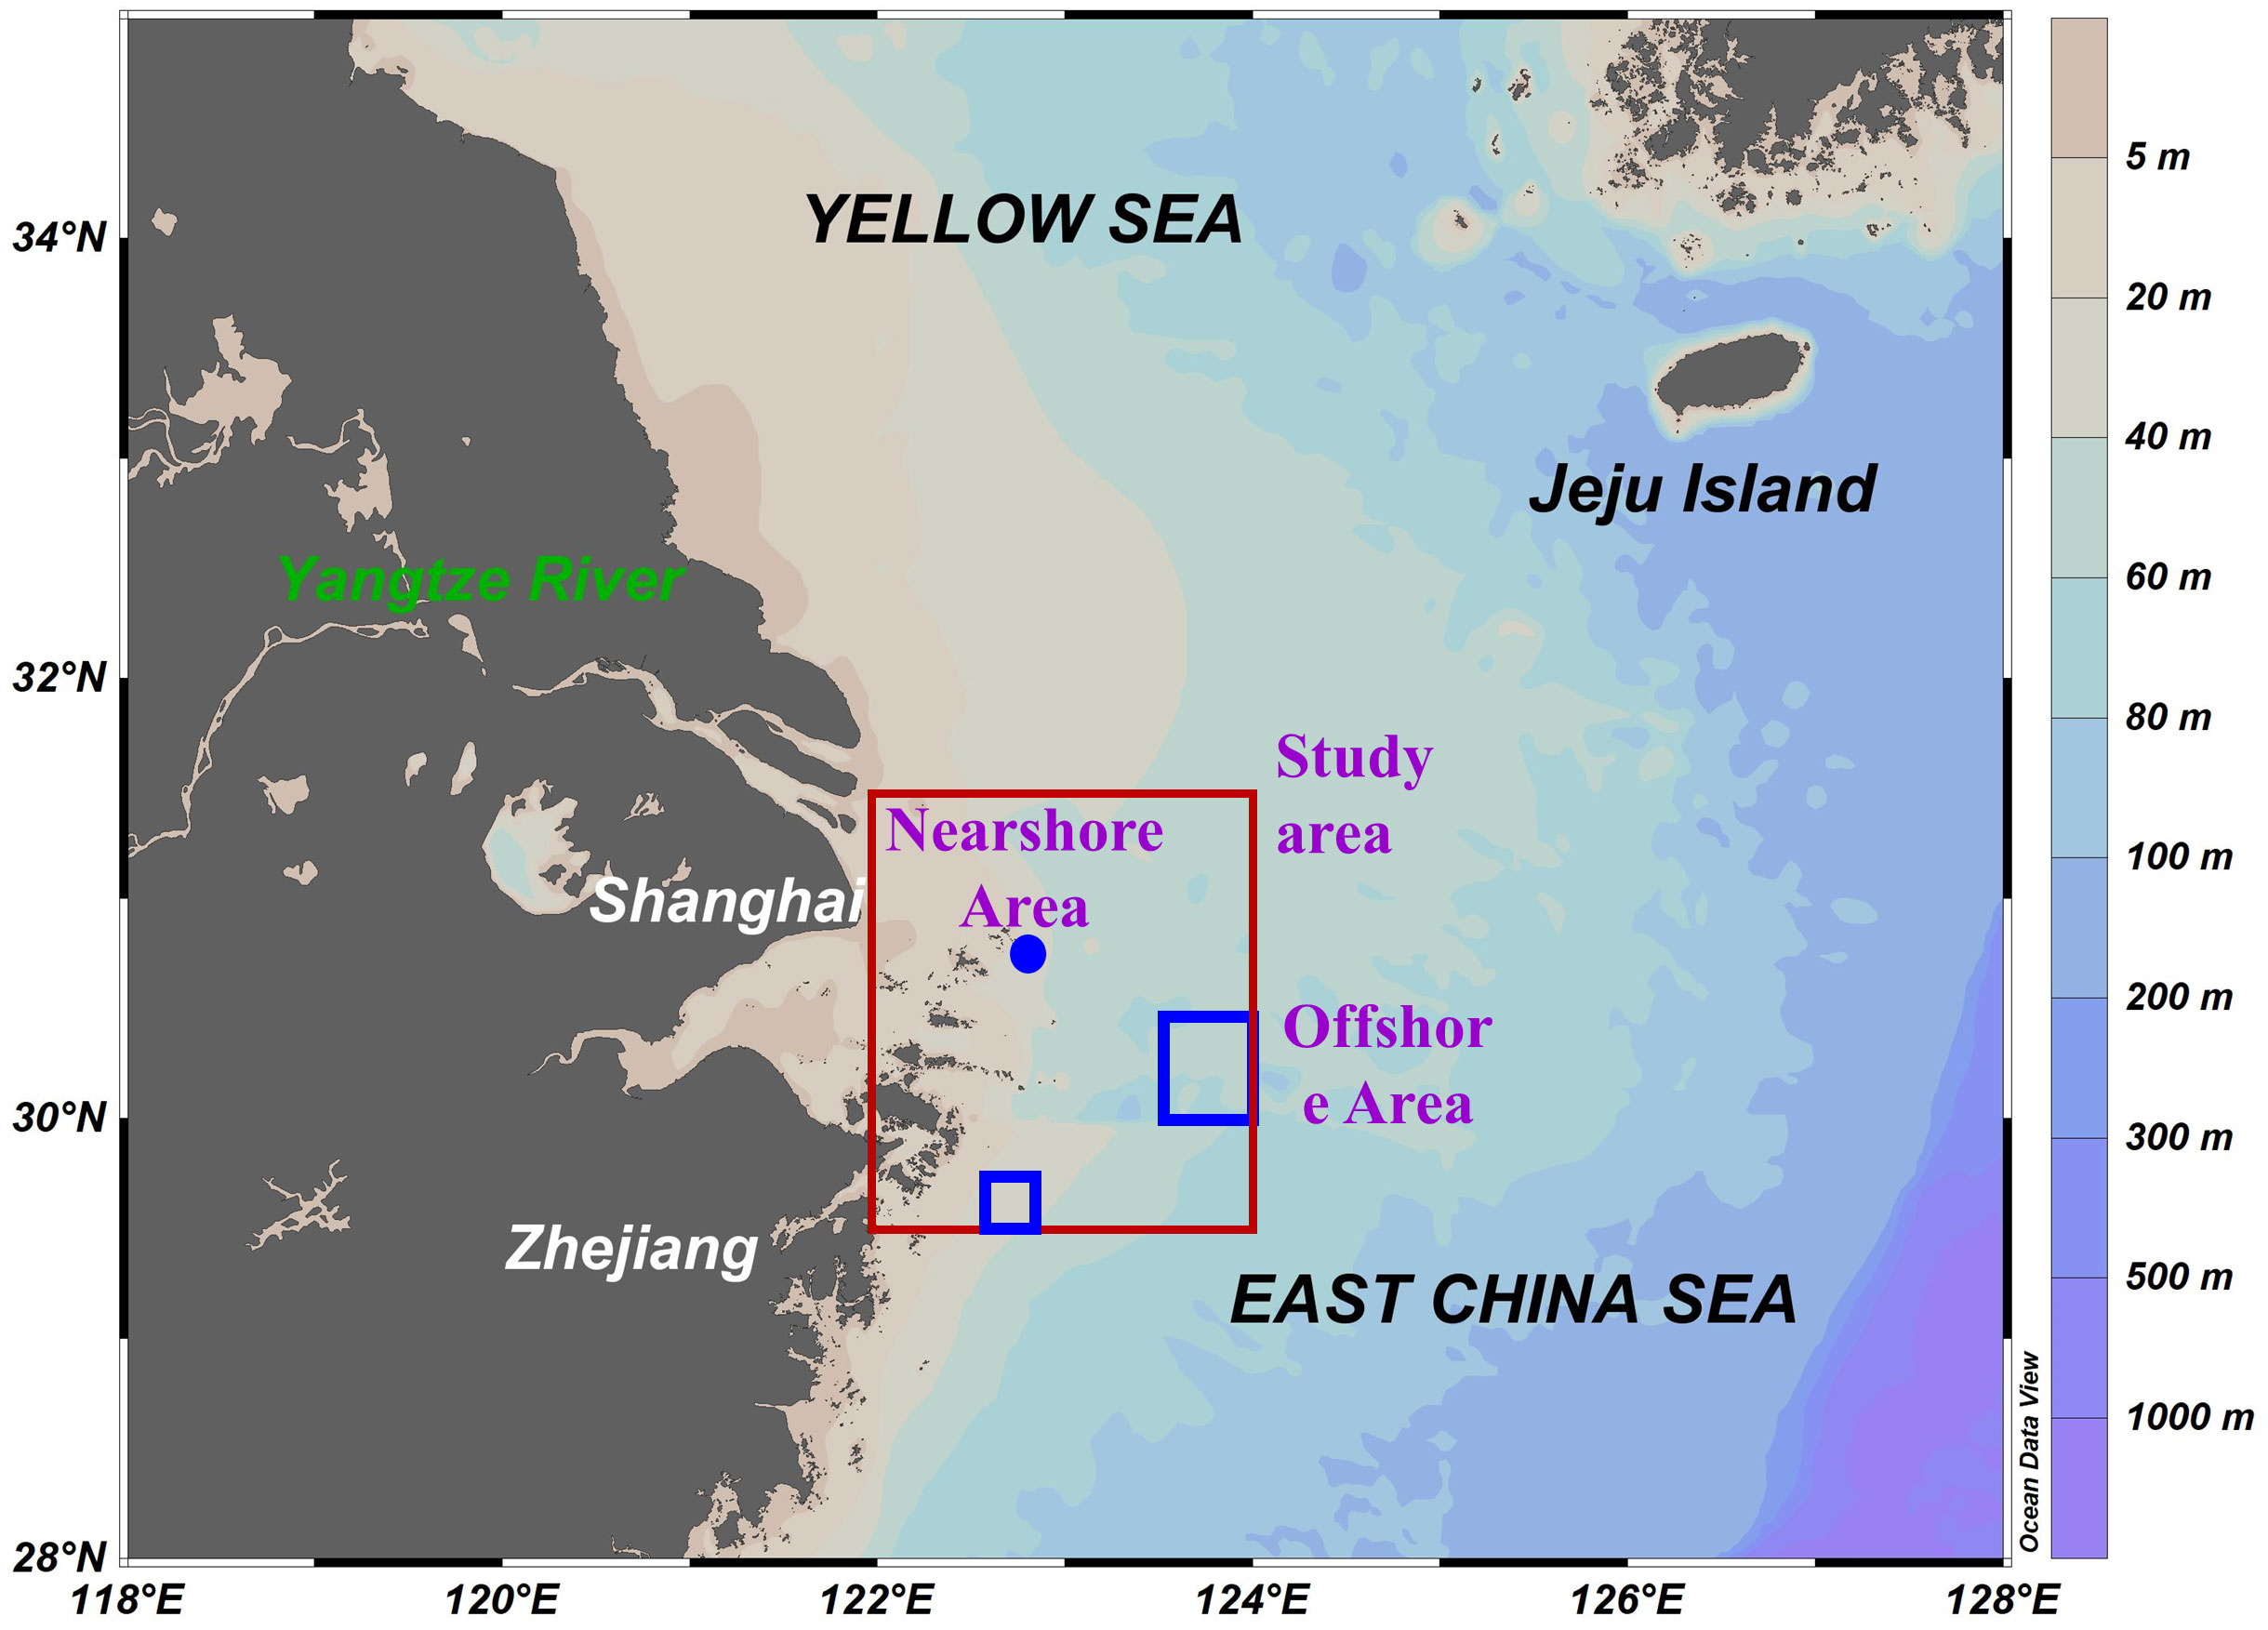
Figure 3 A map showing study sites. The red box indicates the entire research area in the paper. The blue dot marks the location of the mooring buoy, and the blue box represents the Offshore Area that is not affected by the plume and high turbidity. Bathymetry is shown from light to dark blue for the range of 5 to 2500 m.
In recent years, eutrophication in the ECS, which can lead to frequent red tides outbreaks, has become a growing concern. The Yangtze Estuary can be divided into three parts to study the relationship between nutrients and primary productivity: the light-limited area near the estuary, the RNL area in the transition zone, and the ANL area far from the estuary. Taking two fronts as the boundary, the location (122.85°E, 30.75°N) where placed the mooring buoy is named Nearshore Area, where high turbidity will cause light limitation (Xu et al., 2021), and it can be referred to as the RNL area. This area is shown by the blue dot in Figure 3. It is close to the coast and is greatly affected by the CDW. The area marked by the blue box in Figure 3 is away from the two fronts, named Offshore Area, the water at this area is relatively deep without light limitation. It is mainly limited by nutrient concentration, so it can be referred to as the ANL area. The range of the Offshore Area is 123.5-124°E, 30-30.5°N.
3.2 Typhoon
The information on typhoons that affected the Yangtze Estuary from 2011 to 2020 collected was listed in Table 1, the track and period of the typhoon in 2011 were supported by data from the mooring buoy. The selected 11 typhoons include tropical storms (TS), severe tropical storms (STS), severe typhoons (STY), and super typhoons (Super TY). Information on typhoons was obtained from Japan Meteorological Agency (http://www.jma.go.jp/jma/jma-eng/jma-center/rsmc-hp-pub-eg/trackarchives.html). The tracking dataset includes the typhoon location, intensity, and atmospheric pressure every 6 h.
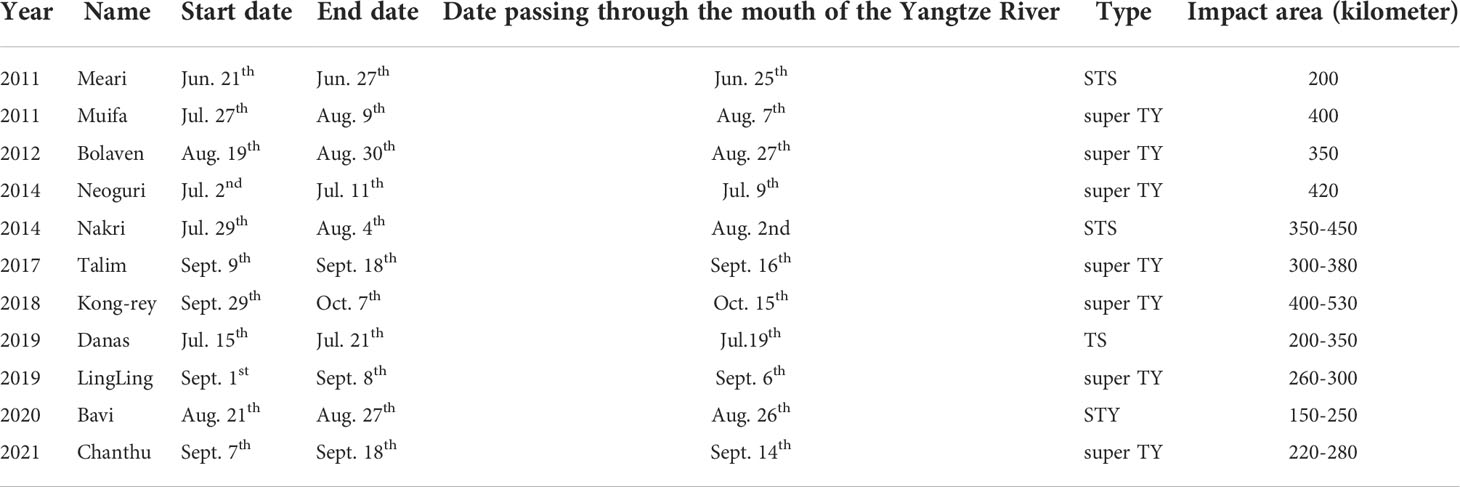
Table 1 Information on typhoons that affected the Yangtze Estuary from 2011 to 2020.
The historic tracks of typhoons collected were illustrated in Figure 4. Among them, “Meari” was formed in the ocean east of the Philippines on the afternoon of 22 June 2011. It intensified into an STS after two days and moved northward along the eastern coast of China. “Meari” had successively combined with the tropical monsoon cloud cluster and the northern westerly belt cloud system. Its fastest moving speed was 40-60 km/h. Super Typhoon “Muifa” (2011) was formed on 28 July 2011. As a Category 5 storm with winds once up to 140 knots, it landed on the eastern coast of China on 6 August. The storm’s sustained winds reached 40 m/s when it approached the study area.

Figure 4 The historic track of typhoons. The green circles indicate the influence area of Category 7 wind circle of typhoon (A) 2011 Meari; (B) 2011 Muifa; (C) 2012 Bolaven; (D) 2014 Neoguri; (E) 2014 Nakri; (F) 2017 Talim; (G) 2018 Kong-rey; (H) 2019 Danas; (I) 2019 LingLing; (J) 2020 Bavi; (K) 2021 Chanthu. The trajectory points in colored different ellipses are all within the same day, and the date is indicated next to the ellipse.
3.3 In situ and GOCI data
A mooring buoy was established off the Yangtze Estuary in 2011 and collected data for about three months at a 30-min interval (Chen et al., 2012). The bio-optical dataset includes in situ dissolved oxygen (DO), salinity, temperature, Chl a, photosynthetically active radiation (PAR), pressure, conductance, and turbidity.
As the first geostationary orbit ocean color satellite sensor launched by the Korea Ocean Satellite Center (KOSC), the Geostationary Ocean Color Imager (GOCI) performs eight measurements in a day. In the paper, we used GOCI Level-2A data obtained from the KOSC (URL: http://kosc.kiost.ac/) for comparison. The dataset covers all the data before and after the typhoon passed the Yangtze Estuary from 2011 to 2020. There are many literatures on GOCI data, and retrieval algorithms have been shown to be useful in retrieving water-column constituents in the Yellow Sea (YS) and East China Sea (ECS) (Min et al., 2014; Kim et al., 2016).
In this paper, we also analyze the temperature, salinity, mixed layer depth, and the flow field changes. The analysis results help to determine the changes in the nutrient ratios. The information on sea surface temperature (SST) data was obtained from Operational Sea Surface Temperature and Sea Ice Analysis (OSTIA) system (Good et al., 2020), which was developed at the Met Office (the UK’s national meteorological service; https://www.metoffice.gov.uk/). The in situ SST data used are those distributed in near real time through the WMO GTS, and are from a mixture of sources including in situ data (drifting and moored buoy platforms and ships), and satellite SST data. Information on salinity, mixed layer thickness, and ocean current velocity were all obtained from GLORYS12V1 product (https://resources.marine.copernicus.eu/product-detail/GLOBAL_MULTIYEAR_PHY_001_030/DATA-ACCESS), which is the CMEMS global ocean eddy-resolving reanalysis products with 1/12° horizontal resolution and 50 vertical levels. It covers from 1st of January 1993 until 30 May 2020 (Le Traon et al., 2019), and the products available for users are daily averages and monthly mean averages. The sea surface salinity (SSS hereafter) is generally fresher than both the climatology with regional biases of less than 0.2 psu.
4 Results and discussion
4.1 Measured data results of buoys before and after the typhoons in 2011
Buoy observations revealed the impact of the typhoon on the Chl a concentration in 2011. During the typhoons, Chl a, oxygen content, turbidity, temperature, and salinity all changed to varying degrees.
4.1.1 Typhoon “Meari”
According to Figure 5, In early summer, the sea surface temperature is about 20 °C, and the salinity of the surface water where the buoy was located was about 27-28. Typhoon “Meari” passed the Yangtze River Estuary on 25 June 2011, and the concentration of Chl a was high at this time, reaching 7.5 mg/m3. Then, the temperature and Chl a concentration decreased obviously on 26 June, and the temperature dropped by about 2°C, while Chl a decreased about 3mg/m3 with a small diurnal variation (Figures 5B, C). (Figure 5A) shows that the increase of the river’s freshwater discharge and strong winds that caused surface salinity and temperature generally decreased suddenly on June 27, and the highest Chl a concentration reached 20.7 mg/m3. It was reported that the study area was sunny to cloudy on June 27 and cloudy on June 28, but the Chl a concentration varied greatly on these two days. This also shows that PAR has less effect on chlorophyll, and the change of chlorophyll was mostly affected by nutrients and CDW input.

Figure 5 The variations of parameters measured by buoy during typhoon “Meari”. The variations when the typhoon passes are marked with red box. The typhoon passed through the Yangtze Estuary on June 25. The red, green and blue boxes represent several typical situations analyzed in the paper. (A) show the daily changes before, during, and after the typhoon, (B, C) show the Chl a and temperature changes with box plots, respectively.
Three sets of data are intercepted from (Figure 5A), which are framed by blue, green, and red boxes respectively. The content of the blue box indicates that there was water intrusion with high salt and low temperature at that time, or the phenomenon that low salt and high temperature water dominated the previous day disappeared. Changes in temperature and salinity were smaller on the days in the green box, while there was a small peak in Chl a, which we consider being because of rainfall. The previous report stated that the heavy rains occurred on 24 and 25 June. The red box mainly shows the parameter changes on June 27. As mentioned above, the intrusion of CDW brought rich nutrients and a large number of suspended solids. Moreover, phytoplankton consumed a large amount of carbon dioxide and released oxygen in the process of life activities, which increased the dissolved oxygen in the surface seawater.
4.1.2 Typhoon “ Muifa”
Typhoon “Muifa” passed the Yangtze Estuary on 7 August 2011. The parameter changes before and after the typhoon in August, as Figure6 shows, were different from those in June. Before the typhoon “Muifa” came, the sea surface temperature was relatively high, and due to the strong wind and rainfall, the sea surface temperature dropped largely on 7 August, with the temperature dropping by nearly 5.0°C. After that, the temperature slowly rose. At the same time, the salinity increased slowly from 5 August and decreased after the typhoon passed. Chl a changed greatly on 5 August with the difference between the maximum and minimum values reaching 2.56 mg/m3. The overall value of Chl a on 7 August was lower, with the lowest value being 0.61 mg/m3 and the highest being only 1.02 mg/m3 (Figures 6B, C ). Surveys have shown that the area was cloudy and rainy during this time, with the temperature remaining at around 25 °C. Dilution effects of heavy rainfall and increased freshwater flow in rivers, and unsuitable temperature caused an overall decrease in Chl a concentration.
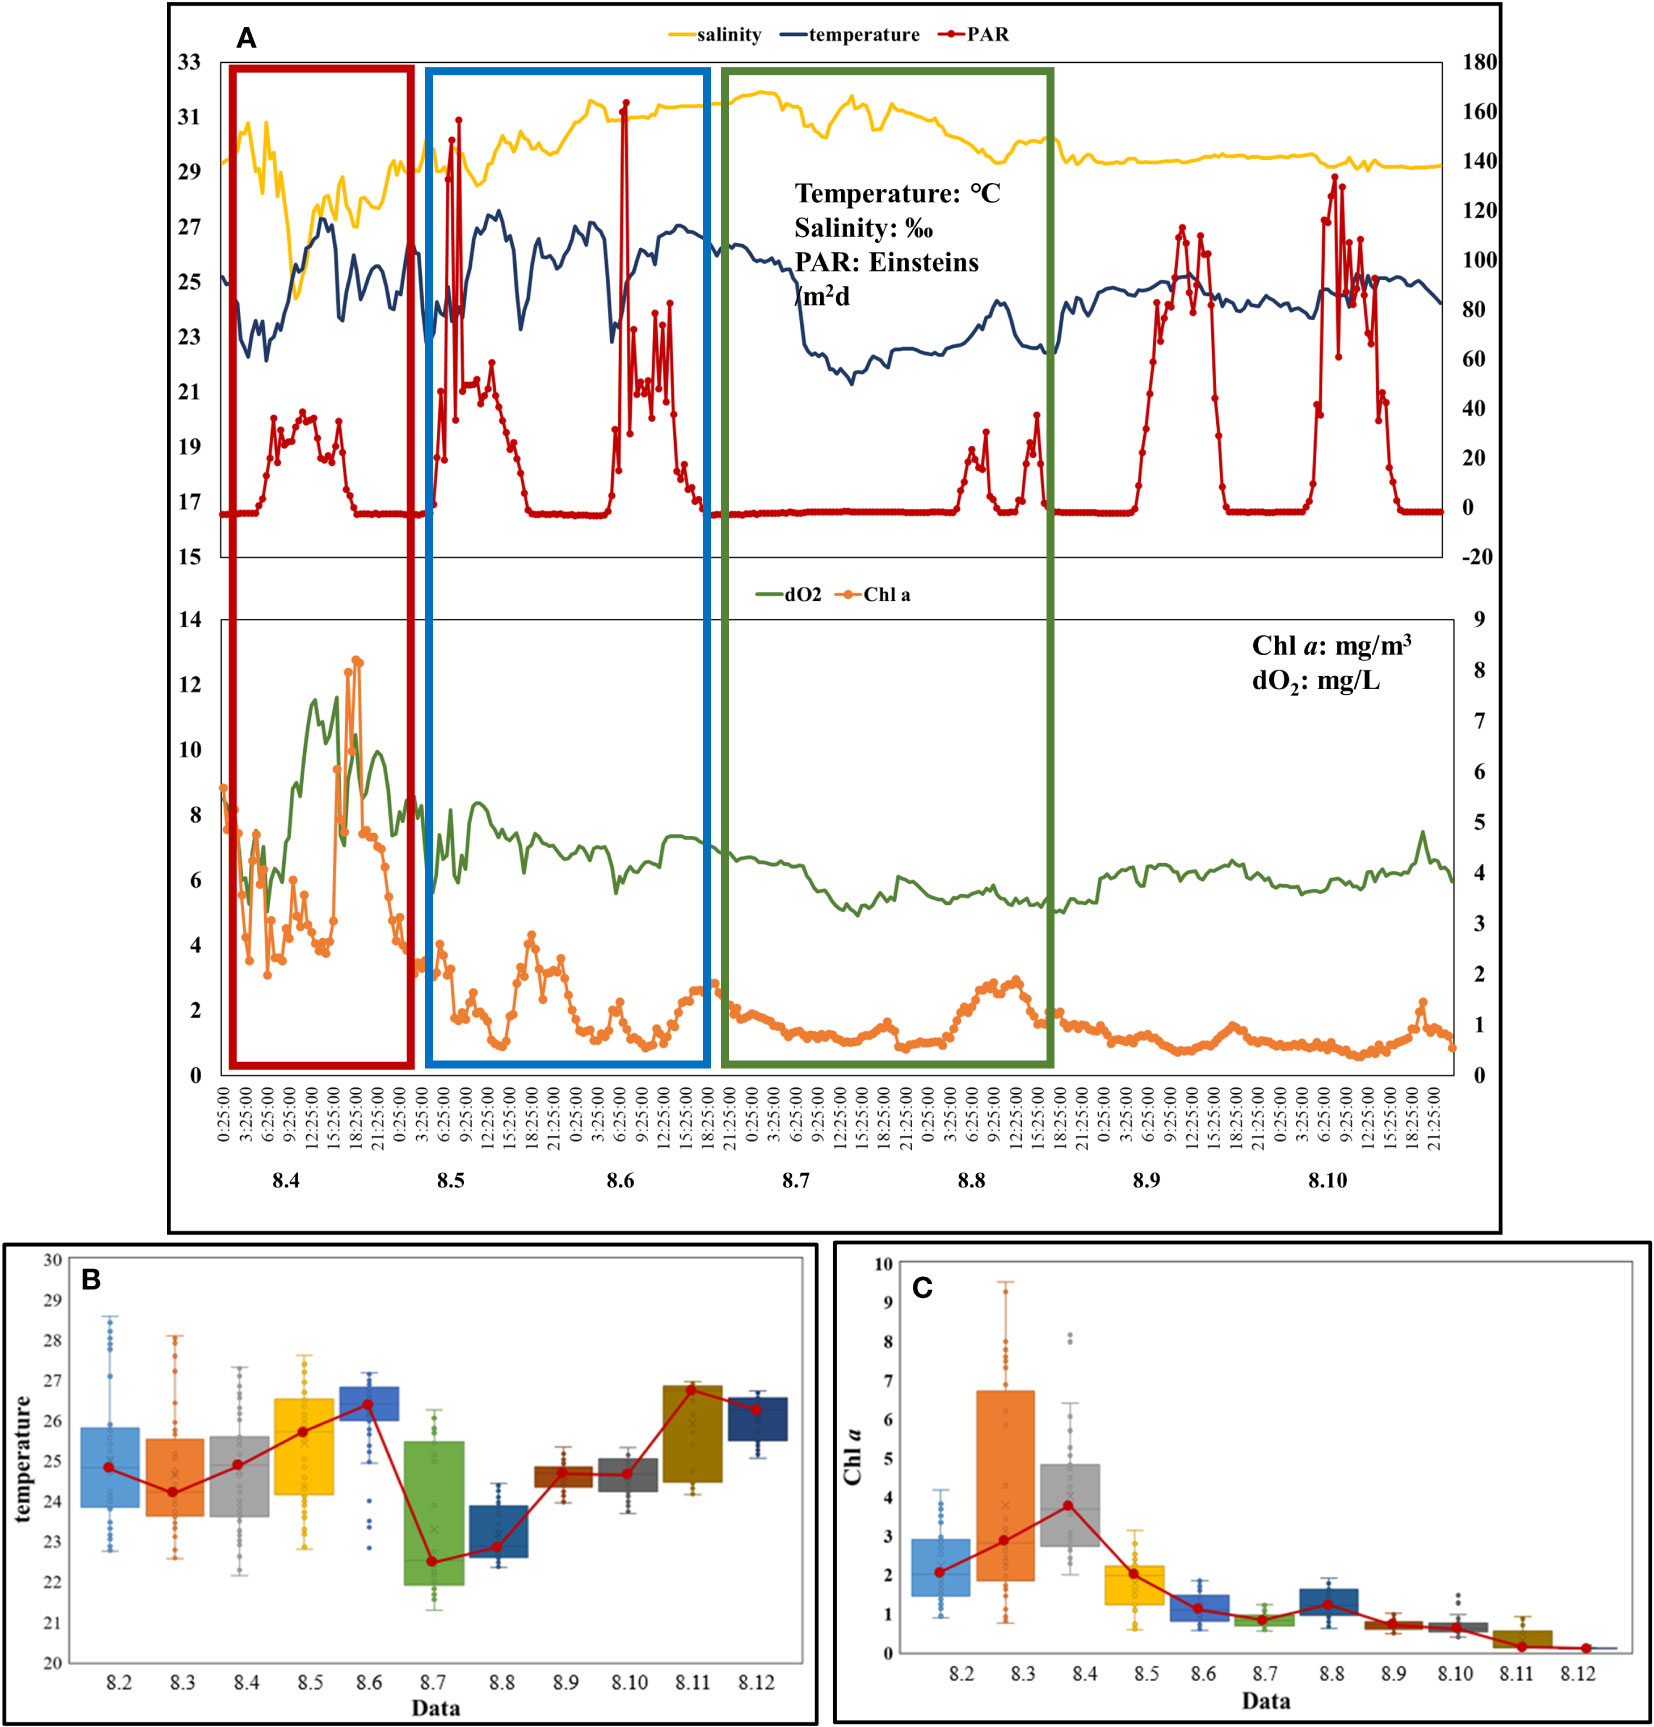
Figure 6 The variations of parameters measured by buoy during typhoon “Muifa”. The variations when the typhoon passes are marked with red box. The typhoon passed through the Yangtze Estuary on August 7. The red, green and blue boxes represent several typical situations analyzed in the paper. (A) show the daily changes before, during, and after the typhoon, (B, C) show the Chl a and temperature changes with box plots, respectively.
Judging from the content displayed in the red box, on August 2, CDW with high temperature and low salinity brought a large amount of suspended matter and phytoplankton, and as a result, the dissolved oxygen in the surface seawater increased significantly. The content displayed in the blue box shows that there was a high saltwater intrusion in the area, and the temperature changed relatively large. Water bodies of different thermohaline states mixed up and down. In addition, there may be reasons for heavy rainfall (5-8 August).
4.2 The variations of GOCI-derived parameters during typhoons
4.2.1 Diurnal variation of GOCI-retrieved parameters during typhoon–Muifa (2011)
Figure 7 shows satellite-observed variations in Chl a, SST, salinity, and mixing layer depth from 1 August to 13 August during the typhoon “Muifa” in 2011. The images available for analysis are limited by the no-data pixels in GOCI imagery, which is mainly due to the contaminating effects of cloud, sea fog, and aerosols.
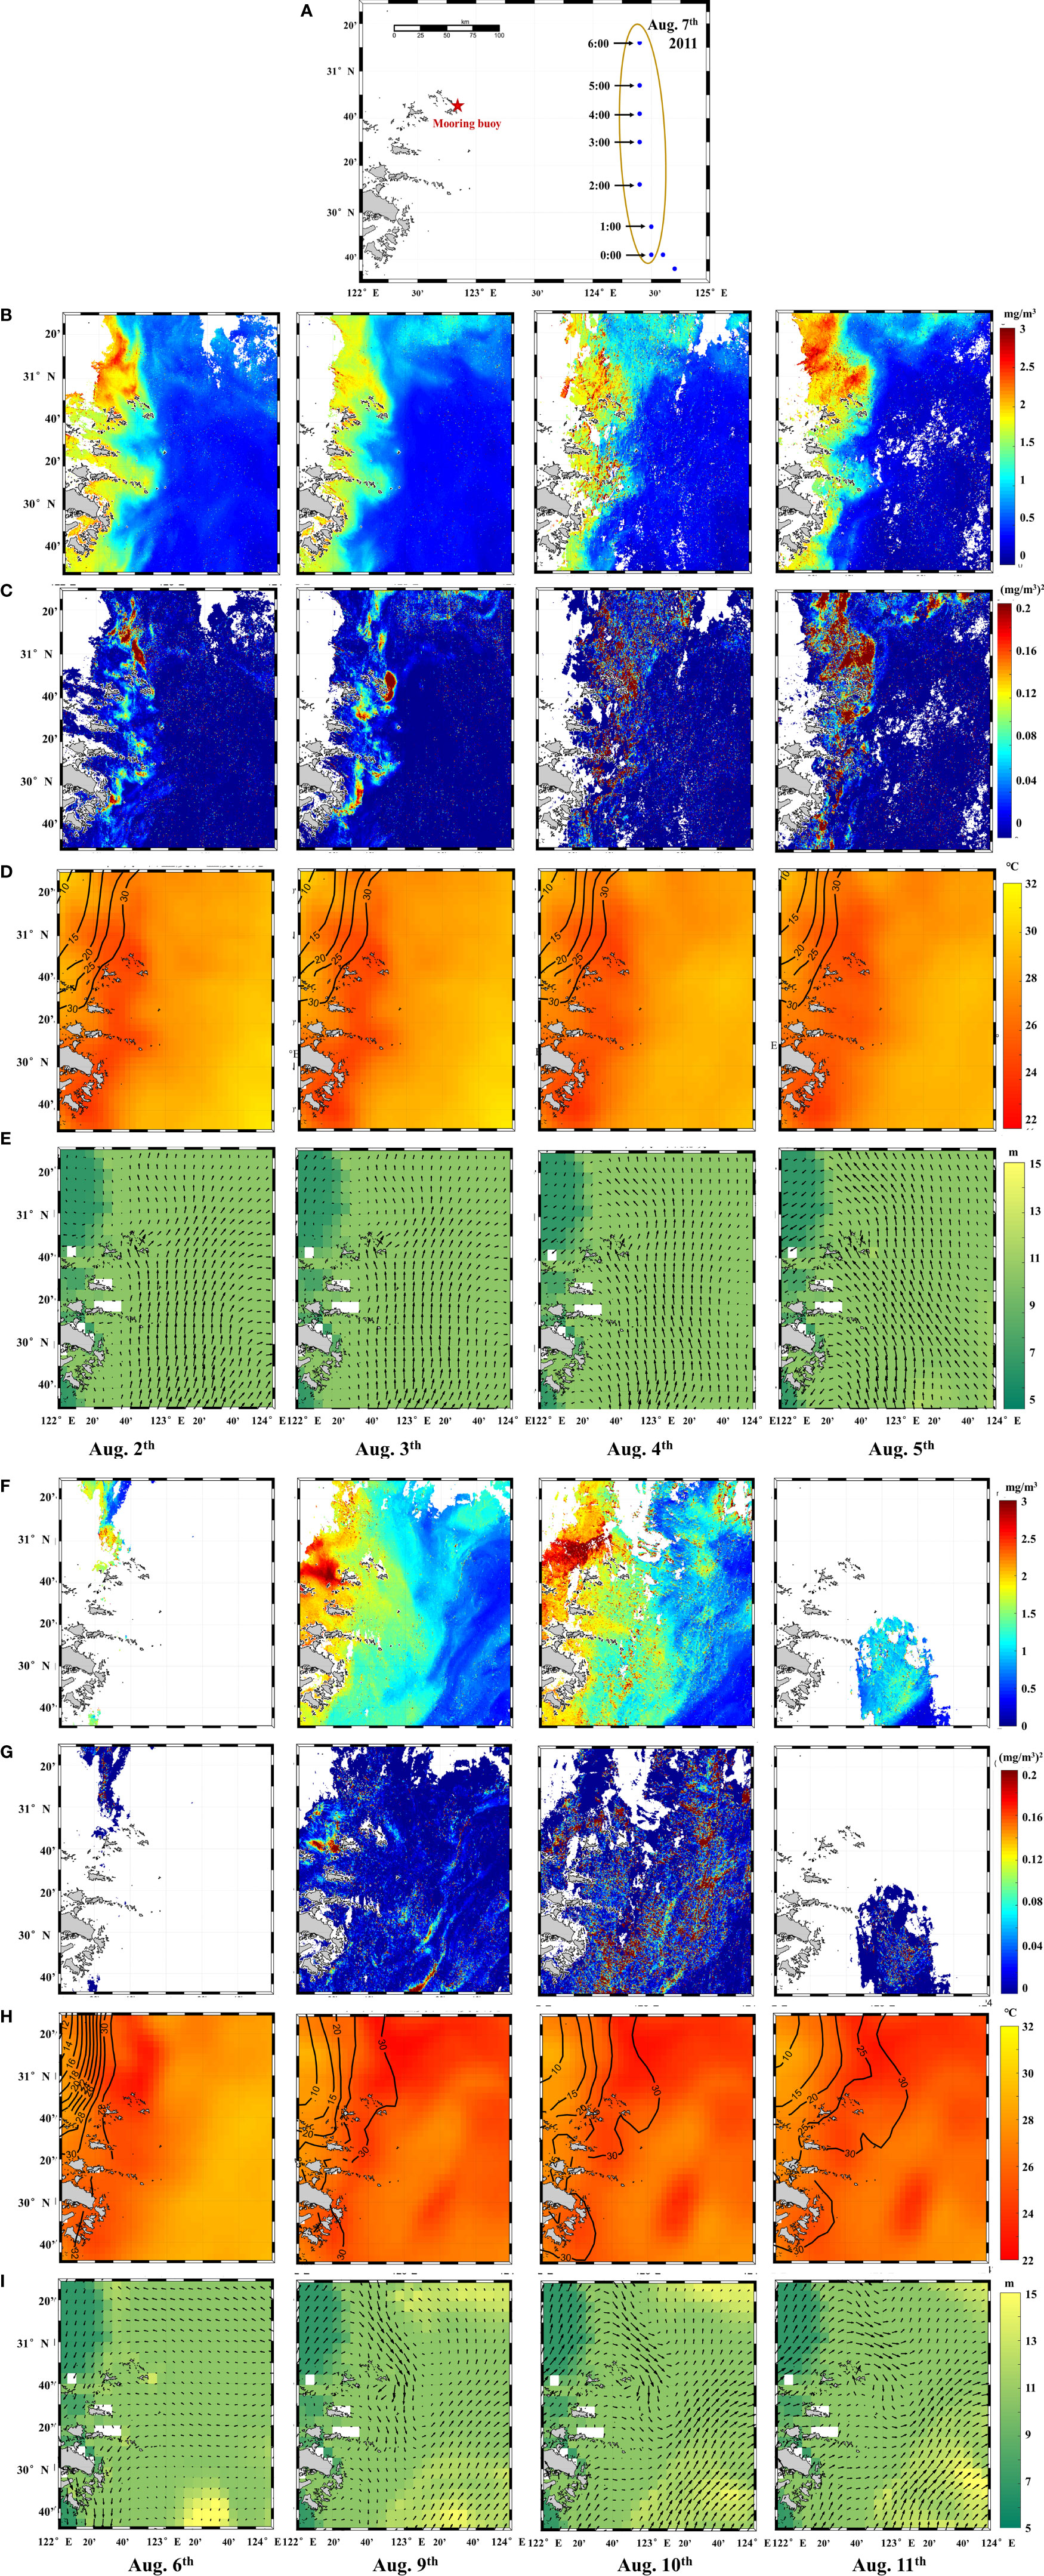
Figure 7 Spatial and temporal distribution of parameters in study area in 2011. The parameter (A, F) Chl a (mg/m3), and (B, G) diurnal variation changes from blue to red. Water temperature (C) is shown in subfigures (D, H), and salinity (unit: spu) is represented by contour lines. Depth of the mixed layer and the flow rate state are shown in subfigure (E, I). White represents cloud coverage.
Before the typhoon, the northeast of the Yangtze Estuary was influenced by the coastal current that represented a cold tongue with a surface temperature of approximately 25°C. Overall, temperatures remained low near the shore and the high-temperature water area was cut off at 123°E. The minimum surface salinity in the study area was below 25‰ and the temperature was above 24°C. The depth of the mixed layer at 29.5°N, 123-124°E was 10 m at first and increased to nearly 16 m on 5 and 6 August. From 2 August to 5 August, the mean Chl a in the southern part of Yangtze Estuary changed little, but the diurnal variation increased largely. In the northern part, both the mean and the diurnal variation were larger. The mean Chl a could reach about 2.5mg/m3, and the maximum diurnal variation could be above 0.2 (mg/m3)2. Moreover, the diurnal variations of Chl a in the near shore were all large, increasing from 0.06 (mg/m3)2 to 0.2 (mg/m3)2 as the typhoon approached, while the diurnal variations of Chl a in the oligotrophic ocean region were low, less than 0.04 (mg/m3)2 in most locations.
After the typhoon, the overall mean Chl a concentration in the water body was higher than that before the typhoon, and the diurnal variation showed differences. On 9 and 10 August, the area with Chl a concentration exceeding 1.0 mg/m3 was further expanded, and it in the oligotrophic ocean region could even exceed 1.5 mg/m3. Chl a over 3 mg/m3 appeared at the intersection of the Yangtze Estuary and Hangzhou Bay. On 9 and 10 August, the diurnal variation in the eutrophic coastal water was close to that on 4 and 5 August, while it was significantly larger in the low-productivity region, which could even be greater than 0.3 (mg/m3)2. The temperature in the study area decreased significantly, with an overall drop of about 2°C. Satellite images revealed a wide patch of cold water in the Nearshore Area. The upwelling held temperature below 23°C in the patch center, and then gradually weakened. Then, a surface warm water (about 27°C) with salinity above 34 moved northward offshore Zhejiang from 9 August, and there was an increasing depth of mixed layer in the southeast corner. The intrusion of the CDW was stronger due to the strong precipitation, and its southward front had reached 29.5°N southward and 123°E eastwards. From 9 to 11 August, the low-salt area expanded eastward to 123.5°E and southward to 29.5°N. Combined with the results in Figure 6, the bottom material came to the surface for mixing due to the influence of upwelling, so there was a small peak of chlorophyll in Nearshore Area on 8 August.
The direction of flow field in the early stage was mainly from south to north. On August 5th, due to the influence of typhoon, the flow field in the southeast direction impacted the study area. Due to the heavy rainfall caused by the typhoon on 9th and 10th, the diluted water of the Yangtze River flowed into the study area obviously, which is also consistent with the content of our previous analysis.
4.2.2 The variations of GOCI-derived parameters during typhoons
The 13-day data were divided into three categories: before typhoon (5 days), during the typhoon (3 days), and after typhoon (5 days). Calculate average values of each category, Fig. 8 shows five typical results in 2012, 2018, 2019, and 2020.
Before the typhoon, most areas west of 123°E were all in high RNL statuses, whereas most areas to the east were in ANL statuses. The results showed that typhoon events have different effects on plankton biomass, even within the same area. Many typhoons have little contribution to, or even have negative effects on, phytoplankton in the nearshore region. During the typhoon, Chl a peaks were observed in the transitional region between the sediment and plume fronts, and the highest diurnal variation appeared in the transitional waters beyond the sediment front. After the typhoon, the chlorophyll concentration in the western part of the 123°E meridian had two situations: the overall decrease (Figures 8A-C), or the increase (Figures 8D, E).
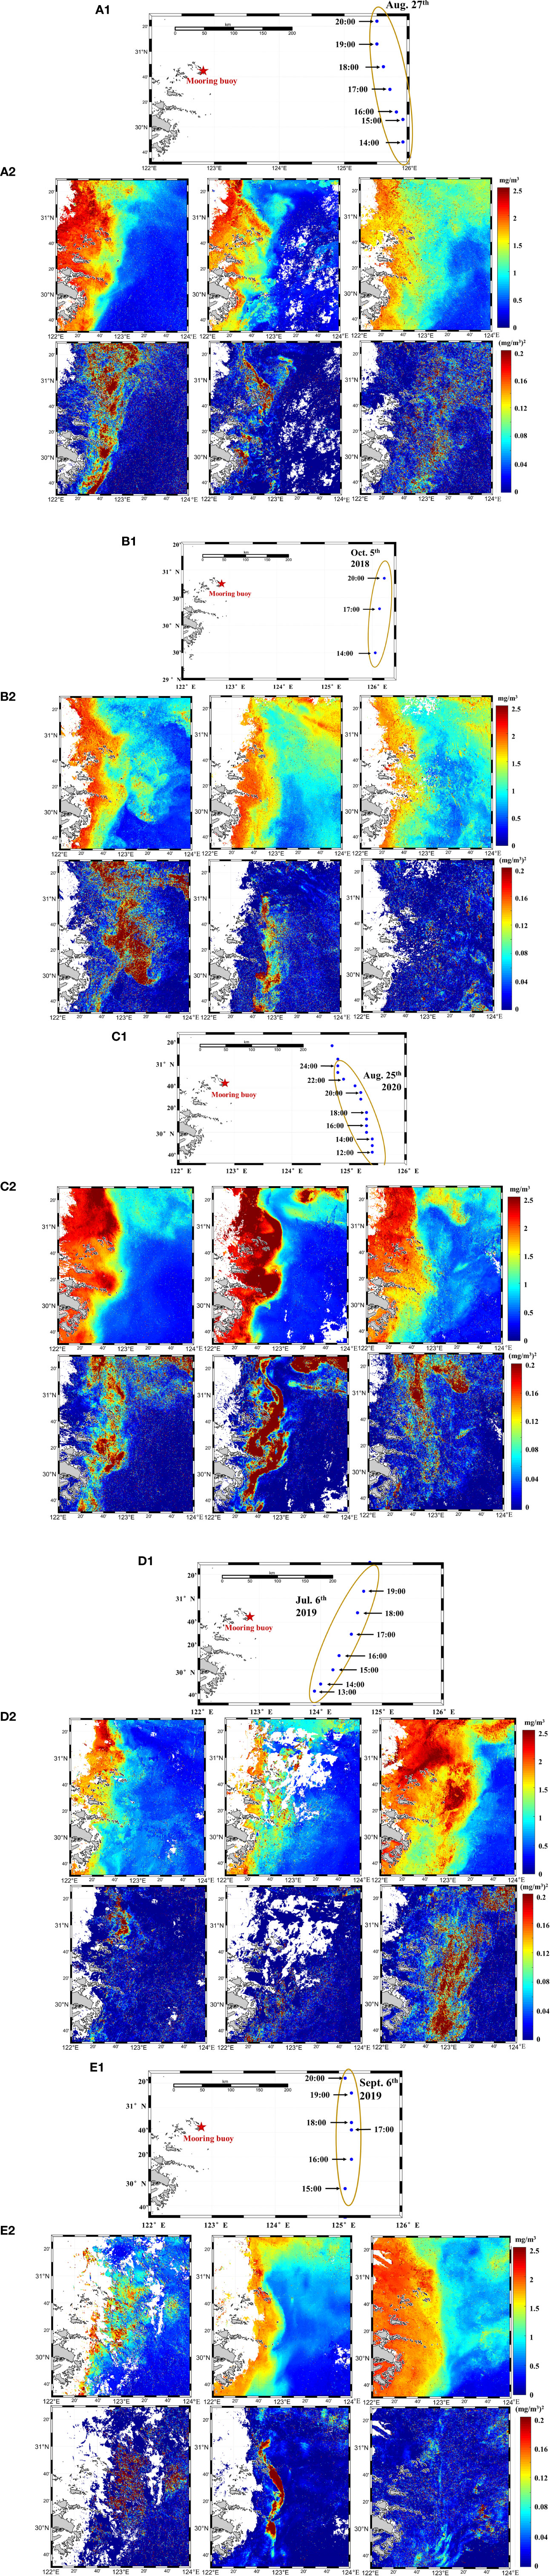
Figure 8 Spatial distribution of parameters measured by GOCI in three periods. The subgraph with suffix 1 shows the time and track of typhoons passing near the study area. Different colors in the subgraph with suffix 2 indicate the concentrations (top row) and variations (bottom row) before (left row), during (left row) and after (left row) (A) Bolaven (2012), (B) Kong-rey (2018), (C) Bavi (2020), (D) LingLing (2019), and (E) Danas (2019) in study area.
4.3 GOCI data results in different areas during the typhoons
Phytoplankton in the Yangtze Estuary and adjacent shelves exhibit complex spatial-temporal heterogeneity. As shown in Figure 8, with 123.5° as the dividing line, there were obvious differences in the changes of results in the Nearshore Area and Offshore Area before and after the typhoon passes.
In the transitional area, the strong vertical mixing and upwelling induced by the typhoon rolled up sedimentation, which is caused by physical-chemical effects near the sediment front. Therefore, the nutrients deposited in the bottom layer are also swept up into the upper water body, resulting in the increase of Chl a concentration and the increase of diurnal variation. Thus, we believe that the original ANL area turned into low ANL status or RNL status. Among them, the southeast corner of the study area is mostly in low ANL status, and the northeast may turn to RNL status.
4.3.1 GOCI data results in Nearshore Area
We compared the GOCI data with the buoy data. Taking the mooring buoy position as the center, we averaged the 3*3 window and used the result as the parameter value of the buoy position. Each pixel in the GOCI image represents an area of 500*500, so there were some differences from the point data measured by the buoy. Table 2 shows the results of valid values from 2011 to 2020. The segmentation rules for the three time periods are consistent with those described in Section 4.2.2.

Table 2 Results at Nearshore Area in GOCI from 2011 to 2020.
Appropriate nutrient ratios are required for phytoplankton production, and most of the Yangtze Estuary region is relatively nutrient-limited, despite high nutrient levels. When the CDW enters the sea, it provides high levels of nutrients to areas affected by plumes and high suspended matter further stimulates phytoplankton productivity. During and after the typhoon, the intense rainfall and floodwaters introduce high quantities of nutrients to the area from atmospheric sources and the adjacent land respectively, strongly enhancing the surface nutrient concentrations. Therefore, changes in the nutrient-limited status led to an increase in the diurnal variation of Chl a in the Nearshore Area after typhoon.
However, heavy rainfall and increased river freshwater flow diluted Chl a concentration. Moreover, massive sediment inflows as well as intense tidal forcing and wind induce bottom resuspension that results in increased turbidity (Cho et al., 2020), which further contributes to changes in the underwater light field, and makes phytoplankton in this area light-limited (Smith and Demaster, 1996; Lohrenz et al., 1999). Therefore, the Chl a concentration decreased after the typhoon passed. The analysis and comparison of Chl a concentration and diurnal variation were consistent with our assumptions described in Section 2.1.
4.3.2 GOCI data results in Offshore Area
The parameter changes in the areas outside the plume front and the sediment front are different from those on the nearshore. The Offshore Area is less affected by turbidity and other factors, and productivity levels are mainly limited by the ratio of nutrients. Taking the average value of the three time periods, the data can be obtained as shown in Table 3.
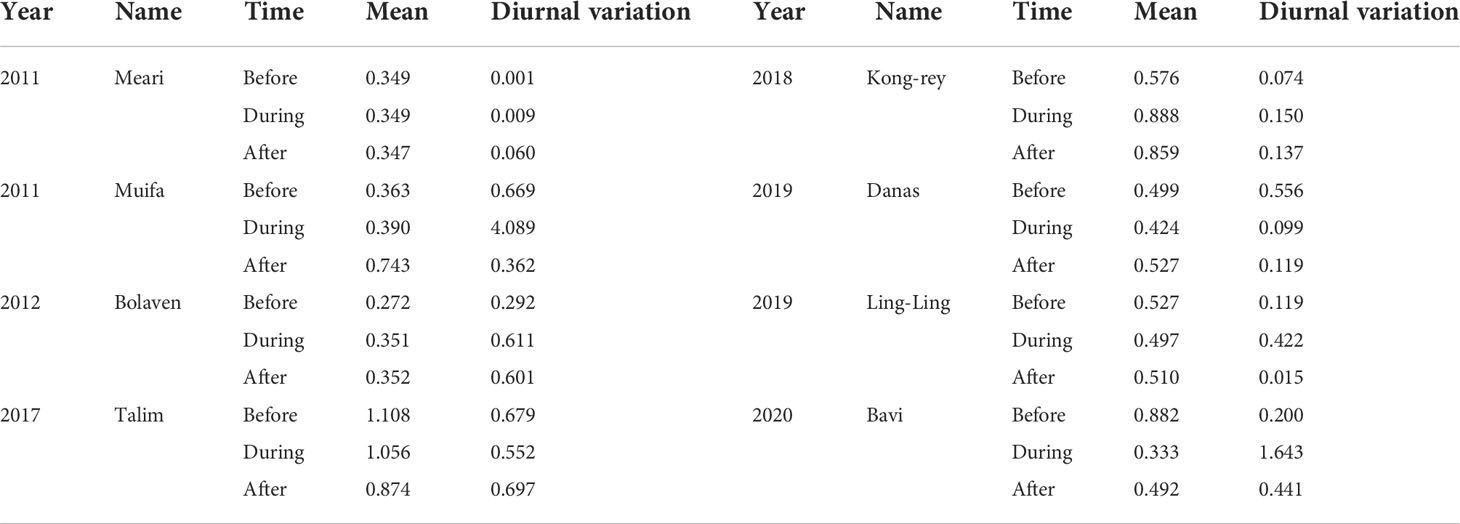
Table 3 Results at Offshore Area in GOCI from 2011 to 2020.
The offshore oligotrophic open sea is characterized by limited nutrients and low turbidities. The upwelling caused by the typhoon rolled the nutrients deposited at the bottom to the surface layer, replenishing the missing phosphorus element, and increasing the productivity of phytoplankton in the area. Therefore, the change in the sea area east of 123° after the typhoon passes is mainly due to the change in the nutrient-limited status. After typhoon Muifa in 2011, typhoon Bolaven in 2012, and typhoon Kong-rey in 2018, the chlorophyll concentration increased significantly, but it was lower than the average value after typhoon Talim in 2017 (more than 1mg/m3). The diurnal variation also increased, and we believe that the nutrient-limited statuses in these time periods all turned to weak RNL statuses.
5 Conclusions
In this paper, we combined remote sensing and mooring buoy based dataset to analyze the growth mechanism of chlorophyll in the Yangtze Estuary before and after the typhoon in 2011. The sediment fronts and plume fronts are used as a reference to select the relative and absolute nutrient-limited status regions to analyze the spatial distribution characteristics of Chl a and to explore the effect of different nutrient statuses on Chl a under typhoon from 2011-2020. During the analysis, the variance was used to display diurnal variation in addition to observing the change of mean Chl a concentrations.
Case studies have shown that the passage of typhoons would cause changes in Chl a concentration. When the typhoon passes by, winds caused by typhoons destroy the stratification of the water and cause strong vertical mixing and upwelling. The GOCI images from 2011 to 2020 show that the Chl a peak appeared in the transition area between the sediment and the plume front, and the highest diurnal variation appeared in the transition water area beyond the sediment front. In addition, the parameter changes in the areas outside the plume front and the sediment front are different from those in the nearshore in RNL status. In the Offshore Area, the mean Chl a after the typhoon is significantly higher than that before the typhoon because of the nutrient status change, while the mean of Chl a within 122-123° decreased, which is affected by the turbidity and the dilution effect of heavy rainfall. The nutrient-limited statuses in the Offshore Area can turned to weak RNL statuses after the typhoon. Chl a diurnal variation calculated from satellite data is larger after the typhoon compared to that before the typhoon throughout the study area, and the nutrient-limited status had different changes.
Data availability statement
The original contributions presented in the study are included in the article/supplementary material. Further inquiries can be directed to the corresponding author.
Author contributions
YX and JC contributed to conception and design of the study. JC organized the database. YX performed the statistical analysis. YX wrote the first draft of the manuscript. YX and JC wrote sections of the manuscript. Both authors contributed to the article and approved the submitted version.
Funding
This research was funded by the Project of State Key Laboratory of Satellite Ocean Environment Dynamics, Second Institute of Oceanography (No. SOEDZZ2203), NSFC‐Zhejiang Joint Fund for the Integration of Industrialization and Informatization (Grant U1609202), the National Key Research and Development Program of China (Grant 2016YFC1400903), and National Natural Science Foundation of China (Grants 42076216, 41376184 and 40976109).
Acknowledgments
The authors thank the Korea Institute of Ocean Science & Technology (KIOST) for providing the freely available GOCI data (http://kosc.kiost.ac.kr/, accessed on Jul.13, 2021), European Space Agency for the information on mixed layer thickness and salinity (ftp://anon-ftp.ceda.ac.uk/neodc/esacci/sea_surface_salinity/data/v03.21/), and Met Office for temperatures data (ftp://nrt.cmems-du.eu/Core/SST_GLO_SST_L4_NRT_OBSERVATIONS_010_001/METOFFICE-GLO-SST-L4-NRT-OBS-SST-V2).
Conflict of interest
The authors declare that the research was conducted in the absence of any commercial or financial relationships that could be construed as a potential conflict of interest.
Publisher’s note
All claims expressed in this article are solely those of the authors and do not necessarily represent those of their affiliated organizations, or those of the publisher, the editors and the reviewers. Any product that may be evaluated in this article, or claim that may be made by its manufacturer, is not guaranteed or endorsed by the publisher.
References
Arrigo K. R. (2005). Marine microorganisms and global nutrient cycles. Nature 438, 122–122. doi: 10.1038/nature04265
Chai C., Yu Z. M., Song X. X., Cao X. H. (2006). The status and characteristics of eutrophication in the Yangtze river (Changjiang) estuary and the adjacent East China Sea, China. Hydrobiologia 563, 313–328. doi: 10.1007/s10750-006-0021-7
Chen S. S., Han L. S., Chen X. Z., Li D., Sun L., Li Y. (2015). Estimating wide range total suspended solids concentrations from MODIS 250-m imageries: An improved method. Isprs J. Photogram. Remote Sens. 99, 58–69. doi: 10.1016/j.isprsjprs.2014.10.006
Chen J. Y., Li D. J., Chen B. L., Hu F. X., Zhu H. F., Liu C. Z. (1999). The processes of dynamic sedimentation in the changjiang estuary. J. Sea Res. 41, 129–140. doi: 10.1016/S1385-1101(98)00047-1
Chen C., Mao Z. H., Tang F. P., Han G. Q., Jiang Y. Z. (2017). Declining riverine sediment input impact on spring phytoplankton bloom off the Yangtze river estuary from 17-year satellite observation. Continental Shelf Res. 135, 86–91. doi: 10.1016/j.csr.2017.01.012
Chen J. Y., Ni X. B., Liu M. L., Chen J. F., Mao Z. H., Jin H. Y., et al. (2014). Monitoring the occurrence of seasonal low-oxygen events off the changjiang estuary through integration of remote sensing, buoy observations, and modeling. J. Geophys. Res. Oceans 119, 5311–5322. doi: 10.1002/2014JC010333
Chen J. Y., Ni X. B., Mao Z. H., Wang Y. F., Liang L. J., Gong F. (2012). Remote sensing and buoy based effect analysis of typhoon on hypoxia off the Changjiang (Yangtze) Estuary. Conference on Remote Sensing of the Ocean, Sea Ice, Coastal Waters and Large Water Regions, Sep 26-27 2012 Edinburgh, Scotand.
Cho J. H., Son Y. B., Shin D.-H., Moh T., Jang S., Lee S. Y., et al. (2020). Changes in underwater visibility due to turbidity associated with typhoon soulik. J. Coast. Res. 95, 417–421. doi: 10.2112/SI95-081.1
Dai Z. J., Liu J. T., Wei W., Chen J. Y. (2014). Detection of the three gorges dam influence on the changjiang (Yangtze river) submerged delta. Sci. Rep. 4, 6600. doi: 10.1038/srep06600
Du Z. H., Qi J., Wu S. S., Zhang F., Liu R. Y. (2021). A spatially weighted neural network based water quality assessment method for Large-scale coastal areas. Environ. Sci. Technol. 55, 2553–2563. doi: 10.1021/acs.est.0c05928
Elsner J. B., Liu K. B. (2003). Examining the ENSO-typhoon hypothesis. Climate Res. 25, 43–54. doi: 10.3354/cr025043
Falkowski P. G. (1997). Evolution of the nitrogen cycle and its influence on the biological sequestration of CO2 in the ocean. Nature 387, 272–275. doi: 10.1038/387272a0
Ge J. Z., Torres R., Chen C. S., Liu J., Xu Y., Bellerby R., et al. (2020). Influence of suspended sediment front on nutrients and phytoplankton dynamics off the changjiang estuary: A FVCOM-ERSEM coupled model experiment. J. Mar. Syst. 204, 103292. doi: 10.1016/j.jmarsys.2019.103292
Good S., Fiedler E., Mao C., Martin M. J., Maycock A., Reid R., et al. (2020). The current configuration of the OSTIA system for operational production of foundation Sea surface temperature and ice concentration analyses. Remote Sens 12, 720. doi: 10.3390/rs12040720
Guan S. D., Li S. Q., Hou Y. J., Hu P., Liu Z., Feng J. Q. (2018). Increasing threat of landfalling typhoons in the western north pacific between 1974 and 2013. Int. J. Appl. Earth Observation Geoinformation 68, 279–286. doi: 10.1016/j.jag.2017.12.017
Guan S. D., Liu Z., Song J. B., Hou Y. J., Feng L. Q. (2017). Upper ocean response to super typhoon tembi) explored using multiplatform satellites and argo float observations. Int. J. Remote Sens. 38, 5150–5167. doi: 10.1080/01431161.2017.1335911
Jiang Z. B., Chen J. F., Zhou F., Shou L., Chen Q. Z., Tao B. Y., et al. (2015). Controlling factors of summer phytoplankton community in the changjiang (Yangtze river) estuary and adjacent East China Sea shelf. Continental Shelf Res. 101, 71–84. doi: 10.1016/j.csr.2015.04.009
Kim W., Moon J. E., Park Y. J., Ishizaka J. (2016). Evaluation of chlorophyll retrievals from geostationary ocean color imager (GOCI) for the north-East Asian region. Remote Sens Environ. 184, 482–495. doi: 10.1016/j.rse.2016.07.031
Le Traon P. Y., Reppucci A., Alvarez Fanjul E., Aouf L., Behrens A., Belmonte M., et al. (2019). From observation to information and users: The Copernicus marine service perspective. Front. Mar. Sci. 6, 234. doi: 10.3389/fmars.2019.00234
Li W. Q., Ge J. Z., Ding P. X., Ma J. F., Glibert P. M., Liu D. Y. (2021). Effects of dual fronts on the spatial pattern of chlorophyll-a concentrations in and off the changjiang river estuary. Estuaries Coasts 44, 1408–1418. doi: 10.1007/s12237-020-00893-z
Li Y. L., Shen Z. L., Xian W. W., Liu S. M. (2015). Structure characteristics of nutrients and their restrictive effect on phytoplankton in the Yangtze river estuary. Mar. Sci. 39 (4), 125–134. doi: 10.11759/hykx20140714001
Lohrenz S. E., Fahnenstiel G. L., Redalje D. G., Lang G. A., Dagg M. J., Whitledge T. E., et al. (1999). Nutrients, irradiance, and mixing as factors regulating primary production in coastal waters impacted by the Mississippi river plume. Continental Shelf Res. 19, 1113–1141. doi: 10.1016/S0278-4343(99)00012-6
Luan H. L., Ding P. X., Wang Z. B., Ge J. Z., Yang S. L. (2016). Decadal morphological evolution of the Yangtze estuary in response to river input changes and estuarine engineering projects. Geomorphology 265, 12–23. doi: 10.1016/j.geomorph.2016.04.022
Martiny A. C., Talarmin A., Mouginot C., Lee J. A., Huang J. S., Gellene A. G., et al. (2016). Biogeochemical interactions control a temporal succession in the elemental composition of marine communities. Limnology Oceanography 61, 531–542. doi: 10.1002/lno.10233
Matthews M. W., Bernard S., Winter K. (2010). Remote sensing of cyanobacteria-dominant algal blooms and water quality parameters in zeekoevlei, a small hypertrophic lake, using MERIS. Remote Sens. Environ. 114, 2070–2087. doi: 10.1016/j.rse.2010.04.013
Min J. E., Choi J. K., Yang H., Lee S., Ryu J. H. (2014). Monitoring changes in suspended sediment concentration on the southwestern coast of Korea. J. Coast. Res. 70, 133–138. doi: 10.2112/SI70-023.1
Moore C. M., Mills M. M., Langlois R., Milne A., Achterberg E. P., La Roche J., et al. (2008). Relative influence of nitrogen and phosphorus availability on phytoplankton physiology and productivity in the oligotrophic sub-tropical north Atlantic ocean. Limnology Oceanography 53, 291–305. doi: 10.4319/lo.2008.53.1.0291
Oey L. Y., Chou S. (2016). Evidence of rising and poleward shift of storm surge in western north pacific in recent decades. J. Geophys. Res. Oceans 121, 5181–5192. doi: 10.1002/2016JC011777
Siswanto E., Ishizaka J., Tripathy S. C., Miyamura K. (2013). Detection of harmful algal blooms of karenia mikimotoi using MODIS measurements: A case study of seto-inland Sea, Japan. Remote Sens. Environ. 129, 185–196. doi: 10.1016/j.rse.2012.11.003
Smith W. O., Demaster D. J. (1996). Phytoplankton biomass and productivity in the Amazon river plume: Correlation with seasonal river discharge. Continental Shelf Res. 16, 291–319. doi: 10.1016/0278-4343(95)00007-N
Song K. S., Li L., Wang Z. M., Liu D. W., Zhang B., Xu J. P., et al. (2012). Retrieval of total suspended matter (TSM) and chlorophyll-a (Chl-a) concentration from remote-sensing data for drinking water resources. Environ. Monit. Assess. 184, 1449–1470. doi: 10.1007/s10661-011-2053-3
Sun L., Li Y. X., Yang Y. J., Wu Q., Chen X. T., Li Q. Y., et al. (2014). Effects of super typhoons on cyclonic ocean eddies in the western north pacific: A satellite data-based evaluation between 2000 and 2008. J. Geophysical Research-Oceans 119, 5585–5598. doi: 10.1002/2013JC009575
Talarmin A., Lomas M. W., Bozec Y., Savoye N., Frigstad H., Karl D. M., et al. (2016). Seasonal and long-term changes in elemental concentrations and ratios of marine particulate organic matter. Global Biogeochemical Cycles 30, 1699–1711. doi: 10.1002/2016GB005409
Tyrrell T. (1999). The relative influences of nitrogen and phosphorus on oceanic primary production. Nature 400, 525–531. doi: 10.1038/22941
Wang T. Y., Zhang S. W. (2021). Effect of summer typhoon linfa on the chlorophyll-a concentration in the continental shelf region of northern south China Sea. J. Mar. Sci. Eng. 9 (8), 794. doi: 10.3390/jmse9080794
Wu Q. Y., Chen D. K. (2012). Typhoon-induced variability of the oceanic surface mixed layer observed by argo floats in the Western north pacific ocean. Atmosphere-Ocean 50, 4–14. doi: 10.1080/07055900.2012.712913
Wu T. N., Wu H. (2018). Tidal mixing sustains a bottom-trapped river plume and buoyant coastal current on an energetic continental shelf. J. Geophysical Research-Oceans 123, 8026–8051. doi: 10.1029/2018JC014105
Xu J. J., Zhou P., Lian E. G., Wu H., Liu D. Y. (2021). Spatial distribution of chlorophyll a and its relationships with environmental factors influenced by front in the changjiang river estuary and its adjacent waters in summer 2019. Mar. Sci. Bull. 40 (5), 541–549. doi: 10.11840/j.issn.1001-6392.2021.05.006
Xu S. S., Song J. M., Li X. G., Yuan H. M., Li N., Duan L. Q., et al. (2010). Changes in nitrogen and phosphorus and their effects on phytoplankton in the bohai Sea. Chin. J. Oceanology Limnology 28, 945–952. doi: 10.1007/s00343-010-0005-3
Xu Y., Zhang Y., Chen H. Q., Zhang D. (2011). Stndy on Dissolved Inorganic Nitrogen Monitoring Based on MODIS Imaging for Haizhou Bay. Adv. In Mar. Sci. 29 (1), 73–80. doi: 10.3724/SP.J.1011.2011.00403
Keywords: remote sensing, buoy, chlorophyll a, Yangtze estuary, nutrient-limited status, typhoon
Citation: Xu Y and Chen J (2022) Remote sensing and buoy based monitoring of chlorophyll a in the Yangtze Estuary reveals nutrient-limited status dynamics: A case study of typhoon. Front. Mar. Sci. 9:1017936. doi: 10.3389/fmars.2022.1017936
Received: 12 August 2022; Accepted: 01 November 2022;
Published: 18 November 2022.
Edited by:
Lei Ren, Sun Yat-sen University, ChinaReviewed by:
Yang Ding, Ocean University of China, ChinaYunhai Li, Third Institute of Oceanography, Ministry of Natural Resources, China
Copyright © 2022 Xu and Chen. This is an open-access article distributed under the terms of the Creative Commons Attribution License (CC BY). The use, distribution or reproduction in other forums is permitted, provided the original author(s) and the copyright owner(s) are credited and that the original publication in this journal is cited, in accordance with accepted academic practice. No use, distribution or reproduction is permitted which does not comply with these terms.
*Correspondence: Jianyu Chen, Y2hlbmppYW55dUBzaW8ub3JnLmNu