 Tianjiao Dai
 Shuo Yang1,2
 Yihan Xing
 Yucong Ma
95% of researchers rate our articles as excellent or good
Learn more about the work of our research integrity team to safeguard the quality of each article we publish.
Find out more
ORIGINAL RESEARCH article
Front. Mar. Sci. , 04 October 2022
Sec. Ocean Solutions
Volume 9 - 2022 | https://doi.org/10.3389/fmars.2022.1016062
This article is part of the Research Topic Dynamics and Hydrodynamics of Offshore Renewable Energy Devices View all 9 articles
Developing offshore low carbon and renewable energy value chains to realize a net-zero energy future requires combining offshore renewable energy and carbon capture storage (CCS) solutions. The subsea shuttle tanker (SST) was presented in recently published works to accelerate the adoption of offshore CCS systems. The SST is a novel underwater vessel designed to transport CO2 autonomously from offshore facilities to subsea wells for direct injection at marginal fields using a flowline connected. The SST will be subjected to stochastic currents and experience dynamic responses during this offloading process. The offloading flowline must be designed to handle this dynamic response. As such, this paper establishes the baseline design for this flowline. The cross-section and global configuration designs drive the flowline design. For the cross-section design, the pressure containment, collapse and local buckling criteria defined in DNV-OS-F101 are applied to validate the required structural capacity at specified water depths. For the configuration design, the principle factors concerning the water depth, internal flow rate, and current speed are investigated to further validate the stress capacity according to the allowed von Mises stress level for a more robust baseline design. Finally, the flowline connecting and disassembly methodology is proposed, and the critical factor of well-coordinated speed between flowline and SST is investigated to avoid overbending during the lifting and lowering phases.
Developing offshore low carbon and renewable energy value chains to realize a net-zero energy future requires combining offshore renewable energy and carbon capture storage (CCS) solutions. To accelerate the adoption of offshore CCS systems, Equinor originally proposed the subsea shuttle tanker in two research disclosures in 2019 (Equinor Energy AS, 2019) and 2020 (Ellingsen et al., 2020) to be an economically attractive alternative to offshore pipelines and tanker ships for marginal offshore CO2 fields. The marginal fields targeted by the SST usually do not have sufficient CO2 volumes to support the use of permanently installed offshore pipelines or larger tanker ships. This vessel loads CO2 from onshore facilities, e.g., ports or temporary storage tanks, and travel at a constant water depth of 70 m to deliver this CO2 to the subsea well for permanent storage or enhanced oil recovery. As the SST operates underwater surface away from waves and wind, it can operate in any weather, allowing for possible operations even in severe sea conditions. Following the disclosures by Equinor (Equinor Energy AS, 2019; Ellingsen et al., 2020; Xing et al., 2021b) discussed essential considerations of the SST. Based on the design considerations made, Ma et al. (2021c) went on to establish a baseline SST design for academic studies. Since then, several research works on the SST have been performed. These included maneuvering studies (Ma et al., 2021a; Ma et al., 2022), structural analysis (Jamissen et al., 2022), computational fluid dynamics analysis (Xing et al., 2021a), CO2 design considerations (Ma et al., 2021b), and technical and economic feasibility studies (Xing et al., 2021c).
The SST is designed to contribute to a cleaner maritime industry by transporting liquid cargos in an emission-free manner and further mitigates global warming by operating in offshore carbon capture, utilization and storage (CCUS) projects. The SST is fully electrically powered and therefore has zero carbon footprint during operations. This can help reduce the greenhouse gas emission from the maritime sector, which occupies roughly 3.3% of fossil-fuel-related emissions worldwide (Xing et al., 2021c) (Papanikolaou, 2014). According to the techno-economic analysis performed by Xing et al. (2021c), the SST also makes it possible for large fields and those fields with marginal profits located away from the coast to be utilized as offshore CO2 storage sites. This helps the SST to cope with the future, increasing global demand for CCUS capacity.
The cargo discharging of the SST is performed in the following manner. The SST will approach the subsea well during the offloading process and hover in its vicinity. An ROV will then assist in pulling the flowline up and connecting it with the SST. The CO2 is later discharged through a flowline connected to the subsea well while hovering at operating depth near the subsea well. The SST will approach the subsea well and hover over outside a safety region to avoid a collision. This offloading method makes it possible for the SST to offload to subsea wells located greater than its permissible diving depth while the vessel hovers at a constant operation depth. Besides, this offloading method can also minimize the risk of collision between the SST and subsea facilities since the SST does not need to travel close to the wellhead during the offloading. Therefore, the SST must be designed for 70 m instead of the subsea wellhead water depth. Throughout the offloading process, it is dynamic-positioned by a pair of tunnel thrusters and its propeller. The hydrostatic pressure is proportional to the depth, and the ocean current is dynamic and stochastic. During discharging, the SST is dragged around by the environmental loads, resulting in a trajectory footprint. Recent studies on the hovering control problem by Ma et al. (2022) showed that SST could move in the surge and heave directions by approximately 4 m in a 4-hour realization, where the mean current velocity is 1.5 m/s. This means that the SST experiences highly dynamic and large motions during offloading. These motions may result in significant load effects experienced by the flowline. Further, extreme response analysis using the ACER method performed by Xing et al. (2022) showed that the 5-year extreme responses could be more than 1.5 times the short-term 4-hour response. This means the flowline experiences significant dynamic load effects that must be appropriately considered and designed.
This paper will continue to further develop the baseline SST in flowline design, where the flowline used while offloading is established and investigated. The paper is organized as follows. First, the SST baseline design is introduced. Second, the cross-section design is established and verified against the collapsing, pressure containment and local buckling criteria. Third, global flowline configuration dynamic response analyses are performed to more robustly verify the cross-section design and von mises stress criterion. This includes more sensitivity studies concerning the water depth, internal flow rate, current speed and flowline connecting, and disassembly validations are performed to characterize the flowline design further.
The baseline SST design was developed by Ma et al. (2021c) based on the extensive design considerations made by Xing et al. (2021b); This vessel (Ma et al., 2021c) is an extra-large autonomous freight submarine designed to serve the current existing offshore CCUS projects in the Norwegian Continental Shelf. These projects are located in the North Sea offshore oil and gas fields: Sleipner, Utgard and Snøhvit (NPD (Norwegian Petroleum Directorate), 2021). Further, the structural design of the baseline SST is checked against DNV military submarine code DNVGL-RU-NAVAL-Pt4Ch1 (DNV, 2018).
The baseline SST design (Ma et al., 2021c) allowed for detailed research studies such as evaluating the technical-economic feasibility of the SST (Xing et al., 2021c). Such an analysis is impossible without a fully defined SST baseline design, as pricing exercises require design details at the component level. The technical-economic feasibility study concluded that the SST is competitive for short distances and low CO2 volumes, which are the characteristics of marginal fields.
The Simulink model was first unveiled by Ma et al. (2021a) to present the depth control modelling. This work is later extended by Ma et al. (2022) to study the hovering problem. Most recently, the model has been deployed to study the extreme motion responses under the effect of stochastic currents when the aft thruster fails (Xing et al., 2022).
The Simulink model is divided into the following components:
● A plant model assembles the equation of motions of the SST considering hydrostatic loads, added mass, body drag, and body lift. The added mass, body drag and lift are expressed as nonlinear hydrodynamic derivatives.
● An actuator system model implements the contributions provided by the propeller and thrusters.
● An LQR control system model for SST stationary control. The tuning of the LQR controller is discussed in Ma et al. (2022).
● An Luenberger Observer (Luenberger, 1971) to monitor the SST states.
● A current velocity model represents the stochastic ocean current velocities as a first-order Gauss-Markov process (Sørensen, 2004; Fossen, 2011).
Since the SST hovers 70 m underwater, its dynamic response is assumed to be only determined by current load instead of wave and wind loads. The ocean current velocity, Vc and current inflow angle θc are both represented as first-order Gauss-Markov process (Sørensen, 2004; Fossen, 2011). Further details of the Simulink model are discussed in Ma et al. (2022) and Xing et al. (2022)
where μ1 and μ2 are time constants, according to (Fossen, 2011) these values should be non-negative. ω1 and ω2 are Gaussian white noises. In this study, μ1= μ2= 1 is used to generate a steady-state current. The noise powers of ω1 and ω2 are set to be 0.1 to generate the fluctuating parts.
Therefore, the heading current speed uc and vertical current speed wc can be obtained as:
The incoming water velocity experience by the SST, u and w in the surge and heave directions (SST body frame) are calculated as follows:
where usst and wsst are the velocities of the SST in the surge and heave directions in SST body frame.
The flowline design presented in this paper is applied in the subsea wellhead conditions at the Sleipner field on the Norwegian Continental Shelf. The steel catenary riser (SCR) is used as the flexible flowline with the SST to transport the liquid CO2. The SCR is the standard and preferred riser type for deepwater applications due to its simplicity and lower cost (Eyssautier et al., 2018; Huang et al., 2022) and is adopted for the SST for the same reasons. The SCR design methodology includes the riser cross-section and global configuration design, as shown in Figure 1. First, the riser wall thickness should be selected based on the bursting and collapsing criteria following DNV-OS-F101 (DNV, 2013). Dapa et al. (2019) also performed a sensitivity study on the wall thickness effects on the strength and fatigue life of SCR. In addition, the wall thickness in this study design must consider the effect of corrosion which is accounted for by DNV-OS-F101 (DNV, 2013) using the corrosion rates from DNV-RP-J202 (DNV, 2010). These corrosion rates are mainly based on the work performed by Brown et al. (2014), who studied steel corrosion rates for different CO2 impurities. In addition, the riser cross-section geometry also considers the flow capacity determined by SST. Next, the cross-section design obtained and riser strength capacity are then further verified by the global configuration analysis. This is performed using a global dynamic response analysis using Orcaflex (Orcaflex, 2022), a popular offshore engineering tool that is based on the finite element method. Then the determined riser cross-section geometry data is presented in Table 1. More details of the design process are presented in Sections 2.2 and 2.3 for the cross-section design and global configuration analysis, respectively.
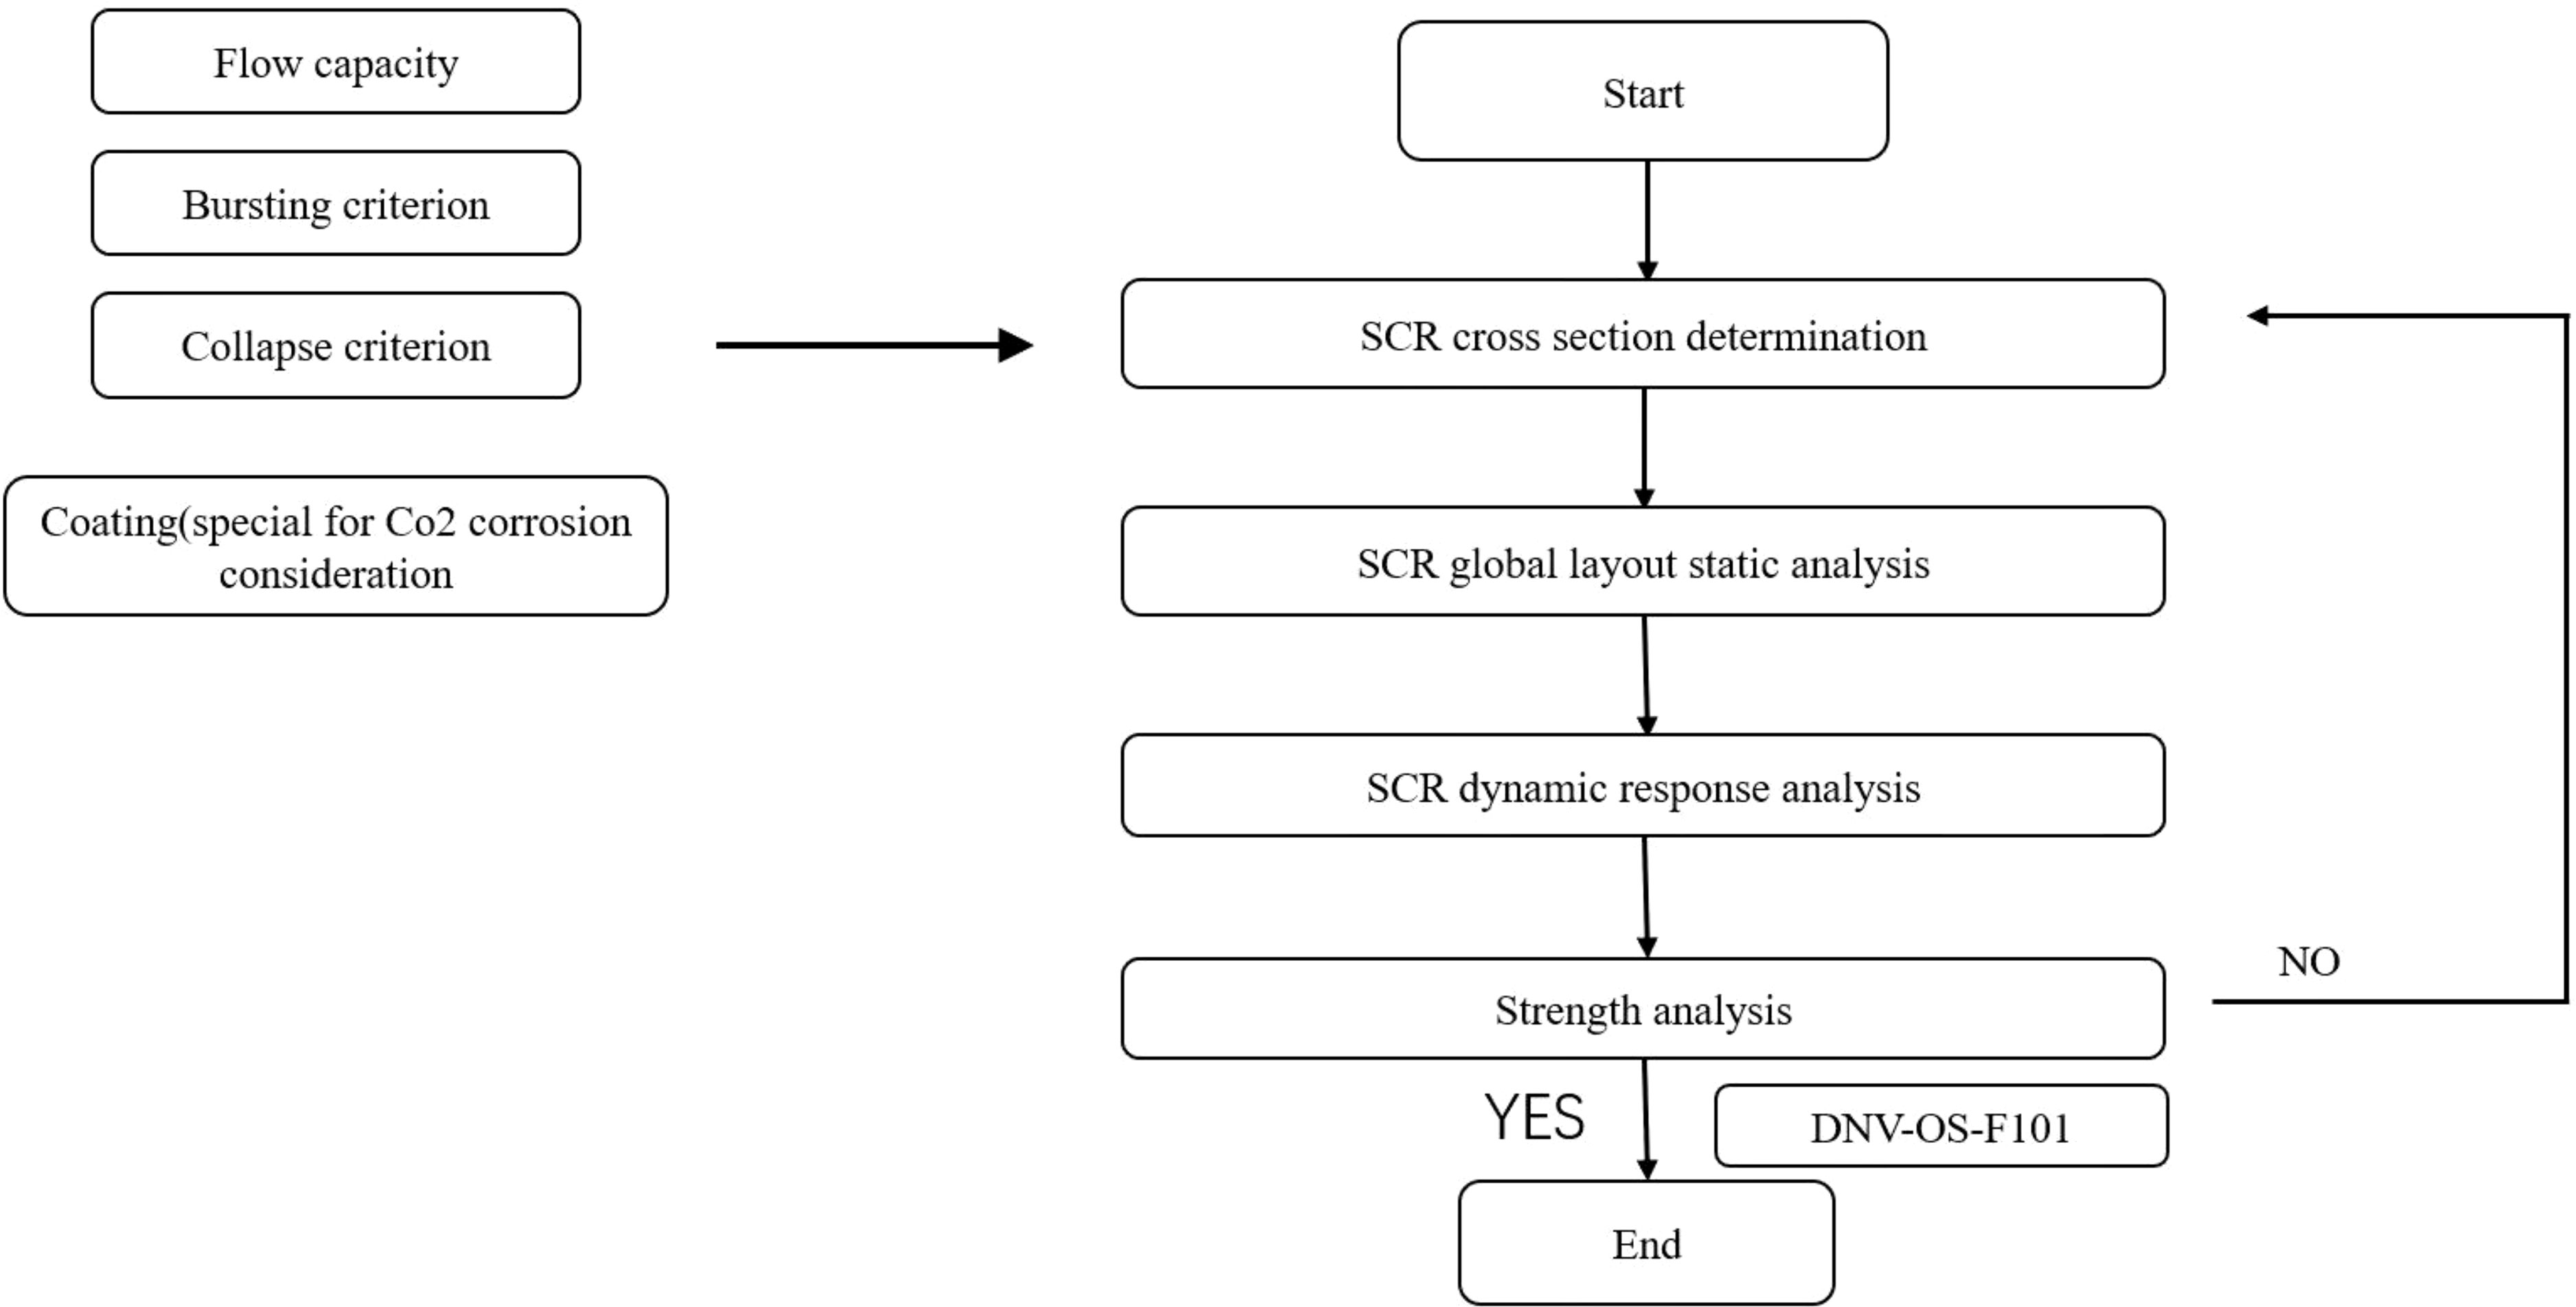
Figure 1 Flowline baseline design’s flow chart.
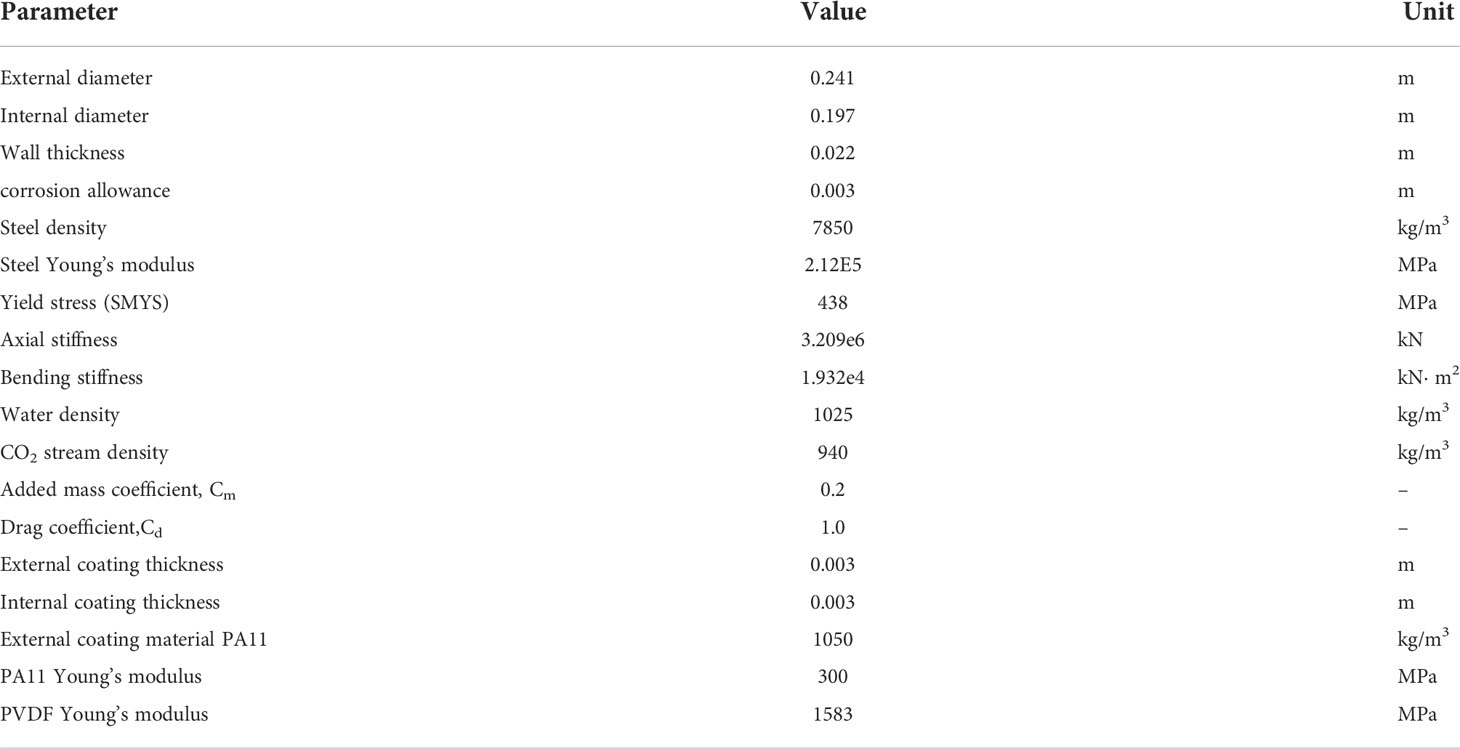
Table 1 Main parameters of steel catenary riser (SCR).
The SST carries CO2 in the saturated liquid form with average conditions of 45 bar and 10°C. The CO2 is directly injected into the subsea well using a booster pump, increasing the pressure to 80 bar at the subsea wellhead during offloading; 80 bar is the subsea wellhead injection pressure at Sleipner (Ma et al., 2021b). This defines the internal design pressure of the flowline. The water depth at Sleipner is about 80 m, which corresponds to an external hydrostatic pressure of 8 bar, which is used as the external design pressure of the flowline. The baseline SST design current speed is generally defined as 1 m/s (Ma et al., 2021c), which is also used as the flowline design current speed. Further, based on the average offloading duration requirement of 6 hours, an inner diameter of approximately 0.18 – 0.19 m is required. This inner diameter is used as the basis for the design. The load conditions used for the flowline design are summarized in Table 2.
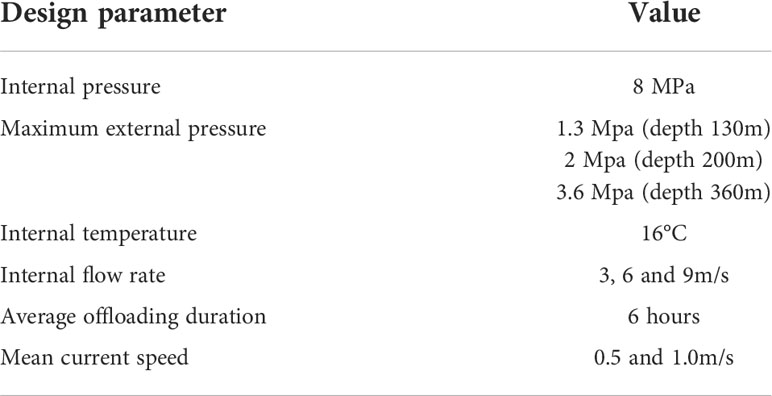
Table 2 The load conditions for flowline during offloading process.
The flowline weight increases with increasing cross-section geometry, resulting in a larger effect on the SST hovering stability. Therefore, the minimum cross-section geometry should be selected for weight control. In addition, the flowline should have sufficient internal pressure containment resistance (bursting), collapsing resistance, and local buckling resistance against the busting and collapsing under the load conditions in Table 2 according to DNV-OS-F101 (DNV, 2013) in this primary cross-section design phase. This is achieved by iterated steps balancing between these two considerations until the minimum weight is obtained.
The DNV-OS-F101 (DNV, 2013) adopts the limit-state design approach in a way that evaluates the potential for failure and the consequences of failure. The probability of failure is dependent on the consequence of failure. This is achieved by the risk and reliability technique used to evaluate the distributions on loads and resistance. After this target reliability is obtained, the corresponding safety factors can be determined. Then the safety factors would be applied to each load and resistance component according to the load and resistance factor design (LRFD) format in Eq. (4) in DNV-OS-F101 (DNV, 2013). Therefore, this limit-state design enables the designer to account for the low probability of worst-case conditions and determine the pipe design required to achieve a satisfactory level of safety.
Lsd is the design load Eq. (5) and Rsd is the design resistance in Eq. (6).
In this flowline design case, the design loads include the internal and external pressures, bending moment, effective tension and weight. These loads are summarized as functional loads and are given in Table 3. In this primary design, the environmental loads LE are not considered. The interference loads LI and accidental loads LA are also not included in the serviceability limit state design. The required partial safety factors are given according to the specified safety class. The safety class is determined based on the consequences by accounting for the location, the fluids and duration. In this work, since the liquid CO2 leakage may happen during offloading operation resulting in significant ocean pollution, the probability of occurrence is less than 10-3 within a year of high safety class for the serviceability limit state. γF, γE, γA are the corresponding load effect factors shown in Table 3. γc is the condition load effect factor.

Table 3 Load effect factors according to the serviceability limit state.
The flowline resistance capacity is determined by the material property (yield and ultimate strength), wall thickness and diameter in Eq. (6). The safety class factor S γsc and material factor γm according to the pressure containment, collapse and local buckling failure mechanism are presented in Table 4 for the high safety class in the serviceability limit state.
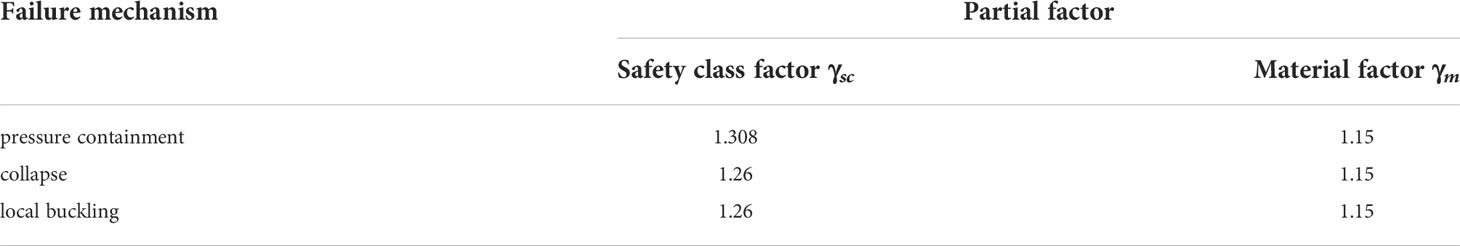
Table 4 The applied partial factors determined by the corresponding high safety class.
Then the flowline’s strength capacity against the bursting, collapse and local buckling could be further validated by this load resistance factor design format. The pressure containment must fulfil the following criterion:
Pl is the incidental pressure, including the design pressure and the content-induced pressure and Pe is the external hydrostatic pressure that depends on the water depth. Pb (t1). is the pressure containment resistance based on minimum wall thickness t1 and material strength.
The external pressure shall meet the following criteria:
Pmin is the minimum internal pressure that can be sustained. Pc(t1) is the characteristic collapse given by Eq.(9).
Pel(t1) is the elastic collapse given by Eq.(10). Pp(t1) is the plastic collapse pressure given by Eq.(11). Oo. is the ovalisation given by Eq.(12).
E is the Young’s modulus. v is the Poisson ratio.
αfab is the fabrication factor.
As the flowline is laid on the seabed before offloading and after offloading, the flowline is frequently lifted from and lowered down to the seabed. The local buckling of the cross-section may be initiated due to excessive bending during the lifting and lowering process at the touchdown point (TDP). Therefore, the local buckling failure mode shall be checked under the combined bending, effective tension and external pressure loads. In this study, the load-controlled criterion is applied:
Msd and Ssd are design loads obtained based on Eq. (5). Following this limit state design approach, the wall thickness is determined by satisfying the busting, collapsing and local buckling criteria. Table 1 presents the determined flowline geometry and selected material properties obtained through the cross-section design procedure presented. More details in these equations above could be found in DNV-OS-F101 (DNV, 2013). The flowline’s geometry will be further validated based on the dynamic results, including effective tension and bending moment obtained from the dynamic response analysis in Section 3.
The global configuration design is aimed to determine the flowline’s global layout, including flowline length, the horizontal distance between SST and the well, and the declination angle according to different water depths requirements. Then the SST hovering location could also be determined based on the flowline’s design parameters. More importantly, the flowline strength capacity and cross-section design could also be further validated against the von Mises stress according to the allowable stress criterion in DNV-OS-F101 (DNV, 2013).
This global configuration design was carried out in Orcaflex, and the established configuration model in Orcaflex is shown in Figure 2. A decoupled analysis is used in this paper, which means the flowline’s dynamic response’s effect on the SST model is not considered in the present work. The SST model was considered a rigid body, and three degrees of freedom (DOF) were allowed, including heave, surge and pitch. These time histories of dynamic response were given as inputs from the SST Simulink model in Section 2.1. The flowline is connected to SST through a flexible joint at the top angle according to the specified water depth and is attached to the middle of SST to minimize the flowline’s weight effect on the SST motion. Then flowline top-end coordinates relative to SST local axis is (0, 0, -8.5).
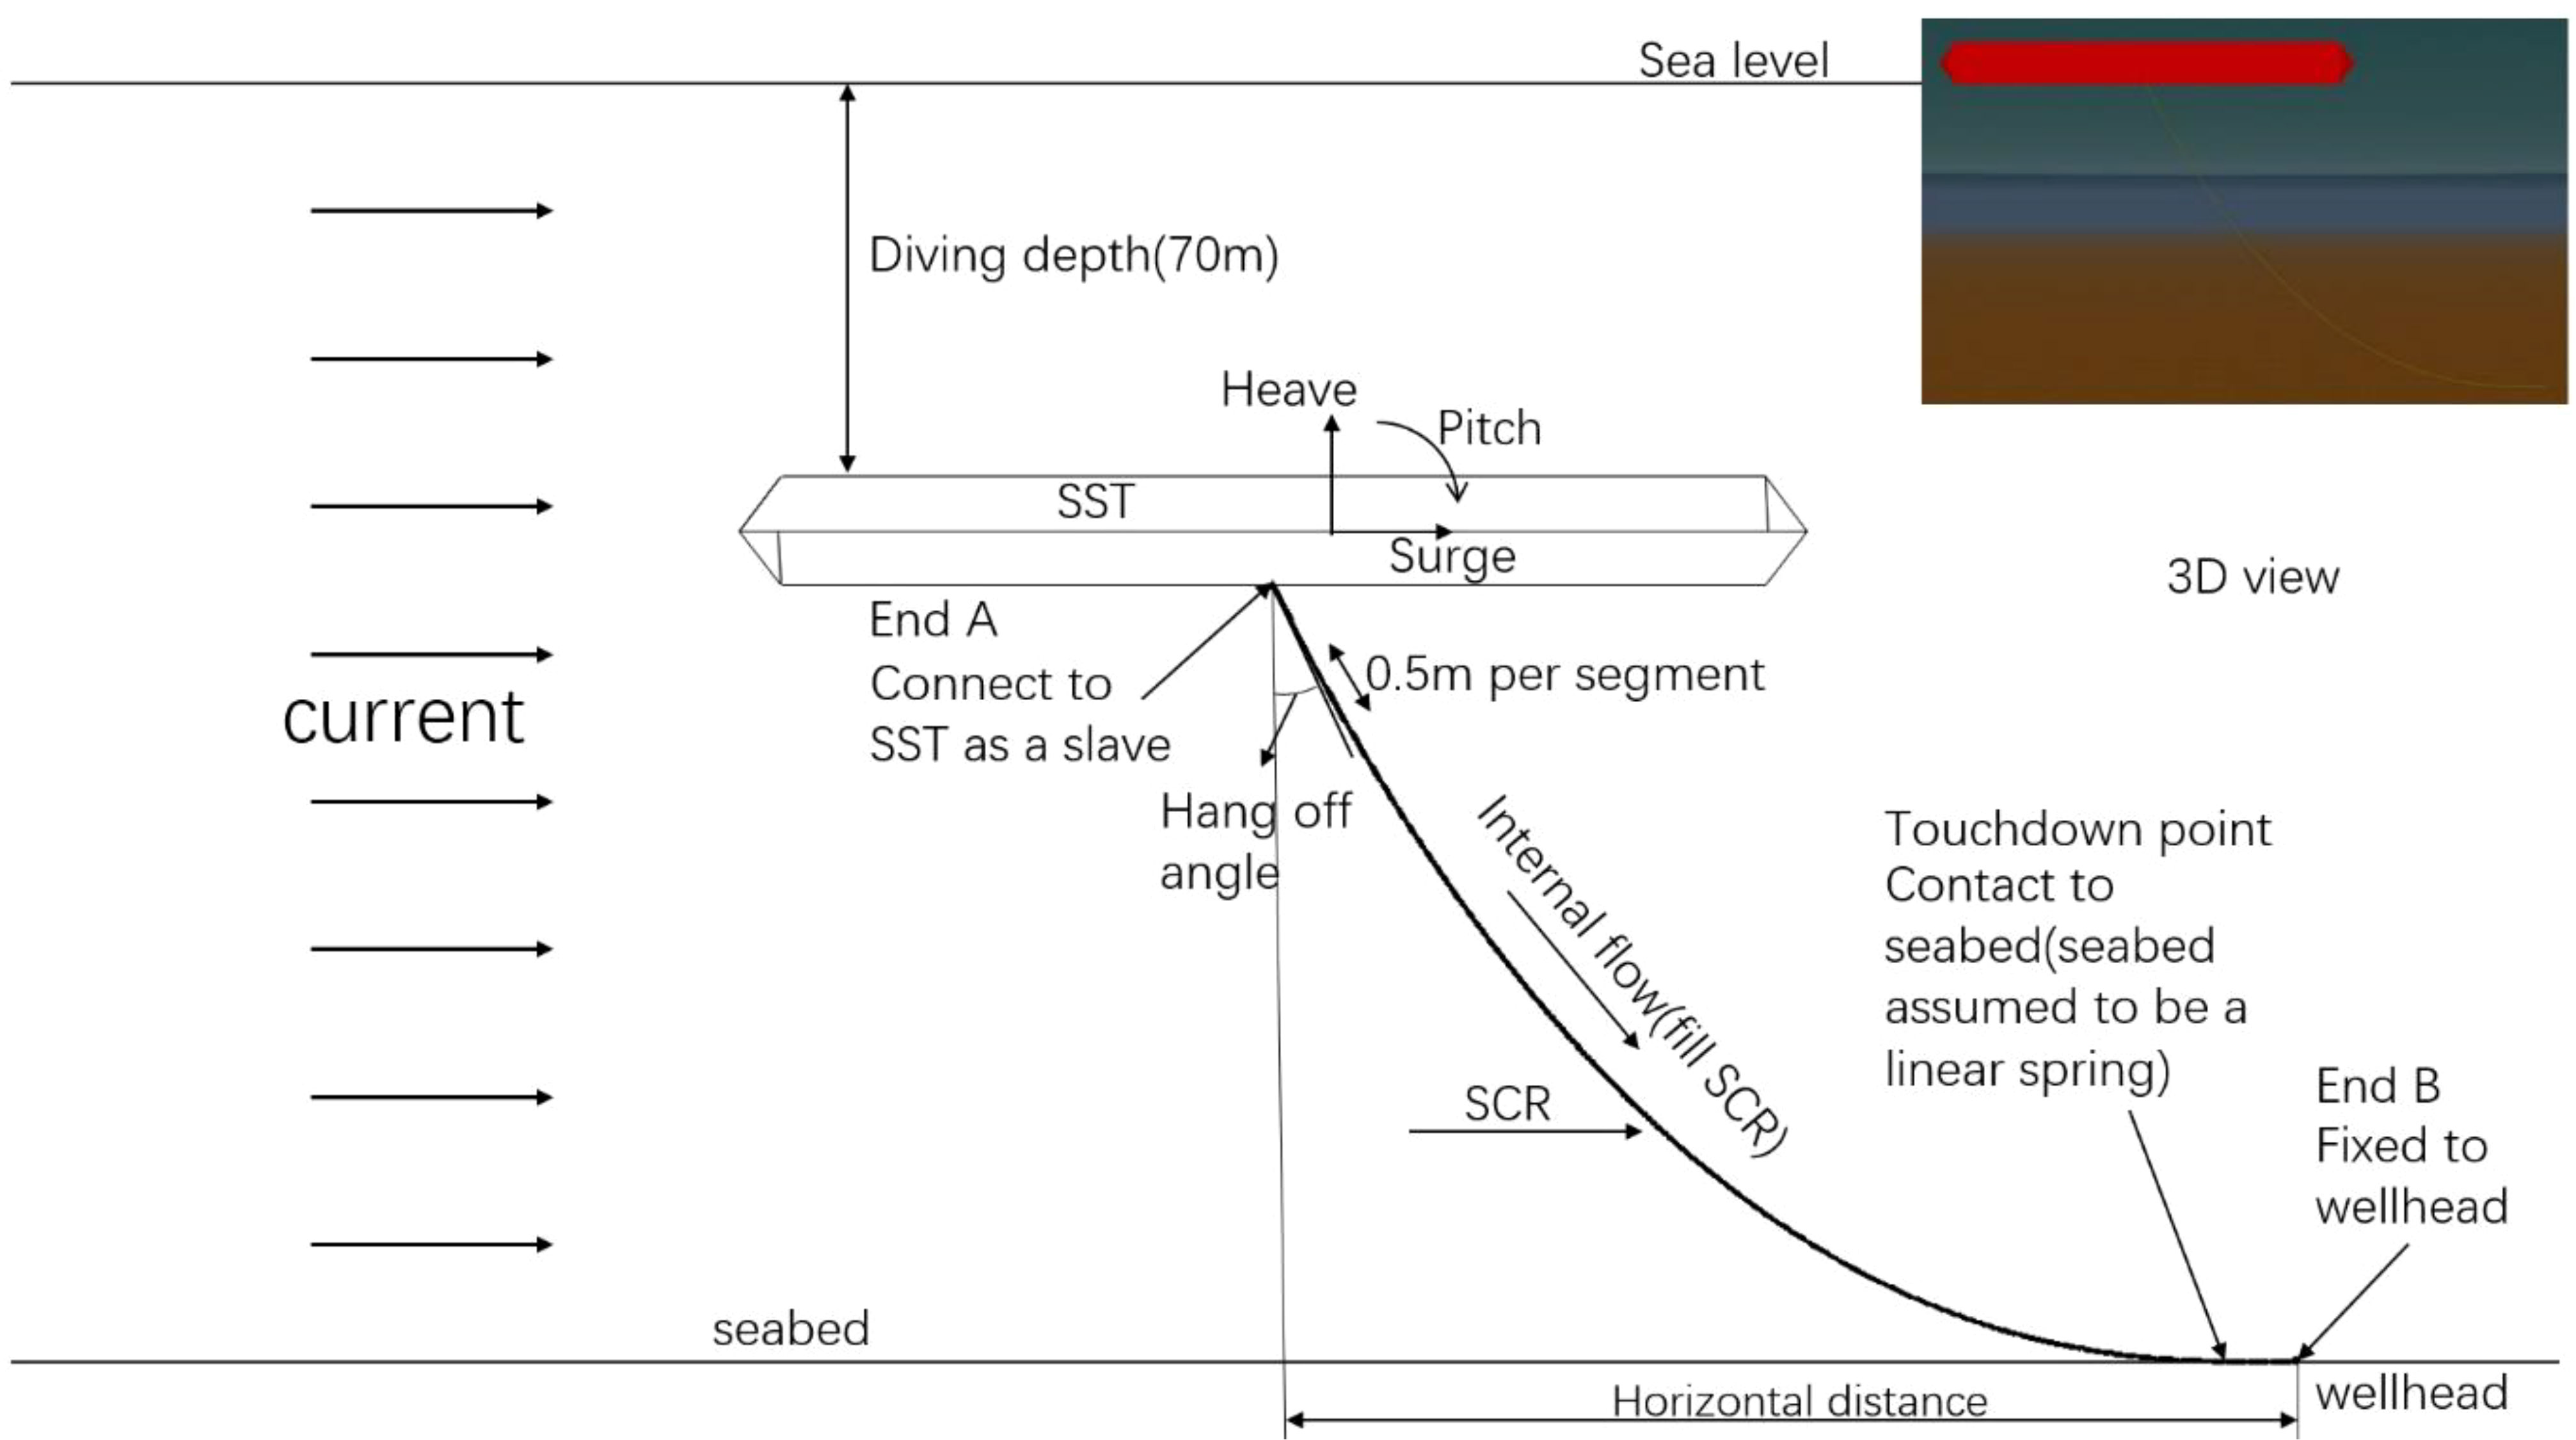
Figure 2 Orcaflex model diagram at case LC1.2.
The flowline is modelled by the line element. The line element is connected by the axial, torsion, and bending springs to transfer the axial forces, torque, and bending moments. In addition, dampers are also used for considering the damping properties in the axial, bending and torsion directions, which is essential in the dynamic analysis. The mass and buoyancy are attached to the nodes (OrcaFlex Manual). The total length at each water depth is divided by 0.5m length of segments. The external coating and internal coating are modelled as liners, only contributing to the mass and buoyancy instead of increasing strength capacity. The internal liner is beneficial to the additional corrosion resistance capacity. At the touchdown point, the seabed is considered flat, and it’s regarded as a linear spring when in contact with SCR, which provides resistance proportional to penetration in shear and normal directions. Liquid carbon dioxide in SCR is considered a fluid with uniform density and fills the whole SCR at a constant and uniform flow rate. With this model, it’s possible to verify whether the cross-section design and the line design are reasonable and also to investigate the effects of some sensitive parameters for SCR by changing the corresponding sensitive parameters such as mean current speed, internal flow speed and water depth, which will be discussed in details in Section 3.
The static analysis was carried out to determine a reasonable global configuration according to different water depths. Then the horizontal distance between the hanging-off position and wellhead, the flowline length, and the declination angle at the hanging-off position could be determined. Therefore, this work gives a guideline to the original SST hovering position above the wellhead. These critical parameters according to different water depths will be further discussed in Section 3.1. In addition, this static work sets an original configuration for the further dynamic response analysis. This dynamic analysis mainly validates the flowline strength capacity under design loads and the dynamic response of SST at surge, pitch, and heave DOFs. Since the SST is hovering underwater at a maximum of 70 m, both the SST and flowline are less likely to be exposed to wave and wind loads. Therefore, only the current load is considered in the dynamic equilibrium function for the SST and flowline. The time history of the current speed applied in the SST Simulink model is also used in the flowline model. The current speed is constant along with the water depth. The current load is calculated based on Morison’s equation:
Where f is the fluid force, Δ is the mass of fluid displaced by the body, αf is the fluid acceleration relative to the earth, Ca is the added mass coefficient for the body, αr is the fluid acceleration relative to the earth, ρ is the density of water, vr is the fluid velocity relative to the body, Cd is the drag coefficient for the body, A is the drag area.
The dynamic response analysis will be elaborated in the next section by investigating the determinant factors’ effects on the SST-Flowline system baseline design. The cross-section design at each specified water depth will be further validated against the allowable stress criterion of the flowline. The following equation defines the von Mises stress:
σe is von Mises stress, σpr, σpθ and σpz are the radial, hoop, and axial stresses.σpr, σpθ and σpz are calculated by the following equation:
Pi and Po are internal and external pressure. Do and Di are outside and inside diameters. t is the pipe wall thickness. A is the pipe cross-section area. T is the true wall tension in the pipe at the section being analyzed. M is the global bending moment in pipe. I is the moment of inertia.
The SST shuttles between the existing offshore/land facilities and subsea wells for CO2 transportation. Since the SST is limited to hovering at the maximum water depth 70 m, the flowline connected between the SST and the subsea well has to be used to assist SST in offloading CO2. When the SST travels to the vicinity of the subsea well, the flowline is straight laid on the seabed and ready to be connected to the SST. Similarly, the flowline would be lowered to the seabed and maintained as a straight configuration after the liquid CO2 is offloaded. Therefore, the flowline connecting and disassembly design method is challenging when the flowline’s safety and reliability are to be assured. When the SST hovers in the vicinity above the subsea well, a suitable method should be proposed to lift and lower the flowline. Since the flowline weight is challenging for the subsea operation, the flowline cannot be directly lifted or lowered by subsea facilities. Therefore, a cable is proposed to be connected at the free end and then the ROV assists in lifting the cable and connecting it to the winch located at the SST. Then winch is designed to be located in the middle of SST to minimize the exposed bending moment induced by the flowline weight and achieve SST stability in terms of pitch motion. Figure 3 shows the connecting, offloading and disassembly steps.
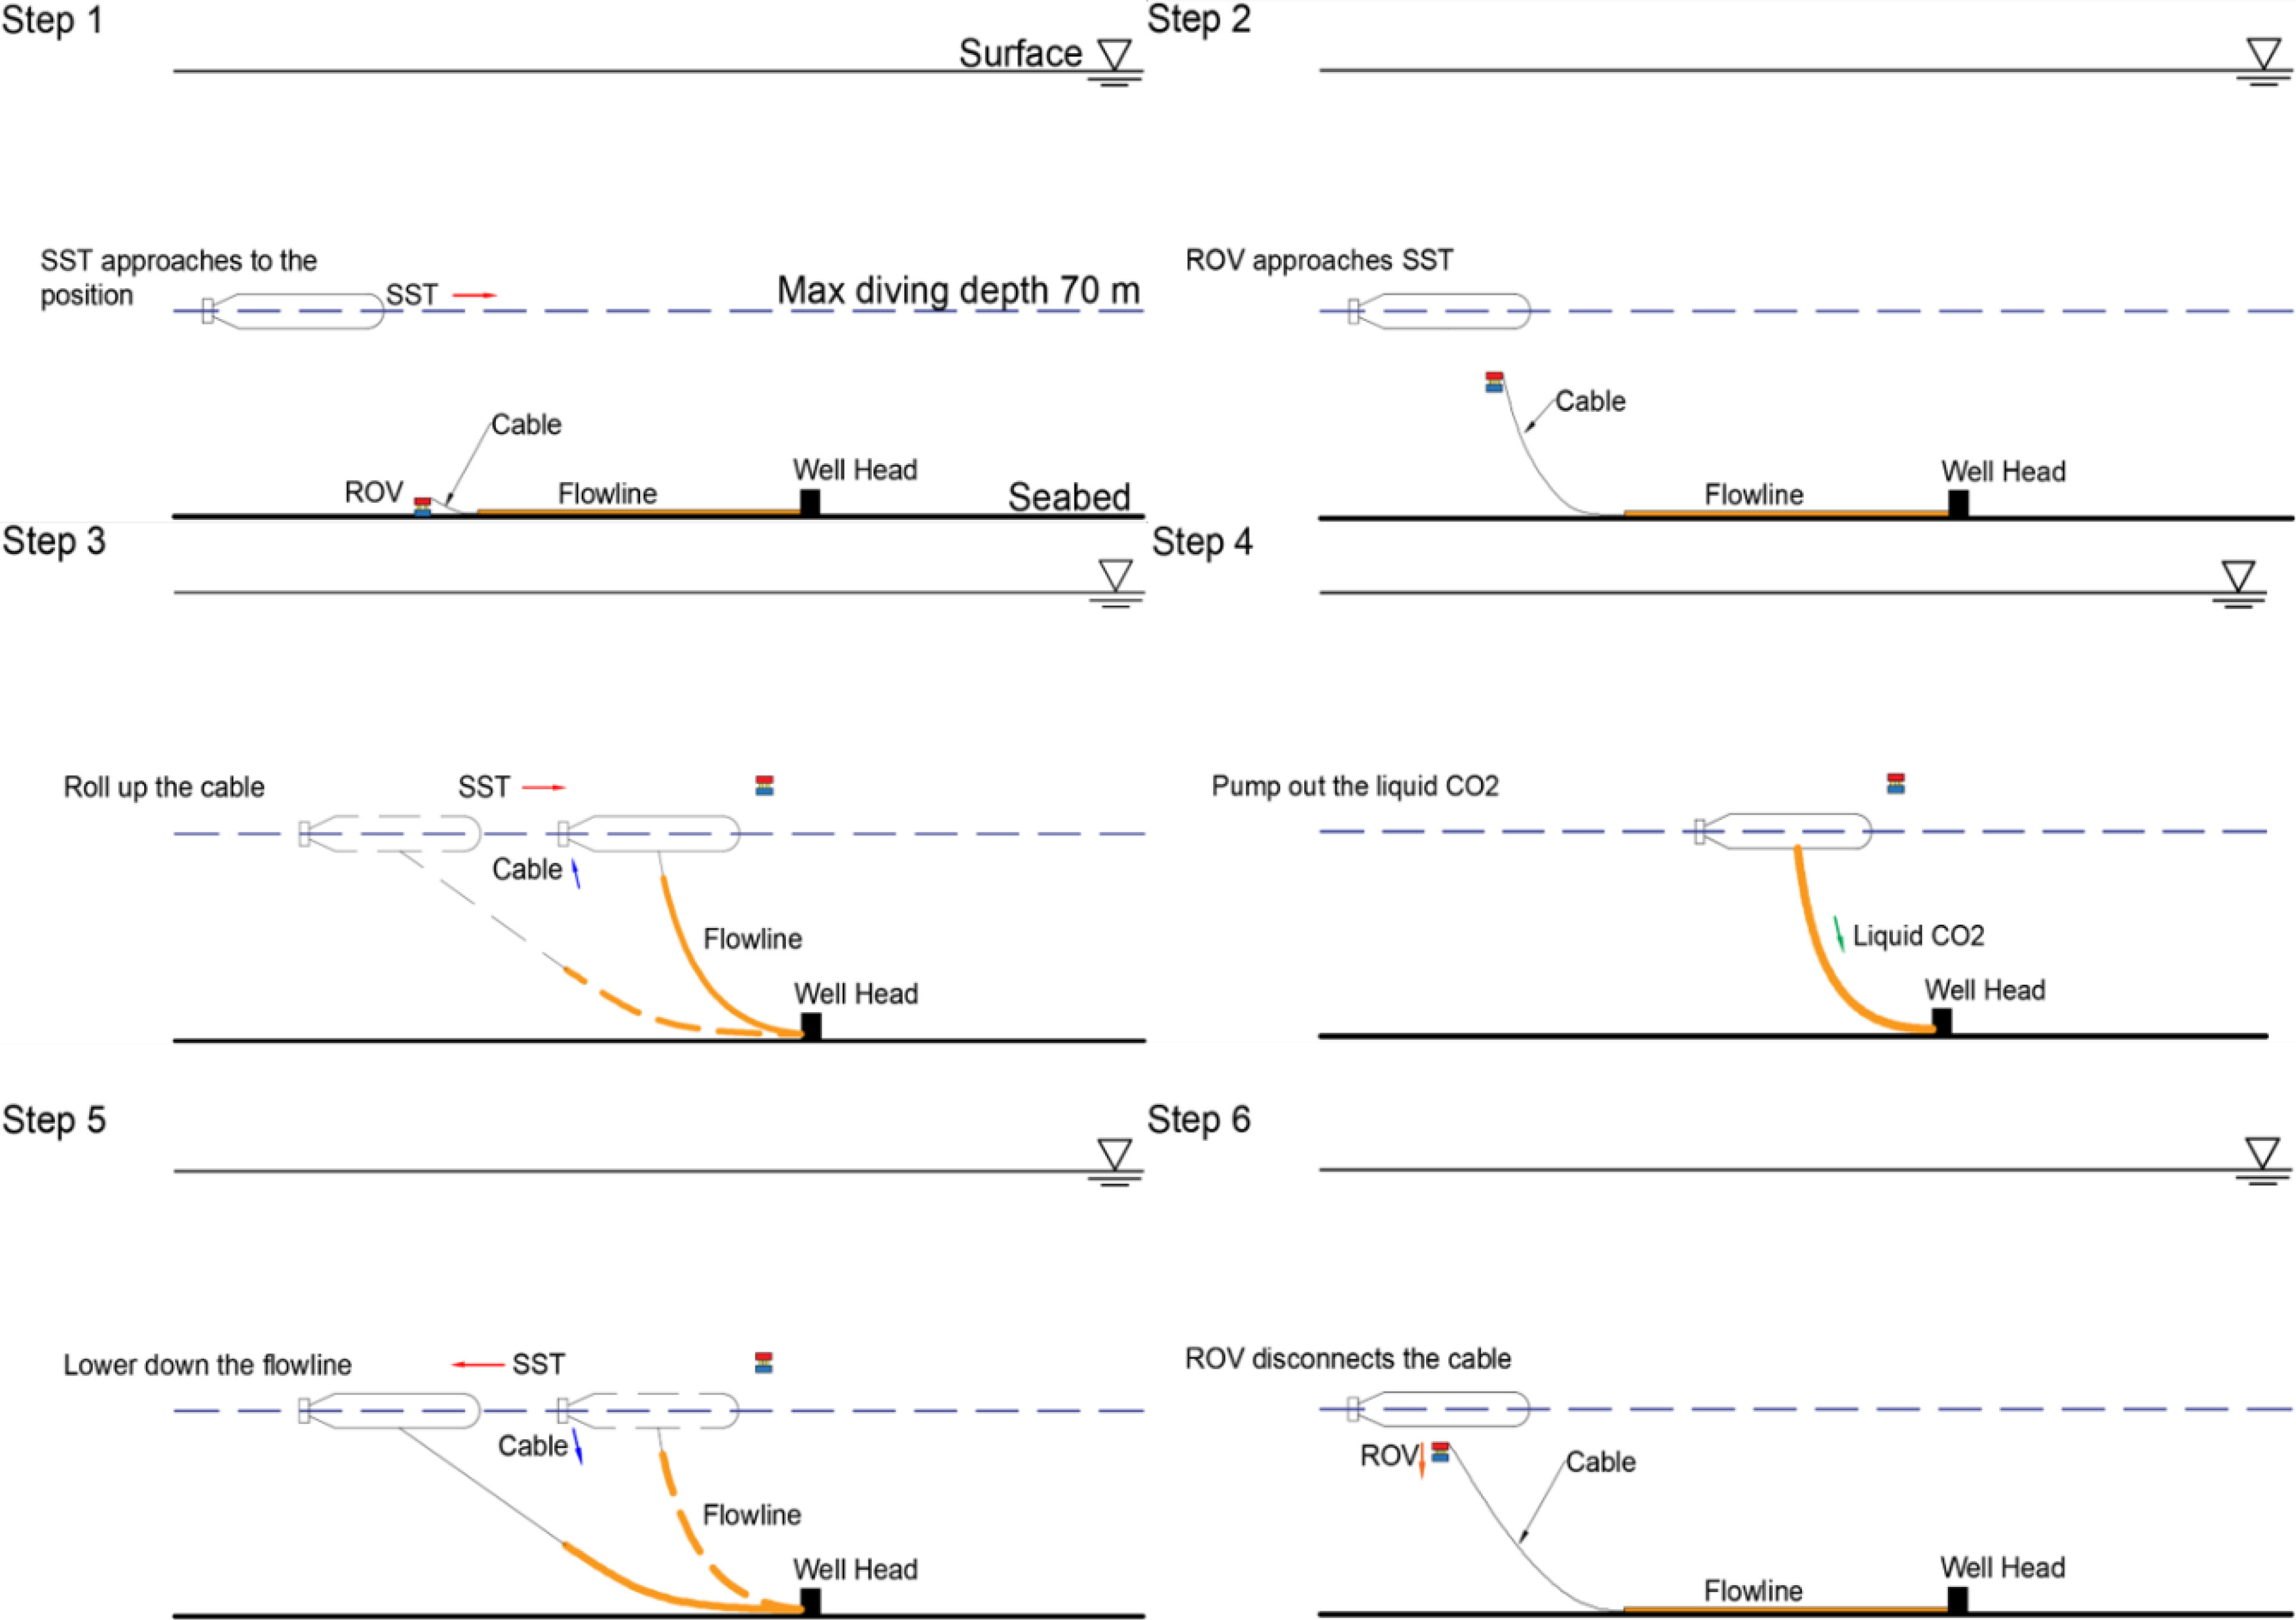
Figure 3 Flowline connecting and disassembly methodology.
Step 1: SST hovers at the maximum water depth 70 m and approaches the position with a horizontal distance, right above the subsea well.
Step 2: A cable is attached to the flowline end and lifted up by an ROV to the winch in the center of SST.
Step 3: The cable is hauled in, and the flowline is lifted up directly for mating. The SST travels slowly to keep a good catenary configuration to avoid overestimated curvature. Then the SST stops at the design offload position, as shown in Section 2.3.
Step 4: The liquid CO2 is pumped out from the cargo tankers through the mated connection, and seawater is pumped in to balance the tank weight to maintain the SST’s trim. After the liquid CO2 is offloaded, the cable is reconnected to the flowline end fitting and leased by the winch.
Step 5: The flowline is gradually lowered to the seabed following the cable. Meanwhile, the SST travels reversely at the same speed in step3 to guarantee the flowline’s strength reliability.
Step 6: The ROV disconnects the cable after the flowline is laid on the seabed.
This offloading method can be used in variable water depth since it allows the SST to hover at constant operation depth (70 m for the maximum). Then the SST is not needed to be designed for the subsea well water depth, significantly reducing the required collapsing capacity in deep water. In addition, this method could effectively reduce the collision risk between the SST and subsea facilities since the SST is not required to hover close to the wellhead during offloading.
Since the SST is applied to transport liquid for injection into the oil and gas wells in the marginal oil fields of the North Sea, the flowline’s global configuration design should be feasible to the water depth based on the typical depth range of this field. Three typical water depths corresponding to 130m, 200m and 360m are selected for this verification. In addition, the offloading time through the flowline is also determined by the internal diameter and flow velocity. This is also limited to the maximum SST hovering time. Therefore, the internal flow velocity should be optimal on the basis of strength capacity-guaranteed internal diameter. The internal flow velocity might affect the dynamic response of the flowline when at a relatively high level Wang and Duan (2015) investigated the internal flow effect on the flowline response, and a minor effect was found when the flow velocity up to 32 m/s was applied. Therefore, three velocity levels 3 m/s, 6 m/s and 9 m/s, to satisfy the hovering capacity, are selected for further verification. The dynamic motions in surge and heave directions have been studied by Ma et al. (2022), and approximately 4 m amplitude in these two directions was found in a 4-hour realization where the mean current speed is 1.5 m/s. This means that the flowline would be faced with structural strength challenges due to these highly dynamic and large motions during offloading. Therefore, two typical mean current velocity levels, 0.5 m/s and 1 m/s are chosen for this verification, and the increased bending moment at the touchdown area would initiate the local buckling risk, three water depth levels 130 m, 200 m and 360 m corresponding to cases LC1, LC2 and LC4 are selected based on the typical depth range of marginal oil and gas fields in the North Sea.
In summary, six load cases consisting of three water depths (corresponding to LC1, LC2 and LC3), three internal flow velocities (LC3, LC4 and LC6) and two mean current flow velocities (LC5 and LC6) are presented in Table 5.
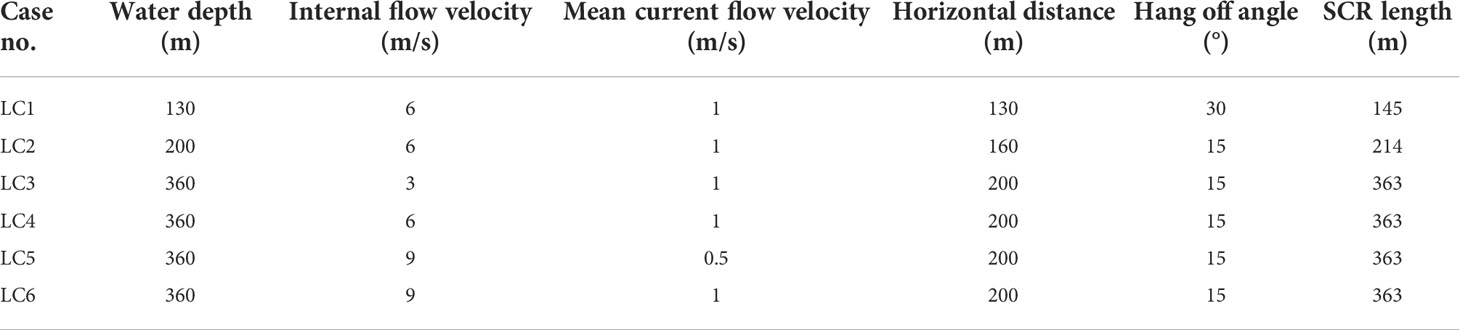
Table 5 Load case matrix.
The fundamental strength capacity of the flowline in each load case should be verified according to the cross-section design in section 2.2 and the dynamic analysis of the global configuration design in section 2.3. For the cross-section design, the burst and collapse criteria are used for verifying the pressure containment capacities under 130 m, 200 m and 360 m water depths. The burst utilization factors under corresponding water depth are 0.198, 0.209 and 0.236, respectively whereas they are 0.078, 0.120 and 0.215, respectively, for the collapse utilization factors. This means the chosen wall thickness and the diameters could guarantee the strength capacity for the required pressure at these water depths.
As the effective tension at the hang-off position would affect the SST stability, these results should be regarded as external loads in further coupled dynamic response analysis of SST. In addition, the von Mises stress along the flowline arclength should be validated to guarantee the strength capacity. Figure 4 presents the extreme values of effective tension, bending moment, the resulting von Mises stress and local buckling validation along the flowline arclength in each load case. It can be seen that the von Mises stress along the arclength in each load case does not exceed the yield stress. This also further validates the cross-section design by these dynamic response analyses. Since the combined effective tension, bending moment, and external pressure would initiate the cross section’s ovalization along the length of the flowline; the local buckling criteria should be used for validating this failure according to Eq. (13). The LRFD utilization parameter along the flowline arclength in each load case proves the local buckling of the cross-section along the length will not occur and is satisfied with the safety of local buckling in each load case.
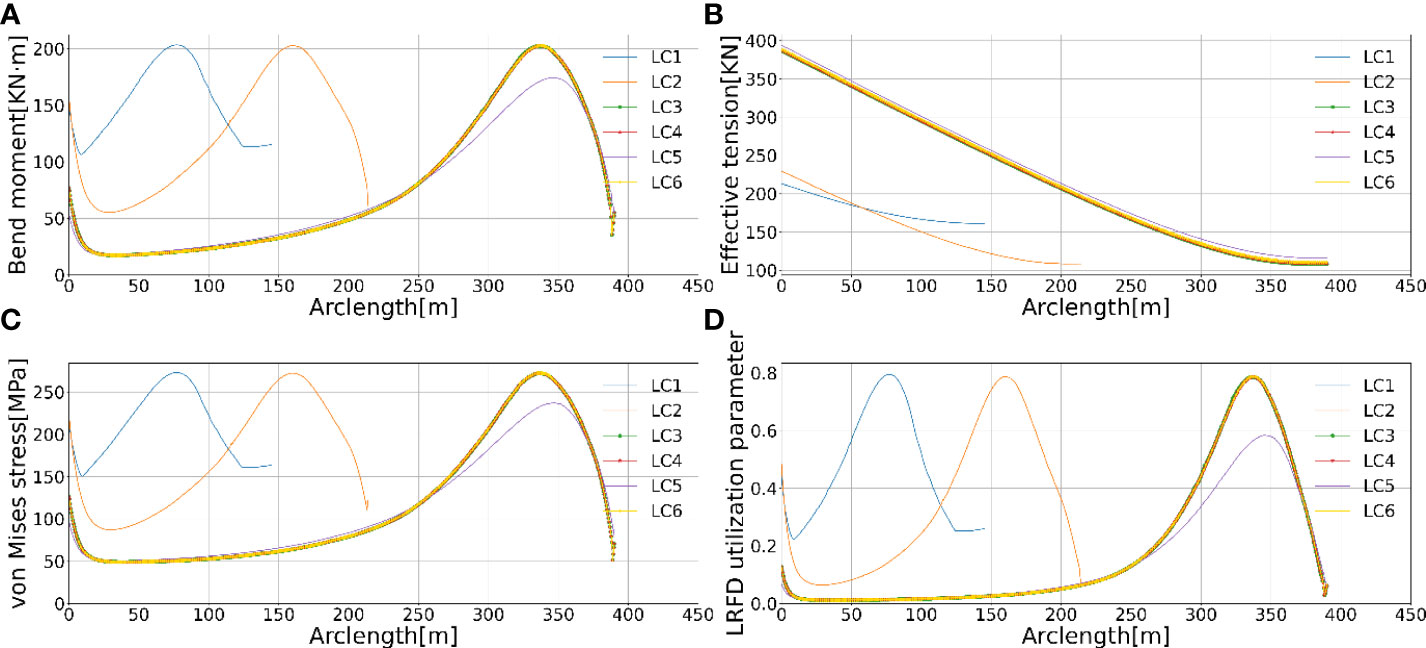
Figure 4 The bending moment (A), effective tension (B), Von-Mises stress (C), and LRFD utilization (D) comparison results in each load case LC1 - LC6.
The content flow effects on the flowline’s static configuration and dynamic response should not be neglected when the content mass and flow rate are at high levels. In this study, the flow rate is essential since it directly determines the offloading capacity in which a rapid flow rate may be required under a specific internal cross-section area of SCR. This study performs the dynamic response analysis with LC3, LC4 and LC6. This results in 5.84, 2.92 and 1.95 hours for offloading within the hovering power supply capacity in LC4 and LC6. The comparison results concerning the effective tension, bending moment and Von-Mises stress with varying internal flow speed are presented in Figure 4. The internal flow speed has no effect on the effective tension, bending moment and von Mise stress along the arclength which means these internal flow speeds are still relatively low.
In this study, the SST motion under combined current loads is given as input in the flowline dynamic response analysis. The SST is exposed to time-varying current loads, respectively. The time-varying current loads exposed on the flowline could also be achieved in the dynamic response analysis. However, the constant current along the water depth is assumed. These dynamic response analyses simulate four hours of SST motion in each water depth case.
The sensitivity study results under different current load conditions are also included in Figure 4 as LC5 and LC6. The current load is found to have a minor effect on the effective tension and has a larger but relatively small effect on the bending moment and von Mises stress at the touchdown point. The LRFD utilization factor along the flowline arclength demonstrates that the current load also has a relatively small effect on this factor at the touchdown point. However, it is still within the allowance range, so the SST is adaptable in these two current load conditions.
The connecting and disassembly methodology has been explained in section 2.4. It is found that the over-bending of the flowline is the most crucial failure during the lifting and lowering process. Therefore, the global configuration of the flowline during the lifting and disassembly should be controlled by using the criterion mentioned in section 2. These lifting and disassembly simulations are performed in Orcaflex. In this process, two factors are found to be the most important factor in avoiding the flowline’s over-bending failure. The first one is the horizontal distance between the hovering position and starting point of lifting. The second one is the speed adjustment between the SST travelling speed and the cable’s haul-in speed. Figure 5 shows the horizontal distance and the flowline’s global configuration during the lifting process. In this section, the sensitivity studies with respect to these two factors and the fundamental strength capacity validations in the typical water depths are carried out as follows.
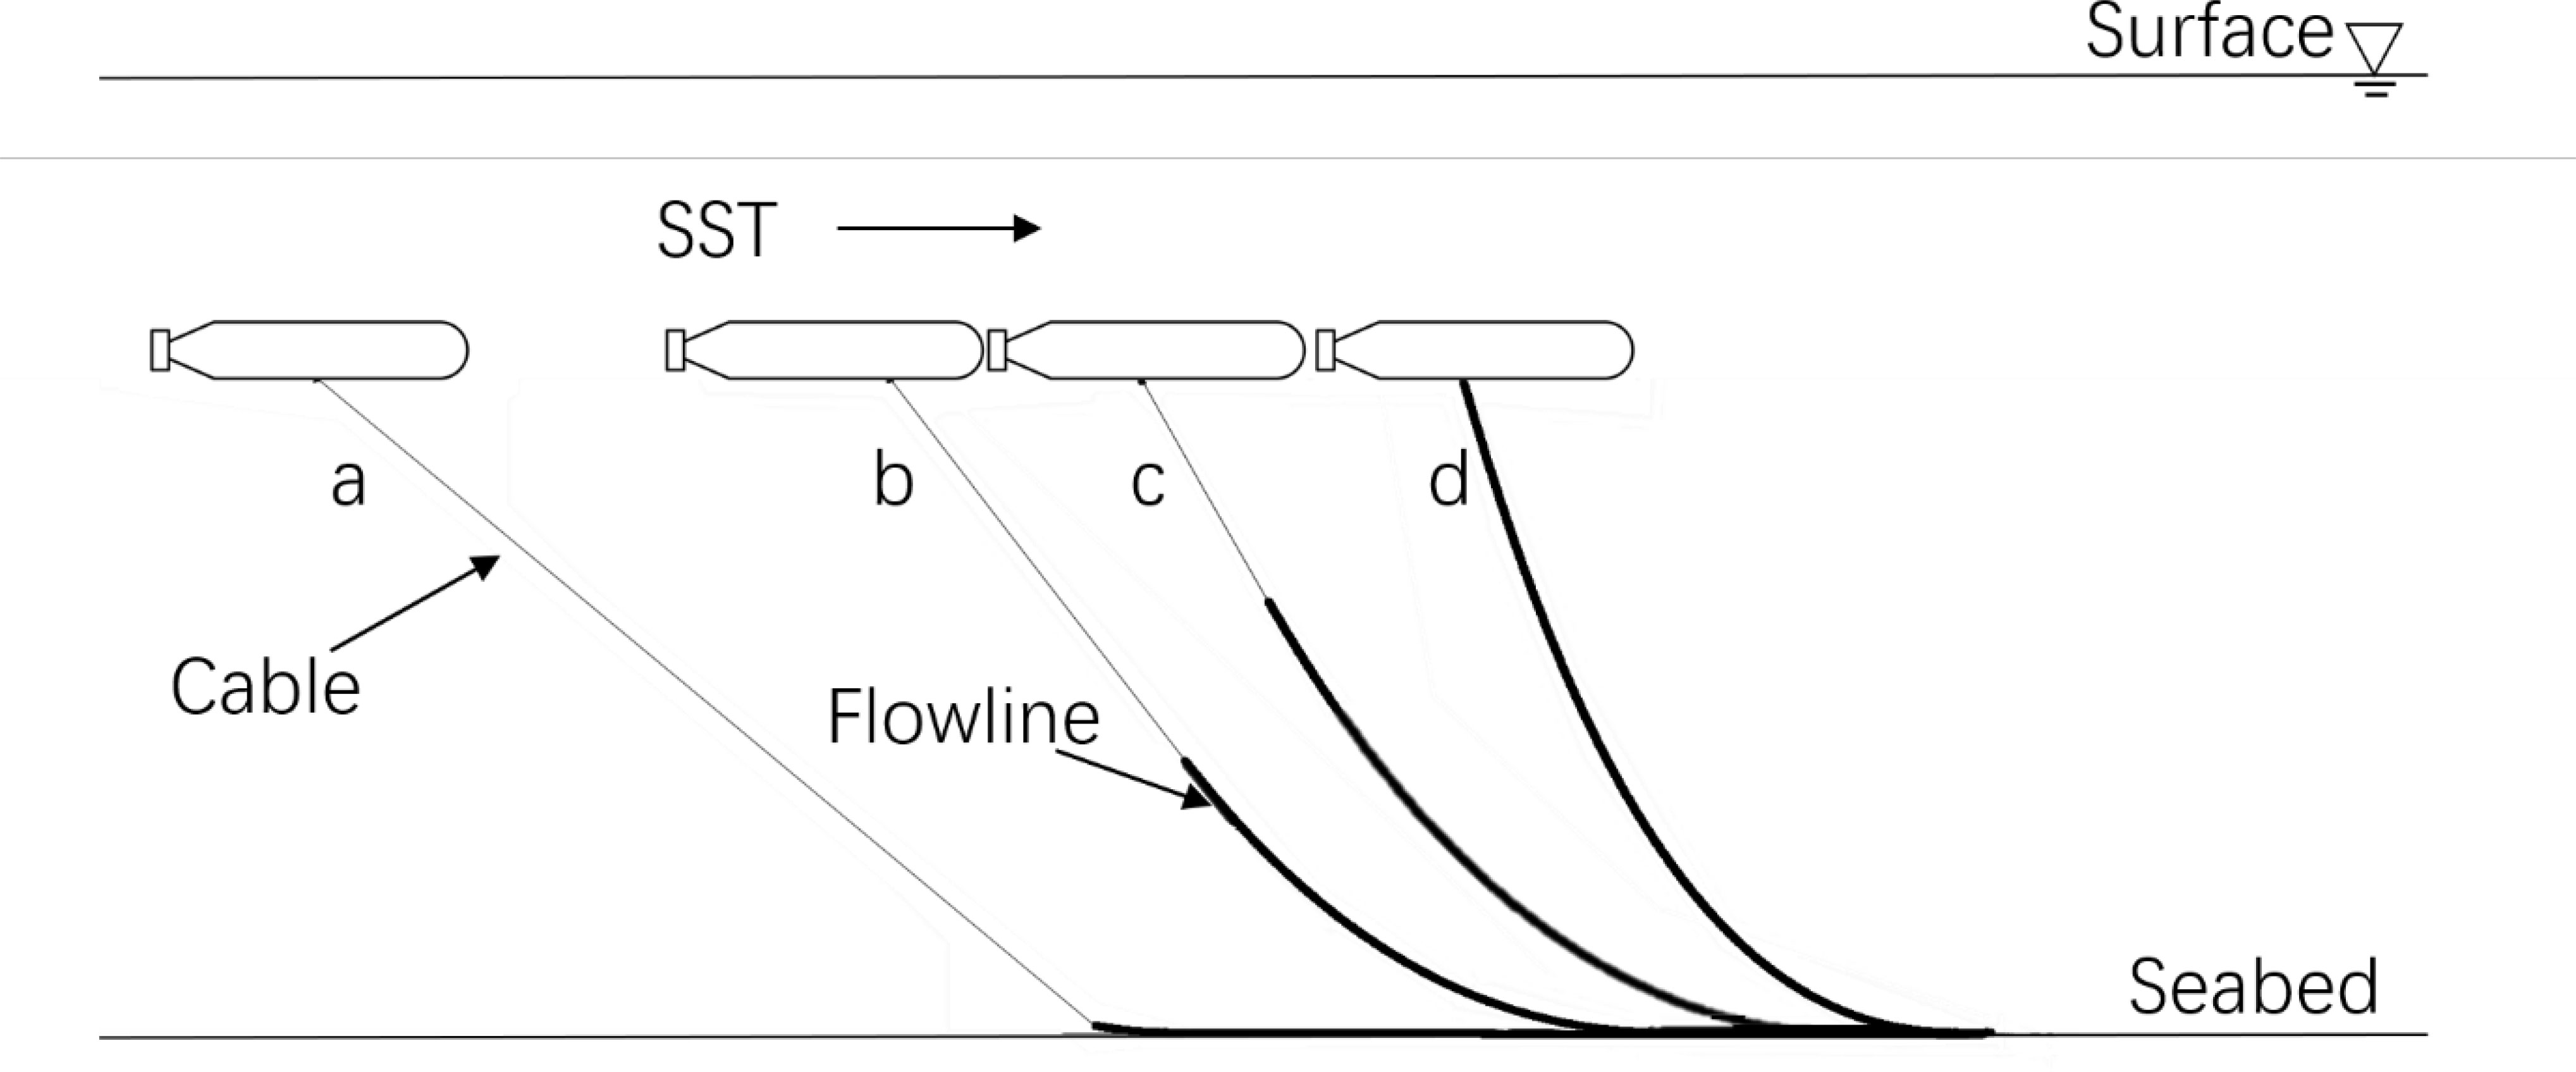
Figure 5 The flowline connecting process.
This fundamental strength capacity to avoid the overbending failure in each water depth condition should be verified through the dynamic analysis of connecting and disassembly processes in section 2.4. All load cases are summarized in Figure 6, and this fundamental strength capacity validation is carried out in load cases FC1, FC2 and FC3, respectively. The effective tension, bending moment, and Von Mises stress, results are shown in Figure 7, which are important for further investigating the SST stability during connecting process. The Von Misses stress is then obtained and shown to be within the yield stress value. The LRFD utilization factor along the flowline arclength is illustrated in Figure 7 to prove that the overbending failure will not occur during this connecting process. More importantly, the cable tension during this connecting process is verified against the maximum allowable hoisting capacity. The breaking strength of the cable is 555.7 KN with a diameter of 25.4 mm and a wet weight 0.02 kg/m (Fossen, 2011). The cable’s tension time history in this connecting process is shown in Figure 7, and the tension level is seen as being within the maximum hoisting capacity. These results prove that this connecting process design, including the initial hovering position and the coordinated speed between the SST and cable, is adaptable in each water depth condition.
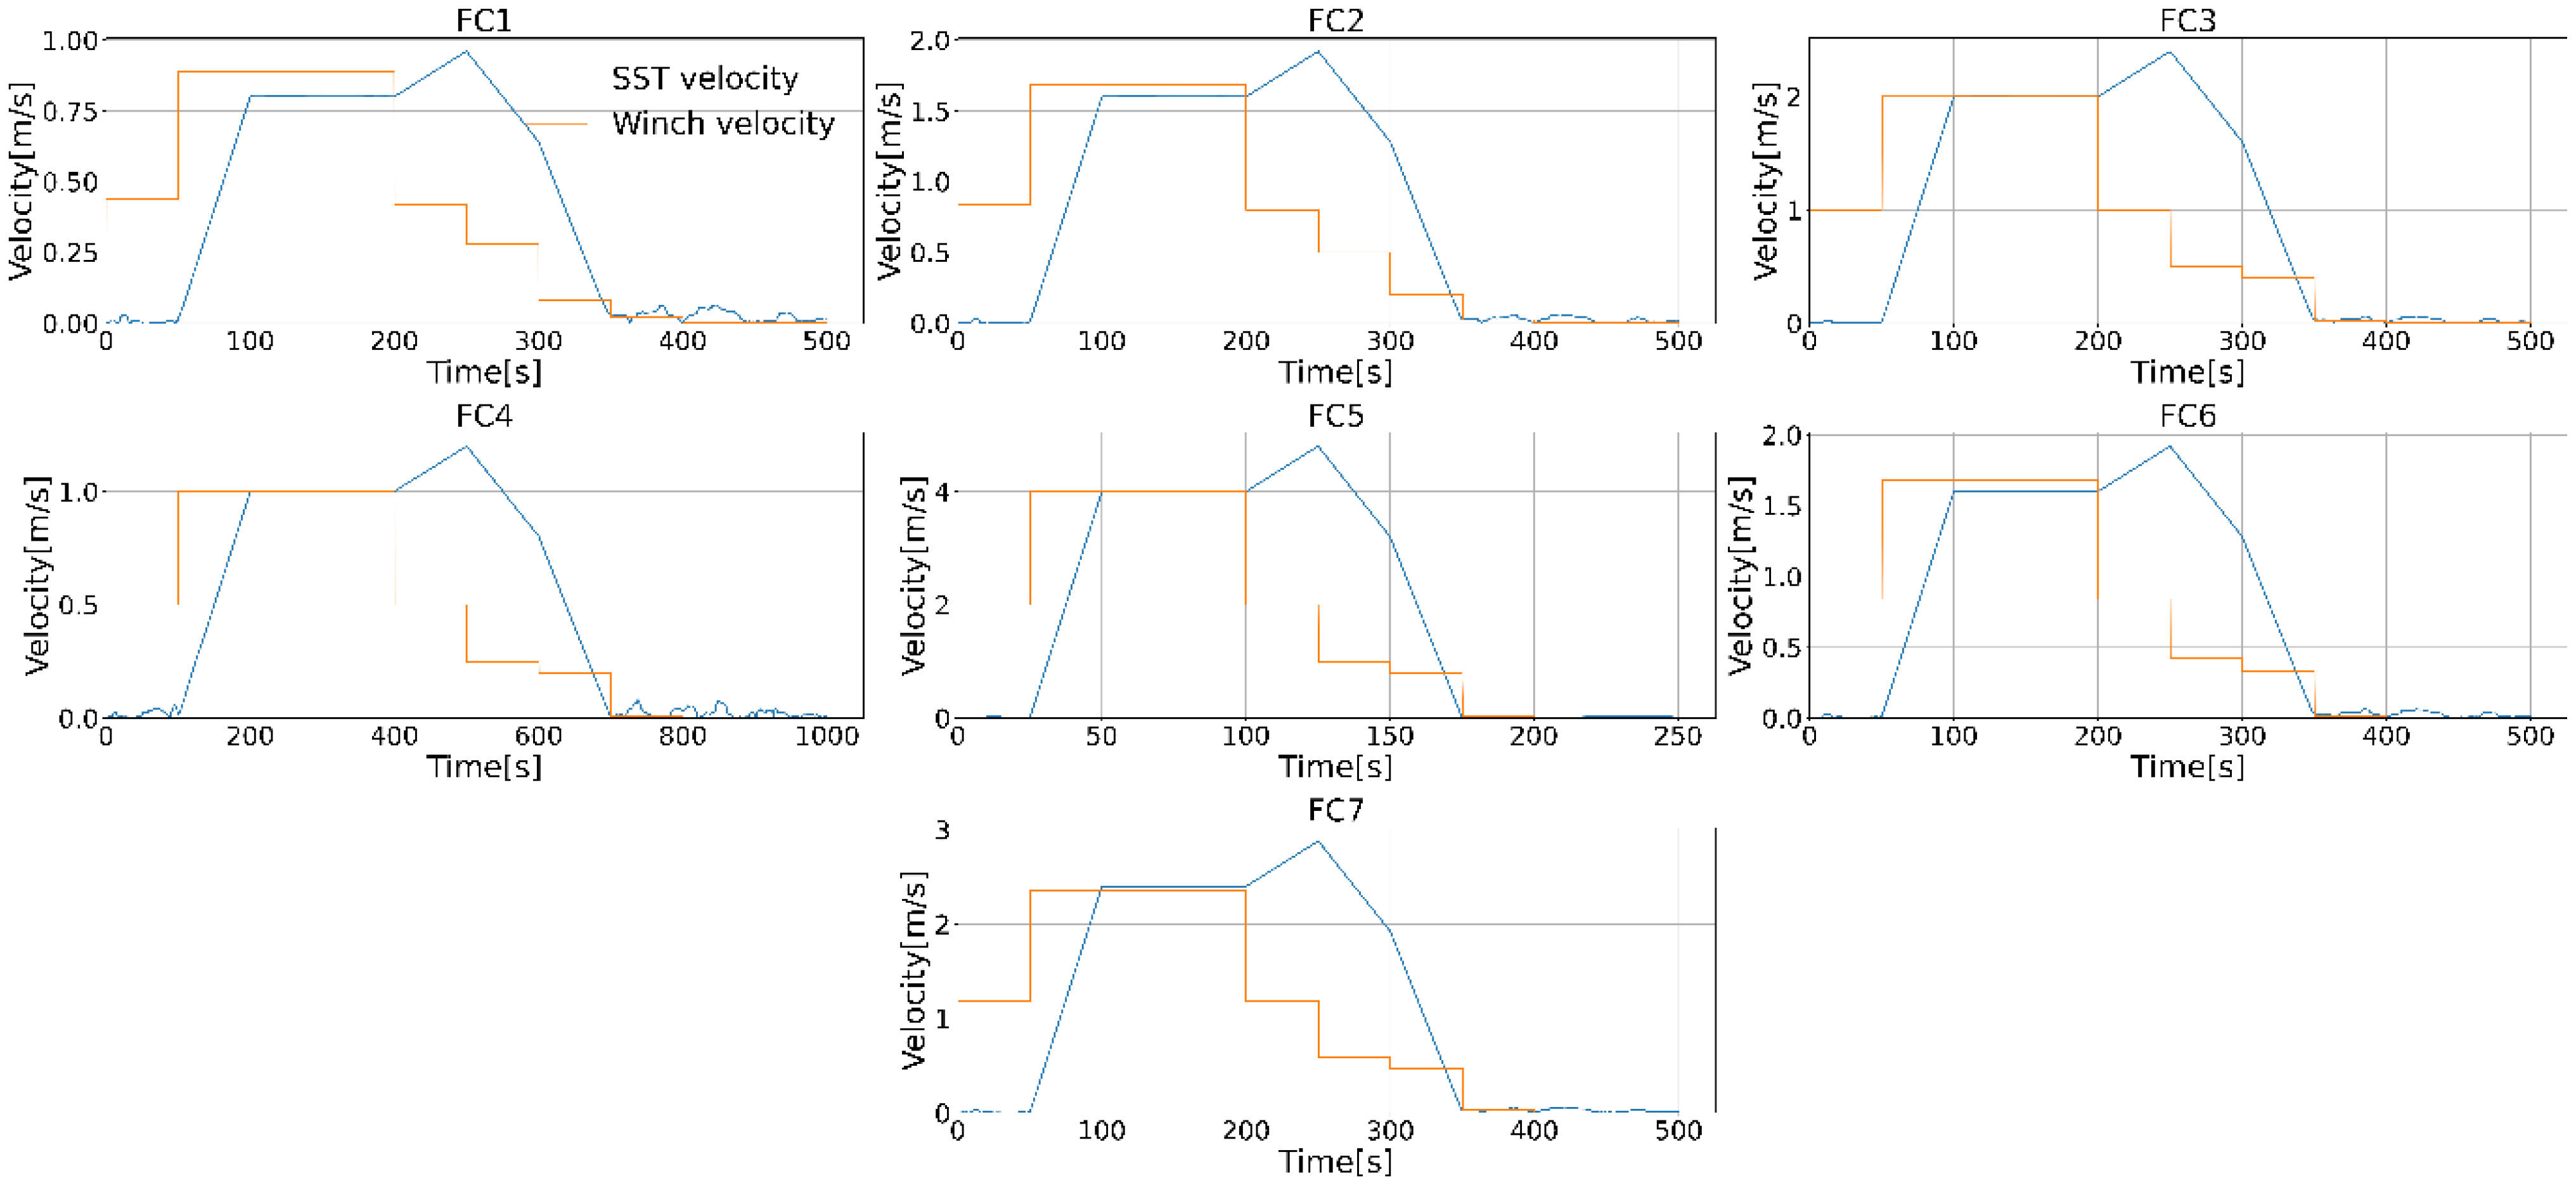
Figure 6 The SST velocity and cable hoisting velocity in each load case for validating the flowline connecting process.
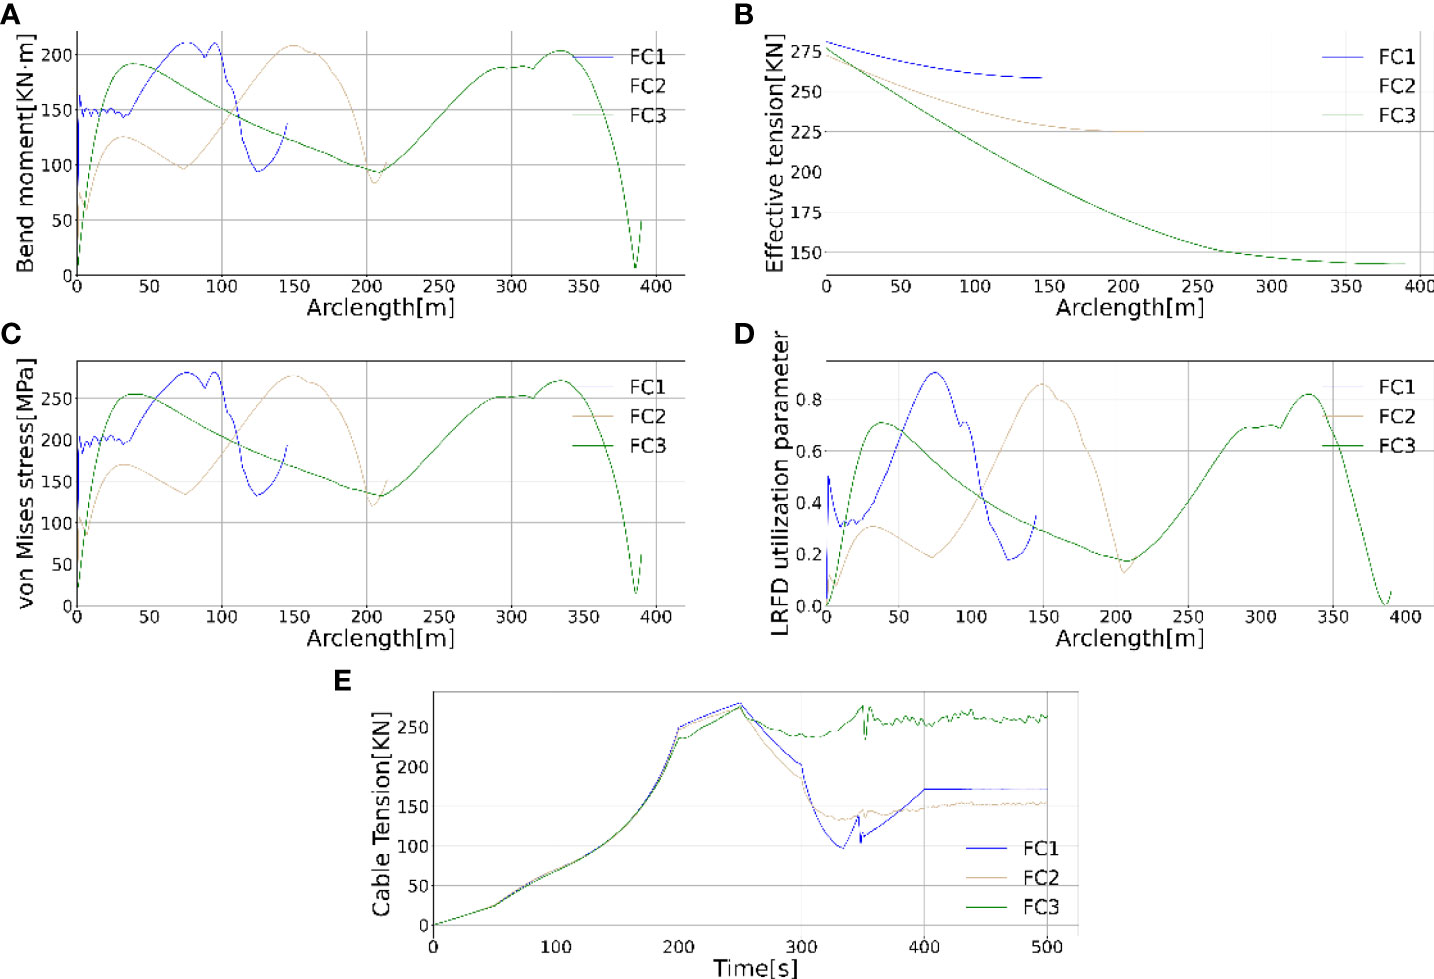
Figure 7 The bending moment (A), effective tension (B), Von Mises stress (C), LRFD utilization (D) and cable tension (E) time history in water depths 130m, 200m and 360m, respectively during the connecting process.
In addition, the SST and cable hoisting velocity should be well coordinated to maintain global configuration without overbending. This velocity sensitivity study is carried out, and the corresponding results in these load cases FC3, FC4 and FC5 are illustrated in Figure 8. The SST velocity and cable hoisting velocity histories in each load case are summarized in Figure 6 illustrates the flowline connecting process and some critical moments with respect to adjusting the SST and cable hoisting velocities. In each case, the winch starts to haul in the cable, and at the same time, the SST still hovers at the initial position within 50 s, as indicated as “a” moment. Then the cable is tensioned as a straight line before SST starts to speed up and gradually catch up with the cable hoisting velocity from 50 s to 100 s. Then the SST is accelerated to the maximum value, and the cable hoisting velocity gradually slows down from 200s to 250s, as indicated as the “b” moment. This is to avoid overbending when the horizontal distance from the wellhead to SST is decreased and to prevent the cable hoisting capacity from being exceeded. In addition, the flowline’s effective tension and the bending moment could be maintained at a controlled level to guarantee the allowable Von-Mises stress and local buckling validation along the flowline. Then SST starts to slow down to avoid overbending at the touchdown point denoted as the “c” moment. Finally, the SST stops, and two meters long cable is lifted up slowly to avoid impact between the bellmouth and flowline. This is also beneficial to adjust and mate the flowline to SST, as seen in the “d” moment. It is worth mentioning that the initial horizontal position of SST is essential to avoid the flowline overbending in the starting moment. Figure 9 shows that the bending moment, effective tension and the local buckling of the cross-section at the touchdown part are increased with a shorter horizontal distance of SST. Therefore, the velocity coordination and horizontal distance are essential factors for the flowline connecting process design and the same conclusions are found in the disassembly process design.
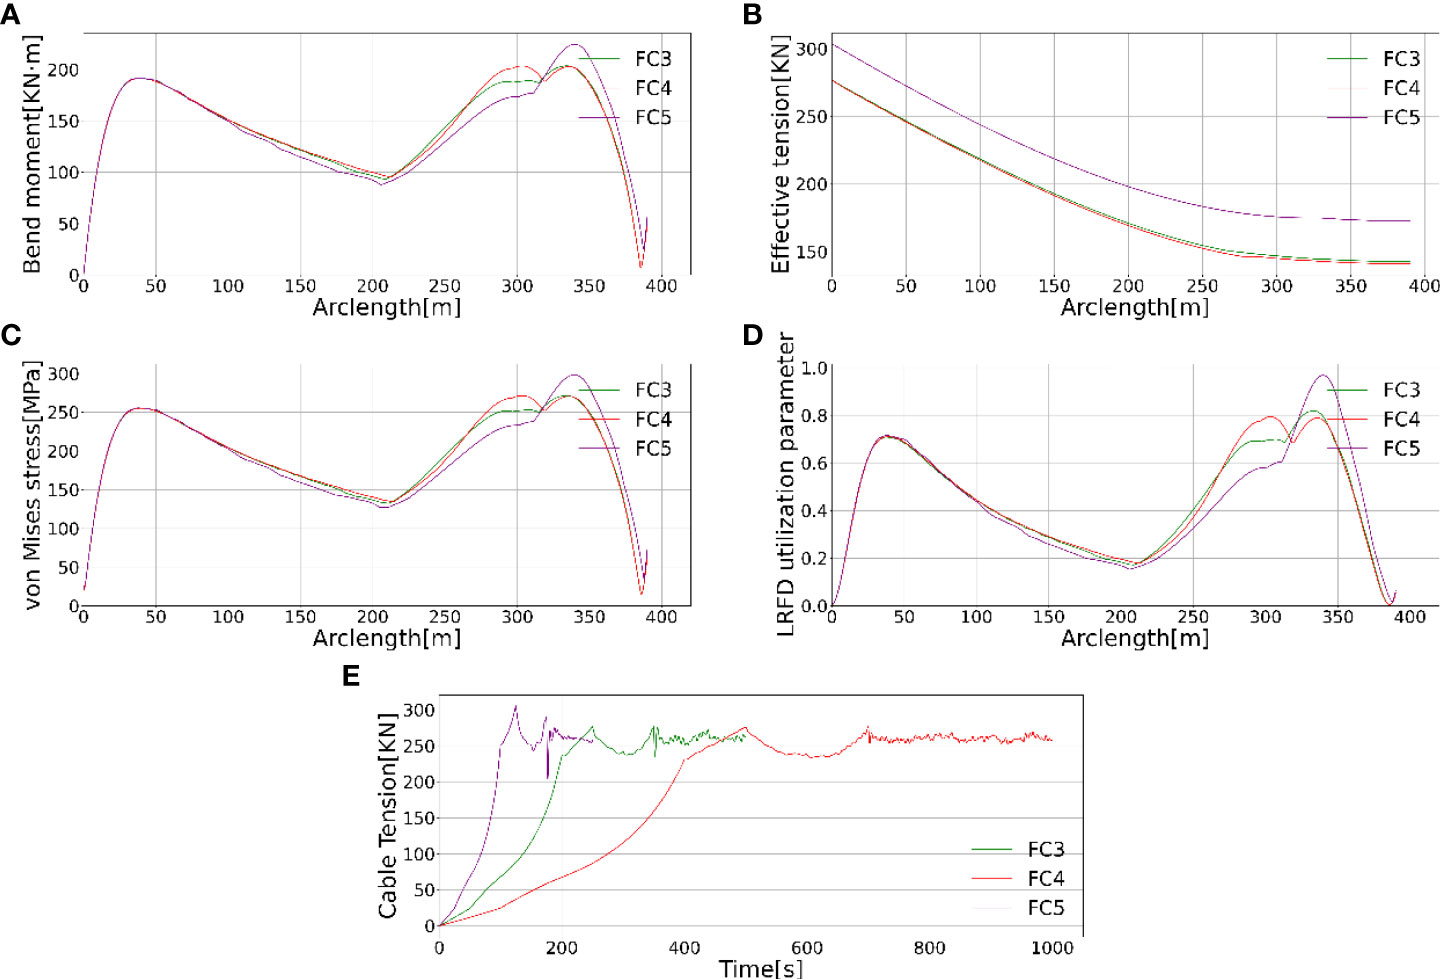
Figure 8 The bending moment (A), effective tension (B), Von Mises stress (C), LRFD utilization (D) and cable tension (E) time history for velocity coordination sensitivity study.
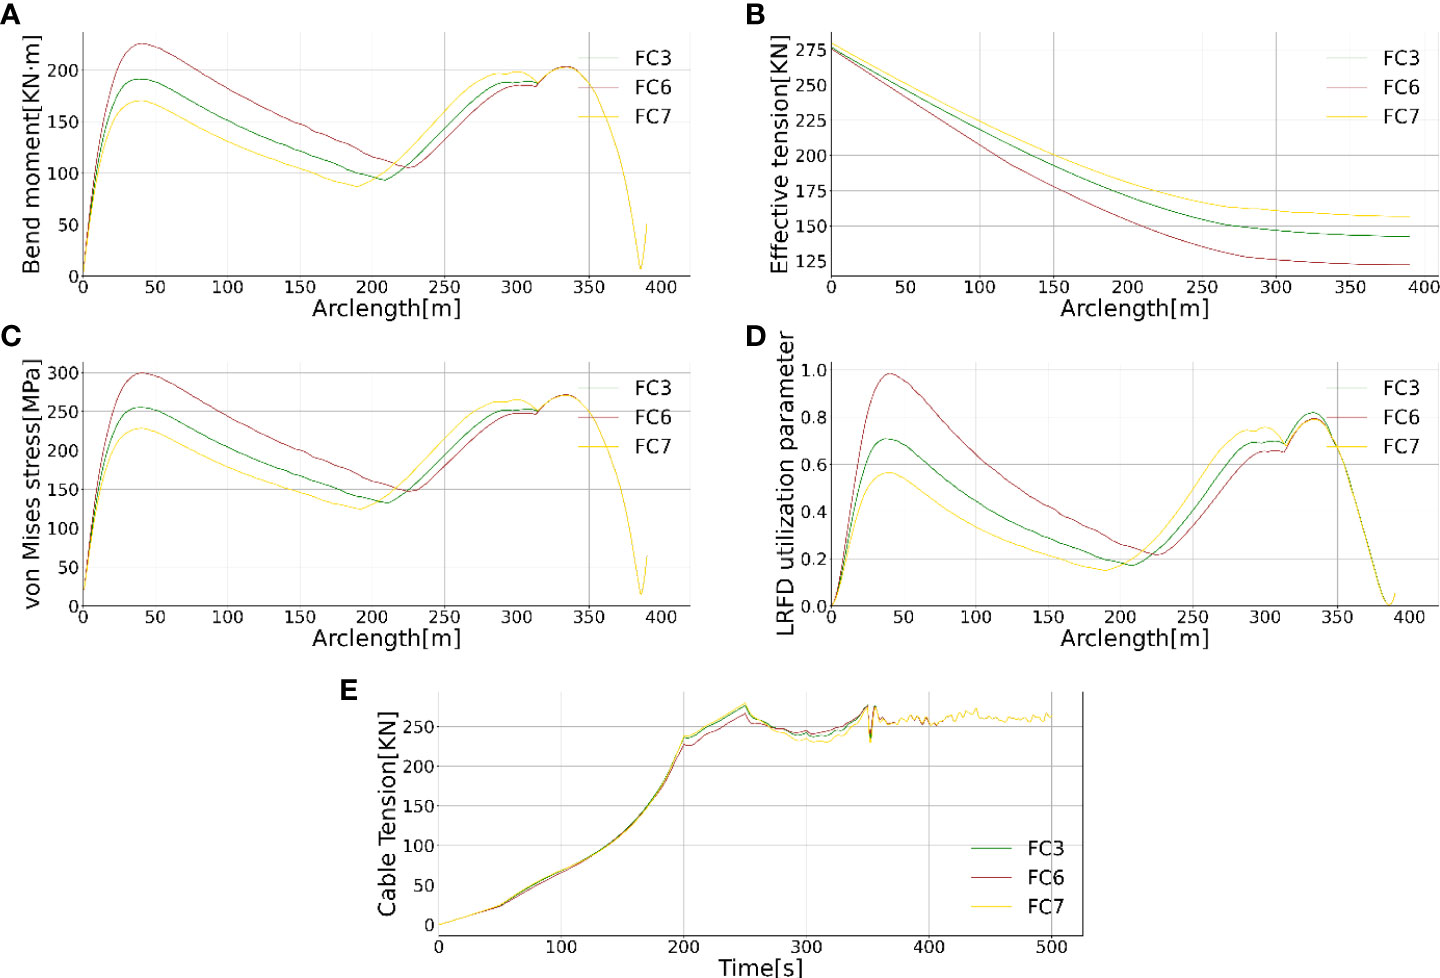
Figure 9 The bending moment (A), effective tension (B), Von Mises stress (C), LRFD utilization (D) and cable tension (E) time history for the initial horizontal distance sensitivity study.
This paper presents the flowline design used for liquid CO2 offloading from the SST. First, the validation of the flowline’s fundamental strength capacity required in the specified water depths was carried out. This includes that the flowline’s cross-section is established according to the strength capacity required in specified water depths concerning the burst, collapse and local buckling criteria (DNV, 2013). Secondly, sensitivity studies investigating parameters including internal flow velocity, current velocities and flowline connecting process were performed for robustness and performance characterization of the design. Since the internal flow velocity is a critical factor in determining the offloading time and the dynamic response of the flowline, sensitivity studies with respect to this factor were carried out to further validate the strength capacity by using the global configuration’s dynamic response analyses. In addition, the flowline structural strength was studied when considering the SST motion under specified current load conditions. The flowline connecting and disassembly is a critical step in this offloading process. The flowline overbending was found to be the most critical structural failure. Therefore, the connecting process to simulate the lifting steps under specified current load conditions and dynamic motions of SST was carried out. In summary, the most fundamental and crucial design factors determining the structural capacity in this offloading process have been considered in this paper for the flowline baseline design. The following conclusions are made:
● The flowline cross-section has been designed by considering multiple factors, including corrosion effect, SST hovering capacity and the global layout configuration and verified against the design burst, collapse and local buckling criteria in DNV-OS-F101 (DNV, 2013). Further, the flowline cross-section design has also been further validated against the von Mises stress criterion for all load conditions studied in this paper. It concludes that the cross-section design satisfied the strength capacity required in all load conditions in the present work.
● Three internal flow velocities of 3, 6 and 9 m/s were studied for the water depth of 360 m. It was found that the internal flow velocity has little effect on the effective tension, bending moment, von Mise stress and the local buckling validation along the flowline’s arclength for the internal flow velocities studied in this paper. This concludes that the applied internal flow velocity of 9 m/s satisfied the hovering capacity of SST and the flowline strength capacity in required water depths in the present work.
● The current load effect on the flowline’s dynamic response was investigated at a water depth of 360 m and an internal flow velocity of 6 m/s. Two mean current velocities of 0.5 m/s and 1 m/s were studied. It was found that an increase in current speed leads to an increase in the effective tension, bending moment, von Mise stress and the local buckling validation along the arclength. However, the strength capacity is still satisfied under these two critical current load conditions.
● The flowline connecting and disassembly design methodology was validated in each water depth with mean current speed. The well-coordinated velocity between the SST and cable hoisting was critical to avoid exceeding the cable’s breaking force and the flowline’s overbending at the touchdown part.
The raw data supporting the conclusions of this article will be made available by the authors, without undue reservation.
TD and YX contributed to conception and design of the study. TD, SY, and YM developed the models necessary for the study. TD and SY performed the analyzes and made the results. TD, SY and YX wrote the first draft of the manuscript. TD, and YX supervised the work. All authors reviewed and edited the manuscript. All authors contributed to the article and approved the submitted version.
The research is partially supported by the National Science Foundation of China (Grant No. 52001129).
The authors declare that the research was conducted in the absence of any commercial or financial relationships that could be construed as a potential conflict of interest.
All claims expressed in this article are solely those of the authors and do not necessarily represent those of their affiliated organizations, or those of the publisher, the editors and the reviewers. Any product that may be evaluated in this article, or claim that may be made by its manufacturer, is not guaranteed or endorsed by the publisher.
Brown J., Graver B., Gulbrandsen E., Dugstad A., Morland B. (2014). Update of DNV recommended practice RP-J202 with focus on CO2 corrosion with impurities. Energy Procedia. 63, 2432–2441. doi: 10.1016/j.egypro.2014.11.265
Dapa M. E., Briggs T. A., Okoli J. U. (2019). Modeling the effects of steel catenary riser (SCR) wall thickness on its structural and fatigue performances for wave-induced load. Innovative Systems Design and Engineering. 10 (6). doi: 10.7176/ISDE/10-6-03
DNV (2018). Rules for classification, naval vessels, part 4 Sub-surface ships, chapter 1 submarines. (Høvik, Norway: Det Norske Veritas)
Ellingsen K., Ravndal O., Reinas R., Hansen J., Marra F., Myhre E., et al. (2020). RD677082 subsea shuttle system. (Paris, France: Research Disclosure).
Eyssautier S., Ryan J., Brouard Y., Erwin Roniawan K., Germanetto F. (2018). Cost effective riser solutions for deepwater gas developments: Steel lazy wave riser and tethered catenary riser, offshore technology conference Asia. (Kuala Lumpur, Malaysia: OnePetro). doi: 10.4043/28279-MS
Fossen T. I. (2011). Handbook of marine craft hydrodynamics and motion control. (West Sussex, UK: John Wiley & Sons). doi: 10.1002/9781119994138
Huang W., Wu X., Liu J., Bai X. (2022). Dynamics of deepwater riser: Theory and method. (Singapore: Springer, Shanghai, China: Shanghai Jiao Tong University Press). doi: 10.1007/978-16-2888-7
Jamissen P. L., Ma Y., Xing Y. (2022). Probabilistic design of thin-walled cylindrical hull structures for application in large cargo submarines, international conference on ocean, offshore and artic engineering. Hamburg, Germany: American Society of Mechanical Engineers.
Luenberger D. (1971). An introduction to observers. IEEE Trans. automatic control. 16 (6), 596–602. doi: 10.1109/TAC.1971.1099826
Ma Y., Sui D., Xing Y., Ong M. C., Hemmingsen T. H. (2021a). Depth control modelling and analysis of a subsea shuttle tanker, international conference on offshore mechanics and Arctic engineering. American Society of Mechanical Engineers. V005T005A026, Virtual, Online. doi: 10.1115/OMAE2021-61827
Ma Y., Xing Y., Hemmingsen T. (2021b). An evaluation of key challenges of CO2 transportation with a novel subsea shuttle tanker, IOP conference series: Materials science and engineering. IOP Publishing. p, 012078. doi: 10.1088/1757-899X/1201/1/012078
Ma Y., Xing Y., Ong M. C., Hemmingsen T. H. (2021c). Baseline design of a subsea shuttle tanker system for liquid carbon dioxide transportation. Ocean Eng. 240, 109891. doi: 10.1016/j.oceaneng.2021.109891
Ma Y., Xing Y., Silva M. S. D., Sui D. (2022). Modelling of a subsea shuttle tanker hovering in ocean current, international conference on offshore mechanics and Arctic engineering (American Society of Mechanical Engineers, Hamburg, Germany).
NPD (Norwegian Petroleum Directorate) (2021) Carbon capture and storage, Norwegian petroleum. Available at: https://www.norskpetroleum.no/en/environment-and-technology/carbon-capture-and-storage/ (Accessed ccessed Sep.05 2022).
Papanikolaou A. (2014). Ship design: methodologies of preliminary design. (Dordrecht, Netherlands: Springer). doi: 10.1007/978-94-017-8751-2
Sørensen A. J. (2004). Marine cybernetics modelling and control lecture notes. Trondheim, Norway: NTNU
Wang J., Duan M. (2015). A nonlinear model for deepwater steel lazy-wave riser configuration with ocean current and internal flow. Ocean Eng. 94, 155–162. doi: 10.1016/j.oceaneng.2014.11.025
Xing Y., Gaidai O., Ma Y., Naess A., Wang F. (2022). A novel design approach for estimation of extreme responses of a subsea shuttle tanker hovering in ocean current considering aft thruster failure. Appl. Ocean Res. 123, 103179. doi: 10.1016/j.apor.2022.103179
Xing Y., Janocha M. J., Yin G., Ong M. C. (2021a). CFD investigation on hydrodynamic resistance of a novel subsea shuttle tanker. J. Mar. Sci. Eng. 9 (12), 1411. doi: 10.3390/jmse9121411
Xing Y., Ong M. C., Hemmingsen T., Ellingsen K. E., Reinås L. (2021b). Design considerations of a subsea shuttle tanker system for liquid carbon dioxide transportation. J. Offshore Mechanics Arctic Eng. 143, (4). doi: 10.1115/1.4048926
Keywords: subsea shuttle tanker, dynamic flowline analysis, CO2 flowline, carbon capture and storage, stochastic current
Citation: Dai T, Yang S, Xing Y and Ma Y (2022) Dynamic design and analysis of subsea CO2 discharging flowline for cargo submarines used for CCS in low-carbon and renewable energy value chains. Front. Mar. Sci. 9:1016062. doi: 10.3389/fmars.2022.1016062
Received: 10 August 2022; Accepted: 14 September 2022;
Published: 04 October 2022.
Edited by:
Sheng Xu, Jiangsu University of Science and Technology, ChinaReviewed by:
Chen An, China University of Petroleum, Beijing, ChinaCopyright © 2022 Dai, Yang, Xing and Ma. This is an open-access article distributed under the terms of the Creative Commons Attribution License (CC BY). The use, distribution or reproduction in other forums is permitted, provided the original author(s) and the copyright owner(s) are credited and that the original publication in this journal is cited, in accordance with accepted academic practice. No use, distribution or reproduction is permitted which does not comply with these terms.
*Correspondence: Yihan Xing, eWloYW4ueGluZ0B1aXMubm8=
†ORCID: Tianjiao Dai, orcid.org/0000-0003-4124-3749
Yihan Xing, orcid.org/0000-0003-0883-4854
Disclaimer: All claims expressed in this article are solely those of the authors and do not necessarily represent those of their affiliated organizations, or those of the publisher, the editors and the reviewers. Any product that may be evaluated in this article or claim that may be made by its manufacturer is not guaranteed or endorsed by the publisher.
Research integrity at Frontiers
Learn more about the work of our research integrity team to safeguard the quality of each article we publish.