 Adnan Haider
 Muhammad Arsalan
 Jiho Choi
 Haseeb Sultan
 Kang Ryoung Park
- Division of Electronics and Electrical Engineering, Dongguk University, Seoul, South Korea
Because fish are vital to marine ecosystems, monitoring and accurate detection are crucial for assessing the potential for fisheries in these environments. Conventionally, fish-related assessment is conducted manually, which makes it labor-intensive and time-consuming. In addition, the assessments are challenging owing to underwater visibility limitations, which leads to poor detection accuracy. To overcome these problems, we propose two novel architectures for the automatic and high-performance segmentation of fish populations. In this study, the efficient fish segmentation network (EFS-Net) and multi-level feature accumulation-based segmentation network (MFAS-Net) are the base and final networks, respectively. In deep convolutional neural networks, the initial layers usually contain potential spatial information. Therefore, the EFS-Net employs a series of convolution layers in the early stage of the network for optimal feature extraction. To boost segmentation accuracy, the MFAS-Net uses an initial feature refinement and transfer block to refine potential low-level information and subsequently transfers it to the deep stages of the network. Moreover, the MFAS-Net employs multi-level feature accumulation that improves pixel-wise prediction for fish that are indistinct. The proposed networks are evaluated using two publicly available datasets, namely DeepFish and semantic segmentation of underwater imagery (SUIM), both of which contain challenging underwater fish segmentation images. The experimental results reveal that mean intersection-over-unions of 76.42% and 92.0% are attained by the proposed method for the DeepFish and SUIM datasets, respectively; these values are higher than those by the state-of-the-art methods such as A-LCFCN+PM and DPANet. In addition, high segmentation performance is achieved without compromising the computational efficiency of the networks. The MFAS-Net requires only 3.57 million trainable parameters to be fully trained. The proposed model and the complete code will be made available1.
1 Introduction
Fish are the subjects of interest in the marine fishing and aquaculture industries. In a marine environment, fish habitat monitoring has become an essential function in research for sustainable fisheries. Fish monitoring primarily includes shape and size assessment, which helps in analyzing the fisheries’ potential (Laradji et al., 2021). Moreover, fish measurements and observations are useful for feed, stock, and growth analysis. Conventionally, manual methods are employed for fish monitoring and measurements. These include ruler and echosounder-based measurements that are time-consuming, error-prone, and tedious (Zhang et al., 2022). Therefore, traditional fish assessment methods should be replaced with automated methods for a more efficient process.
In recent years, artificial intelligence has made significant contributions to automating manual processes (Arsalan et al., 2022c; Haider et al., 2022a; Mahmood et al., 2022b). In particular, the combination of deep learning with computer vision has enabled complex problems to be solved using multimedia-based learning (Owais et al., 2021; Sultan et al., 2021; Arsalan et al., 2022a). Moreover, convolutional neural networks (CNNs) supported by machine vision have been used in automated marine observation. Automatic machine vision-based marine observation can contribute substantially to developing an intelligent decision support system (Laradji et al., 2020). In particular, machine vision for fish observation is a noteworthy step toward modern and intelligent fisheries. However, limited research work and databases are available for underwater machine vision methods because of the underwater imaging limitations and constraints. Existing deep feature-based methods for underwater fish segmentation have limitations in segmentation performance and computational efficiency. Underwater, the segmentation of objects in general and small objects in particular, is challenging because of the visibility constraints.
Existing automatic fish segmentation methods have not delivered high segmentation accuracy with the required small number of trainable parameters. To overcome these problems, two novel architectures were designed to segment fish in an underwater environment. The efficient fish segmentation network (EFS-Net) and multi-level feature accumulation-based segmentation network (MFAS-Net) respectively are the base and final networks of this study. In CNNs, layers close to the image input layer carry potential low-level information (Hosseinzadeh Kassani et al., 2022). In EFS-Net, a series of convolution layers is set at the start of the network for optimal feature extraction from this initial spatial information. In MFAS-Net, potential initial information is refined and transferred using the initial feature refinement and transfer block (IFRT-Block) approach. These initial features are transferred to the deep section of the network where, at the multi-level, they are combined with deep stage features. Feature accumulation at the multi-level improves network training and consequently enhances its segmentation performance.
Detailed fish assessment requires accurate segmentation. Both proposed networks perform semantic segmentation that classifies every pixel of the image into the fish and non-fish (background) classes. The proposed semantic segmentation methods enable precise soft computation and morphological assessment. The effectiveness of the proposed methods is validated on two publicly available datasets, namely DeepFish (Saleh et al., 2020) and semantic segmentation of underwater imagery (SUIM) (Islam et al., 2020). The contribution of the present study can be summarized as follows.
● Two novel networks were developed for robust fish segmentation in challenging underwater environments. EFS-Net and MFAS-Net are the base and final networks, respectively.
● EFS-Net uses a series of convolution layers at the start of the network for optimal low-level feature extraction. In MFAS-Net, initial low-level features are refined and transferred to a deep section of the network using IFRA-Block for improved performance. In addition, MFAS-Net accumulates initial and deep section features at multi-levels to further enhance accurate fish segmentation in underwater environments.
● Both networks, EFS-Net and MFAS-Net, were evaluated on two challenging underwater fish segmentation datasets (DeepFish and SUIM). The proposed approach outperformed state-of-the-art methods and exhibited promising performance with superior computational efficiency (it required only 3.57 million trainable parameters).
● The proposed models and algorithm are made publicly available1.
The remaining paper is organized as follows. We discuss the existing methods in section 2. The proposed work and results are presented in sections 3 and 4, respectively. A detailed discussion is provided in section 5 and a brief conclusion of this work is given in section 6.
2 Related work
Globally, artificial intelligence has introduced revolutionary changes to traditional industries. Furthermore, computer vision has automated manual processes and provided robust solutions to reduce human efforts (Arsalan et al., 2022b). Machine vision provided versatile solutions in numerous fields, such as computer-aided diagnosis, autonomous driving, object tracking, intelligent agriculture, automatic fault detection, smart surveillance, remote sensing, smart decision support system, under-water imagery, human-machine interface, robot-assisted surgery, and many more (Cui et al., 2022; Haider et al., 2022b; Mahmood et al., 2022a). Recently, semantic segmentation has become a widely accepted computer vision-based method. Semantic segmentation networks are usually trained with training data and tested on unseen data. In segmentation, every pixel of the image is classified into desired or undesired classes. Therefore, morphological assessments, measurements, region-based ratios, and visual monitoring can be conducted using segmentation algorithms. In a study (Arsalan et al., 2022d), a pool-less residual segmentation network (PLRS-Net) was used to segment the retinal vessels. This method transfers instant spatial information with residual connectivity. However, PLRS-Net requires a large number of parameters (7.3 million) to complete its training (Arsalan et al., 2022d). Underwater semantic segmentation is challenging because of the unfavorable visual conditions. In the work by Rahnemoonfar and Dobbs (2019), a deep feature-based approach; dense module, dilated convolution, and inception are used for the segmentation of underwater sonar imagery to detect potholes.
In Zhang et al. (2022), a dual pooling‐aggregated attention network was employed for segmenting fish underwater. Position attention and channel attention modules were used for the aggregation of spatial context information to highlight the context dependencies for fish segmentation (Zhang et al., 2022). In their study, the proposed framework was evaluated using two datasets of underwater fish segmentation. The use of ResNet50 as the backbone can be defined as the limitation in the study by Zhang et al. (2022). Another study, Laradji et al. (2021), proposed a weakly supervised approach for underwater fish segmentation that uses a CNN, one section of which provides a pixel-wise score and the other an affinity matrix. Aggregation was performed for both outputs, and consequently, the refined pixel-wise output was generated (Laradji et al., 2021). The limitation of the study was the inability to detect several fish in the same image because it used point-level annotation (Laradji et al., 2021). In Ditria et al. (2020), a deep feature-based object detection approach was used to analyze the abundance of fish. This method presents three models for detecting species underwater and compares the results with the detection accuracy of human experts. A limitation to their study was using the ResNet50 model pre-trained on the ImageNet. Similarly, in Kandimalla et al. (2022), a deep learning method was presented for the detection and classification of fish. Herein, the widely used you only look once (YOLO) machine learning model was combined with Kalman filters to classify and track different species of fish. This method was evaluated with limited data; a single dataset was used for the detection and classification performance evaluation. In addition, no pixel-level detection was performed; therefore, no morphological analyses or species measurements were possible (Kandimalla et al., 2022).
Subsequently, semantic segmentation was performed using DeepLabv3+ for underwater pixel-wise scene detection in another study (Liu and Fang, 2020). This method employed a basic architecture (DeepLabv3+) and used XceptionNet as the backbone, which can be considered the limitation of this method (Liu and Fang, 2020). The Labao and Naval (2017) method, employs a fully convolutional residual network (ResNet-FCN) with 152-layers to segment fish underwater. This method can better deal with the illumination and background changes in underwater environments. However, the network used in this method is outdated and computationally expensive (Labao and Naval, 2017). The Abe et al. (2021) study refers to a framework that is designed for the identification and tracking of fish. In the Badrinarayanan et al. (2017) method, widely used SegNet was chosen for detecting fish at the pixel level (Abe et al., 2021). This method has the limitation of relying on SegNet, which has vanishing gradient problems and requires a large number of trainable parameters (Abe et al., 2021). A study by Islam et al. (2020) used a dataset of underwater objects with a deep residual network for segmentation. In this work, an encoder-decoder structure was presented with optional residual skip blocks (Islam et al., 2020). Each residual skip block consists of three convolutional layers in combination with the rectified linear unit (ReLU) and batch normalization (BN) layers (Islam et al., 2020). Although this work exhibited excellent segmentation performance with competitive computational efficiency, improvements can be made (Islam et al., 2020).
Existing methods suffered from many limitations that have driven the development of new models. Some of the existing methods use the backbone of different architectures or rely on pre-trained networks/preprocessing that can make the model dependent, complex, and less efficient. Similarly, few methods use point-level annotation therefore such a framework shows an inability for multiple fish detection. Most of the networks exhibit a degraded performance for underwater small and unclear objects. Existing methods that deliver competitive accuracies suffer from poor computational efficiency and require a large number of trainable parameters. Proposed methods are developed to address all these problems and to overcome the limitations of existing methods.
3 Materials and methods
3.1 Overview of the proposed methods
An overview of the proposed architecture is shown in Figure 1. Experimentation was performed for underwater fish segmentation task using two publicly available datasets. High-performance segmentation is challenging in an underwater environment because of the difficult imaging environment. Underwater imaging produces serious limitations in contrast and sharpness that create challenging conditions for segmentation. Underwater segmentation becomes even more challenging because of the sizes and shapes of fish as well as the effects of the background and illumination. Additionally, detecting small-sized fish under unfavorable background conditions is challenging. Most of the existing methods failed to provide better performance because of the small final feature map size, vanishing gradient problem, and unavailability of appropriate feature aggregation mechanisms. To overcome all these problems and deal with challenges, two networks were developed for fish segmentation underwater. Input images from both datasets are provided to the network for training and testing. To train the network fast, the training data split was resized using nearest neighbor interpolation and input to the network. Resizing training images is a common practice for the training of deep learning models. In our experiments, training images were resized to 400 × 400 pixels for efficient training of the network. However, images can be resized to any other size keeping the original image’s size in view.
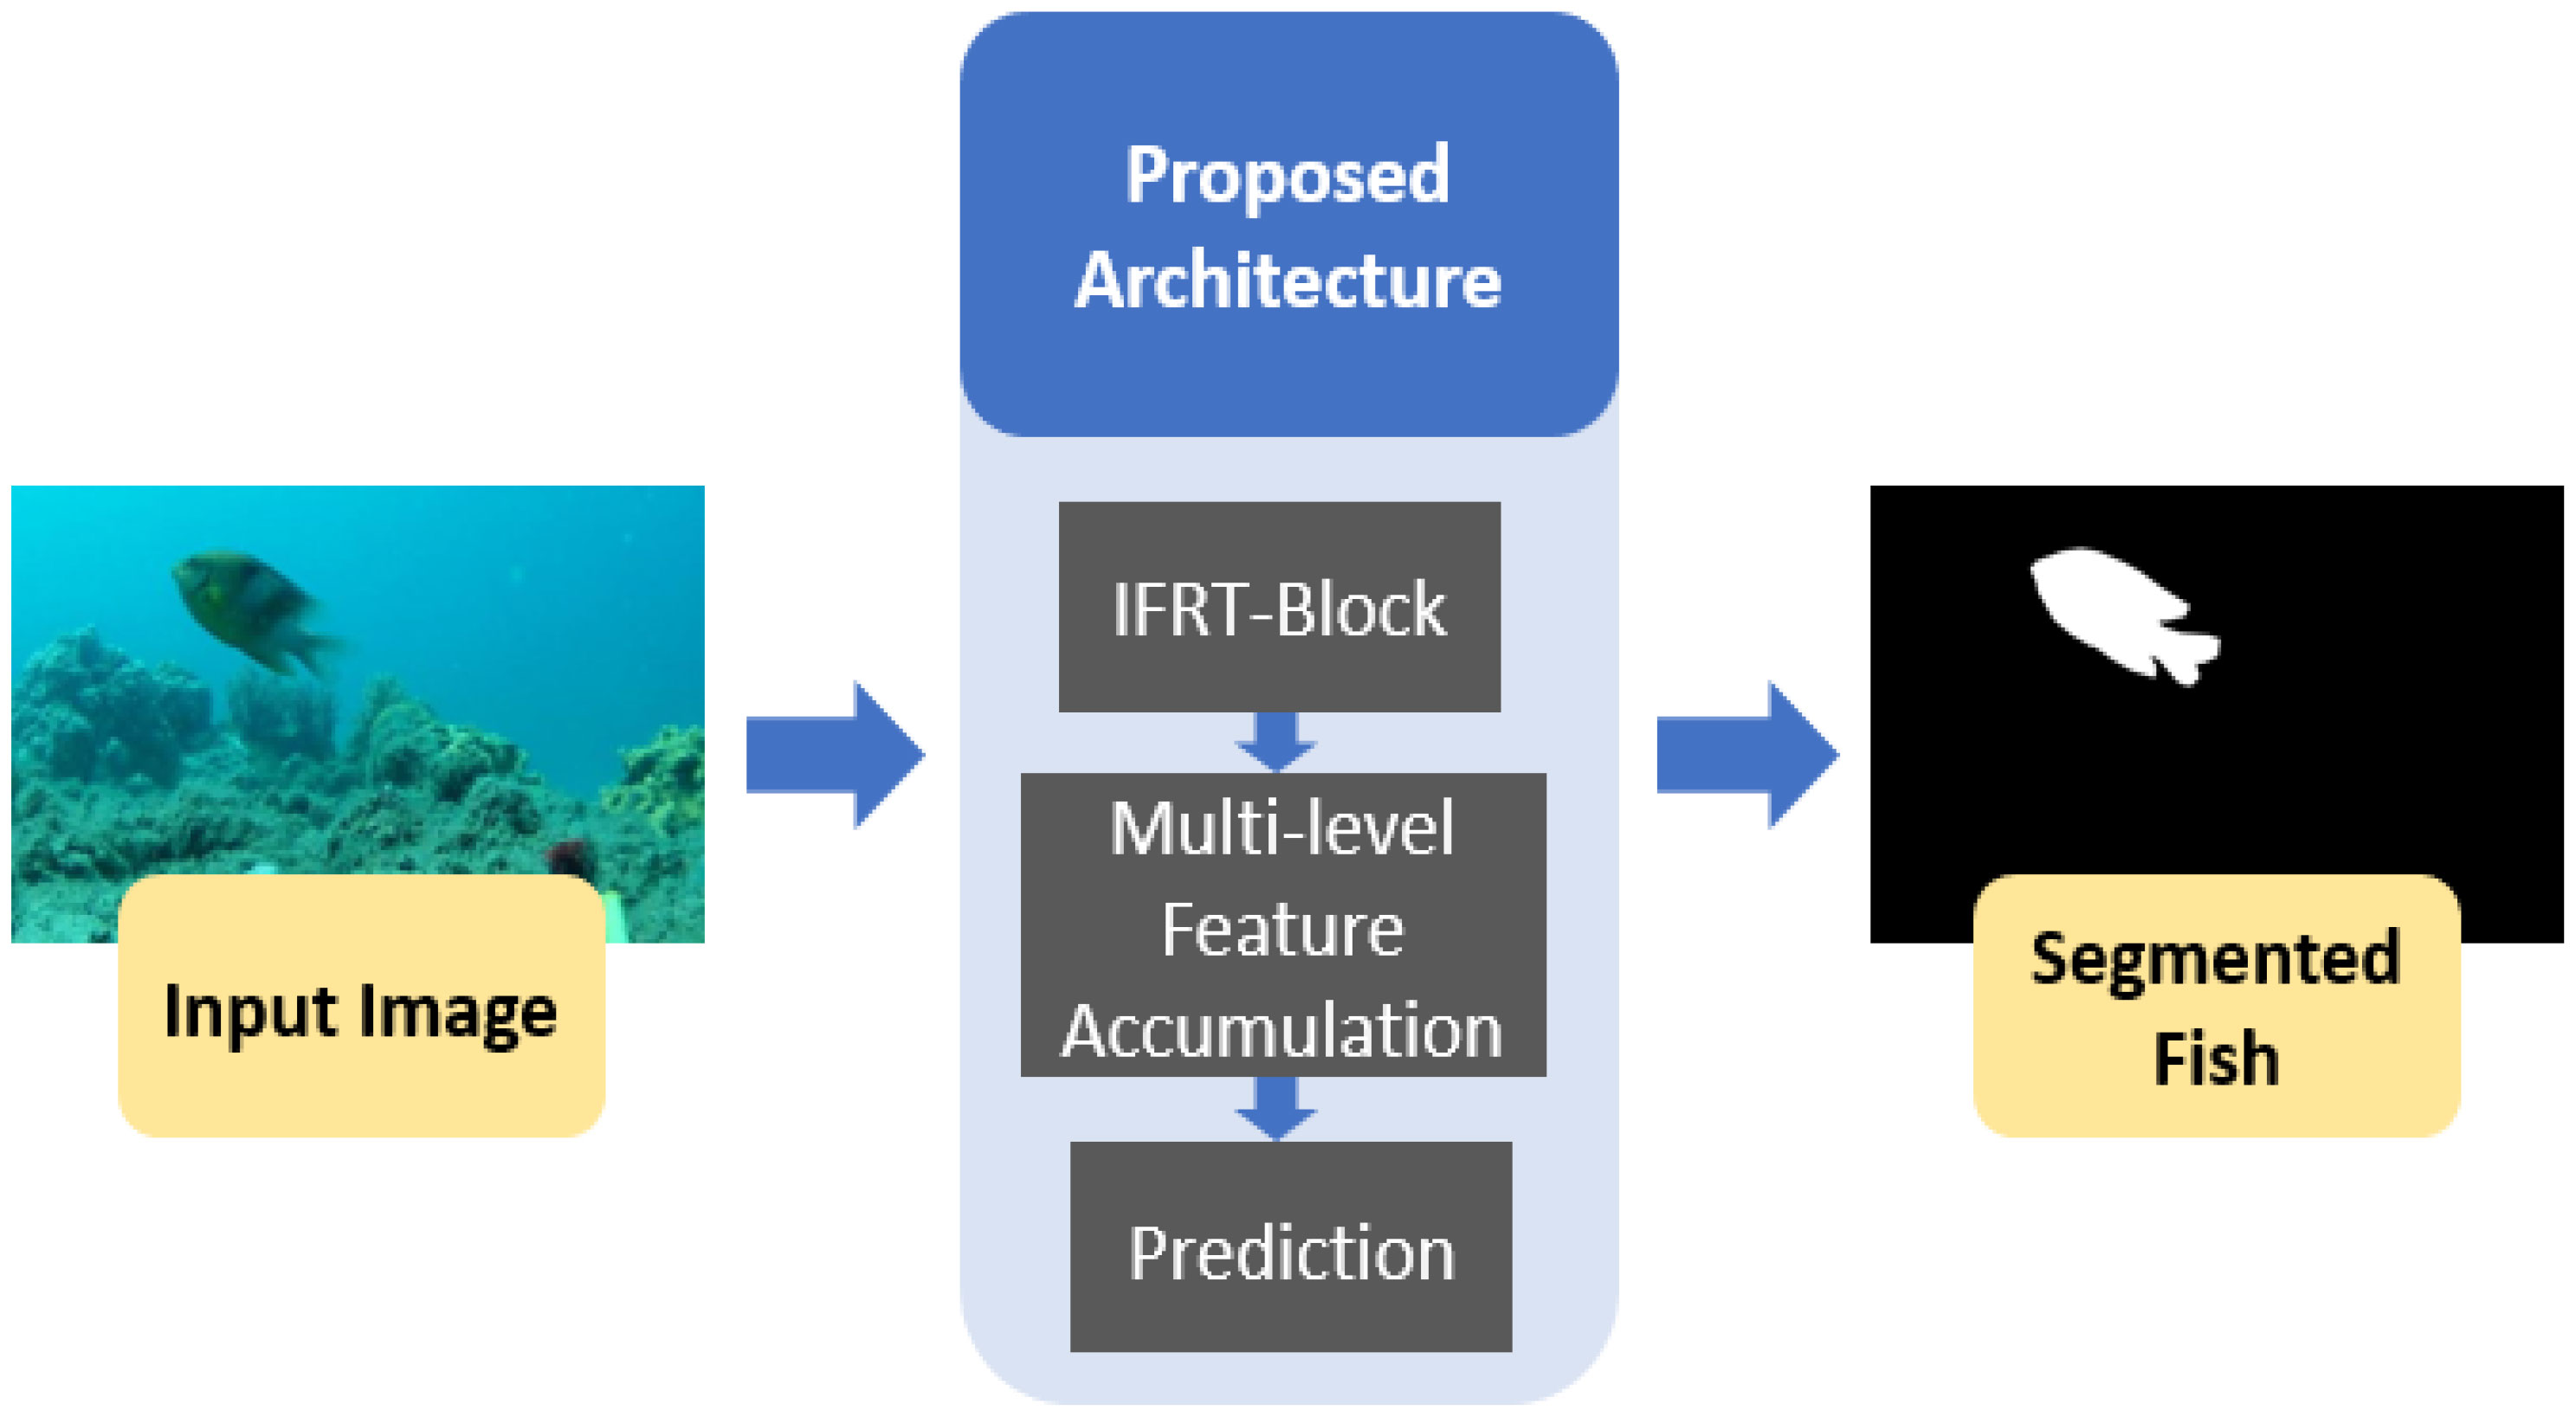
Figure 1 Overview of the proposed method.
The initial layers of a CNN hold potential low-level information (Hosseinzadeh Kassani et al., 2022). The proposed method uses a large number of convolution layers in the early stage of the network to optimize extraction from this low-level information. These valuable initial features are further refined and transferred to the deeper stages of the network in the IFRT-Block. Subsequently, the transferred initial features are accumulated with the features from the deeper layers. For feature empowerment and effective learning, feature accumulation occurs at multiple levels in the network. Finally, a prediction mask is generated to detect pixels of the desired class. Unlike most of the existing methods, the proposed methods do not require pre-processing to achieve desirable results. In addition, the proposed methods are not computationally expensive and require a small number of trainable parameters to complete the network training.
3.2 Fish segmentation using EFS-net
Underwater image segmentation requires an efficient and effective architecture to obtain acceptable results. Fish imaging in a natural marine environment produces a wide variety of fish images with different sizes, shapes, and backgrounds. Therefore, accurate fish segmentation is challenging in the marine underwater environment. In this study, networks were designed to overcome these challenges. EFS-Net is the base network of this study and its network architecture is shown in Figure 2. In deep learning models, layers close to the image input layer have potential low-level initial information (Hosseinzadeh Kassani et al., 2022). Herein, a series of five convolution layers were deployed to extract valuable features from low-level information. This low-level information processing helps boost the segmentation performance.
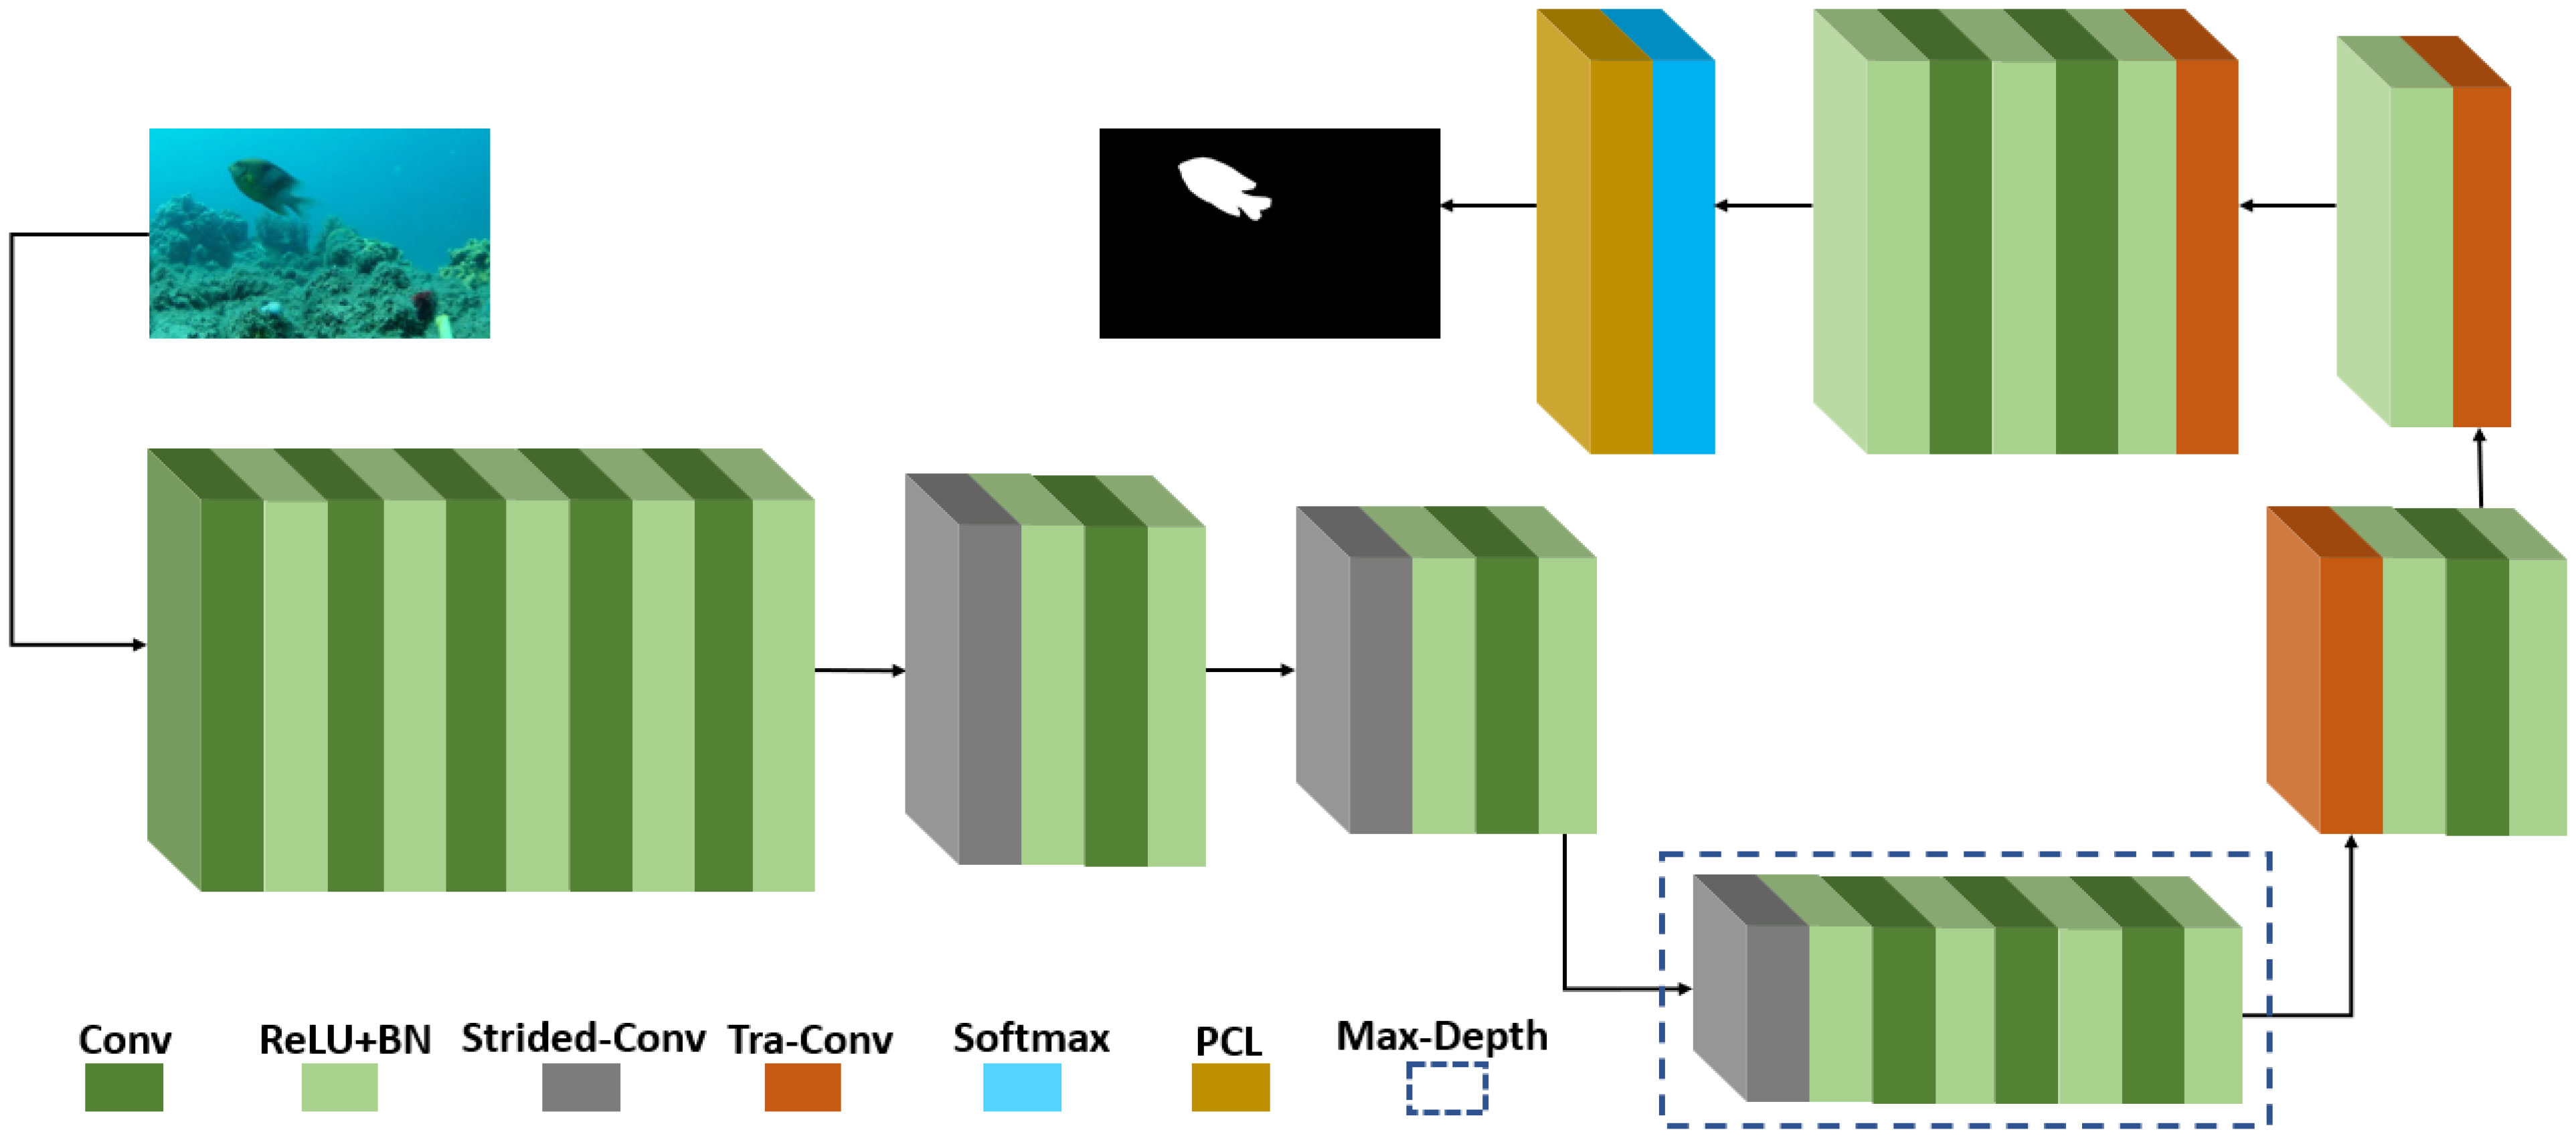
Figure 2 Proposed EFS-Net architecture.
Subsequently, the feature map size of the initial spatial information was reduced using a strided convolutional (strided-Conv) layer. In EFS-Net, the strided-Conv layer was used in place of despite using pooling layers. Pooling layers produce spatial loss that negatively affects the learning process (Abdeldaim et al., 2018). Moreover, an excessively small final feature map size degrades the detection accuracy, particularly for small objects. In underwater fish segmentation, several images contain small-sized fish. Therefore, in EFS-Net, the final feature map size was sufficiently large to detect the pixels of small-sized fish. Only three strided-Conv layers with a stride value of 2 were used to reduce the feature map size. Every convolutional layer in the network was followed by ReLU and BN combinations for activations and normalization. In Figure 2, the maximum depth (Max-Depth) of the network is outlined by a dashed bounding box. The last strided-Conv layer further reduced the feature map size and applied maximum filters. Therefore, in Max-Depth, the final feature map size was minimal (50 × 50) with the maximum number of channels (256) in the network. The CNNs possess better semantic information in the Max-Depth area of the network (Kreso et al., 2017). Thus, to better learn the semantics of the image, more convolution layers (03) were used in the Max-Depth of the network.
The feature map size of spatial features in Max-Depth was increased using transposed convolution layers (Tra-Conv). In EFS-Net, three Tra-Conv layers were used to increase the feature map size back to the initial size. Note that EFS-Net avoided having an unpooling layer by using Tra-Conv layers to avoid any kind of spatial loss. Unlike pooling and unpooling layers, both strided and Tra-Conv layers are trainable layers; hence, they both contributed to the learning of the network (Kreso et al., 2017). The last Tra-Conv layer provided the feature to the next convolution layer for further feature empowerment. The last convolution layer applied two filters and, for the softmax function, provided two channels to match the number of classes (02). Finally, the dice pixel classification layer (PCL) classified each pixel into fish and non-fish (background) classes. Notably, more convolution layers were used in the initial stage and Max-Depth sections because these stages are crucial for effective learning. Despite showing promising performance, EFS-Net exhibited some performance degradation when segmenting indistinct small fish with similar backgrounds (Detailed quantitative and qualitative results are provided in subsections 4.4−4.7)
3.3 Fish segmentation using MFAS-net
MFAS-Net is the final network of this study. MFAS-Net uses the architectural base of EFS-Net and was developed to further increase the segmentation accuracies for underwater fish segmentation. As stated, EFS-Net exhibited certain performance limitations in segmenting obscure small-sized fish. To overcome this problem and enhance the overall segmentation performance, MFAS-Net introduced the IFRT-block with a multi-level feature accumulation scheme. MFAS-Net architectural design is presented in Figure 3. Layers close to the input image contain potential spatial features (Hosseinzadeh Kassani et al., 2022). In the IFRT-Block, the spatial features are further refined and transferred to the deeper layers of the network. IFRT block is based on three convolution layers with one feature accumulation (FA-1) junction. Initial low-level spatial features from four different points are concatenated in FA-1. The IFRT-Block transfers processed initial features to FA-4 using two convolution layers.
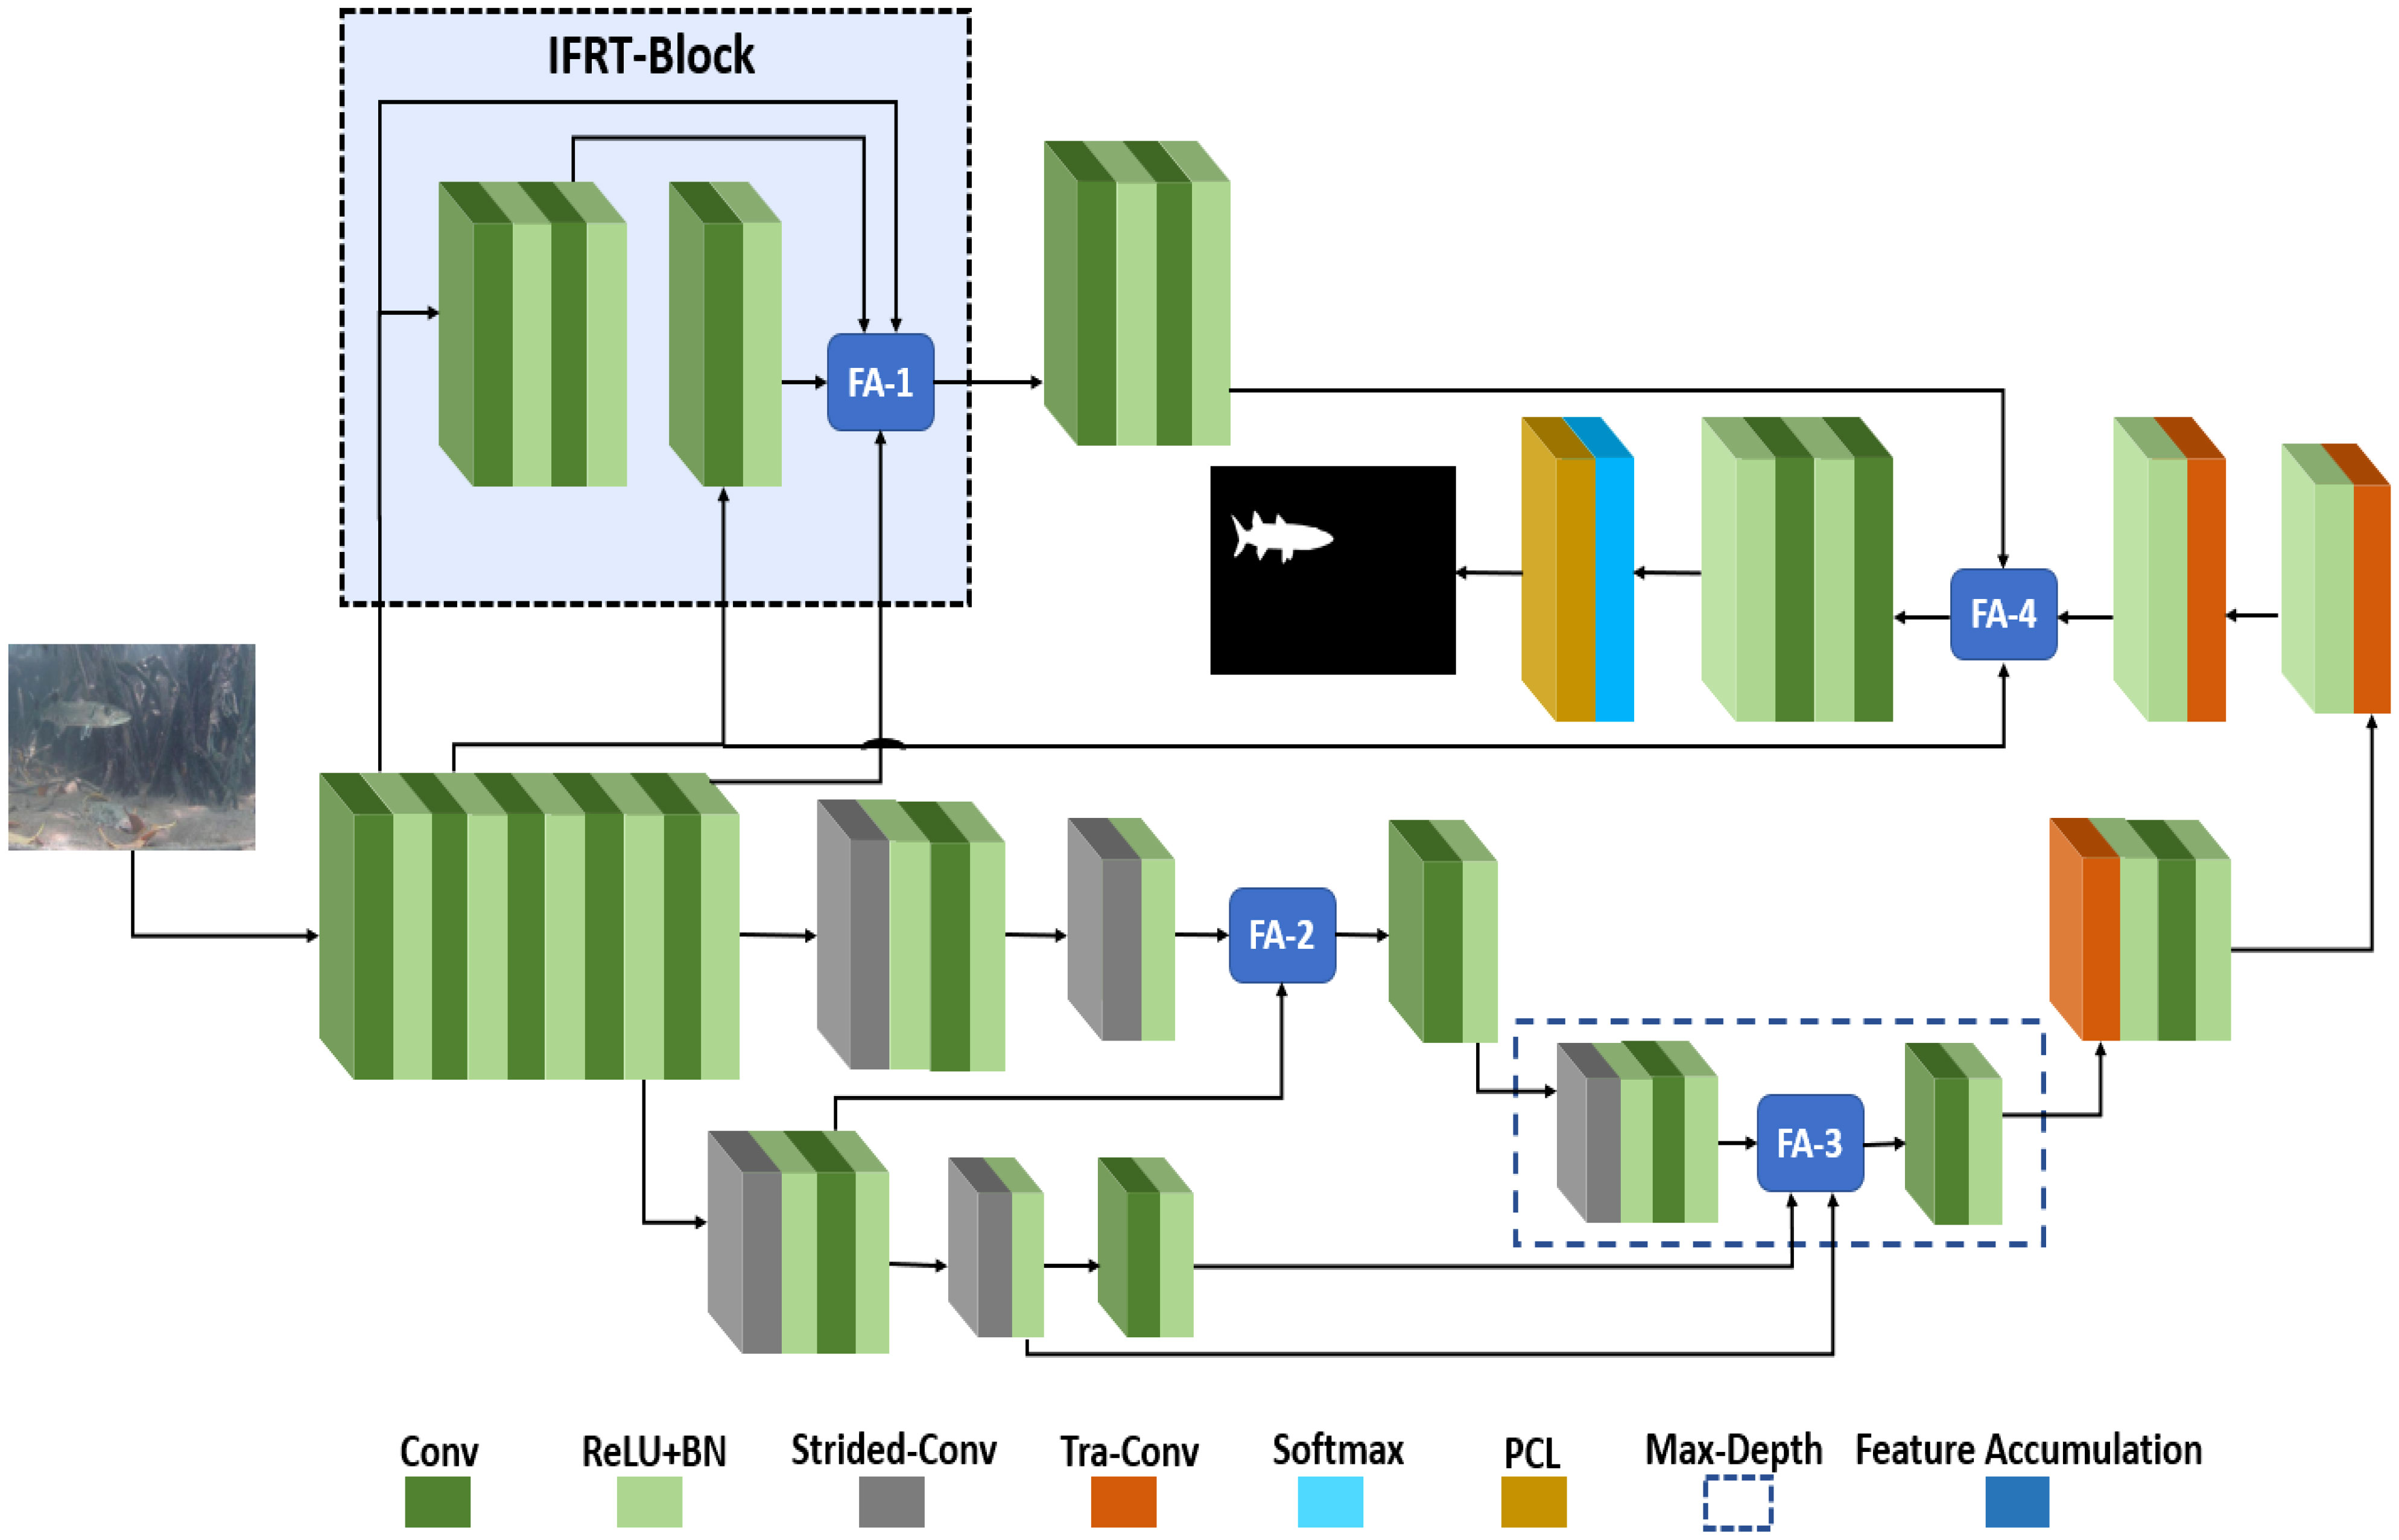
Figure 3 Proposed MFAS-Net architecture.
In FA-2, the downsampled spatial features are concatenated with the transferred features from the high stride (stride = 4) skip path. The first strided-Conv layer of this skip path uses a stride of 4 to reduce the feature map size and its output is provided to FA-2 through a convolution layer. This accumulation of features from different levels and scales allows diverse learning and helps improve the segmentation performance. Subsequently, features from the first high strided-Conv layer are input to the second strided-Conv layer where the feature map size is further reduced and its output is provided to FA-3. In FA-3, direct features from the second strided-Conv layer and features from a convolution layer are concatenated with the final downsampled features in Max-Depth. In CNNs, deeper layers are more effective for preserving image semantics (Kreso et al., 2017). FA-3 lies in Max-Depth; therefore, it has a vital impact on improving segmentation performance.
After the feature map is up-sampled back to the initial size, final feature accumulation (FA-4) is applied. In FA-4, the up-sampled accumulated features (Fus ) are concatenated with the direct initial spatial features (Fis ) and the initial refined features (Fir) from the IRFT-Block. The feature accumulation process can be further explained using the diagram in Figure 4. After feature accumulation, FA (m) in the IFRT-Block transfers Fir for final accumulation. Fis is the initial spatial feature that originated from the early stage of the network to be concatenated in FA-4 with identity mapping. At Max-Depth of the network, after feature accumulation FA (n), the accumulated features from Max-Depth are up-sampled. Additionally, Fus from the last Tra-Conv layer is provided to FA (p) for final feature accumulation as follows.
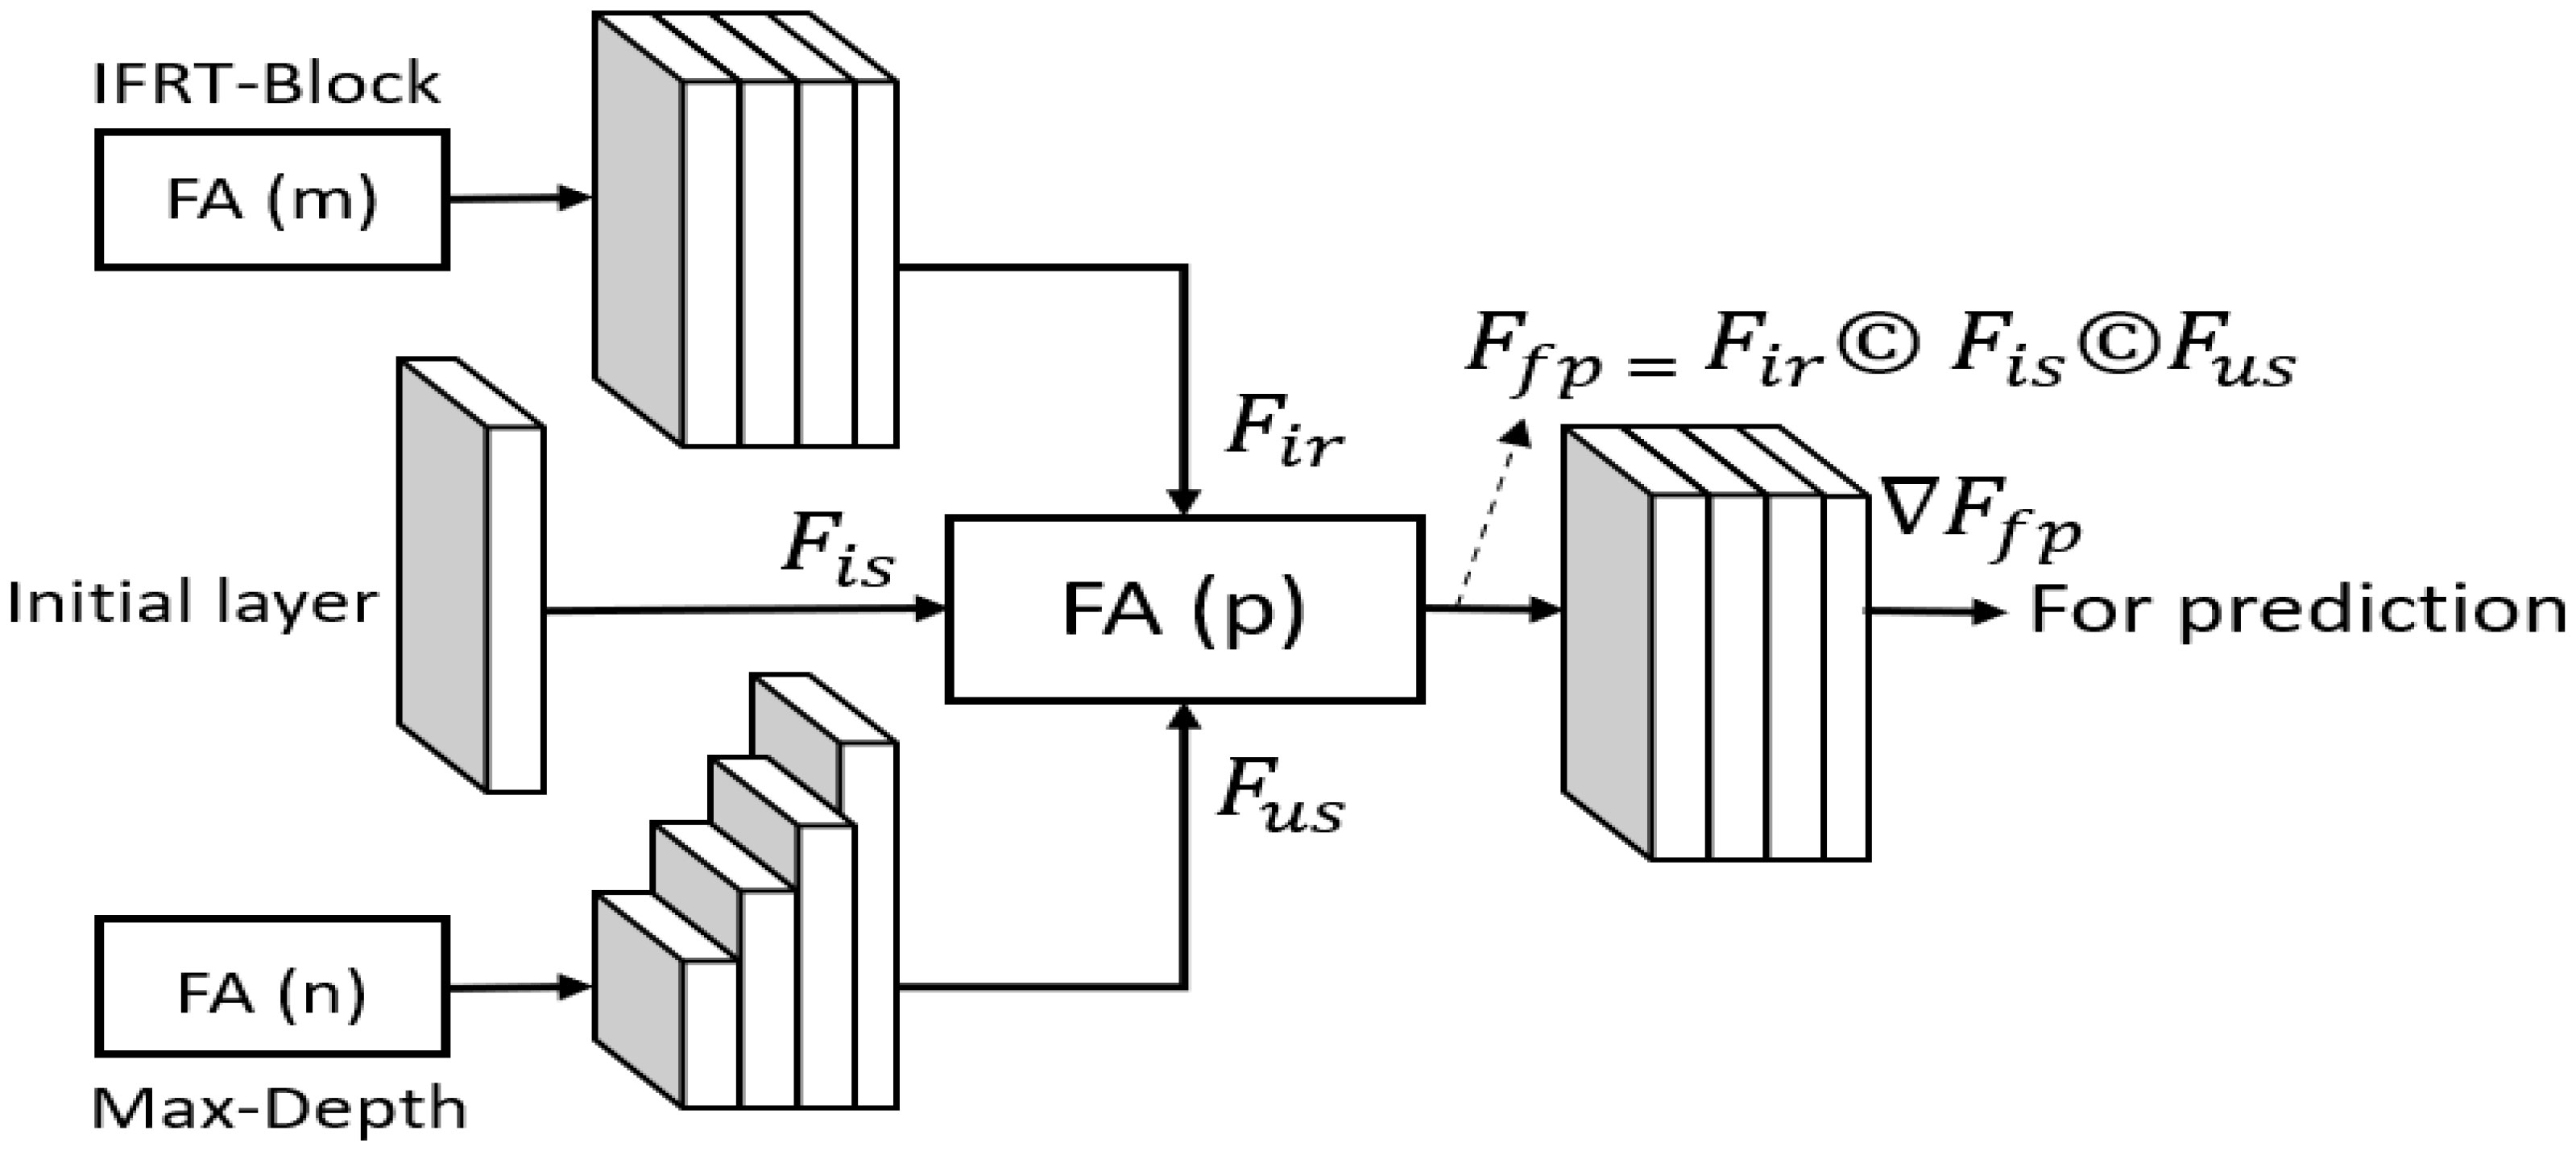
Figure 4 Schematic illustrating feature accumulation.
where Ffp denotes the final feature for prediction and is generated by concatenating three features. The Ffp is provided to two convolution layers for final feature extraction before prediction and the feature change because of convolution is indicated by ∇. Finally, a prediction mask is generated by the pixel classification layer based on ∇Ffp .
This feature accumulation from different levels of the network empowers the feature and helps enhance the segmentation performance. In addition, the feature accumulation scheme enables the network to minimize the vanishing gradient problem and maintain a better pixel-wise prediction even for small-sized unclear fish images. The configuration details of layers of MFAS-Net are presented in Table 1
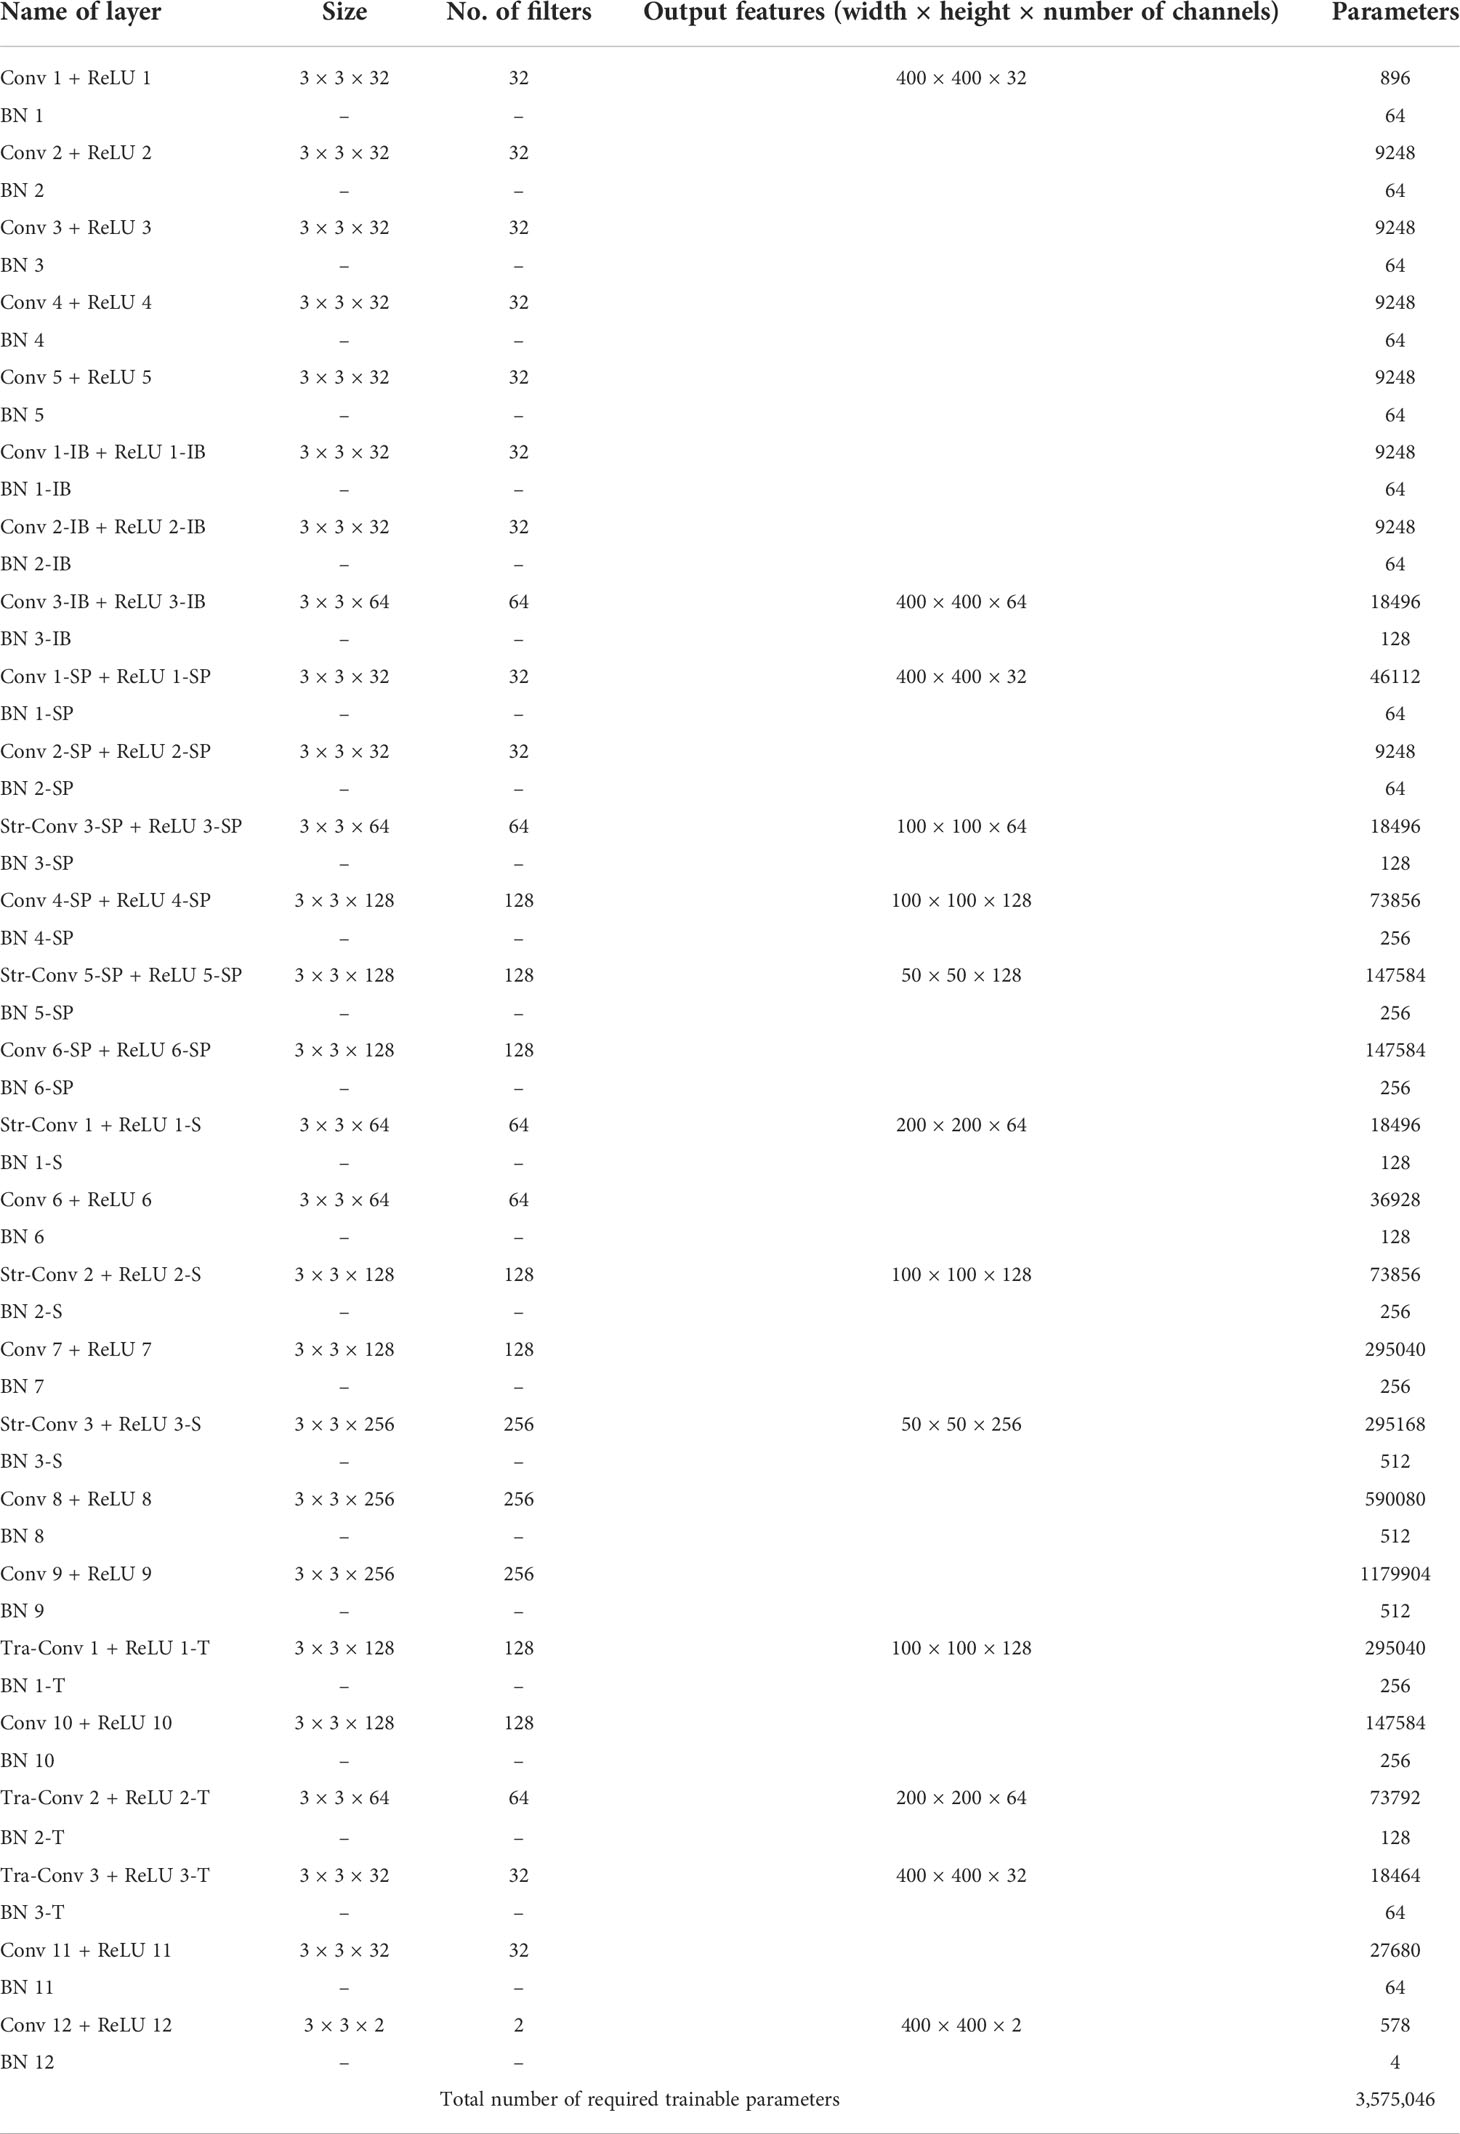
Table 1 Layers configurational details of MFAS-Net with the number of required trainable parameters (Resized feature map of 400 × 400 is used to show the configuration of the layers) (Str-Conv, Strided convolution layer; Tra-Conv ,Transposed convolution layer; IB, IFRT-Block; SP, Skip path; Conv, Convolution).
4 Results
4.1 Experimental data and environment
In this study, both proposed networks were evaluated using two underwater fish segmentation-related datasets, DeepFish (Saleh et al., 2020) and SUIM (Islam et al., 2020). DeepFish is a large-scale fish dataset containing a total of 40,000 images from different marine habitats. The purpose of developing the DeepFish dataset was to monitor the fish dynamics along with shape and size assessments. This dataset is divided into three categories: FishLoc (fish location), FishClf (fish classification), and FishSeg (fish segmentation). In FishLoc, point-level annotations are provided to specify the location of fish. FishClf includes the classification labels. Last, FishSeg has pixel-level expert annotations for the segmentation of fish. In this study, we focused on segmentation; therefore, only FishSeg was used in our experiments. The FishSeg data split contains 310 training, 124 validation, and 186 testing images. FishSeg is a challenging subset of DeepFish because it consists of samples with different shapes, sizes, illumination conditions, and backgrounds. Examples from DeepFish (FishSeg) are shown in Figure 5.
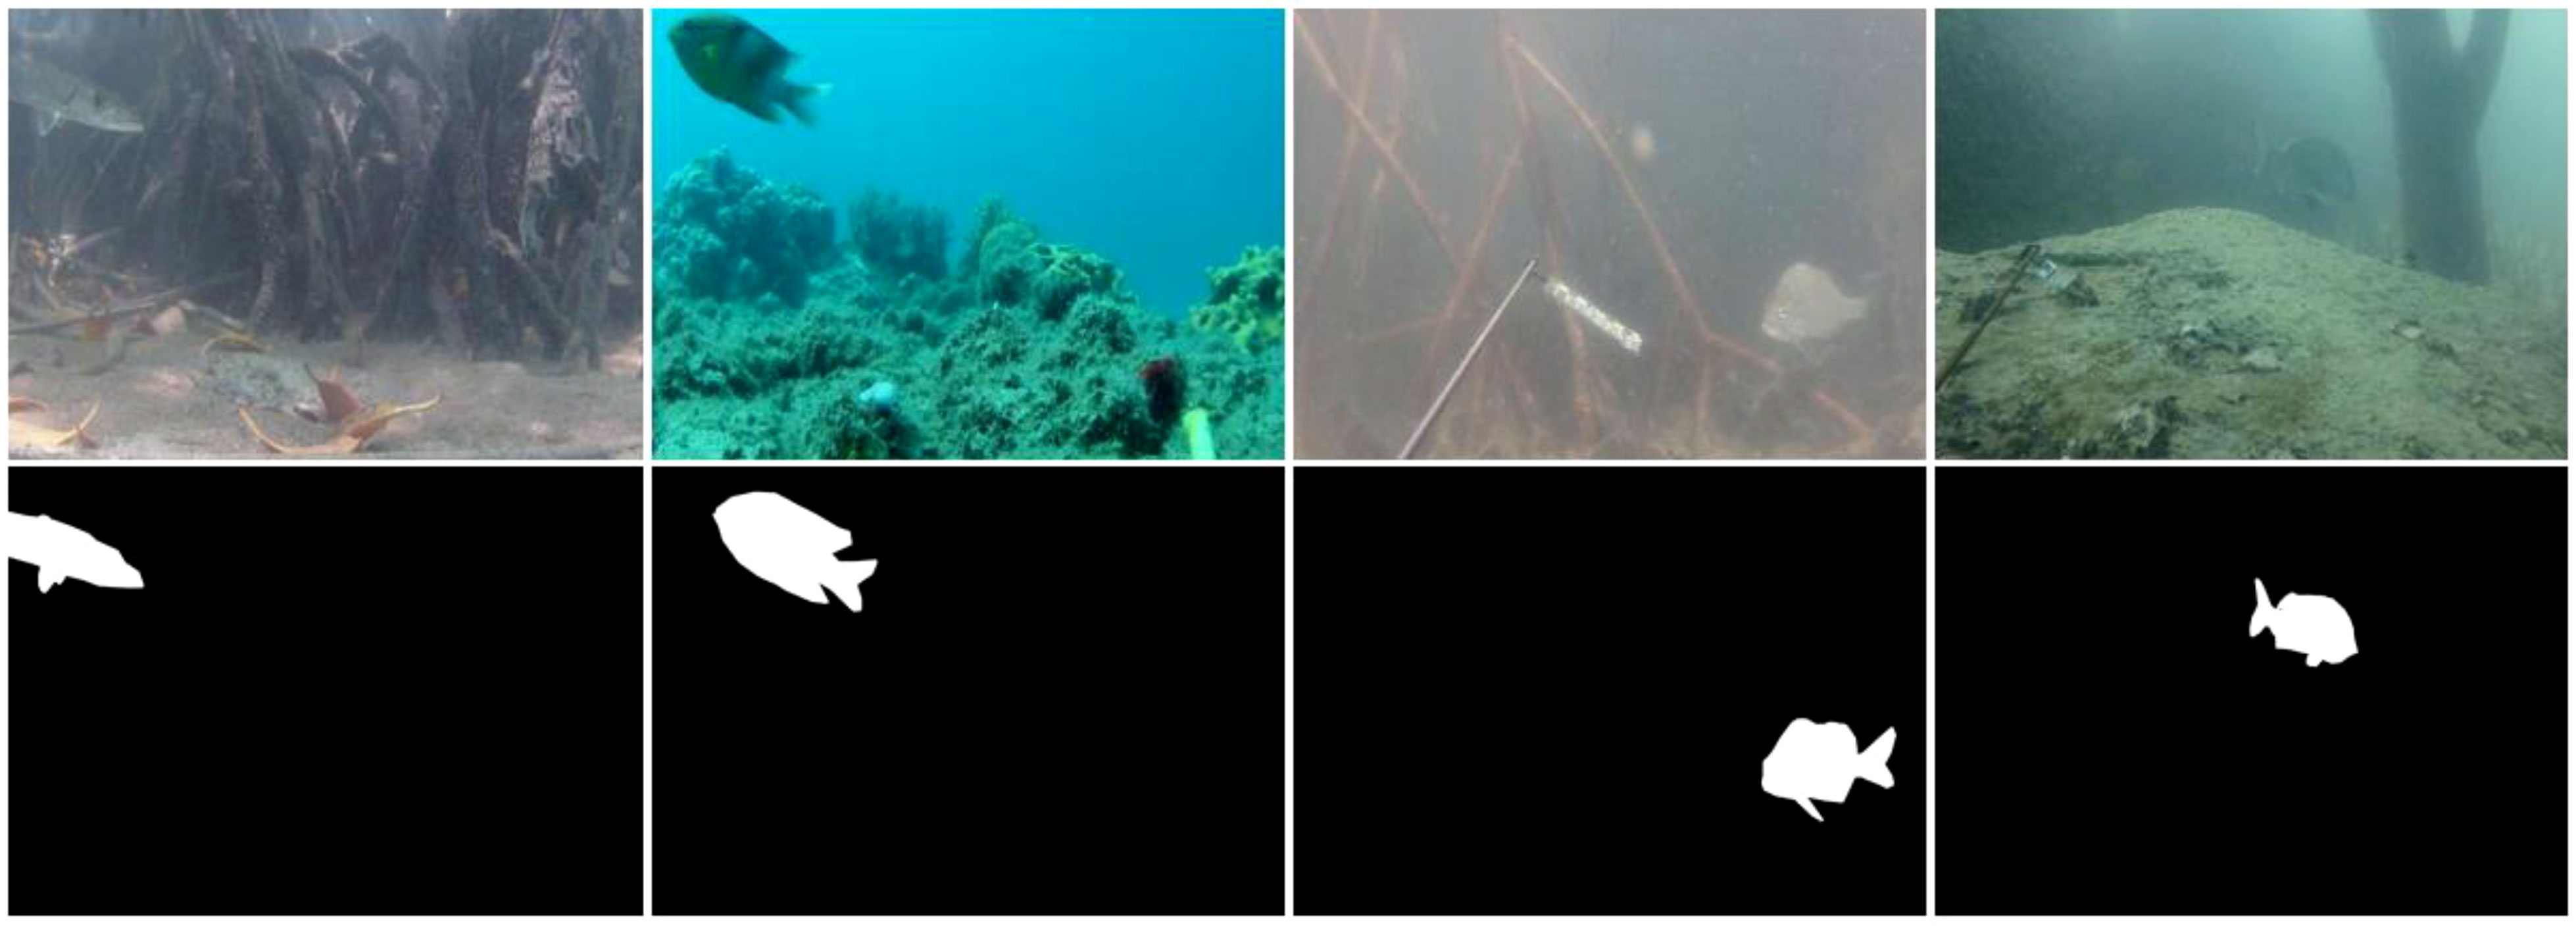
Figure 5 DeepFish (FishSeg) sample images with corresponding ground truth images. (The white pixels in the ground truth images belong to fish).
SUIM dataset contains a total of 1525 underwater images of multiple categories, including fish. SUIM provides a test split with separate annotations for each category. Therefore, in the experiments, we worked with fish and other vertebrate categories and used this data for fish segmentation. Sample images from the SUIM dataset are presented in Figure 6.
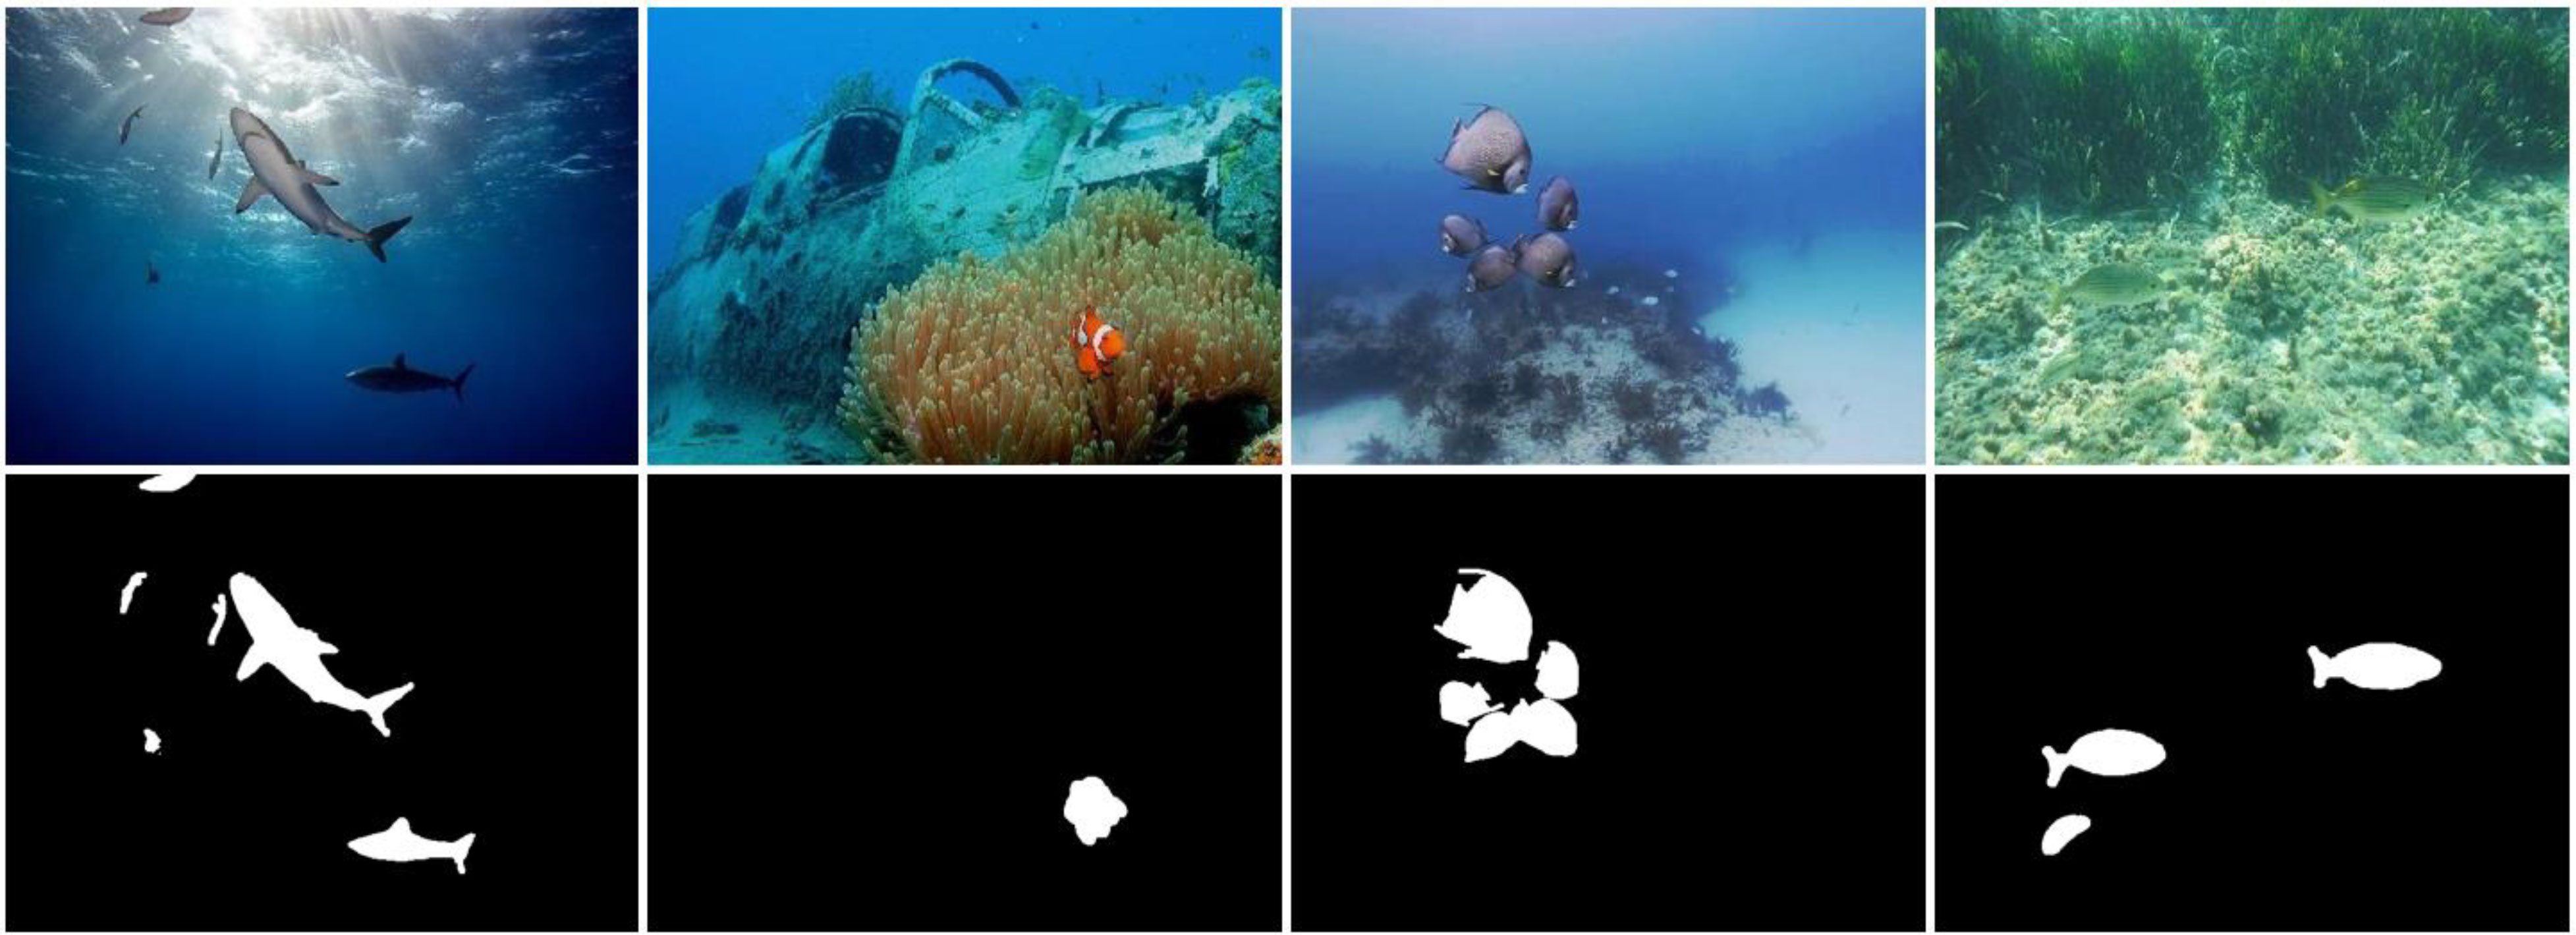
Figure 6 SUIM sample images with corresponding ground truth images. (The white pixels in the ground truth images belong to fish).
The fish segmentation experimental work was performed using a desktop computer Intel ® Core™ i7 CPU950@3.7 GHz with 32 GB of RAM and an NVIDIA GeForce GTX 1070 GPU with 8 GB of graphical memory (GeForce GTX 1070, accessed on January 25, 2022). MATLAB 2020b (MATLAB R2020b, accessed on January 25, 2022) was used for the architectural development, training, and testing of the networks.
4.2 Training proposed networks
Both networks, EFS-Net and MFAS-Net, were trained on DeepFish and SUIM datasets separately. The training images from both datasets were resized to 400 × 400 for time-efficient training. The image resizing used nearest-neighbor interpolation. The data splits of both datasets were defined by the dataset providers. Proposed methods are evaluated with the same data splits used by the previous research (Laradji et al., 2021) for a fair comparison. Overfitting was avoided using early stopping and data augmentation. The Adam optimizer was used because of its fast convergence and data handling capabilities (Kingma and Ba, 2014). The training loss and accuracy plots of MFAS-Net are presented in Figure 7, which shows high training accuracy with progressively decreasing loss.
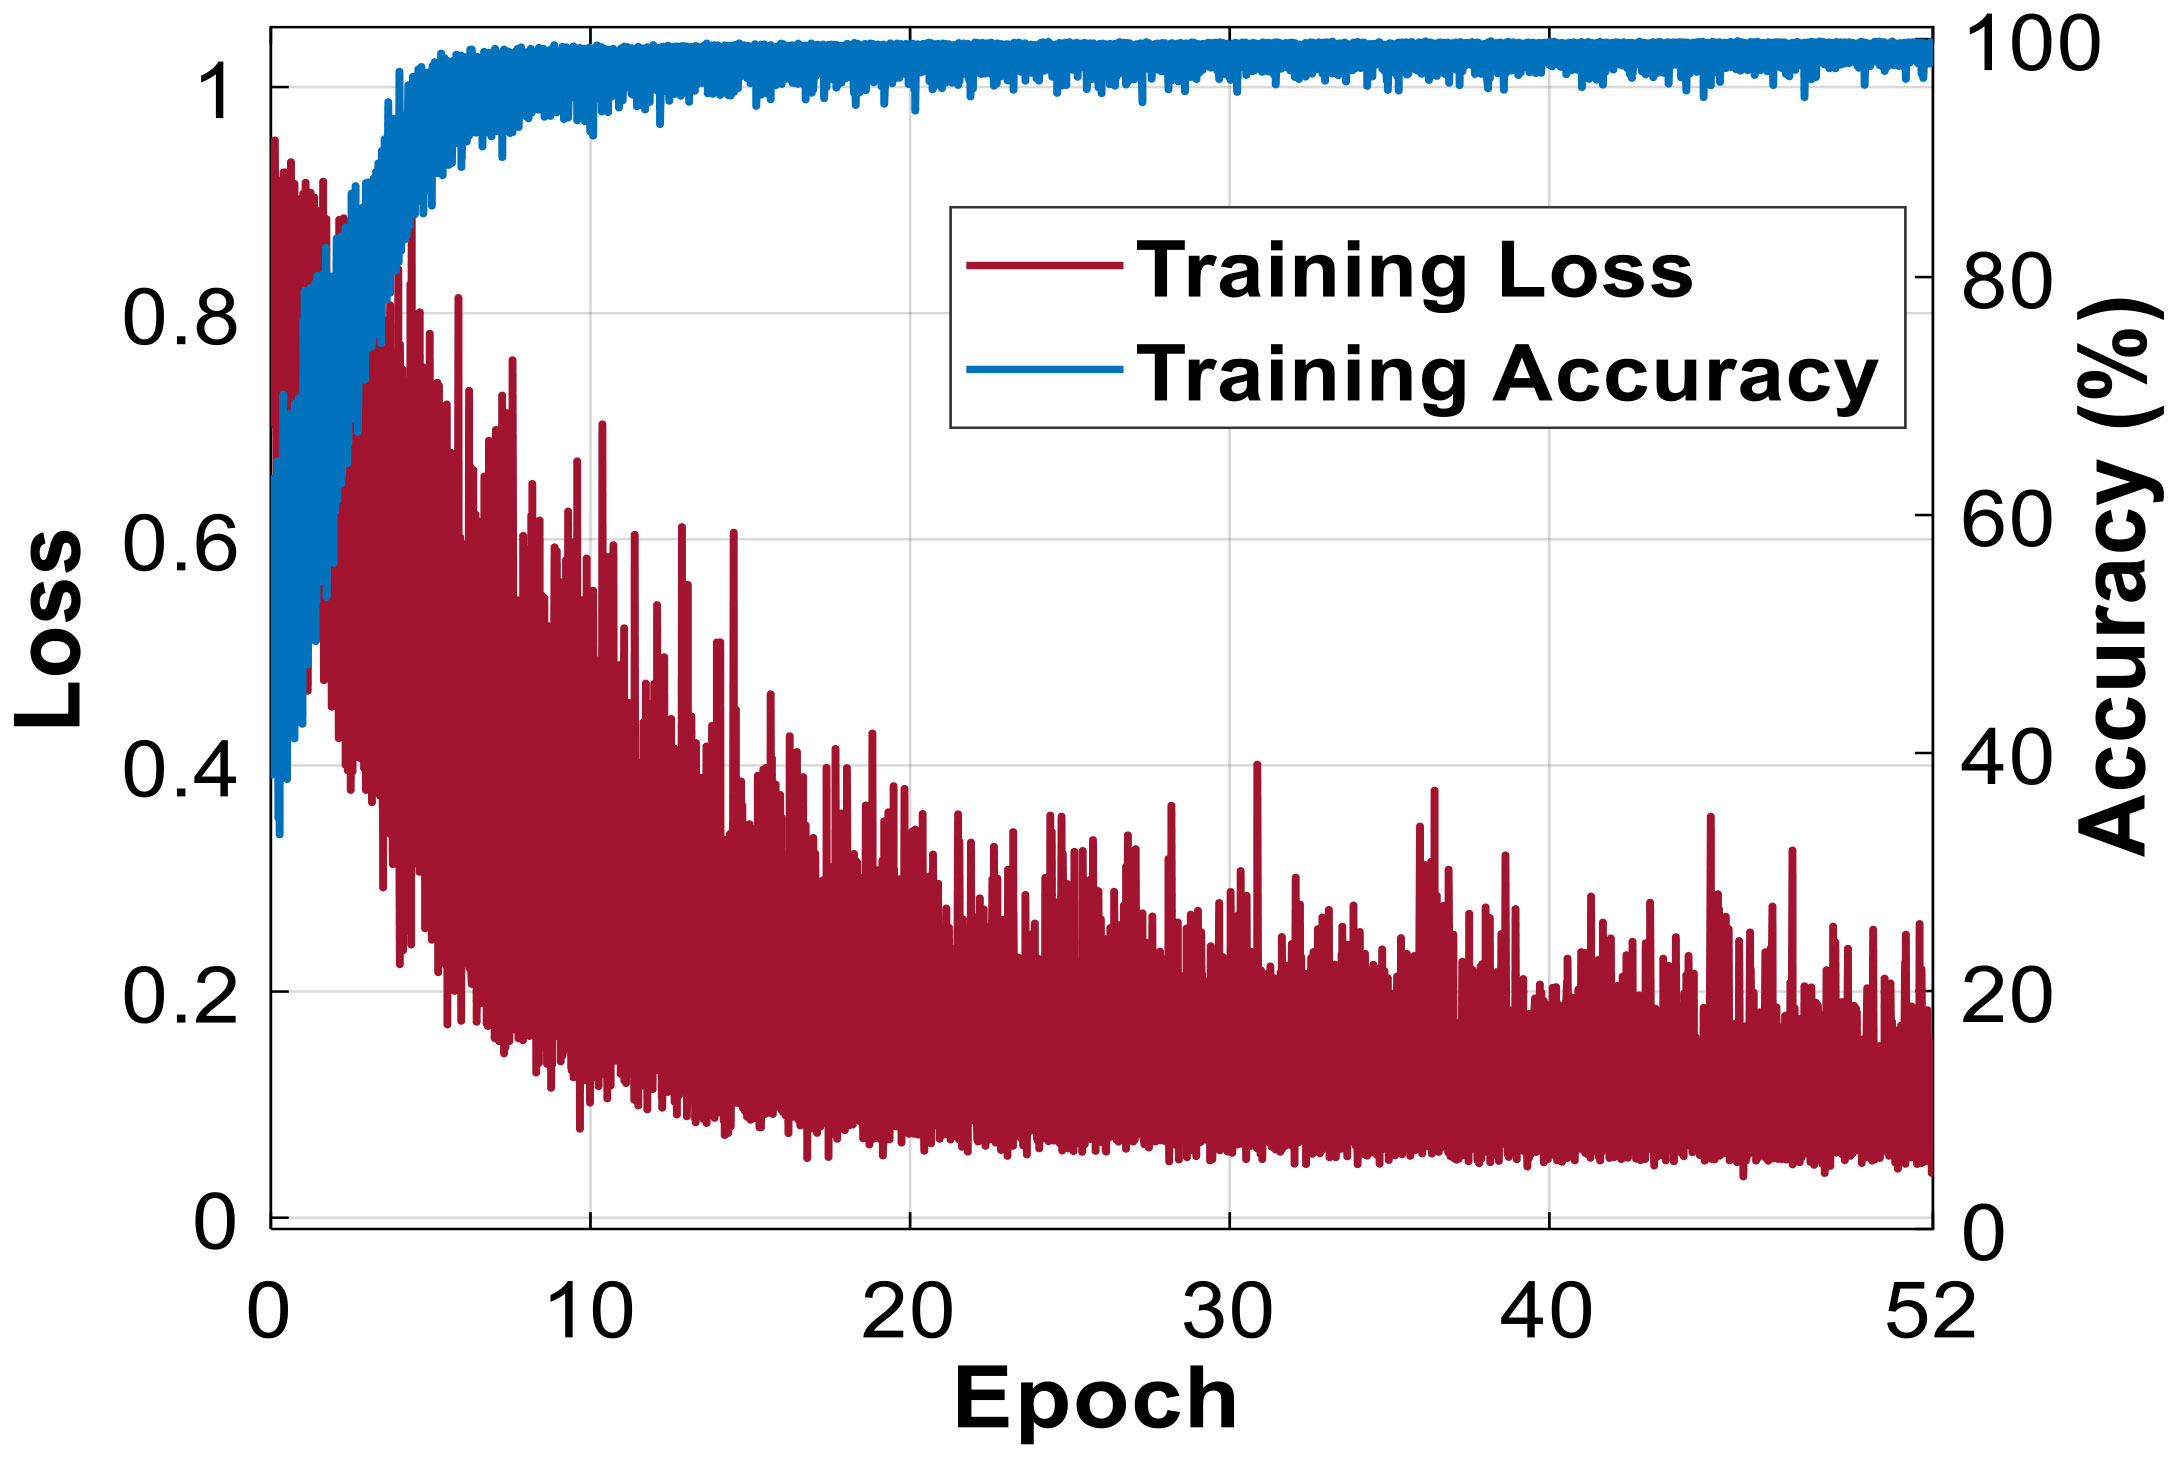
Figure 7 Training accuracy and loss plot.
Underwater imaging has numerous challenging aspects, such as visual limitations, logistic hurdles, and equipment costs; thus, only limited underwater data is available for experimentation. In addition, the annotation of images requires special resources. Augmentation, which transforms data through numerous operations, is widely used to overcome data limitations. To do so, we used different arithmetic and geometric operations including image flipping, translation, cropping, and random rotation for data augmentation. These geometric and arithmetic operations help in producing a wide variety of training images and contribute to effective learning of the network. MATLAB (MATLAB R2020b, accessed on January 25, 2022) functions and commands are used for the above-mentioned image operations. In addition, dice loss (Ld) (Drozdzal et al., 2018) was used in our experiments. Ld is among the top loss functions used in segmentation tasks to guide the network for an effective learning throughout the training process. Ld is widely used in segmentation tasks because it covers the class imbalance problems, improves the segmentation performance, and minimizes the metric during network backpropagation (Drozdzal et al., 2018). Mathematically, Ld is expressed as:
where the ground truth label is represented by ki; ki∈{0,1}, whereas, fi refers to the network’s final output and fi∈{0,1} . In equation (3), constant value in the denominator is included for smoothing (Drozdzal et al., 2018).
4.3 Testing of proposed networks
Both proposed models were tested on two publicly available datasets, DeepFish and SUIM. For evaluation, the trained networks were applied to the testing images. The networks generate a binary prediction mask that was compared with the ground truth image for final results. In both datasets, the ground truth images have binary pixel values. As shown in Figures 5 and 6, desired region (fish) is annotated in white (pixel value = 255), whereas non-fish (the background) is represented in black (pixel value = 0). Moreover, the network generates a binary prediction mask for pixel-wise comparison with the ground truth image. Mean intersection-over-union (mIoU) (Zhang et al., 2022) was used to evaluate the proposed methods. mIoU is widely used and accepted for the evaluation of segmentation tasks. The mathematical expression for mIoU is as follows
True positive (tp ) pixels are those pixels that are correctly predicted as the desired class by the proposed network. The pixels that, according to ground truth, belong to the desired class but the proposed network incorrectly predicts as being of an undesired class, are categorized as false negative (fn) . If, according to the ground truth image, those pixels belonging to an undesired class but marked as being of the desired class are categorized as false positive (fp) .
4.4 Comparison of results between EFS-net and MFAS-net for fish segmentation on the DeepFish dataset (ablation studies)
EFS-Net and MFAS-Net were both evaluated on the DeepFish dataset for fish segmentation. The DeepFish dataset contains several challenging cases, such as small-sized, indiscernible, and multiple adjacent fish. Nonetheless, the proposed architectures exhibited promising performance. Table 2 presents numerical results that confirm the superior performance of MFAS-Net compared to EFS-Net. The IFRT-Block and multi-level feature accumulation enabled MFAS-Net’s better segmentation performance.
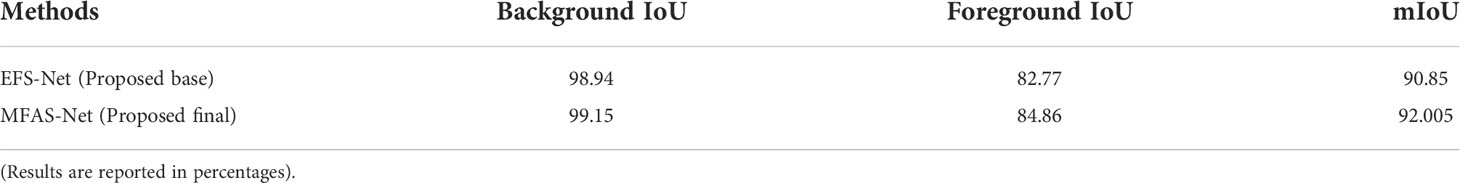
Table 2 Comparison between EFS-Net and MFAS-Net’s numerical results on the DeepFish dataset.
The comparative qualitative segmentation results obtained by EFS-Net and MFAS-Net are shown in Figure 8 (rows 1-4) and show promising segmentation performance by both proposed architectures even in the challenging cases of segmenting small-sized and indiscernible fish. In addition, the visual results confirm the effectiveness of MFAS-Net compared with EFS-Net. MFAS-Net exhibits better performance because of the initial feature refinement and feature accumulation schemes. Segmented fish is detected based on different labels using the further processing of component labeling. In Figure 8 (row 5), the example of segmentation-based fish detection and counting result is shown. Despite the challenging case of small and unclear fish, MFAS-Net detects all the fish, and provides the accurate information of fish position and counting. On the other hand, EFS-Net could not detect small fish because of its blurred structure, and presented an inaccurate information of fish counting. Figure 9 shows that the poor visual segmentation results obtained by EFS-Net and MFAS-Net can be attributed to barely discernible fish having little contrast against the background. Nevertheless, compared to EFS-Net, MFAS-Net still exhibits a better segmentation performance.
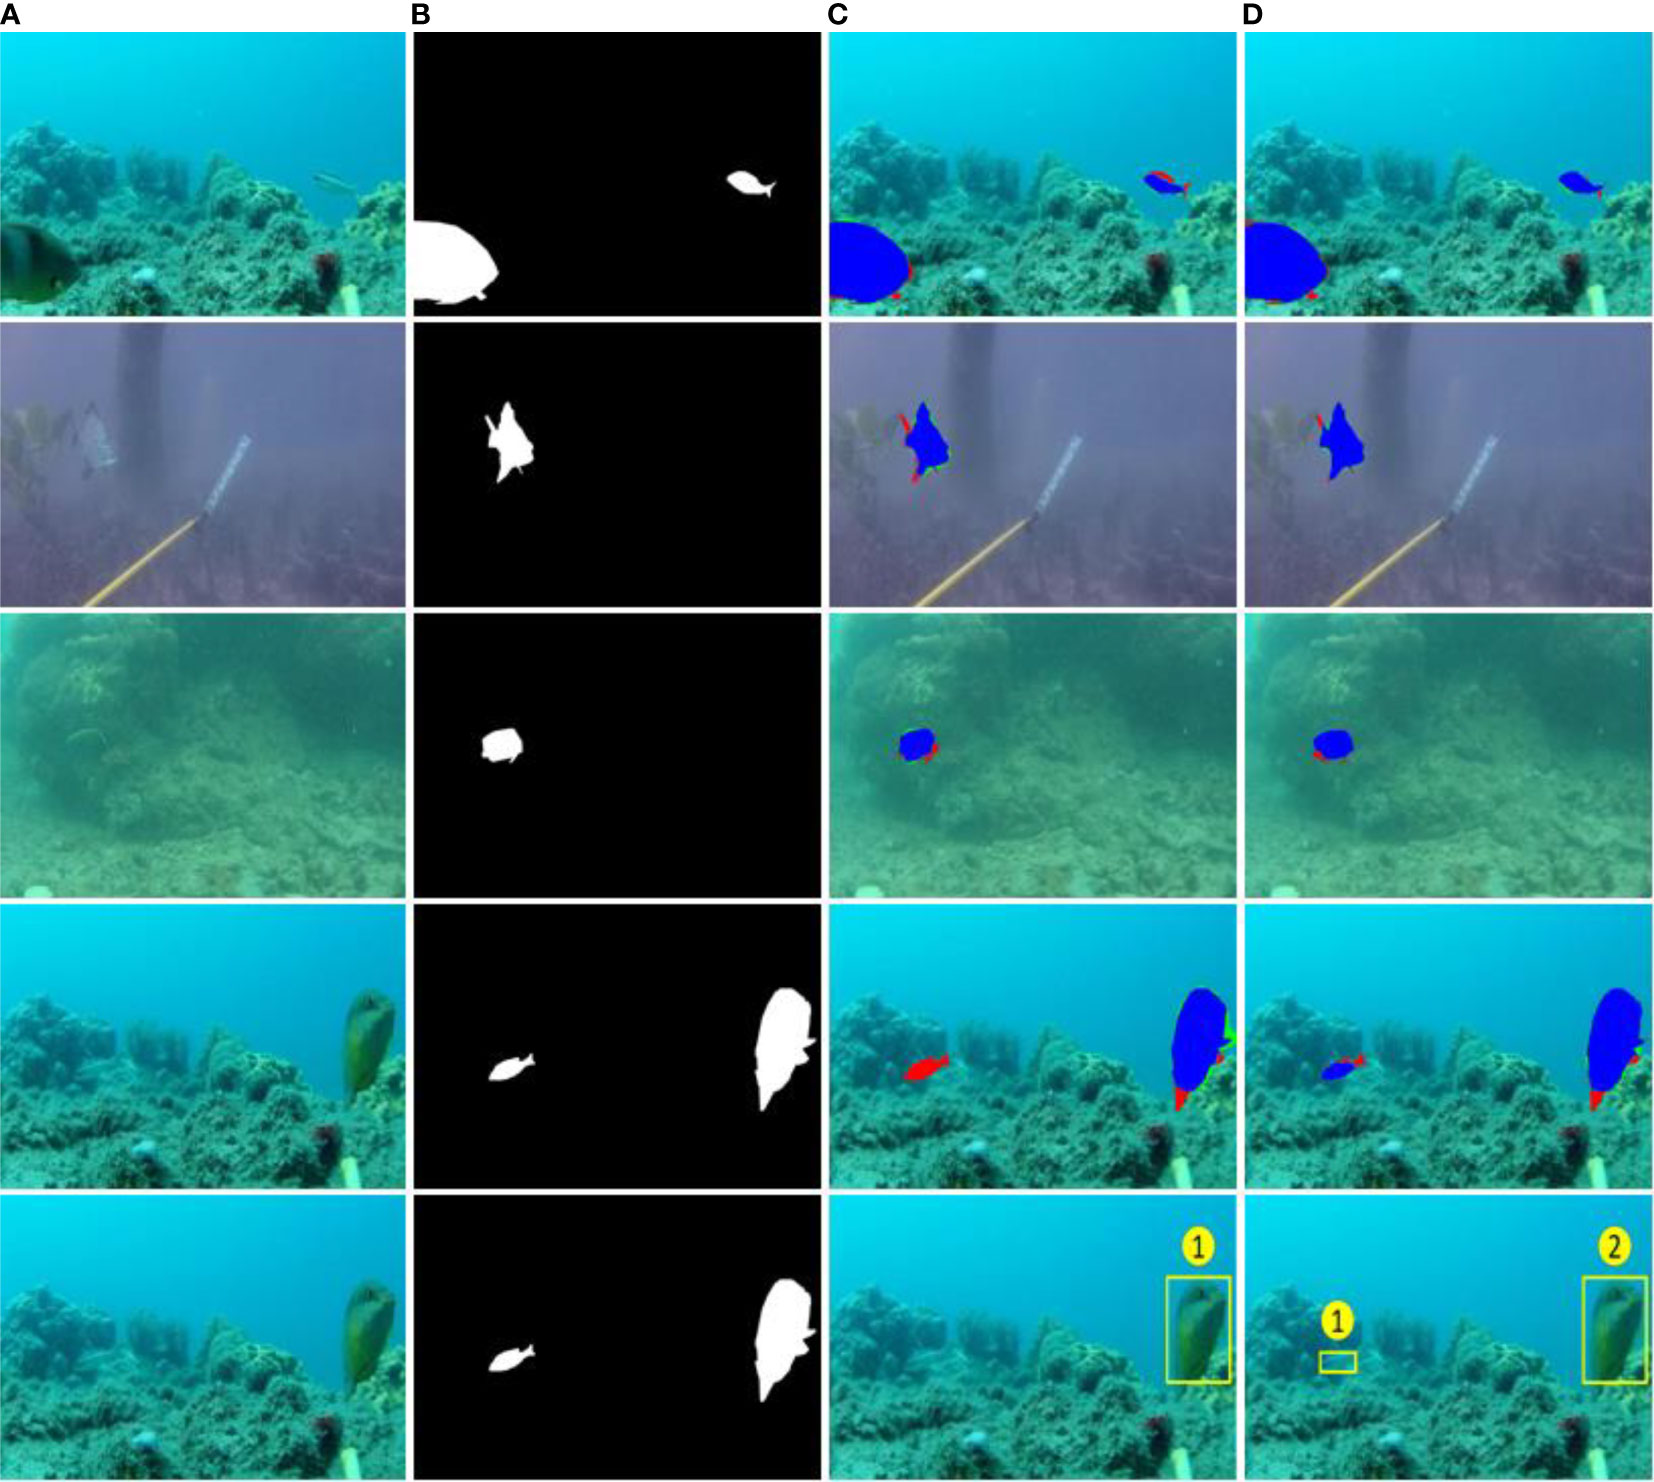
Figure 8 Good qualitative results by EFS-Net and MFAS-Net on the DeepFish dataset. Rows 1-4: Segmentation results; (A) original test image, (B) ground truth image, (C) segmented images achieved by applying EFS-Net, and (D) segmented images achieved by MFAS-Net (the fp and tp pixels are referred by green and blue colors, respectively. Pixel representation for fn is done with red color). Row 5: segmentation-based fish detection and counting.
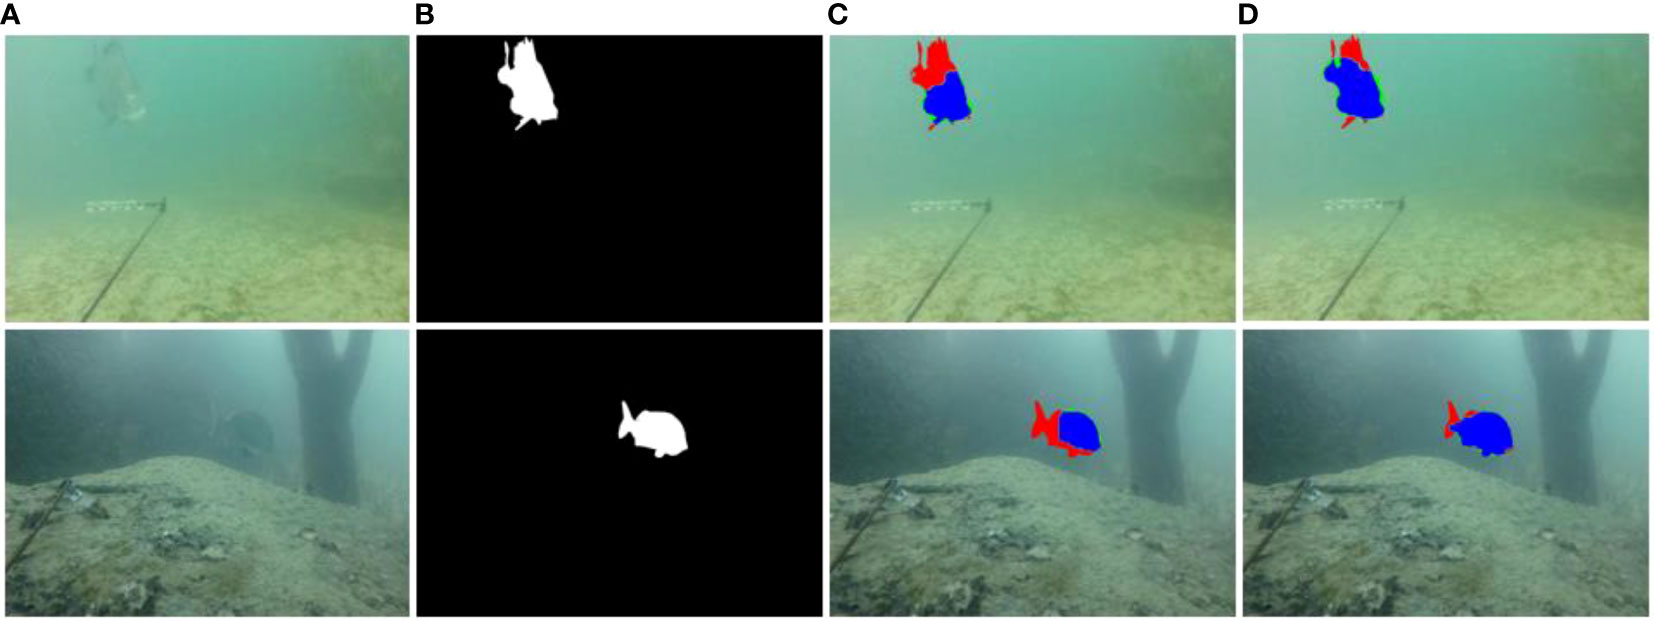
Figure 9 Poor segmentation sample qualitative results by EFS-Net and MFAS-Net on the DeepFish dataset (A) original test image, (B) ground truth image, (C) segmented images achieved by applying EFS-Net, and (D) segmented images achieved by MFAS-Net (the fp and tp pixels are referred by green and blue colors, respectively. Pixel representation for fn is done with red color).
4.5 Comparison of the segmentation results with state-of-the-art methods on the DeepFish dataset
To confirm the effectiveness of the proposed methods, the segmentation performances of both methods were compared with state-of-the-art methods. The state-of-the-art methods were fine-tuned with the two experimental datasets which were also used for the fine-tuning of our method for the fair comparisons. The comparative numerical results presented in Table 3 reveal that EFS-Net achieved a competitive performance, whereas MFAS-Net outperformed the state-of-the-art methods. These results were obtained without any pre-processing or applying biases during training. The results obtained by MFAS-Net validate the effectiveness of MFAS-Net architecture.
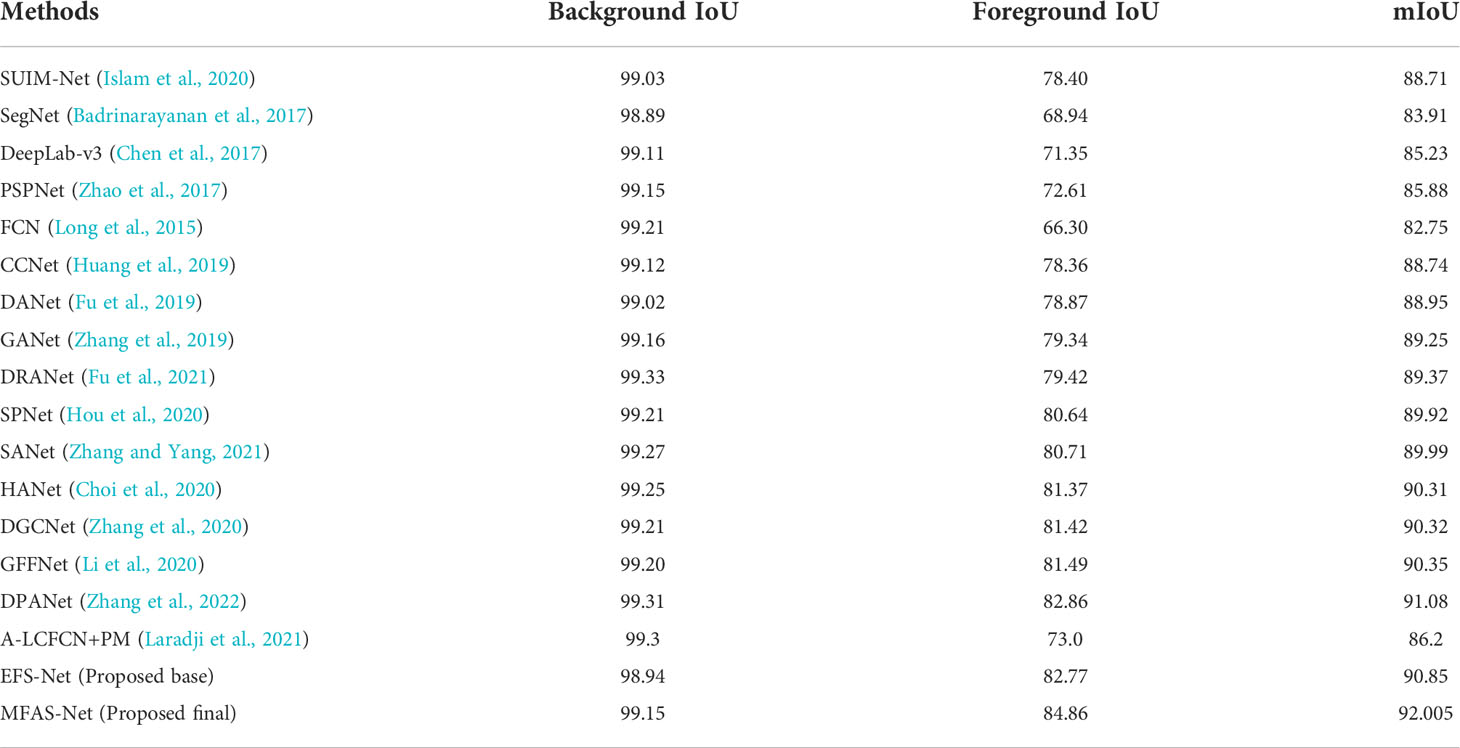
Table 3 Comparative results by the proposed methods with state-of-the-art methods on the DeepFish dataset. (Results are reported in percentages).
4.6 Comparison of results between EFS-net and MFAS-net for fish segmentation on SUIM dataset (ablation studies)
Both proposed networks were further tested on the SUIM dataset to validate the proposed methods’ robustness for these tasks. The SUIM dataset is considerably different from the DeepFish dataset. Compared with the DeepFish dataset, fish in SUIM dataset differ in types, sizes, illumination effects, and backgrounds. However, both networks in general, and MFAS-Net in particular, achieve superior segmentation results. Comparative numerical results using EFS-Net and MFAS-Net presented in Table 4 further confirm better performance by MFAS-Net over EFS-Net. The better performance by MFAS-Net can be attributed to the accumulation of low-level initial features with the deep layers feature that help to improve underwater segmentation performance. In Figure 10 (rows 1-4), good segmentation visual results are presented to compare the segmentation performance of MFAS-Net with EFS-Net on the SUIM dataset. The visual results confirm that MFAS-Net produces better segmentation results than EFS-Net. In an underwater environment, segmentation is challenging because of the visual implications, fish sizes, background effects, and indistinct object boundaries. However, MFAS-Net delivers a good segmentation performance using its effective architecture. Component labeling is applied to detect the fish in segmented images. The sample result for segmentation-based fish detection with the count is shown in Figure 10 (row 5). MFAS-Net accurately detects the challenging small-sized fish, and presents the correct information of fish counting. However, EFS-Net fails to detect the smaller fish positioned at the lower-left side of the image, and presents the false information of fish counting, consequently. Figure 11 exhibits poor segmentation caused by indistinct outlines. Nonetheless, MFAS-Net still delivers better performance than EFS-Net.
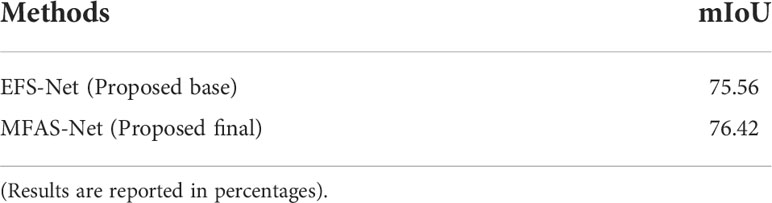
Table 4 Comparison of EFS-Net and MFAS-Net’s numerical results on the SUIM dataset.
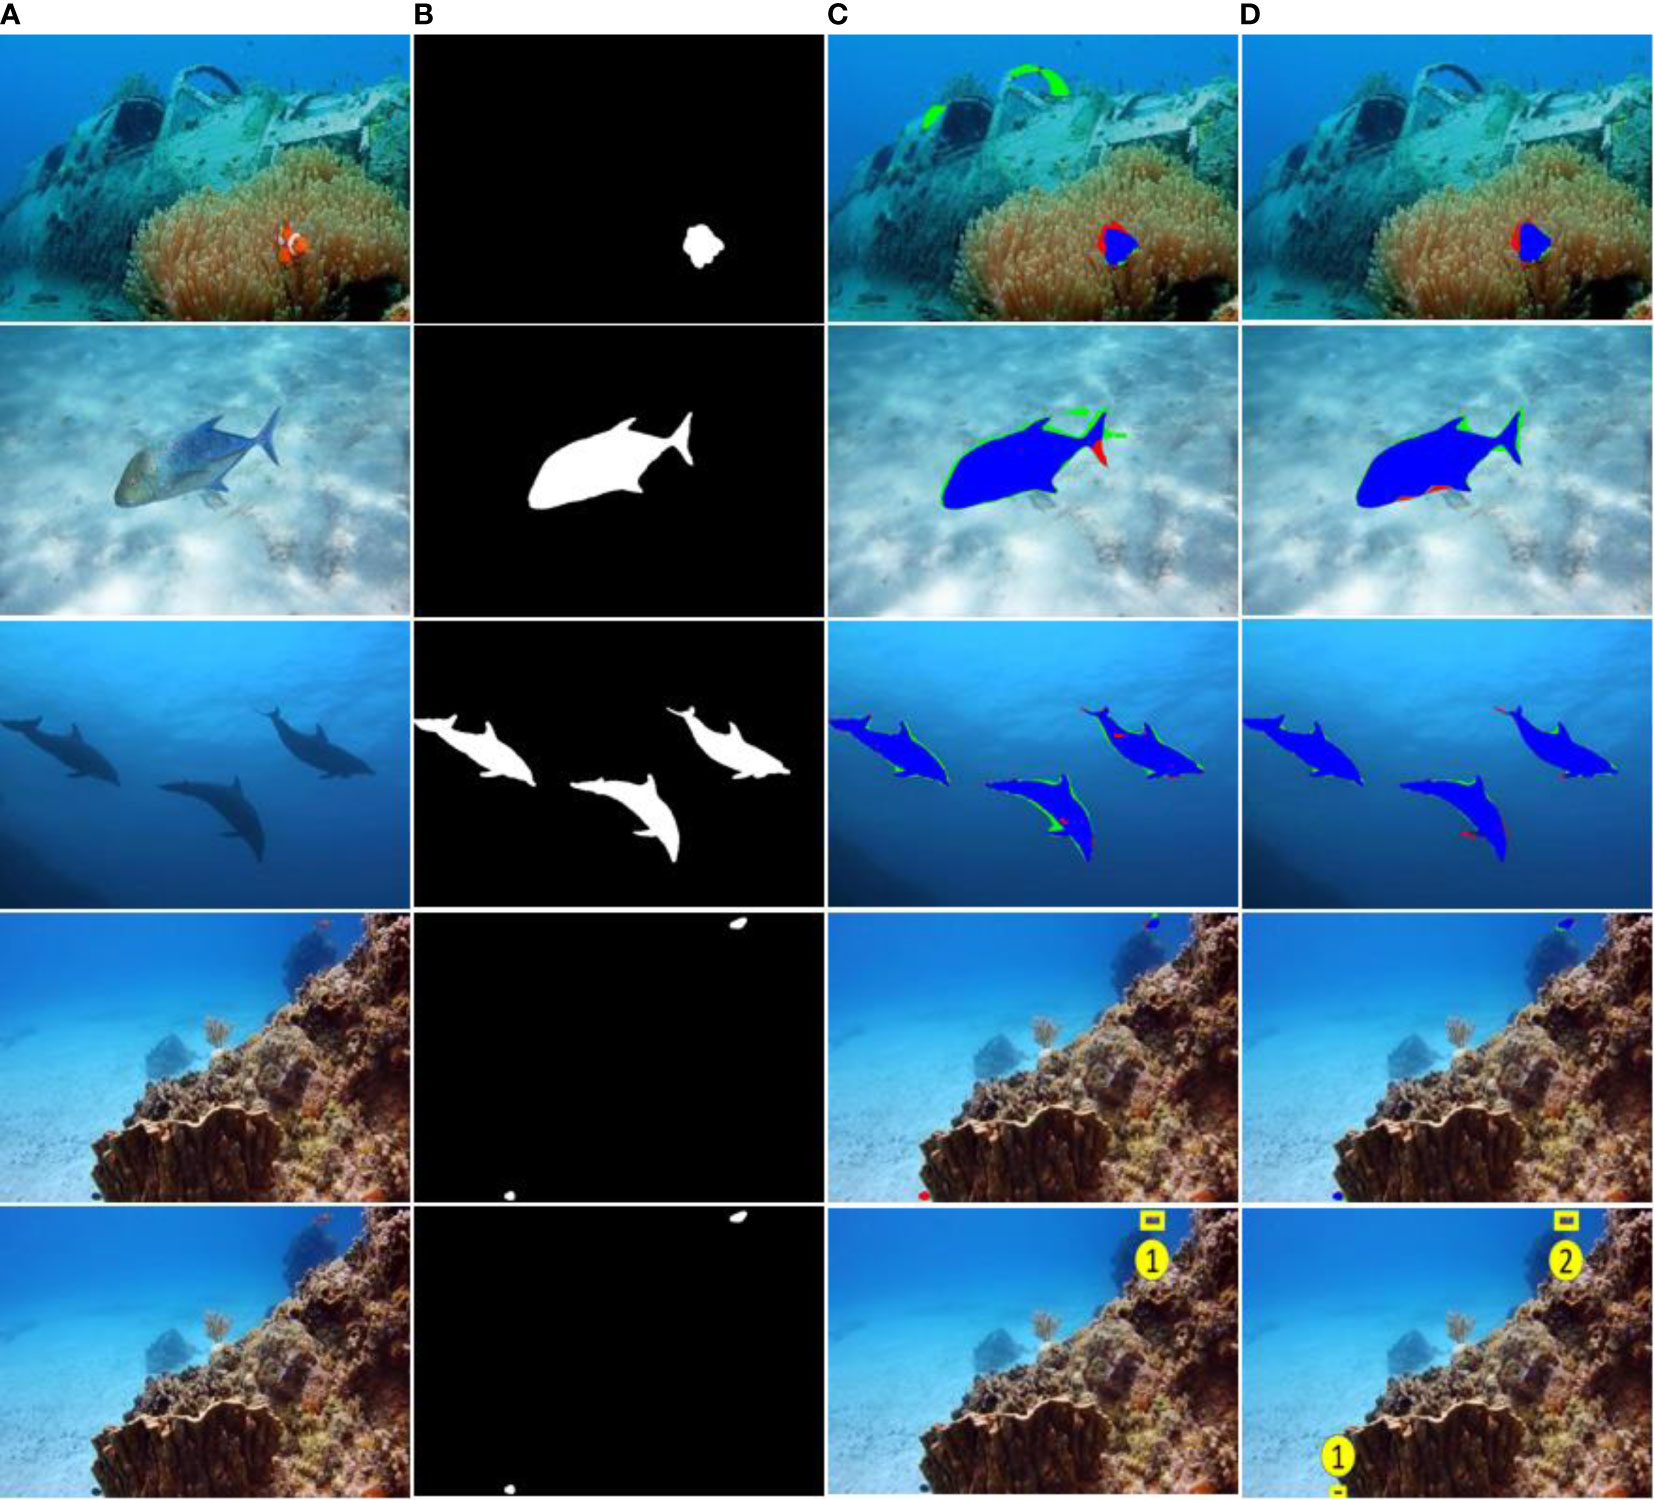
Figure 10 Good qualitative results by EFS-Net and MFAS-Net on the SUIM dataset. Rows 1-4: Segmentation results; (A) original test image, (B) ground truth image, (C) segmented images achieved by applying EFS-Net, and (D) segmented images achieved by MFAS-Net (the fp and tp pixels are referred by green and blue colors, respectively. Pixel representation for fn is done with red color). Row 5: segmentation-based fish detection and counting.
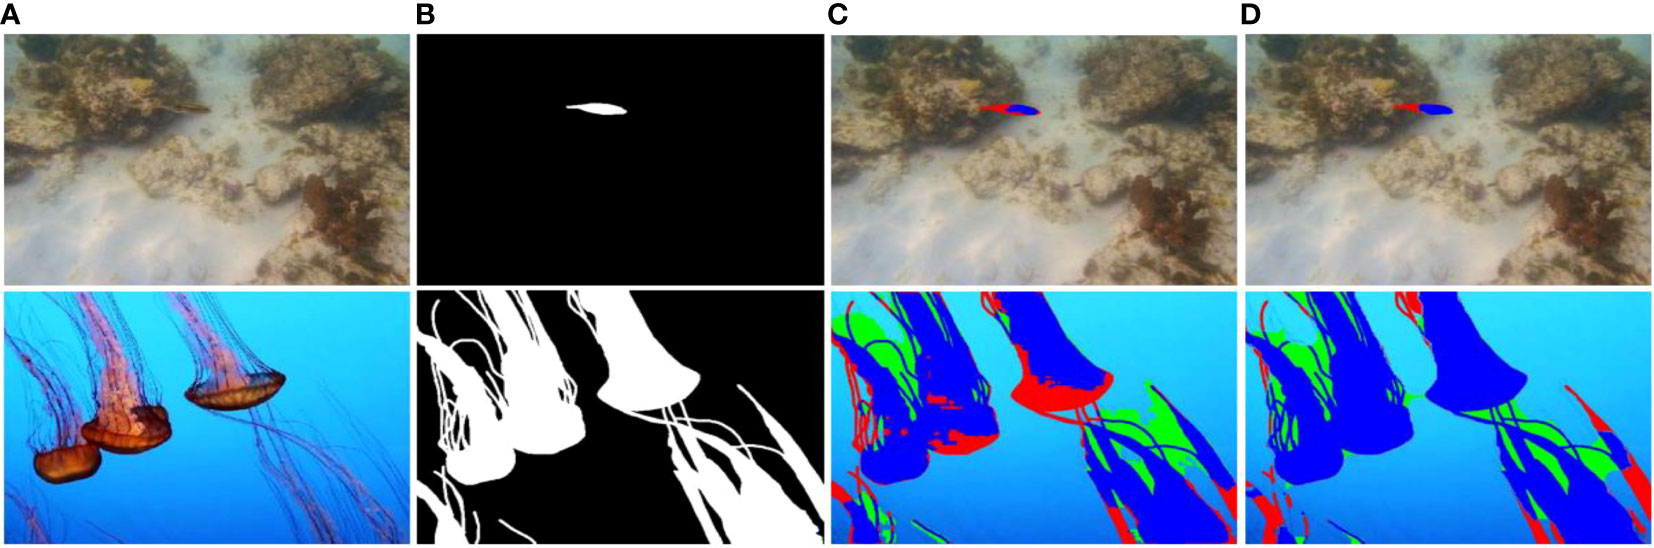
Figure 11 Poor segmentation visual results by EFS-Net and MFAS-Net on the SUIM dataset (A) original test image, (B) ground truth image, (C) segmented images achieved by applying EFS-Net, and (D) segmented images achieved by MFAS-Net (the fp and tp pixels are referred by green and blue colors, respectively. Pixel representation for fn is done with red color).
4.7 Comparison of segmentation results with state-of-the-art methods on SUIM dataset
In Table 5, the proposed methods’ numerical results on the SUIM dataset are compared with those of the state-of-the-art methods. The state-of-the-art methods were fine-tuned with the two experimental datasets which were also used for the fine-tuning of our method for the fair comparisons. The results reveal that both the proposed methods performed better than the other methods. In particular, MFAS-Net achieved the highest mIoU score owing to its effective architecture. Additionally, these results were achieved without pre-processing or excessive computational overheads while requiring only a small number of trainable parameters (details are given in subsection 5.1)
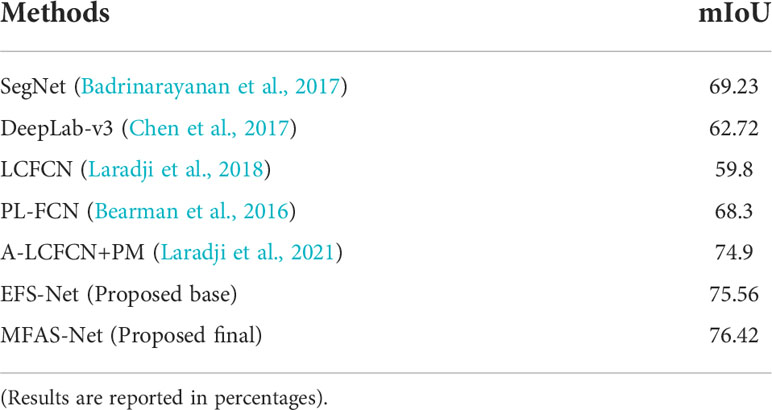
Table 5 Comparison between EFS-Net and MFAS-Net’s numerical results on the SUIM dataset.
5 Discussion
In an underwater environment, effectively segmenting objects is challenging because the image quality is degraded. Most of the underwater images contain obscure objects with indistinct boundaries. This is exacerbated with fish because they are usually moving and sometimes the contrast with the background is too low to distinguish them. In addition, the marine environment has several other animals and objects in the background, which can mislead the neural network. Thus, achieving good segmentation performance in such challenging conditions is difficult. Despite these factors, the proposed networks demonstrated highly accurate segmentation However, as shown in the visual results, occasionally EFS-Net could not detect small-sized fish in murky conditions. Similarly, EFS-Net showed relatively a low performance in the case of fish with indistinct outlines. This is possibly because of the task difficulty, such as unclear objects and indistinct object outlines. Nevertheless, MFAS-Net overcomes these challenges by refining and transferring potential low-level information and finally accumulating the features at different levels of the network.
Proposed method can provide the pixel-wise segmentation result, and after the further processing of component labeling, the results of fish detection and counting can also be achieved. However, proposed method has the limitations for detection with the cases of overlapped fish in ‘crowded’ scenarios.
Our method focuses on the pixel-wise segmentation of fish in an underwater environment. Many latest researches have worked with the pixel-wise segmentation of fish because it can provide the detailed morphological measurements such as fish size and shape. In previous research (Laradji et al., 2021), the size and shape of fish are accounted as the main measure for fish habitat monitoring because this information can be used to assess the fish growth and can also be considered as the reference for feeding. Semantic segmentation offers pixel-wise prediction, therefore it can provide accurate information about the size, area, and shape of fish. However, this information cannot be accurately obtained by detection-based method because it can provide only the roughly detected box area including the object or instance. United nation (UN) Food and Agriculture findings state that 33% of important marine fish stocks are overfished, worldwide (FAO, 2018). Moreover, 11% of total fish are discarded because of undersized catching (Pe´rez Roda et al., 2019). Fish size assessment through segmentation can also help in avoiding the catching of undersized fish (Laradji et al., 2021). Similarly, another study (Zhang et al., 2022) reports that automatic measurement of fish data using semantic segmentation can be very helpful for the sustainable development of marine fisheries. Dataset provider of DeepFish (Saleh et al., 2020) refers that the segmentation labels are helpful to analyze the fish habitat by estimating the fish size and shape.
In short, the segmentation of fish has a significant impact on the morphological assessment of fish, and it can be very useful for fish monitoring and the sustainable development of fisheries. Due to these reasons, many state-of-the-art methods have researched about the pixel-wise semantic segmentation of fish as shown in Tables 3 and 5.
5.1 Comparison of computational efficiency
Computational requirements of the networks are equally important in a framework. Numerous deep learning-based architectures are capable of achieving a competitive result, but they require a large number of trainable parameters that render the framework computationally inefficient. The architecture proposed in this study exhibits outstanding results without compromising computational efficiency. Proposed networks are designed in such a way that it provides a high segmentation performance requiring a small number of trainable parameters for their complete training. In a CNN, Max-Depth is the most computationally expensive part of the network because of the maximum number of channels operating in it. As shown in Figure 3, MFAS-Net uses less number of convolutional layers (only 2) in Max-Depth to reduce the parameters requirement. In addition, as presented in Table 1, MFAS-Net also uses a maximum number of 256 channels to contain the parameters. In Table 6, the required trainable parameters are compared, which, with its low computational overhead, confirm the superior performance of MFAS-Net. Requiring only 3.57 million (M) parameters for complete training, MFAS-Net is the lowest compared with the other methods. Modern research trends encourage robust models that can achieve higher accuracies with lower computational overheads. However, models have different architectural designs, performance limitations, and computational requirements. Proposed methods achieve superior performance without compromising computational efficiency because of their customized efficient network designs.
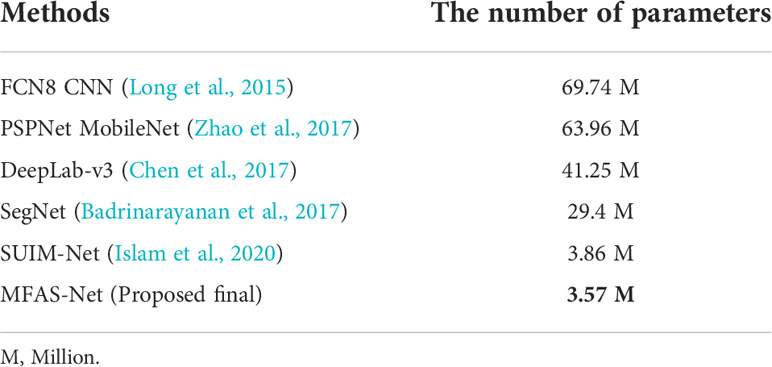
Table 6 Comparison between other methods and MFAS-Net’s trainable parameters requirement.
5.2 Analysis with class activation maps
In supervised learning, CNNs generally learn from training data and evaluation is performed on the unseen testing set. In CNNs, learning is a black box; however, this progressive learning can be visually interpreted using heat activation maps (Selvaraju et al., 2017). During learning, the main features considered by the CNN can be analyzed using activation maps. Figure 12 shows heat activation maps extracted from different stages of the architecture. This visual interpretation confirms that MFAS-Net progressively learns from fish images. Additionally, it confirms that MFAS-Net primarily considers the features of the desired class (fish) without biases.
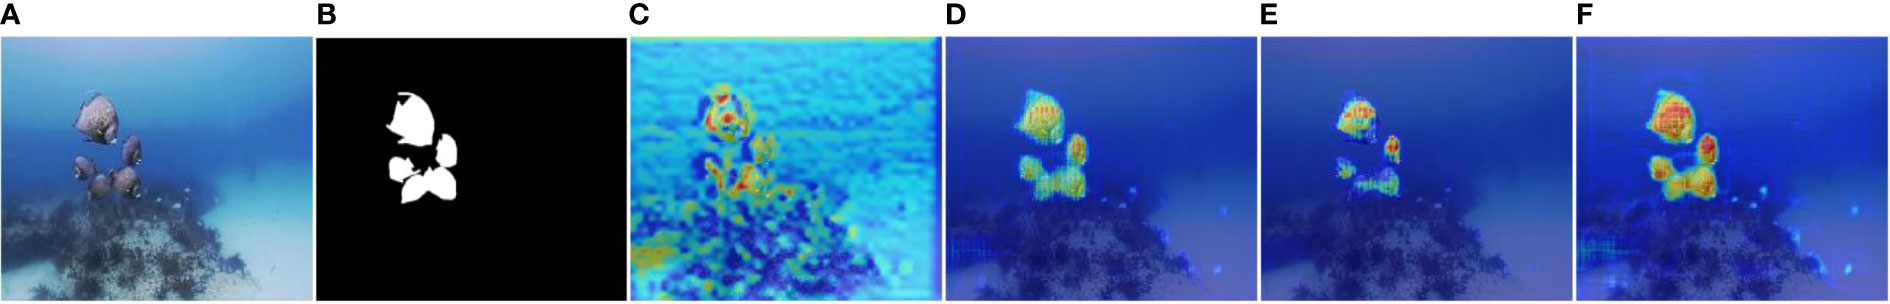
Figure 12 Visual depiction of progressive learning by MFAS-Net using activation maps taken from different stages of the architecture. (A) original image. (B) Ground truth image. Heat activation maps are obtained from the (C) ReLU 2, (D) ReLU 6-SP, (E) ReLU 8, and (F) ReLU 12 layers of the MFAS-Net, as given in Table 1.
6 Conclusion
Fish are vital to the maintenance of sustainable marine environments. Therefore, fish monitoring and assessment are essential for managing resources in the marine ecosystem. Conventionally, the manual methods employed for fish observation and assessment are time-consuming, labor-intensive, and error-prone. To meet this need, two novel architectures were developed for high-performance fish segmentation. In an underwater environment, achieving high segmentation accuracy is challenging because of the visual limitations underwater. However, both proposed methods exhibited promising results with superior computational efficiency. EFS-Net is a shallow architecture with a series of convolution layers at the early stage of the network for optimal low-level feature extraction. MFAS-Net is the final network and refines valuable initial features and transfers them to the deep stage of the network for feature accumulation. As shown in the ablation study, feature refinement and accumulation enable MFAS-Net to perform better segmentation even for the challenging barely discernible small-sized fish with indistinct outlines. Furthermore, multi-level feature accumulation improves the overall learning of the network and produces enhanced segmentation performance. Both proposed networks, EFS-Net and MFAS-Net, were evaluated on two publicly available databases. The proposed methods outperformed state-of-the-art methods with a small number of required trainable parameters (3.57 million). The fish detection and counting based on segmentation and further processing of component labeling cannot adequately work when there are overlapped instances. This is a limit of the proposed method, i.e., it is not able to detect instances in ‘crowded’ scenarios. In future work, we would research the method to detect instances in ‘crowded’ scenarios. In addition, we would optimize the networks further, and perform the instance segmentation for fish detection.
Data availability statement
Publicly available datasets were analyzed in this study. This data can be found here: https://alzayats.github.io/DeepFish/ https://irvlab.cs.umn.edu/resources/suim-dataset.
Ethics statement
Ethical review and approval was not required for the animal study because in this research, we used two open databases of DeepFish and SUIM which can be freely used for academic purpose. Therefore, ethical review and approval was not required for this study.
Author contributions
AH designed the method with experiments and wrote the first draft of the manuscript supervised by KRP. MA, JC, and HS performed the data collection and verified the experimental results. KRP critically reviewed the initial manuscript and provided helpful input. All authors contributed to the article and approved the submitted version.
Funding
This research was supported in part by the National Research Foundation of Korea (NRF) funded by the Ministry of Science and ICT (MSIT) through the Basic Science Research Program (NRF-2021R1F1A1045587), in part by the NRF funded by the MSIT through the Basic Science Research Program (NRF-2022R1F1A1064291), and in part by the MSIT, Korea, under the ITRC (Information Technology Research Center) support program (IITP-2022-2020-0-01789) supervised by the IITP (Institute for Information & Communications Technology Planning & Evaluation).
Conflict of interest
The authors declare that the research was conducted in the absence of any commercial or financial relationships that could be construed as a potential conflict of interest.
Publisher’s note
All claims expressed in this article are solely those of the authors and do not necessarily represent those of their affiliated organizations, or those of the publisher, the editors and the reviewers. Any product that may be evaluated in this article, or claim that may be made by its manufacturer, is not guaranteed or endorsed by the publisher.
Footnotes
References
Abdeldaim A. M., Sahlol A. T., Elhoseny M., Hassanien A. E. (2018)Computer-aided acute lymphoblastic leukemia diagnosis system based on image analysis. In: Advances in soft computing and machine learning in image processing studies in computational intelligence (Accessed 28 March 2022).
Abe S., Takagi T., Torisawa S., Abe K., Habe H., Iguchi N., et al. (2021). Development of fish spatio-temporal identifying technology using segnet in aquaculture net cages. Aquac. Eng. 93, 102146. doi: 10.1016/j.aquaeng.2021.102146
Arsalan M., Haider A., Choi J., Park K. R. (2022a). Detecting blastocyst components by artificial intelligence for human embryological analysis to improve success rate of in vitro fertilization. J. Pers. Med. 12, 124. doi: 10.3390/jpm12020124
Arsalan M., Haider A., Choi J., Park K. R. (2022b). Diabetic and hypertensive retinopathy screening in fundus images using artificially intelligent shallow architectures. J. Pers. Med. 12, 7. doi: 10.3390/jpm12010007
Arsalan M., Haider A., Koo J. H., Park K. R. (2022c). Segmenting retinal vessels using a shallow segmentation network to aid ophthalmic analysis. Mathematics 10, 1536. doi: 10.3390/math10091536
Arsalan M., Haider A., Won Lee Y., Ryoung Park K. (2022d). Detecting retinal vasculature as a key biomarker for deep learning-based intelligent screening and analysis of diabetic and hypertensive retinopathy. Expert Syst. Appl. 200, 117009. doi: 10.1016/j.eswa.2022.117009
Badrinarayanan V., Kendall A., Cipolla R. (2017). SegNet: A deep convolutional encoder-decoder architecture for image segmentation. IEEE Trans. Pattern Anal. Mach. Intell. 39, 2481–2495. doi: 10.1109/TPAMI.2016.2644615
Bearman A., Russakovsky O., Ferrari V., Fei-Fei L. (2016). “What’s the point: Semantic segmentation with point supervision,” in Proceedings of the European conference on computer visio (Amsterdam, Netherlands: Springer), 549–565.
Chen L.-C., Papandreou G., Schroff F., Adam H. (2017). Rethinking atrous convolution for semantic image segmentation. arXiv. 1–14. doi: 10.48550/arXiv.1706.05587
Choi S., Kim J. T., Choo J. (2020). “Cars can’t fly up in the sky: Improving urban-scene segmentation via height-driven attention networks,” in Proceedings of the Computer Vision and Pattern Recognition, Seattle, Online, USA, 2020 June 16-18. (New York, U.S: IEEE) 9373–9383.
Cui Y., Chen R., Chu W., Chen L., Tian D., Li Y., et al. (2022). Deep learning for image and point cloud fusion in autonomous driving: A review. IEEE Trans. Intell. Transp. Syst. 23, 722–739. doi: 10.1109/TITS.2020.3023541
Ditria E. M., Lopez-Marcano S., Sievers M., Jinks E. L., Brown C. J., Connolly R. M. (2020). Automating the analysis of fish abundance using object detection: Optimizing animal ecology with deep learning. Front. Mar. Sci. 7. doi: 10.3389/fmars.2020.00429
Drozdzal M., Chartrand G., Vorontsov E., Shakeri M., Di Jorio L., Tang A., et al. (2018). Learning normalized inputs for iterative estimation in medical image segmentation. Med. Image Anal. 44, 1–13. doi: 10.1016/j.media.2017.11.005
FAO (2018). The state of world fisheries and aquaculture. meeting the sustainable development goals (Rome, Italy: Food and Agriculture Organization of the United Nations). Available at: http://www.fao.org/3/i9540en/I9540EN.pdf.
Fu J., Liu J., Jiang J., Li Y., Bao Y., Lu H. (2021). Scene segmentation with dual relation-aware attention network. IEEE Trans. Neural Netw. Learn. Syst. 32, 2547–2560. doi: 10.1109/TNNLS.2020.3006524
Fu J., Liu J., Tian H., Li Y., Bao Y., Fang Z., et al. (2019). “Dual attention network for scene segmentation. in 3146–3154,” in Proceedings of the Computer Vision and Pattern Recognition, California, USA. (New York, U.S: IEEE) 2019 June 17-20. 3146–3154.
Haider A., Arsalan M., Lee M. B., Owais M., Mahmood T., Sultan H., et al. (2022a). Artificial intelligence-based computer-aided diagnosis of glaucoma using retinal fundus images. Expert Syst. Appl. 207, 117968. doi: 10.1016/j.eswa.2022.117968
Haider A., Arsalan M., Lee Y. W., Park K. R. (2022b). Deep features aggregation-based joint segmentation of cytoplasm and nuclei in white blood cells. IEEE J. Biomed. Health Inform., 26 1–1. doi: 10.1109/JBHI.2022.3178765
Hosseinzadeh Kassani S., Hosseinzadeh Kassani P., Wesolowski M. J., Schneider K. A., Deters R. (2022). Deep transfer learning based model for colorectal cancer histopathology segmentation: A comparative study of deep pre-trained models. Int. J. Med. Inf. 159, 104669. doi: 10.1016/j.ijmedinf.2021.104669
Hou Q., Zhang L., Cheng M.-M., Feng J. (2020). “Strip pooling: Rethinking spatial pooling for scene parsing,” in Proceedings of the Computer Vision and Pattern Recognition, Seattle, Online, USA. (New York, U.S: IEEE) 2020 June 16-18. 4003–4012.
Huang Z., Wang X., Huang L., Huang C., Wei Y., Liu W. (2019). “CCNet: Criss-cross attention for semantic segmentation,” in Proceedings of the International Conference on Computer Vision, Seoul, Korea. (New York, U.S: IEEE) 2019 Oct-27 to Nov-2. 603–612.
Islam M. J., Edge C., Xiao Y., Luo P., Mehtaz M., Morse C., et al. (2020). “Semantic segmentation of underwater imagery: Dataset and benchmark,” in Proceeding of the IEEE International Conference on Intelligent Robots and Systems, Las Vegas, NV, USA. (New York, U.S: IEEE) 2020 Oct-24 to Jan-24. 1769–1776.
Kandimalla V., Richard M., Smith F., Quirion J., Torgo L., Whidden C. (2022). Automated detection, classification and counting of fish in fish passages with deep learning. Front. Mar. Sci. 8. doi: 10.3389/fmars.2021.823173
Kingma D. P., Ba J. (2014). Adam: A method for stochastic optimization. arXiv. 1–15. doi: 10.48550/arXiv.1412.6980
Kreso I., Segvic S., Krapac J. (2017). “Ladder-style DenseNets for semantic segmentation of Large natural images,” in Proceedings of the International Conference on Computer Vision, Venice, Italy. (New York, U.S: IEEE) 2017 October 22-29. 238–245.
Labao A. B., Naval P. C. (2017). “Weakly-labelled semantic segmentation of fish objects in underwater videos using a deep residual network,” in Proceedings of the Asian Conference on Intelligent Information and Database Systems, Kanazawa, Japan: Springer. (New York, U.S: IEEE) 2017 April 3-5. 255–265.
Laradji I. H., Rostamzadeh N., Pinheiro P. O., Vazquez D., Schmidt M. (2018). “Where are the blobs: Counting by localization with point supervision,” in Proceedings of the European Conference on Computer Vision, München, Germany. (New York, U.S: IEEE) 2018 September 10-13. 547–562.
Laradji I., Saleh A., Rodriguez P., Nowrouzezahrai D., Azghadi M. R., Vazquez D. (2020). Affinity LCFCN: Learning to segment fish with weak supervision. arXiv 1–10, doi: 10.48550/arXiv.2011.03149
Laradji I. H., Saleh A., Rodriguez P., Nowrouzezahrai D., Azghadi M. R., Vazquez D. (2021). Weakly supervised underwater fish segmentation using affinity LCFCN. Sci. Rep. 11, 17379. doi: 10.1038/s41598-021-96610-2
Liu F., Fang M. (2020). Semantic segmentation of underwater images based on improved deeplab. J. Mar. Sci. Eng. 8, 188. doi: 10.3390/jmse8030188
Li X., Zhao H., Han L., Tong Y., Tan S., Yang K. (2020). “Gated fully fusion for semantic segmentation,” in Proceedings of the AAAI Conference on Artificial Intelligence, New York, USA, (New York, U.S: IEEE) 2020 February 7-12. 11418–11425.
Long J., Shelhamer E., Darrell T. (2015). “Fully convolutional networks for semantic segmentation,” in Proceedings of the Computer Vision and Pattern Recognition, Boston, USA, (New York, U.S: IEEE) 2015 June 7-12. 3431–3440.
Mahmood T., Cho S. W., Park K. R. (2022a). DSRD-net: Dual-stream residual dense network for semantic segmentation of instruments in robot-assisted surgery. Expert Syst. Appl. 202, 117420. doi: 10.1016/j.eswa.2022.117420
Mahmood T., Kim S. G., Koo J. H., Park K. R. (2022b). Artificial intelligence-based tissue phenotyping in colorectal cancer histopathology using visual and semantic features aggregation. Mathematics 10, 1909. doi: 10.3390/math10111909
Owais M., Baek N. R., Park K. R. (2021). Domain-adaptive artificial intelligence-based model for personalized diagnosis of trivial lesions related to COVID-19 in chest computed tomography scans. J. Pers. Med. 11, 1008. doi: 10.3390/jpm11101008
Pe´rez Roda M. A., Gilman E., Huntington T., Kennelly S. J., Suuronen P., Chaloupka M., et al. (2019). A third assessment of global marine fisheries discards (Rome: FAO), 1–58.
Rahnemoonfar M., Dobbs D. (2019). “Semantic segmentation of underwater sonar imagery with deep learning,” in Proceedings of the IEEE International Geoscience and Remote Sensing Symposium, Yokohama, Japan. (New York, U.S: IEEE) 2019 July-28 to Aug-2. 9455–9458.
Saleh A., Laradji I. H., Konovalov D. A., Bradley M., Vazquez D., Sheaves M. (2020). A realistic fish-habitat dataset to evaluate algorithms for underwater visual analysis. Sci. Rep. 10, 14671. doi: 10.1038/s41598-020-71639-x
Selvaraju R. R., Cogswell M., Das A., Vedantam R., Parikh D., Batra D. (2017). “Grad-CAM: Visual explanations from deep networks via gradient-based localization,” in Proceedings of the International Conference on Computer Vision, Venice, Italy, 2017 October 22-29. (New York, U.S: IEEE) 618–626.
Sultan H., Owais M., Park C., Mahmood T., Haider A., Park K. R. (2021). Artificial intelligence-based recognition of different types of shoulder implants in X-ray scans based on dense residual ensemble-network for personalized medicine. J. Pers. Med. 11, 482. doi: 10.3390/jpm11060482
Zhang L., Li X., Arnab A., Yang K., Tong Y., Torr P. H. S. (2020). Dual graph convolutional network for semantic segmentation. arXiv. New York, U.S: IEEE. doi: 10.48550/arXiv.1909.06121
Zhang P., Liu W., Wang H., Lei Y., Lu H. (2019). Deep gated attention networks for Large-scale Street-level scene segmentation. Pattern Recognit. 88, 702–714. doi: 10.1016/j.patcog.2018.12.021
Zhang W., Wu C., Bao Z. (2022). DPANet: Dual pooling-aggregated attention network for fish segmentation. IET Comput. Vis. 16, 67–82:1–18. doi: 10.1049/cvi2.12065
Zhang Q.-L., Yang Y.-B. (2021). “SA-Net: Shuffle attention for deep convolutional neural networks,” in IEEE International Conference on Acoustics, Speech and Signal Processing, Toronto, Canada. Japan, 2021 June 6-11. New York, U.S: IEEE 2235–2239.
Keywords: artificial intelligence, marine environment, underwater computer vision, fish segmentation, EFS-net and MFAS-net
Citation: Haider A, Arsalan M, Choi J, Sultan H and Park KR (2022) Robust segmentation of underwater fish based on multi-level feature accumulation. Front. Mar. Sci. 9:1010565. doi: 10.3389/fmars.2022.1010565
Received: 03 August 2022; Accepted: 20 September 2022;
Published: 06 October 2022.
Edited by:
Hong Song, Zhejiang University, ChinaReviewed by:
Nitin Agarwala, National Maritime Foundation, IndiaJamil Hussain, Kyung Hee University, South Korea
Copyright © 2022 Haider, Arsalan, Choi, Sultan and Park. This is an open-access article distributed under the terms of the Creative Commons Attribution License (CC BY). The use, distribution or reproduction in other forums is permitted, provided the original author(s) and the copyright owner(s) are credited and that the original publication in this journal is cited, in accordance with accepted academic practice. No use, distribution or reproduction is permitted which does not comply with these terms.
*Correspondence: Kang Ryoung Park, cGFya2dyQGRvbmdndWsuZWR1