 Oscar E. Romero
 Simon Ramondenc
- 1MARUM – Center for Marine Environmental Sciences, University of Bremen, Bremen, Germany
- 2Helmholtz Centre for Polar and Marine Research, Alfred Wegener Institute, Bremerhaven, Germany
Understanding seasonal and multiyear variability of primary producers’ populations in the Mauritanian coastal upwelling system along the northwestern African margin may help to predict future impact of climate change (e.g., nutrient availability, productivity, and phyto- and zooplankton dynamics). For this, continuous, long time-series are required. A major challenge in obtaining these time-series is the logistics associated with the uninterrupted, in-situ sampling over several years. Sediment traps represent a reliable alternative. In this study, we assess the variations of the diatom community in samples almost continuously collected between June 2003 and March 2020 with 17 sediment traps deployed at site CBeu (=Cape Blanc eutrophic), located at c. 20°N-18°45’W, offshore Mauritania in the Canary Current Eastern Boundary Upwelling Ecosystems (CC-EBUE). In addition to describing the multiyear dynamics of the total diatom flux and major shifts in the species-specific composition of the populations, our study addresses questions such as (i) how constant is the intrannual pattern of populations’ occurrence, (ii) what the amplitude of annual changes is, and (iii) how populations’ shifts relate to physical setting dynamics. Matching the occurrence of most intense seasonal upwelling, highest diatom flux maxima mainly occur in spring and summer between 2003 and 2020. The diverse diatom community (e.g., benthic, coastal upwelling, coastal planktonic, and open-ocean diatoms) closely follows the annual cycle of atmospheric and hydrologic conditions. Benthic diatoms dominate during spring and summer (e.g., upwelling season), while open-ocean diatoms contribute the most in fall and winter when the upper water column stratifies. As no persistent –either decreasing or increasing trend of diatom productivity over the 17 sampled years, our results are at odds with Bakun’s hypothesis of upwelling intensification. Anchoring temporal changes of diatoms in a wider environmental frame allows for insights into the complex dynamics of the Mauritanian upwelling ecosystem and the populations’ response to climate forcing. This helps in establishing the scientific basis for modeling future states of the CC-EBUE and/or comparable environments.
1 Introduction
The highly productive Mauritanian upwelling along the northwestern Africa margin is an essential component of the Canary Current Eastern Boundary Upwelling Ecosystem (CC-EBUE; Cropper et al., 2014). The strong winds and the input of wind-carried dust particles and nutrients from the Sahara and the Sahel (Romero et al., 1999b; Romero et al., 2003; Fischer et al., 2016; Friese et al., 2017; Fischer et al., 2019), the wide shelf and the intense coastal upwelling (Hagen, 2001; Cropper et al., 2014), and the vigorous offshore Ekman transport strongly impact the primary production dynamics in Mauritanian surface waters (Mittelstaedt, 1983; Chavez and Messié, 2009; Marcello et al., 2011; Cropper et al., 2014). Primary productivity in the CC-EBUE supports a vast biomass of marine consumers, including some of the world’s most productive fisheries (Cooley et al., 2022). Among the diverse phyto- and zooplankton communities off Mauritania (Romero et al., 2020), marine diatoms –unicellular algae with opaline (SiO2*nH2O) cell walls (Round et al., 1990)– deliver a large part of the primary production.
The traditional approach on the characterization of the annual cycle of populations (e.g., the cycle through the four seasons) assumes that (i) most of physical variables impacting the populations’ dynamics are perfectly periodic and that (ii) non-linearities or internal modes of variability exist (Pezzulli et al., 2005). This pattern can be easily altered without any significant shift in boundary conditions. Non-linear mechanisms, such as lateral advection via nepheloid layers, can generate transition phenomena (Dijkstra, 2013) that alter the annual cycle of populations’ occurrence. Abrupt deviations from the annual baseline inform on the magnitude of impact of extraordinary events (e.g., exceptional coolings/warmings, strengthenings/weakenings of upwelling intensity, occurrence of El Niño/Southern Oscillation), while stepwise changes may suggest the progressive reorganization of large-scale atmospheric and/or oceanic circulation in response to low-frequency climate modes (e.g., North Atlantic Oscillation and El Niño/Southern Oscillation, Fischer et al., 2016; Atlantic Multidecadal Oscillation, Romero et al., 2021).
The interest on long-term variations of coastal upwelling intensity has largely increased since the early 1990s, after Bakun (1990) proposed that global warming might lead to upwelling intensification in EBUEs. Whether long-term atmospheric and hydrographic trends support this hypothesis remains controversial (Varela et al., 2015). How intra-, interannual and decadal variability of climatic variability off Mauritania impact marine phyto- and zooplankton populations remains debatable (Cooley et al., 2022). The reliable characterization of intra- and interannual trends of phytoplankton populations in EBUEs requires long-term and continuous in-situ observations. Since this can be logistically challenging and financially costly, sediment traps offer a more affordable alternative of continuously assessing the flux of microorganisms over multiyear intervals. Previous diatom studies at site CBeu addressed the variations of marine diatom fluxes and the contributing populations (Romero and Fischer, 2017) and the phyto- and zooplankton communities (Romero et al., 2020) up to 6,5 years (June 2003-Feb 2010). Our study builds on earlier investigations on temporal variations of the diatom community captured with sediment traps deployed at the survey site CBeu (=Cape Blanc eutrophic) in coastal Mauritanian waters (Figure 1). Here, we extend the diatom record collected from early June 2003 through March 2020, using 17 trap experiments (Table 1). We address the following questions: (i) is there a baseline of annual variation (e.g., seasonal) off Mauritania, and (ii) whether and how this baseline is impacted by progressive changes and/or extraordinary events.
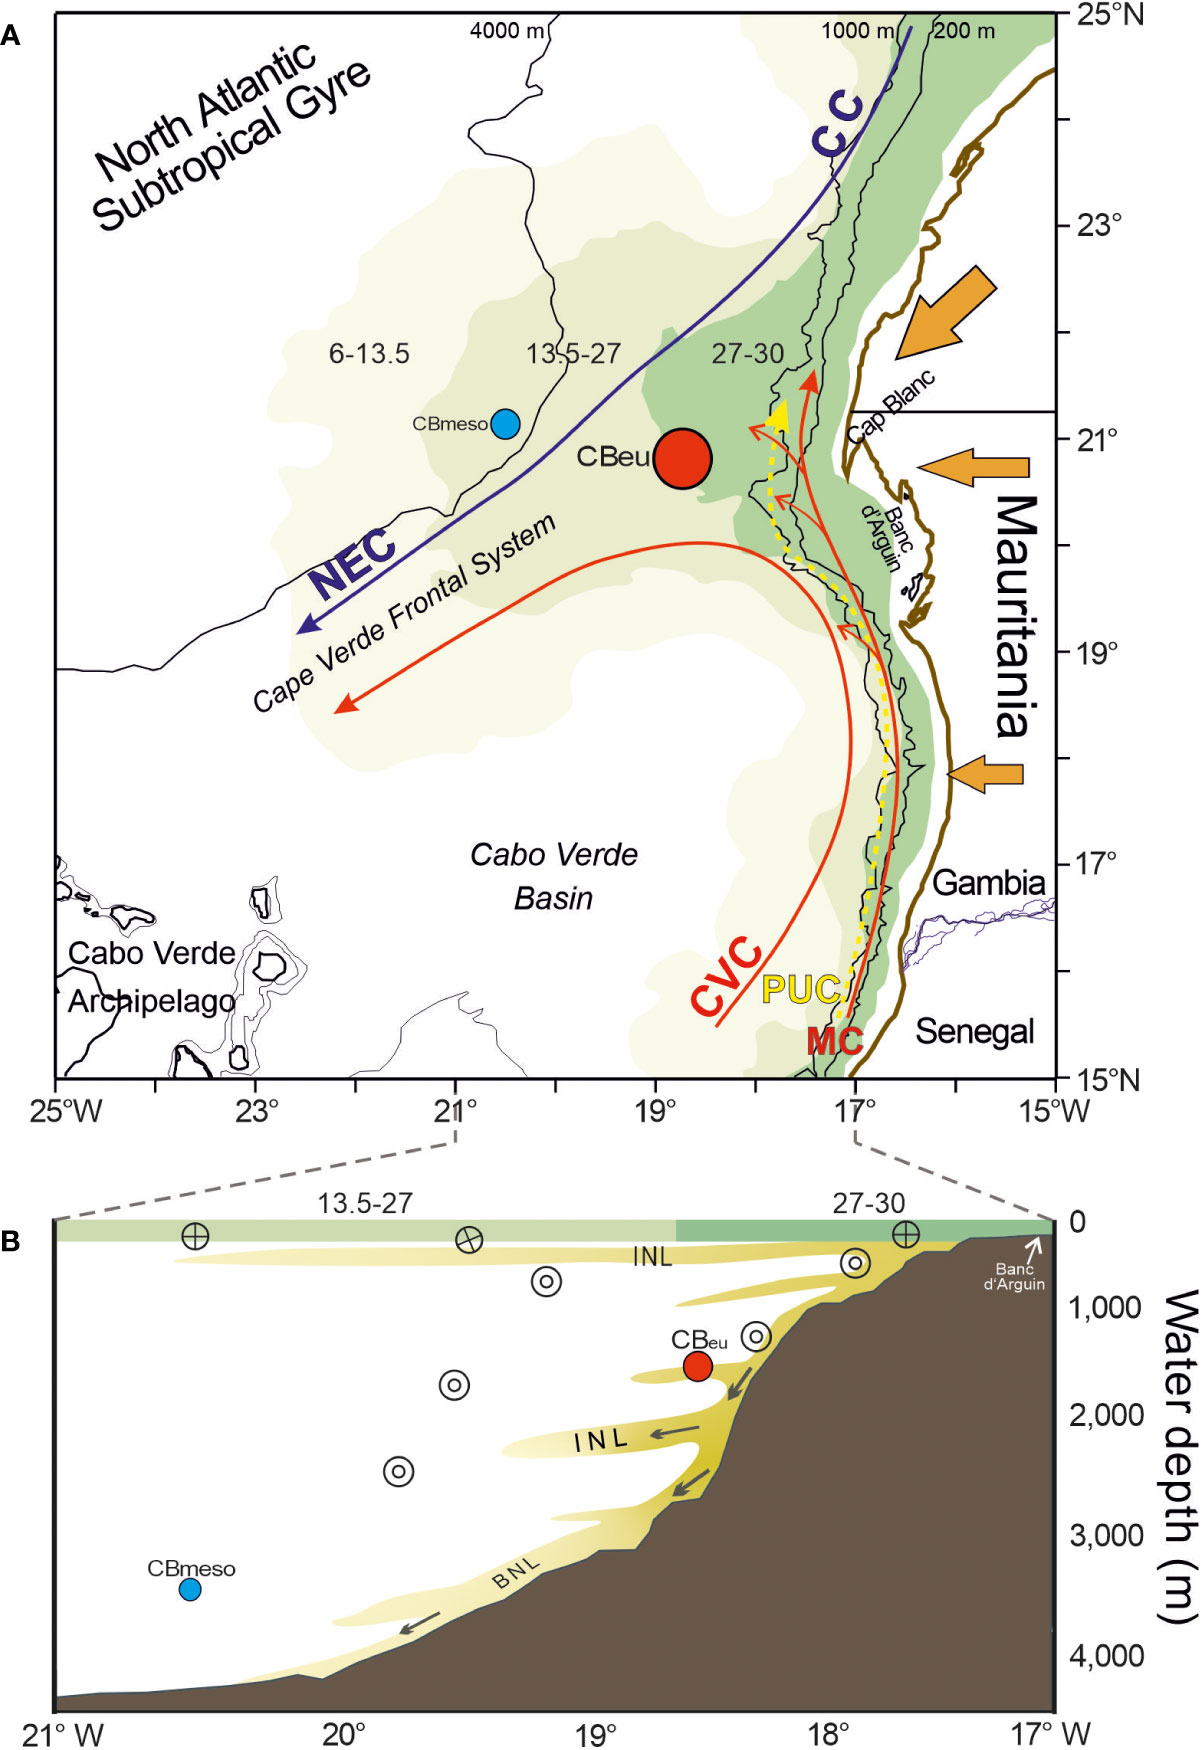
Figure 1 (A) Map of the study area and the location of site CBeu. The chlorophyll filament occupation zones are depicted in shades of green and give the occupation as a percentage of time for a calendar year (27-30%, 13.5-27 and 6-13.5%, according to Cropper et al., 2014). The location of the external trap site CBmeso is given as a blue dot. The predominant direction of dust supply is indicated by orange arrows. Major surface currents are also shown (Canary Current=CC; Cape Verde Current=CVC; Mauritanian Current=MC; North Equatorial Current=NEC; Poleward Undercurrent=PUC). (B) E-W transect along 20.5°–21°N showing the chlorophyll filament occupation zones in the uppermost water column (green-shaded horizontal bars), and intermediate nepheloid (INL) and bottom nepheloid layers (BNL; following Karakaş et al., 2006; Karakaş et al., 2009). Encircled dots indicate poleward currents and encircled crosses equatorward currents (Mittelstaedt, 1983; Mittelstaedt, 1991). Full red dot represents site CBeu, while the full blue dot represents the outer CBmeso.
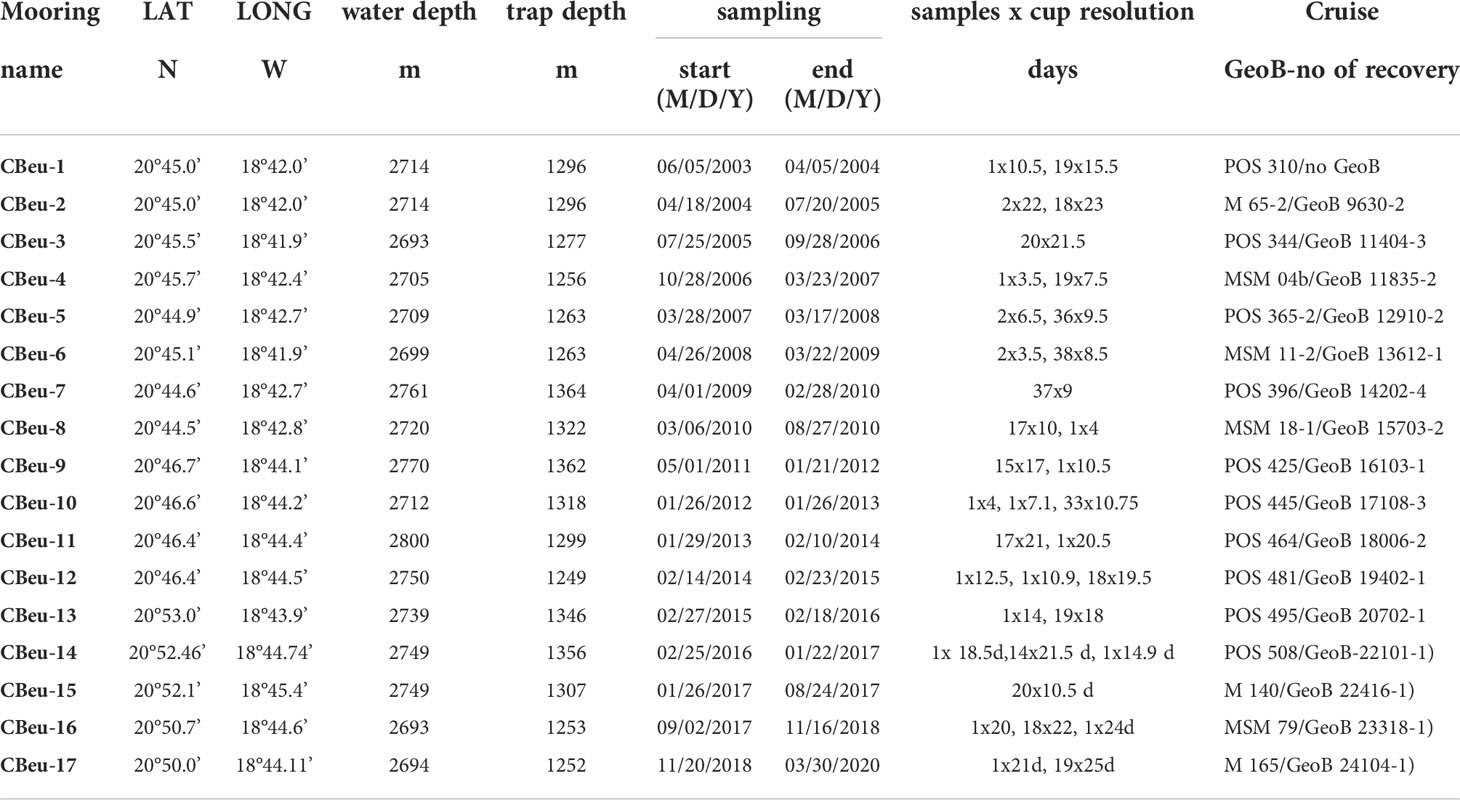
Table 1 Data deployment at site CBeu (=Cape Blanc eutrophic): trap name, coordinates (latitude and longitude), ocean bottom depth, trap depth, sampling interval (M=month, D=day, Y=year), and sample amount.
2 Study area
The CC-EBUE is in the eastern part of the North Atlantic subtropical gyre (Figure 1; Chavez and Messié, 2009; Arístegui et al., 2009; Cropper et al., 2014). The shelf break zone with its steep continental slope extends over approximately 100 km from the coastline (Hagen, 2001). Because of the coastal topography, the water currents and the wind system, coastal surface waters off Mauritania are characterized by almost permanent upwelling with varying intensity through the year (Lathuilière et al., 2008; Cropper et al., 2014).
Two major surface currents dominate the hydrography off Mauritania: the southwestward-flowing CC and the poleward-flowing coastal countercurrent or Mauritania Current (MC; Figure 1). The surface, relatively cool CC detaches from the northern African continental slope between 25° and 21°N and supplies waters to the North Equatorial Current (Mittelstaedt, 1991). The Si-rich MC gradually flows northward along the coast up to about 20°N (Mittelstaedt, 1991), and brings warmer surface waters from the equatorial realm into waters overlying site CBeu. Towards late fall, the MC is gradually replaced by a southward flow associated with upwelling water due to the increasing influence of trade winds south of 20°N (Zenk et al., 1991), becoming a narrow strip (<100 km wide) in winter (Mittelstaedt, 1983). The MC advances onto the shelf in summer and is enhanced by the relatively strong Equatorial Countercurrent and the southerly trade winds (Mittelstaedt, 1983).
North of Cape Blanc (ca. 21°N; Figure 1), intense north-easterly winds cause coastal upwelling to extend further offshore, until reaching upper slope waters. South of Cape Blanc, northerly winds dominate year-through, but surface waters remain stratified (Pelegrí et al., 2017). South of Cape Timiris (ca. 19°30’N), the northward flowing Polar Undercurrent (PUC) intensifies during summer-fall and remains at the subsurface during winter–spring (Pelegrí et al., 2017). The encountering of the northward flowing MC-PUC system with the southward flowing currents builds the Cape Verde Frontal Zone (Zenk et al., 1991; Figure 1) and the large offshore water export is visible as the giant Mauritanian chlorophyll filament (Gabric et al., 1993; Pelegrí et al., 2006; Pelegrí et al., 2017).
3 Material and methods
3.1 Mooring location, sampling intervals, and sample treatment
Details on sampling strategies (e.g., time resolution and trap depths) are given in Table 1. A total of 17 moorings were deployed at site CBeu (Figure 1) between June 2003 and March 2020 (Table 1), equivalent to 345 samples. Over the originally planned study interval of 6,298 days, samples were available for 5,694 days (e.g., ~90% of the originally planned time-series). Trapping failed for 604 days of the entire trap experiment with major gaps occurring between: (i) mid October 2007 and late April 2008 (malfunctioning of CBeu-5); (ii) late August 2012 and late February 2013 (malfunctioning of CBeu-10); (iii) late August 2014 and late November 2014 (malfunctioning of CBeu-12), and (iv) early April 2018 and late October 2018 (malfunctioning of CBeu-16) (Table 1). Minor gaps occurred between early January and mid-February 2010, early March and early April 2010, early June and early July 2010, and between late December 2011 and late January 2012 (Table 1).
As in previous studies at site CBeu (Fischer et al., 2016; Romero and Fischer, 2017; Fischer et al., 2019; Romero et al., 2020), we used sediment traps of the Kiel and Honjo types with mostly 20 cups and 0.5 m² openings, equipped with a honeycomb baffle (Kremling et al., 1996). As CBeu traps were moored below 1000 m, uncertainties with the trapping efficiency due to strong currents (e.g., undersampling, Buesseler et al., 2007) and/or due to the migration and activity of zooplankton migrators (“swimmer problem”) are assumed to be minimal. Following standard procedures applied within the trapping research program at MARUM (e.g., Fischer et al., 2016; Fischer et al., 2019), the sampling cups were poisoned prior to the deployments with mercuric chloride (HgCl2, 1 ml of conc. HgCl2 per 100ml of filtered seawater) while pure sodium chloride (NaCl) was used to increase the density in the sampling cups to 40‰. Upon recovery, samples were stored at 4°C on board and wet split in the Sediment Trap Laboratory (MARUM) using a rotating McLane splitter system. Larger swimmers –such as crustaceans and copepods– were handpicked by using forceps and were removed by filtering the sample carefully through a 1-mm sieve in the Sediment Trap Laboratory. All flux data here refer to the size fraction<1 mm. In almost all samples, the fraction of particles >1 mm was negligible (larger pteropods were found only in a few samples; Fischer et al., 2016).
3.2 Assessment of diatom fluxes and species identification
Samples for diatom studies were processed in the Diatom Laboratory (MARUM) between 4 and 12 weeks after trap recovery (Table 1). 1/125 splits of the original sediment trap samples were used. A total of 328 sediment trap samples was processed. Each sample was chemically treated with potassium permanganate (KMnO4), hydrogen peroxide (H2O2, 33%) and concentrated hydrochloric acid (HCl, 32%) following previously used methodology (Romero et al., 1999a; Romero et al., 1999b; Romero et al., 2002; Romero et al., 2009a; Romero et al., 2009b; Romero and Fischer, 2017; Romero et al., 2020; Romero et al., 2021). Qualitative and quantitative analyses of the diatom community were carried out on permanent slides of acid-cleaned material (Mountex® mounting medium) at x1000 magnifications by using a Zeiss®Axioscop with phase-contrast illumination. Depending on the valve abundance in each sample, several traverses across each permanent slide were examined. The census and definition of counting units for valves follow Schrader and Gersonde (1978). The total amount of counted valves per slide ranged between ca. 350 and 700. Two coverslips per sample were scanned in this way. The census of valves in replicate slides indicates that the analytical error of valve concentration and relative abundance estimates is ≤10%.
The resulting counts yielded absolute and relative abundance of individual diatom taxa as well as daily diatom fluxes (valves m-2 d-1), calculated according to Sancetta and Calvert (1988), as follows:
where, [N] number of valves in a known area [a], as a fraction of the total area of a petri dish [A] and the dilution volume [V] in ml. This value is multiplied by the sample split [Split], representing the fraction of total material in the trap, and then divided by the number of [days] of sample deployment and the sediment trap collection area [D].
3.3 Species-specific composition of the groups
A total of 210 diatom species were identified in CBeu samples between June 2003 and March 2020. Out of 210 taxa, 109 species (whose average relative contribution is ≥0.50% for the entire studied interval) are grouped in four groups, according to the main ecological and/or habitat conditions they represent: (1) benthic, (2) coastal upwelling, (3) coastal planktonic, and (4) open-ocean diatoms. Taxa assigned to each group (listed in Supplementary Table 1) and their ecology are described as follows:
1. The benthic group is dominated by the small-valved (length= 5-15 μm) Delphineis surirella (range: 2.58-84.68%, average: 37.73%). A common component of the epipsammic community, D. surirella is commonly found in the shallow euphotic zone of sandy shores, shelf, and uppermost slope waters along temperate to cool seas (Andrews, 1981; Round et al., 1990).
2. The coastal upwelling group is composed of several species of Chaetoceros resting spores (RS) and vegetative cells of Thalassionema nitzschioides var. nitzschioides. Both taxa are usually abundant in upwelling ecosystems of EBUEs (Nave et al., 2001; Abrantes et al., 2002; Romero et al., 2002; Romero and Armand, 2010). Vegetative cells of numerous Chaetoceros species (mainly those assigned to the section Hyalochaete, Rines and Hargraves, 1988) rapidly respond to nutrient depletion when upwelling weakens and build endogenous resting spores.
3. Coastal planktonic taxa are typical of neritic to hemipelagic, oligo-to-mesotrophic waters with moderate levels of dissolved silica (DSi). This group becomes more abundant when stratification of the uppermost water column increases (Romero et al., 2009a; Romero et al., 2009b; Romero and Armand, 2010; Crosta et al., 2012; Romero and Fischer, 2017; Romero et al., 2020). The well-silicified species Actinocyclus curvatulus, Cyclotella litoralis, Coscinodiscus radiatus, and Shionodiscus oestrupii var. venrickae are the main contributors.
4. Open-ocean taxa thrive in pelagic, oligotrophic, and warm to temperate waters with low siliceous productivity due to low DSi availability (<5 µmol kg-2, Tréguer and de la Rocha, 2013) and stratified uppermost water column (Nave et al., 2001; Romero and Fischer, 2017; Romero et al., 2005; Crosta et al., 2012). Main components of this highly diverse group are several species of Azpeitia, Fragilariopsis doliolus, Nitzschia bicapitata, Nitzschia interruptestriata, Roperia tesselata and Planktoniella sol.
3.4 Web-based environmental variables
To evaluate the impact of the atmospheric and hydrographic conditions on the diatom flux and the four communities, we analyzed each group with several environmental variables obtained by satellite for a box area around the CBeu station (e.g., 18°W, 19°W; 20°N, 21°N). For each calendar year, samples were seasonally assigned as follows: January through March: JFM, boreal winter, April through June: AMJ, boreal spring; July through September: JAS, boreal summer, and October through December: OND, boreal fall). Monthly means were compiled to address the seasonal cycle.
1. The Bakun upwelling index has been calculated based on the monthly Ekman transport obtained from ERDDAP (http://coastwatch.pfeg.noaa.gov/erddap/griddap/erdlasFnWPr.html), following the ERD’ instruction (https://oceanview.pfeg.noaa.gov/products/upwelling/bakun).
2. Monthly Sea Surface Temperature (SST) in the inmediate area surrounding site CBeu has been downloaded from ERDDAP server (https://coastwatch.pfeg.noaa.gov/erddap/griddap/erdMH1sstdmdayR20190SQ.html). This dataset with a resolution of 4km has been recorded by Moderate Resolution Imaging Spectroradiometer aboard the AQUA satellite.
3. Wind plays a key role in the study area (Mittelstaedt, 1983; Mittelstaedt, 1991; Pelegrí et al., 2006; Cropper et al., 2014; Pelegrí et al., 2017). Thus, we downloaded the monthly wind data at 20m of the surface recorded by satellite from ERDDAP server (https://coastwatch.pfeg.noaa.gov/erddap/griddap/erdlasFnWind20_LonPM180.html).
4 Results
4.1 Total diatom fluxes
The main contributors to the siliceous fraction at site CBeu between June 2003 and March 2020 are marine diatoms. In terms of the number of individuals, the total diatom flux is always one order to six orders of magnitude higher than that of the other siliceous organisms. Silicoflagellates and radiolarians are secondary components, with minor input by land-derived freshwater diatoms and phytoliths (data not shown here). The latter represents the eolian-derived signal and is indicative of aridity/humidity conditions in North Africa (Romero et al., 1999; Romero et al., 2002; Romero et al., 2003).
The total diatom flux ranged 1.6 x 10⁴-1.2 x 10⁸ valves m-2 d-1 (average = 4.1 x 10⁶ valves ± 1.5 x 10⁷) and shows strong interannual variability (Figures 2, 3). Maxima of total diatom flux are defined here as values higher than the total diatom flux average ± 1 standard deviation (STD) for the entire study period. The two highest fluxes occurred in late winter 2005 (1.2 x 10⁸ valves m-2 d-1, Figure 2) and summer 2008 (9.1 x 10⁷ valves m-2 d-1, Figure 2). Fluxes in spring and summer show the highest number of above-the-average values (n=17) whereas winter has the lowest amount of total diatom flux maxima (n=12). Although the same amount of total diatom flux maxima is recorded in fall as in summer and spring, fluxes of fall maxima were predominantly lower than those of spring and summer.
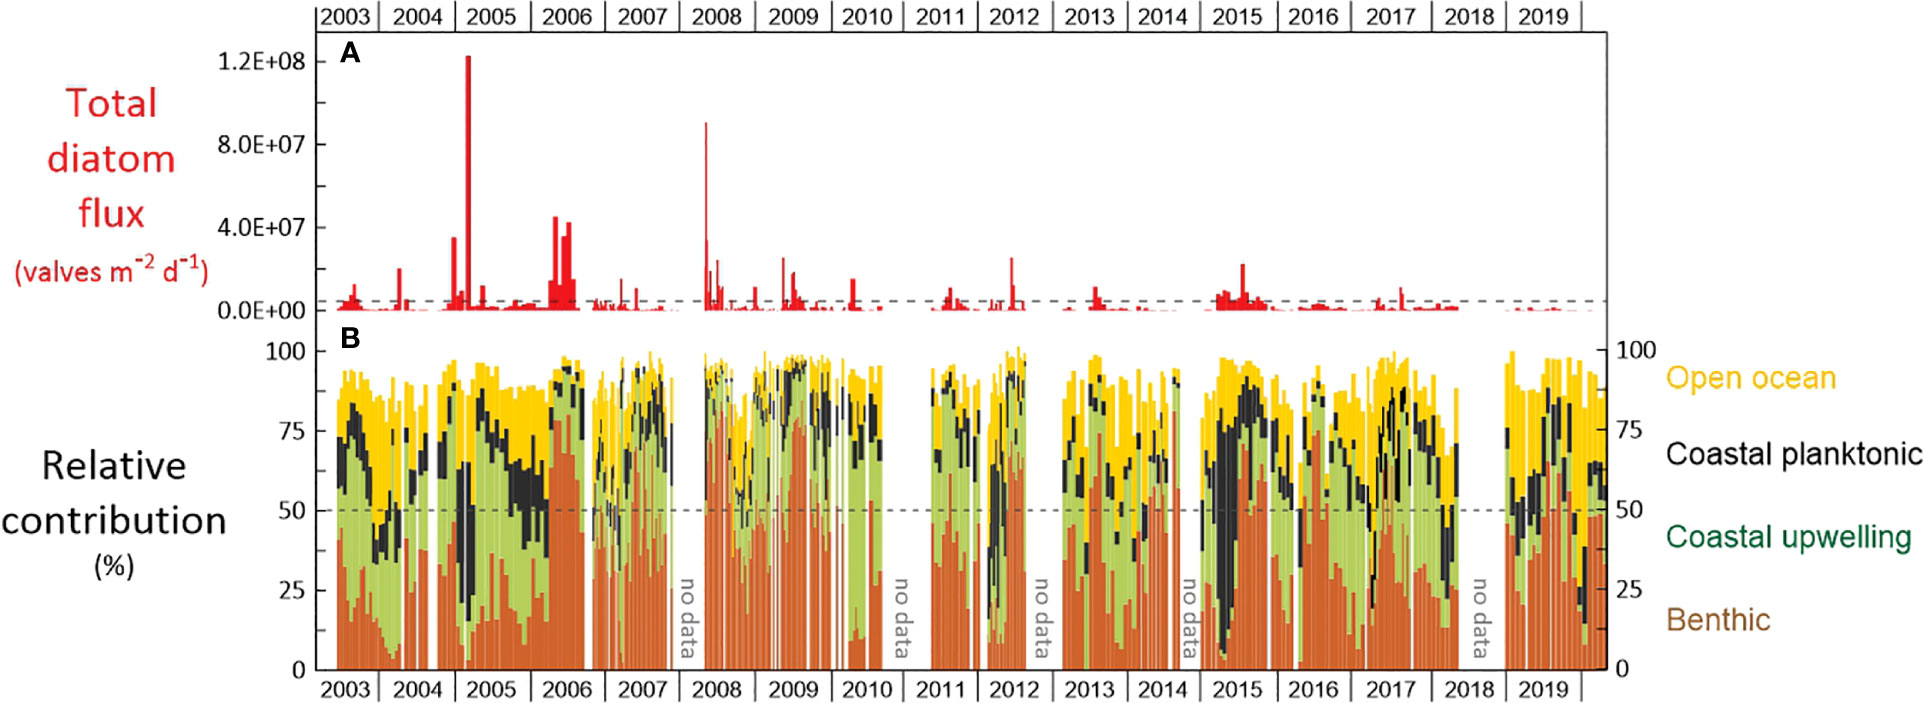
Figure 2 Daily (A) total diatom flux (valves m-2 d-1) and (B) relative contribution of diatom groups (%) for the interval June 2003 and March 2020 at the CBeu site. Groups of diatoms are benthic (brown), coastal upwelling (green), coastal planktonic (black), and open-ocean (yellow). The dotted line in (B) represents 50% of the relative contribution. For the species-specific composition of each group see 3.4. and Supplementary Table 1.
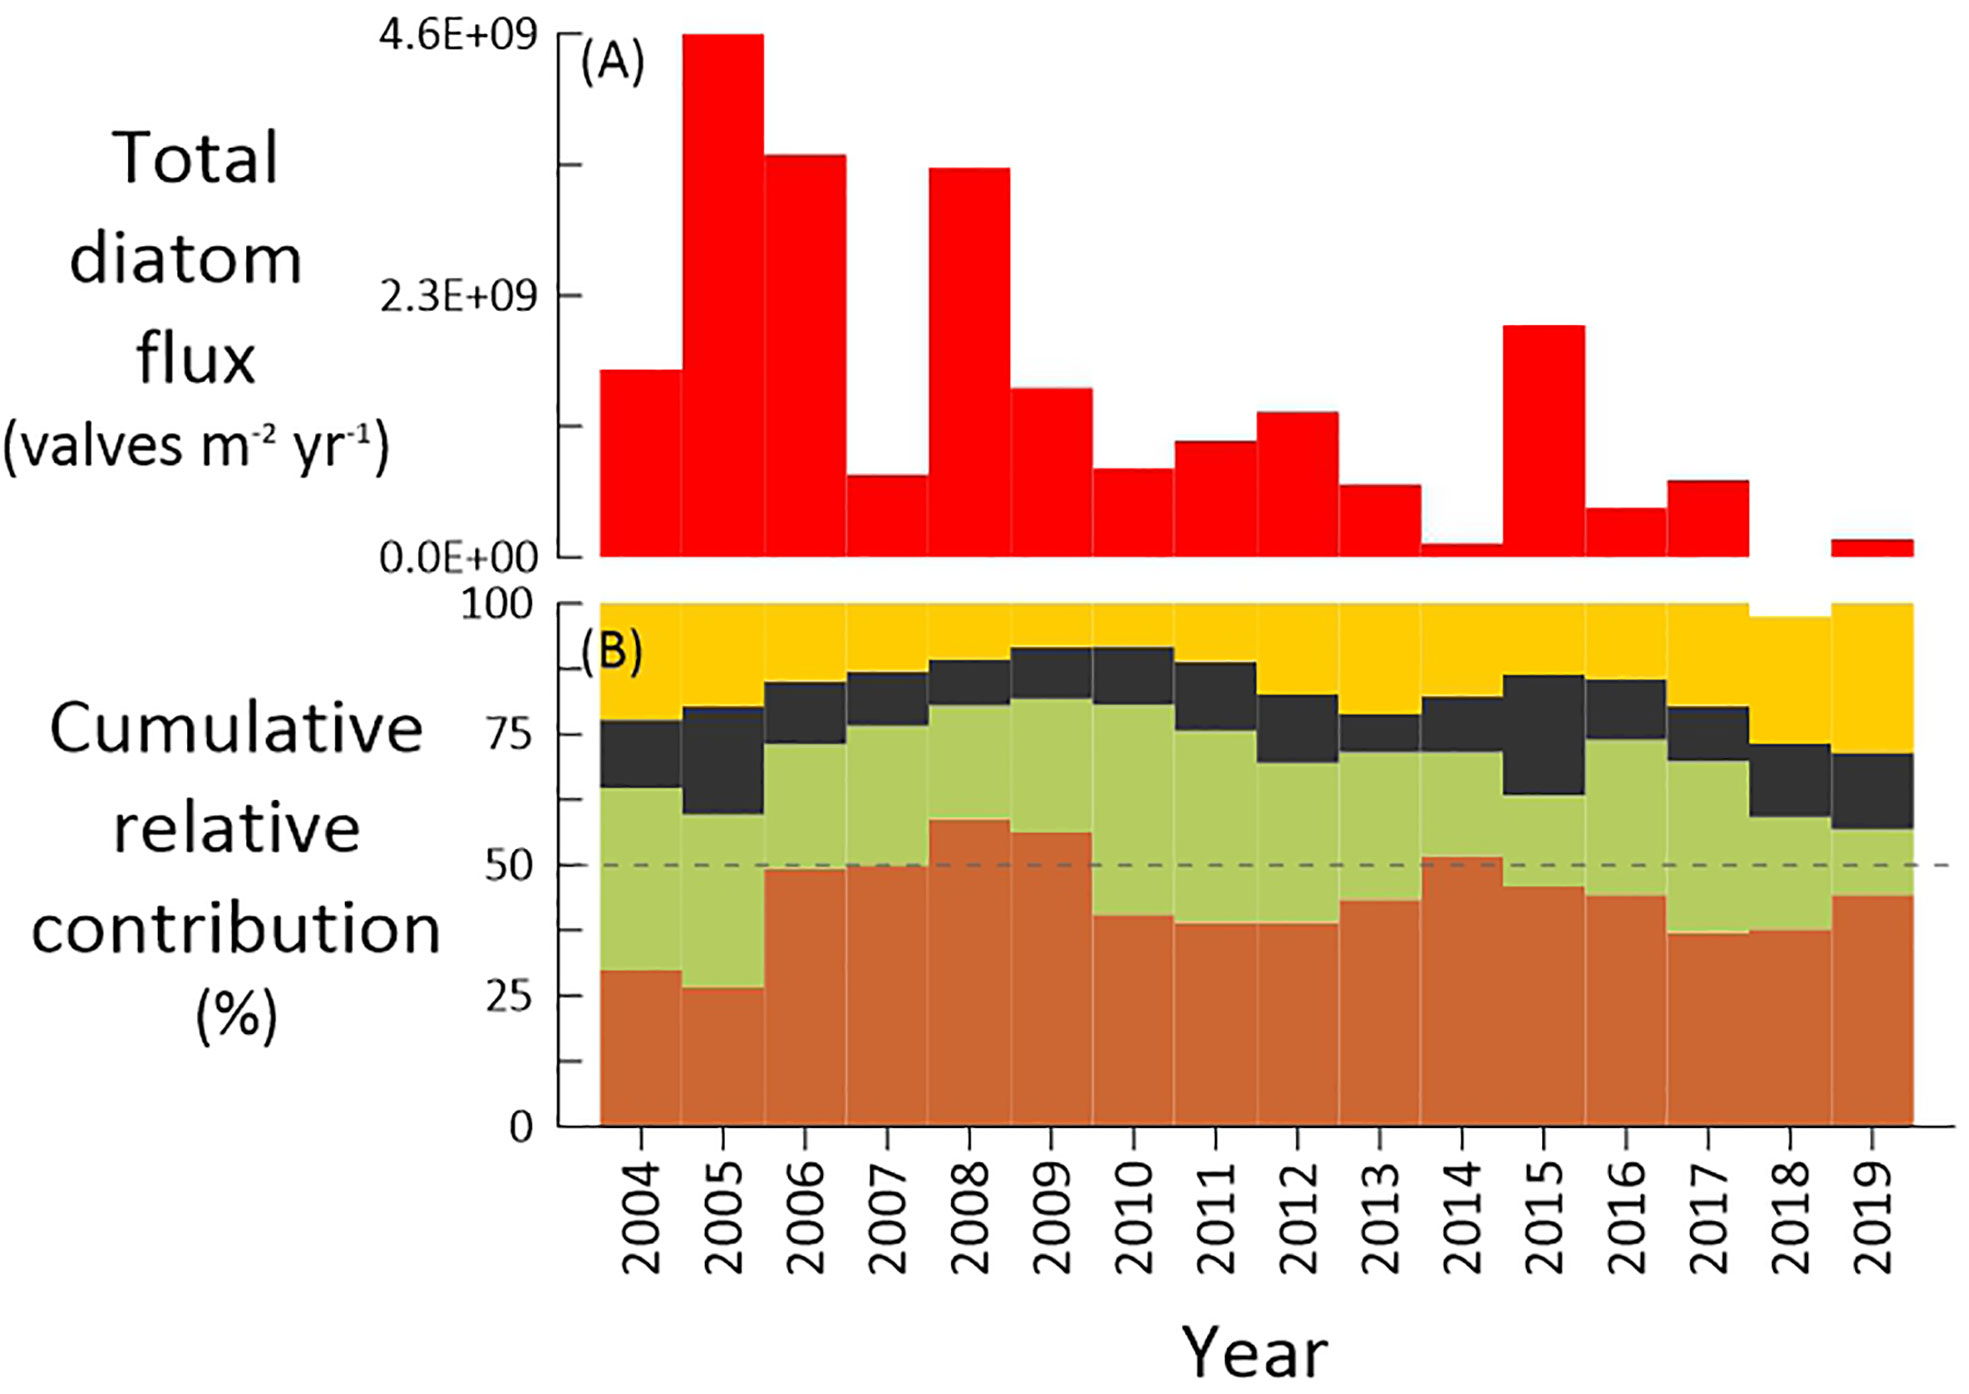
Figure 3 Annual (A) total diatom flux (valves m-2 year-1) and (B) relative contribution (%) of diatom groups at site CBeu 2004 and 2019. Reference for group color: benthic (brown), coastal upwelling (green), coastal planktonic (black), and open-ocean diatoms (yellow).
Estimates of annual total diatom fluxes were calculated for calendar years with at least 250 days per year of flux collections. Data are presented in Table 2 and Figure 3. Values range between 1.2 x 10⁸ and 4.6 x 10⁹ valves m-2 yr-1 (1 STD= 1.4 x 10⁹ valves m-2 yr-1; average = 1.5 x 10⁹ valves m-2 yr-1). Values above the average (1.5 x 10⁹ valves m-2 yr-1) occurred in 2005, 2006, 2008, and 2015 whereas the lowest values occurred in 2014 and 2019.
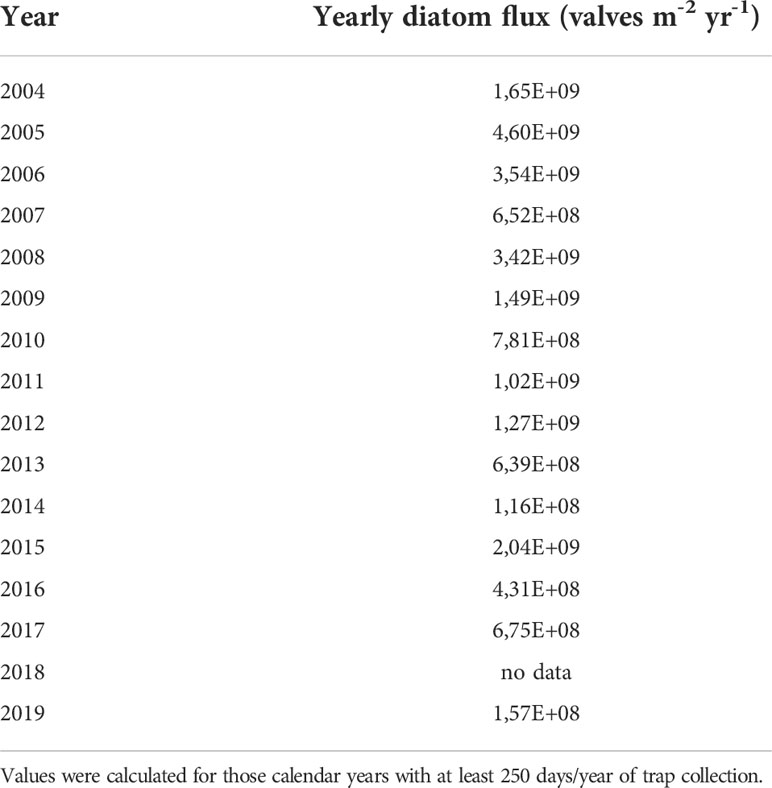
Table 2 Estimates of annual total diatom fluxes.
4.2 Temporal variations of the marine diatom populations
4.2.1 Annual cycle
The main regular seasonal patterns are (i) the dominance of benthic diatoms between April and September (Figure 4A) and, (ii) highest abundance of open-ocean taxa from October through March (Figure 4B), (iii) coastal upwelling taxa mainly contributing between August and December (with additional high values in March and April), and (iv) coastal planktonic species are more abundant between January and April (Figures 4B, C).
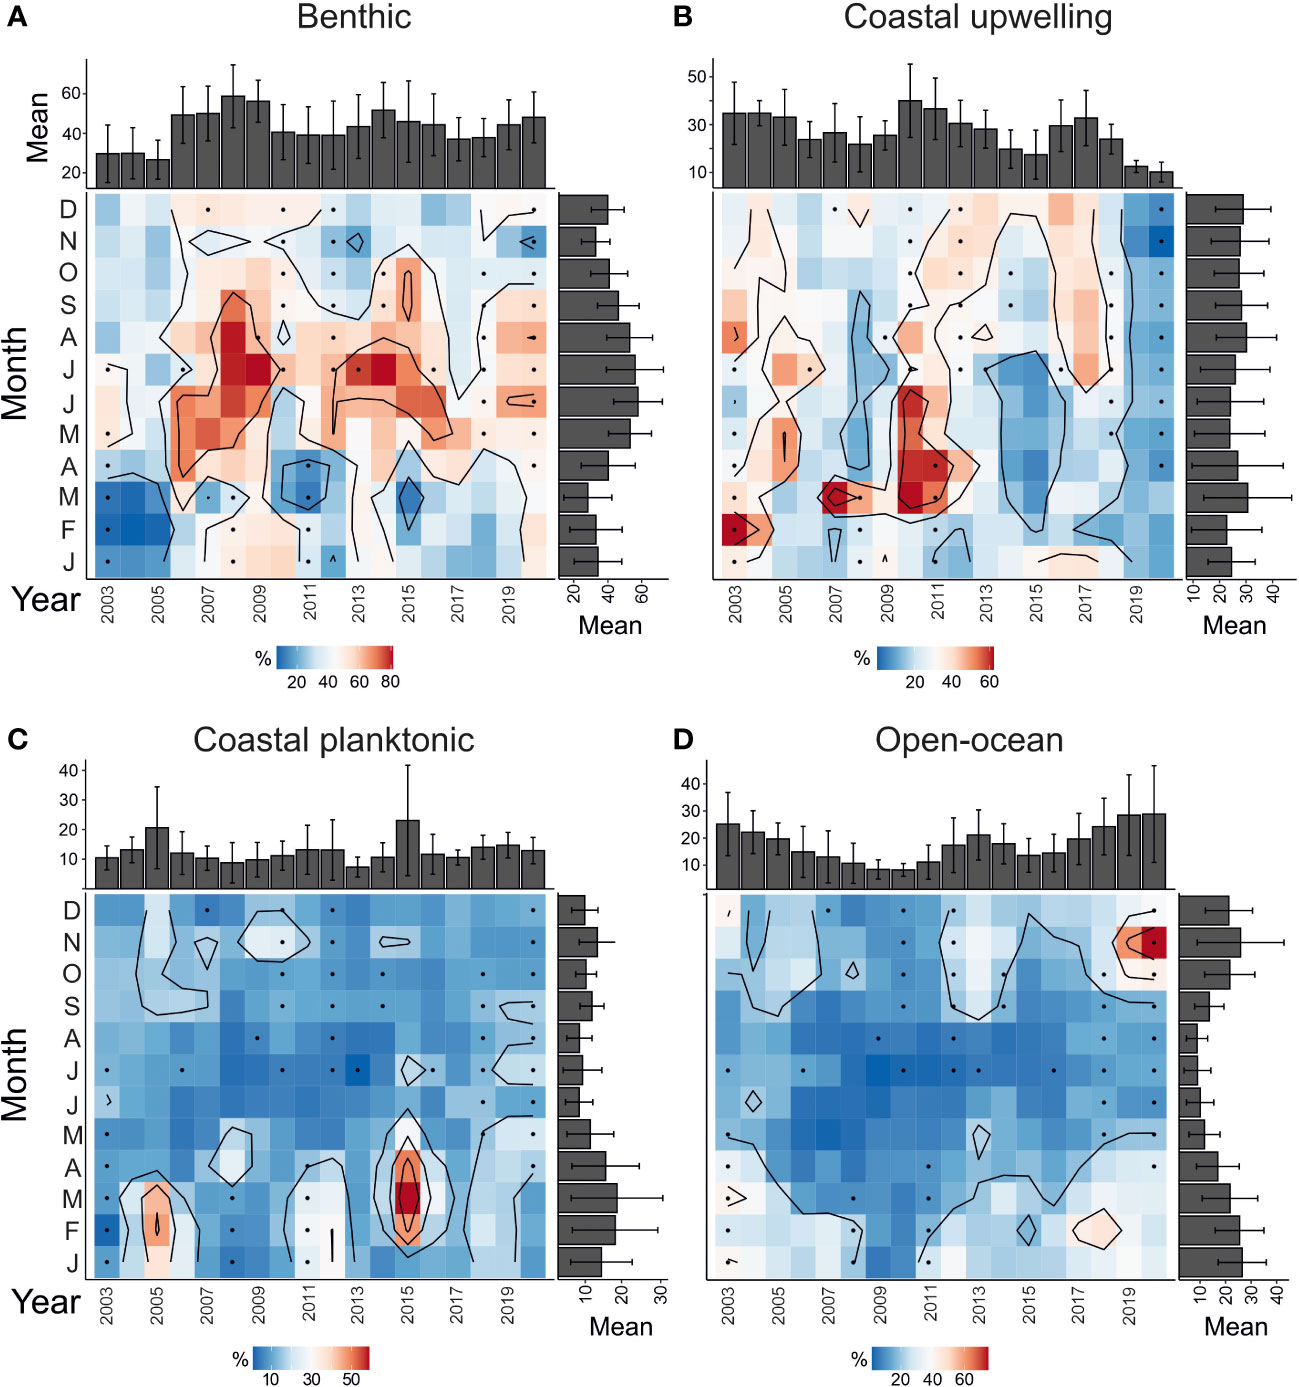
Figure 4 Seasonal and interannual relative contribution of diatom groups (%) for the interval June 2003 and March 2020 at the CBeu site. Groups of diatoms are: (A) benthic, (B) coastal planktonic, (C) coastal upwelling, and (D) open-ocean diatoms. Squares with dots represent the period without measurements and interpolated by the Barnes method. For the species-specific composition of each group see 3.4. and Supplementary Table 1.
The correspondence analysis (Figure 5A) shows that the main variability of diatom populations’ contribution is related to their seasonal occurrence. The first component covers 68% of the total variance and clearly opposes benthic and open-ocean communities. This confirms that these two groups are temporally exclusive in the annual cycle of population dynamics. The clustering analysis (Figure 5B) additionally supports this scenario: out of 28 maxima dominated by benthic diatoms, 20 occur in spring and summer (Figures 5B, BTH1.1, BTH2.1 and BTH2.2), while the rest occur in fall and winter. The seasonal dynamics of open-ocean and benthic diatoms communities respond to different environmental conditions, mainly wind conditions (e.g., crosswind; p-value<0.05, R=0.83).
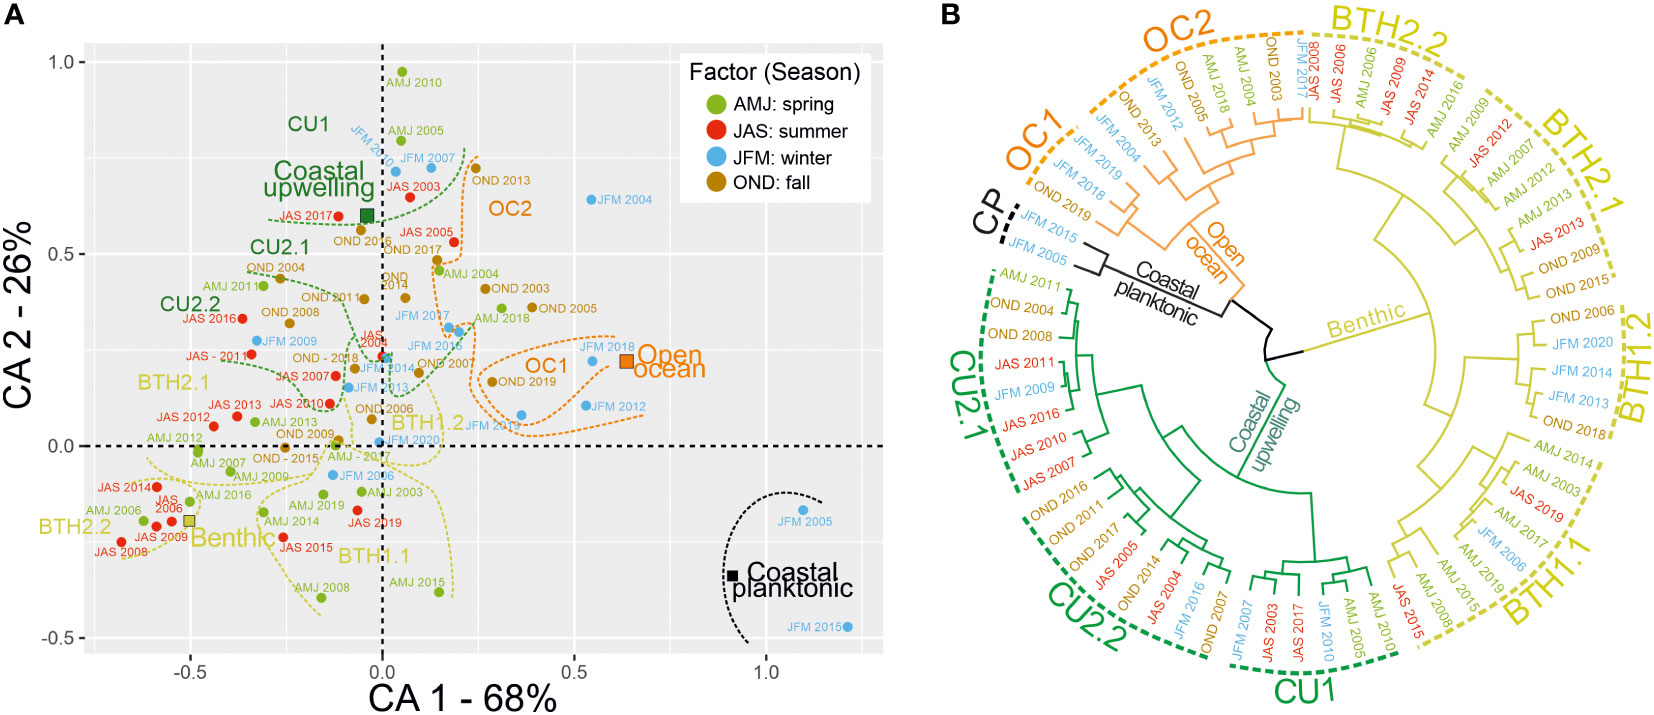
Figure 5 (A) Correspondence Analysis (CA) of diatom groups found at CBeu site between June 2003 and March 2020, coupled with (B) a hierarchical clustering analysis of samples’ score resulting from CA (see 2.4 Statistical analysis). Euclidean distance and Ward’s aggregation link were used to generated hierarchical dendrogram. Colors used for labels and cluster branches identify respectively the seasons (blue, DJF; green, MAM; red, JJA; brown, SON) and each diatom group. For the species-specific composition of each group see 3.4 and Supplementary Table 1.
Intervals of above-the-average (c. 15.7%) contribution of open-ocean diatoms occurred in winter 2017 and 2018, and winter 2018 and 2019 (Figure 4D, OC1 in Figure 5B). These exceptional contributions fall within a period of lowest diatom productivity with total diatom fluxes well below the overall average (4.1 x 10⁶ valves) and the lowest yearly diatom flux (Figure 3). However, the statistical analysis does not show any significant correlation with environmental conditions.
The seasonal contribution of coastal planktonic and coastal upwelling groups is less conspicuous than that of benthic and open-ocean taxa (Figures 4B, C). The pattern of the highest relative contribution of coastal planktonic species from winter through early spring (Figure 4C) is additionally confirmed by the correspondence analysis: coastal planktonic populations mainly distribute along the first component and stay closer to the open-ocean community (Figure 5A). The largest standard deviation of seasonal coastal planktonic relative values (compared to that of the other three groups) is related to their extraordinary high contribution in winter 2005 and spring 2015 (Figure 4C).
Opposite to the other three groups, the distribution of coastal upwelling community samples’ score is mainly along the second component of the CA (which covers 26% of the total variance, Figure 5A). Cluster CU1 (Figure 5B) groups exceptionally high contributions of coastal upwelling populations in spring 2005 and 2010. In particular, the spring 2010 maxima of coastal upwelling diatoms (≥50%) is the only one associated with a total diatom flux maximum (1.5 x 10⁷ valves m-2 yr-1, Figure 2).
4.2.2 Interannual pattern
The average relative contribution ± 1STD of each group between 2003 and 2020 was as follows: (1) benthic = 42.21±19.71%, (2) coastal upwelling = 24.60±14.15%, (3) open ocean = 15.69±10.87%, (4) coastal planktonic = 11.56±10.21% (sum of the averages = 94.1%). A major shift in the relative contribution of groups occurs in 2006, when the percentage of benthic diatoms abruptly increased between late February and early April 2006 (an increase from 15.3 to 63.4%; trap CBeu3, samples #11 and #13, 02/25 to 04/09/06). Although variable, the dominance of benthic diatoms at CBeu prevailed throughout until March 2020 (Figures 2, 4A). When analyzing the influence of environmental variables on diatom groups by correlation, the benthic community is only significantly associated with the upwelling index (p-value<0.05; R=0.52).
Open-ocean diatoms contribute over 15% between 2003-2005, in 2013, and again between 2017-2019 (Figure 4D). The interannual contribution of open-ocean diatoms has decreasing values until 2009-2010 (<10%, Figure 4D), increases into 2012 followed by a decreasing trend in 2015 and to increase again toward 2019 (Figure 4D). On average, coastal upwelling diatoms are the second most abundant contributors to the diatom assemblage off Mauritania and contributes the most (≥30%) between 2003 and 2005, 2010-11 and 2016-17. The annual highest concentration of coastal upwelling diatoms occurs during years of lower benthic contribution: 2003-2005, 2010,2012, and 2016-2017 (Figures 3, 4A, B). Whereas benthic and open-ocean populations are exclusive on the seasonal timescale, coastal upwelling and benthic groups seem opposite on the interannual timescale (p-value<0.05, R=-0.56). The statistical analysis between the annual contribution of coastal upwelling diatoms and environmental variables shows a significant positive correlation with the SST (p-value<0.05, R=0.76) and a negative relationship with wind intensity (headwind and wind speed; p-value<0.05 R=-0.59 and R=-0.61).
The yearly relative contribution of coastal planktonic diatoms is rather stable (around 10%) with exceptionally high values (20-22%) in 2005 and 2015 (Figure 4C). As mentioned earlier, these highest yearly values and largest standard deviation are attributed to their extraordinary contribution in winter 2005 (36.4-46.7%) and spring 2015 (47.1-59.0%, Figure 4C; overall average ± 1 STD = 11.56±10.21%). Likewise in open-ocean populations, no significant correlation has been observed between coastal planktonic community and prevalent environmental conditions.
5 Discussion
5.1 The physical setting off Mauritania and the annual cycle of diatom populations
Highest diatom fluxes at site CBeu between June 2003 and March 2020 match the occurrence of the most intense upwelling interval off Mauritania. The prevalent spring-summer pattern of diatom productivity at site CBeu mirrors well their response to the annual dynamics of atmospheric and hydrographic conditions in northwestern Africa and off Mauritania. Physical parameters that define the sequence of events leading to the most adequate conditions for productivity in surface waters show the highest upwelling index (≥150) between February and June (Figure 6A), matching in turn lowest SST (mostly below 20°C, indicative of the well-mixed uppermost water column, Figure 6B) and the strongest trade winds (Figure 6C). Highest upwelling strength (Figure 6A) follows the breaking of stratification by late winter (Pelegrí et al., 2006; Cropper et al., 2014) and leads to the subsequent mixing of the uppermost water column (down to 100 m, Mittelstaedt, 1983) due to increasing intensity of northwestern winds along the CC-EBUE (Marcello et al., 2011; Pelegrí et al., 2017). Synchronous with the most intense upwelling, the DSi-rich, northward flowing MC advances upon the Mauritanian shelf (Mittelstaedt, 1983), and gradually flows away from the shelf, before turning westward up to about 20°N (close to site CBeu, Figure 1).
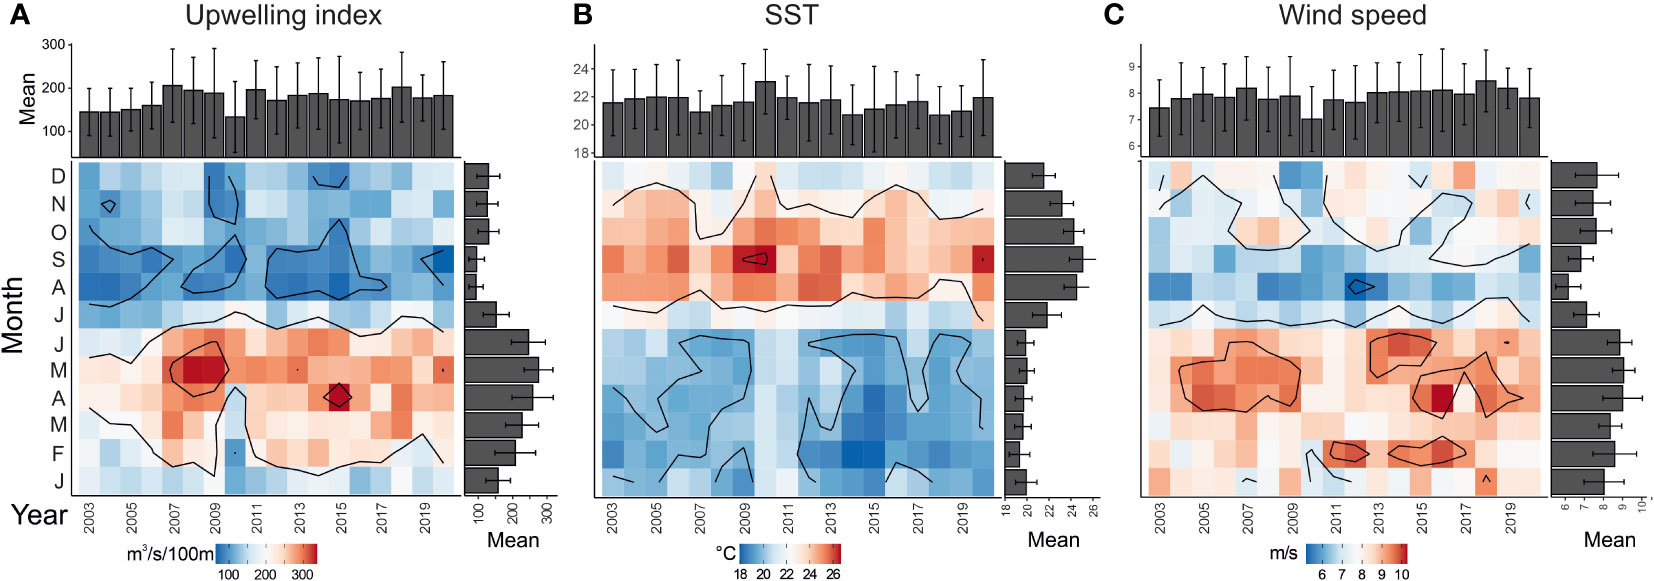
Figure 6 Monthly values of (A) upwelling index (m3 s-1 100 m), (B) sea-surface temperature (°C) and (C) wind speed (m s-1) for the interval January 2003 through December 2020. For each parameter: the x-axis represents the calendar year, while the y-axis refers to months (January through December); gray right-hand bars represent the average monthly value, and the gray bars in the uppermost panel the annual average. Color scale: values are highest in the red realm, while become lower in the blue realm.
Independent of the temporal occurrence of diatom maxima at the CBeu site, an outstanding feature is their short duration (less than three weeks). Although the length of each peak depends to a certain degree on the sampling interval of each trap experiment (albeit variable between June 2003 and March 2020, Table 1), diatom maxima represent brief productivity and export events, which deliver up to 70% of the total annual diatom flux in intervals shorter than 35 days. The abruptness of these events reflects the sudden availability of nutrients vital for diatom production –mainly N, P, and DSi (Tréguer and de la Rocha, 2013)– due to their upwelling into the uppermost 30 m of the water column, followed by their brisk and thorough consumption. Off Mauritania, the timescale of upwelling favorable winds and cooling of surface waters varies on short timescales (one day up to a few days, Pradhan et al., 2006; Versteegh et al., 2022), and fluxes of sinking microorganisms’ remains subsequently vary on short intervals. However, the highest sampling resolution at site CBeu (between 3.5-7 days, Table 1) may be still low to properly resolve the natural variability of quick productivity and export events off Mauritania.
Statistical analysis shows that the occurrence of benthic diatoms at site CBeu is predominantly driven by wind conditions along north-western Africa, which in turn impact the upwelling intensity (Figure 6A; Cropper et al., 2014) and the transport from coastal waters into the hemipelagic realm (Fischer et al., 2016). The negative correlation between benthic diatoms and easterly winds indicates that this diatom group dominates the assemblage when predominantly winds blow along the Mauritanian coast. As discussed in previous studies, offshore transport mainly occurs via (i) intermediate nepheloid layers and (ii) the giant chlorophyll filament (Romero and Fischer, 2017; Romero et al., 2020; Romero et al., 2021). Both offshore carriers are most active in spring and summer (Fischer et al., 2009; Fischer et al., 2019; Karakaş et al., 2006; Karakaş et al., 2009), interval with the highest benthic taxa occurrence (Figure 4A).
The predominant occurrence of open-ocean diatoms (e.g., October–March, Figure 4D) during the interval of diminished diatom productivity (Figure 2A) and the lowest number of diatom flux maxima matches the interval of lowest mixing (=warmest SST, Figure 6B) of surface waters overlaying site CBeu (Romero and Fischer, 2017; Romero et al., 2020), the weakening offshore streaming of the giant chlorophyll filament (Fischer et al., 2019) and the predominant occurrence of North Atlantic Central Waters reaching site CBeu (Fischer et al., 2019). The positive correlation of open-ocean diatoms with easterly wind suggests that their dominance is due to the combination of (i) sluggish Ekman offshore transport, together with (ii) weakened upwelling, (iii) the predominance of equatorward-flowing water masses, and (iv) highest seasonal stratification of the uppermost water column.
5.2 Exceptional increase of coastal planktonic diatoms in winter 2005 and spring 2015
Exceptional contributions of coastal planktonic diatoms occurred in winter 2005 and spring 2015. The occurrence of the first coastal planktonic diatoms event matches the highest diatom flux for the entire trap experiment (1.2 x 10⁸ valves m-2 d-1; late April to early May 2005). This productivity event was accompanied by an unusual set of physical conditions in northwestern Africa and the neighboring Mauritanian upwelling ecosystem. Before this event occurred, a long dry interval happened in the Sahel and the Sahara between 2001 and 2004 while, simultaneously, the eastern Atlantic became anomalously warm (Zeeberg et al., 2008; Alheit et al., 2014). The Mauritanian chlorophyll filament was relatively small, and an almost neutral North Atlantic Oscillation occurred from 2004-05 (Fischer et al., 2019).
In a previous study of the phyto- and zooplankton communities at site CBeu, several unprecedented shifts in the populations were observed between late 2004 and late 2006 (Romero et al., 2020). These changes occurred in three main stages as follow: (1) 2004: low total biogenic production, absence of warm-water foraminifera, and significant SST cooling; (2) late 2005/early 2006: extraordinarily high contribution of the coccolithophore Umbilicosphaera anulus, and first high occurrence of the pteropod Limacina bulimoides; and (3) fall 2006-winter 2007: increase of warm-water calcareous dinoflagellates and highest abundance of L. bulimoides. Most of these populations returned to their ‘regular’ annual pattern of occurrence after late 2006 (Romero et al., 2020).
The physical setting during the highest contribution of coastal planktonic diatoms in spring 2015 differed from the one framing the winter 2005 peak. The accompanying lowest benthic diatom contribution in spring 2015 (Figure 4A) points to a significant weakening of lateral advection. In addition to the high yearly diatom flux at site CBeu (Figure 3) and high fluxes of biogenic silica and organic carbon (Fischer et al., 2019), the 2015 biogenic silica flux event was related to the extraordinarily high contribution (up to 70%) of Actinocyclus subtilis, a large diatom with well-silicified, disk-shaped valves (Hasle and Syvertsen, 1996).
5.3 Interannual trends and the Bakun’s hypothesis of upwelling intensification
Due to on-going global warming(https://www.ipcc.ch/sr15/), Bakun (1990) hypothesized that the weakening of night/day temperature gradient on land would lead to the intensification of the thermal gradient in adjacent EBUEs. This thermal intensification should lead to increased onshore-offshore atmospheric pressure gradients, hence accelerating westward winds and intensifying coastal surface and subsurface circulation (Bakun, 1990; Bakun et al., 2010). Considering the strong coupling between upwelling intensity and productivity dynamics in the CC-EBUE (Mittelstaedt, 1983; Cropper et al., 2014; Pelegrí et al., 2017), the scenario of thermal gradient intensification might have far-reaching implications for the productivity in marine ecosystems along the north-western African margin and the adjacent land. Assuming Bakun’s hypothesis to be conceivable, it might have been expected that diatom production should have increased between 2003 and 2020 off Mauritania. Our long-term diatom record, however, is at odd with Bakun’s hypothesis. Annual diatom fluxes show a significant increase in 2005, followed by an almost uninterrupted and substantial decrease until 2020 (exception=2015, Figure 3A, Table 2). Simultaneous with this long-term reduction, decreasing organic carbon flux and the diminished relative contribution of organic carbon to settling particles have been observed (Fischer et al., 2019). Important shifts in physical variables that might have impacted the yearly production of diatoms include a c. 1°C increase of satellite‐measured average summer SST (Fischer et al., 2019), a notorious change in predominant wind direction (Fischer et al., 2019), and the increasing influence of the warm, northward-flowing MC in summer after 2005 due to the AMOC weakening (Romero et al., 2021).
Admittedly, 17 years might still be a too short interval to pinpoint long-term trends (up to decadal) in the evolution of upwelling intensity off Mauritania (Varela et al., 2015). Studies with longer time-series of physical data along the north-western African margin have drawn contradictory conclusions and their output appears highly dependent on the parameters measured, the length of the time-series and the study area along the CC-EBUE (Varela et al., 2015). Using time-series of zonal Ekman transport, Gómez-Gesteira et al. (2008) observed the weakening of upwelling between 20°N and 32°N. Pardo et al. (2011) reached similar conclusions for the area from the Iberian Peninsula down to the Moroccan coast, while Narayan et al. (2010), who examined SST and wind data near off southern Morocco, concluded that the upwelling intensified between 1960 and 2001.
5.4 Abrupt increase in the contribution of benthic diatoms in 2006
As discussed in previous sediment trap diatom studies off Mauritania (Romero and Fischer, 2017; Romero et al., 2020; Romero et al., 2021), an exceptional feature of the populations’ occurrence pattern at site CBeu is the abrupt increase of benthic diatoms between late February and early April 2006 (Figures 2 and 4A). Site CBeu captured, however, the second of a major, two-step increase of benthic diatom contribution, as the first one occurred already in May 2002 as recorded at the outer CBmeso station (Romero et al., 2021; c. 13 months before the begin of the CBeu trap experiment, Table 1). The exceptional increase of benthic diatoms in spring 2006 was possibly caused by the combined intensification of lateral advection of intermediate nepheloid layers and surface waters-mediated transport within the giant chlorophyll filament (Helmke et al., 2005). Erosional processes along the Mauritanian slope (Meunier et al., 2012) are responsible for particle clouds (Fischer et al., 2009; Karakaş et al., 2006; Karakaş et al., 2009), which also contain phytoplankton originally thriving in shelf waters. These clouds stream offshore up to several tenths of kilometers (Karakaş et al., 2006; Karakaş et al., 2009). Quantitatively, our data agree with previous estimations of downslope transport of organic carbon into the Mauritanian hemi- and pelagial domains. Like the highest annual relative abundance of benthic diatoms (Figure 4A), it has been estimated that almost 50% of the organic carbon trapped at the external CBmeso site (deep trap, c. 3,600 m water depth) derives from shallowest coastal waters via lateral advection (Karakaş et al., 2006).
Substantial interannual variations of benthic diatoms (Figure 4A) suggest that both intensifications (2006-2009 and 2013-2016) as well as weakenings (2010-2012 and 2017, 2018) of the lateral transport occurred. The intensification of intermediate waters transport during the warm phase of the AMO (started in the second half of the 1990s; Wang and Zhang, 2013) might have also contributed to the strengthening of lateral transport into the early 2000s (as proposed for the outer site CBmeso, Romero et al., 2021). Impacted by the intensification of the AMOC (Wang and Zhang, 2013), we speculate that subsurface (100–300 m water depth) water masses might be the place of mixing processes of laterally-advected valves from the shelf (where benthic diatoms predominantly thrive; Andrews, 1981; Round et al., 1990). We propose that the shift in the species composition at the CBeu site in 2006 is associated with external forcings (e.g., AMO), rather than being due to the natural long-term variability of the diatom populations.
6 Conclusions
We highlight the significance of multiannual trap experiments on evaluating the impact of changing environmental conditions on primary producers in EBUEs. Although the trap-based diatom time-series at site CBeu is shorter than previously published long-term studies in the CC-EBUE, it is the only survey focusing on the continuous, long-term characterization of in-situ measured variations of diatom populations and, as such, delivers a unique perspective on seasonal and interannual productivity trends.
Our multiannual time-series confirms that a large portion of diatom valves captured at site CBeu is effectively displaced from their production area in waters overlying the uppermost Mauritanian shelf. The contribution of laterally transported valves to hemi- and pelagic export should be considered in the estimation of the marine cycle of major elements (C, DSi, P), the biological pump, and the paleoenvironmental signal preserved in downcore sediments off Mauritania. The lateral transport scenario applies to other EBUEs and may help to explain the formation of deep-water organic carbon depocenters in the geological record (e.g., Gallego-Torres et al., 2014).
Understanding the degree of interannual variability in the Mauritania upwelling ecosystem is fundamental on predicting future changes of primary productivity along the CC-EBUE as well in other EBUEs. Continuously conducted, multiyear time-series trap experiments –as those currently performed off Mauritania (Fischer et al., 2016; Fischer et al., 2019; Romero et al., 2020; Romero et al., 2021)– provide a reliable observational basis on the occurrence of short- and long-lasting variations of populations in response to key environmental forcings response. Our multiannual dataset is useful for model experiments on phytoplankton dynamics in low- and mid-latitude EBUEs and could also help in understanding the potential impact of population shifts in the marine biological pump.
Data availability statement
The datasets presented in this study can be found in online repositories. The names of the repository/repositories and accession number(s) can be found below: https://doi.pangaea.de/10.1594/PANGAEA.948026.
Author contributions
OR devised the study, collected the data, and wrote the manuscript. SR performed the statistical analysis. Both authors contributed to interpretation and discussion of results. All authors contributed to the article and approved the submitted version.
Funding
S. Ramondenc was supported by funding from the internal AWI program "INternational Science Program for Integrative Research in Earth Systems" (INSPIRES) during the manuscript preparation. The long-term funding by the German Research Foundation (DFG) through SFB 261, the Research Center Ocean Margins (RCOM) and the current MARUM Excellence Cluster “The Ocean in the Earth System” (University of Bremen, Bremen, Germany) made this study possible.
Acknowledgments
We are greatly indebted to the masters and crews of the RVs Meteor, MS Merian, Polarstern and Poseidon for several research expeditions off Mauritania. Much appreciated is the help of the RV Poseidon headquarters at Geomar (K. Lackschewitz, Kiel, Germany) during the planning phases of these research expeditions and the support by the German, Moroccan and Mauritanian authorities. The Institut Mauretanien de Recherches Océanographiques et des Pêches at Nouadhibou (Mauritania) is acknowledged for its support and help in getting the necessary permissions to perform our ongoing multiyear trap experiments in Mauritanian coastal waters. G. Ruhland, N. Nowald and M. Klann (MARUM, Bremen) were responsible for the mooring deployments and home lab work. Comments and suggestions by the two reviewers are greatly appreciated.
Conflict of interest
The authors declare that the research was conducted in the absence of any commercial or financial relationships that could be construed as a potential conflict of interest.
Publisher’s note
All claims expressed in this article are solely those of the authors and do not necessarily represent those of their affiliated organizations, or those of the publisher, the editors and the reviewers. Any product that may be evaluated in this article, or claim that may be made by its manufacturer, is not guaranteed or endorsed by the publisher.
Supplementary material
The Supplementary Material for this article can be found online at: https://www.frontiersin.org/articles/10.3389/fmars.2022.1006345/full#supplementary-material
References
Abrantes F., Meggers H., Nave S., Bollman J., Palma S., Sprengel C., et al. (2002). Fluxes of micro-organisms along a productivity gradient in the canary islands region (29°N): implications for paleoreconstructions. Deep Sea Res. II 49, 3599–3629. doi: 10.1016/S0967-0645(02)00100-5
Alheit J., Licandro P., Coombs S., Garcia A., Giráldez A., Santamaría M. T. G., et al. (2014). Atlantic Multi-decadal oscillation (AMO) modulates dynamics of small pelagic fishes and ecosystem regime shifts in the eastern north and central Atlantic. J. Mar. Syst. 133, 88–102. doi: 10.1016/j.jmarsys.2014.02.005
Andrews G. W. (1981). “Revision of the diatom genus delphineis and morphology of delphineis surirella (Ehrenberg) g. w. andrews, n. comb.” in Proc. sixth diatom symp. Eds. Ross R., Otto Koeltz K., (Koenigstein: Koeltz) 81–92.
Arístegui J., Barton E. C., Aílvarez-Salgado X. A., Santos A. M. P., Figueiras F. G., Kifani S., et al. (2009). Sub-Regional ecosystem variability in the canary current upwelling. Prog. Oceanogr. 83, 33–48. doi: 10.1016/j.pocean.2009.07.031
Bakun A. (1990). Global climate change and intensification of coastal ocean upwelling. Science 247, 198–201. doi: 10.1126/science.247.4939.198
Bakun A., Field D. B., Redondo-Rodriguez A., Weeks S. J. (2010). Greenhouse gas, upwelling-favorable winds, and the future of coastal ocean upwelling ecosystems. Global Change Biol. 16 (4), 1213–1228. doi: 10.1111/j.1365-2486.2009.02094.x
Buesseler K. O., Antia A. A., Chen M., Fowler S. W., Gardner W. D., Gustafsson O., et al. (2007). An assessment of the use of sediment traps for estimating upper ocean particle fluxes. J. Mar. Res. 65, 345–416. doi: 10.1357/002224007781567621
Chavez F. P., Messié M. (2009). A comparison of Eastern boundary upwelling ecosystems. Prog. Oceanogr. 83, 80–96. doi: 10.1016/j.pocean.2009.07.032
Cooley S., Schoeman D., Bopp L., Boyd P., Donner S., Ghebrehiwet D. Y., et al. (2022). “Oceans and coastal ecosystems and their services”, in climate change 2022: Impacts, adaptation and vulnerability. contribution of working group II to the sixth assessment report of the intergovernmental panel on climate change. Ed. Pörtner H.-O. (Cambridge, UK and New York, NY, USA: Cambridge University Press), 379–550. doi: 10.1017/9781009325844.005
Cropper T. E., Hanna E., Bigg G. R. (2014). Spatial and temporal seasonal trends in coastal upwelling off Northwest Africa 1981–2012. Deep Sea Res. I 86, 94–111. doi: 10.1016/j.dsr.2014.01.007
Crosta X., Romero O. E., Ther O., Schneider R. R. (2012). Climatically-controlled siliceous productivity in the eastern gulf of Guinea during the last 40000yr. Clim. Past 8, 415–431. doi: 10.5194/cp-8-415-2012
Dijkstra H. A. (2013). Nonlinear climate dynamics (Cambridge: Cambridge University Press), 1–357. doi: 10.1017/CBO9781139034135
ERDDAP. Available at: https://oceanview.pfeg.noaa.gov/products/upwelling/bakunhttp://coastwatch.pfeg.noaa.gov/erddap/griddap/erdlasFnWPr.htmlhttps://coastwatch.pfeg.noaa.gov/erddap/griddap/erdlasFnWind20_LonPM180.html (Accessed Accesed Febraury 1st 2022).
Fischer G., Reuter C., Karakaş G., Nowald N., Wefer G. (2009). Offshore advection of particles within the cape blanc filament, Mauritania: Results from observational and modelling studies. Prog. Oceanogr. 83, 322–330. doi: 10.1016/j.pocean.2009.07.023
Fischer G., Romero O. E., Merkel U., Donner B., Iversen M., Nowald N., et al. (2016). Deep ocean mass fluxes in the coastal up- welling off Mauritania from 1988 to 2012: variability on seasonal to decadal timescales. Biogeosciences 13, 3071–3090. doi: 10.5194/bg-13-3071-2016
Fischer G., Romero O. E., Toby E., Iversen M., Donner B., Mollenhauer G., et al. (2019). Changes in the dust-influenced biological carbon pump in the canary current system: Implications from a coastal and an offshore sediment trap record off cape blanc, Mauritania. Global Biogeochem. Cy. 33, 1100–1128. doi: 10.1029/2019GB006194
Friese C. A., van Hateren J. A., Vogt C., Fischer G., Stuut J.-B. W. (2017). Seasonal provenance changes in present-day Saharan dust collected in and off Mauritania. Atmos. Chem. Phys. 17, 10163–10193. doi: 10.5194/acp-17-10163-2017
Gabric A. J., Garcia L., Van Camp L., Nykjaer L., Eifler W., Schrimpf W. (1993). Offshore export of shelf production in the cape blanc (Mauritania) giant filament as derived from coastal zone color scanner imagery. J. Geophys. Res. 98, 4697–4712. doi: 10.1029/92JC01714
Gallego-Torres D., Romero O. E., Martínez-Ruiz F., Kim J.-H., Ortega-Huertas M. (2014). Rapid bottom-water circulation changes during the last glacial cycle in the coastal low-latitude NE Atlantic. Quat. Res. 81 (2), 330–338.
Gómez-Gesteira M., De Castro M., Álvarez I., Lorenzo M. N., Gesteira J. L. G., Crespo A. J. C. (2008). Spatio-temporal upwelling trends along the canary upwelling system, (1967–2006). Ann. N. Y. Acad. Sci. 1146, 320–337. doi: 10.1196/annals.1446.004
Hagen E. (2001). Northwest African Upwelling scenario. Oceanol. Acta 24, S113–S128. doi: 10.1016/S0399-1784(00)01110-5
Hasle G. A., Syvertsen E. E. (1996). “Marine diatoms”, in Identifying marine diatoms and dinoflagellates. Ed. Thomas C. (San Diego, CA: Academic Press, Inc), 1–385.
Helmke P., Romero O. E., Fischer G. (2005). Northwest African Upwelling and its effect on off-shore organic carbon export to the deep sea. Global Biogeochem. Cy. 19, GB4015. doi: 10.1029/2004GB002265
Karakaş G., Nowald N., Blaas M., Marchesiello P., Frickenhaus S., Schlitzer R. (2006). High-resolution modeling of sediment erosion and particle transport across the northwest African shelf. J. Geophys. Res. 111, C06025. doi: 10.1029/2005JC003296
Karakaş G., Nowald N., Schäfer-Neth C., Iversen M., Barkmann W., Fischer G., et al. (2009). Impact of particle aggregation on vertical fluxes of organic matter. Prog. Oceanogr. 83, 331–341. doi: 10.1016/j.pocean.2009.07.047
Kremling K., Lentz U., Zeitzschell B., Schulz-Bull D. E., Duinker J. C. (1996). New type of time-series sediment trap for the reliable collection of inorganic and organic trace chemical substances. Rev. Sci. Instrum. 67, 4360–4363. doi: 10.1063/1.1147582
Lathuilière C., Echevin V., Levy M. (2008). Seasonal and intraseasonal surface chlorophyll-a variability along the north-west African coast. J. Geophys. Res. Oceans 13, C05007. doi: 10.1029/2007JC004433
Marcello J., Hernández-Guerra A., Eugenio F., Fonte A. (2011). Seasonal and temporal study of the northwest African upwelling system. Int. J. Remote Sens. 32 (7), 1843–1859. doi: 10.1080/01431161003631576
Meunier T., Barton E. D., Barreiro B., Torres R. (2012). Upwelling filaments off cape blanc: interaction of the NW African upwelling current and the cape Verde frontal zone eddy field? J. Geophys. Res. Oceans 117, C8, C08031. doi: 10.1029/2012JC007905
Mittelstaedt E. (1983). The upwelling area off Northwest Africa – a description of phenomena related to coastal upwelling. Prog. Oceanogr. 12, 307–331. doi: 10.1016/0079-6611(83)90012-5
Mittelstaedt E. (1991). The ocean boundary along the northwest African coast: Circulation and oceanographic properties at the sea surface. Prog. Oceanogr. 26, 307–355. doi: 10.1016/0079-6611(91)90011-A
Narayan N., Paul A., Mulitza S., Schulz M. (2010). Trends in coastal upwelling intensity during the late 20th century. Ocean Sci. 6, 815–823. doi: 10.5194/os-6-815-2010
Nave S., Freitas P., Abrantes F. (2001). Coastal upwelling in the canary island region: spatial variability reflected by the surface sediment diatom record. Mar. Micropaleontol. 42, 1–23. doi: 10.1016/S0377-8398(01)00008-1
Pardo P., Padiín X., Gilcoto M., Farina-Busto L., Peírez F. (2011). Evolution of upwelling systems coupled to the long term variability in sea surface temperature and ekman transport. Clim. Res. 48, 231–246. doi: 10.3354/cr00989
Pelegrí J. L., Marrero-Díaz A., Ratsimandresy A. W. (2006). Nutrient irrigation of the north Atlantic. Prog. Oceanogr. 70, 366–406. doi: 10.1016/j.pocean.2006.03.018
Pelegrí J. L., Peña-Izquierdo J., Machín F., Meiners C., Presas-Navarro C. (2017). “Oceanography of the cape Verde basin and Mauritanian slope waters”, in Deep-Sea ecosystems off Mauritania, research of marine biodiversity and habitats in the Northwest African margin. Ed. Ramos A., et al (Springer Dorfrecht), 119–153. doi: 10.1007/978-94-024-1023-5_3
Pezzulli S., Stephenson D. B., Hannachi A. (2005). The variability of seasonality. J. Clim. 18 (1), 71–88. doi: 10.1175/JCLI-3256.1
Pradhan Y., Lavender S. J., Hardman-Mountford N. J., Aiken J. (2006). Seasonal and inter-annual variability of chlorophyll-a concentration in the Mauritanian upwelling: Observation of an anomalous event during 1998–1999. Deep Sea Res. I 53, 1548–1559. doi: 10.1016/j.dsr2.2006.05.016
Rines J. E. B., Hargraves P. E. (1988). The Chaetoceros ehrenberg (Bacillariophyceae) flora of narrangansett bay, Rhode island, U.S.A. Bibl. Diatomol. 79, 196.
Romero O. E., Armand L. K. (2010). “Marine diatoms as indicators of modern changes in oceanographic conditions”, in The diatoms, applications for the environmental and earth sciences, 2nd ed. Eds. Smol J. P., Stoermer E. F. (Cambridge: Cambridge University Press), 373–400.
Romero O. E., Baumann K.-H., Zonneveld K. A. F., Donner B., Hefter J., Hamady B., et al. (2020). Flux variability of phyto- and zooplankton communities in the Mauritanian coastal upwelling between 2003 and 2008. Biogeosciences 17 (1), 187–214. doi: 10.5194/bg-5117-5187-2020
Romero O. E., Dupont L., Wyputta U., Jahns S., XXXG. Wefer G. (2003). Temporal variability of fluxes of eolian-transported freshwater diatoms, phytoliths, and pollen grains off cape blanc as reflection of land-atmosphere-ocean interactions in northwest Africa. J. Geophys. Res. 108, C5, 3153. doi: 10.1029/2000JC000375
Romero O. E., Fischer G. (2017). Shift in the species composition of the diatom community in the eutrophic Mauritanian coastal upwelling: Results from a multi-year sediment trap experiment, (2003 – 2010). Prog. Oceanogr. 159, 31–44. doi: 10.1016/j.pocean.2017.09.010
Romero O. E., Lange C. B., Fischer G., Treppke U. F., Wefer G. (1999a). “Variability in export production documented by downward fluxes and species composition of marine planktonic diatoms,” in Observations from the tropical and equatorial atlantic in the use of proxies in paleoceanography - examples from the south Atlantic. Eds. Fischer G., Wefer G. (Heidelberg: Springer Verlag Berlin), 365–392.
Romero O. E., Lange C. B., Swap R. J., Wefer G. (1999b). Eolian-transported freshwater diatoms and phytoliths across the equatorial Atlantic record temporal changes in Saharan dust transport patterns. J. Geophys. Res. 104, 3211–3222. doi: 10.1029/1998JC900070
Romero O. E., Lange C. B., Wefer G. (2002). Interannual variability, (1988-1991) of siliceous phytoplankton fluxes off northwest Africa. J. Plank. Res. 24 (10), 1035–1046. doi: 10.1093/plankt/1024.1010.10352002
Romero O. E., Ramondenc S., Fischer G. (2021). A 2-decade, (1988–2009) record of diatom fluxes in the Mauritanian coastal upwelling: impact of low-frequency forcing and a two-step shift in the species composition. Biogeosciences 18 (5), 1873–1891. doi: 10.5194/bg-18-1873-2021
Romero O. E., Rixen T., Herunadi B. (2009a). Effects of hydrographic and climatic forcing on diatom production and export in the tropical southeastern Indian ocean. Mar. Ecol. Progr. Ser. 384, 69–82. doi: 10.3354/meps08013
Romero O. E., Thunell R. C., Astor Y., Varela R. (2009b). Seasonal and interannual dynamics in diatom production in the cariaco basin, Venezuela. Deep Sea Res. I 56 (4), 571–581. doi: 10.1016/j.dsr.2008.1012.1005
Round F. E., Crawford R. M., Mann D. G. (1990). The diatoms (Cambridge: Cambridge University Press).
Sancetta C., Calvert S. E. (1988). The annual cycle of sedimentation in saanich inlet, British Columbia: implications for the interpretation of diatom fossil assemblages. Deep Sea Res. 35, 71–90. doi: 10.1016/0198-0149(88)90058-1
Schrader H.-J., Gersonde R. (1978). “Diatoms and silicoflagellates,” in Micropaleontological counting methods and techniques – an exercise on an eight meter section of the lower pliocene of capo rosello, Sicily. Eds. Zachariasse W. J., Riedel W. R., Sanfilippo A., Schmidt R. R., Brolsma M. J., Schrader H., et al (Utrecht 17: Utrecht Micropaleontological Bulletin), 129–176.
Tréguer P. J., de la Rocha C. L. (2013). The world ocean silica cycle. Annu. Rev. Mar. Sci. 5 (1), 477–501. doi: 10.1146/annurev-marine-121211-172346
Varela R.I. Á., Santos F., de Castro M., Gómez-Gesteira M. (2015). Has upwelling strengthened along worldwide coasts over 1982-2010? Sci. Rep. 5, 10016. doi: 10.1038/srep10016
Versteegh G. J. M., Zonneveld K. A. F., Hefter J., Romero O. E., Fischer G., Mollenhauer G. (2022). Performance of temperature and productivity proxies based on long-chain alkane-1, mid-chain diols at test: a 5-year sediment trap record from the Mauritanian upwelling. Biogeosciences 19 (5), 1587–1610. doi: 10.5194/bg-19-1587-2022
Wang C., Zhang L. (2013). Multidecadal ocean temperature and salinity variability in the tropical north Atlantic: Linking with the AMO, AMOC, and subtropical cell. J. Climate. 26, 6137–6162. doi: 10.1175/JCLI-D-12-00721.1
Zeeberg J., Corten A., Tjoe-Awie P., Coca J., Hamady B. (2008). Climate modulates the effects of Sardinella aurita fisheries off Northwest Africa. Fish. Res. 89, 65–75. doi: 10.1016/j.fishres.2007.08.020
Keywords: Canary Current, coastal upwelling, diatoms, Eastern Boundary Upwelling Ecosystems, Mauritania, time-series, northwest Africa, particle fluxes
Citation: Romero OE and Ramondenc S (2022) A 17-year time-series of diatom populations‘ flux and composition in the Mauritanian coastal upwelling. Front. Mar. Sci. 9:1006345. doi: 10.3389/fmars.2022.1006345
Received: 29 July 2022; Accepted: 16 September 2022;
Published: 03 October 2022.
Edited by:
Alex J. Poulton, Heriot-Watt University, United KingdomReviewed by:
Claire Widdicombe, Plymouth Marine Laboratory, United KingdomWei-dong Zhai, Southern Marine Science and Engineering Guangdong Laboratory, China
Copyright © 2022 Romero and Ramondenc. This is an open-access article distributed under the terms of the Creative Commons Attribution License (CC BY). The use, distribution or reproduction in other forums is permitted, provided the original author(s) and the copyright owner(s) are credited and that the original publication in this journal is cited, in accordance with accepted academic practice. No use, distribution or reproduction is permitted which does not comply with these terms.
*Correspondence: Oscar E. Romero, b3JvbWVyb0B1bmktYnJlbWVuLmRl