 Tong Wang
 Toshio Suga
 Shinya Kouketsu
- 1Department of Geophysics, Graduate School of Science, Tohoku University, Sendai, Japan
- 2Research Institute for Global Change, Japan Agency for Marine-Earth Science and Technology, Yokosuka, Japan
The density-compensated salinity anomalies (spiciness anomalies) in the upper North Pacific were investigated using Argo float profiles during 2004–2018. The freshening of the subtropical thermocline was found within the Central Mode Water (CMW) and the North Pacific Intermediate Water (salinity minimum). Meanwhile, the increase of salinity was found in the lighter layer within the North Pacific Tropical Water (salinity maximum). The interannual and longer spiciness anomalies were interpreted with three-dimensional evolutions and were linked to the fate of three mode waters (i.e., Subtropical Mode Water (STMW), Eastern Subtropical Mode Water (ESTMW), and CMW) for the first time. In the STMW, the salinity was dominated by a quasi-decadal variability, which was consistent with the KE variability with a 1-year lag, and did not show rapid freshening. In the CMW, the salinity decreased with a quasi-decadal variability, which was weaker and out of the phase compared with the STMW. In the ESTMW, the salinity was dominated by year-to-year variability. The spiciness anomalies originated mainly in the outcrop region of the isopycnals, where they were accompanied by the formation and the subduction of the mode waters. They also propagated and decayed downstream the geostrophic currents. However, a few of the interannual anomalies found in the northern part of the CMW were almost dampened before their spread further south. In addition, some anomalies in the ESTMW appeared and intensified without a connection to the mixed layer. These anomalies occurred far from the outcrop line, suggesting these were caused likely by salt fingering associated with the modification of the mode waters. Furthermore, the propagation of the spiciness anomalies in the western to the central subtropics was significantly faster than the geostrophic current and inclined to the inner side of streamlines. These indicated the transport by eddies in addition to the mean geostrophic currents.
1 Introduction
The thermohaline variations in an ocean involves two dynamics, which are the vertical displacement of isopycnals and the density-compensated temperature and salinity anomalies (Bindoff and McDougall, 1994; Schneider et al., 1999). The former is governed by planetary wave dynamics. Meanwhile, the latter is advected like a passive tracer and often referred to as spiciness anomaly; spiciness is a variable used to describe the potential temperature and salinity of sea water on a given isopycnal surface, being high (low) for warm (cold) and salty (fresh) water (Munk, 1981).
Since first hypothesized by Gu and Philander (1997), various modeling studies (Nonaka and Xie, 2000; Schneider, 2000; Yeager and Large, 2004; Luo, 2005; Nonaka and Sasaki, 2007; Furue et al., 2018) have demonstrated that spiciness anomalies, which were generated in the subtropics, were subducted in the thermocline and propagated to the equatorial Pacific. These anomalies play a vital role in climate variability through upwelling.
Despite the importance suggested via modeling studies, the observational evidences of spiciness anomalies have been limited mainly due to insufficient in situ observations before the 2000s. In the North Pacific, the basin-wide network of expendable bathy-thermograph (XBT) observations detected decadal temperature signals, which propagated from the subtropics to the tropics of the North Pacific (Schneider et al., 1999; Zhang and Liu, 1999). However, without salinity observations, these studies were unable to separate the density-compensated spiciness anomalies from the temperature anomalies that were caused by wave dynamics. Repeat hydrographic data have revealed spiciness anomalies in the thermoclines within the North Pacific Tropical Water (NPTW) (Suga et al., 2000) and Subtropical Mode Water (STMW) (Oka et al., 2017), and near Hawaii (Lukas, 2001; Lukas and Santiago-Mandujano, 2008). Nevertheless, the anomalies have been limited to specific sections or small areas; hence, they cannot provide a three-dimensional (3-D) description of the evolution of spiciness anomalies.
The Argo program has provided a global dataset with spatially and temporally unbiased sampling since the early 2000s (Roemmich et al., 2009). The program provided the first description of the large-scale 3-D evolution of spiciness anomalies. Sasaki and co-workers (Sasaki et al., 2010) were the first to detect a negative spiciness anomaly at σθ = 25.0–25.5 during 2004–2008, which originated from the eastern subtropical North Pacific and propagated southwestward with a speed that was consistent with the mean geostrophic velocity. Other research groups (Kolodziejczyk and Gaillard, 2012; Li et al., 2012) have detected similar propagations from both the northeastern and the southeastern Pacific. They have also found the spiciness anomalies diffused along the pathways and reached the equator, which proves the important role of spiciness anomalies as suggested by their modeling studies. In addition, propagations of spiciness anomalies were observed in the NPTW at σθ = ~24 (Katsura et al., 2013), the South Pacific Tropical Water at σθ = 24.5 (Zhang and Qu, 2014), the Subtropical South Atlantic at σθ = 26.3 (Kolodziejczyk et al., 2014), and the South Indian Ocean at σθ = 24.0–25.0 (Li and Wang, 2015).
Spiciness anomalies have been generated mainly in the formation regions of thermocline water masses by processes, such as air-sea interactions (Bindoff and McDougall, 1994), anomalous advection across the mean isopycnal spiciness fronts (Schneider, 2000), and diapycnal mixing across subducted isopycnals (Yeager and Large, 2004). In the North Pacific thermocline, there are three mode waters, which are characterized as water masses with nearly vertical homogeneity over a relatively large area (Hanawa and Talley, 2001). These are the STMW (Masuzawa, 1969), Eastern Subtropical Mode Water (ESTMW) (Hautala and Roemmich, 1998), and Central Mode Water (CMW) (Nakamura, 1996; Suga et al., 1997), which are located in the western part of the North Pacific subtropical gyre, eastern part of the North Pacific subtropical gyre, and just south of the Subarctic Front, respectively.
Mode waters are formed in deep mixed layers and capped by a seasonal thermocline in late winter and spring, respectively (Bingham, 1992). They are able to carry signals from the mixed layers and their formation regions to a permanent thermocline through subduction and to wider regions during their spreading, respectively, and in turn impact the mixed layer properties through reemergence (Hanawa and Sugimoto, 2004; Sugimoto, 2005) or obduction (Qiu and Huang, 1995; Endoh et al., 2006). Therefore, it is essential to investigate the spiciness anomalies in the three mode waters.
Previous observational studies in the upper North Pacific have concentrated mainly on spiciness anomalies in the tropics and the eastern subtropics that have a relationship with the variability of the ESTMW (Sasaki et al., 2010; Katsura, 2018). Meanwhile, the three-dimensional structure of STMW and CMW has not been sufficiently described. However, previous studies have suggested that both STMW and CMW present a variability in formation, distribution, and dissipation. In particular, STMW formation has interannual to decadal variations that are attributed to the variability in atmospheric forcing such as in wintertime monsoons (Hanawa, 1987; Suga and Hanawa, 1995; Taneda et al., 2000). Another topic of interest is the decadal variability in the STMW (Qiu and Chen, 2006; Qiu et al., 2007; Miyazawa et al., 2009; Oka et al., 2015; Cerovecki and Giglio, 2016), which is related to the decadal variability of the Kuroshio Extension (KE) system (Qiu and Chen, 2005; Qiu et al., 2014). Besides, the temperature of the CMW had decreased after the 1976/1977 regime shift, which was related to surface heat loss and Ekman transport associated with the intensification of westerlies (Yasuda and Hanawa, 1997). This change has been considered as a decadal variability of the CMW that were caused by Pacific Decadal Oscillation (PDO) (Mantua et al., 1997) according to numerical simulations (Ladd and Thompson, 2002; Hosoda et al., 2004). Large variability was also witnessed in 1988/1989 with increased temperature and salinity along the 180° repeat section only (Suga et al., 2003). In addition, mesoscale eddies have been shown to affect the formation and distribution of the STMW (Uehara et al., 2003; Pan and Liu, 2005; Nishikawa et al., 2010; Nishikawa et al., 2013) and the CMW (Qu et al., 2002; Oka et al., 2009; Kouketsu et al., 2012).
The aforementioned variabilities in the STMW and CMW processes raised the need to explore the consequent anomalies that occur in their properties and understand the spread of the anomalies. However, due to inadequate salinity observations before the Argo period, observational evidence of spiciness anomalies is insufficient. Oka and co-workers (Oka et al., 2017) have demonstrated the freshening trend and decadal variability of salinity in STMW; however, their investigation was only along the 137°E section. Meanwhile, Yan and co-workers used Argo observations (Yan et al., 2017) to detect a freshening trend at σθ = 24.5–25.4 in the eastern Luzon Strait during 2003–2012, which was traceable back to the northwestern subtropical outcrop region. However, the authors failed to mention its association with the STMW. In another study, Li and co-workers (Li et al., 2019) demonstrated a positive salinity trend in the upper 200 m and a freshening trend in the 200–600 m layer of the Pacific Ocean during 2005–2015. However, their study was on isobaths rather than isopycnals.
Here, we provide a comprehensive description of the spiciness anomalies and their propagation in the upper North Pacific, with focus on STMW, CMW, and ESTMW. This work that was based on Argo profiles was primarily on the neutral density (γ) coordinates for preserving water mass structures. By definition, the temperature and salinity anomalies on density surfaces are density-compensated, and we will only present the salinity anomalies on γ surfaces, which serve as proxies of spiciness anomalies. The data and methods used in this study are described in section 2. Meanwhile, the climatology of the upper North Pacific, the linear trend of salinity in the upper North Pacific and temporal variations of salinity in mode waters, the spatial evolutions of spiciness anomalies on core γ surfaces of the mode waters, the quantitation of propagation speeds of spiciness anomalies and comparison with geostrophic currents, and the vertical structure of the spiciness anomalies are described in sections 3.1, 3.2, 3.3, 3.4, and 3.5, respectively. We discussed the generation of the spiciness anomalies with the effects of meridional shift of the outcrop line, and the correlation of salinity with KE and Pacific Decadal Oscillation (PDO) (Mantua et al., 1997) in sections 4.1 and 4.2. Finally, we summarized the findings and raised the issues for future work in section 5.
2 Data and methods
2.1 Isopycnal surface data
The temperature and salinity profiles obtained via Argo profiling floats were used. The profiles were processed into the monthly 1° × 1° × 0.05 γ gridded data of salinity, potential temperature, and thickness following previous methods (Kouketsu et al., 2017), and were extended to 2018 (Argo, 2019). As the floats in the North Pacific only provide sufficient sampling since 2004, we focused on the period of 2004–2018. The total number of profiles used for each grid averaged over γ = 24.00–27.00 is shown in Figure 1A.
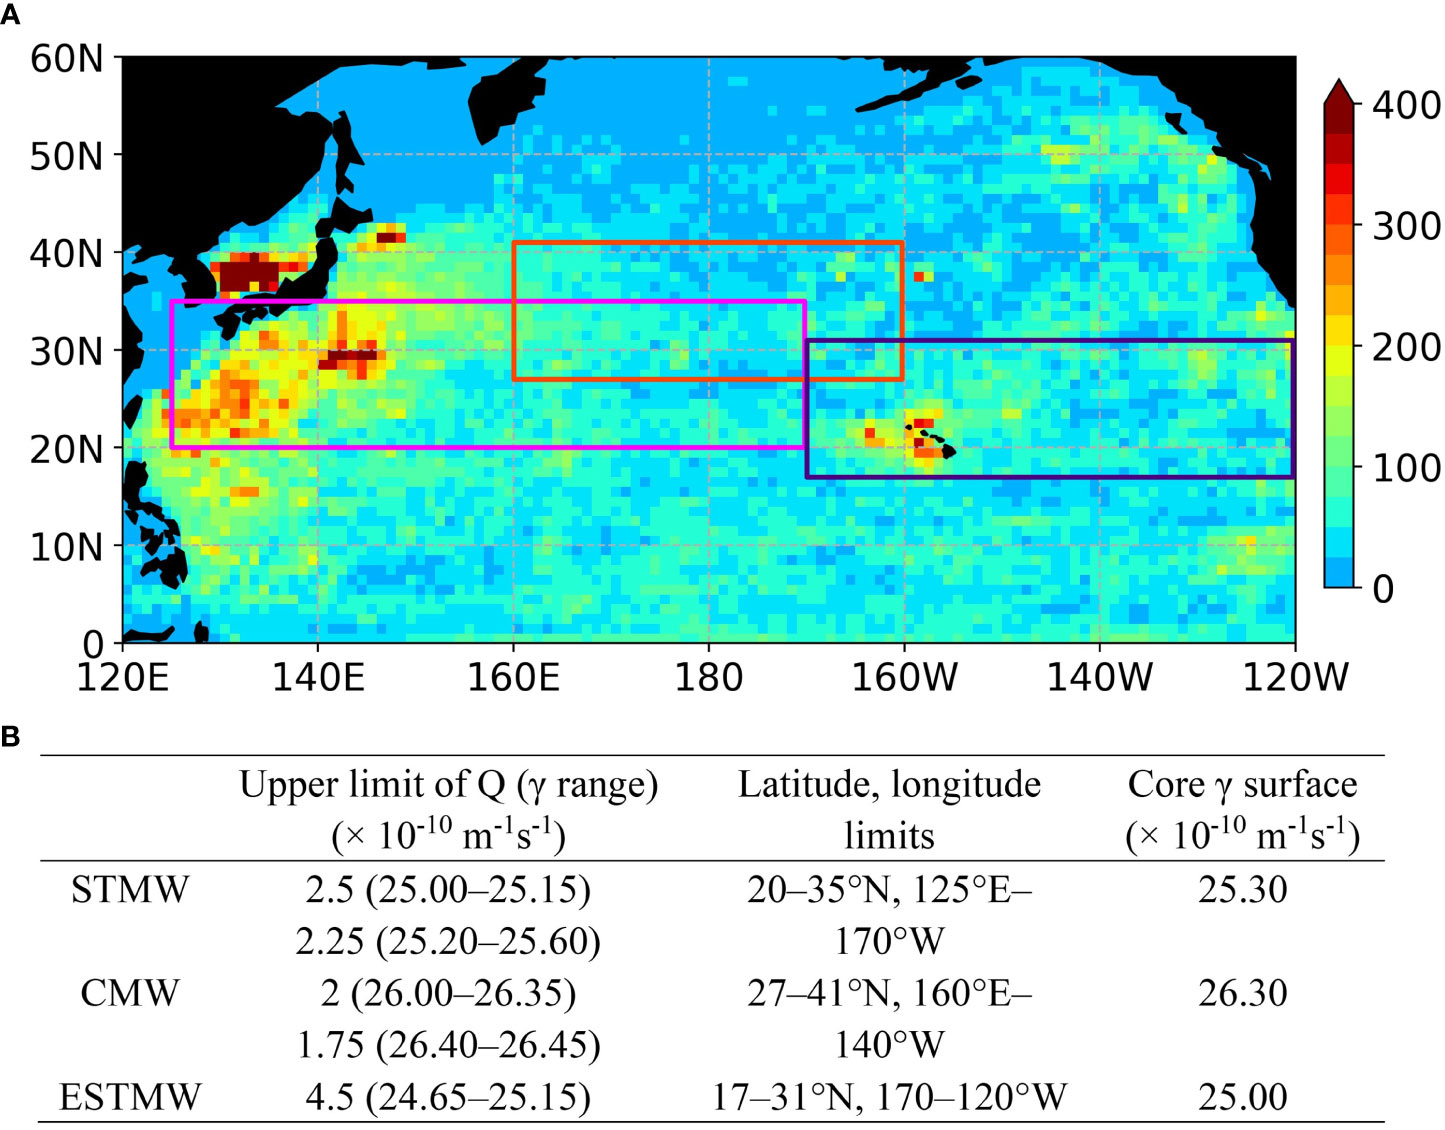
Figure 1 (A) Number of Argo profiles used in total during 2004–2018 for each 1° × 1° grid, averaged over γ = 24.00–27.00. Pink, red, and purple rectangle indicates the latitude and longitude limits for STMW, CMW, and ESTMW respectively. (B) Criteria for the mode waters used for the calculation in Section 3.2.2, 3.2.3, and 3.2.4.
Approximate calculations of geostrophic stream functions and velocities were conducted on γ surfaces following a previous work (McDougall and Klocker, 2010) with the use of GSW V3.0 library (TEOS-10). The calculations were more accurate than the more commonly used Montgomery stream functions (Montgomery, 1937) for isopycnal or neutral surfaces. The zero-velocity reference level was set at 1500 dbar.
The calculation of potential vorticity (Q) was based on Talley’s work (Talley, 1988), which neglected the relative vorticity as shown in equation 1.
Equation 1 was applied to γ coordinates to yield equation 2.
where, f is the Coriolis parameter. Δγ/Δz is calculated in the range of γ ± 0.025 and its thickness.
2.2 Mixed layer data
The mixed layer data set of Argo grid point value (MILA GPV) product was based on the Argo profiles. The mixed layer depth (MLD) was defined by a minimum thickness of either Δσθ = 0.125 kg/m3 or ΔT = 0.5°C from 10 dbar (Hosoda et al., 2010). In order to match the 1° × 1° isopycnal surface data, the mixed layer data were interpolated into 1° × 1° grids.
The outcrop line of a γ surface was defined by the contour where the averaged mixed layer neutral density, which was calculated from the averaged mixed layer temperature and salinity in MILA GPV, was equal to the specified γ value.
3 Results
3.1 Mean state
Before studying the water mass anomalies on neutral density (γ) surfaces, we first looked at the mean distributions of salinity and neutral density in the upper North Pacific during 2004–2018. The vertical distributions of climatology and the standard deviation of salinity are shown in Figure 2. A vertical salinity maximum at γ = 23–25 was observed in each region within 5–34°N (Figures 2A-C). The salinity maximum within 35–44°N was centered at γ = 25 and only existed west of 170°W (Figure 2D). Salinity variations were prominent within the vertical salinity maximum in 25–44°N, in the density range up to γ = 24.5 centered at 140°W in 25–44°N, and in the density range up to γ = 26.0 in the western to central parts of the gyre boundary (35–44°N, 140°E to 160°W). The layers were outcropping in the wintertime; thus, their large standard deviations reflected the large variability on sea surfaces. In addition, the above regions with large subsurface salinity variations were found close to the formation and distribution regions of CMW, STMW, and ESTMW.
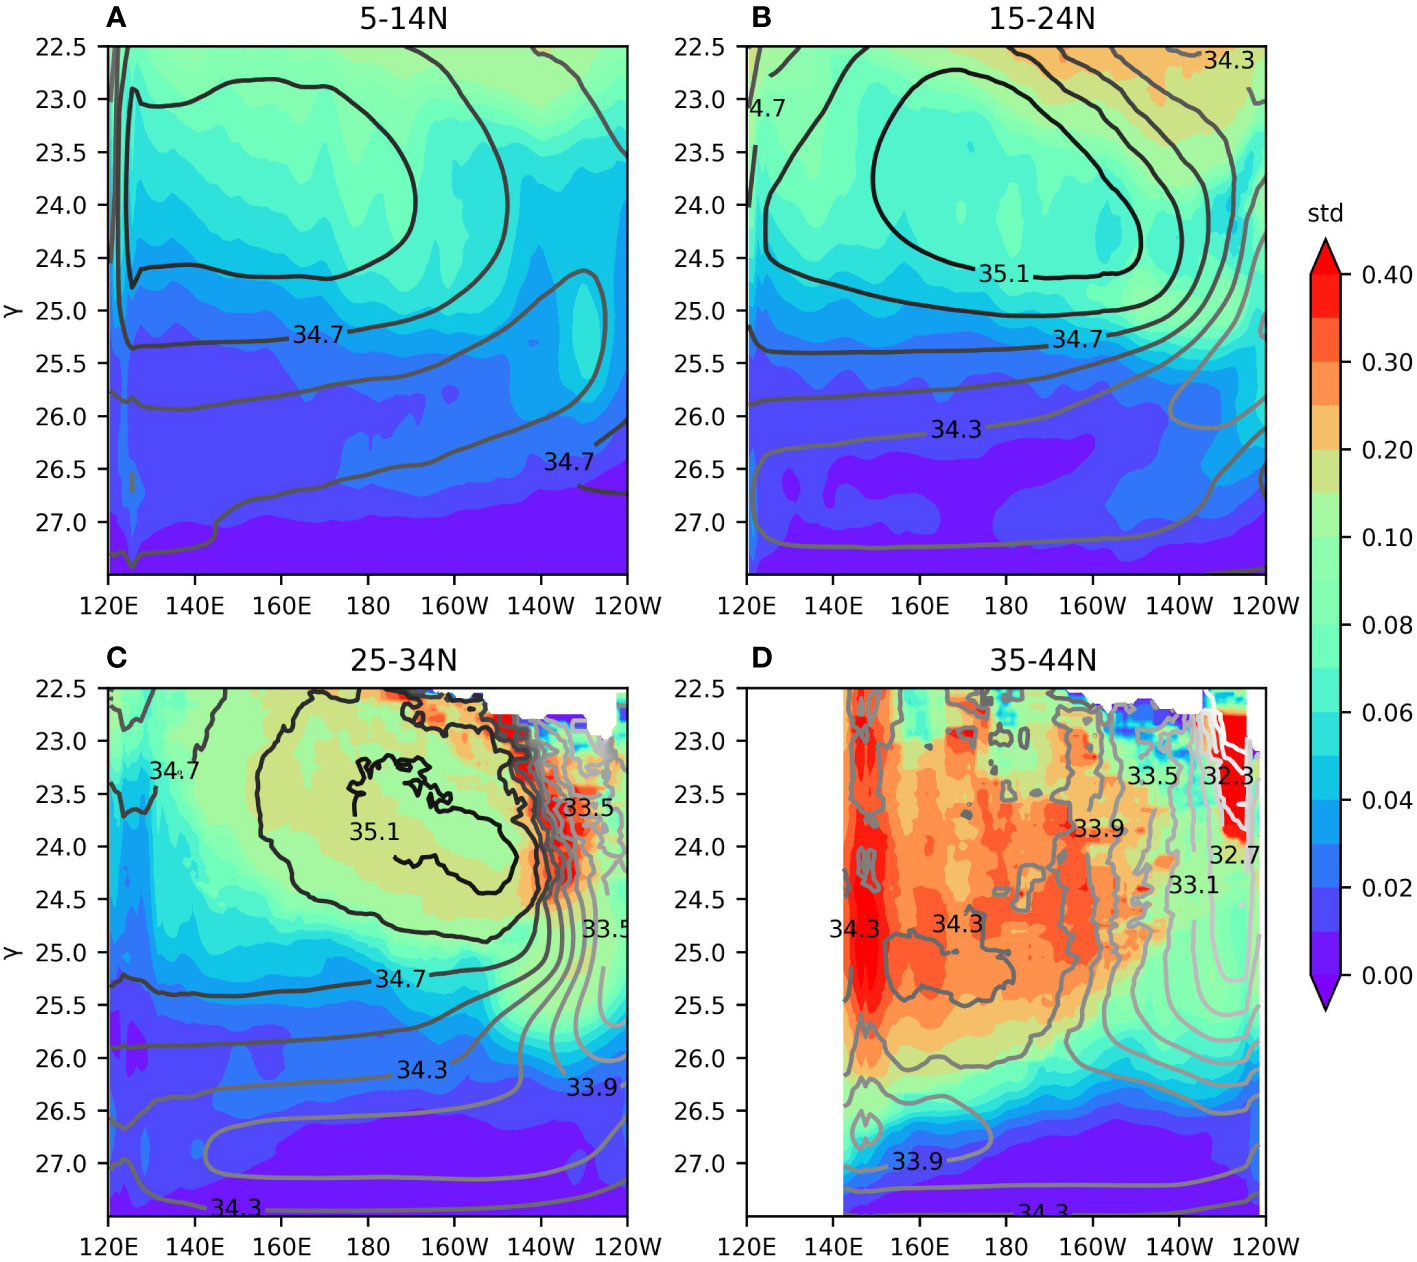
Figure 2 Climatology (contour) and standard deviation (color) of the salinity during 2004–2018 with respect to neutral density (unit = kg·m−3), which were averaged in (A) 5–14°N, (B) 15–24°N, (C) 25–34°N, and (D) 35–44°N. Contour interval is 0.2. The grids in the Sea of Japan are whitened in (D).
The criteria for water mass properties are often influenced by different periods or datasets; therefore, we defined the mode waters by their fundamental feature or a lateral minimum in potential vorticity (Q) (Hanawa and Talley, 2001).
Climatological potential vorticity values on selected γ surfaces are summarized in Figure 3. The lateral Q minimum at the northwestern corner of the subtropical gyre was recognizable from γ = 24.70 (Figure 3B) with a contour of Q < 2.5. The 2 × 10⁻¹⁰ m−1s−1 was recognizable from γ = 25.00 (Figure 3C) and 25.20 (Figure 3D). The lowest contour at Q < 1.5 × 10⁻¹⁰ m−1s−1 was found at γ = 25.30 (Figure 3E), which was centered at 29°N, 150°E. The Q minimum in the STMW spread eastward to the region of CMW continuously with the increase in γ; however, the separation of the low Q cores found between STMW and CMW was identified at γ = 25.60 (Figure 3F). In the CMW, Q < 2.00 × 10⁻¹⁰ m−1s−1 was found from γ = 26.00 (Figure 3H). The lowest contour with Q < 1.75 × 10⁻¹⁰ m−1s−1 was largest at γ = 26.30 (Figure 3J), which was centered at 35°N, 165°W. The Q minimum in the CMW extended southwestward with the increase in γ and merged with the tropical low Q at γ = 26.50 (Figure 3K). This was consistent with the extension of the low Q tongue described by Suga and co-workers (Suga et al., 2004). The ESTMW showed a higher Q than the STMW and CMW. Its Q minimum represented a clear separation with the western value on the 24.40–25.20 γ surfaces (Figures 3A-D). Q values of < 4.5 × 10⁻¹⁰ m−1s−1 were found on the 24.65–25.15 γ surfaces. The lowest contour with Q < 4 × 10⁻¹⁰ m−1s−1 was widest at γ = 25.00 and centered at 25°N, 140°W (Figure 3C).

Figure 3 Climatological potential vorticity values (Q) (unit = 10−10 m−1s−1) on surfaces γ = (A) 24.40, (B) 24.70, (C) 25.00, (D) 25.20, (E) 25.30, (F) 25.60, (G) 25.80, (H) 26.00, (I) 26.20, (J) 26.30, (K) 26.50, and (L) 26.60. Black contours are for Q = 1, 2, 3, 4, 5, 6, 8, and 10 × 10−10 m−1s−1. Colors in 1× 10⁻¹⁰ < Q < 3 × 10⁻¹⁰ m−1s−1 changed every 0.25 × 10⁻¹⁰ m−1s−1. The colors in 3 × 10⁻¹⁰ < Q < 5 × 10⁻¹⁰ m−1s−1 changed every 0.5 × 10⁻¹⁰ m−1s−1. White contours denote isopycnal geostrophic stream function that is relative to 1500 dbar with an interval of 1 m2s−2. Purple, pink, and red circle indicates the core of ESTMW, STMW, and CMW respectively.
The Q distribution in each month was much noisier; thus, it was difficult to find a continuous and clear boundary in some months. This was when the same Q criteria used by Suga and co-workers for mode water cores (Suga et al., 2004) or the one only for summertime (Sugimoto and Hanawa, 2007) were used. In the work of Toyama and Suga (Toyama and Suga, 2010), which used Argo data to calculate Q, a few of the low Q waters were mixed layer remnants or internal wave fluctuations on isopycnals. To reduce these disturbances and the artificial mixing created by interpolating data in outcropping, we fist choose relatively loose Q criteria on each month and γ surface. However, we only used grids that were within the widest low Q contour and excluded the grids outside. We also excluded the grids with depths that were shallower than the MLD. We tested various criteria for Q, γ, latitude, and longitude according to monthly Q distribution maps (not shown here). The most reasonable criteria that define the mode waters in this study are listed in Figure 1B.
The distributions of the detected mode waters were generally consistent with previous descriptions.
3.2 Temporal variations of salinity
3.2.1 Linear trend
The linear trends in salinity during 2004–2018 (Figure 4) were obtained by the least-squares method, with a modified Mann-Kendall test (Hamed and Rao, 1998) of significance on the 95% level. The most striking feature found was the significant large-scale freshening trend in the subsurfaces of subtropics on both isobars and isopycnals. Within 15–24°N, the trend was at 25.5–26.6 γ (about 200–500 dbar) west of 150°W (Figures 4B, F). Within 25–34°N, the trend was found within 25.6–26.8 γ (350–450 dbar) on all longitudes but with a separation near 140°W (Figures 4C, G). The magnitude of the freshening trend was stronger than −0.002/year (Figures 4B, C, F and G). The distribution on isobars of the subtropical freshening trend was deeper and thicker in the west than in the east and higher latitude than lower latitude. This corresponded to the distribution of γ surfaces on isobars, which supported the advantage of investigating salinity anomalies on γ instead of pressure coordinates. The subsurface freshening trend was connected to the mixed layer at 35–44°N in the central longitudes (150°E to 150°W), which is also an outcrop region of the isopycnals with much stronger signals. This suggested subsurface freshening in the subtropics that resulted from the subducted surface freshening at higher latitudes.
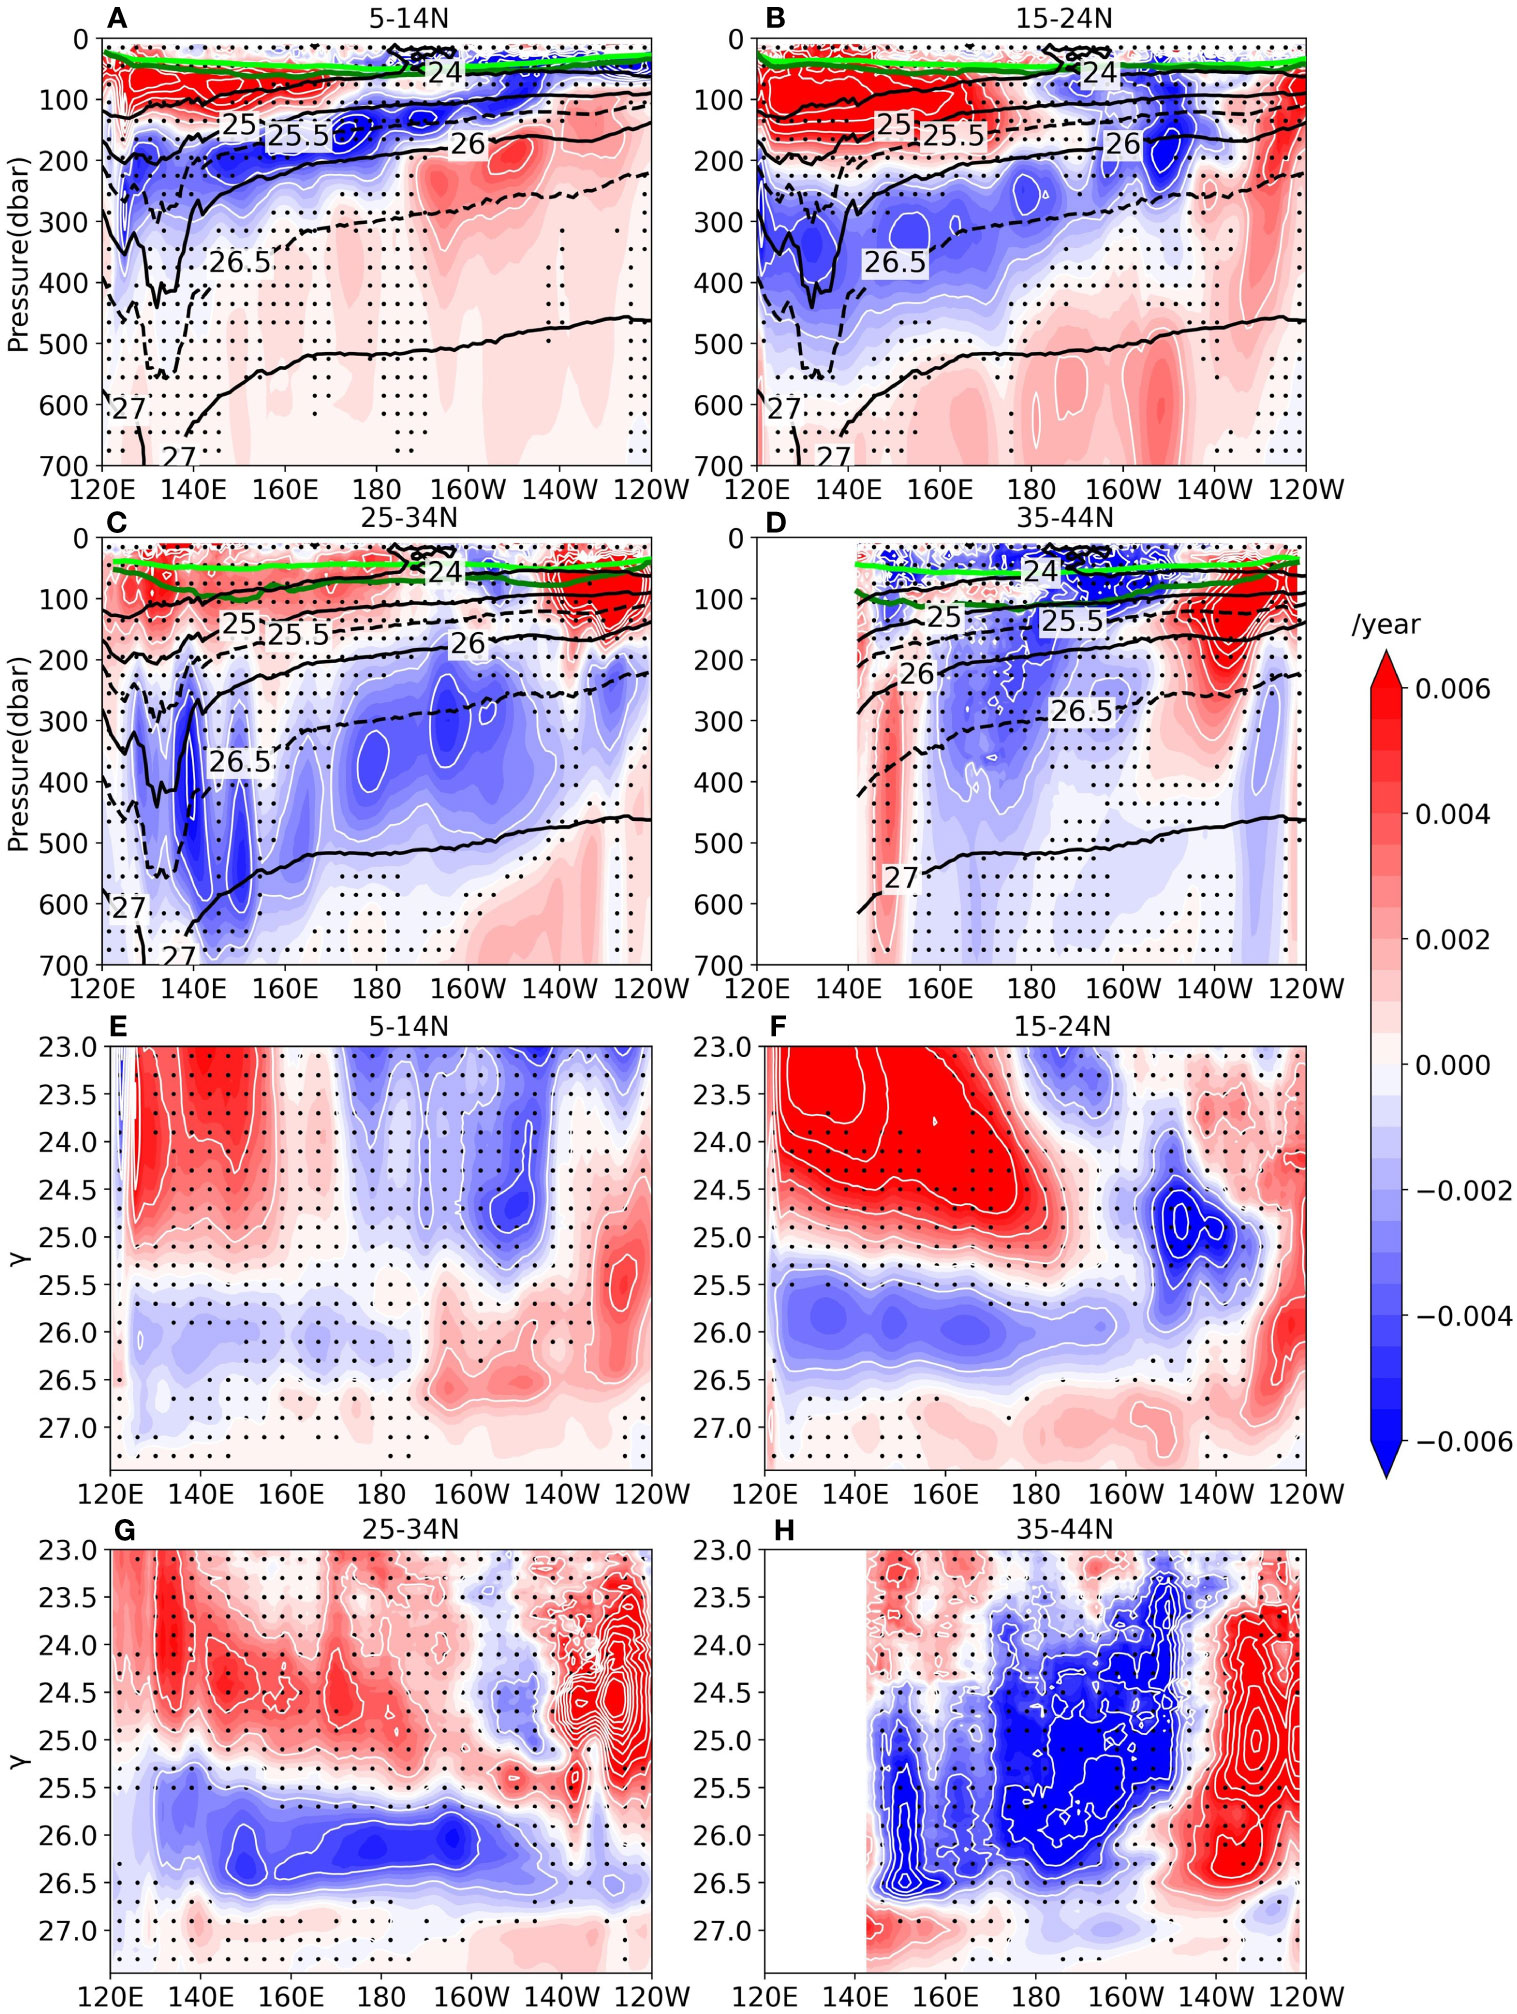
Figure 4 Linear trend of salinity (color and white contours were every 0.002) (unit = year−1) with respect to (A–D) pressure and (E–H) γ during 2004–18, which were averaged in (A) and (E) 5–14°N, (B) and (F) 15–24°N, (C) and (G) 25–34°N, and (D) and (H) 35–44°N. Stippled grids indicate where a trend was insignificant at 95% confidence level. In (A–D), the light and dark green lines represent all-season mixed layer depths and depths in February–March, respectively. The black contours indicate a climatological neutral density (unit = kg·m−3).
The density range of the freshening encompassed the full range of the CMW and the lighter part of the salinity minimum in the subtropics (Figures 2B, C), i.e., the North Pacific Intermediate Water (NPIW) (Talley, 1993). The density range of the freshening was consistent with the freshening detected dating back to the 1960s along hydrographic sections, which have σθ values in the range of 25.5–27.0 along the 137°E north of 10°N during 1967–2016 (Oka et al., 2017), between the main thermocline and NPIW north of 15°N along 137°E during 1967–2005 (Nakano et al., 2007), and in the NPIW along 24°N during the 1960s to 1985 (Wong et al., 2001). However, previous results with more recent starting time have suggested a lighter range in the significant freshening with σθ values of 25.0–26.0 near the Hawaii Ocean Time Series station (22°N, 158°W) during 1988–2001 (Lukas, 2001), σθ values of 25.0–26.0 along the 24°N that were comparison between historical and Argo data of 2003–2006 (Ren and Riser, 2010), σθ values of 25.0–26.2 along the 137°E north of 12°N during 1997–2016 (Oka et al., 2017), and from the sea surface to the subsurface salinity maximum along 137°E during 1992–2009 (Nan et al., 2015). Thus, there was a long-term freshening of the entire thermocline in the subtropics during 2004–2018 and possibly dating back to the 1960s. However, the rapid freshening of the upper thermocline, possibly since the 1990s, likely underwent a hiatus from 2004 to 2018.
In the western to the central longitudes at γ < 25 (p < 150 dbar) within 5–24°N and near the eastern boundary at γ < 25.5 (p < 150 dbar) within 25–44°N, a significant salinification trend that extended from the mixed layer to the upper thermocline was found over the subsurface freshening. The former coincided with the salinity maxima, i.e., the NPTW (Figure 2) (Cannon, 1966). The latter encompassed the northeastern part of the ESTMW. Previous studies have investigated the NPTW using hydrographic data that were mainly along 137°E and revealed that the salinity of the NPTW increased after the 1976/77 regime shift and decreased with decadal variations thereafter (Suga et al., 2000; Nakano et al., 2015; Nan et al., 2015; Oka et al., 2017). The recent increase in salinity during 1997–2016 was recently reported (Oka et al., 2017). The area with an amplitude that was stronger than 0.008/year occupied a large part of the salinification region. Under the freshening layer, there was also a positive but weak salinity trend within 5–34°N.
The above patterns in salinity trends that were derived from a recent and short period (2004–2018) were consistent with the long-term global trend in salinity patterns, which were observed in earlier and longer periods [i.e., 1950–2010 (Skliris et al., 2014), 1970–2005 (Helm et al., 2010), and 1960–2007 (Hosoda et al., 2009)]. The upper-ocean salinity maximum layer and the sea surface of its outcrop region in the subtropics became saltier, where evaporation dominates precipitation. Meanwhile, the intermediate salinity minimum and the sea surface of its outcrop region in high latitudes became fresher, where precipitation dominates evaporation. Since the trend patterns were observed on both isopycnals and isobars, they may provide the latest evidence for the enhancement of the hydrological cycle (Allen and Ingram, 2002; Held and Soden, 2006).
3.2.2 STMW
Salinity in the STMW was dominated by a quasi-decadal variability. Its seasonal variability was smaller compared to interannual or longer variability (Figure 5A). The peak and trough of the STMW salinity were in 2006 and 2010 with a difference of ~0.1, which was consistent with the clear freshening of the STMW during 2009–2010 (Sugimoto et al., 2013) and freshening of the northwestern Pacific at σθ = 24.5–25.4 during 2003–2012 (Yan et al., 2017). The linear trend observed during 2004–2018 was −0.002/year and failed the 95% significance test. This trend was consistent with that found during 1967–2016 along the 137°E section (Oka et al., 2017) and weaker than that found during 1997–2016 (−0.005/year) (Oka et al., 2017) and 1987–2012 (−0.004/year) (Nan et al., 2015) along the same section. Although it is difficult to separate the decadal variability from the peak to trough and the freshening trend in the considered 15-year period, the value of the linear trend obtained is in favor of a long-term weak freshening that was superimposed by a decadal variability. This contrasts with the more recent rapid freshening observed in previous studies. In addition, in the vertical diagram of salinity trends (Figure 4), the freshening in the density range of the STMW is not significant and lighter than the density range of significant freshening.
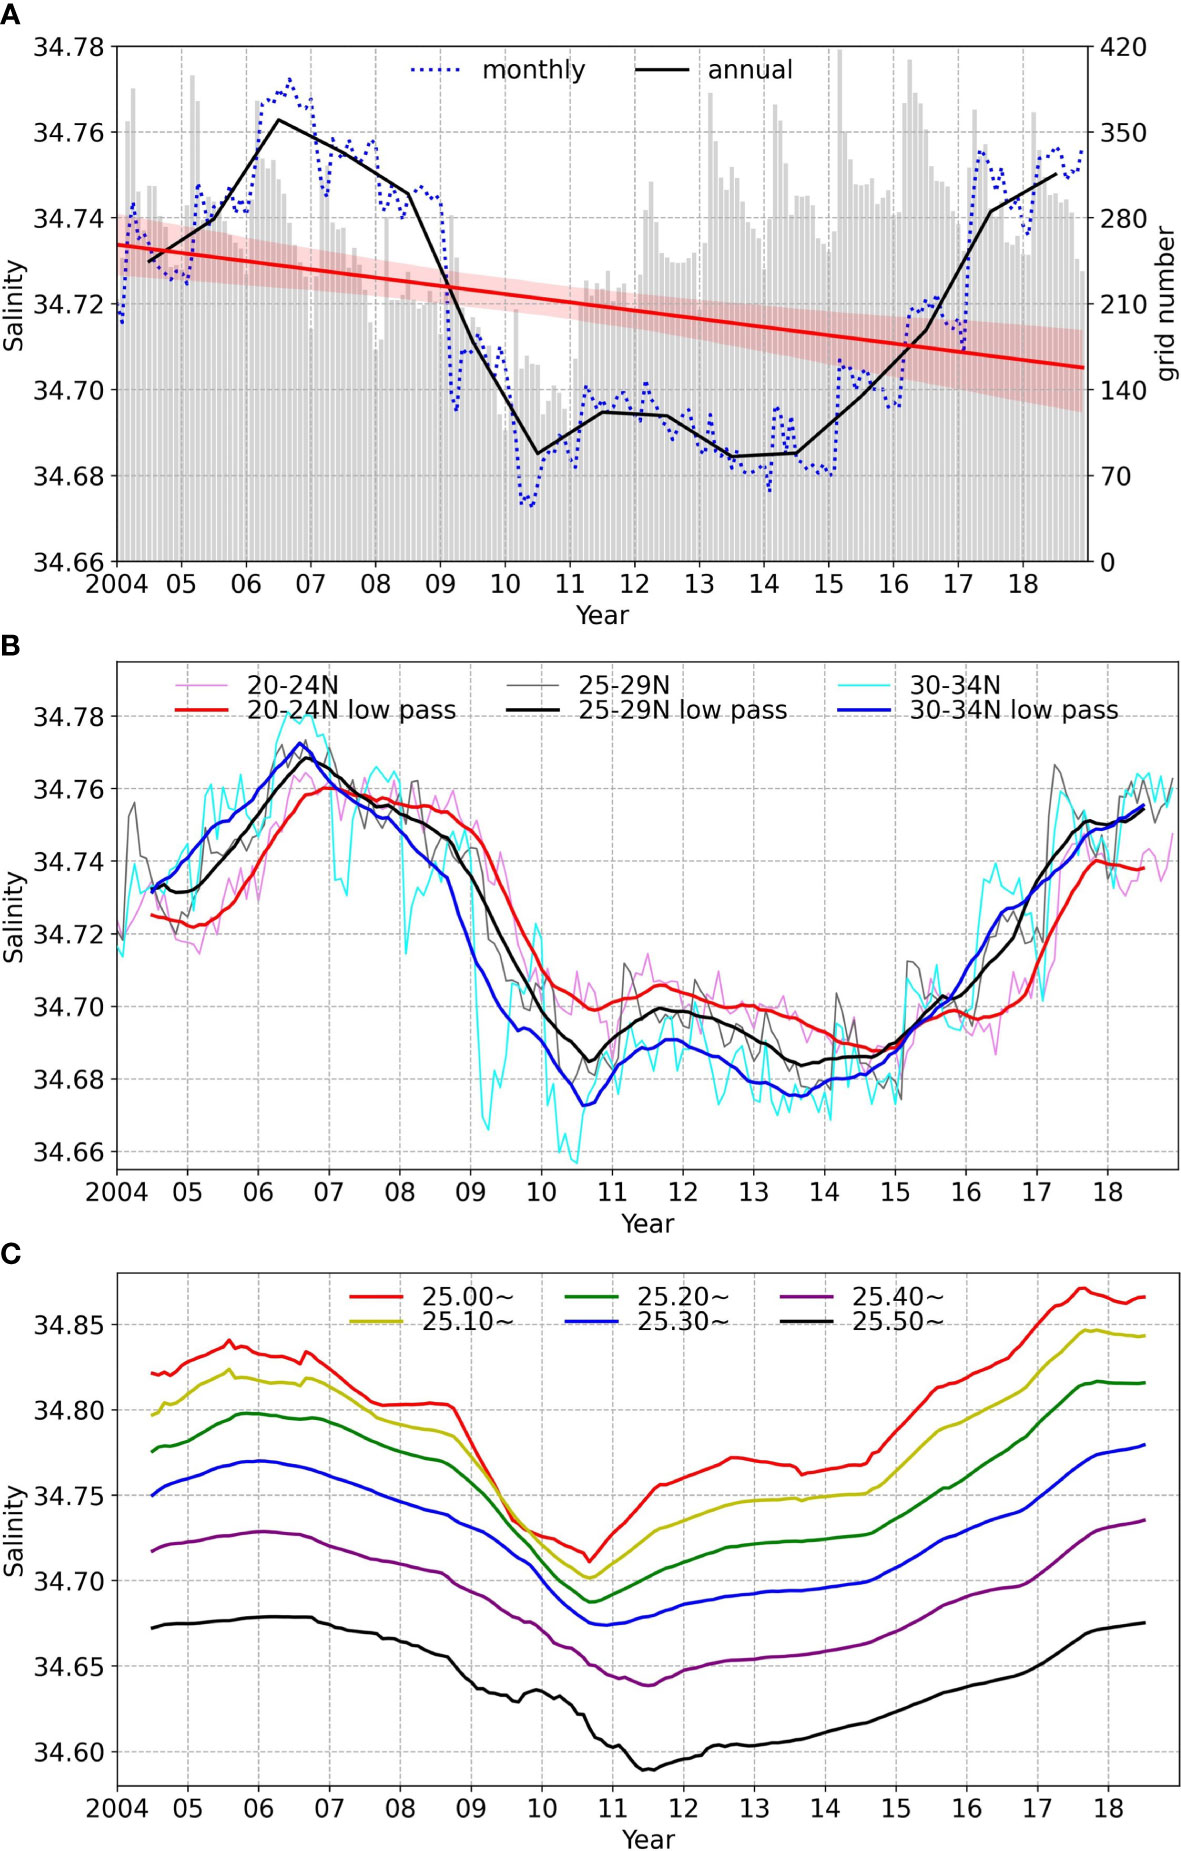
Figure 5 Time series of salinity in the STMW based on the criteria in Figure 1B. (A) Monthly (dotted blue), annual mean (solid black), and linear trend (solid red) with a 95% confidence interval (red band) of salinity. The values were weight-averaged at each grid by thickness of a γ surface. Gray bars represent the average number of 1°×1° grid, which were used on one γ surface. (B) Salinity weight-averaged by thickness in three latitude ranges. Pink (monthly) and red (12-month moving average) for 20–24°N, gray and black for 25–29°N, and light blue and blue for 30–35°N. (C) 12-month moving average salinity averaged on surfaces at γ = 25.00–25.05 (red), 25.10–25.15 (yellow), 25.20–25.25 (green), 25.30–25.35 (blue), 25.40–25.45 (purple), and 25.50–25.60 (black).
Compared to the northern and middle parts, the salinity in the southern part of the STMW showed smaller seasonal variations (Figure 5B), a smaller amplitude of the decadal cycle, and a delay of several months. These results suggest an STMW spreading away from its formation region by the subtropical gyre (Bingham, 1992). In addition, the spiciness anomalies were spread and dampened at the same time. Similar dampening of seasonal variations and delay of signals from the northern to the southern sides were also found in the CMW (Figure 6B) and ESTMW (Figure 7B); however, their consistencies are not as good as in the STMW.
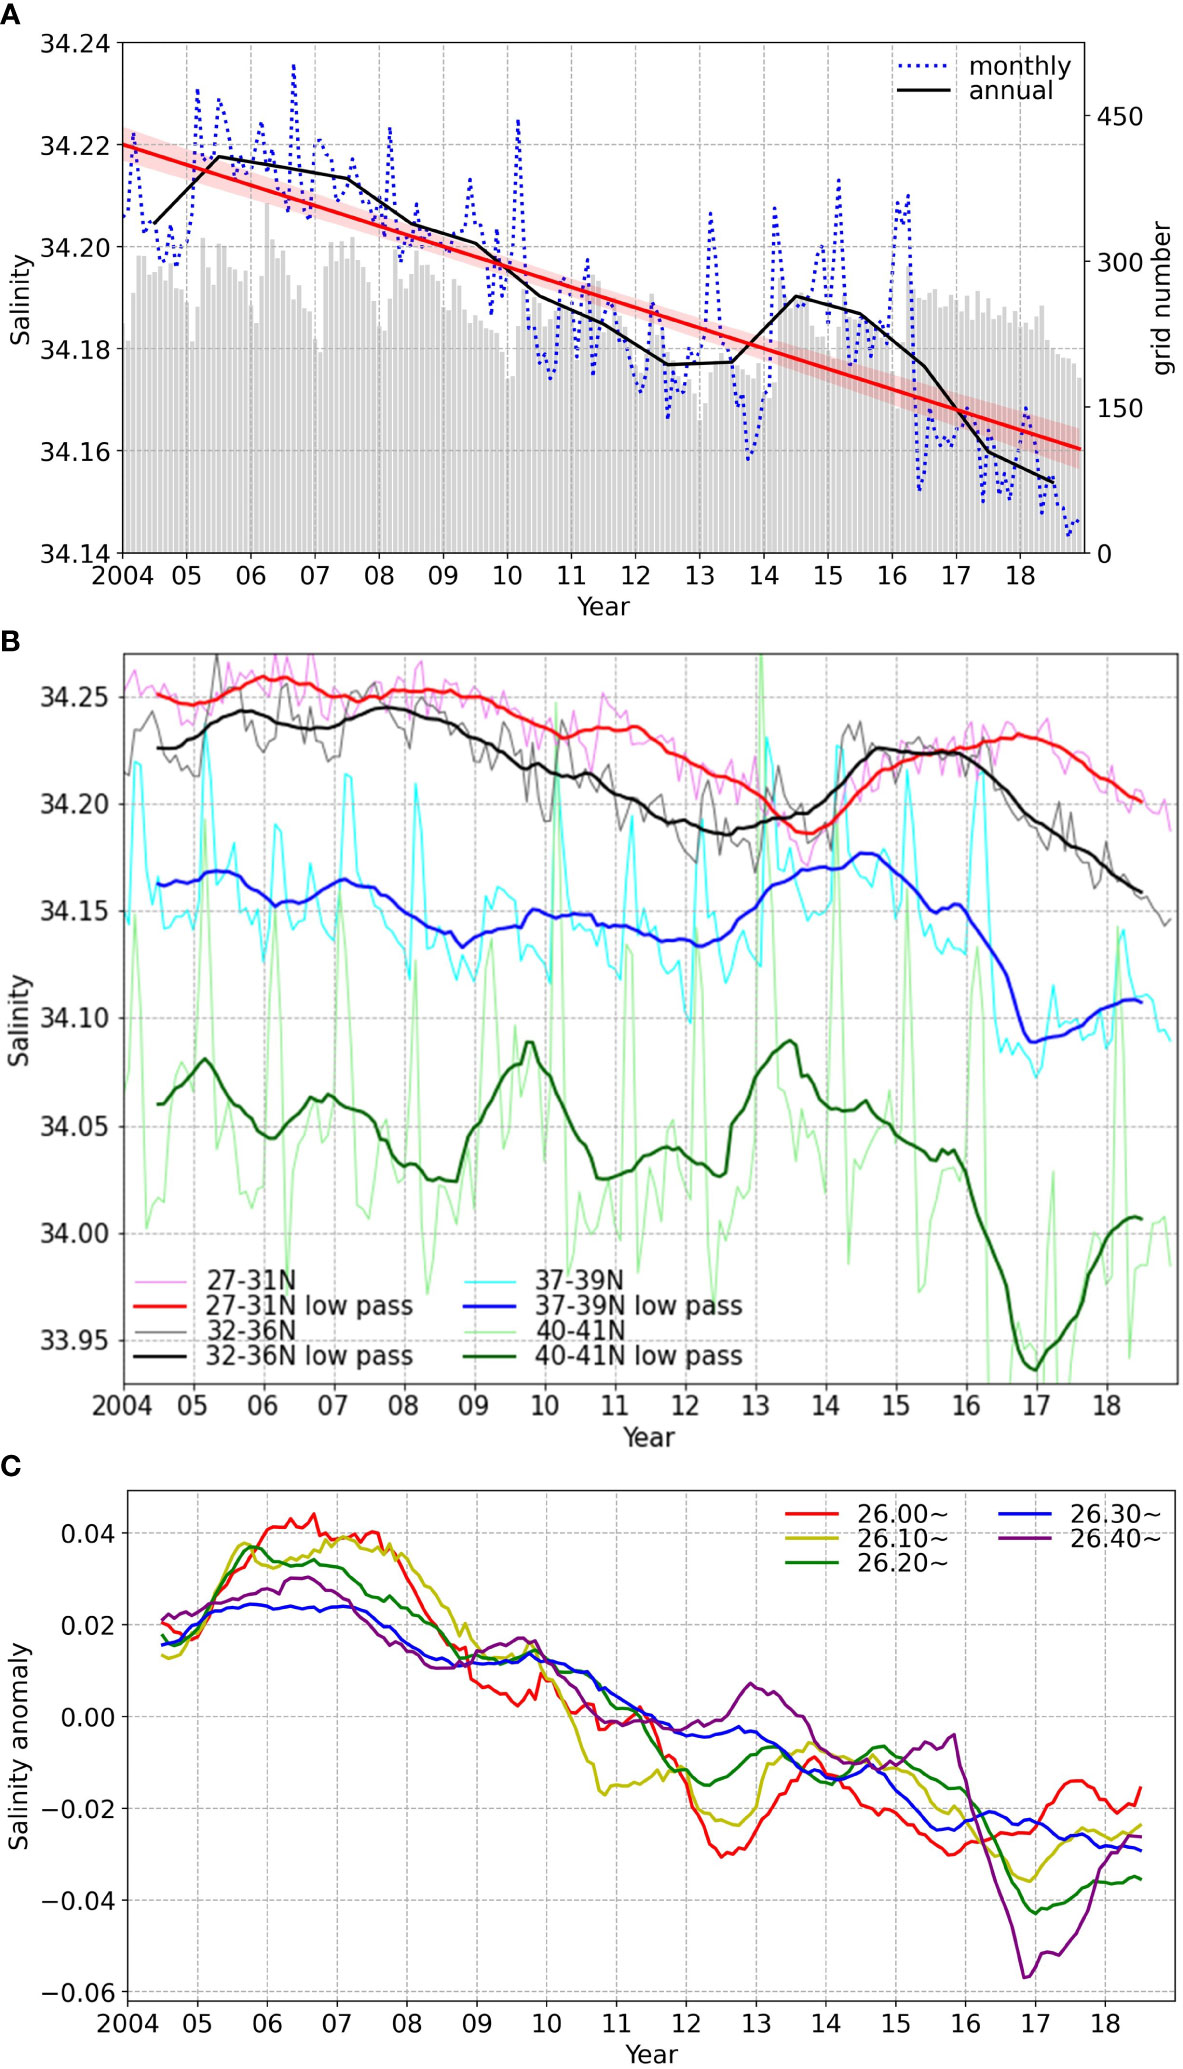
Figure 6 Same as in Figure 5 but for CMW, except that (C) presents salinity anomalies because the salinity ranged between different surfaces and varied significantly in the CMW. (B) In 27–31°N (pink and red), 32–36°N (gray and black), 37–39°N (light blue and blue), and 37–39°N (light green and green). (C) On surfaces at γ = 26.00–26.05 (red), 26.10–26.15 (yellow), 26.20–26.25 (green), 26.30–25.35 (blue), and 26.40–26.45 (purple).
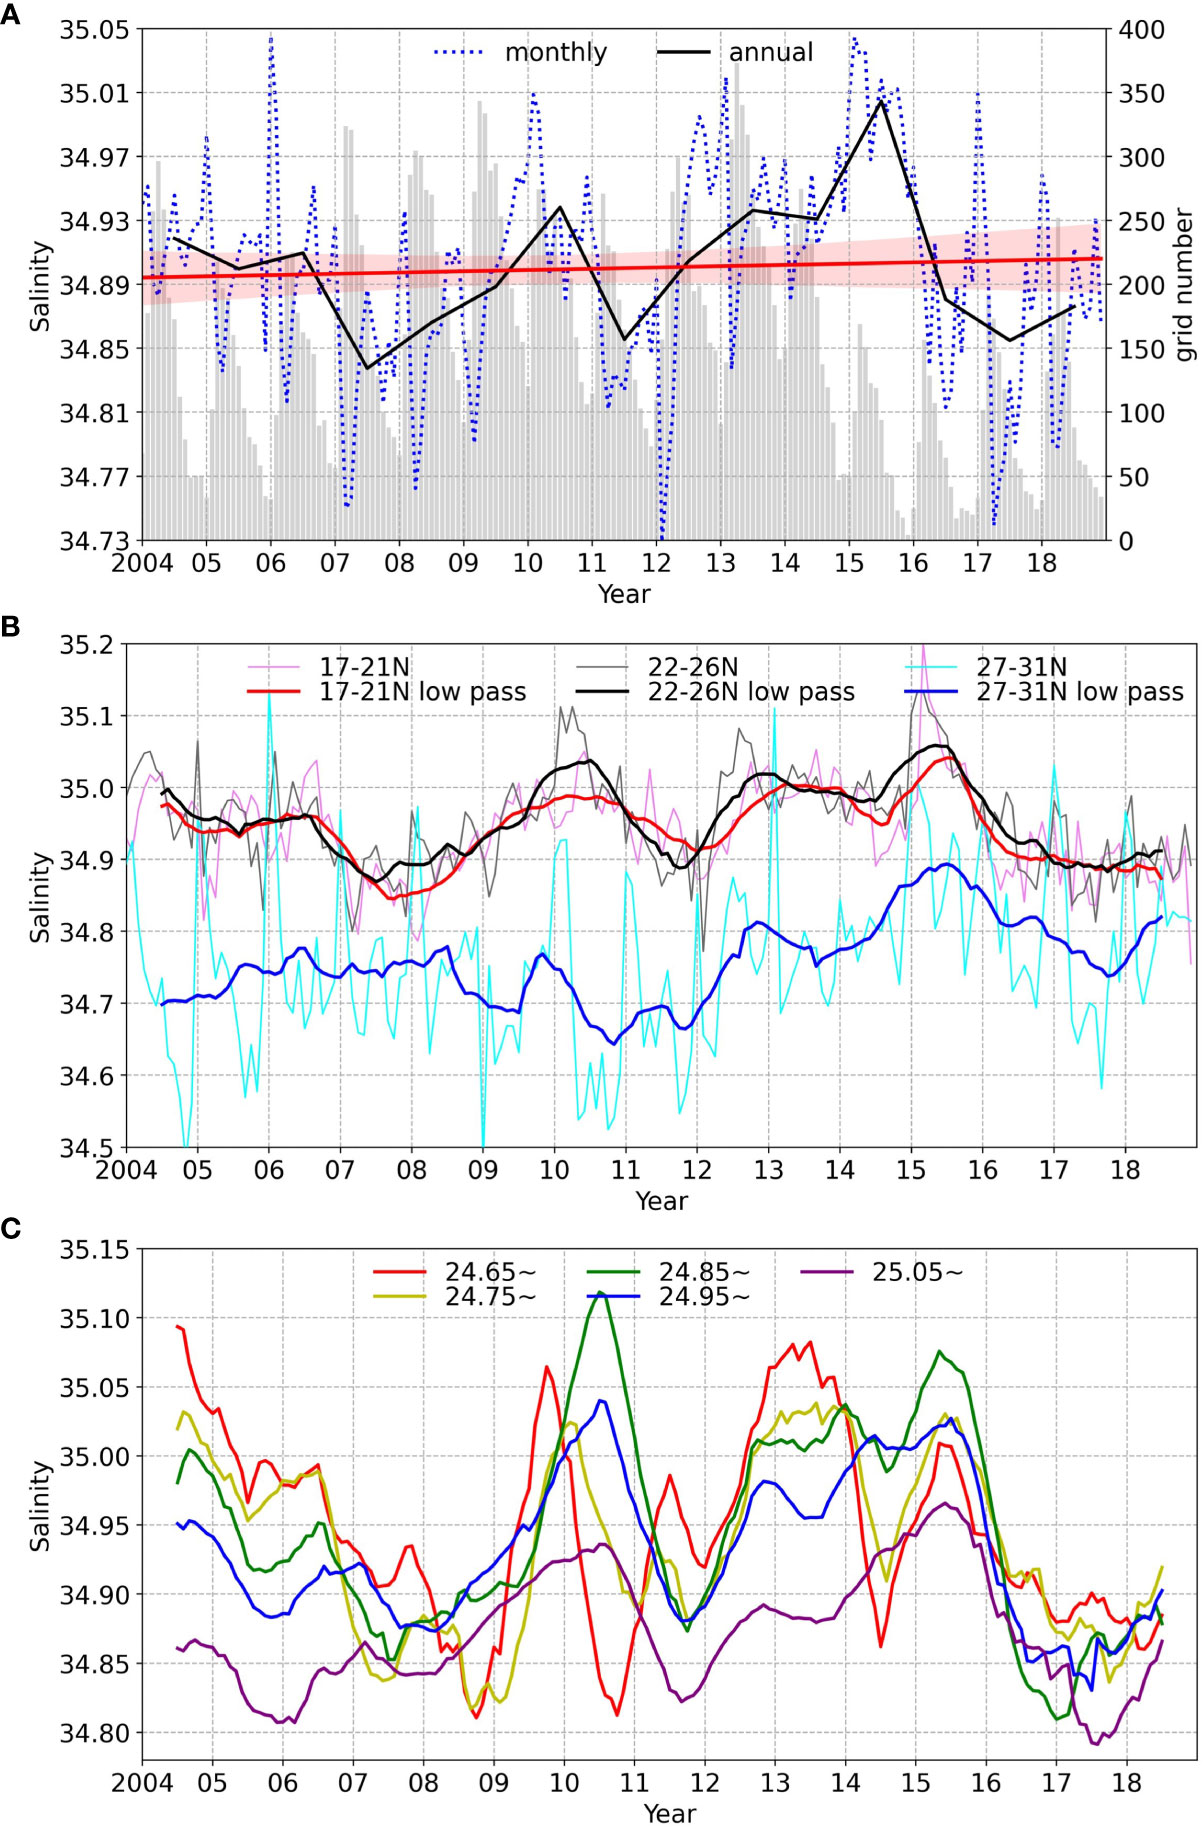
Figure 7 Same as in Figure 5 but for ESTMW. (B) In 17–21°N (pink and red), 22–26°N (gray and black), and 27–31°N (light blue and blue). (C) On surfaces at γ = 24.65–24.70 (red), 24.75–24.80 (yellow), 24.85–24.90 (green), 24.95–25.00 (blue), and 25.05–25.15 (purple).
Vertically in the STMW, we find a delay in salinity anomalies from light to dense surfaces. The lowest salinity in 2010 and 2011 was at γ = 25.00–25.05 and γ = 25.50–25.60, respectively (Figure 5C). Denser isopycnals outcrop further north, subduct to deeper depths, and show slower geostrophic currents (data not shown); thus, the signals need more time to fill the corresponding portion of the STMW.
3.2.3 CMW
In the CMW, the salinity showed a 95% significant freshening trend of −0.004/year during 2004–2018 (Figure 6A). The salinity decreased since 2005 and reached a minimum in 2012. It increased to a second peak in 2014 and then decreased rapidly since 2015. These show an overall quasi-decadal cycle with a smaller amplitude and earlier phase compared to the STMW. This decadal variability has been detected by hydrographic data along 180° during the 1988/1989 climate shift (Suga et al., 2003) and along 137° during 1967–1996 (Oka et al., 2017). However, it has not been reported after the 2000s. The freshening was also consistent with the freshening at σθ = 26.0 and 26.4 along 137° during 1996–2016 (Oka et al., 2017).
While the middle and southern parts of the CMW (27–36°N) were essentially homogeneous for both salinity and salinity changes with a 1-year lag, the northern part that was also in the formation region of the CMW (37–39°N) showed a much lower salinity (i.e., 0.05 and 0.15 lower in 32–36°N and 40–41°N, respectively compared to the middle to southern parts). This part also showed much larger seasonal variations and more significant year-to-year variations, which obscured its decadal variability (Figure 6B). These result from the strong climatological salinity gradients that existed north of 39°N. The interannual variations on the northern side were preserved up to the southern side with a total delay of about 2 years. The year-to-year variations were dampened significantly; thus, the decadal variability and trend were more significant. For example, the salinity increased at >0.06 and peaked in 2009 within 40–41°N. It increased by 0.02 within 37–39°N and was flat during 2009–2010 within 32–36°N. These will be discussed in section 3.3.
The salinity in the CMW showed similar trend on all surfaces; however, the interannual variations showed differences between the light (γ = 26.00–26.15) and dense (γ = 26.20–26.45) layers, for example, in 2012 (Figure 6C). The inconsistency in interannual variations corresponded to the different formation regions and circulation pathways in the light part (L-CMW) and the dense part (D-CMW) of the CMW. The L-CMW is formed between the KE front and the Kuroshio bifurcation front (KBF) and distributed along the inner part of the eastern subtropical gyre, while the D-CMW is formed between the KBF and the subarctic frontal zone (SAFZ) and distributed in the outer part (Oka and Suga, 2005; Oka et al., 2011; Oka et al., 2020).
3.2.4 ESTMW
In the ESTMW, a significant trend in the salinity was not observed; however, it showed much larger seasonal and year-to-year variations compared to the STMW and the CMW (Figure 7A). The entire ESTMW showed a variability at a 3–4 years period with higher-frequency variations on a time scale of 1–2 years, which get less pronounced gradually from the northern part (near its formation region) to the middle and the southern parts (Figure 7B). The delay observed from the northern part (27–31°N) to the southern part (17–21°N) is within one year. Although previous studies have suggested decadal variability in density and volume of the ESTMW (Ladd and Thompson, 2000; Guo et al., 2018), decadal variability was not found in the ESTMW salinity. This suggested dynamic changes during the ESTMW formation, which likely have limited effects on the spiciness anomalies in the distribution region of the ESTMW. In the ESTMW, the northeastern part showed a significant positive salinity trend (Figure 4 and Section 3.2.1); however, significant trends were not observed in its other parts or the thickness-weighted salinity of the entire ESTMW (Figure 7A).
The salinity values that decreased with an increase in the density and the prominent vertical delay of salinity anomalies from light to dense surfaces, which were observed in STMW and the CMW, were not found in ESTMW. Besides, the salinity changes in the ESTMW were similar among the different isopycnals in most years, except in years with a vast year-to-year variation (i.e., 2009–2011 and 2014), during which the light (γ = 24.65–24.80) and dense (γ = 24.85–25.15) parts showed different changes. These features among different γ surfaces in the ESTMW corresponded to its weak stratification (Hautala and Roemmich, 1998).
3.3 Spatial evolution of spiciness anomalies
The annual mean salinity anomalies averaged on the core surfaces of the STMW (γ = 25.3) and ESTMW (γ = 25.0), and those on the core surface of CMW (γ = 26.3) are shown in Figure 8 and Figure 9, respectively. In addition, we calculated the anomalies in the entire γ range of each water mass and weighted the values by thickness. Their amplitudes and spatial patterns were consistent with the core γ surfaces only. Therefore, we investigated the propagation of salinity anomalies on the core γ surfaces of the mode waters.
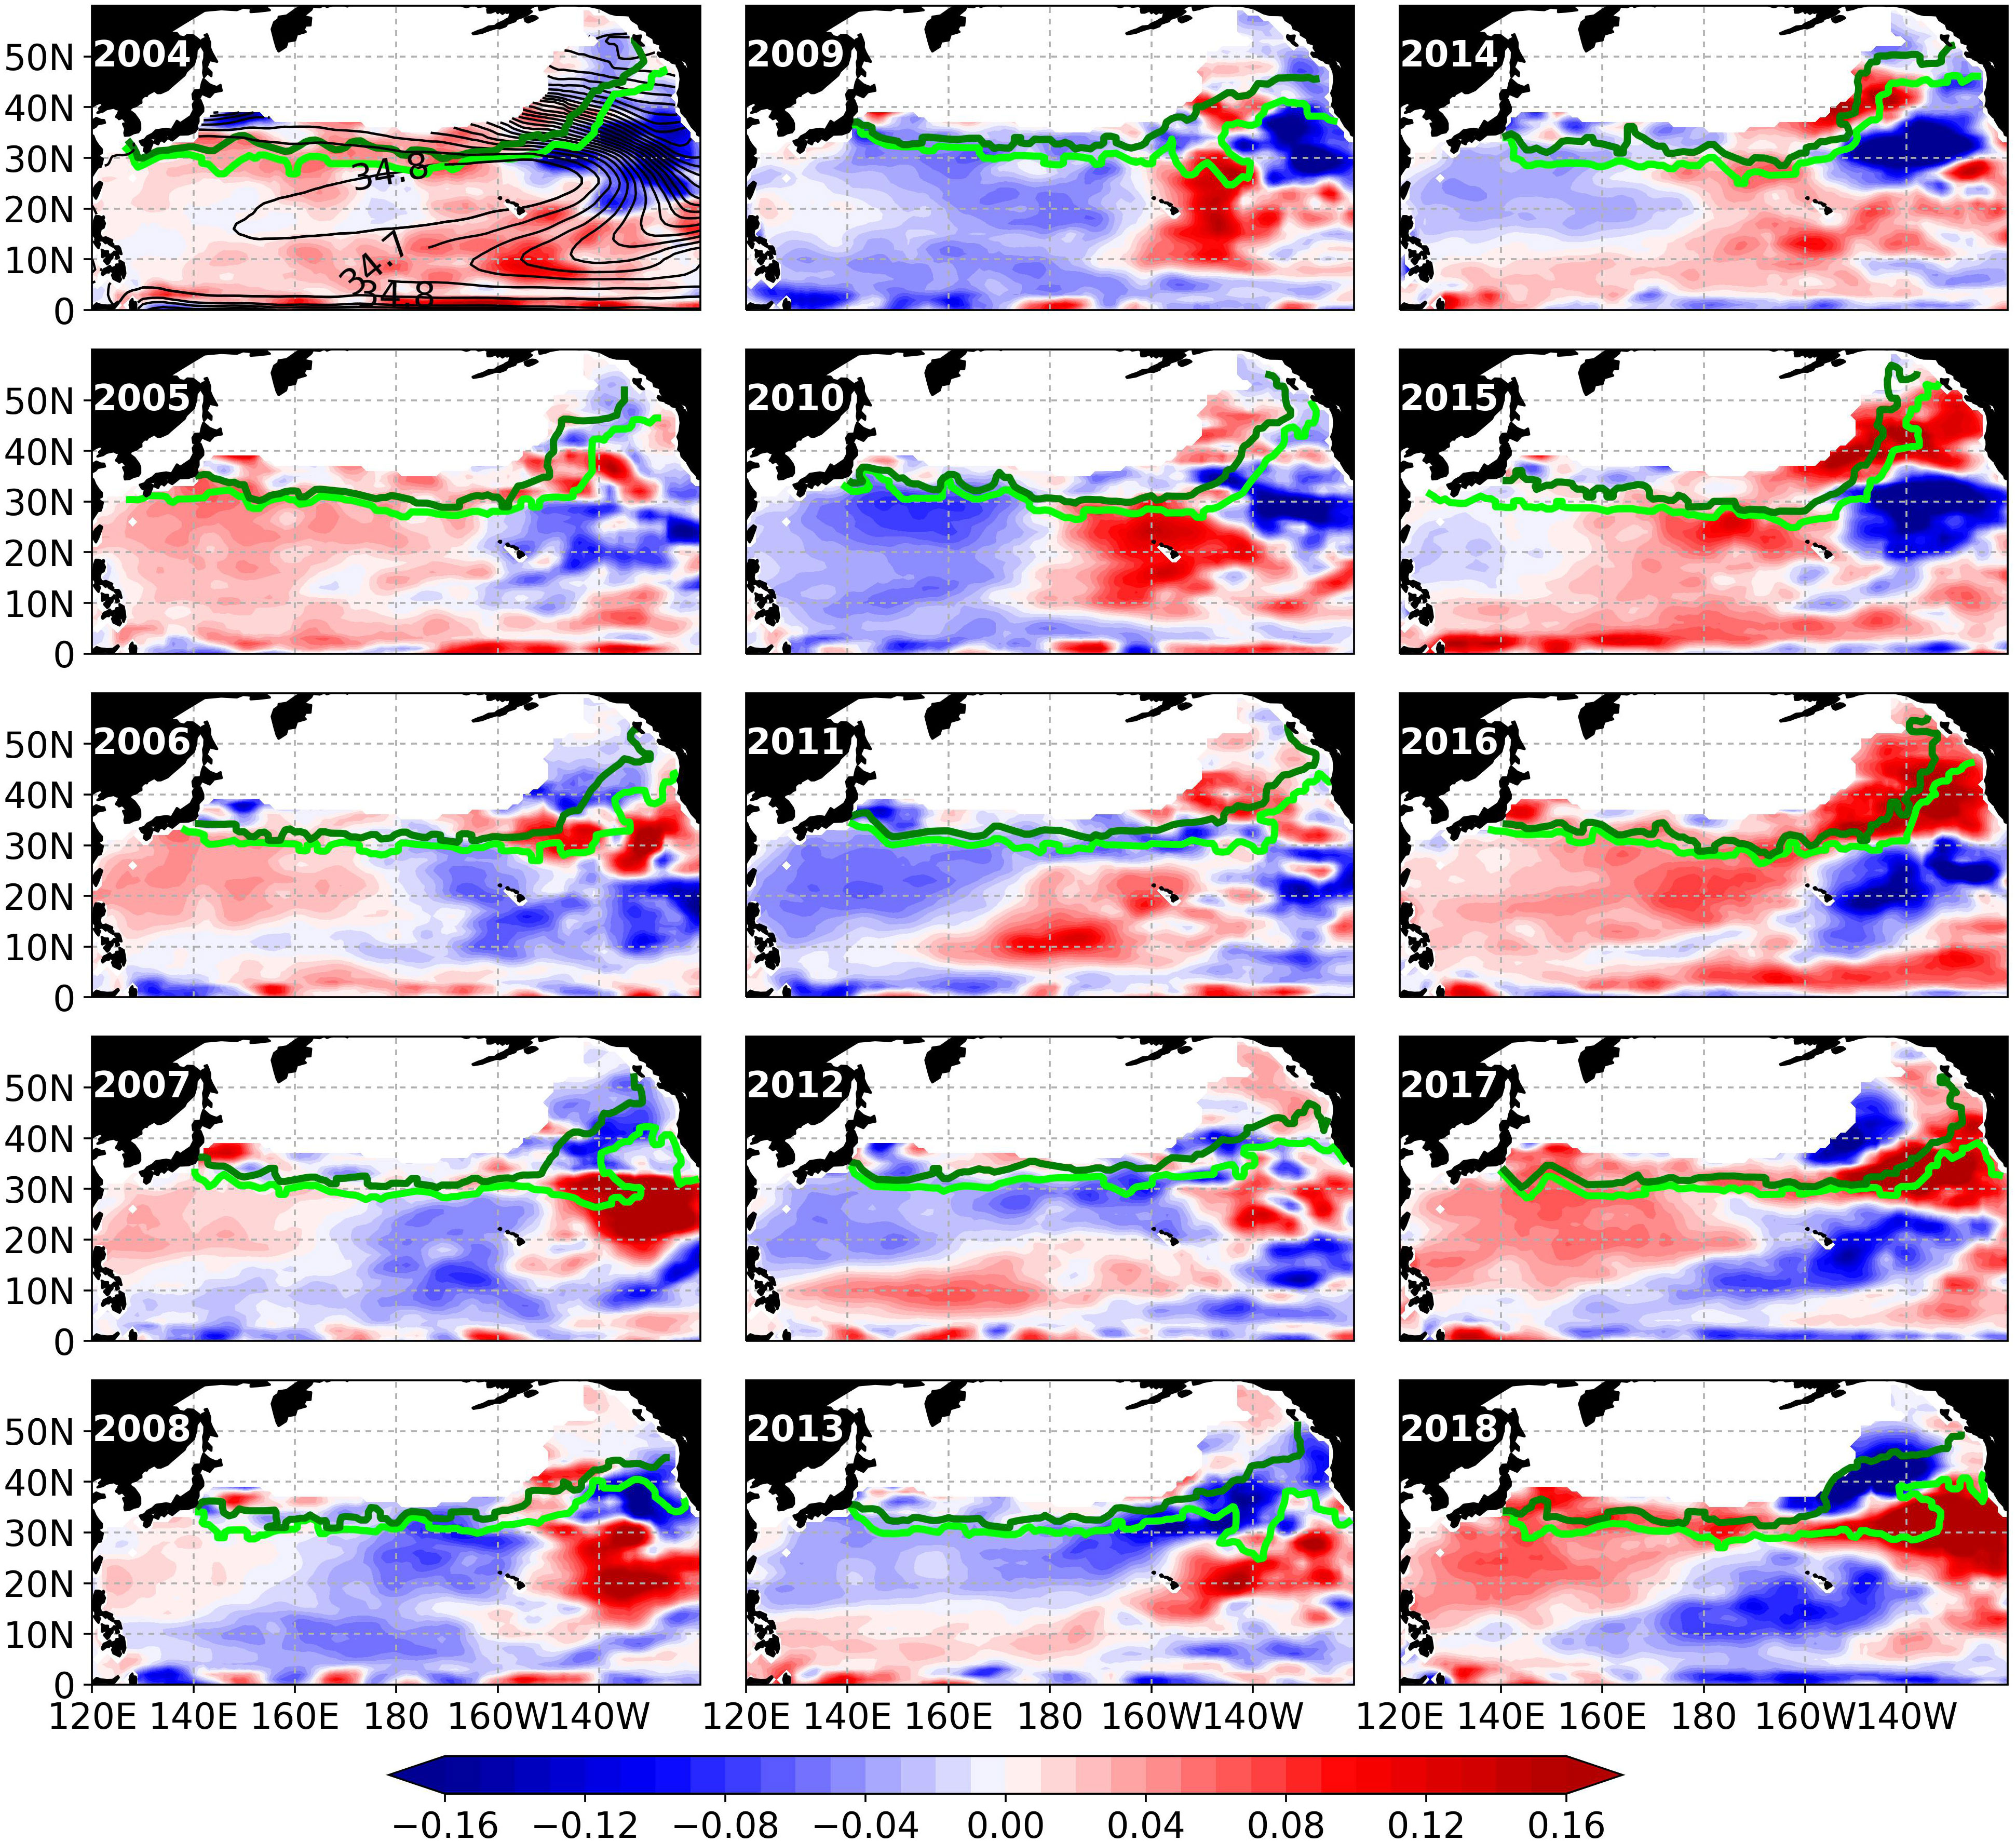
Figure 8 Annual mean anomalies of salinity averaged between 25.0 and 25.3 γ surfaces. Climatological salinity (black contours) is shown in the subplot of 2004 with intervals of 0.1 and labels of 34.7 and 34.8. Light green and dark green lines denote the late winter outcrop line for γ 25.0 and γ 25.3 respectively, which was averaged in February and March of each year.
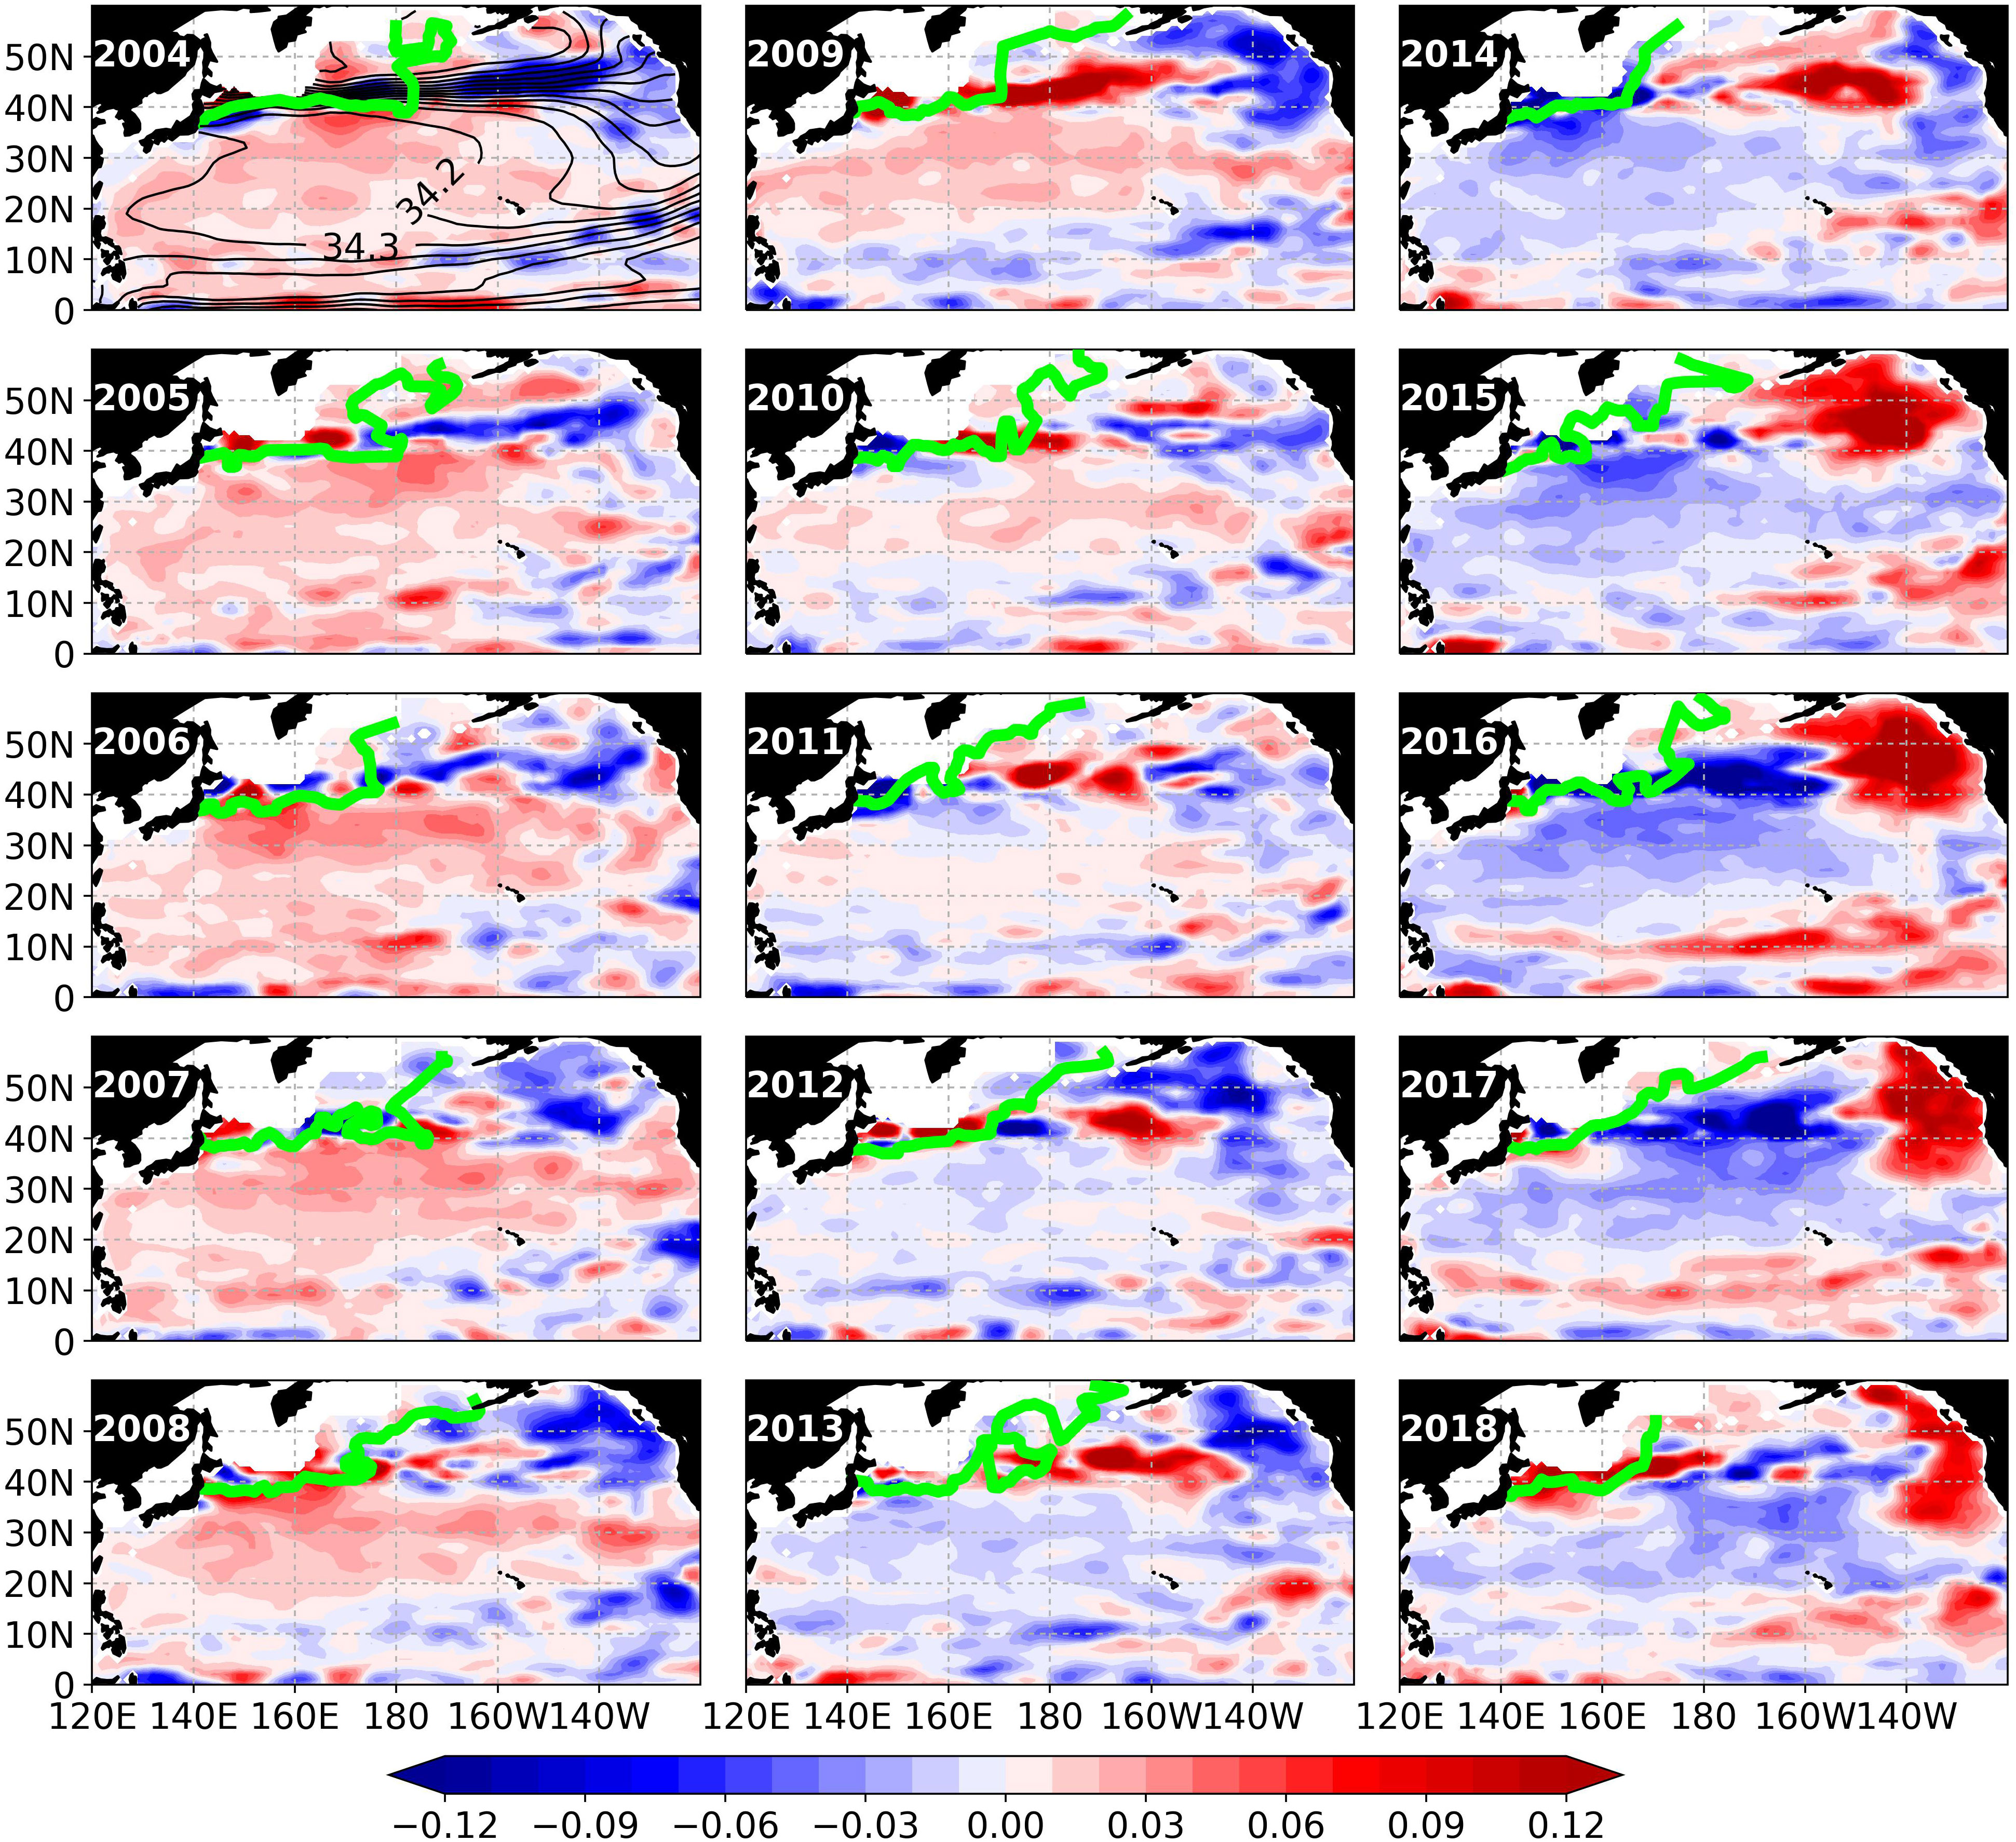
Figure 9 Same as in Figure 8 but on 26.3 γ surface with labels of 34.2 and 34.3.
Around the region of the STMW (Figure 8), positive (negative) salinity anomalies >0.004 (<−0.004) appeared initially in 2004 (2009) near the outcrop line (30–35°N) in both the 140–150°E and the central longitudes (160°E–160°W). The former was in the STMW formation area, while the latter was beyond the eastern boundary of the STMW formation area, which was 175°E (Oka and Suga, 2003), and beyond the low Q boundary in the monthly Q maps (see Supplementary Material Figure 1). The anomalies were found to spread southwestward to the entire domain of the STMW in 2005–2006 (2010–2012). They then weakened gradually in the same direction from northeast to southwest sides during 2007–2009 (2012–2015). At the end of the data period, new positive anomalies appeared in 2016, which were found to spread to the entire STMW region in 2018. The path of southwestward propagation of the anomalies was generally consistent with the streamlines in the region (Figure 3); however, it was closer to the inner part of the streamlines, which suggested cross-streamline spreading.
In the ESTMW (Figure 8), the salinity anomaly in each positive or negative period appeared initially at 150–130°W near the outcrop line (30–40°N), which was near the northern part of the ESTMW formation region (centered at 30°N, 140°W). The anomalies spread initially clockwise to the domain of the ESTMW (centered at 25°N, 140°W) in 1–2 years and then southwestward to the dateline around 20°N. They finally arrived at the western boundary of the tropics (near 10°N, 125°E). The propagation path was consistent with the direction of geostrophic streamlines (Figure 3) and similar to those detected by Sasaki and co-workers (Sasaki et al., 2010) and Katsura (Katsura, 2018) during 2004–2008 and 2005–2013, respectively. The rapid signal change near the outcrop line and the continuous propagation of signals caused the meridional contrasts of positive and negative anomalies in the eastern side of the subtropical gyre (Figure 8).
On the surface γ = 26.3 (Figure 9) during 2004–2018, the entire North Pacific subtropical gyre experienced a freshening during 2004–2018, especially in the distribution region of the CMW. The anomalies were largest near the boundary of subtropical and subpolar gyres, which were accompanied by a strong salinity frontal structure that determines the distribution of the CMW (Oka and Suga, 2005). The negative salinity anomalies (i.e., <−0.06) appeared initially at 155°E and 37°N in 2014, as shown in Figure 9. These were around the western part of the CMW formation region (Oka and Suga, 2005). They spread southward within the subtropical gyre to the majority of CMW and eastward along the North Pacific current to the northeastern corner where they mixed with positive anomalies during 2015–2018. The two propagation pathways were also found in the positive period. Unlike the anomalies in the STMW with cores that migrated downstream along the spreading path (Figure 8), the upstream part of the CMW remained as the core of the anomalies.
Here, the separation between CMW and Transition Region Mode Water (TRMW) (Saito et al., 2007; Saito et al., 2011) was not conducted. The TRMW in a density range of 26.3–26.6 σθ typically shows fresher and colder properties (salinity <34.0) than the CMW. The modification of a part of the TRMW into D-CMW associated with double-diffusion salt-finger convection has been suggested (Saito et al., 2011; Suga et al., 2013). This process occurs in a favorable condition due to geostrophic shear with a spiciness front. At 40–41°N, the salinity decreased to <33.95 in 2017 (Figure 6B) and an isopycnal salinity front existed (Figure 9); thus, the water in the area may also consist of TRMW. To examine the potential for double-diffusion, we calculated the Turner angle (Tu) (Ruddick, 1983). Double-diffusion becomes active when the Tu >71.6° (Johnson, 2006). At γ = 26.3–26.5 along 40°N east of Japan, which coincides with the location of the TRMW, the Tu showed a value >71.6° from February to April, indicating a potential for active salt-finger double-diffusion (calculation and figures are presented in the Supplementary Material). Therefore, the modification processes of the TRMW likely contributed to the year-to-year variations that were prominent on the northern side and very weak on the southern side of the CMW. A few spiciness anomalies were generated and diffused near the spiciness fronts without propagating downstream.
3.4 Propagation direction and velocity of spiciness anomalies
The propagation directions of salinity anomalies in Figures 8 and Figure 9 were generally consistent with the geostrophic currents; therefore, we traced the anomalies on the core γ surfaces of the mode waters along the mean streamlines that pass through the mode water regions. A comparison of the propagation speeds with the advection of the mean flow is shown in Figures 10-Figure 12. Along a streamline, seasonal variations dominated upstream and near the outcrop line; however, most of the signals attenuated quickly south of the outcrop line. Low-frequency signals dominated the downstream regions, which was consistent with the spatial differences found in the salinity time series (Figures 2-4). The low-frequency signals were found to propagate and decay at the same time.
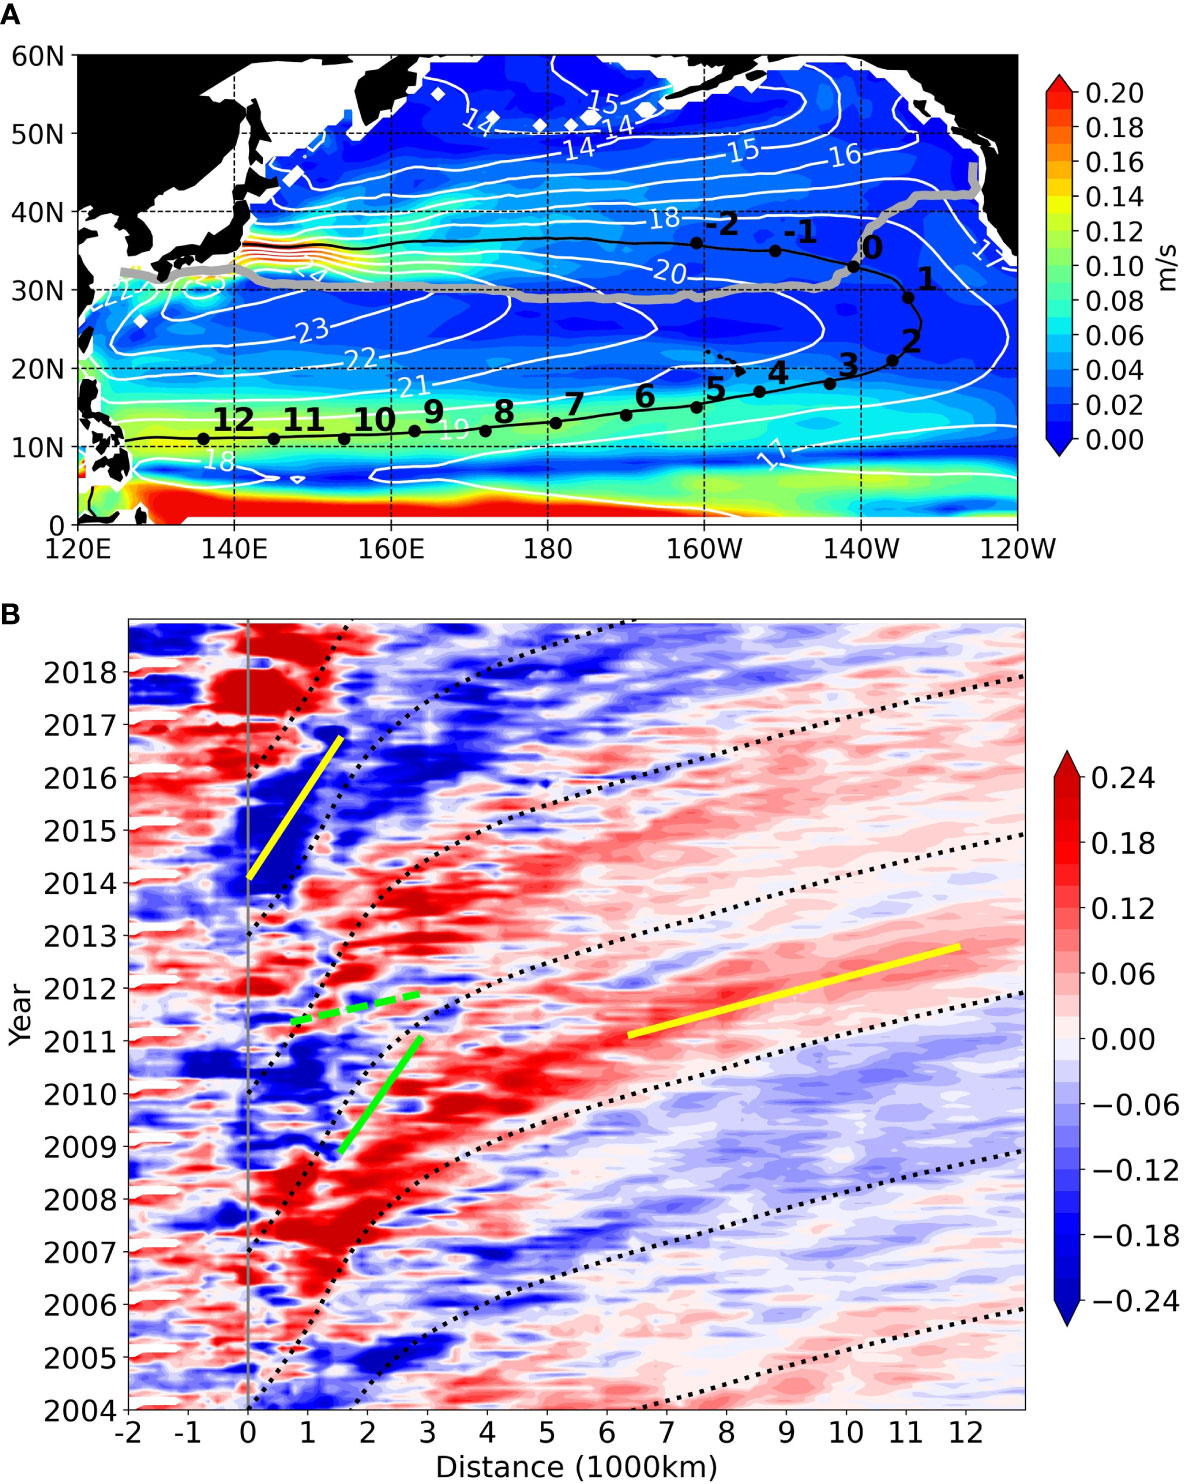
Figure 10 (A) Geostrophic velocity (color) and streamline (white contour) on γ = 25.0 surface (unit = m/s) that was relative to 1500 dbar. Black contour denotes the 19 isopycnal stream function isopleth with positions dotted at every 1000 km distance (the great-circle distance at each pressure point) from the “0” point. The thick gray line denotes the winter outcrop line of the γ = 25.0 surface. (B) Time-distance diagram of the salinity anomalies along the 19 isopycnal stream function isopleth (same as the black contour in a). The dotted black curves denote the advection by mean geostrophic velocity along the streamline, which integrated from the “0” point (gray line). The positions of every 1000 km distance are the same as the dotted points in (A) The yellow lines indicate representative propagation speeds of the anomalies, which are 0.02 m/s and 0.12 m/s respectively. The solid and dashed green lines indicate branches of the anomalies that did not propagate following the mean geostrophic speed, with speed of 0.02 m/s and 0.09 m/s respectively.
Along the streamline that passes through the ESTMW (Figure 10), the detected low-frequency signals were found to change phase every 3 years south of the outcrop line (points 0–2 in Figure 10) during 2004–2018. Almost all the low-frequency signals propagated from the outcrop line near 30°N and 140°W until they reached the western boundary near 10°N. The propagation speed of spiciness anomalies accelerated from 0.02 m/s in the eastern subtropics (points 0–2 in Figure 10) to ~ 0.12 m/s in the western tropics (points 7–12 in Figure 10), which was consistent with the mean geostrophic velocity (Figure 10A). This was similar to the observations in previous studies (Sasaki et al., 2010; Kolodziejczyk and Gaillard, 2012; Katsura, 2018). The amplitudes of low-frequency anomalies decayed rapidly along the streamlines, especially after passing through the south of Hawaii (see point 4 in Figure 10).
One low-frequency signal that did not reach the western boundary (near 10°N, 125°E) was the negative signal that appeared initially during 2008–2009 (Figure 10). This signal was intruded by the positive signals and almost disappeared near 145°W (point 3 in Figure 10) in 2012. From the slope of the continuous anomalies in Figure 10B, the intrusion may be attributed to a branch of the former positive signal which propagated more slowly (solid green line in Figure 10B; 0.02 m/s at points 1–3) than the geostrophic current (0.02 m/s to 0.05 m/s at points 1–3) and a branch of the latter positive signal that propagated faster (dashed green line in Figure 10B; 0.09 m/s at points 1–3) than the geostrophic current, implying that the anomalies propagated mainly by the mean geostrophic currents but could also be transported by other processes at the same time.
Along the streamline that passed through the STMW (Figure 11), continuous downstream propagations were observed only in the southwestward part of the streamline (points 0–5). Unlike the good agreement found between spiciness anomalies’ propagation speed and the mean geostrophic velocity in the eastern subtropics, the propagation speed of spiciness anomalies in the western subtropics was much faster than the geostrophic current. Calculating from the strongest amplitudes of signals that propagated from the easternmost to the westernmost points (distance of 500 – 3500 km) in ~1.5 years (yellow line in Figure 11B), the propagation speed of spiciness anomalies was about 0.06 m/s. Meanwhile, the mean geostrophic speed was only approximately 0.03 m/s. When we investigated the neighboring streamlines and streamlines on adjacent isopycnals, the transit time of spiciness anomalies from the outcrop lines to the southmost STMW was 1–2 years with a speed of 0.06–0.09 m/s.
After the streamline turned northeastward, the low-frequency anomalies fragmented and could not propagate downstream (Figure 11). The spiciness anomalies were almost simultaneous between point 4 (30°N, 132°E) and point 5 (32°N, 141°E), with the occurrence time being several months earlier at point 5, and were simultaneous between points 5 and point 0 (33°N,150°E), despite the large eastward geostrophic speed. These results imply that the spiciness anomalies were generated simultaneously near the outcrop line in the wide range of the STMW formation area. They propagated southwestward and finally disappeared near the western boundary. The fact that the signals propagated at a higher speed than the geostrophic current in the southwestward part of the gyre and southwestward in the northeastward part of the gyre suggested that the spiciness anomalies in the western subtropics were propagated by both the geostrophic current and other processes (e.g., eddies). Using an eddy-resolving model, Nishikawa and co-workers (Nishikawa et al., 2010) revealed the southward eddy thickness transport in the STMW core density. Another research group (Shi et al., 2018) suggested that the eddies carry STMW westward in models. The above studies support the hypothesis that the eddies play an important role in propagating the anomalies southwestward. However, since the resolution of Argo network does not resolve mesoscale and sub-mesoscale eddies, we did not investigate the contributions of eddies on the transport spiciness anomalies.
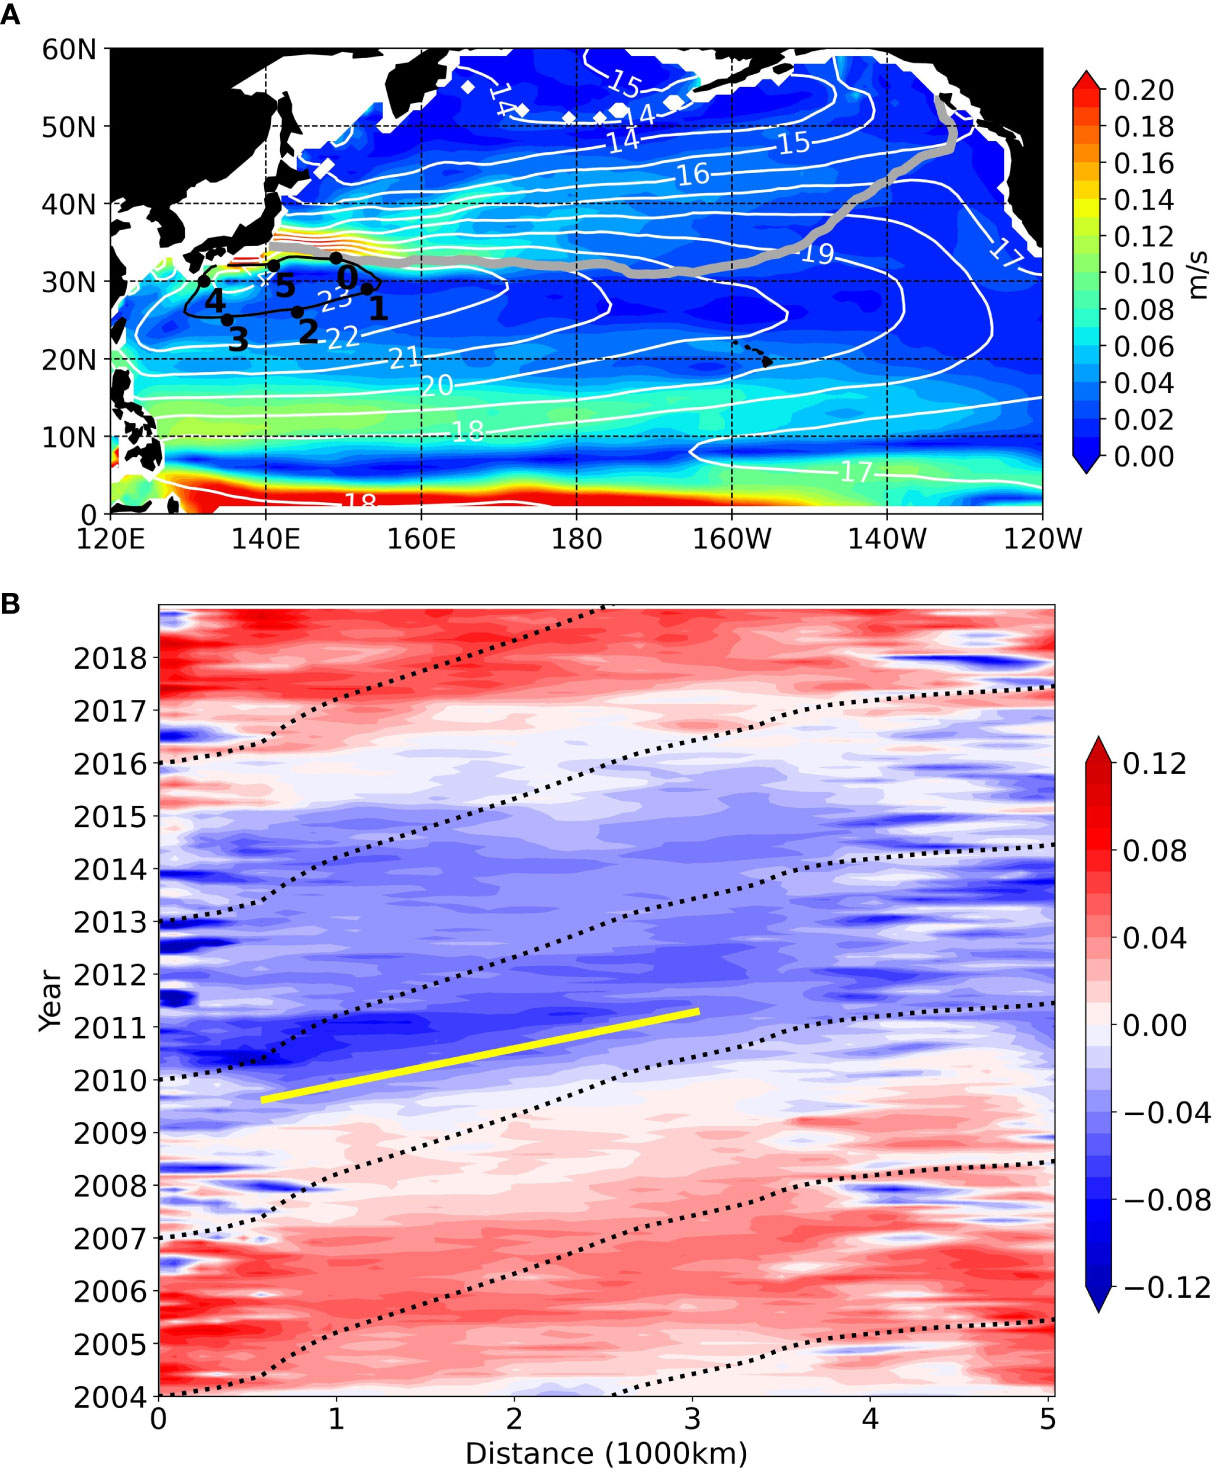
Figure 11 Same as in Figure 10 but on γ = 25.3 surface along a 22.5 stream funtion isopleth. The yellow line indicates representative propagation speed of the anomalies, which is 0.02 m/s and 0.12 m/s respectively.
Along the streamline that passed through the CMW domain at the γ = 26.3 surface (Figure 12B), the spiciness anomalies did not propagate from the upstream (near 34°N) all the way to the downstream (near 20°N). However, we observed the propagation of strong signals in some parts. For example, the center of the strongest positive anomaly propagated from 165°E (point 2) to 165°W (point 5) during 2004–2009. The anomaly then turned gradually negative, and the resulting negative anomaly propagated from 170°E (point 8) to the western boundary (point 13) during 2014–2018. The time that anomalies shifted from positive to negative was not a monotonic increase downstream, which is 2010, the end of 2012, and the beginning of 2012 at 165°E (point 2), 180° (point 6), and 170°E (point 8), suggesting that the spread of the freshening anomaly did not follow the downstream direction of the mean flow. The above positions were far from the outcrop line and the freshening in 2011–2013 in this region occurred only under the mixed layer (Figure 13D); thus, the extension of negative anomalies among points 5–8 in 2012 was not caused by local outcropping. On the other hand, the long-term trend of CMW salinity and mixed layer salinity in the CMW formation region (Figure 6 and Figure 14) showed good agreement; therefore, we considered that the salinity anomalies were still propagated from the outcrop to the downstream regions along a pathway that was different from the mean flow. Using the XCTD section data in 2001, it has been suggested that a part of the D-CMW was transported southward across the eastward mean flow by mesoscale eddies and then spread along the subtropical gyre (Suga et al., 2013). Inspired by this idea, we hypothesized the existence of a large southward transport by eddies at a speed much faster than the quasi-zonal geostrophic current; thus, the overall transport of a spiciness anomaly is in the inner side of a streamline. This is also consistent with the southward eddy-induced transport in CMW explored by Nishikawa et al. (2010) using an eddy-resolving OGCM. Therefore, the synchronized occurrence of freshening among points 6–9 (Figure 12B) was affected by negative anomalies further northwest (points 2–3), which were brought via eddy transports. Meanwhile, the anomalies advected from the points just upstream by the geostrophic current were also likely to affect the changes in the eastern part (points 6–7). This was supported by the spatial patterns found in Figure 9. As a result, we were able to observe the propagation of anomalies along the streamline and the different occurrence times of freshening that was not consistent with the streamline at the same time. Further studies using eddy-resolving datasets are needed to examine our hypothesis.
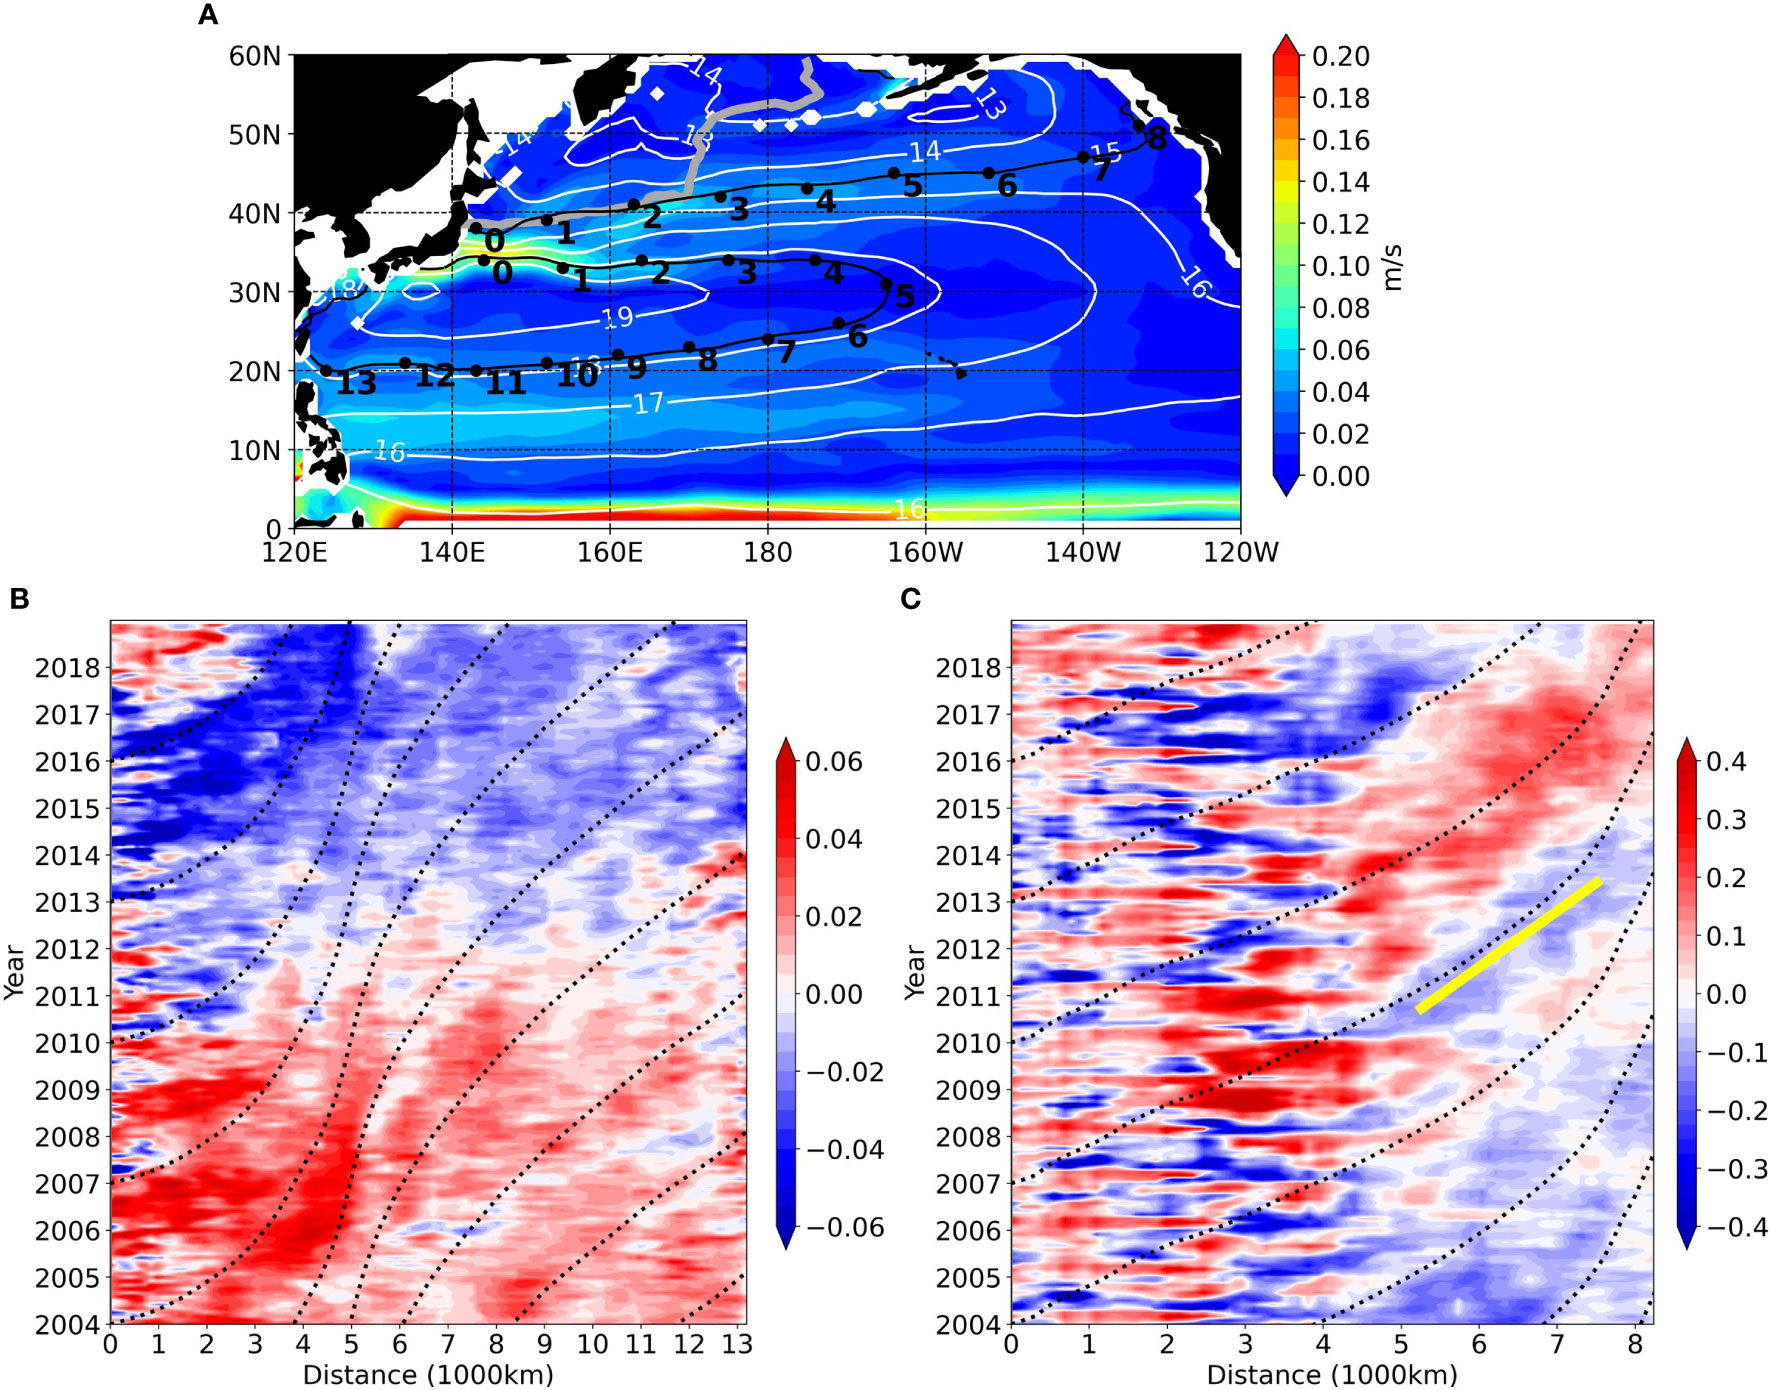
Figure 12 Same as in Figure 10 but on γ = 26.3 surface along (B) 18.2 and (C) 15 stream funtion isopleths. The yellow line indicates a speed of 0.03 m/s.
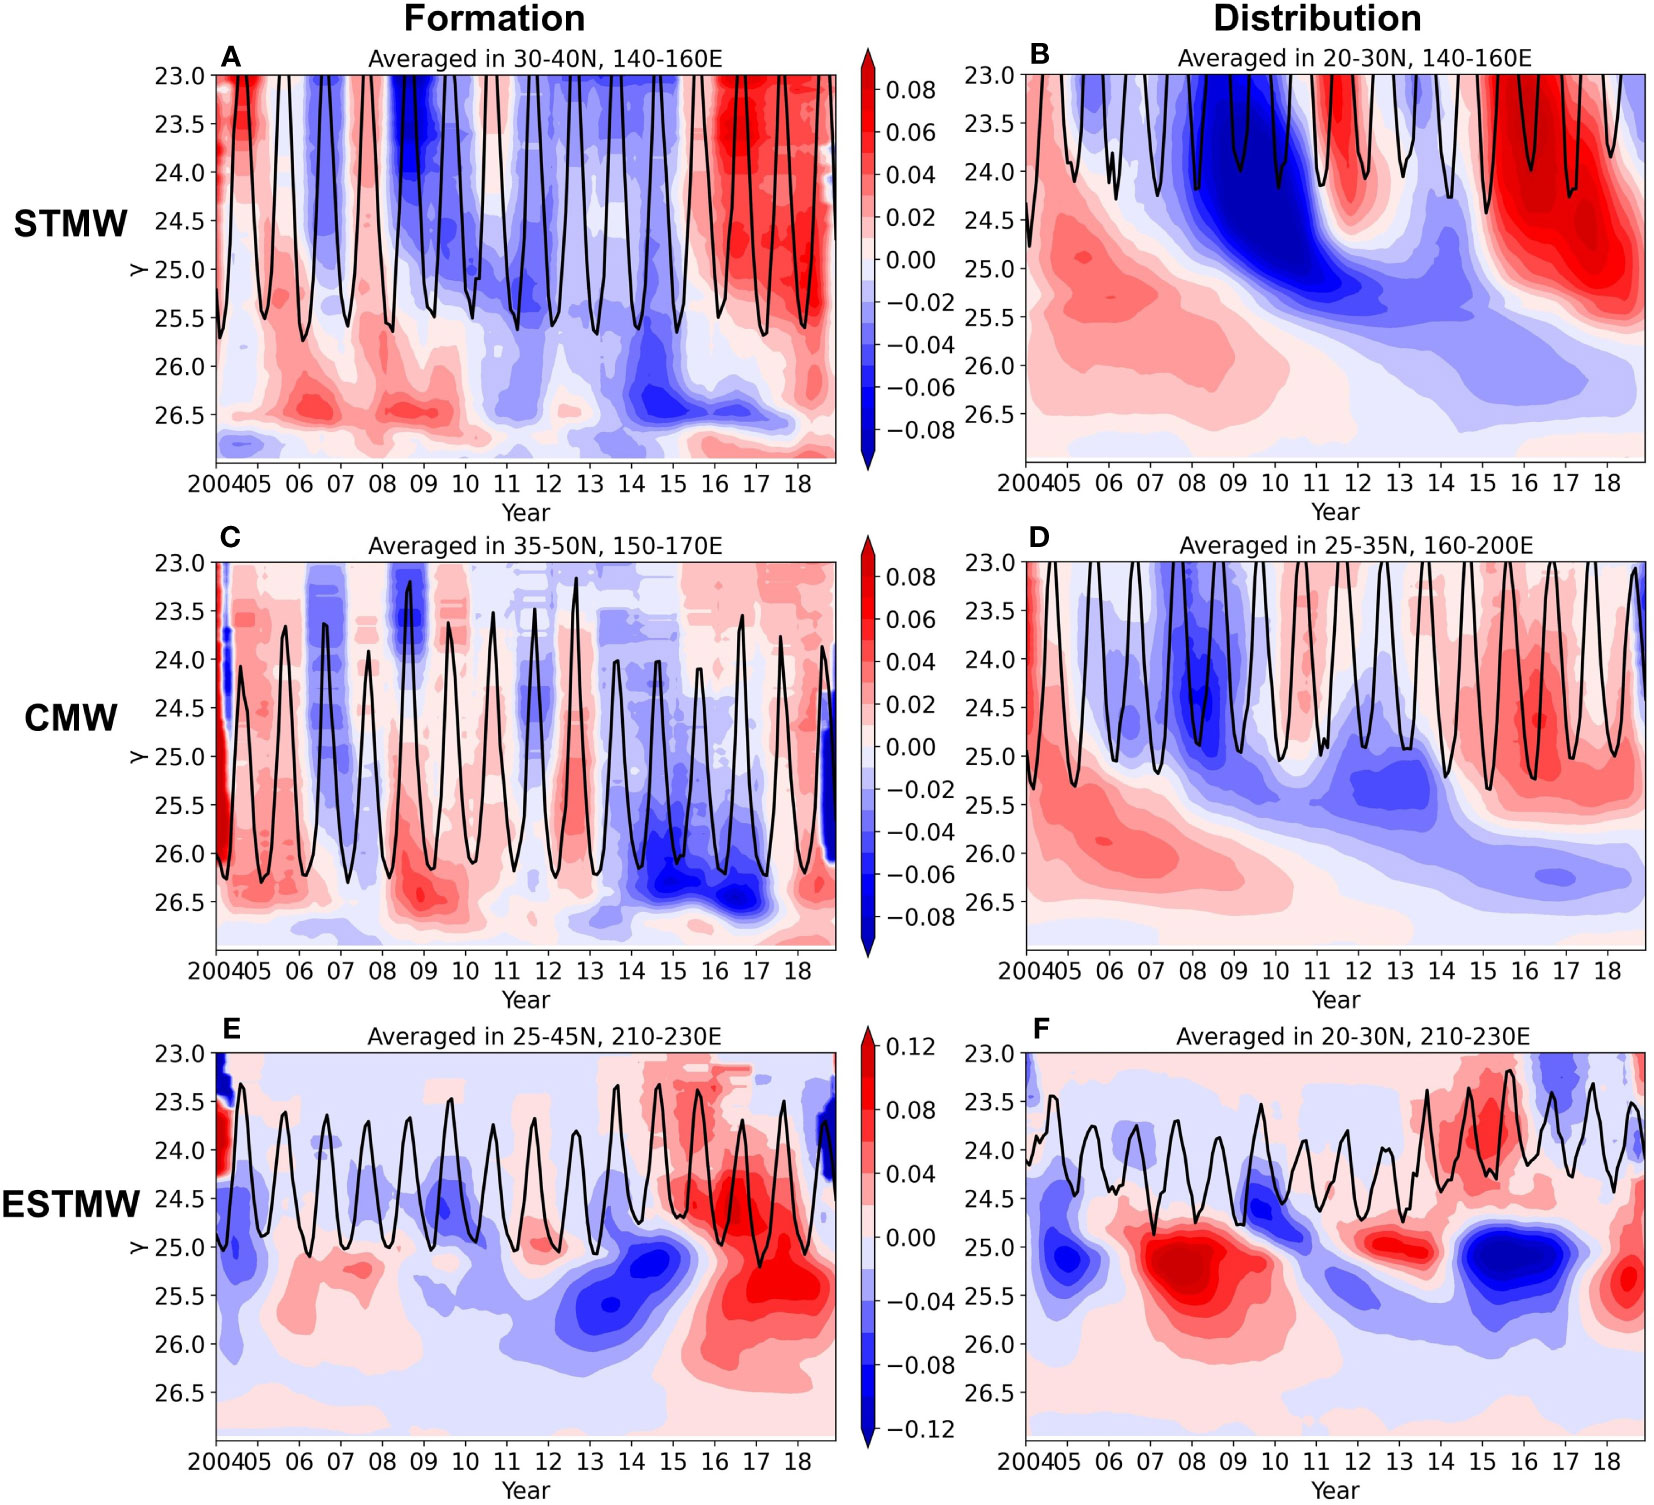
Figure 13 The γ-time diagram for 12-month running average salinity anomalies that were averaged in boxes, which represent the formation and downstream distribution regions of the studied three mode waters. (A) 30–40°N, 140–60°E, (B) 20–30°N, 140–160°E, (C) 35–50°N, 150°E to 170°W, (D) 25–35°N, 160°E–160°W, (E) 25–45°N, 130–50°W, and (F) 20–30°N, 130–150°W, represent STMW formation, STMW distribution, CMW formation, CMW distribution, ESTMW formation, and ESTMW distribution regions, respectively. Black contours denote the potential density of the mixed layer. The latitude ranges in A, C, and E were chosen based on Figure 14.
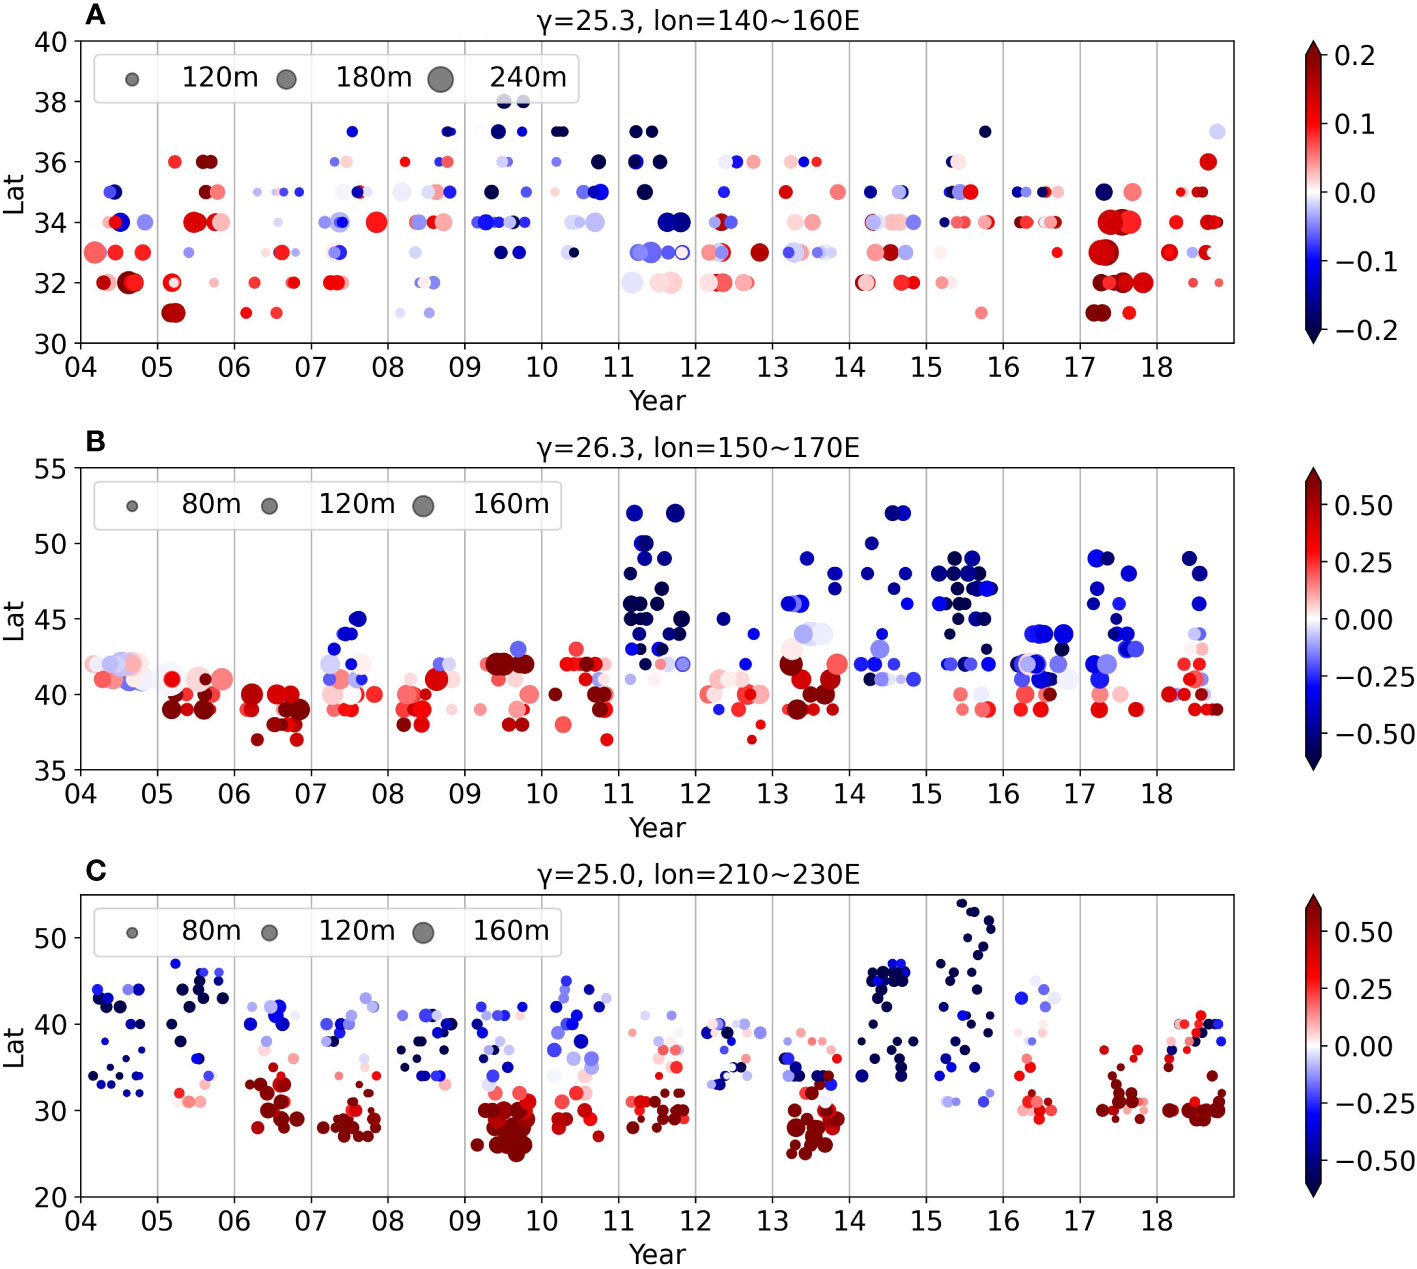
Figure 14 Scatter plots for the latitudes of the grids on late winter outcrop line of the mode water core surfaces in their main formation regions. (A) γ = 25.3 in 140–160°E, (B) γ = 26.3 in 150–170°E, and (C) γ = 25.0 in 130–150°W. Colors in the scatters indicate salinity anomalies in late winter mixed layer, which were calculated by the salinity at a plotted grid subtracted by the climatological salinity that was averaged at the appropriate longitude on the outcrop line. Sizes of the scatters indicate late winter MLD. The horizontal positions of the scatters are distributed randomly within the bin of each year to avoid overlap.
The streamline at the gyre margin at γ = 26.3 surface was also investigated (Figure 12C). Salinity was dominated by the high-frequency seasonal variations in the western side (points 0–2) that was close to the outcrop line, both seasonal and interannual variations in the middle portion (points 2–4), and the low-frequency anomalies across the date line (point 4). The eastward propagation of the low-frequency anomalies is consistent with that suggested in a previous report (Taguchi et al., 2017), which was based on historical observations and the ocean general circulation model (OGCM). The propagation speed of the low-frequency signals is about 0.03 m/s at points 5–7, which is consistent with the geostrophic speeds. The boundary where seasonal variations played a dominant role varied significantly in different years. This is consistent with the significant changes in outcrop line positions in 160°E~180° as shown in Figure 9 and related to the changes in the CMW formation region. The high-frequency variations that extended to point 4 are likely the result of strong eddy activity in the central North Pacific near the gyre margin and in favor of the eddy-induced southward transport to the downstream part of the CMW.
3.5 Vertical structure of the spiciness anomalies
Besides the horizontal patterns on each isopycnals, it is also instructive to observe the vertical structures during the occurrence of the spiciness anomalies. The γ-time diagram of interannual salinity anomalies was averaged in the formation and the downstream distribution regions of the STMW, CMW, and ESTMW. The results are presented in Figure 13.
In formation regions of the STMW and the CMW (Figures 13A, C), the strong anomalies under the MLD of up to γ = 26.8 were found to be connected to anomalies found in the mixed layer. However, some variations that lasted no more than 1 year were confined in the mixed layer. Therefore, the anomalies subducted into the thermocline showed a lower frequency. The low-frequency anomalies were preserved and further smoothed in the downstream distribution regions of both STMW and CMW (Figures 13B, D). The above behaviors are consistent with the dampening of seasonal and year-to-year salinity variations from the northern to the southern sides of both STMW and CMW (Figures 3B and 5B).
During the large-scale freshening period, the migration of the core surfaces of the anomalies found in the STMW and CMW distribution regions was from γ < 25.0 before 2009 to γ = 25.5 in 2012 and finally to γ = 26.0–26.5 since 2015 (Figures 13B,D). The migration of the signal coincided with the delay from the light to the dense layers as shown in the STMW time series (Figure 2C). The occurrence time of the anomalies showed no vertical delay in both the STMW and the CMW formation regions (Figures 13A,C); thus, the vertical migration of an anomaly core in the distribution regions can be explained by a northward shift of the outcropping position, the accompanying longer subduction path of denser isopycnals (Figures 8 and Figure 9), and a decrease in the geostrophic speed with depth. Its synchronization between STMW and CMW suggested sharing common causes on decadal to longer time scales in the salinity anomalies found in both STMW and CMW. Meanwhile, the interannual variations in the CMW were also influenced by other processes in the mixed layer of the formation region.
However, the connections between the thermocline and the mixed layer anomalies in mode water formation regions and the vertical delay in mode water distribution regions did not apply to the eastern subtropics. Instead, almost in the same year, spiciness anomalies in the ESTMW distribution region appeared at γ = 24.5–26.0 with the strongest signals at γ = 25.0–25.5. In the ESTMW formation region at γ = 25.0–26.0 (Figure 13E), a positive anomaly during 2005–2007 or a negative anomaly during 2012–2014 was not found in the earlier mixed layer. Another positive anomaly occurred at the mixed layer and γ = 26.0–26.5 isopycnals almost the same time during 2015–2017, which suggested sources of anomalies other than outcropping. Coincidently, the above three anomalies were intensified downstream after leaving the outcrop line during 2005–2007, 2013–2015, and 2016–2018 on the distance-time diagram along γ = 25.3 isopycnal (Figure 10). An intensification of the anomalies was also observed widely at γ = 25.0–25.7 in the ESTMW distribution region (Figure 13F) during 2006–2007, 2014–2015, and 2017–2018. The former two cases of downstream intensification were consistent with a study at σθ = 25.0–25.2 near the ESTMW formation region (Katsura, 2018). These were explained by the subsurface spice injection that occurred at the base of the ESTMW. In our Tu maps (see Supplementary Material), Tu values >71.6° were distributed widely in 150–135°W, 23–30°N at γ = 25.2–25.3, which was at the base of the ESTMW from March to May and found during February to September, indicating conditions favorable to salt-finger double-diffusive convection during the formation and dissipation periods of the ESTMW. Considering the similar behaviors found among the three cases, the new positive anomaly that occurred near the outcrop line in 2016 and intensified downstream during 2017–2018 was likely due to the salt-finger double-diffusion.
4 Discussion
4.1 Meridional shift of the outcrop line
The spiciness anomalies in the thermocline were connected to the mixed layer in most cases (Section 3.5), especially in the western to central subtropics; therefore, we looked at the changes in the mixed layer near the outcrop line. Modeling studies indicated that a meridional shift of the outcrop line determined the spiciness variability in the western North Pacific at σθ = 25.4, i.e., warm-salty (cold-fresh) anomalies with a distinct equatorward (poleward) shift (Nonaka and Sasaki, 2007; Ogata and Nonaka, 2020). We examined the influence of the meridional shift of outcrop line on the spiciness anomalies in the observations and the application of the shift mechanism in the central and eastern North Pacific. The latitudes of the late winter outcrop line, the salinity anomalies in the mixed layer along the winter outcrop line, and the late winter MLD are shown in Figure 14.
In the formation region of the STMW (outcrop line of γ = 25.3 in 140–160°E shown in Figure 14A), the outcrop line position was in the north most (south most) during 2009–2011 (2005 and 2017). The northward (southward) migration of the outcrop line of γ = 25.3 was also found on Figure 8 in 2010 (2017) near 150°E. The mixed layer salinity along the outcrop line was dominated by negative (positive) anomalies, which were synchronized with the negative (positive) spiciness anomalies in the STMW distribution region at γ = 25.3 during the same period (Figure 8). The peaks and troughs in the weight-averaged salinity time series in the STMW below the MLD (Figure 5) were also consistent with the above variations with a delay of 1 year. Meanwhile, the late winter MLD along the outcrop line also correlated with the salinity anomalies but was not as good as the latitudinal position. A deeper (shallower) MLD was accompanied by an increase (decrease) of the spiciness anomalies in STMW in 2005, 2011, and 2017 (2006 and 2008) (Figure 5), but this was not applicable in 2016. However, the changes in MLD did not show a clear relationship with the salinity anomalies in the mixed layer, suggesting that the deepening (shoaling) of the MLD influenced the STMW salinity most likely through dynamic mechanisms.
While a study (Ogata and Nonaka, 2020) explained the spiciness anomalies in the western North Pacific by the meridional shift of outcrop line around the central-eastern North Pacific, we found that the anomalies were more consistent with the meridional shift of outcrop line and the accompanying mixed layer anomalies in the western North Pacific (Figures 14B, C). They were also not synchronized with the anomalies in the eastern North Pacific.
To further investigate whether the signals in the northeastern Pacific propagated to the western subtropics, we checked the time-longitude diagram of salinity anomalies at γ = 25.3 that were averaged in 25–30°N (see Supplementary Material Figure 4). The continuous westward propagation of salinity anomalies from 160°W to 145°N during 1998–2001 based on OGCM (Figure 9 in Ogata and Nonaka, 2020) is not shown here. Instead, we observed different propagations between the eastern and the western sides. The positive (negative) anomalies that originated at 130°W in 2006 (2009) propagated westward up to 180° in 2010 (2013) and did not spread to the west. Meanwhile, the anomalies in the western subtropics showed later propagation with a small amplitude back to 170°E in 2009. However, the anomalies that originated around 170°W in 2012 and 2014 showed later eastward propagation with a high amplitude to the eastern boundary. The results supported that the salinity anomalies in the western subtropics were generated mainly in the northwestern subtropics rather than the eastern subtropics. This is in agreement with the origin and pathway suggested by other groups (Yan et al., 2017; Oka et al., 2019).
In the annual mean maps of spiciness anomalies shown in Figure 8, the anomalies appeared initially at the same time in the center of the STMW formation region and 160°E to 160°W near the outcrop line. It was most likely explained by the large-scale and simultaneous changes that occurred in the entire outcropping region. This was supported by the synchronized vertical migration of low-frequency signals between the western and the central subtropics (Figures 13B, D). The above results did not follow the continuous propagation from 30°N, 160°W to the western subtropics, which were shown in previous experiments (Ogata and Nonaka, 2020). In addition, the results were not in agreement with the “subtropical pathway” of anomalies, which originated in the eastern subtropics to the tropics and propagated westward in the subtropics and then northeastward along the Kuroshio path toward the midlatitudes, proposed in another study (Zhang and Liu, 1999). Since the zonal propagation of the anomalies around the central to eastern latitudes showed different directions in different years (see Supplementary Material Figure 4), further work is needed to clarify whether the disagreement of propagation path was caused by models or different events in different years.
We also investigated the influence of the meridional shifts of outcrop line in the CMW and ESTMW, and found it applicable to the CMW only. In the CMW formation region, a more southern outcrop line, which was accompanied by a large mixed layer salinity along the line was observed during the early years (i.e., 2005–2006 and 2008–2010). A more northern outcrop line, which was associated with a small mixed layer salinity was observed in the second half of the data period (i.e., 2011, 2014–2015, and 2017). This was also shown in the annual mean maps (Figure 9), in which the outcrop line of γ = 26.3 had a more northern position near 170°E–180° in the second half of the periods. This was consistent with the significant freshening trend of CMW salinity (Figure 6). In addition, the further north outcrop line and fresher mixed layer in 2007 and 2011 caused the interannual variations observed in the northern part of the CMW (Figure 6B and Figure 9).
The above relationship was not applicable in the ESTMW. During 2004–2005 and 2014–2015 (2007, 2013, and 2017–2018), the outcrop line at γ = 25.0 in the ESTMW formation region (150–130°W) shifted poleward (equatorward). The mixed layer salinity along the line was dominated by negative (positive) anomalies; however, the corresponding salinity variations were not found in the subducted ESTMW (Figure 7). Synchronized significant anomalies were detected at γ = 25.0 only near the center of the ESTMW formation region (30°N, 140°W) and were not found in 2005 (2017) (Figure 8). The above results combined with limited connections of anomalies between the mixed layer and the denser isopycnals in the ESTMW (Figure 13) suggested that the outcrop line shift and the accompanying salinity anomalies in the mixed layer in eastern subtropics only influenced the near center of the ESTMW formation region. Meanwhile, the spiciness anomalies in the downstream region and the denser layers were caused by other processes such as spice injection. The more limited influence of the mixed layer on spiciness anomalies in the ESTMW than both the STMW and CMW was related to the distinct vertical structure in the ESTMW. The water was cooler and fresher below the ESTMW, which is favorable to cause the rapid dissipation of the ESTMW through a salt-finger type convection (Sugimoto and Hanawa, 2007; Toyama and Suga, 2010).
4.2 Correlation with KE index and PDO
The decadal variability of salinity in the core surface of the STMW (γ = 25.3) was very consistent with the decadal variability of the KE between a stable and an unstable dynamic state (Qiu and Chen, 2005; Qiu et al., 2014; Qiu et al., 2021). The KEI changed to negative (positive) in 2005 (2009), which meant that the KE became unstable (stable) and the salinity in the STMW on its core surface (γ = 25.3) began to decrease (increase) in 2006 (2010) (see Supplementary Material Figure 5A). This was explained by fresh or cool water, which was transported from the north of the KE to the STMW formation region and accompanied by high eddy activity in the KE located further north during the unstable KE state (Oka et al., 2017). Through lagged-correlation analysis, we found that the KEI led salinity change rate of the STMW for 7–12 months at γ = 25.00–25.45 with a high correlation (R = 0.56–0.72), with shorter lag on lighter layer. Meanwhile, the lag at γ = 25.50–25.60 was longer than 2 years with a lower correlation (R = 0.44). In addition, the lag for the change rate of the STMW total salinity was 1 year with R = 0.65. This correlation coefficient was similar to that found in a previous study (Oka et al., 2017), which reported a correlation R = 0.63 between the annual mean KE index and the annual change of the winter mixed layer salinity at 30–35°N, 144°E during 1993–2015; however, the result of the study was without a time lag. We also calculated the correlation between KEI and the STMW salinity in 30–35°N and found lags of several months. Our results implied that the KE state variability generated directly the salinity anomalies in the winter mixed layer and the signals were subducted to the thermocline within 1 year from the lighter surface to the denser surface. However, it takes 2–3 years for KE to change the salinity of the entire STMW, which is also shown in Figure 11B.
The further north position of KE and large eddy activities during unstable KE state that transport negative spiciness anomalies southward to the STMW may also transport positive anomalies (warm and salty water) northward to the CMW, which has been hypothesized for the late 1980s regime shift (Suga et al., 2012). Therefore, it is natural to ask whether the salinity change rate in the CMW will show a negative correlation with the KEI. However, their negative correlation was found only with a 3–4-year lead of the CMW (R = −0.5 to −0.3) (see Supplementary Material Figure 5C).
In correlation with PDO, CMW salinity decreased significantly after PDO phase shifted from negative to positive in 2014 (Figure 6 and Supplementary Material Figure 6A). This is consistent with the negative correlations revealed by previous studies during the climate shifts in 1976/77 and 1988/89 (Yasuda and Hanawa, 1997; Suga et al., 2003). However, the correlation between the time series of PDO and CMW was not good. The time change rates of CMW salinity did not show a significant correlation with PDO index at zero lag but showed a weak correlation (R = 0.4) at lag = 1.5–2 years and a negative correlation (R = –0.4) at lag = -1– -2 years (see Supplementary Material Figure 6C). This indicated that though the regime shift of PDO can cause abrupt changes in CMW properties, the impact of PDO related processes on interannual salinity changes is limited. The lag from CMW and PDO to KEI was likely related to the transport of the anomalies originated at the central North Pacific related to PDO to the KE system in 3–5 years (Deser et al., 1999; Schneider et al., 2002; Oka et al., 2015; Newman et al., 2016; Joh and Di Lorenzo, 2019), but further investigation was needed to examine it.
A clear distinction between L-CMW and D-CMW in the correlation of salinity change rate with KE or PDO was not found; however, previous studies have suggested changes in the proportion of L-CMW and D-CMW and separated changes in their formation regions caused by KE (Oka et al., 2012; Kawakami et al., 2016) and PDO (Ladd and Thompson, 2002; Suga et al., 2003; Hu et al., 2011). The change rate of thickness-weighted total salinity in a mode water and the spiciness anomalies on a thin surface showed different results in the lagged-correlation between KE and CMW, PDO and STMW, and PDO and CMW; thus, it will be useful to conduct similar analyses using other tracers, thickness anomalies of isopycnals, besides spiciness anomalies.
The PDO index showed a positive correlation (R = 0.6) with a rate of change of thickness-weighted salinity of the STMW with a lag of 1 year; however, the correlation in each surface during a 1-year lag was weak compared to lags that were too long compared to the data length (e.g., 6-year lags). Also at a 1-year lag, the PDO index and the ESTMW salinity change rate showed negative correlations. The negative correlation in the ESTMW salinity was coincident with a previously reported negative correlation found between ESTMW thickness and PDO index at a 1-year lag reported (Katsura, 2018). A negative correlation between ESTMW volume and PDO index was also indicated by another group (Guo et al., 2018).
In general, the PDO correlated with the salinity change rate in both STMW and ESTMW at a 1-year lag. It was also related to the CMW at negative lags of −1 to −2 years. Previous studies have investigated the influences of PDO-related activities on formation regions and the volume changes in mode waters (e.g., Qu and Chen, 2009; Toyama, 2015; Guo et al., 2018); however, only a few studies have shown the consequent changes in salinity (Yasuda and Hanawa, 1997; Suga et al., 2003). Here we provided some evidence on the correlation between PDO and salinity in mode waters. We found a large-scale freshening and a good agreement among interannual spiciness anomalies in formation regions of the STMW and the central Pacific. These suggest a potentially common cause of spiciness anomalies in the entire outcropping region. The correlation between PDO and salinity anomalies in the considered three mode waters supports our hypothesis on a vital role of PDO-related large-scale changes (e.g., the migration of temperature-salinity fronts and changes of gyre strength) in the generation of spiciness anomalies in midlatitude, which can influence the subsurface through the mode water life cycle.
5 Summary and conclusion
Observational data sets provided by Argo floats were used to investigate the spiciness anomalies and their propagation in the upper North Pacific during 2004–2018. The temporal and spatial evolutions of the spiciness anomalies were illustrated with a focus on the three mode waters (i.e., STMW, CMW, and ESTMW), which were defined by their density range, location, and low Q limitation (Figure 3). The primary results of the study are summarized in Figure 15. In general, the spiciness anomalies were generated mostly in the formation regions of the mode waters (i.e., the outcropping region of the isopycnals). The seasonal and year-to-year variations were dampened largely within the upstream part. Meanwhile, the low-frequency variations were preserved downstream. They propagated and decayed in the direction of geostrophic currents. However, some cases showed cross-streamline propagation and some cases were not caused by mixed layer changes.
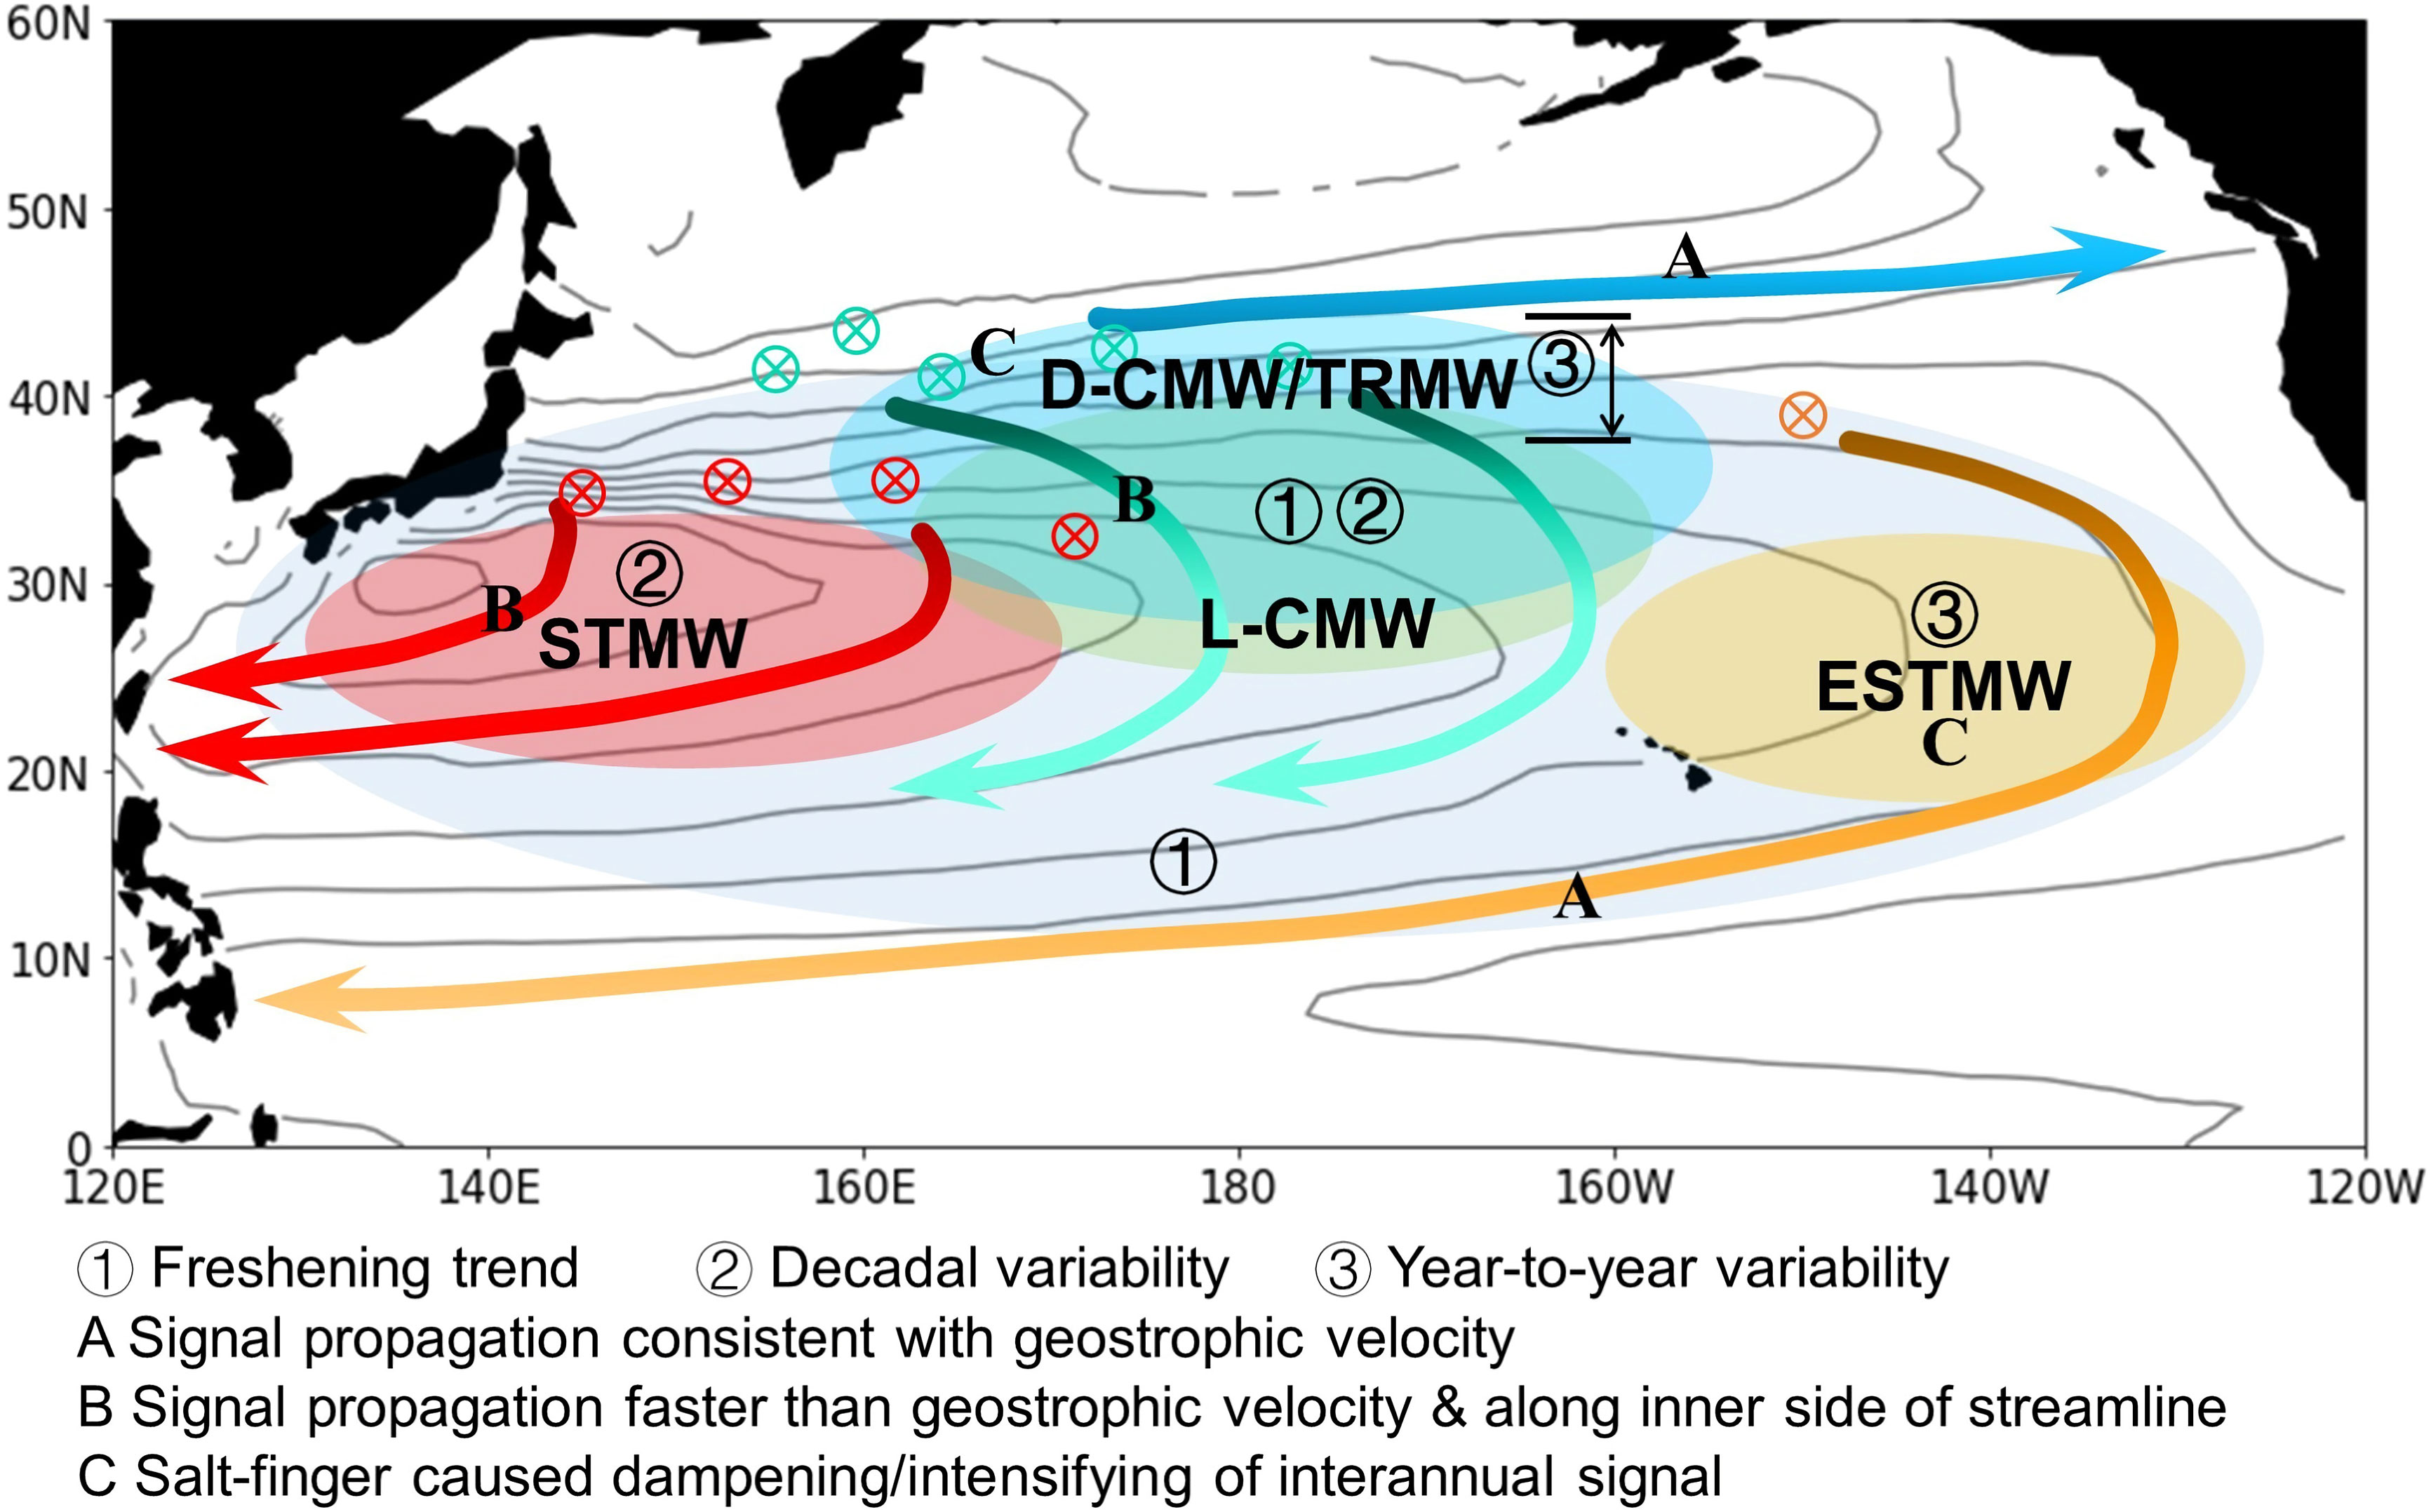
Figure 15 A schematic map illustrating the propagation pathways of the spiciness anomalies. Gray contours in the background indicate streamlines that were averaged on γ = 24.4–26.5. Crosses with a circle indicate subduction of the mixed layer salinity anomalies.
A freshening trend in the thermocline of the subtropical gyre at a density range consistent with CMW and NPIW (γ = 25.7–27) was observed at large scale. It was connected to an intense freshening of the surface layer, which was near the northern boundary of the subtropical gyre. It was capped with a salinification trend in a sea surface and a layer corresponding to the NPTW (Figure 4). The density and rate of the freshening during 2004–2018 were consistent with the long-term freshening, which was detected dating back to the 1960s (Wong et al., 2001; Nakano et al., 2007; Oka et al., 2017), and were different from those of the rapid freshening of the upper thermocline since the 1990s (Lukas, 2001; Nakano et al., 2015; Nan et al., 2015; Oka et al., 2017).
In the STMW, the salinity was dominated by a quasi-decadal variability (Figure 5). On its core surface (25.3 γ), the spiciness anomalies appeared initially simultaneously in the STMW formation region and the central latitudes. They were found to spread southwestward to the entire domain of the STMW in 1–2 years. They disappeared finally at the western boundary without spreading northeastward after a direction change in geostrophic currents (Figures 1, 8, and 11). The southwestward propagation speed of the spiciness anomalies in the western subtropics was in the range of 0.06–0.09 m/s, almost twice the geostrophic current speed (Figure 11), suggesting additional transport by eddies. Among isopycnals, the spiciness anomalies were relatively homogeneous in the STMW; however, they showed a delay from 25.00 γ to 25.60 γ during several months. These differed from the simultaneous decadal salinity variations found among latitudes and isopycnals along the 137°E (Oka et al., 2017).
The interannual and longer variability in the CMW during the Argo period were described for the first time. Salinity in the CMW showed a significant decreasing trend of −0.004/year, which was part of the large-scale freshening of the entire subtropics in the density range that was centered at 26.3 γ and quasi-decadal variability that was out of phase with the salinity of the STMW (Figures 6, 9). CMW salinity decreased abruptly after the phase shift of PDO from positive to negative in 2014. The spiciness anomalies at 26.3 γ appeared initially near the western part of the CMW formation region. They spread both southward to the majority of the CMW within the subtropical gyre and eastward to the eastern boundary near the boundary between the subtropical and subpolar gyres (Figure 9). Their propagation pathway in the subtropical gyre was not strictly along the geostrophic current; however, it was in the inner side of the gyre with a large southward component (Figure 12), which was likely caused by eddy transport. While low-frequency signals were propagated from the northern to the southern parts of the CMW with a 2-year delay, the robust year-to-year variations were confined to the northern part and the formation region of the CMW, where strong spiciness fronts existed (Figures 6, 9, and 12). These were likely due to double-diffusion related to the modification of the TRMW. In addition, L-CMW (γ < 26.20) and D-CMW (γ > 26.20), which have different formation regions, showed different year-to-year variations in a number of years.
In the ESTMW, the salinity values with a total time scale of 3–4 years (Figure 7) showed larger seasonal and year-to-year variations than the other water masses. The spiciness anomalies appeared initially near its formation region and propagated clockwise in a direction and velocity that were consistent with the geostrophic currents. They finally arrived at the western boundary in the western tropics (Figures 8, Figure 10). The transport times across the domain of the ESTMW for the spiciness anomalies were within 1 year, which were shorter than the other water masses considered. Among different isopycnals, the spiciness anomalies between the light part (γ < 24.85) and dense part (γ > 24.85) of the ESTMW showed different year-to-year variations without a steady lag; however, the ranges found in their raw salinity were uniform (Figures 2C, 3C, and 4C).
Furthermore, we discussed the origins of the spiciness anomalies in the thermocline. In the western to central subtropics, the interannual spiciness anomalies in the thermocline were synchronized with the meridional shift of the outcrop lines of the isopycnals and the consequent interannual salinity anomalies in the mixed layer near the outcrop line - (negative salinity anomalies with further north outcrop line), with a lag of no longer than one year (Figures 13, 14). Our results indicated that the spiciness anomalies observed in STMW and CMW were generated mainly in and subducted from the western to central parts of their outcropping region. In addition, the STMW salinity change rate and KEI (R = 0.65) showed good correlation at a lag shorter than one year. These suggested that the decadal variability in the STMW salinity was caused by the decadal variability of the KE. With the above associations and the continuous propagation of the spiciness anomalies, which were different between western and eastern subtropics (Figures 8, 13), we demonstrated the western pathway from the KE region to the western subtropics. It was consistent with some previous findings (Yan et al., 2017; Oka et al., 2019) but not with a pathway from the eastern subtropics-tropics to the western subtropics as supported by other results (Zhang and Liu, 1999; Ogata and Nonaka, 2020).
Meanwhile, in eastern subtropics, a few interannual signals appeared in the thermocline without a corresponding earlier occurrence in the mixed layer (Figures 13, 14). These signals intensified after leaving the outcrop line (Figures 10 and Figure 13). Notably, spiciness anomalies in the thermocline that corresponded to the meridional shifts of the outcrop line and the accompanying mixed layer salinity anomalies were found only near the center of ESTMW formation region. This implied the limited contribution of the mixed layer salinity variations in the generation of the spiciness anomalies in the eastern subtropics. It also provided new evidence for the contributions of spice injection after the work of Katsura (Katsura, 2018).
The main subject of this study was the spiciness anomalies that were subducted to the thermocline; therefore, we provided concise explanations of the generation mechanisms involved. However, there are several issues that remain to be explained. For example, we need to clarify the relationships of PDO with the salinity changes in both STMW and ESTMW at 1-year lag and relate them to large-scale teleconnections. We also need to explain in more detail the delay from CMW salinity change rate to KEI. Ongoing investigations of the variations of mode water thickness and core density are expected to extend the understanding on the generation mechanisms of water mass anomalies. In addition, we found that the propagation speeds of the spiciness anomalies were obviously faster than the mean geostrophic current in western subtropics, and the spread of the spiciness anomalies were inclined to the inner side of the relevant streamlines and linked with eddy effects. This is consistent with and could explain why the Fukushima-derived radioactive cesium was observed across the STMW and the CMW in 1–2 years after the accident, whose rapid transport cannot be explained by the large-scale geostrophic currents (Kumamoto et al., 2014; Yoshida et al., 2015; Aoyama et al., 2016; Kaeriyama, 2017). However, the spatial resolution of the Argo data was unable to resolve the mesoscale eddies; therefore, the eddy effect was not examined. In future work, we will take into account mesoscale to submessoscale eddies and the interannual variations of the geostrophic currents, and estimate the contributions of the different processes involved in the propagation of signals based on both Argo observations and eddy-resolving models.
Data availability statement
The original contributions presented in the study are included in the article/Supplementary Material. Further inquiries can be directed to the corresponding author.
Author contributions
TW, TS, and SK contributed to conception and design of the study. SK conducted the original data processing. TW performed the computations and analyses. TS supervised the work and helped interpreting the results. TW wrote the first draft of the manuscript. TS and SK provided constructive recommendations on the manuscript writing. All authors contributed to the article and approved the submitted version.
Funding
This work was supported by The International Joint Graduate Program in Earth and Environmental Sciences, Tohoku University (GP-EES), JSPS KAKENHI Grant JP19H05700, and JST SICORP Grant JPMJSC21E7. The open access publishing fee was supported by JSPS KAKENHI Grant JP19H05700.
Acknowledgments
The authors thank the members of the Physical Oceanography Group at Tohoku University and Prof. Bo Qiu, Prof. Kelvin Richards, and Prof. Niklas Schneider at University of Hawai’i at Mānoa for meaningful discussions and suggestions.
Conflict of interest
The authors declare that the research was conducted in the absence of any commercial or financial relationships that could be construed as a potential conflict of interest.
The reviewer HM declared a shared affiliation with the authors TS and SK to the handling editor at the time of review.
Publisher’s note
All claims expressed in this article are solely those of the authors and do not necessarily represent those of their affiliated organizations, or those of the publisher, the editors and the reviewers. Any product that may be evaluated in this article, or claim that may be made by its manufacturer, is not guaranteed or endorsed by the publisher.
Supplementary material
The Supplementary Material for this article can be found online at: https://www.frontiersin.org/articles/10.3389/fmars.2022.1006042/full#supplementary-material
References
Allen M. R., Ingram W. J. (2002). Constraints on future changes in climate and the hydrologic cycle. Nature 419, 228–232. doi: 10.1038/nature01092
Aoyama M., Hamajima Y., Hult M., Uematsu M., Oka E., Tsumune D., et al. (2016). 134Cs and 137Cs in the north pacific ocean derived from the march 2011 TEPCO fukushima dai-ichi nuclear power plant accident, japan. part one: surface pathway and vertical distributions. J. Oceanogr. 72, 53–65. doi: 10.1007/s10872-015-0335-z
Argo (2019). Argo float data and metadata from global data assembly centre (Argo GDAC) - snapshot of argo GDAC of July 8st 2019. SEANOE. doi: 10.17882/42182#64916
Bindoff N. L., McDougall T. J. (1994). Diganosing climate change and ocean ventilation using hydrographic data. J. Phys. Oceanogr. 24, 1137–1152. doi: 10.1175/1520-0485(1994)024<1137:DCCAOV>2.0.CO;2
Bingham F. M. (1992). Formation and spreading of subtropical mode water in the north pacific. J. Geophys. Res. 97. doi: 10.1029/92jc01001
Cannon G. A. (1966). Tropical waters in the western pacific ocean, august-September 1957. Deep. Res. Oceanogr. Abstr. 13, 1139–1148. doi: 10.1016/0011-7471(66)90705-4
Cerovecki I., Giglio D. (2016). North pacific subtropical mode water volume decrease in 2006-09 estimated from argo observations: Influence of surface formation and basin-scale oceanic variability. J. Clim. 29, 2177–2199. doi: 10.1175/JCLI-D-15-0179.1
Deser C., Alexander M. A., Timlin M. S. (1999). Evidence for a wind-driven intensification of the kuroshio current extension from the 1970s to the 1980s. J. Clim. 12, 1697–1706. doi: 10.1175/1520-0442(1999)012<1697:EFAWDI>2.0.CO;2
Endoh T., Jia Y., Richards K. J. (2006). Sensitivity of the ventilation process in the north pacific to eddy-induced tracer transport. J. Phys. Oceanogr. 36, 1895–1911. doi: 10.1175/JPO2941.1
Furue R., Takatama K., Sasaki H., Schneider N., Nonaka M., Taguchi B. (2018). Impacts of sea-surface salinity in an eddy-resolving semi-global OGCM. Ocean Model. 122, 36–56. doi: 10.1016/j.ocemod.2017.11.004
Guo Y., Lin X., Wei M., Liu C., Men G. (2018). Decadal variability of north pacific Eastern subtropical mode water. J. Geophys. Res. Ocean. 123, 6189–6206. doi: 10.1029/2018JC013890
Gu D., Philander S. G. H. (1997). Interdecadal climate fluctuations that depend on exchanges between the tropics and extratropics. Sci. (80-.). 275, 805–807. doi: 10.1126/science.275.5301.805
Hanawa K. (1987). Interannual variations of the winter-time outcrop area of subtropical mode water in the western north pacific ocean. Atmos. - Ocean 25, 358–374. doi: 10.1080/07055900.1987.9649280
Hanawa K., Sugimoto S. (2004). ‘Reemergence’ areas of winter sea surface temperature anomalies in the world’s oceans. Geophys. Res. Lett. 31, n/a–n/a. doi: 10.1029/2004GL019904
Hanawa K., Talley D. L. (2001). “Chapter 5.4 mode waters,” in International geophysics (San Diergo, Sydney: Academic Press), 373–386. doi: 10.1016/S0074-6142(01)80129-7
Hamed K. H., Ramachandra Rao A. (1998). A modified Mann-Kendall trend test for autocorrelated data. J. Hydrol. 204, 182–196. doi: 10.1016/S0022-1694(97)00125-X
Hautala S. L., Roemmich D. H. (1998). Subtropical mode water in the northeast pacific basin. J. Geophys. Res. Ocean. 103, 13055–13066. doi: 10.1029/98jc01015
Held I. M., Soden B. J. (2006). Robust responses of the hydrological cycle to global warming. J. Clim. 19, 5686–5699. doi: 10.1175/JCLI3990.1
Helm K. P., Bindoff N. L., Church J. A. (2010). Changes in the global hydrological-cycle inferred from ocean salinity. Geophys. Res. Lett. 37, 18701. doi: 10.1029/2010GL044222
Hosoda S., Ohira T., Sato K., Suga T. (2010). Improved description of global mixed-layer depth using argo profiling floats. J. Oceanogr. 66, 773–787. doi: 10.1007/s10872-010-0063-3
Hosoda S., Suga T., Shikama N., Mizuno K. (2009). Global surface layer salinity change detected by argo and its implication for hydrological cycle intensification. J. Oceanogr. 65, 579–586. doi: 10.1007/s10872-009-0049-1
Hosoda S., Xie S.-P. P., Takeuchi K., Nonaka M. (2004). Interdecadal temperature variations in the north pacific central mode water simulated by an OGCM. J. Oceanogr. 60, 865–877. doi: 10.1007/s10872-005-5779-0
Hu H., Liu Q., Yuan Z., Liu W. (2011). Variability of subduction rates of the subtropical north pacific mode waters. Chin. J. Oceanol. Limnol. 29, 0–000. doi: 10.1007/s00343-011-0000-0
Joh Y., Di Lorenzo E. (2019). Interactions between kuroshio extension and central tropical pacific lead to preferred decadal-timescale oscillations in pacific climate. Sci. Rep. 9, 1–12. doi: 10.1038/s41598-019-49927-y
Johnson G. C. (2006). Generation and initial evolution of a mode water θ- s anomaly. J. Phys. Oceanogr. 36, 739–751. doi: 10.1175/JPO2895.1
Kaeriyama H. (2017). Oceanic dispersion of fukushima-derived radioactive cesium: a review. Fish. Oceanogr. 26, 99–113. doi: 10.1111/fog.12177
Katsura S. (2018). Properties, formation, and dissipation of the north pacific Eastern subtropical mode water and its impact on interannual spiciness anomalies. Prog. Oceanogr. 162, 395–410. doi: 10.1016/j.pocean.2018.02.023
Katsura S., Oka E., Qiu B., Schneider N. (2013). Formation and subduction of north pacific tropical water and their interannual variability. J. Phys. Oceanogr. 43, 2400–2415. doi: 10.1175/JPO-D-13-031.1
Kawakami Y., Sugimoto S., Suga T. (2016). Inter-annual zonal shift of the formation region of the lighter variety of the north pacific central mode water. J. Oceanogr. 72, 225–234. doi: 10.1007/s10872-015-0325-1
Kolodziejczyk N., Gaillard F. (2012). Observation of spiciness interannual variability in the pacific pycnocline. J. Geophys. Res. Ocean. 117, 1–19. doi: 10.1029/2012JC008365
Kolodziejczyk N., Reverdin G., Gaillard F., Lazar A. (2014). Low-frequency thermohaline variability in the subtropical south Atlantic pycnocline during 2002-2013. Geophys. Res. Lett. 41, 6468–6475. doi: 10.1002/2014GL061160
Kouketsu S., Osafune S., Kumamoto Y., Uchida H. (2017). Eastward Salinity anomaly propagation in the intermediate layer of the north pacific. J. Geophys. Res. Ocean. 122, 1590–1607. doi: 10.1002/2016JC012118
Kouketsu S., Tomita H., Oka E., Hosoda S., Kobayashi T., Sato K. (2012). The role of meso-scale eddies in mixed layer deepening and mode water formation in the western north pacific. J. Oceanogr. 68, 63–77. doi: 10.1007/s10872-011-0049-9
Kumamoto Y., Aoyama M., Hamajima Y., Aono T., Kouketsu S., Murata A., et al. (2014). Southward spreading of the fukushima-derived radiocesium across the kuroshio extension in the north pacific. Sci. Rep. 4, 1–9. doi: 10.1038/srep04276
Ladd C., Thompson L. A. (2000). Formation mechanisms for north pacific central and Eastern subtropical mode waters. J. Phys. Oceanogr. 30, 868–887. doi: 10.1175/1520-0485(2000)030<0868:FMFNPC>2.0.CO;2
Ladd C., Thompson L. A. (2002). Decadal variability of north pacific central mode water*. J. Phys. Oceanogr. 32, 2870–2881. doi: 10.1175/1520-0485(2002)032<2870:DVONPC>2.0.CO;2
Li Y., Wang F. (2015). Thermocline spiciness variations in the tropical Indian ocean observed during 2003-2014. Deep. Res. Part I Oceanogr. Res. Pap. 97, 52–66. doi: 10.1016/j.dsr.2014.12.004
Li Y., Wang F., Sun Y. (2012). Low-frequency spiciness variations in the tropical pacific ocean observed during 2003-2012. Geophys. Res. Lett. 39, n/a–n/a. doi: 10.1029/2012GL053971
Li G., Zhang Y., Xiao J., Song X., Abraham J., Cheng L., et al. (2019). Examining the salinity change in the upper pacific ocean during the argo period. Clim. Dyn. 53, 6055–6074. doi: 10.1007/s00382-019-04912-z
Lukas R. (2001). Freshening of the upper thermocline in the north pacific subtropical gyre associated with decadal changes of rainfall. Geophys. Res. Lett. 28, 3485–3488. doi: 10.1029/2001GL013116
Lukas R., Santiago-Mandujano F. (2008). Interannual to interdecadal salinity variations observed near Hawaii: Local and remote forcing by surface freshwater fluxes. Oceanography 21, 46–55. doi: 10.5670/oceanog.2008.66
Luo Y. (2005). On the connection between south pacific subtropical spiciness anomalies and decadal equatorial variability in an ocean general circulation model. J. Geophys. Res. 110, C10002. doi: 10.1029/2004JC002655
Mantua N. J., Hare S. R., Zhang Y., Wallace J. M., Francis R. C. (1997). A pacific interdecadal climate oscillation with impacts on salmon production. Bull. Am. Meteorol. Soc 78, 1069–1079. doi: 10.1175/1520-0477(1997)078<1069:APICOW>2.0.CO;2
Masuzawa J. (1969). Subtropical mode water. Deep. Res. Oceanogr. Abstr. 16, 463–472. doi: 10.1016/0011-7471(69)90034-5
McDougall T. J., Klocker A. (2010). An approximate geostrophic streamfunction for use in density surfaces. Ocean Model. 32, 105–117. doi: 10.1016/j.ocemod.2009.10.006
Miyazawa Y., Zhang R., Guo X., Tamura H., Ambe D., Lee J. S., et al. (2009). Water mass variability in the Western north pacific de- tected in a 15-year eddy resolving ocean reanalysis. J. Oceanogr. 65, 737–756. doi: 10.1007/s10872-009-0063-3
Montgomery R. B. (1937). A suggested method for representing gradient flow in isentropic surfaces. Bull. Am. Meteorol. Soc 18, 210–212. doi: 10.1175/1520-0477-18.6-7.210
Nakamura H. (1996). A pycnostad on the bottom of the ventilated portion in the central subtropical north pacific: Its distribution and formation. J. Oceanogr. 52, 171–188. doi: 10.1007/BF02235668
Nakano T., Kaneko I., Soga T., Tsujino H., Yasuda T., Ishizaki H., et al. (2007). Mid-depth freshening in the north pacific subtropical gyre observed along the JMA repeat and WOCE hydrographic sections. Geophys. Res. Lett. 34, 1–6. doi: 10.1029/2007GL031433
Nakano T., Kitamura T., Sugimoto S., Suga T., Kamachi M. (2015). Long-term variations of north pacific tropical water along the 137°E repeat hydrographic section. J. Oceanogr. 71, 229–238. doi: 10.1007/s10872-015-0279-3
Nan F., Yu F., Xue H., Wang R., Si G. (2015). Ocean salinity changes in the northwest pacific subtropical gyre: The quasi-decadal oscillation and the freshening trend. J. Geophys. Res. C Ocean. 120, 2179–2192. doi: 10.1002/2014JC010536
Newman M., Alexander M. A., Ault T. R., Cobb K. M., Deser C., Di Lorenzo E., et al. (2016). The pacific decadal oscillation, revisited. J. Clim. 29, 4399–4427. doi: 10.1175/JCLI-D-15-0508.1
Nishikawa S., Tsujino H., Sakamoto K., Nakano H. (2010). Effects of mesoscale eddies on subduction and distribution of subtropical mode water in an eddy-resolving OGCM of the Western north PACIFIC. J. Phys. Oceanogr. 40, 1748–1765. doi: 10.1175/2010JPO4261.1
Nishikawa S., Tsujino H., Sakamoto K., Nakano H. (2013). Diagnosis of water mass transformation and formation rates in a high-resolution GCM of the north pacific. J. Geophys. Res. Ocean. 118, 1051–1069. doi: 10.1029/2012JC008116
Nonaka M., Sasaki H. (2007). Formation mechanism for isopycnal temperature-salinity anomalies propagating from the Eastern south pacific to the equatorial region. J. Clim. 20, 1305–1315. doi: 10.1175/JCLI4065.1
Nonaka M., Xie S.-P. (2000). Propagation of north pacific interdecadal subsurface temperature anomalies in an ocean GCM. Geophys. Res. Lett. 27, 3747–3750. doi: 10.1029/2000GL011488
Ogata T., Nonaka M. (2020). Mechanisms of long-term variability and recent trend of salinity along 137°E. J. Geophys. Res. Ocean. 125. doi: 10.1029/2019JC015290
Oka E., Katsura S., Inoue H., Kojima A., Kitamoto M., Nakano T., et al. (2017). Long-term change and variation of salinity in the western north pacific subtropical gyre revealed by 50-year long observations along 137°E. J. Oceanogr. 73, 479–490. doi: 10.1007/s10872-017-0416-2
Oka E., Kouketsu S., Toyama K., Uehara K., Kobayashi T., Hosoda S., et al. (2011). Formation and subduction of central mode water based on profiling float data 2003-08. J. Phys. Oceanogr. 41, 113–129. doi: 10.1175/2010JPO4419.1
Oka E., Kouketsu S., Yanagimoto D., Ito D., Kawai Y., Sugimoto S., et al. (2020). Formation of central mode water based on two zonal hydrographic sections in spring 2013 and 2016. J. Oceanogr. 76, 373–388. doi: 10.1007/s10872-020-00551-9
Oka E., Qiu B., Kouketsu S., Uehara K., Suga T. (2012). Decadal seesaw of the central and subtropical mode water formation associated with the kuroshio extension variability. J. Oceanogr. 68, 355–360. doi: 10.1007/s10872-011-0098-0
Oka E., Qiu B., Takatani Y., Enyo K., Sasano D., Kosugi N., et al. (2015). Decadal variability of subtropical mode water subduction and its impact on biogeochemistry. J. Oceanogr. 71, 389–400. doi: 10.1007/s10872-015-0300-x
Oka E., Suga T. (2003). Formation region of north pacific subtropical mode water in the late winter of 2003. Geophys. Res. Lett. 30 2205. doi: 10.1029/2003GL018581
Oka E., Suga T. (2005). Differential formation and circulation of north pacific central mode water. J. Phys. Oceanogr. 35, 1997–2011. doi: 10.1175/JPO2811.1
Oka E., Toyama K., Suga T. (2009). Subduction of north pacific central mode water associated with subsurface mesoscale eddy. Geophys. Res. Lett. 36, 3–6. doi: 10.1029/2009GL037540
Oka E., Yamada K., Sasano D., Enyo K., Nakano T., Ishii M. (2019). Remotely forced decadal physical and biogeochemical variability of north pacific subtropical mode water over the last 40 years. Geophys. Res. Lett. 46, 1555–1561. doi: 10.1029/2018GL081330
Pan A., Liu Q. (2005). Mesoscale eddy effects on the wintertime vertical mixing in the formation region of the north pacific subtropical mode water. Chin. Sci. Bull. 50, 1949–1956. doi: 10.1360/982004-757
Qiu B., Chen S. (2005). Variability of the kuroshio extension jet, recirculation gyre, and mesoscale eddies on decadal time scales. J. Phys. Oceanogr. 35, 2090–2103. doi: 10.1175/JPO2807.1
Qiu B., Chen S. (2006). Decadal variability in the formation of the north pacific subtropical mode water: Oceanic versus atmospheric control. J. Phys. Oceanogr. 36, 1365–1380. doi: 10.1175/JPO2918.1
Qiu B., Chen S., Hacker P. (2007). Effect of mesoscale eddies on subtropical mode water variability from the kuroshio extension system study (KESS). J. Phys. Oceanogr. 37, 982–1000. doi: 10.1175/JPO3097.1
Qiu B., Chen S., Schneider N., Oka E., Sugimoto S. (2021). On the reset of the wind-forced decadal kuroshio extension variability in late 2017. J. Clim. 33, 10813–10828. doi: 10.1175/JCLI-D-20-0237.1
Qiu B., Chen S., Schneider N., Taguchi B. (2014). A coupled decadal prediction of the dynamic state of the kuroshio extension system. J. Clim. 27, 1751–1764. doi: 10.1175/JCLI-D-13-00318.1
Qiu B., Huang R. (1995). Ventilation of the north Atlantic and north pacific: subduction versus obduction. J. Phys. Oceanogr. 25, 2374–2390. doi: 10.1175/1520-0485(1995)025<2374:votnaa>2.0.co;2
Qu T., Chen J. (2009). A north pacific decadal variability in subduction rate. Geophys. Res. Lett. 36. doi: 10.1029/2009GL040914
Qu T., Xie S. P., Mitsudera H., Ishida A. (2002). Subduction of the north pacific mode waters in a global high-resolution GCM. J. Phys. Oceanogr. 32, 746–763. doi: 10.1175/1520-0485(2002)032<0746:SOTNPM>2.0.CO;2
Ren L., Riser S. C. (2010). Observations of decadal time scale salinity changes in the subtropical thermocline of the north pacific ocean. Deep. Res. Part II Top. Stud. Oceanogr. 57, 1161–1170. doi: 10.1016/j.dsr2.2009.12.005
Roemmich D., Johnson G. C., Riser S., Davis R., Gilson J., Owens W. B., et al. (2009). The argo program: Observing the global ocean with profiling floats. Oceanography 22, 34–43. doi: 10.5670/oceanog.2009.36
Ruddick B. (1983). A practical indicator of the stability of the water column to double-diffusive activity. Deep Sea Res. Part A Oceanogr. Res. Pap. 30, 1105–1107. doi: 10.1016/0198-0149(83)90063-8
Saito H., Suga T., Hanawa K., Shikama N. (2011). The transition region mode water of the north pacific and its rapid modification. J. Phys. Oceanogr. 41, 1639–1658. doi: 10.1175/2011JPO4346.1
Saito H., Suga T., Hanawa K., Watanabe T. (2007). New type of pycnostad in the western subtropical-subarctic transition region of the north pacific: Transition region mode water. J. Oceanogr. 63, 589–600. doi: 10.1007/s10872-007-0052-3
Sasaki Y. N., Schneider N., Maximenko N., Lebedev K. (2010). Observational evidence for propagation of decadal spiciness anomalies in the north pacific. Geophys. Res. Lett. 37, n/a–n/a. doi: 10.1029/2010GL042716
Schneider N. (2000). A decadal spiciness mode in the tropics. Geophys. Res. Lett. 27, 257–260. doi: 10.1029/1999GL002348
Schneider N., Miller A. J., Pierce D. W. (2002). Anatomy of north pacific decadal variability. J. Clim. 15, 586–605. doi: 10.1175/1520-0442(2002)015<0586:AONPDV>2.0.CO;2
Schneider N., Venzke S., Miller A. J., Pierce D. W., Barnett T. P., Deser C., et al. (1999). Pacific thermocline bridge revisited. Geophys. Res. Lett. 26, 1329–1332. doi: 10.1029/1999GL900222
Shi F., Luo Y., Xu L. (2018). Volume and transport of eddy-trapped mode water south of the kuroshio extension. J. Geophys. Res. Ocean. 123, 8749–8761. doi: 10.1029/2018JC014176
Skliris N., Marsh R., Josey S. A., Good S. A., Liu C., Allan R. P. (2014). Salinity changes in the world ocean since 1950 in relation to changing surface freshwater fluxes. Clim. Dyn. 43, 709–736. doi: 10.1007/S00382-014-2131-7
Suga T., Hanawa K. (1995). Interannual variations of north pacific subtropical mode water in the 137°E section. J. Phys. Oceanogr. 25, 1012–1017. doi: 10.1175/1520-0485(1995)025<1012:IVONPS>2.0.CO;2
Suga T., Kato A., Hanawa K. (2000) North pacific tropical water: its climatology and temporal changes associated with the climate regime shift in the 1970s. Available at: www.elsevier.com/locate/pocean.
Suga T., Motoki K., Hanawa K. (2003). Subsurface water masses in the central north pacific transition region: The repeat section along the 180° meridian. J. Oceanogr. 59, 435–444. doi: 10.1023/A:1025536531583
Suga T., Saito H., Toyama K., Watanabe T., Oceanography C. (2013). Water mass formation, modification and subduction in and around the subarctic frontal zone in the north pacific. Bull. Coast. Oceanogr. 50, 103–118. doi: 10.32142/engankaiyo.50.2_103
Suga T., Sato K., Nonaka M., Hosoda S., Ueno H., Shikama N., et al. (2012) A REVISIT TO CAUSES OF THE NORTH PACIFIC CENTRAL MODE WATER PROPERTY CHANGES ASSOCIATED WITH REGIME SHIFTS (Accessed March 28, 2022).
Suga T., Motoki K., Aoki Y., Macdonald A. M. (2004). The North Pacific Climatology of Winter Mixed Layer and Mode Waters. J. Phys. Oceanogr. 34, 3–22. doi: 10.1175/1520-0485(2004)034<0003:TNPCOW>2.0.CO;2.
Suga T., Takei Y., Hanawa K. (1997). Thermostad distribution in the north pacific subtropical gyre: The central mode water and the subtropical mode water. J. Phys. Oceanogr. 27, 140–152. doi: 10.1175/1520-0485(1997)027<0140:TDITNP>2.0.CO;2
Sugimoto S. (2005). Remote reemergence areas of winter sea surface temperature anomalies in the north pacific. Geophys. Res. Lett. 32, L01606. doi: 10.1029/2004GL021410
Sugimoto S., Hanawa K. (2007). Further evidence for non-reemergence of winter SST anomalies in the north pacific eastern subtropical mode water area. J. Oceanogr. 63, 625–635. doi: 10.1007/s10872-007-0055-0
Sugimoto S., Takahashi N., Hanawa K. (2013). Marked freshening of north pacific subtropical mode water in 2009 and 2010: Influence of freshwater supply in the 2008 warm season. Geophys. Res. Lett. 40, 3102–3105. doi: 10.1002/grl.50600
Taguchi B., Schneider N., Nonaka M., Sasaki H. (2017). Decadal variability of upper-ocean heat content associated with meridional shifts of western boundary current extensions in the north pacific. J. Clim. 30, 6247–6264. doi: 10.1175/JCLI-D-16-0779.1
Talley L. D. (1988). Potential vorticity distribution in the north pacific. Am. Meteorological Soc 18, 89–106. doi: 10.1175/1520-0485(1988)018<0089:PVDITN>2.0.CO;2
Talley L. D. (1993). Distribution and formation of north pacific intermediate water. J. Phys. Oceanogr. 23, 517–537.
Taneda T., Suga T., Hanawa K. (2000). Subtropical mode water variation in the northwestern part of the north pacific subtropical gyre. J. Geophys. Res. Ocean. 105, 19591–19598. doi: 10.1029/2000jc900073
Toyama K. (2015). Interannual variation of annual subduction rate in the north pacific estimated from a gridded argo product. J. Phys. Oceanogr. 45, 2276–2293. doi: 10.1175/JPO-D-14-0223.1
Toyama K., Suga T. (2010). Vertical structure of north pacific mode waters. Deep. Res. Part II Top. Stud. Oceanogr. 57, 1152–1160. doi: 10.1016/j.dsr2.2009.12.004
Uehara H., Suga T., Hanawa K., Shikama N. (2003). A role of eddies in formation and transport of north pacific subtropical mode water. Geophys. Res. Lett. 30, 1999–2002. doi: 10.1029/2003GL017542
Wong A. P. S., Bindoff N. L., Church J. A. (2001). Freshwater and heat changes in the north and south pacific oceans between the 1960s and 1985-94. J. Clim. 14, 1613–1633. doi: 10.1175/1520-0442(2001)014<1613:FAHCIT>2.0.CO;2
Yan Y., Xu D., Yu K., Qi Y. (2017). Propagation of the subsurface freshening water and its major source in the northwestern pacific. J. Geophys. Res. Ocean. 122, 6857–6871. doi: 10.1002/2017JC013033
Yasuda T., Hanawa K. (1997). Decadal changes in the mode waters in the midlatitude north pacific. J. Phys. Oceanogr. 27, 858–870. doi: 10.1175/1520-0485(1997)027<0858:DCITMW>2.0.CO;2
Yeager S. G., Large W. G. (2004). Late-winter generation of spiciness on subducted isopycnals. J. Phys. Oceanogr. 34, 1528–1547. doi: 10.1175/1520-0485(2004)034<1528:LGOSOS>2.0.CO;2
Yoshida S., Macdonald A. M., Jayne S. R., Rypina I. I., Buesseler K. O. (2015). Observed eastward progression of the fukushima 134Cs signal across the north pacific. Geophys. Res. Lett. 42, 7139–7147. doi: 10.1002/2015GL065259
Zhang R. H., Liu Z. (1999). Decadal thermocline variability in the north pacific ocean: Two pathways around the subtropical gyre. J. Clim. 12, 3273–3296. doi: 10.1175/1520-0442(1999)012<3273:DTVITN>2.0.CO;2
Keywords: salinity, mode waters, water masses, subtropical gyre, North Pacific, spiciness anomaly, Argo, interannual to decadal variability
Citation: Wang T, Suga T and Kouketsu S (2022) Spiciness anomalies in the upper North Pacific based on Argo observations. Front. Mar. Sci. 9:1006042. doi: 10.3389/fmars.2022.1006042
Received: 28 July 2022; Accepted: 01 November 2022;
Published: 17 November 2022.
Edited by:
Fan Wang, Institute of Oceanology (CAS), ChinaReviewed by:
Gilles Reverdin, Centre National de la Recherche Scientifique (CNRS), FranceHiroyuki Matsumoto, Japan Agency for Marine-Earth Science and Technology (JAMSTEC), Japan
Xiaopei Lin, Ocean University of China, China
Copyright © 2022 Wang, Suga and Kouketsu. This is an open-access article distributed under the terms of the Creative Commons Attribution License (CC BY). The use, distribution or reproduction in other forums is permitted, provided the original author(s) and the copyright owner(s) are credited and that the original publication in this journal is cited, in accordance with accepted academic practice. No use, distribution or reproduction is permitted which does not comply with these terms.
*Correspondence: Tong Wang, d2FuZ3RvbmcuMzMwQGdtYWlsLmNvbQ==