 Yunzhi Feng
 Dong Sun
 Qianwen Shao
 Chen Fang
 Chunsheng Wang
- 1School of Oceanography, Shanghai Jiao Tong University, Shanghai, China
- 2Key Laboratory of Marine Ecosystem Dynamics, Second Institute of Oceanography, Ministry of Natural Resources, Hangzhou, China
- 3Southern Marine Science and Engineering Guangdong Laboratory (Zhuhai), Zhuhai, China
- 4Ningbo Institute of Oceanography, Ningbo, China
- 5College of Oceanography, Hohai University, Nanjing, China
Zooplankton plays a crucial role in marine ecosystems. However, due to issues with morphological identification and sampling methods, knowledge of their biodiversity and community structure in the vast pelagic zone of the western tropical Pacific Ocean is still limited compared with other areas in the North Pacific Ocean. In this study, we used environmental DNA (eDNA) metabarcoding and morphological identification approaches to investigate mesozooplankton’s biodiversity and vertical assemblages in the western tropical Pacific Ocean from the surface to 1000 m deep. Two different barcodes were used in metabarcoding: mitochondrial cytochrome oxidase I (COI) and small subunit ribosomal RNA genes (18S). Our results showed that eDNA metabarcoding revealed 2-4 times more medusae taxa than morphological processing. Both methods detected that small copepod species were dominant in the community and six of the top-10 most abundant copepod genera overlapped. Morphological results showed that mesozooplankton communities were classified into three groups: epipelagic (0–200 m), upper mesopelagic (200-500 m), and lower mesopelagic (500–1000 m). And eDNA results showed distinct vertical variations of mesozooplankton communities within the epipelagic. Both methods showed that the dominant genera Clausocalanus, Paracalanus, and Calocalanus exhibited diel patterns in relative abundance, demonstrating that the eDNA method can capture diel vertical migration (DVM) signals of copepods. Overall, our results indicate that eDNA metabarcoding is an effective and efficient tool for the study and monitoring of mesozooplankton diversity and vertical assemblages in the open sea.
Introduction
In the marine ecosystem, zooplankton is a crucial secondary producer linking primary producers and higher tropic levels (Madin et al., 2001). Zooplankton provides a significant contribution to the biological pump by transporting organic carbon from the surface to the deep seas (Hays, 2003). Many zooplankton possess diel vertical migration (DVM) strategies that promote material exchange between different water layers and regulate vertical carbon flux. Thus, their biodiversity and community composition have an important effect on marine biogeochemical cycling (Romare et al., 1999). Species identification is fundamental to zooplankton ecological research. However, their complex morphology and high biodiversity limit the knowledge that can be gained using traditional identification methods.
With the development of molecular methods, the DNA metabarcoding method has become a promising way to solve these problems in zooplankton diversity monitoring. This technique extracts the total genomic DNA from environmental samples and sequences one or more molecular barcodes using a high-throughput sequencing (HTS) platform. The small subunit ribosomal RNA (18S) gene is most frequently used in eukaryote metabarcoding because of its broad taxonomic coverage (Amaral-Zettler et al., 2009). Additionally, the mitochondrial cytochrome oxidase I (COI) gene has been increasingly used for the analysis of zooplankton biodiversity (Schroeder et al., 2020; Coguiec et al., 2021; Garcia-Vazquez et al., 2021). In addition to samples collected by traditional plankton nets, samples of environmental DNA (eDNA), which is trace DNA derived from organisms in the water column, could also be used for zooplankton metabarcoding analysis (Bohmann et al., 2014). This approach provides cost-effective, rapid, and accurate assessments of biodiversity (Bucklin et al., 2016). Besides, metabarcoding has been shown to reveal the hidden diversity of marine zooplankton communities (Lindeque et al., 2013; Hirai et al., 2017), and reveal similar distribution patterns as morphological methods (Kim et al., 2019). Specially, metabarcoding based on eDNA would cause less disturbance to marine habitats and the zooplankton community and could fill gaps in species monitoring by increasing the detection of organisms that are rarely captured by plankton nets (Djurhuus et al., 2018). For instance, medusae are one of the most abundant zooplankton groups in the marine system, but they are underestimated because they are easily damaged during traditional trawl sampling procedures. The eDNA method has been used to assess the biodiversity and distribution of medusae (Takasu et al., 2019; Ames et al., 2021). Therefore, this method is becoming a research priority, and it has great application potential in ecological monitoring and assessment (Valdez-Moreno et al., 2021; Xie et al., 2021). However, limited metabarcoding studies were conducted in the open sea with high biodiversity and complex community structure relative to coastal waters and continental shelf areas (Suter et al., 2021).
With the greatest biodiversity and biomass of all ecosystems on earth, the marine pelagic environment constitutes more than 90% of the living world (Robison, 2009). The mesopelagic zone (200–1000 m) provides vital ecosystem services including vast fishery biomass, the connection of surface and deep waters, and critical contributions nutrient generation and carbon flux (Drazen and Sutton, 2017; Boyd et al., 2019). Therefore, it is necessary to further understand mesopelagic species composition. Due to its unique and heterogeneous environmental characteristics caused by its complex current system, the western Pacific Ocean is known to be a biodiversity hotspot (Briggs, 2005; Allen, 2008; Tittensor et al., 2010). Studies on mesozooplankton diversity and community structure have been mainly carried out in the epipelagic zone (0–200 m) (Dai et al., 2016b; Sun and Wang, 2017; Yamaguchi et al., 2017; Long et al., 2021). Besides, biomass and size spectra of zooplankton down to 3000 m in the Philippine Sea were reported (Dai et al., 2016a), and vertical distribution of zooplankton community between North Pacific Subtropical Gyre and Western Pacific Warm Pool was studied (Sun et al., 2019). Overall, knowledge of mesozooplankton diversity and distribution on the vertical scale is limited compared with those on the horizontal scale, perhaps due to difficulties in deep sea sampling and morphological identification. Hence, the eDNA metabarcoding approach provides a new and less invasive method to better understand the mesopelagic zone in the tropical western Pacific Ocean.
In this study, we conducted an ecological investigation of mesozooplankton (including holoplankton and meroplankton) in the epipelagic and mesopelagic zones (0–1000 m) of the western tropical Pacific Ocean using eDNA metabarcoding and morphological identification methods. Two molecular barcodes (COI and 18S) were used for eDNA metabarcoding to enable a broad taxonomic coverage of mesozooplankton. We evaluated the biodiversity and vertical distribution patterns of mesozooplankton in the water column and compared the eDNA metabarcoding of two biomarkers with the morphological method. The main hypotheses of our study are as follows: 1) eDNA metabarcoding can reveal higher mesozooplankton biodiversity than morphological methods, including many gelatinous organisms that are rarely captured by plankton nets, and 2) in the open ocean with a relatively stable water body, eDNA is vertically stratified and thus could reveal vertical assemblages and migration of mesozooplankton.
Materials and methods
Field sampling
The investigation was carried out during a cruise on the R/V Shenhaiyihao in the western tropical Pacific Ocean between 13 and 27 January 2021, as part of the China Ocean Mineral Resources Research and Development Association Cruise DY60. Environmental DNA was sampled at four stations along the Kyushu–Palau Ridge and two stations in the central deep basin of the Philippine Sea (Figure 1, Table 1). At each station, seawater samples were collected in Niskin bottles equipped with an SBE 911 plus CTD sampler (SeaBird 911 plus, Seabird Co., Ltd., Sunnyvale, CA, United States) at six depths: 5m, 100 m, deep chlorophyll maximum (DCM), 200 m, 500 m, and 1000 m. Depths of the DCM at each station were determined by real-time chlorophyll a concentrations obtained in situ by the CTD profiler (Figure S1, Table 1). We sampled 4L of seawater at each depth referring to Laroche et al. (2020). Water samples were filtered on board through a 0.22-μm polycarbonate membrane (47-mm diameter, Millipore, Bedford, MA, United States). The filters were immediately put in 2-mL sterile tubes and preserved at −80°C until DNA extraction. To reduce cross-contamination in the sampling process, the filtration kits were carefully cleaned before and after each round of seawater filtration with sterile water.
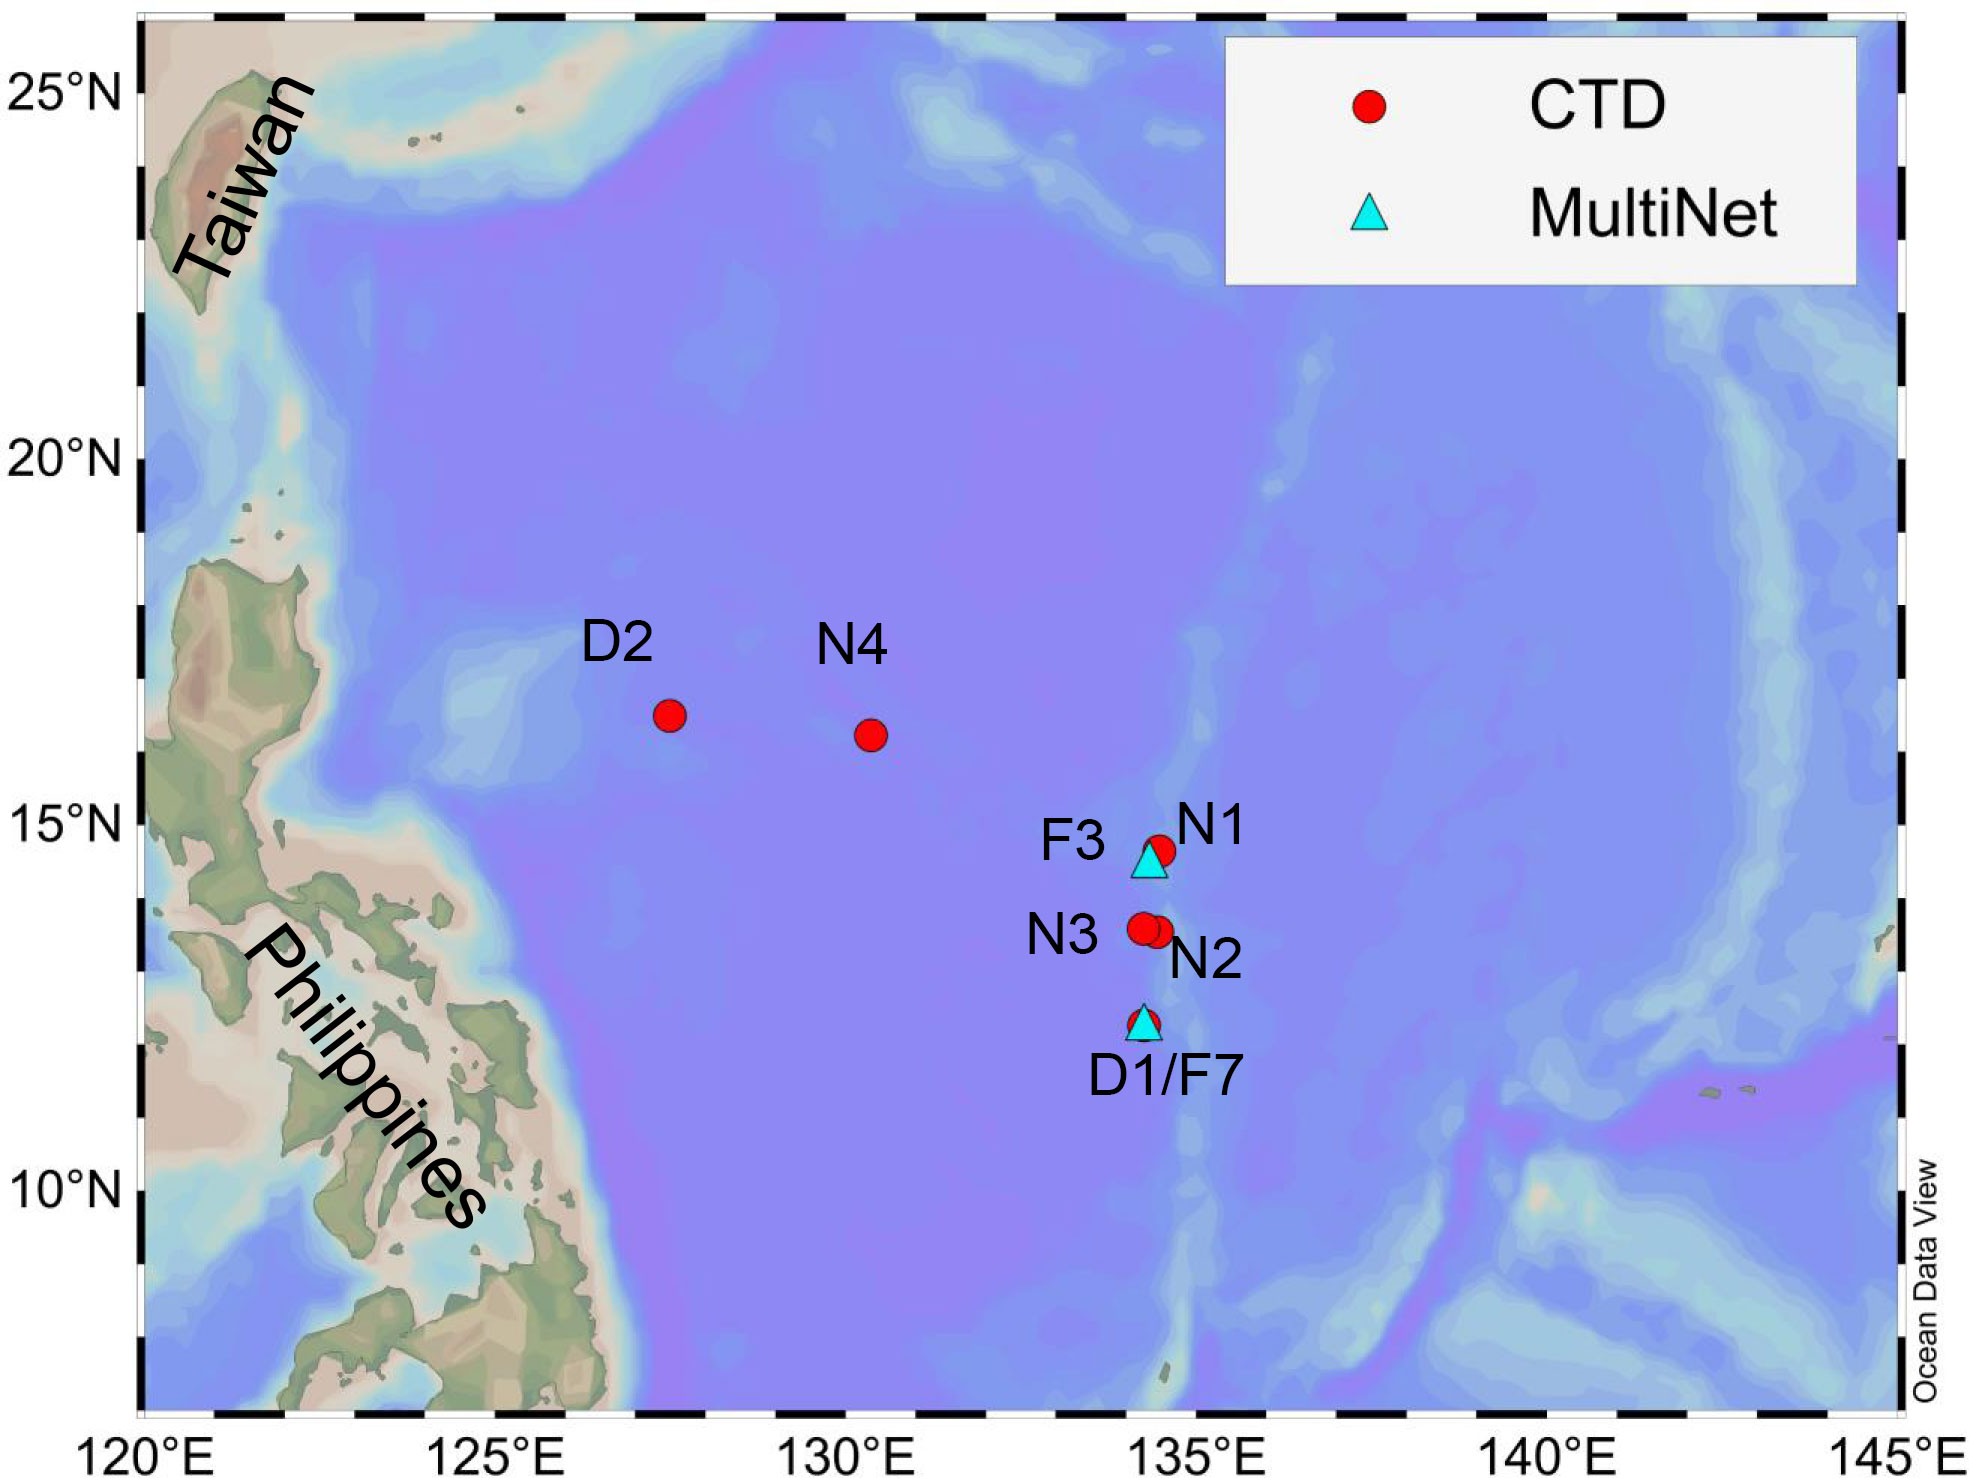
Figure 1 Position of the six CTD casts (red circles) and two MultiNet tows (blue triangles) in the western tropical Pacific Ocean.

Table 1 Summary of environmental DNA and MultiNet sampling.
Bulk samples were collected for morphological analysis at two stations (Figure1, Table 1) using a Multi Plankton Sampler (MultiNet, Hydro-Bios Co. Ltd., Altenholz, German) system with a mesh size of 200 μm and a 0.50 m2 mouth opening area. Stratified samples of zooplankton were obtained by vertical haul from nine strata (0-50 m, 50-100 m, 100-150 m, 150-200 m, 200-300 m, 300-400 m, 400-500 m, 500-750 m, and 750-1000 m). Filtered water volumes were estimated by a flowmeter installed in the MultiNet system. All samples were immediately fixed in 5% (v/v) buffered formalin-seawater solution for further analysis.
Metabarcoding
eDNA extraction, amplification, and sequencing
In the laboratory, the genomic DNA of each filter membrane was extracted using the EasyPure Marine Animal Genomic DNA Kit (TransGen Biotech Co. Ltd., Shanghai, China), which is designed to extract DNA from marine animals whose tissues have high salt content. After each round of extraction, the work area was cleaned with 75% ethanol. DNA concentration and quality were monitored by a Nanodrop 2000 (Thermo Fisher Scientific, Wilmington, DE, United States). The universal metazoan primer set mlCOIintF, (5’-GGWACWGGWTGAACWGTWTAYCCYCC-3’) and HCO2198, (5’-TAAACTTCAGGGTGACCAAAAAATCA-3’) (Folmer et al., 1994; Leray et al., 2013) were used to amplify a 313-bp fragment of the COI gene. Additionally, the primers F04 (5’-GCTTGTCTCAAAGATTAAGCC-3’) and R22mod (5’-CCTGCTGCCTTCCTTRGA-3’) (Fonseca et al., 2010; Sinniger et al., 2016) were chosen to amplify the V1-V2 region of 18S, because the R22mod primer was modified to better match some metazoan groups (Sinniger et al., 2016). Unique 7- bp sequences were added to the 5’ end of each former primer as Illumina sequencing barcodes. Single Polymerase Chain reaction (PCR) was run in a 25-μL mixture, including 2 μL of total DNA template (20 ng/μL), 5 μL of reaction buffer (5 ×), 5 μL of GC buffer (5 ×), 2 μL of dNTP (2.5 mM), 1 μL of each primer (10 μM), 8.75 μL of ddH2O, and 0.25 μL of Q5 High-Fidelity DNA polymerase (0.625 U). The PCR conditions for COI were as follows: an initial denaturation at 98°C for 5 min, 27 cycles at 98°C for 30 s, 50°C for 30 s, and 72°C for 45 s, with a final extension at 72°C for 5 min. The 18S cycling parameters were as follows: an initial denaturation at 98°C for 5 min, and 35 cycles at 98°C for 30 s, 55°C for 30 s, and 72°C for 45 s, with a final extension at 72°C for 5 min. PCR products were visualized on 2% agarose gels and purified by Agencourt AMPure XP Beads (Beckman Coulter, Brea, CA, United States). Purified PCR products were then quantified by a QuantiFluor® dsDNA System (Promega Corp., Milano, Italy) and pooled equally. High-throughput amplicon sequencing was performed on an Illumina NovaSeq-PE250 platform using paired-end sequencing (2 × 250 bp) by Personal Biotechnology, Co. Ltd., Shanghai, China.
Bioinformatics
Raw sequences were processed in QIIME 2 (Caporaso et al., 2010) with the default parameters according to official tutorials (https://docs.qiime2.org/2019.4/tutorials/). Firstly, raw sequences were demultiplexed using the demux plugin with a maximum error rate of 20% in primer matching. Primers and tags were cut using the Cutadapt (Martin, 2011) plugin. Passed sequences were filtered to retain only paired reads with a maximum of two expected errors per read using the DADA2 plugin (Callahan et al., 2016). After dereplicated, the paired reads were merged with a minimum overlap of 10 bp to generate amplicon sequence variants (ASVs) following by chimeras filtering using the DADA2 plugin. For COI, the representative sequence for each ASV was annotated using BLAST against the MetaZooGene Barcode Atlas and Database (MZGdb; https://metazoogene.org/mzgdb) restricted to “All zooplankton of the North Pacific-Mode A”. Only hit with a sequence similarity > 97% was identified to the species level. When the sequence similarity was between 95% and 97%, the ASV was identified to the genus level. Other hits were assigned to family or higher taxonomic ranks following the similarity thresholds described by Laroche et al. (2020). For 18S, ASVs were assigned to the lowest common ancestor of the top five BLAST hits against the NCBI nt database restricted to “Animal”, using the BROCC algorithm (https://github.com/kylebittinger/q2-brocc#the-brocc-algorithm) (Dollive et al., 2012). We also tried BOLD and SILVA databases for the assignment of COI and 18S sequences during pre-experiments, respectively, but low resolution and annotation efficiency of zooplankton were obtained in these two databases. Thus, we used MZGdb and NCBI databases for the assignment of COI and 18S in the further analysis, respectively. To minimize sequence noise or cross-contamination, rare ASVs with less than 10 reads in a total of 36 samples were removed from the COI and 18S datasets (Govindarajan et al., 2021; Suter et al., 2021). The ASV tables were subsampled to the lowest obtained sequencing depth (75204 for COI and 65618 for 18S) by the “vegan” package (Oksanen et al., 2007) in R ver.4.1.2 (R Development Core Team, 2019) to standardize the sequencing effort. To assess whether the samples were exhaustively sequenced, rarefaction curves of ASVs richness were generated based on QIIME 2 diversity alpha-rarefaction plugin. Prior to data analysis, we discarded hits with < 80% sequence similarity followed Djurhuus et al. (2020) from the COI dataset, and hits that were unclassified at the phylum level in the 18S dataset. By consulting the World Register of Marine Species (WoRMS Editorial Board, 2022), we removed all freshwater taxa, insects, arachnids, and chordates other than tunicates to focus on marine zooplankton.
Morphological identification
After large particles were removed and excess water was eliminated in the laboratory, all individuals were identified to the lowest taxonomic level possible and counted under a stereomicroscope (ZEISS SteREO Discovery V20, German) according to the morphological characteristics. Mesozooplankton abundance was calculated by dividing the number of individuals by the filtered water volume, and expressed as individuals m-3 (ind. m-3).
Data analysis
Since the identification by both metabarcoding and morphological methods was to the lowest taxonomic level possible, we counted unique lowest-level taxa to measure richness (Ershova et al., 2021; Meredith et al., 2021). Proportion of mesozooplankton unique taxa among different samples was visualized by bar-plots. Venn diagrams were used to compare the richness detected by different methods. To fully utilize the sequences obtained, alpha diversity and community structure were analyzed based on the ASV datasets (Berry et al., 2019; Suter et al., 2021). The “vegan” package in R was used to calculate alpha diversity indices including Shannon-Wiener diversity and Pielou’s evenness indices. Boxplots of alpha diversity among six depth groups identified by COI and 18S were plotted. Kruskal-Wallis tests were chosen to determine whether the differences between different depth groups were significant, because the data did not follow a normal distribution. The Venn diagrams, bar-plots, and boxplots were visualized in the Genescloud platform (https://www.genescloud.cn). Community structure was investigated by non-metric multidimensional scaling (nMDS) based on Bray–Curtis similarity matrix after the datasets were fourth-root transformed using PRIMER v6 (PRIMER-E Ltd., Plymouth, UK). Permutational multivariate analysis of variance (PERMANOVA) was applied to test for significant differences in mesozooplankton communities using the “vegan” R package. Finally, according to the sampling time (Table 1), diel relative abundance at each depth was calculated and plotted for the three dominant copepod genera (Clausocalanus, Paracalanus, and Calocalanus). The eDNA data that were used to calculate relative abundance represented a sum of all ASVs identified as each genus.
Results
Overview of biodiversity detected
The HTS yielded 4,959,957 and 4,994,172 sequences for COI and 18S, respectively. In the COI dataset, the sequencing depth of each sample ranged from 131,288 (N3_200) to 145,640 (D1_DCM), with an average of 137,777 reads. In the 18S dataset, the sequencing depth of each sample ranged from 112,477 (N4_100) to 174,166 (D1_1000), with an average of 138,727 reads. After filtering, denoising, merging, and removing chimeras and singletons, 3,773,750 and 3,561,702 reads remained for COI and 18S, respectively. Keeping only zooplankton taxa resulted in 2,342 ASVs comprising 726,046 reads for COI, and 1,550 ASVs comprising 512,056 reads for 18S, after removing rare ASVs and subsampling. The total numbers of zooplankton ASVs per sample varied from 9 (D2_1000) to 462 (D2_100) in the COI dataset and from 7 (N2_DCM) to 217 (N4_5) in the 18S dataset. Detailed information on reads and ASV numbers per sample are presented in Table S1. Rarefaction curves indicated sufficient sequence depth for all samples (Figure S2).
In the COI dataset, only 103 ASVs were assigned to species, 8 to genus, and 71 to family level. A total of 88 unique taxa were identified belonging to 7 phyla, 15 classes, 24 orders, 33 families, 26 genera, and 29 species (Table S2). Medusa was the most dominant group, accounting for 36% of total ASVs, 24% of total unique taxa, and 41% of total reads obtained. Copepoda had more unique taxa than Medusae, accounting for 20% of total ASVs, 38% of total unique taxa, and 18% of total reads. They were followed by Anthozoa and Malacostraca (amphipods, euphausiids, and decapods). Other groups comprised less than 5% of total richness and reads. In the 18S dataset, 167 ASVs were assigned to species, 267 to genus, and 556 to family level. A total of 145 unique taxa were identified belonging to 10 phyla, 22 classes, 35 orders, 82 families, 55 genera, and 25 species (Table S2). Copepoda was the most dominant group, accounting for 47% of total ASVs, 35% of total unique taxa, and 63% of total reads obtained. It was followed by Medusa and Anthozoa. Other groups comprised less than 5% of total richness and sequence abundance. Overall, the zooplankton community revealed by eDNA metabarcoding of both markers was dominated by copepods and medusae (here mainly hydrozoans) based on the overall richness and sequence abundance (Figure 2, Table 2). The relative richness of copepods was lower in the mesopelagic zone than that in the epipelagic zone (Figure 2). Morphological analysis of the 18 net samples detected 125 unique taxa belonging to 6 phyla, 8 classes, 16 orders, 44 families, 71 genera, and 94 species (Table S3). Copepoda was the only dominant group in all samples, occupying 71% of total taxa and 93% of total abundance. It was followed by Medusa and Ostracoda. Other groups comprised less than 5% of total richness and abundance (Figure 2, Table 2).
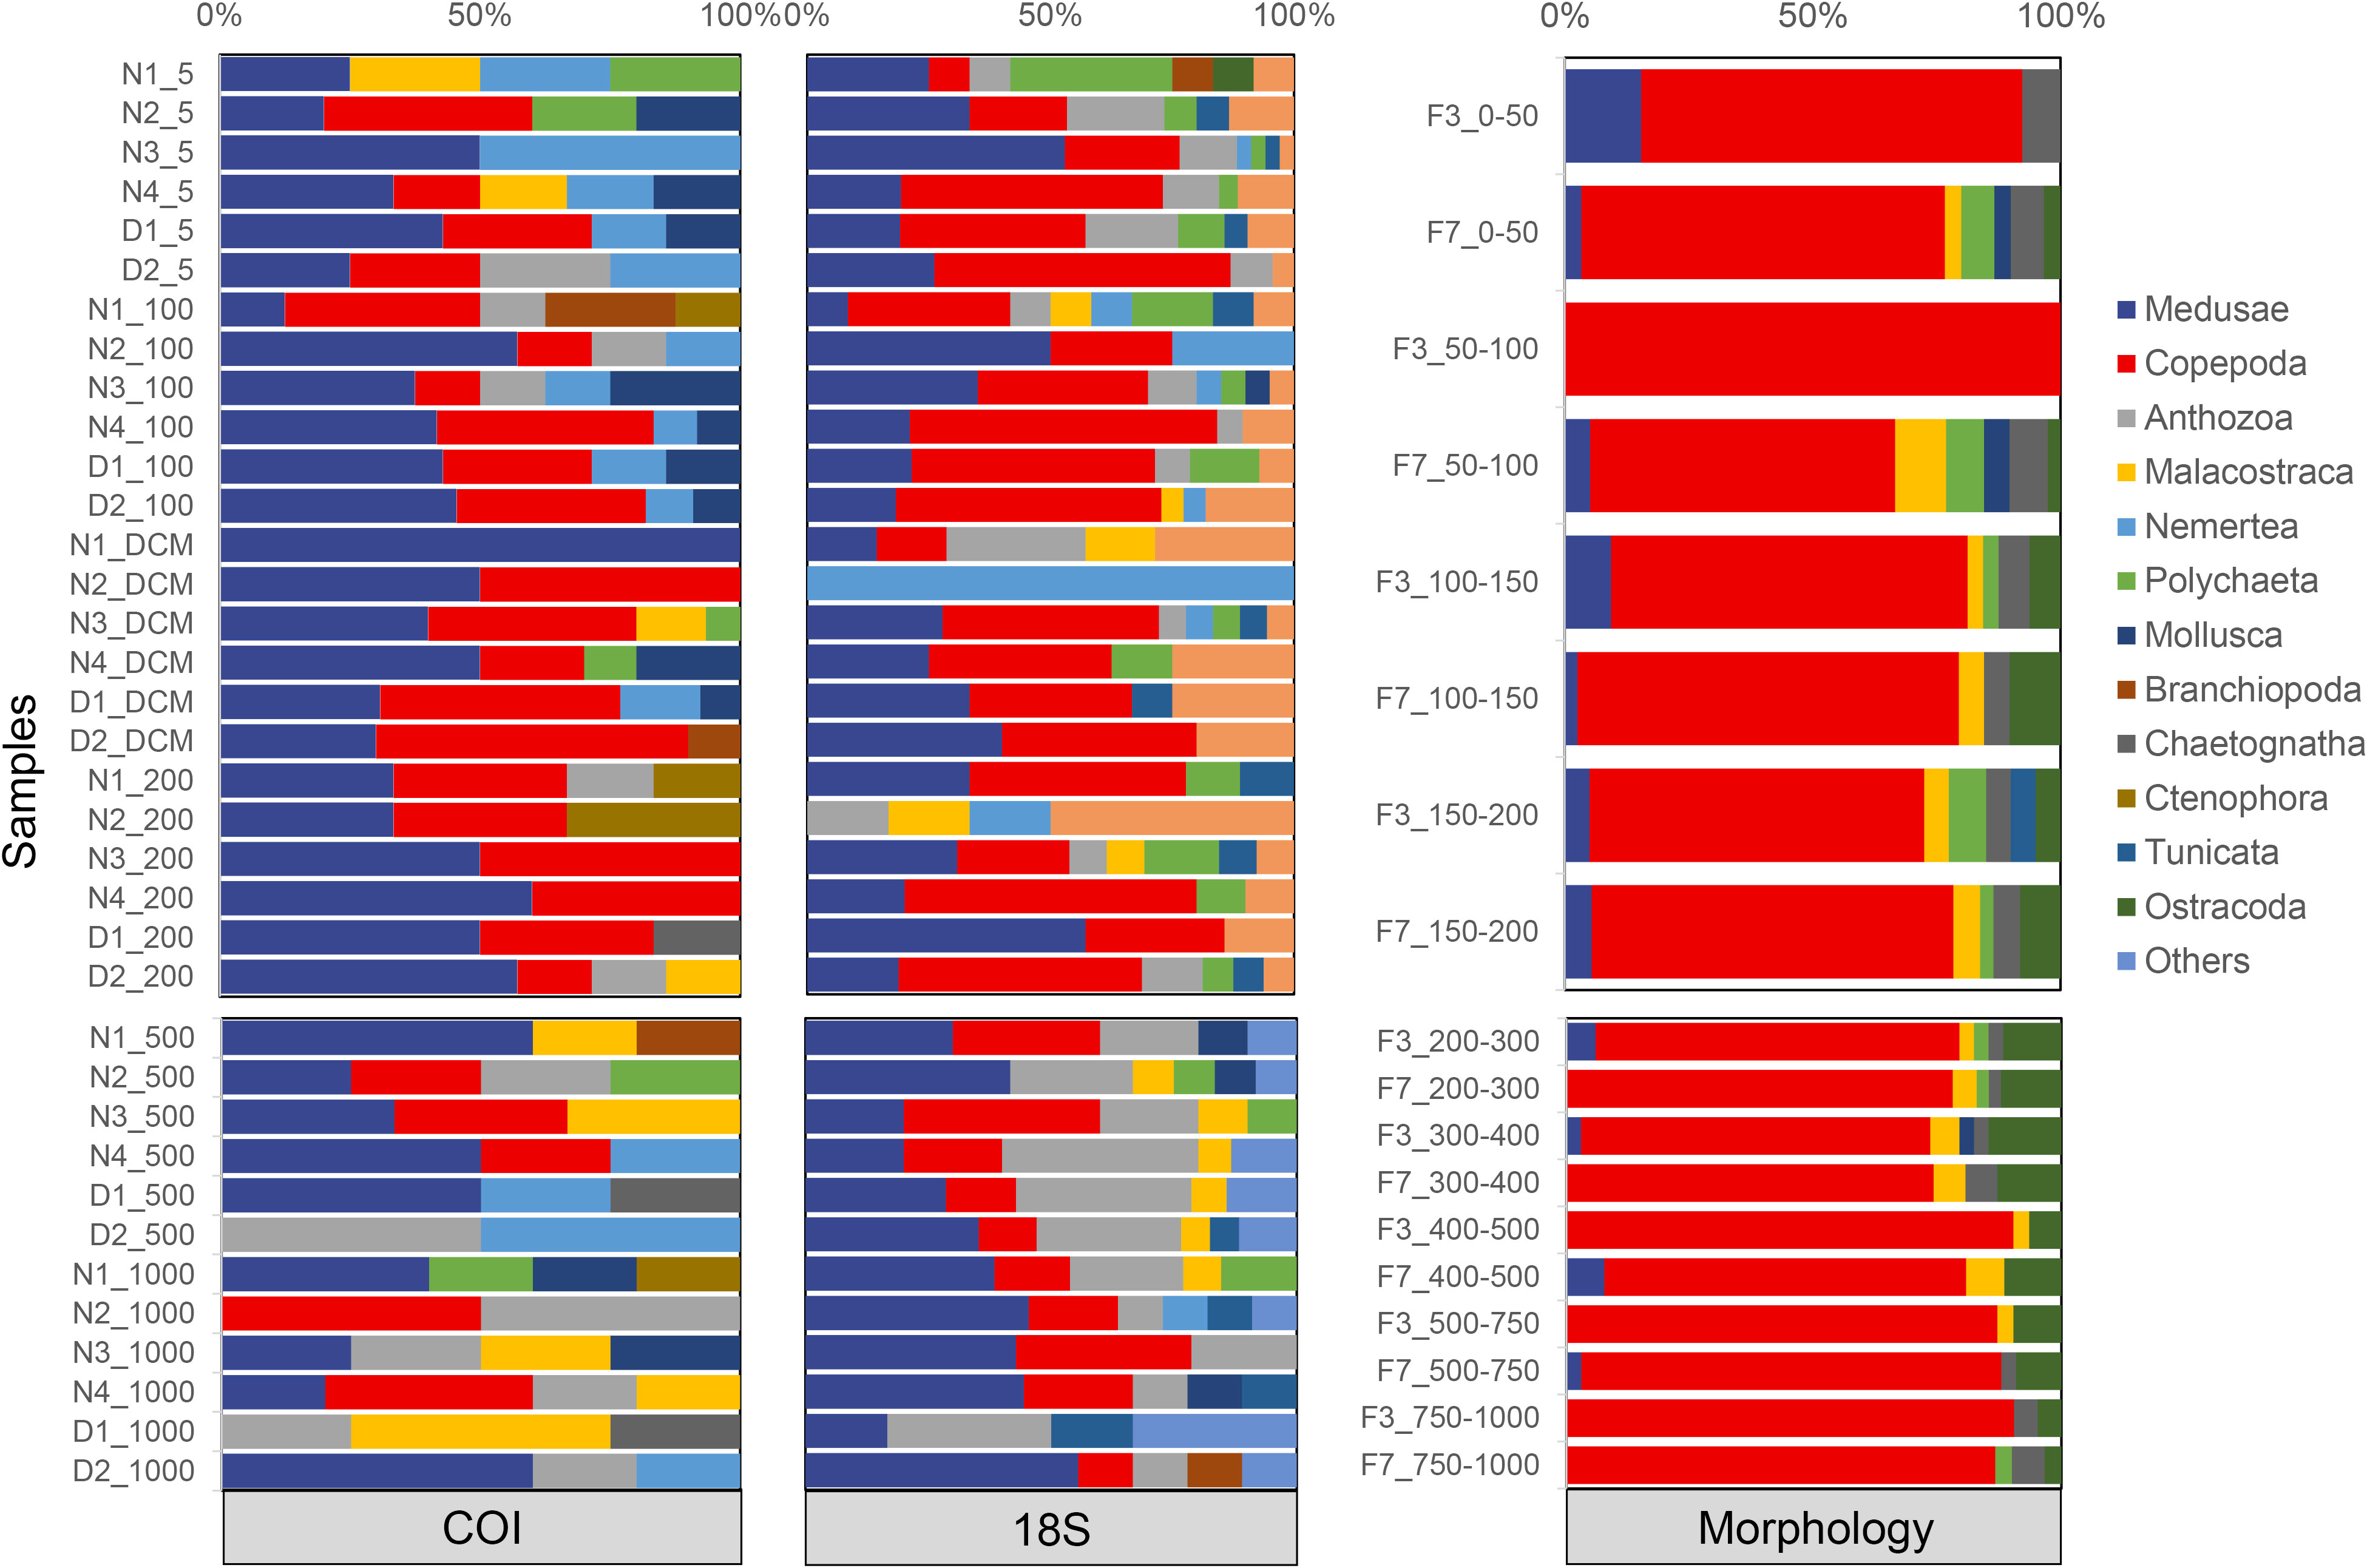
Figure 2 Relative richness (unique lowest-level taxa) of mesozooplankton taxonomic groups identified by eDNA metabarcoding (COI and 18S) and morphological methods.
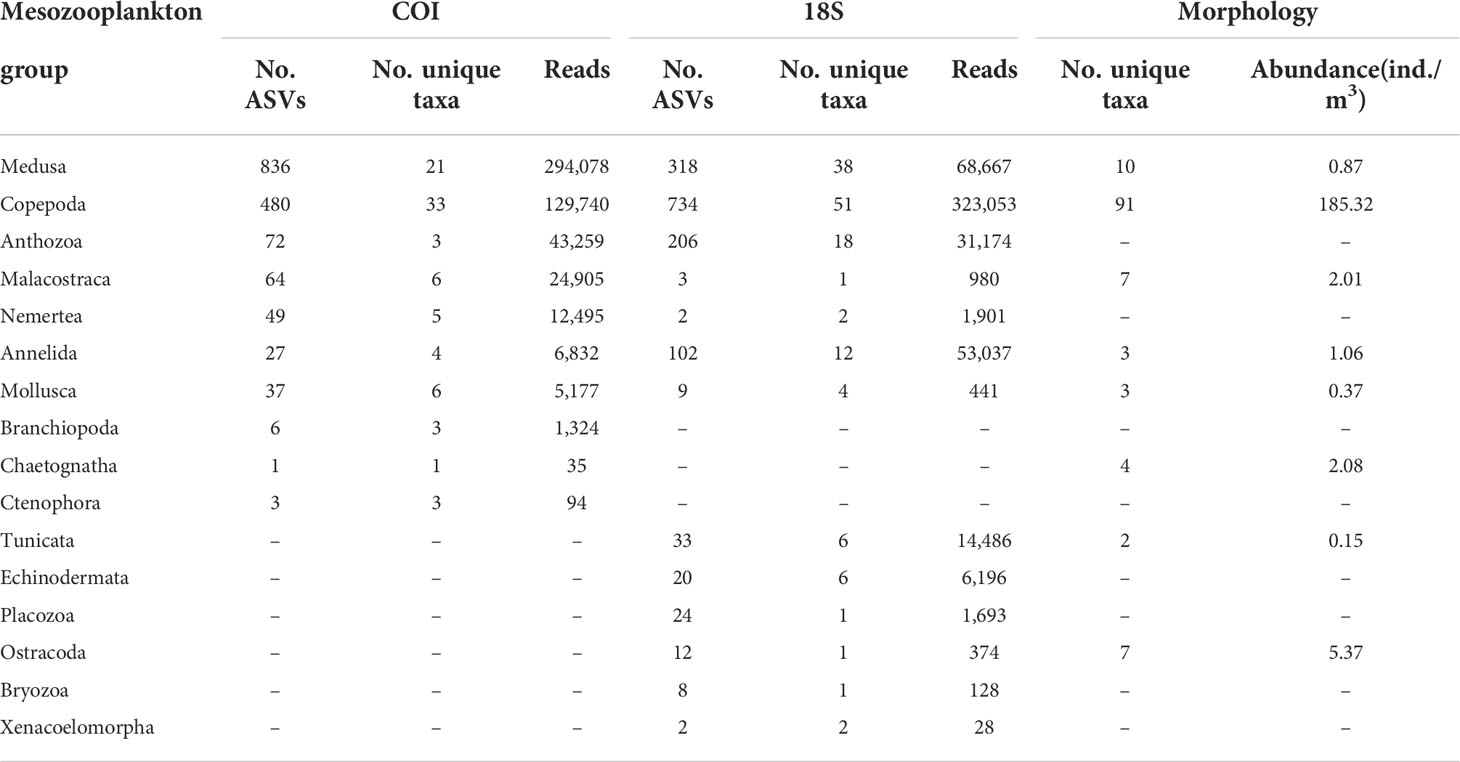
Table 2 Numbers of unique taxa, ASVs, and reads for metabarcoding, and numbers of unique taxa categories and abundance (ind./m3) for morphology across mesozooplankton groups.
Comparison of eDNA metabarcoding and morphological results
Combining the metabarcoding of two biomarkers and the morphological method, a total of 17 mesozooplankton taxonomic groups were identified from all samples. All groups detected by morphology were also detected by eDNA metabarcoding (Table 2). The 18S marker identified more groups than COI, most of which were meroplankton groups. Four groups (Echinodermata, Placozoa, Bryozoa, and Xenacoelomorpha) were detected only by 18S, while Branchiopoda and Ctenophora were detected only by COI. Compared with the morphological method, eDNA metabarcoding revealed higher richness at phylum, class, and order levels, but lower richness at genus and species levels (Figure 3A). The Venn diagrams showed that the overlap between taxa detected by molecular and morphological techniques was larger at higher taxonomic levels. Specifically, 45% of the families detected by morphology failed to be recovered by either COI or 18S (Figure 3B). And the percentage of genera and species detected exclusively in morphology were much higher, most of which were copepods. 18S identified more unique taxa than COI at all taxonomic levels except at species level (Figure 3).
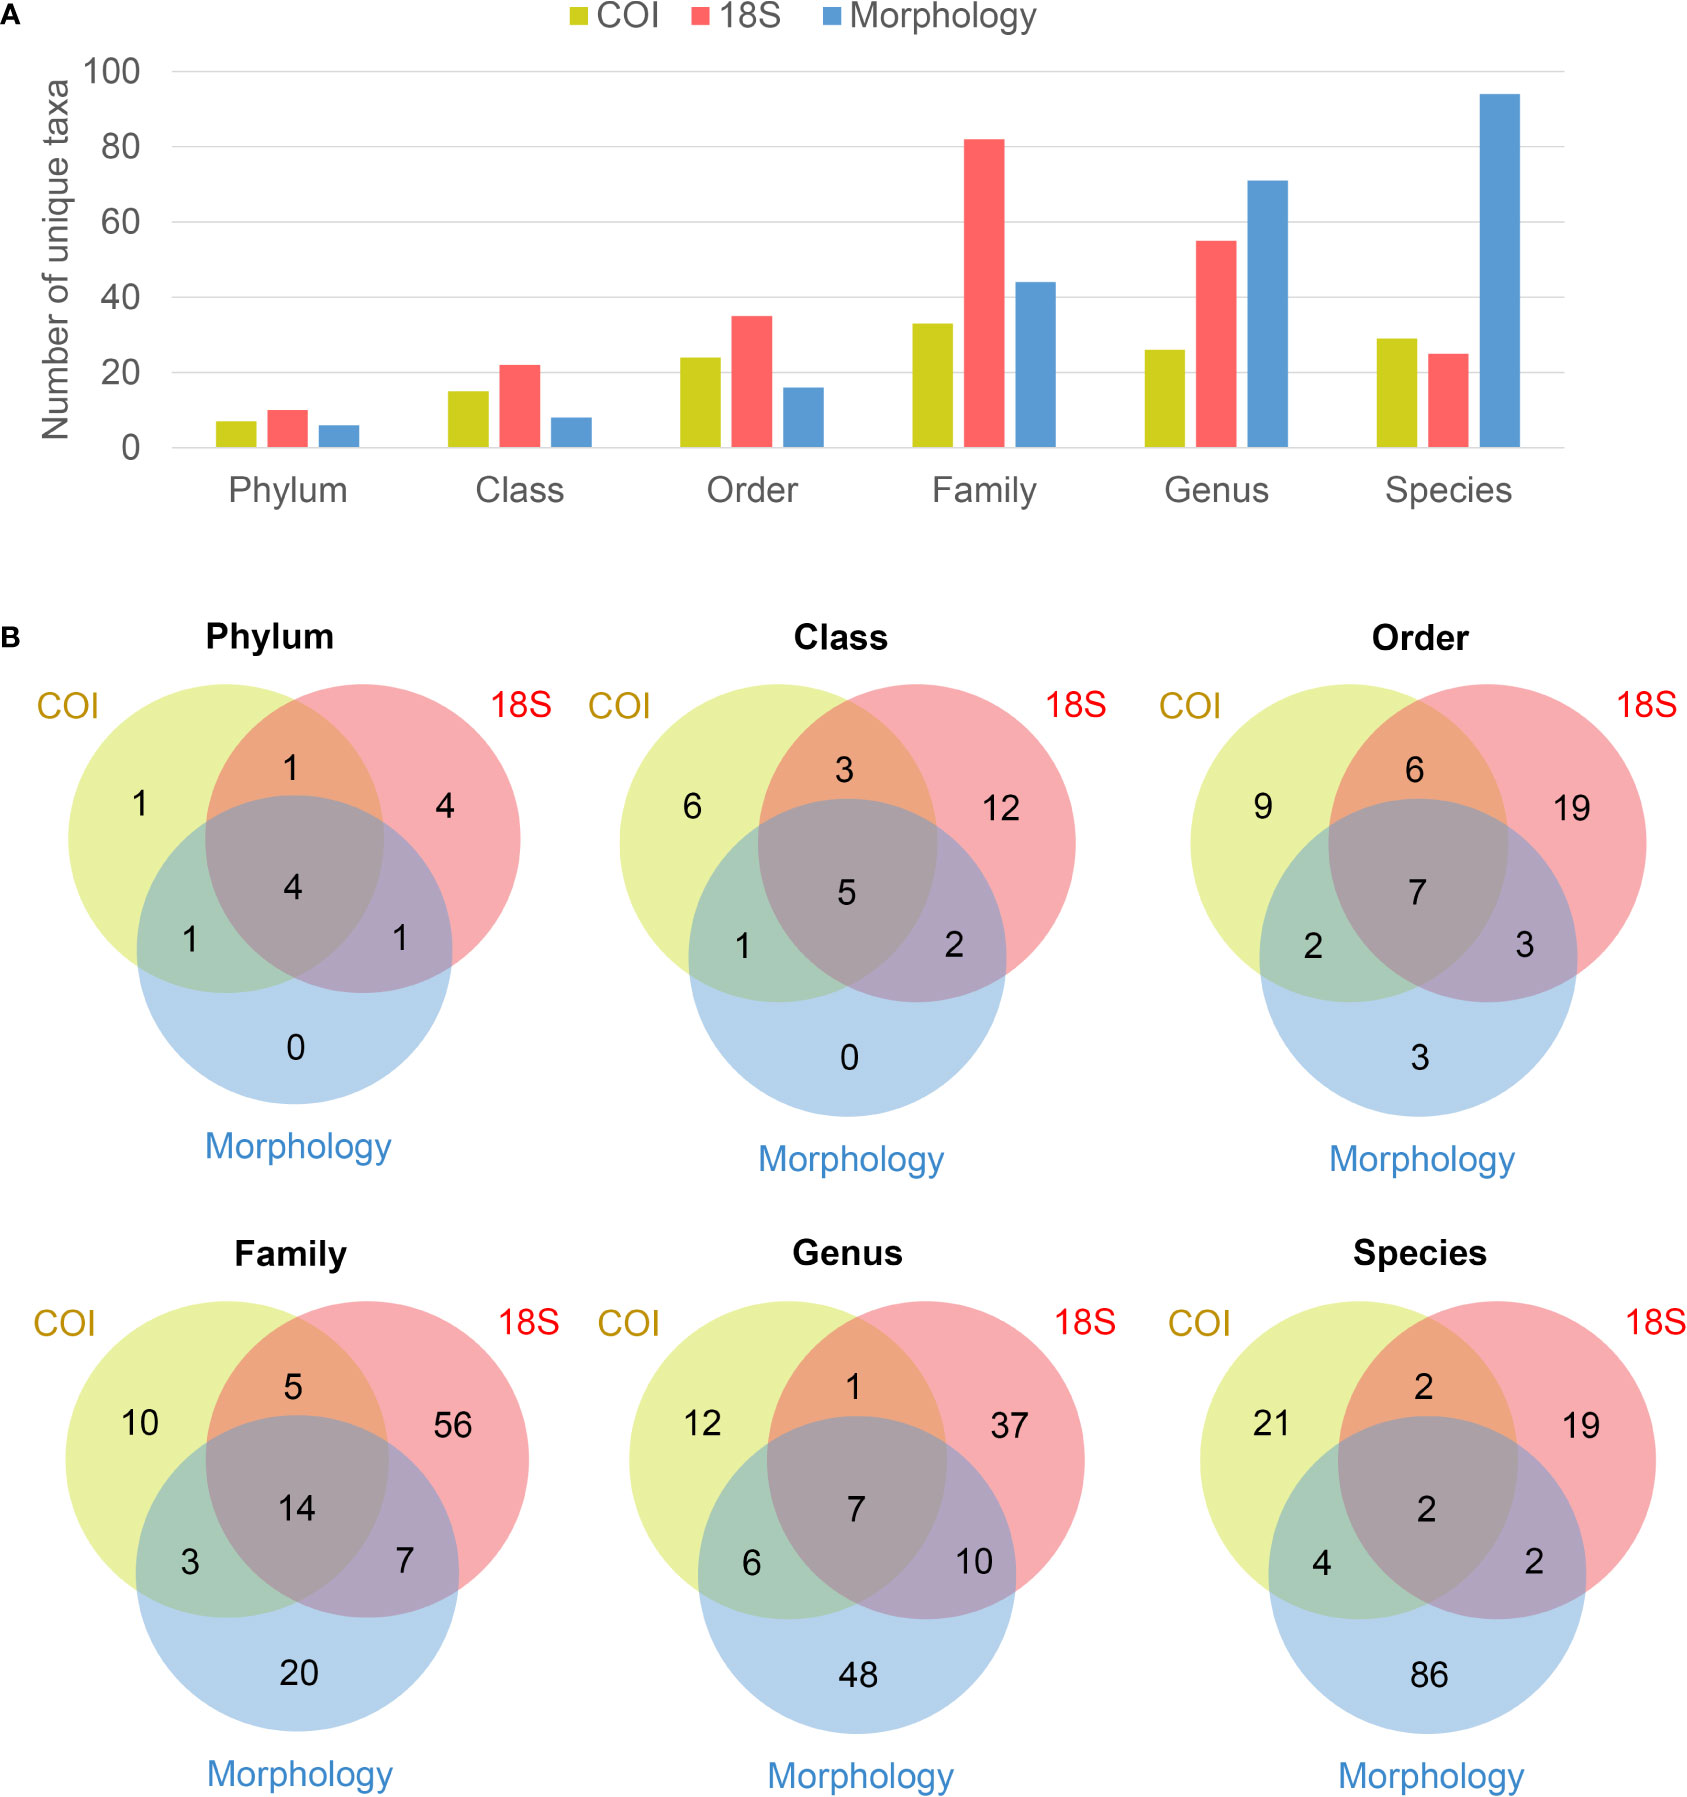
Figure 3 Numbers of mesozooplankton taxa detected per taxonomic level with eDNA metabarcoding (COI and 18S) and morphology. (A) Bar plot, (B) Venn diagrams.
The eDNA metabarcoding method detected more unique taxa of medusae (COI: twice, 18S: 4 times) than morphological analysis (Table 2). Only 10 unique medusa taxa were detected in morphological samples, belonging to seven genera in five families of three orders. At higher taxonomic levels, a larger proportion of overlapping taxa occurred between molecular and morphological techniques (Figure 3A). Of the seven genera detected via the morphological technique, only the genus Clytia was also detected by 18S metabarcoding. Two families, Diphyidae and Campanulariidae, were identified by all methods. The family Pandeidae occurred in COI and morphology datasets. At the order level, all three orders detected by the visual method also showed up with high richness in COI and 18S datasets. The taxonomic composition of medusae at the order level is shown in Figure 4B. When combining COI and 18S results, seven more orders were identified by eDNA metabarcoding than by the visual assessment. Anthoathecata and Siphonophorae dominated in richness in all methods. Leptothecata and Semaeostomeae showed higher relative richness in the COI than in 18S (Figure 4B). Coronatae and Carybdeida were found exclusively in 18S.
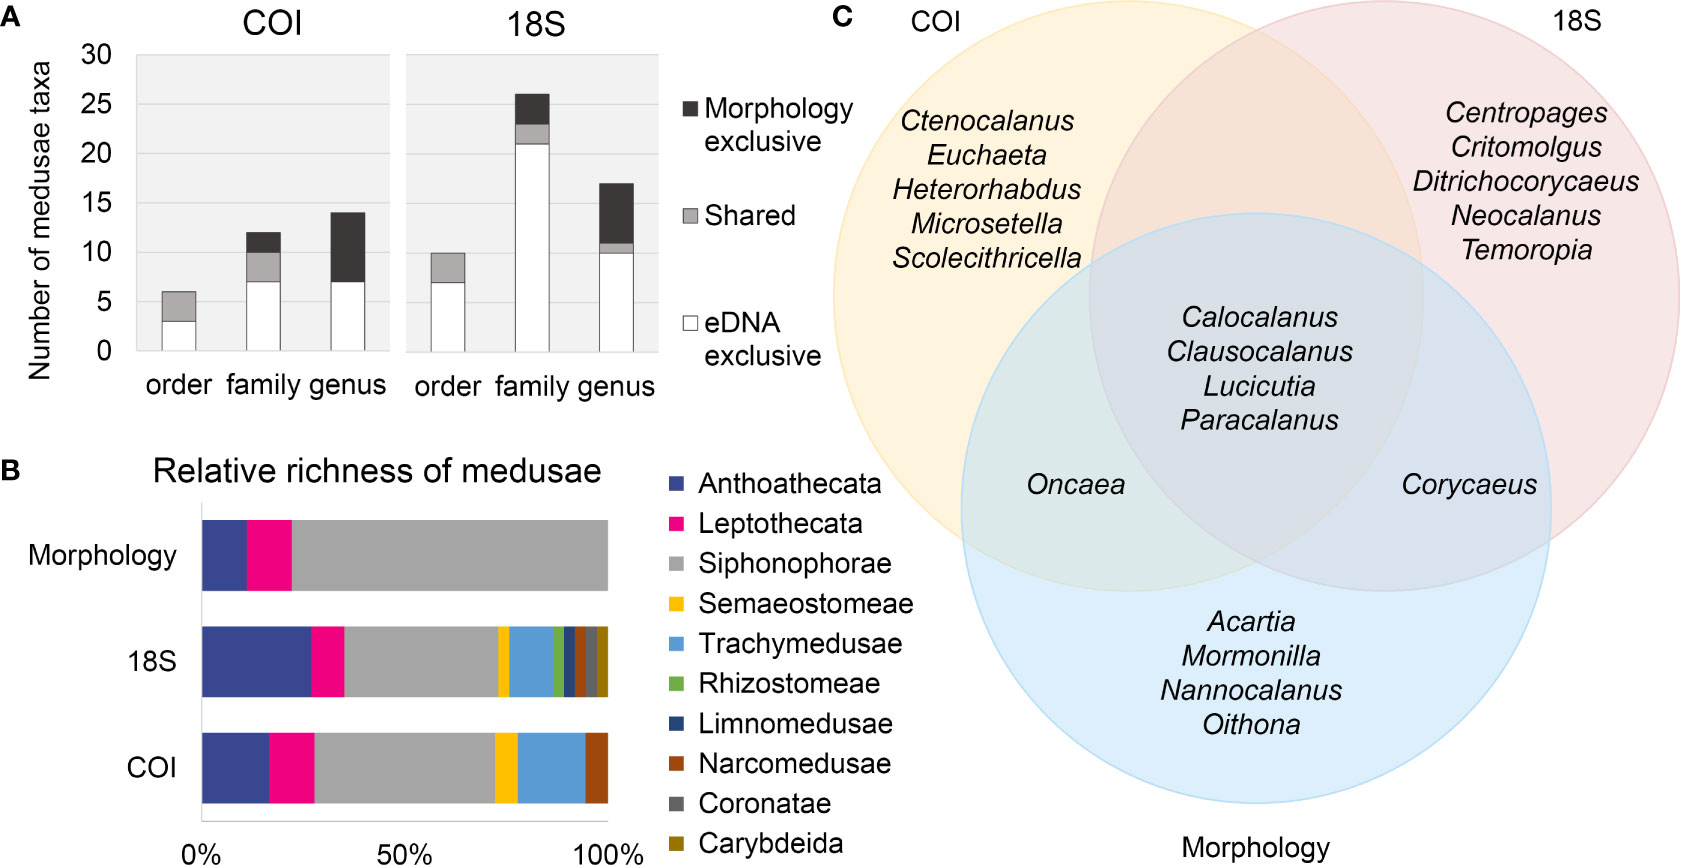
Figure 4 Comparison of biodiversity detected by different methods. (A) Numbers of medusae taxa detected per taxonomic level with eDNA metabarcoding (COI and 18S) only, morphology only, or shared by both methods. (B) Relative richness (unique lowest-level taxa) of medusae (Hydrozoa, Scyphozoa, Cubozoa, Staurozoa) at order level identified by eDNA metabarcoding (COI and 18S) and morphology. (C) Venn diagram of the top-10 most dominant copepods genera (by abundance) detected with eDNA metabarcoding (COI and 18S) and morphology.
Both COI and 18S found fewer unique taxa of copepods than morphology (Table 2). Among the top-10 dominant genera of copepods by sequence abundance and individual abundance, there was a large overlap between different approaches. Four were shared among the two biomarkers and the morphological method, namely Calocalanus, Clausocalanus, Lucicutia, and Paracalanus. Oncaea was shared by COI and morphology, and Corycaeus was shared by 18S and morphology. However, several dominant copepod genera identified by morphology failed to show up in the top-10 results of COI and 18S, including Acartia and Oithona (Figure 4C).
Variation of mesozooplankton assemblages across depth
The alpha diversity of mesozooplankton generated from the COI datasets showed significant vertical variation. The 100 m group had the highest ASV richness and Shannon-Wiener diversity index, followed closely by the DCM group. Low diversity was detected in the 5 m, 500 m, and 1000 m samples. Mesozooplankton diversity showed a decreasing trend from 100 m to 1000 m. No significant difference in Pielou’s evenness was observed among different depth groups, except between the 5-m layer and 500-m layer groups (Figure 5). However, in the 18S datasets, there was no significant difference in the ASV richness and diversity indices among different layers (Figure 5).
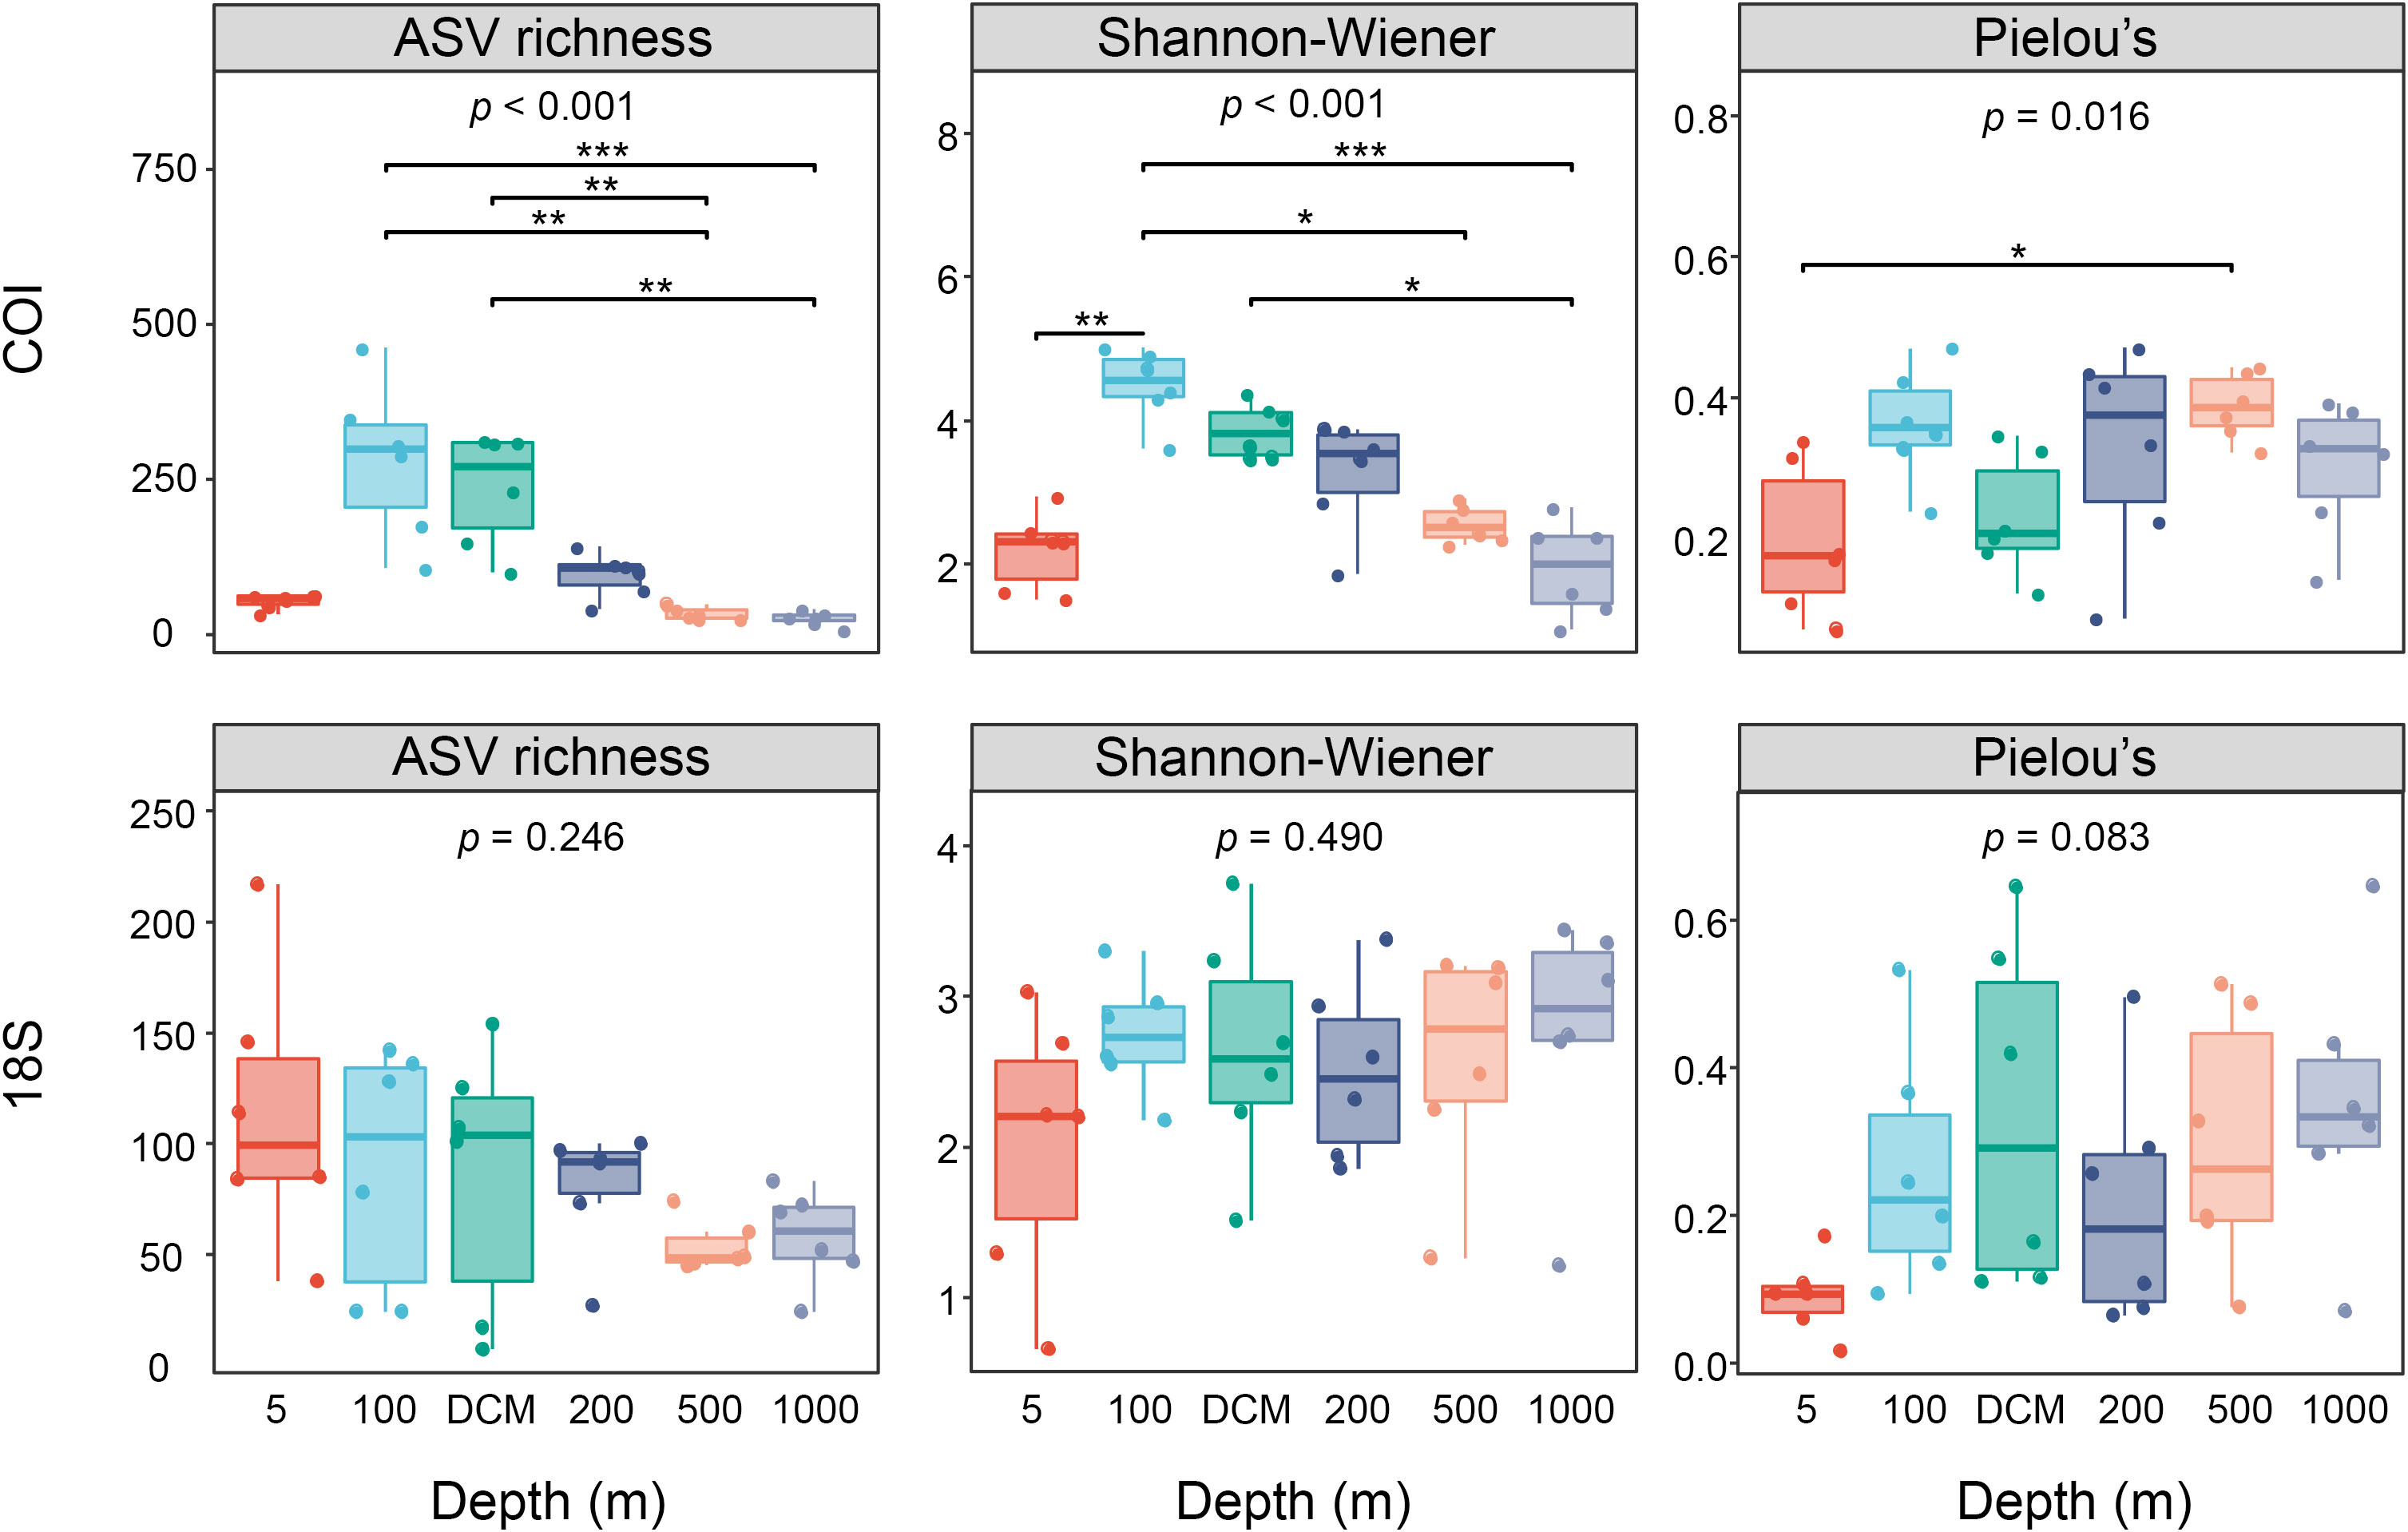
Figure 5 Boxplots of ASV richness, Shannon–Wiener diversity index, and Pielou’s evenness index of six depth groups identified by COI and 18S. Kruskal-Wallis tests were conducted among six depth groups. * represents p<0.05; ** represents p<0.01; *** represents p<0.001.
The results of NMDS ordination analysis and PERMANOVA tests based on the COI dataset showed that the mesozooplankton changed significantly with depth. In the COI dataset, the primary separation occurred between epipelagic (5–200 m) and mesopelagic (500 m and 1000 m) zones by NMDS axis 1. The 100 m and DCM groups, together with the 500 m and 1000 m groups, were more similar than the other depth groups (Figure 6A). The medusae community displayed similar patterns as the entire mesozooplankton community (Figure 6B). In the 18S datasets, the major separation of the mesozooplankton community also occurred between epipelagic (5–200 m) and mesopelagic (500 m and 1000 m), and the DCM and 200 m samples were more similar than other depth groups (Figure S3A). The communities of medusae exhibited weak separation by depth in the NMDs plot (Figure S3B).
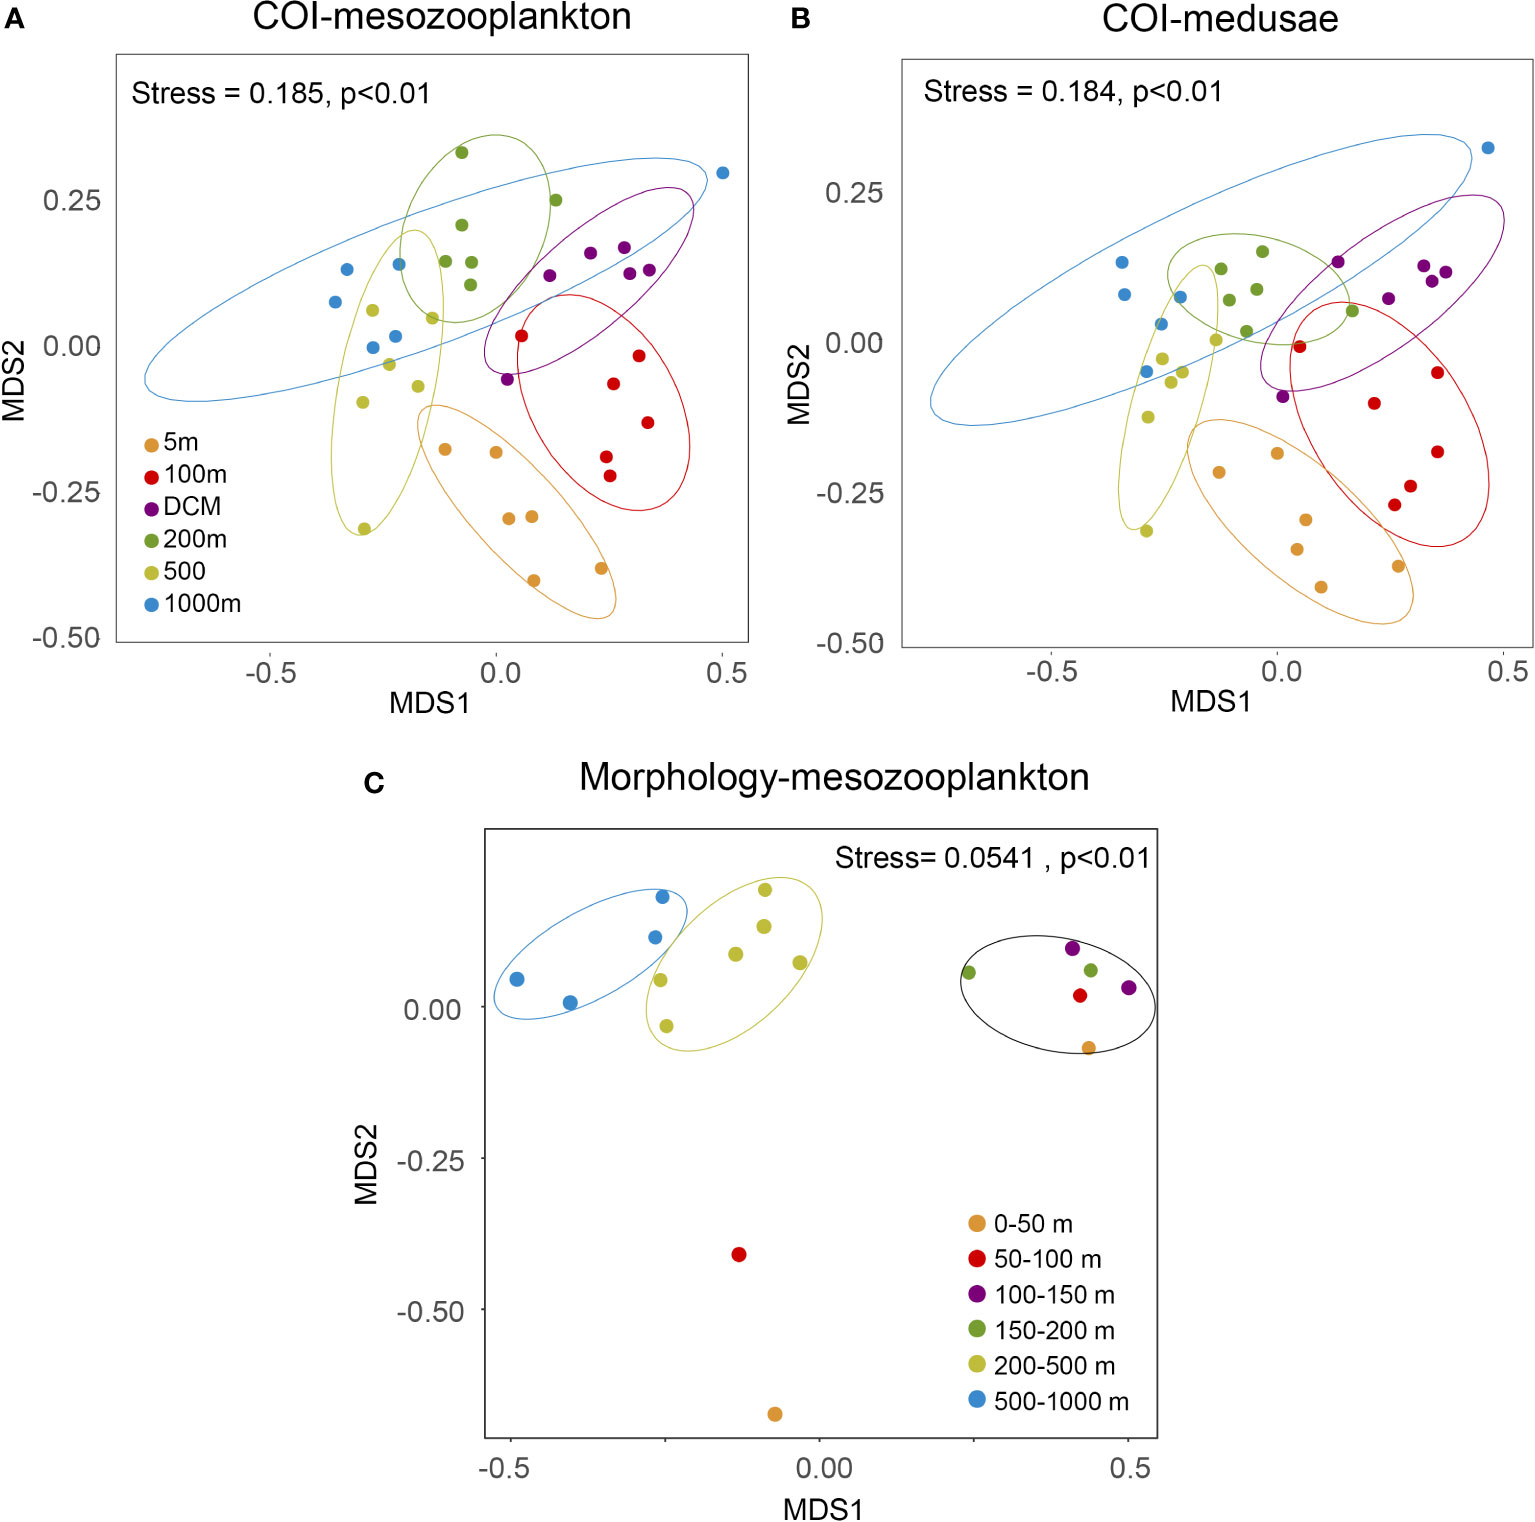
Figure 6 Nonmetric multidimensional scaling (NMDS) plots of (A) COI-mesozooplankton, (B) COI-medusae, and (C) morphology-mesozooplankton. The PERMANOVA was applied to test for significant differences in mesozooplankton communities.
The NMDS plot of morphological results (Figure 6C) defined three major groups: epipelagic (0–200 m), upper mesopelagic (200-500 m), and lower mesopelagic (500–1000 m). The major transition between communities also occurred at 200 m (Figure 6C) The F3_0–50 m and F3_50–100 m samples did not group with other samples because of their extremely low abundance and diversity (Figure S4). The vertical profile of abundance and species numbers of the morphological samples showed obvious diel differences in the epipelagic zone (Figure S4), reflecting the DVM patterns. Diel depth distribution plots for all three methods showed that the three most abundant migrating genera (Clausocalanus, Paracalanus, and Calocalanus) showed higher relative abundance in the shallower layer during the nighttime compared to the daytime, demonstrating that eDNA metabarcoding was able to detect DVM signals (Figure 7).
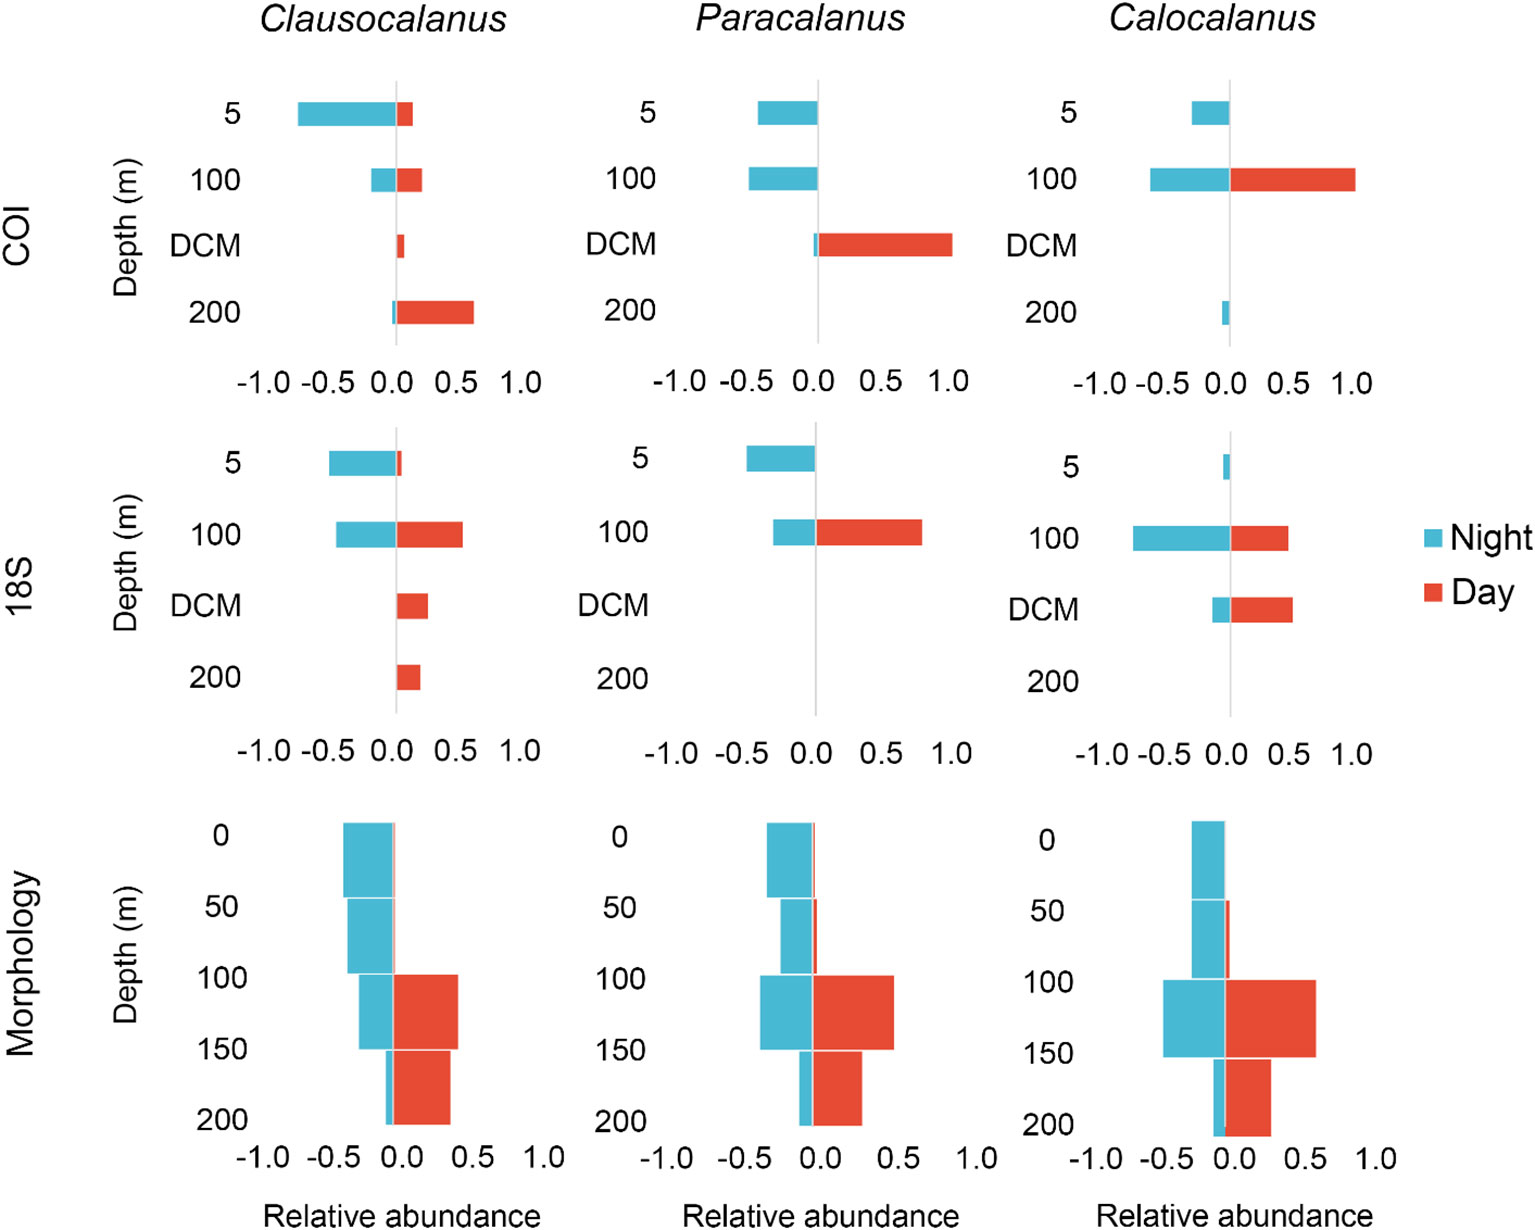
Figure 7 Diel vertical distribution plots of the genera Clausocalanus, Paracalanus, and Calocalanus from surface to 200 m. The eDNA data that were used to calculate relative abundance represent a sum of all ASVs identified as each genus.
Discussion
Mesozooplankton biodiversity detection
In our study, the eDNA metabarcoding method using both COI and 18S resolved most of the known mesozooplankton groups, including Medusa (Hydrozoa, Scyphozoa, Cubozoa, Staurozoa), Ctenophora, Polychaeta, Copepoda, Ostracoda, Malacostraca (Mysida, Amphipoda, Euphausiacea, Decapoda, Cumacea), Cumacea, Chaetognatha, Tunicata (Appendiculata and Thaliacea), Branchiopoda, Pelagic Mollusca, and several meroplankton taxa. The metabarcoding method has been proven to reveal hidden zooplankton diversity in the North Pacific Ocean (Sommer et al., 2017), Arctic Ocean (Questel et al., 2021), and coastal waters (Lindeque et al., 2013; Hirai et al., 2017; Semmouri et al., 2021). The diversity of zooplankton was likely underestimated because some widespread zooplankton species possess significant genetic variation. These probable cryptic species cannot be distinguished and identified by morphological analysis (Mcmanus and Katz, 2009; Cornils et al., 2017). In our study, we used the DADA2 approach to produce ASVs that were clustered at 100% sequence similarity. This method could preserve more genetic variation in the prefiltering process than traditional “operational taxonomic unit” methods, clustered at 97% similarity (Callahan et al., 2016), and thus could better reveal undetected zooplankton diversity (Chain et al., 2016). It has been widely used in zooplankton metabarcoding studies recently (Holman et al., 2021; Cicala et al., 2022). However, intraspecific variations in sequences might lead to an overestimate of diversity. Therefore, we used unique lowest-level taxa rather than ASV numbers when comparing richness between metabarcoding and morphology. Only 5% of COI ASVs and 31% of 18S ASVs were assigned to genus or species level, indicating the reference sequences were strongly limited in the open sea, especially for COI. The richness will be higher in the future with the improvement of the reference databases.
With a majority of sequences being unclassified at genus or species level, eDNA metabarcoding still found 2-4 times more medusae taxa than the morphological method based on net sampling (Figure 4A; Table 2). The higher detection of medusae in eDNA metabarcoding than in morphological analysis is compatible with other studies (Kim et al., 2019; Govindarajan et al., 2021). This result may be associated with several reasons. First, medusae are easily destroyed in net sampling, leading to difficulties in morphological identification and, consequently, underestimation of diversity and biomass. Second, medusae were found to have higher eDNA shedding rates than other animal taxa (Minamoto et al., 2017; Allan et al., 2021), especially those with a hard shell or exoskeleton (Sansom and Sassoubre, 2017). In addition, the degradation and dilution of eDNA might also vary between taxa and individuals. Allan et al. (2021) found that the decay rate constants of medusae exhibited no obvious temperature dependence, while those of crustaceans and fish increased with temperature. This might explain why medusae were easily detected in the tropical area we studied. The metabarcoding analysis also does well in detecting rare taxa like meroplankton (Lindeque et al., 2013; Chain et al., 2016; Blanco-Bercial, 2020). Even well-trained experts would find it difficult to identify meroplankton because they are composed of mainly immature larvae with few obvious morphological characteristics. Molecular methods are more suitable for solving this problem than morphological methods. We obtained higher meroplankton diversity, including 10 taxa dominated by Anthozoa and Nemertea with eDNA metabarcoding than with morphological methods (Table 2). However, eDNA metabarcoding could provide only information of relative abundance rather than actual abundance. Though eDNA concentration has been found to be correlated with biomass (Yamamoto et al., 2016), this relationship could be biased by primer amplification effects and technical bias during the PCR process (Kim et al., 2019). Therefore, other approaches like acoustic backscatter are recommended to be combined with eDNA metabarcoding when evaluating both diversity and biomass of zooplankton.
However, neither COI nor 18S recovered as many unique taxa of copepods as did morphology. There is no doubt that low eDNA concentrations in the water column and the lack of reference sequences in the database of rare zooplankton taxa strongly limited the identification and detection by metabarcoding (Meredith et al., 2021). However, several abundant taxa were underestimated in our study. The small copepod genera7 Acartia and Oithona have been recorded with relatively high abundance in our morphological results (Table S3) and a previous study in the western Pacific Ocean (Yang et al., 2017a), but they showed low sequence abundance and diversity in our eDNA samples. Such underestimation has also been observed in other taxa, like the chaetognaths and hyperiid amphipods (Sommer et al., 2017), and the Calanidae family (Questel et al., 2021). These inconsistencies in our samples might be associated with a low shedding rate of eDNA, or the primer bias and issues with the HTS process. Despite all this, the eDNA metabarcoding method detected small copepods dominated by abundance in our study area, which was comparable to morphological results (Figure 4C). This result corresponded with previous research that small copepods with high growth rates are well suitable to live in the western tropical Pacific Ocean, where the environment is oligotrophic all year (Chiba et al., 2015; Sun et al., 2019; Long et al., 2021). These results indicated that eDNA metabarcoding is a useful and reliable tool for evaluating zooplankton biodiversity (Djurhuus et al., 2018; Di Capua et al., 2021; Suter et al., 2021).
Vertical distribution patterns of mesozooplankton community
Although there are some problems in the taxonomic classification of zooplankton by metabarcoding, the evaluation of α- and β-diversity is taxonomic independent and is thus reliable (Berry et al., 2019). Significant vertical variation in diversity was obtained by the COI marker in this study. Shannon-Wiener diversity index was high at the 100-m and DCM layers and low at the surface layer and mesopelagic zone (Figure 5), which corresponded with the morphological results (Figure 6B). This vertical pattern was also similar to previous results of zooplankton studies based on metabarcoding at Station ALOHA in the North Pacific Subtropical Gyre (Sommer et al., 2017). The community composition of mesozooplankton varied significantly across depth. In the morphological results, the mesozooplankton communities were classified into epipelagic (0–200 m), upper mesopelagic (200-500 m), and lower mesopelagic (500–1000 m) groups (Figure 6C), which were partially concordant with previous research in the western tropical Pacific Ocean (Dai et al., 2016a). However, the mesozooplankton communities detected by COI and 18S showed distinct vertical variations within the epipelagic zone (Figure 6A; Figure S3A). The different patterns might be related to the different sampling methods. The net samples were collected from strata, while the eDNA samples were collected at a certain depth. These results also indicated that eDNA was likely depth-stratified in the water column rather than mixed up in the open ocean (Canals et al., 2021), and could better reflect the vertical structure of mesozooplankton. On the other hand, eDNA metabarcoding recovered high relative richness and abundance of medusae than morphology. The medusae communities were also found to have distinct vertical variations within the epipelagic zone (Figure 6B; Figure S3B), which would affect the vertical structure of the whole mesozooplankton community.
Noticeably, the dominant copepods Clausocalanus spp., Paracalanus spp., and Calocalanus spp., which were known to have DVM strategies (Vega-Perez and Hernandez, 1997; Lo et al., 2004; Shimode and Shirayama, 2004), exhibited obvious diel patterns (Figure 7). These findings suggested that, as has been found for fish (Canals et al., 2021), eDNA metabarcoding enabled the detection of DVM behavior in copepods and also suggested that eDNA provides a snapshot of organisms present in the water column (Easson et al., 2020; Suter et al., 2021). The DVM behavior detected in our study occurred mainly in the epipelagic waters. This is likely because the small body size of the dominant copepods makes them less susceptible to visual predators; therefore, they do not have to migrate to deep depths as the larger ones do (Ohman and Romagnan, 2016). Also, the migration of small copepods would be restricted by the thermocline (Ge et al., 2021). With strong DVM strategies between the surface and mesopelagic zones (Hays, 1996; Falk-Petersen et al., 2008; Navarro-Barranco and Hughes, 2015; Tarrant et al., 2021), euphausiids, amphipods, and the large copepods Pleuromamma showed a low proportion of reads in both COI and 18S datasets (Table S2), and low abundance in the morphologic dataset (Table S3) The high amplitude of DVM of these groups would lead to enhanced carbon export to the deep ocean. For a more complete description of the DVM pattern and the consequent effect on vertical carbon flux, more sensitive sequencing and multiple samples at different depths and times of the day would be needed to focus on those rare taxa with strong DVM behaviors.
Consideration of marker choice and databases in the eDNA metabarcoding method
In our results, the COI gene had better performance at describing the vertical distribution of the mesozooplankton than the 18S gene, when compared with morphological results (Figure 5, Figure S4). Many studies argue that COI is a better marker than 18S in metabarcoding of zooplankton or metazoans due to the more conserved nature of 18S relative to COI (Tang et al., 2012; Wangensteen et al., 2018; Meredith et al., 2021). In addition, the different reference databases we used in this study also contributed to the differences in results. It is well known that an accurate and region-specific database would strongly improve the identification resolution and accuracy of the highly divergent zooplankton community in metabarcoding studies (Ransome et al., 2017; Yang et al., 2017b; Questel et al., 2021). The MZGdb database provides over 150,000 COI sequences belonging to ~5600 described species of marine zooplankton with high-quality control, and it is available for assembling sub-databases including specific sequences from selected ocean regions (Bucklin et al., 2021). This resource proved to be a valuable tool for the metabarcoding of mesozooplankton in our study. On the other hand, the number of COI sequences in the MZGdb was much less than that of 18S sequences in NCBI, leading to a higher proportion of COI sequences being unclassified at family and lower levels than that of 18S sequences. That might explain why 18S had higher taxonomic coverage and identified more taxa than COI, especially for mesoplankton (Figure 3; Table 1). When combining COI and 18S, eDNA metabarcoding revealed more taxa than morphology (Figure 3B). Thus, the use of multi-gene barcodes is encouraged to obtain comprehensive information in complex zooplankton samples (Zhan et al., 2014; Djurhuus et al., 2018; Zhang et al., 2018). However, despite high diversity in this area, only 5% and 12%, respectively, of ASVs were assigned to the species level in COI and 18S datasets. The taxonomic resolution of eDNA metabarcoding was lower than that of metabarcoding based on net samples or morphological methods, indicating that there are a large number of unknown species that are rarely captured and sequenced by traditional sampling in the open ocean. The lack of reference sequences was still the biggest limitation to our understanding of marine zooplankton diversity, especially in these poorly explored deep pelagic zones.
Conclusion
With the combination of eDNA metabarcoding and morphological methods, mesozooplankton biodiversity and vertical assemblages in the western tropical Pacific Ocean were investigated. Compared to morphology. eDNA metabarcoding detected higher richness and relative abundance of medusae and provides different insights into the vertical structure of mesozooplankton in the western tropical Pacific. The eDNA metabarcoding was also found to capture the same DVM signals of copepods as did morphological identification. The two biomarkers complement each other. Therefore, use of multiple barcodes is encouraged to maximize the efficiency and accuracy of diversity detection. In sum, our results suggest that eDNA metabarcoding is a valuable approach for studying mesozooplankton in open sea areas, and it could complement traditional methods by improving the detection of medusae and meroplankton. Additional effort is needed to increase sampling efforts and reference sequences of rare taxa to obtain a higher taxonomic resolution, enabling a comprehensive exploration of mesozooplankton vertical structuring and DVM by eDNA sampling.
Data availability statement
The raw sequences datasets presented in this study can be found in the Sequence Read Archive (SRA) repository of NCBI. COI datasets: https://www.ncbi.nlm.nih.gov/bioproject/PRJNA858185; 18S datasets: https://www.ncbi.nlm.nih.gov/bioproject/PRJNA858640.
Author contributions
YF, DS, and QS conceptualized the study and designed the experiment. CF and CW participated in the research cruise and realized the sampling. YF performed the experiments and statistical analysis and draft the manuscript. DS, QS, and CW revised and edit the manuscript. All authors contributed to the article and approved the submitted version.
Funding
This study was supported by the National Natural Science Foundation of China (42076122) and the China Ocean Mineral Resources Research and Development Association Program (DY-XZ-02).
Acknowledgments
We thank the members of the research vessel Shenhaiyihao for their great help during the investigation, and Lei Wang for providing the chlorophyll data. We also thank the editor and reviewers for their valuable comments. We thank LetPub (www.letpub.com) for its linguistic assistance during the preparation of this manuscript.
Conflict of interest
The authors declare that the research was conducted in the absence of any commercial or financial relationships that could be construed as a potential conflict of interest.
Publisher’s note
All claims expressed in this article are solely those of the authors and do not necessarily represent those of their affiliated organizations, or those of the publisher, the editors and the reviewers. Any product that may be evaluated in this article, or claim that may be made by its manufacturer, is not guaranteed or endorsed by the publisher.
Supplementary material
The Supplementary Material for this article can be found online at: https://www.frontiersin.org/articles/10.3389/fmars.2022.1004410/full#supplementary-material
References
Allan E. A., Zhang W. G., Lavery A. C., Govindarajan A. F. (2021). Environmental DNA shedding and decay rates from diverse animal forms and thermal regimes. Environ. DNA 3 (2), 492–514. doi: 10.1002/edn3.141
Allen G. R. (2008). Conservation hotspots of biodiversity and endemism for indo-pacific coral reef fishes. Aquat. Conserv.: Mar. Freshwat. Ecosyst. 18 (5), 541–556. doi: 10.1002/aqc.880
Amaral-Zettler L. A., Mccliment E. A., Ducklow H. W., Huse S. M., Gordon L. (2009). A method for studying protistan diversity using massively parallel sequencing of v9 hypervariable regions of small-subunit ribosomal RNA genes. PLoS One 4 (7), e6372. doi: 10.1371/journal.pone.0006372
Ames C. L., Ohdera A. H., Colston S. M., Collins A. G., Fitt W. K., Morandini A. C., et al. (2021). Fieldable environmental DNA sequencing to assess jellyfish biodiversity in nearshore waters of the Florida keys, united states. Front. Mar. Sci. 8. doi: 10.3389/fmars.2021.640527
Berry T. E., Saunders B. J., Coghlan M. L., Stat M., Jarman S., Richardson A. J., et al. (2019). Marine environmental DNA biomonitoring reveals seasonal patterns in biodiversity and identifies ecosystem responses to anomalous climatic events. PLoS Genet. 15 (2), e1007943. doi: 10.1371/journal.pgen.1007943
Blanco-Bercial L. (2020). Metabarcoding analyses and seasonality of the zooplankton community at BATS. Front. Mar. Sci. 7. doi: 10.3389/fmars.2020.00173
Bohmann K., Evans A., Gilbert M. T. P., Carvalho G. R., Creer S., Knapp M., et al. (2014). Environmental DNA for wildlife biology and biodiversity monitoring. Trends Ecol. Evol. 29 (6), 358–367. doi: 10.1016/j.tree.2014.04.003
Boyd P. W., Claustre H., Levy M., Siegel D. A., Weber T. (2019). Multi-faceted particle pumps drive carbon sequestration in the ocean. Nature 568 (7752), 327–335. doi: 10.1038/s41586-019-1098-2
Briggs J. C. (2005). The marine East indies: Diversity and speciation. J. Biogeogr. 32 (9), 1517–1522. doi: 10.1111/j.1365-2699.2005.01266.x
Bucklin A., Lindeque P. K., Rodriguez-Ezpeleta N., Albaina A., Lehtiniemi M. (2016). Metabarcoding of marine zooplankton: prospects, progress, and pitfalls. J. Plankton Res. 38 (3), 393–400. doi: 10.1093/plankt/fbw023
Bucklin A., Peijnenburg K. T. C. A., Kosobokova K. N., O'Brien T. D., Blanco-Bercial L., Cornils A., et al. (2021). Toward a global reference database of COI barcodes for marine zooplankton. Mar. Biol. 168 (6), 78. doi: 10.1007/s00227-021-03887-y
Callahan B. J., McMurdie P. J., Rosen M. J., Han A. W., Johnson A. J. A., Holmes S. P. (2016). DADA2: High-resolution sample inference from illumina amplicon data. Nat. Methods 13 (7), 581. doi: 10.1038/Nmeth.3869
Canals O., Mendibil I., Santos M., Irigoien X., Rodríguez-Ezpeleta N. (2021). Vertical stratification of environmental DNA in the open ocean captures ecological patterns and behavior of deep-sea fishes. Limnol. Oceanogr. Lett. 6 (6), 339–347. doi: 10.1002/lol2.10213
Caporaso J. G., Kuczynski J., Stombaugh J., Bittinger K., Bushman F. D., Costello E. K., et al. (2010). QIIME allows analysis of high-throughput community sequencing data. Nat. Methods 7 (5), 335–336. doi: 10.1038/nmeth.f.303
Chain F. J. J., Brown E. A., MacIsaac H. J., Cristescu M. E. (2016). Metabarcoding reveals strong spatial structure and temporal turnover of zooplankton communities among marine and freshwater ports. Divers. Distrib. 22 (5), 493–504. doi: 10.1111/ddi.12427
Chiba S., Batten S. D., Yoshiki T., Sasaki Y., Sasaoka K., Sugisaki H., et al. (2015). Temperature and zooplankton size structure: climate control and basin-scale comparison in the north pacific. Ecol. Evol. 5 (4), 968–978. doi: 10.1002/ece3.1408
Cicala F., Arteaga M. C., Herzka S. Z., Hereu C. M., Jimenez-Rosenberg S. P. A., Saavedra-Flores A., et al. (2022). Environmental conditions drive zooplankton community structure in the epipelagic oceanic water of the southern gulf of Mexico: A molecular approach. Mol. Ecol. 31 (2), 546–561. doi: 10.1111/mec.16251
Coguiec E., Ershova E. A., Daase M., Vonnahme T. R., Wangensteen O. S., Gradinger R., et al. (2021). Seasonal variability in the zooplankton community structure in a sub-Arctic fjord as revealed by morphological and molecular approaches. Front. Mar. Sci. 8. doi: 10.3389/fmars.2021.705042
Cornils A., Wend-Heckmann B., Held C. (2017). Global phylogeography of Oithona similis s.l. (Crustacea, copepoda, oithonidae) - a cosmopolitan plankton species or a complex of cryptic lineages? Mol. Phylogen. Evol. 107, 473–485. doi: 10.1016/j.ympev.2016.12.019
Dai L., Li C., Tao Z., Yang G., Wang X., Zhu M. (2016a). Zooplankton abundance, biovolume and size spectra down to 3000 m depth in the western tropical north pacific during autumn 2014. Deep Sea Res. (I Oceanogr. Res. Pap.) 121, 1–13. doi: 10.1016/j.dsr.2016.12.015
Dai L. P., Li C. L., Yang G., Sun X. X. (2016b). Zooplankton abundance, biovolume and size spectra at western boundary currents in the subtropical north pacific during winter 2012. J. Mar. Syst. 155, 73–83. doi: 10.1016/j.jmarsys.2015.11.004
Di Capua I., Piredda R., Mazzocchi M. G., Zingone A. (2021). Metazoan diversity and seasonality through eDNA metabarcoding at a Mediterranean long-term ecological research site. ICES J. Mar. Sci. 78 (9), 3303–3316. doi: 10.1093/icesjms/fsab059
Djurhuus A., Closek C. J., Kelly R. P., Pitz K. J., Michisaki R. P., Starks H. A., et al. (2020). Environmental DNA reveals seasonal shifts and potential interactions in a marine community. Nat. Commun. 11 (1), 254. doi: 10.1038/s41467-019-14105-1
Djurhuus A., Pitz K., Sawaya N. A., Rojas-Marquez J., Michaud B., Montes E., et al. (2018). Evaluation of marine zooplankton community structure through environmental DNA metabarcoding. Limnol. Oceanogr. Methods 16 (4), 209–221. doi: 10.1002/lom3.10237
Dollive S., Peterfreund G. L., Sherrill-Mix S., Bittinger K., Sinha R., Hoffmann C., et al. (2012). A tool kit for quantifying eukaryotic rRNA gene sequences from human microbiome samples. Genome Biol. 13 (7), R60. doi: 10.1186/gb-2012-13-7-r60
Drazen J. C., Sutton T. T. (2017). Dining in the deep: The feeding ecology of deep-sea fishes. Ann. Rev. Mar. Sci. 9, 337–366. doi: 10.1146/annurev-marine-010816-060543
Easson C. G., Boswell K. M., Tucker N., Warren J. D., Lopez J. V. (2020). Combined eDNA and acoustic analysis reflects diel vertical migration of mixed consortia in the gulf of Mexico. Front. Mar. Sci. 7. doi: 10.3389/fmars.2020.00552
Ershova E. A., Wangensteen O. S., Descoteaux R., Barth-Jensen C., Praebel K. (2021). Metabarcoding as a quantitative tool for estimating biodiversity and relative biomass of marine zooplankton. ICES J. Mar. Sci. 78 (9), 3342–3355. doi: 10.1016/j.dsr2.2008.05.010
Falk-Petersen S., Leu E., Berge J., Kwasniewski S., Nygard H., Rostad A., et al (2008). Vertical migration in high Arctic waters during autumn 2004. Deep Sea Res. (II Top. Stud. Oceanogr). 55 (20–21), 2275–2284. doi: 10.1016/j.dsr2.2008.05.010
Folmer O., Black M., Hoeh W., Lutz R., Vrijenhoek R. (1994). DNA Primers for amplification of mitochondrial cytochrome c oxidase subunit I from diverse metazoan invertebrates. Mol. Mar. Biol. Biotechnol. 3 (5), 294–299.
Fonseca V. G., Carvalho G. R., Sung W., Johnson H. F., Power D. M., Neill S. P., et al. (2010). Second-generation environmental sequencing unmasks marine metazoan biodiversity. Nat. Commun. 1, 98. doi: 10.1038/ncomms1095
Garcia-Vazquez E., Georges O., Fernandez S., Ardura A. (2021). eDNA metabarcoding of small plankton samples to detect fish larvae and their preys from Atlantic and pacific waters. Sci. Rep. 11 (1), 7224. doi: 10.1038/s41598-021-86731-z
Ge R. P., Chen H. J., Liu G. X., Zhu Y. Z., Jiang Q. (2021). Diel vertical migration of mesozooplankton in the northern yellow Sea. J. Oceanol. Limnol. 39 (4), 1373–1386. doi: 10.1007/s00343-020-0170-y
Govindarajan A. F., Francolini R. D., Jech J. M., Lavery A. C., Llopiz J. K., Wiebe P. H., et al. (2021). Exploring the use of environmental DNA (eDNA) to detect animal taxa in the mesopelagic zone. Front. Ecol. Evol. 9. doi: 10.3389/fevo.2021.574877
Hays G. C. (1996). Large-Scale patterns of diel vertical migration in the north Atlantic. Deep Sea Res. (I Oceanogr. Res. Pap.) 43 (10), 1601–1615. doi: 10.1016/s0967-0637(96)00078-7
Hays G. C. (2003). A review of the adaptive significance and ecosystem consequences of zooplankton diel vertical migrations. Hydrobiologia 503 (1), 163–170. doi: 10.1023/B:HYDR.0000008476.23617.b0
Hirai J., Katakura S., Kasai H., Nagai S. (2017). Cryptic zooplankton diversity revealed by a metagenetic approach to monitoring metazoan communities in the coastal waters of the Okhotsk Sea, northeastern Hokkaido. Front. Mar. Sci. 4. doi: 10.3389/fmars.2017.00379
Holman L. E., de Bruyn M., Creer S., Carvalho G., Robidart J., Rius M. (2021). Animals, protists and bacteria share marine biogeographic patterns. Nat. Ecol. Evol. 5 (6), 738–746. doi: 10.1038/s41559-021-01439-7
Kim D.-K., Park K., Jo H., Kwak I.-S. (2019). Comparison of water sampling between environmental DNA metabarcoding and conventional microscopic identification: A case study in gwangyang bay, south Korea. Appl. Sci. (Basel). 9 (16), 3272. doi: 10.3390/app9163272
Laroche O., Kersten O., Smith C. R., Goetze E. (2020). Environmental DNA surveys detect distinct metazoan communities across abyssal plains and seamounts in the western clarion clipperton zone. Mol. Ecol. 29 (23), 4588–4604. doi: 10.1111/mec.15484
Leray M., Yang J. Y., Meyer C. P., Mills S. C., Agudelo N., Ranwez V., et al. (2013). A new versatile primer set targeting a short fragment of the mitochondrial COI region for metabarcoding metazoan diversity: application for characterizing coral reef fish gut contents. Front. Zool. 10, 34. doi: 10.1186/1742-9994-10-34
Lindeque P. K., Parry H. E., Harmer R. A., Somerfield P. J., Atkinson A. (2013). Next generation sequencing reveals the hidden diversity of zooplankton assemblages. PloS One 8 (11), e81327. doi: 10.1371/journal.pone.0081327
Long Y., Abu Noman M., Chen D. W., Wang S. H., Yu H., Chen H. T., et al. (2021). Western Pacific zooplankton community along latitudinal and equatorial transects in autumn 2017 (Northern hemisphere). Diversity 13 (2), 58. doi: 10.3390/d13020058
Lo W. T., Shih C. T., Hwang J. S. (2004). Diel vertical migration of the planktonic copepods at an upwelling station north of Taiwan, western north pacific. J. Plankton Res. 26 (1), 88–96. doi: 10.1093/plankt/fbh004
Madin L. P., Horgan E. F., Steinberg D. K. (2001). Zooplankton at the Bermuda Atlantic time-series study (BATS) station: diel, seasonal and interannual variation in biomass1994-1998. Deep Sea Res. (II Top. Stud. Oceanogr.) 48 (8-9), 2063–2082. doi: 10.14806/ej.17.1.200
Martin M. (2011). CUTADAPT removes adapter sequences from high-throughput sequencing reads. EMBnet J. 17 (1), 10–12. doi: 10.14806/ej.17.1.200
Mcmanus G. B., Katz L. A. (2009). Molecular and morphological methods for identifying plankton: what makes a successful marriage? J. Plankton Res. 31 (10), 1119–1129. doi: 10.1093/plankt/fbp061
Meredith C., Hoffman J., Trebitz A., Pilgrim E., Okum S., Martinson J., et al. (2021). Evaluating the performance of DNA metabarcoding for assessment of zooplankton communities in Western lake superior using multiple markers. Metabarcoding Metagenom. 5, 83–97. doi: 10.3897/mbmg.5.64735
Minamoto T., Fukuda M., Katsuhara K. R., Fujiwara A., Hidaka S., Yamamoto S., et al. (2017). Environmental DNA reflects spatial and temporal jellyfish distribution. PloS One 12 (2), e0173073. doi: 10.1371/journal.pone.0173073
Navarro-Barranco C., Hughes L. E. (2015). Effects of light pollution on the emergent fauna of shallow marine ecosystems: Amphipods as a case study. Mar. pollut. Bull. 94 (1-2), 235–240. doi: 10.1016/j.marpolbul.2015.02.023
Ohman M. D., Romagnan J. B. (2016). Nonlinear effects of body size and optical attenuation on diel vertical migration by zooplankton. Limnol. Oceanogr. 61 (2), 765–770. doi: 10.1002/lno.10251
Oksanen J., Kindt R., Legendre P., O’Hara R. B., Stevens M. H. H., Oksanen M. J., et al. (2007). The vegan package. Commun. Ecol. Pack 10, 631–637.
Questel J. M., Hopcroft R. R., DeHart H. M., Smoot C. A., Kosobokova K. N., Bucklin A. (2021). Metabarcoding of zooplankton diversity within the chukchi borderland, Arctic ocean: improved resolution from multi-gene markers and region-specific DNA databases. Mar. Biodivers. 51 (1), 4. doi: 10.1007/s12526-020-01136-x
Ransome E., Geller J. B., Timmers M., Leray M., Mahardini A., Sembiring A., et al. (2017). The importance of standardization for biodiversity comparisons: A case study using autonomous reef monitoring structures (ARMS) and metabarcoding to measure cryptic diversity on mo'orea coral reefs, French Polynesia. PloS One 12 (4), e0175066. doi: 10.1371/journal.pone.0175066
R Development Core Team (2019). R: A language and environment for statistical computing (Vienna, Austria: R Foundation for Statistical Computing).
Robison B. H. (2009). Conservation of deep pelagic biodiversity. Conserv. Biol. 23 (4), 847–858. doi: 10.1111/j.1523-1739.2009.01219.x
Romare P., Bergman E., Hansson L. A. (1999). The impact of larval and juvenile fish on zooplankton and algal dynamics. Limnol. Oceanogr. 44 (7), 1655–1666. doi: 10.4319/lo.1999.44.7.1655
Sansom B. J., Sassoubre L. M. (2017). Environmental DNA (eDNA) shedding and decay rates to model freshwater mussel eDNA transport in a river. Environ. Sci. Technol. 51 (24), 14244–14253. doi: 10.1021/acs.est.7b05199
Schroeder A., Stankovic D., Pallavicini A., Gionechetti F., Pansera M., Camatti E. (2020). DNA Metabarcoding and morphological analysis - assessment of zooplankton biodiversity in transitional waters. Mar. Environ. Res. 160, 104946. doi: 10.1016/j.marenvres.2020.104946
Semmouri I., De Schamphelaere K. A. C., Willemse S., Vandegehuchte M. B., Janssen C. R., Asselman J. (2021). Metabarcoding reveals hidden species and improves identification of marine zooplankton communities in the north Sea. ICES J. Mar. Sci. 78 (9), 3411–3427. doi: 10.1093/icesjms/fsaa256
Shimode S., Shirayama Y. (2004). Diel changes in vertical distribution of copepods community in tanabe bay, Japan. J. Mar. Biol. Assoc. U.K. 84 (3), 607–615. doi: 10.1017/S0025315404009622h
Sinniger F., Pawlowski J., Harii S., Gooday A. J., Yamamoto H., Chevaldonné P., et al. (2016). Worldwide analysis of sedimentary DNA reveals major gaps in taxonomic knowledge of deep-sea benthos. Front. Mar. Sci. 3. doi: 10.3389/fmars.2016.00092
Sommer S. A., Van Woudenberg L., Lenz P. H., Cepeda G., Goetze E. (2017). Vertical gradients in species richness and community composition across the twilight zone in the north pacific subtropical gyre. Mol. Ecol. 26 (21), 6136–6156. doi: 10.1111/mec.14286
Sun D., Wang C. S. (2017). Latitudinal distribution of zooplankton communities in the Western pacific along 160 degrees e during summer 2014. J. Mar. Syst. 169, 52–60. doi: 10.1016/j.jmarsys.2017.01.011
Sun D., Zhang D., Zhang R., Wang C. (2019). Different vertical distribution of zooplankton community between north pacific subtropical gyre and Western pacific warm pool: its implication to carbon flux. Acta Oceanol. Sin. 38 (6), 32–45. doi: 10.1007/s13131-018-1237-x
Suter L., Polanowski A. M., Clarke L. J., Kitchener J. A., Deagle B. E. (2021). Capturing open ocean biodiversity: Comparing environmental DNA metabarcoding to the continuous plankton recorder. Mol. Ecol. 30 (13), 3140–3157. doi: 10.1111/mec.15587
Takasu H., Inomata H., Uchino K., Tahara S., Mori K., Hirano Y., et al. (2019). Spatio-temporal distribution of environmental DNA derived from Japanese sea nettle jellyfish Chrysaora pacifica in omura bay, Kyushu, Japan. Plankton Benthos Res. 14 (4), 320–323. doi: 10.3800/pbr.14.320
Tang C. Q., Leasi F., Obertegger U., Kieneke A., Barraclough T. G., Fontaneto D. (2012). The widely used small subunit 18S rDNA molecule greatly underestimates true diversity in biodiversity surveys of the meiofauna. PNAS 109 (40), 16208–16212. doi: 10.1073/pnas.1209160109
Tarrant A. M., McNamara-Bordewick N., Blanco-Bercial L., Miccoli A., Maas A. E. (2021). Diel metabolic patterns in a migratory oceanic copepod. J. Exp. Mar. Biol. Ecol. 545, 151643. doi: 10.1016/j.jembe.2021.151643
Tittensor D. P., Mora C., Jetz W., Lotze H. K., Ricard D., Vanden Berghe E., et al. (2010). Global patterns and predictors of marine biodiversity across taxa. Nature 466 (7310), 1098–1101. doi: 10.1038/nature09329
Valdez-Moreno M., Mendoza-Carranza M., Rendon-Hernandez E., Alarcon-Chavira E., Elias-Gutierrez M. (2021). DNA Barcodes applied to a rapid baseline construction in biodiversity monitoring for the conservation of aquatic ecosystems in the sian ka'an reserve (Mexico) and adjacent areas. Diversity 13 (7), 292. doi: 10.3390/d13070292
Vega-Perez L. A., Hernandez S. (1997). Structure and distribution of the family paracalanidae (Copepoda: Calanoida), from off sao sebastiao region, sao paulo state-Brazil, with special reference of Paracalanus. Rev. Bras. Oceanogr. 45 (1-2), 61–75. doi: 10.1590/S1679-87591997000100007
Wangensteen O. S., Palacin C., Guardiola M., Turon X. (2018). DNA Metabarcoding of littoral hard-bottom communities: high diversity and database gaps revealed by two molecular markers. Peerj 6, e4705. doi: 10.7717/peerj.4705
WoRMS Editorial Board (2022) World register of marine species. Available at: http://www.marinespecies.org (Accessed 9 October 2022).
Xie R., Zhao G., Yang J., Wang Z., Xu Y., Zhang X., et al. (2021). eDNA metabarcoding revealed differential structures of aquatic communities in a dynamic freshwater ecosystem shaped by habitat heterogeneity. Environ. Res. 201, 111602–111602. doi: 10.1016/j.envres.2021.111602
Yamaguchi A., Matsuno K., Abe Y., Arima D., Imai I. (2017). Latitudinal variations in the abundance, biomass, taxonomic composition and estimated production of epipelagic mesozooplankton along the 155 degrees e longitude in the western north pacific during spring. Prog. Oceanogr. 150, 13–19. doi: 10.1016/j.pocean.2015.04.011
Yamamoto S., Minami K., Fukaya K., Takahashi K., Sawada H., Murakami H., et al. (2016). Environmental DNA as a ‘Snapshot’ of fish distribution: A case study of Japanese jack mackerel in maizuru bay, Sea of Japan. PloS One 11, e0149786. doi: 10.1371/journal.pone.0149786
Yang G., Li C. L., Wang Y. Q., Wang X. C., Dai L. P., Tao Z. C., et al. (2017a). Spatial variation of the zooplankton community in the western tropical pacific ocean during the summer of 2014. Cont. Shelf Res. 135, 14–22. doi: 10.1016/j.csr.2017.01.009
Yang J. H., Zhang X. W., Zhang W. W., Sun J. Y., Xie Y. W., Zhang Y. M., et al. (2017b). Indigenous species barcode database improves the identification of zooplankton. PLoS One 12 (10), e0185697. doi: 10.1371/journal.pone.0185697
Zhan A., Bailey S. A., Heath D. D., Macisaac H. J. (2014). Performance comparison of genetic markers for high-throughput sequencing-based biodiversity assessment in complex communities. Mol. Ecol. Resour. 14 (5), 1049–1059. doi: 10.1111/1755-0998.12254
Keywords: mesozooplankton, eDNA, metabarcoding, biodiversity, vertical assemblages, western tropical Pacific Ocean
Citation: Feng Y, Sun D, Shao Q, Fang C and Wang C (2022) Mesozooplankton biodiversity, vertical assemblages, and diel migration in the western tropical Pacific Ocean revealed by eDNA metabarcoding and morphological methods. Front. Mar. Sci. 9:1004410. doi: 10.3389/fmars.2022.1004410
Received: 27 July 2022; Accepted: 13 October 2022;
Published: 25 October 2022.
Edited by:
Leocadio Blanco-Bercial, Bermuda Institute of Ocean Sciences, BermudaReviewed by:
Stephanie Matthews, Scripps Institution of Oceanography, University of California, San Diego, United StatesAstrid Cornils, Alfred Wegener Institute Helmholtz Centre for Polar and Marine Research (AWI), Germany
Copyright © 2022 Feng, Sun, Shao, Fang and Wang. This is an open-access article distributed under the terms of the Creative Commons Attribution License (CC BY). The use, distribution or reproduction in other forums is permitted, provided the original author(s) and the copyright owner(s) are credited and that the original publication in this journal is cited, in accordance with accepted academic practice. No use, distribution or reproduction is permitted which does not comply with these terms.
*Correspondence: Dong Sun, c3VuZEBzaW8ub3JnLmNu; Chunsheng Wang, d2FuZ3Npb0BzaW8ub3JnLmNu