 Carlos Rodero
 Raul Bardaji2
 Estrella Olmedo
 Jaume Piera
- 1Environmental and Sustainability Participatory Information Systems (EMBIMOS) Research Group, Department of Physical and Technological Oceanography, Institute of Marine Sciences, Spanish National Research Council (CSIC), Barcelona, Spain
- 2Marine Technology Unit, Spanish National Research Council (CSIC), Barcelona, Spain
- 3Department of Physical and Technological Oceanography, Barcelona Expert Center, Institute of Marine Sciences, Spanish National Research Council (CSIC), Barcelona, Spain
We analyze the efficacy of using a Do-It-Yourself (DIY) modular instrument to estimate the diffuse attenuation coefficient (Kd) of photosynthetically active radiation (PAR), which can be used for operational oceanography in turbid shallow waters. This parameter evaluates the water transparency, as it summarizes several water components providing an indicator for water quality. Historically, water transparency has been measured with a simple and inexpensive tool: the Secchi disk. Although it contributes a valuable index of visual water clarity, the quality of its measurements is user-dependent, and it does not enable the automatic monitoring of the water quality. For this reason, we need electronic devices to get accurate measures and facilitate long-term evaluations for water quality monitoring. This paper has two main objectives: First, to present the KduPRO, a low-cost and DIY moored instrument. The KduPRO is an evolution of the KdUINO buoy, that provides an estimation of the water transparency in coastal areas and continental waters, with an automatic quality control parameter that makes this sensor suitable for operational observing systems; and second, to provide a replicability analysis associated to the uncertainty of its Kd estimations. This instrument is based on a modular system of light sensors, independent of each other, measuring the irradiance at different depths. This study analyses the performance of the KduPRO with other reference commercial instruments, the performance between different modules of the same system and finally, a case study of measuring the water quality in Loch Leven (a lake in Scotland). The affordable cost, ease of use and measurement repeatability make this instrument a potentially valuable tool for anyone interested in monitoring water quality.
1. Introduction
In aquatic systems, the underwater light penetration and availability is a crucial factor for many physical, biological, geological, and chemical processes (Kirk, 1994). Water transparency plays an important role in understanding ecological environment variations in water, especially relevant in coastal areas and lakes strongly affected by human activities (Buchaca et al., 2019; Bai et al., 2020). Monitoring water transparency serves as an index for the trophic state of a water body and informs about phytoplankton concentrations or levels of dissolved organic and inorganic compounds (Sosik, 2008).
The measurement of water transparency has been attempted by various methods, most commonly based on light attenuation principles (Kirk, 1994; Mobley, 1994). When sunlight penetrates water, its intensity decreases exponentially with depth citepwei2013model (Wei and Lee, 2013; Adi, 2015). The light diffuse attenuation coefficient (Kd) is one parameter to estimate the water transparency (Mobley, 1994). This coefficient is of particular interest in water quality monitoring programs, especially in coastal and continental waters, because it is a suitable proxy for water transparency (Darecki et al., 2003; Schaeffer et al., 2013).
Historically, water transparency has been measured with a simple and inexpensive tool: the Secchi disk (Secchi, 1864; Wernand, 2010; Pitarch, 2020). The Secchi disk is a white (or black and white) disk that is lowered from above the water surface and tracked visually until it goes out of sight. The depth at which it disappears is known as the Secchi disk depth (ZSD). Nowadays, citizen scientists can contribute to monitoring water quality using 3d printed mini Secchi disks (Brewin et al., 2019; George et al., 2021). However, in shallow and transparent waters, the Secchi disk can reach the bottom without having to disappear (see Figure 1). Furthermore, the quality of ZSD observations has an error associated with each person’s vision (Preisendorfer, 1986). Additionally, this kind of instrument does not allow automatic and routine monitoring deployment. As it is difficult to quantify the uncertainty of the measurement, it cannot be included as an operational oceanography measurement.
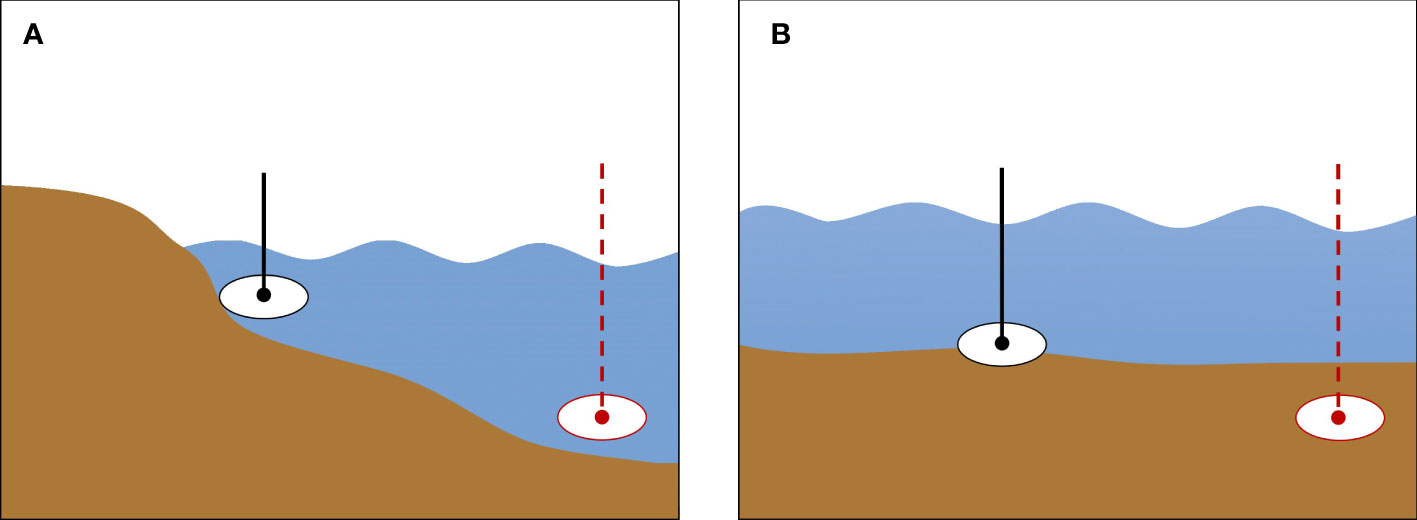
Figure 1 Limitations to estimate water transparency through the Secchi disk. (A) There is no access to deep enough water from the shore. (B) Water column depth is shallower than the Secchi disk depth.
These issues contrast with the objectivity of electronic devices. These devices can bring accurate and complete measurements and complement traditional monitoring methods to facilitate evaluations on a long-term scale. In particular, they can provide systematical routine measures of the water quality as requested by operational oceanography systems, with a rapid interpretation and dissemination of them (Einsporn et al., 2013).
In recent years, low-cost electronic devices have appeared to monitor water quality (Schima et al., 2019; Molnar et al., 2021). An example is the low-cost and Do-It-Yourself (DIY) moored system KdUINO (Bardaji et al., 2016), which estimates the Kd. The design of the KdUINO follows the concept of DIY, using inexpensive and easy-to-use components. With the idea of applying Beer-Lambert’s law (Gordon, 1989), the objective was to develop a mooring system equipped with low-cost sensors to obtain irradiance measurements at different depths. With this information and a post-processing script, Kd was estimated. KdUINO used an Arduino MEGA (https://www.arduino.cc/) to receive and save the data from the sensors. The sensors used were the TCS3200 (not distributed anymore), a semi-digital optical sensor that concert light irradiance measurements into a square signal with a variable frequency (depending on the light). The Arduino counts the number of pulses per minute from the sensors and saves it into an SD card. Each sensor was located at different depths. The sensor was connected to the Arduino with a cable. The KdUINO also contains a transmission module to send the data to a mobile device. The performance of the KdUINO was compared with a reference oceanographic instrumentation, showing that measurements from those instruments presented similar accuracy.
Water transparency is one of the indicators monitored and used for water quality assessments worldwide (Teubner et al., 2020). The importance of this indicator is reflected in the policy-making frameworks, like the EU Water Framework Directive and the EU Marine Strategy Framework Directive, or the 2030 Agenda for Sustainable Development Goals (SDGs), specifically in the water and sanitation goal (6) and in the marine ecosystems goal (14) (Assembly G, 2017). In recent decades, due to the impact of environmental problems on ecosystems, there has been a growth in societies of environmental awareness and understanding of the biophysical environment and its issues. For this reason, in the last years, the citizen science community has demonstrated interest in the SDGs for monitoring and contributing to achieving their goals and targets (Fraisl et al., 2020; Parkinson et al., 2022; Woods et al., 2022). Citizen science in marine and freshwater domains is a powerful tool for collecting observational data (Salvador et al., 2021) and environmental variables (Bishop et al., 2020; Soacha Godoy et al., 2022).
This paper has two main objectives: First, to present the KduPRO, an affordable cost and DIY moored instrument, which is an evolution of the KdUINO buoy, to assess water transparency in the case of shallow waters, and second, to analyses the replicability associated to the uncertainty of the Kd estimation from KduPRO. This analysis does not only include the propagation of the sensor accuracy to the final measurement, but it also could be very sensitive to the fact that untrained users build the instrument.
This paper is structured as follows. Section 2, materials and methods, presents the KduPRO instrument, the method that we use for estimating its theoretical Kd error, the assessment performed with respect to other instruments and the practical use of the KduPRO calculating the Kd in a field campaign at the Loch Leven. Section 3 presents the corresponding results of the estimation of the Kd error from KduPRO, the performance of the KduPRO compared with a reference sensor measuring both the underwater downwelling PAR and the Kd estimations. Section 4 discusses the results and closes with the conclusions and outlooks.
2. Materials and methods
This section presents the KduPRO and describes the experiments performed with this and other instruments, listed and summarized in Table 1.
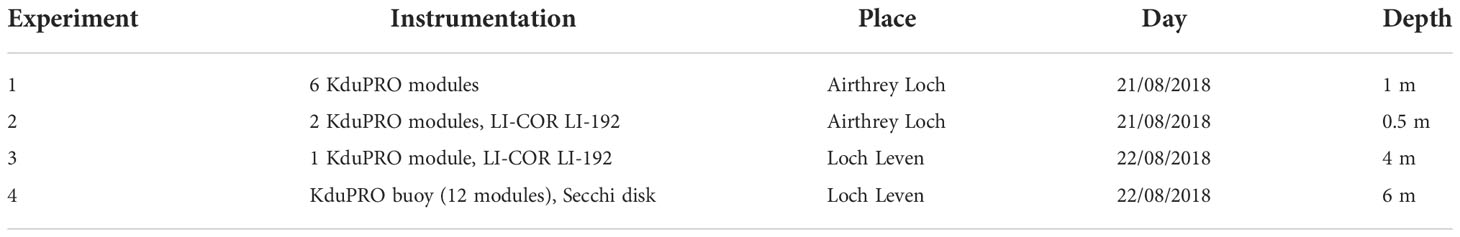
Table 1 List of experiments done with the KduPRO.
2.1. KduPRO instrument
The KduPRO is a cost-affordable and DIY moored system evolved from the KdUINO buoy. It is based on a modular system of light sensors, independent of each other (instead of being cable-connected as in the case of KdUINO), measuring the irradiance at different depths. Each module of the KduPRO, placed at a known depth, consists of a light sensor which allows measuring the light intensity and stores data independently. The KduPRO is ensembled using open-source hardware supplied by Adafruit Industries (www.adafruit.com), a company dedicated to developing and providing low-cost open-source electronic solutions. Regarding the price, the total cost of an independent module of the KduPRO is almost 100 €. The modularity of this instrument facilitates its deployment and set up at the moment of the measurements. Each sensor depth can be modified according to the project’s requirements or the environment, offering the user a custom array of sensors. Furthermore, the system is robust in terms of sensor failures and data integration due to each sensor’s independence. Finally, to retrieve the Kd, it is necessary to collect all the individual irradiance values obtained from the KduPRO in the water column and do a post-processing analysis. The KduPRO is presented and used as a modular moored instrument, made up of multiple independent modules. However, a unique module can be used as a separate sensor for vertical profiles.
The KduPRO assembles the TCS34725 light sensor. This sensor can read lighting intensity by photo-diodes on four different channels [red, green, blue and PAR; their spectral band are provided by the manufacturer (ams-OSRAM, 2022)] and includes an infrared blocking filter. It contains an integrated analogue to digital converter (ADC) to modify the lighting intensity into digital values. The units are defined as counts by simply counting the number of pulses. This sensor provides different configurations for the integration time and gain of the values. To carry out the experiment proposed in this study, we selected the PAR spectrum, the largest integration time to mitigate light variability in the water column [i.e. wave focusing effect (Zaneveld et al., 2001)] and the lowest gain to increase the sensitivity.
The design of the KduPRO includes the building process of a corrective cosine filter for the TCS34725 light sensor (see Figure 2). This corrective cosine filter has a diffuse surface used to capture light, following Lambert’s cosine law: the amount of light falling upon the cosine corrector is proportional to the cosine of the light beam’s incident angle. The User’s guide and technical documentation of the KduPRO includes an installation section with the material list and the steps to build it (Rodero et al., 2021a).
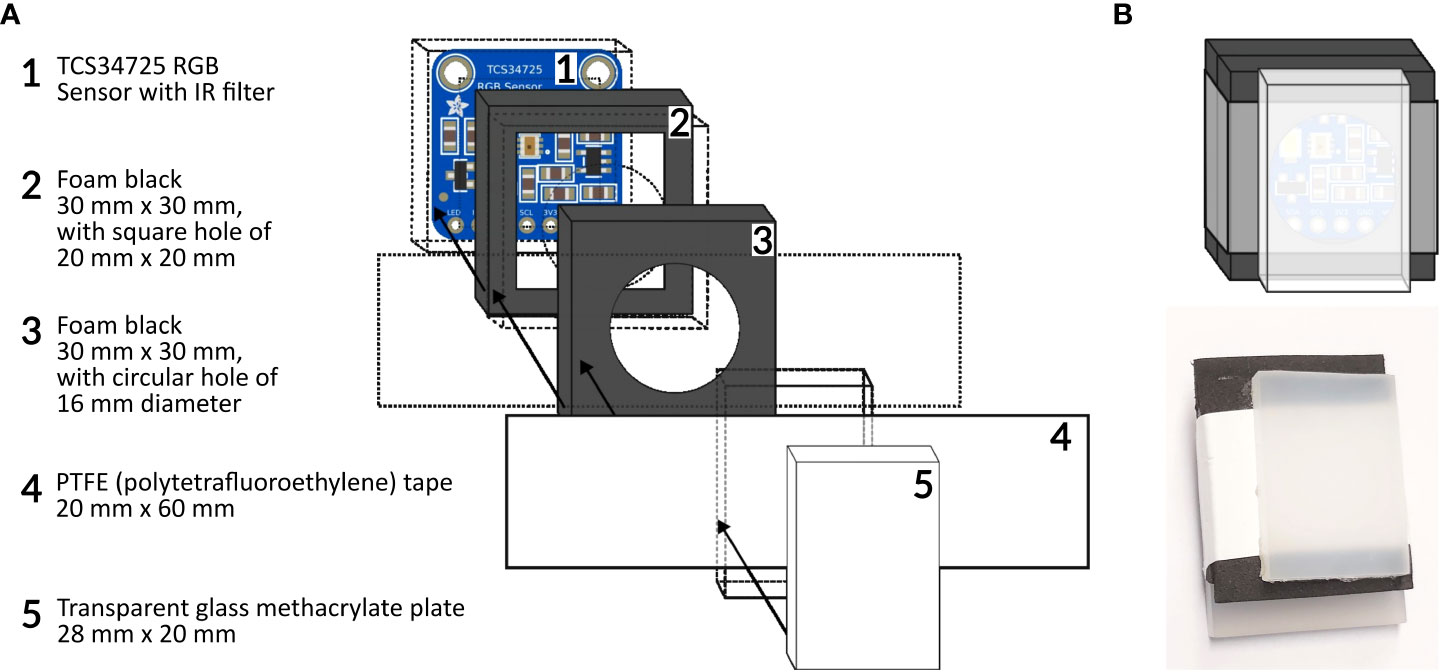
Figure 2 (A) Schematic drawing of the corrective cosine filter in the KduPRO. (B) Final schematic and image of the corrective cosine filter.
In the case of using KduPRO as a separate sensor to perform vertical profiles, since the measurements are provided by the same sensor there is no need of calibration. In the case of using KduPRO as a modular moored instrument, by using multiple sensors, an intercalibration among the different sensors is required, This protocol is described in section 2 from (Bardaji et al., 2016). Since this instrument is intended to citizen science that may not be familiar with the calibration protocol, in the next section we present an analysis of the propagation error in the case of using the mooring KduPRO without the intercalibration of its sensors.
2.2. Replicability analysis associated to uncertainty in Kd estimations from KduPRO
We evaluated the uncertainty associated to the Kd estimations from KduPRO by using a series of concurrent irradiance measurements from six different modules of the KduPRO, collocated at the same water column and depth (see Figure 3).
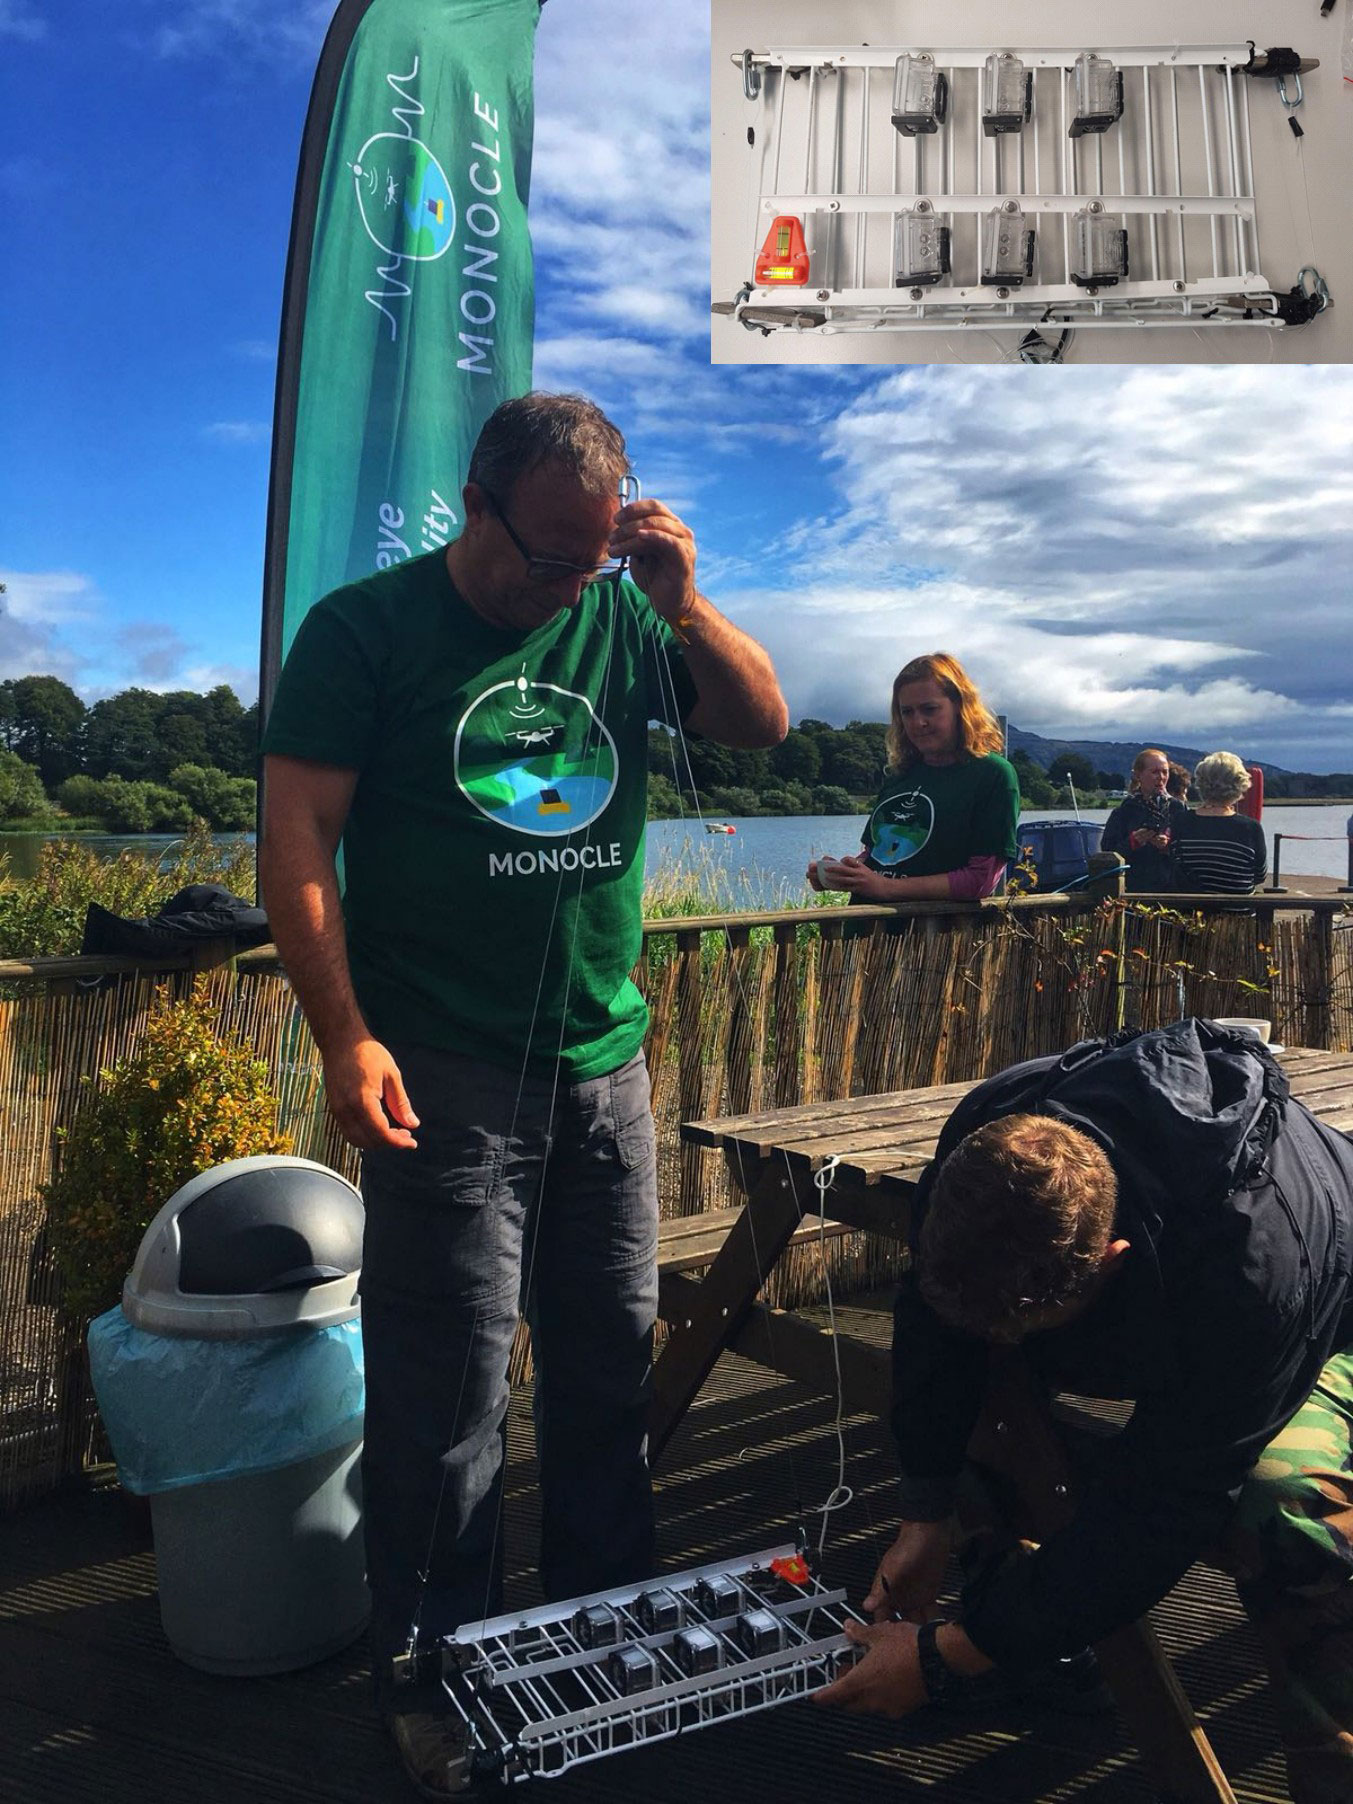
Figure 3 Concurrent measurements to derive theoretical Kd uncertainty. The in situ measurements took place in the Stirling’s University campus (Airthrey Loch) and in the Loch Leven, in August of 2018. Six KduPRO (numbered as 13, 14, 15, 17, 18 and 19) were placed in the same plane at 1 m depth, doing measurements for 15 minutes at noon.
These measurements are used as initial seed for a Monte Carlo simulation to estimate statistically the difference between the expected and the simulated Kd. The specifications of the simulations are described in Table 2.
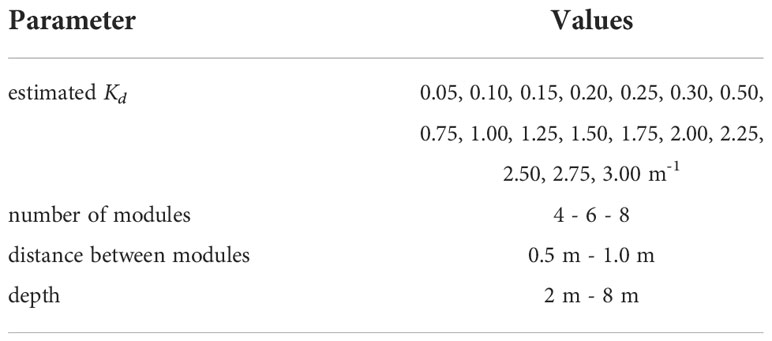
Table 2 Parameters evaluated during the sensitivity analysis.
The replicability analysis is performed in the following steps:
● Step 1: We compared the relationship between the concurrent light measures of different KduPRO modules obtained at the same depth (see Figure 3). The comparison was implemented with a scatter analysis. Thus, for every pair of sensors x and y, we obtained: the linear regression coefficient (ax, y) and intercept (bx, y) representing the relationship between sensors x and y; the deviation of the actual values provided by sensors x and y to the corresponding linear regression (errx, y); and the correlation coefficient which represents the degree of consistency between both sets of measurements.
● Step 2: We generated a set of simulated measurements by considering one of the sensors as reference (for example sensor x, sx) and simulating the expected measurements of sensor y () accordingly with the scatter analysis, i. e.:
with ϵ a Gaussian random value with zero mean and sigma equal to errx, y.
● Step 3: We defined different scenarios by fixing the number of modules at each depth and the depths (see Table 3)
● Step 4: For each scenario we simulated the irradiance values for each module of KduPRO and each depth with the following formula:
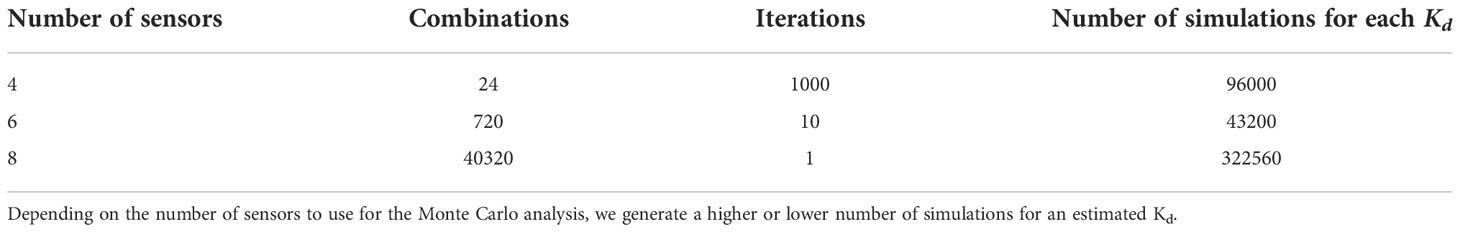
Table 3 Number of Monte Carlo simulations for different number of sensors.
substituting the Ed(0) (irradiance value at depth 0 whether from in situ measurement or from numerical simulation), the Kd and the z depth (see in Table 2 the values considered in this study) to obtain the reference value of Ed(z) (irradiance value at depth z).
● Step 5: We computed Kd by applying the neperian logarithm of the irradiances. We estimated Kd as the negative of the slope of the linear regression of the logarithm irradiances at the different depths following the Beer-Lambert law (Bardaji et al., 2016). Furthermore, we used the coefficient of determination (the squared of the correlation coefficient, ρ) associated to the linear regression as a quality control parameter.
● Step 6: The estimate of the Kd uncertainty is computed as the standard deviation of the difference between the Kd computed from the simulated sensors and the actual Kd values. We also provided the average of the estimated Kd within a confident interval of 90%.
2.3. Performance assessment with respect to other instrument measurements
We compared the performance of the KduPRO with the one of the LI-COR LI-192 SA underwater quantum sensor (LI-COR, 2022), measuring a vertical profile of the downwelling PAR at three different depths (20 cm, 35 cm and 50 cm) for one hour at noon. This study aimed to compare the measurements in the PAR spectrum region of both instruments, without estimating Kd, and to analyse them in a scatter analysis. This experiment was carried out on the Stirling’s University campus, at the Airthrey Loch, in August of 2018.
The LI-COR LI-192 measures PAR in the form of photosynthetic photon flux density (PPFD), with an uncertainty of ± 5%. The units of this measure are defined as photon flux in units of micromoles per square meter per second (μmol m-2 s-1). This sensor receives the radiation in an acrylic disc (diffuser), and their design allows the proper cosine response (follows Lambert’s cosine law) at angles of incidence up to 82°.
To compare both instruments, we used the 2009S Lowering Frame providing the placement of the LI-COR LI-192 and two modules of the KduPRO, measuring both the downwelling PAR at different depths (see Figure 4). The frequency of these measurements are configured up to 60 Hz in the case of the KduPRO and 250 Hz in the case of the LI-COR, using the LI-1500 light sensor logger. A small weight was attached to the weight ring of the Lowering Frame to avoid tilt movements. The whole LI-COR system used during this experiment (sensor, wire and datalogger) cost around 4,000 €. In addition, we connected to this structure a pressure sensor, the HOBO U20-001-01, to measure the depth changes of the measurements precisely.
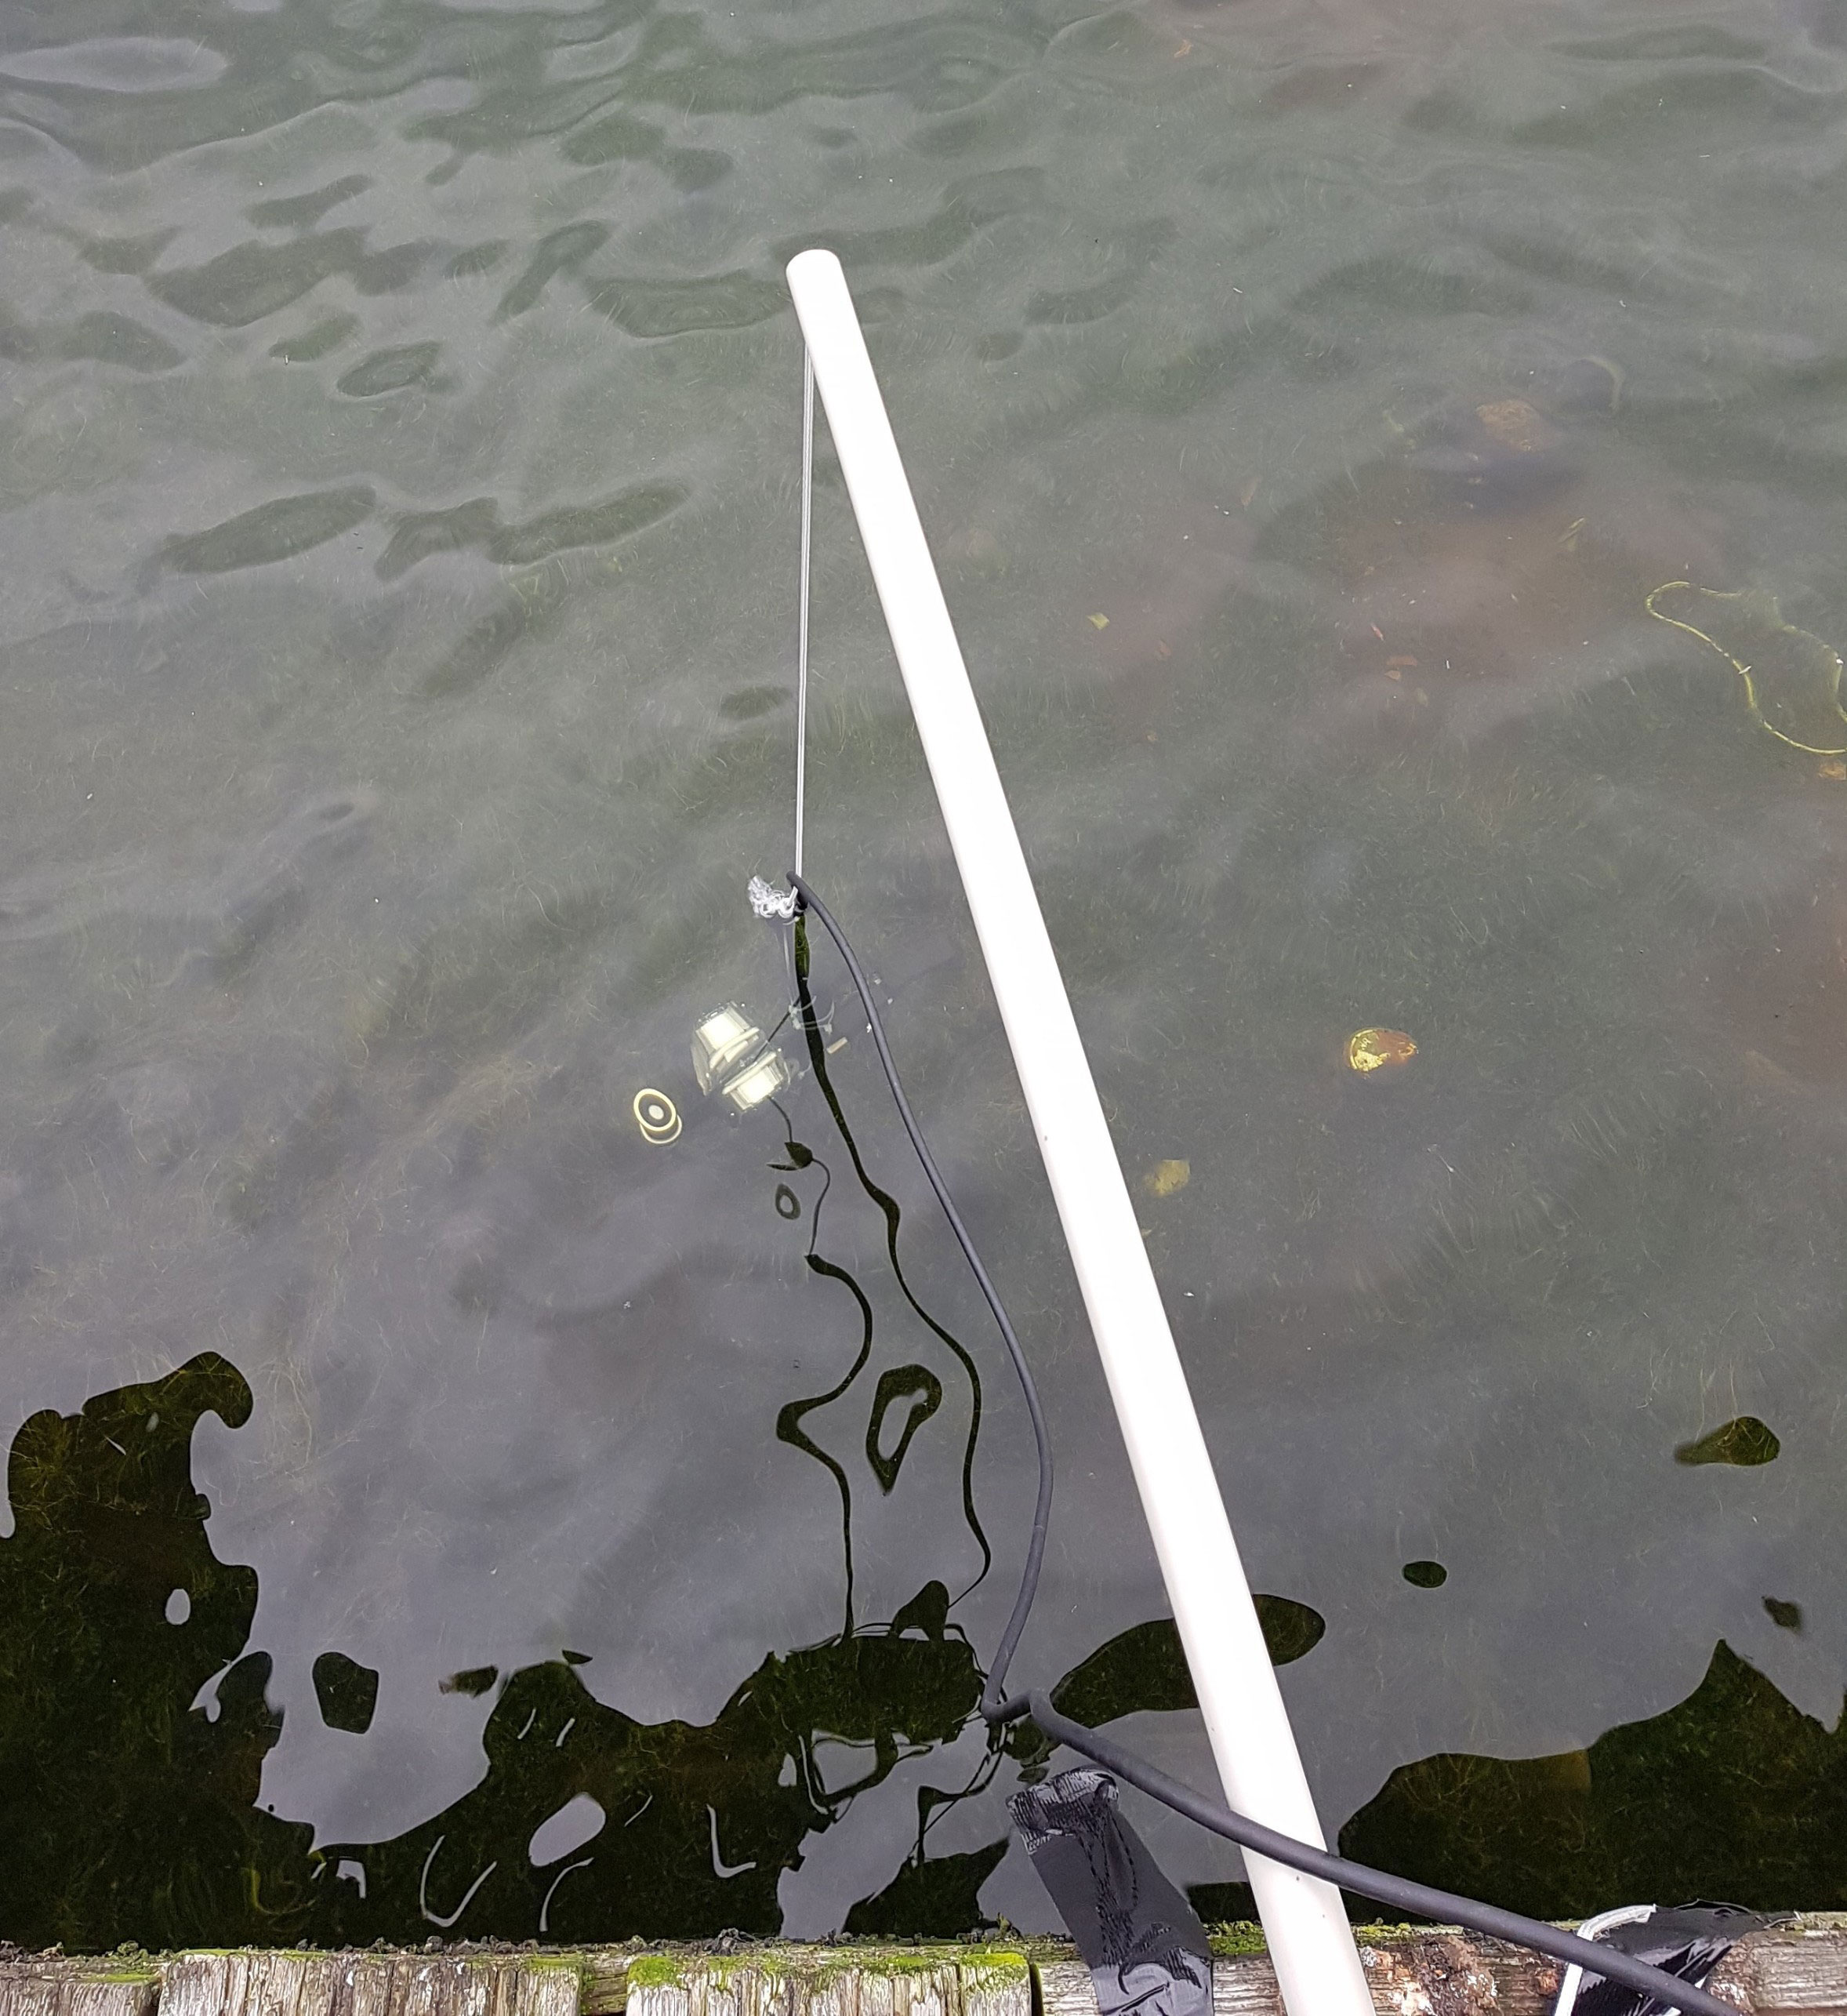
Figure 4 Measurements of the downwelling PAR at different depths, using two modules of the KduPRO and the LI-COR 192 as a reference sensor. In this experiment, we use the Lowering Frame to offer stability for proper orientation of sensors.
2.4. Estimations of Kd and quality control
The downwelling diffuse attenuation coefficient Kd in the PAR spectral range was measured by the KduPRO at the Loch Leven in August of 2018. Two experiments were carried out to retrieve this parameter: first, with a unique module of KduPRO doing a vertical profile within the water column; second, as a moored buoy with an array of KduPRO modules at different depths doing the downwelling PAR measurements.
In the first case, to characterize the attenuation of light within the water column, we measured the downwelling PAR at different depths beneath the water surface. We used the 2009S Lowering Frame to provide the placement of the module of the KduPRO (configured up to 60 Hz); also, we attached the LI-COR LI-192 (configured up to 250 Hz) to compare it with the KduPRO measurements, and the pressure sensor HOBO U20-001-01 to measure the depth changes. We obtained measurements of downwelling PAR at 1 m, 2 m, 3 m and 4 m depth for 10 minutes at noon. The measurements were collected at the location defined by longitude 56°11’58.1”N and latitude 3°24’29.1”W and were conducted on 22 August 2018. The Kd estimation was computed as described in step 5 of section 2.2.
In the second case, we estimated Kd using the KduPRO as a modular moored instrument. Each module of KduPRO is placed at a known depth and measured the downwelling PAR by its sensor independently from each other. In this experiment, the moored instrument consists of twelve modules of KduPRO separated by 0.5 m each one. It collected measurements from 11:24 to 15:00 on 22 August 2018 and was located at the longitude 56°11’19.4”N and latitude 3°22’27.6”W. The Kd estimations followed an automatic quality control (ρ), providing information to know if it was a valid estimation or not. In parallel with this last experiment, we used the Secchi disk to obtain a measure of Secchi disk depth. Following the new theory of Lee (Lee et al., 2015), the detection of a Secchi disk in water by a human eye depends on the contrast of brightness in the spectral window of the perceived water color. For this reason, ZSD is determined by the diffuse attenuation coefficient of water’s transparent window (i.e. at a wavelength corresponding to the maximum transparency), and not the diffuse attenuation coefficient of PAR. However, there are several studies that evaluated the relationship between ZSD and Kd in the PAR band (Lee et al., 2018), and show that both ZSD and Kd values can be related with the following equation:
3. Results
3.1. Uncertainty in Kd estimation
First, the underwater downwelling PAR measurements from the six different KduPRO modules are compared by means of a scatter analysis (see Figure 5). These measurements were concurrently taken at the same water column and in the same depth, as explained in the step 1 of section 2.2. The correlation coefficient among the measurements from the different KduPRO modules are larger than 0.9 in all the cases, showing consistency and robustness among them.
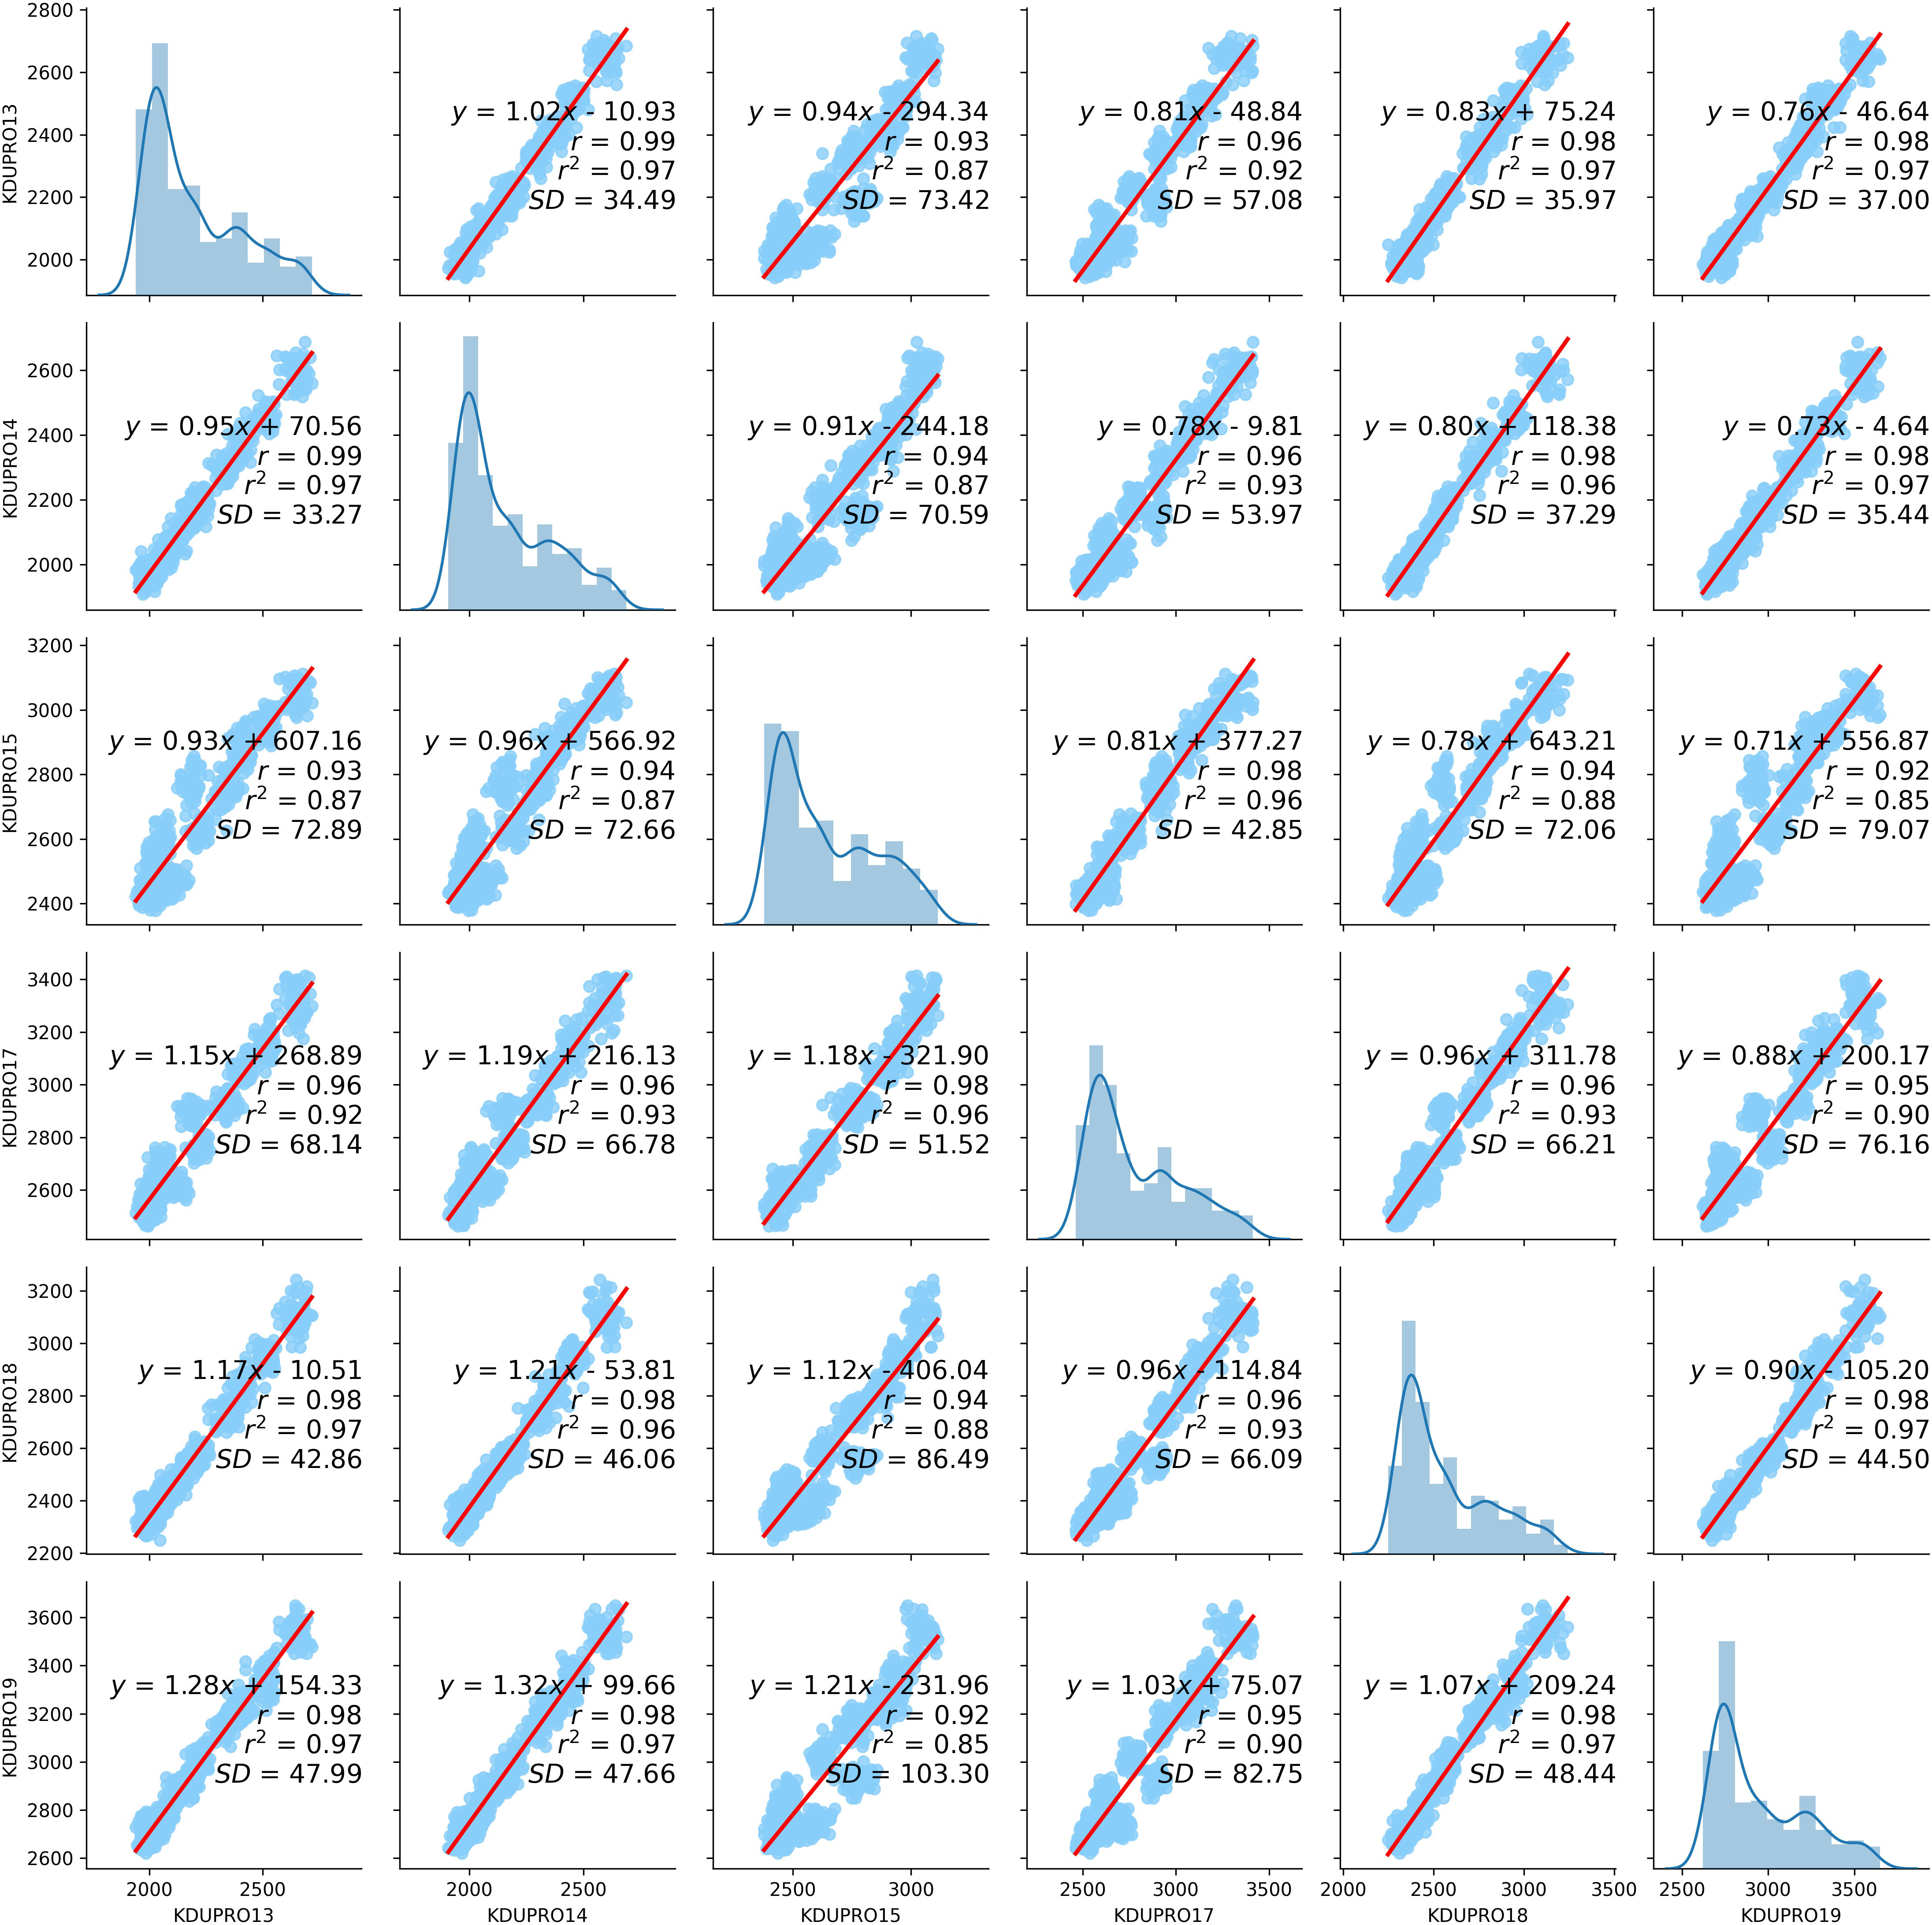
Figure 5 Scatter matrix about the relation of the underwater downwelling PAR measurements between all the different modules of the KduPRO, showing the regression line, the correlation coefficient, the coefficient of determination and the standard deviation from each pair of modules. The data points in the diagonal of the scatter matrix represents a histogram from the time series of the underwater downwelling PAR measurements obtained by each sensor.
Following this scatter analysis, we applied the Monte Carlo simulation methodology, analysing the contribution of replicability to uncertainty in Kd estimation, explained in section 2.2. Figure 6 compares the average of the estimated Kd values from the Monte Carlo simulation (y-axis) with the expected Kd values (x-axis) in different configurations: with 4, 6 or 8 modules separated by 0.5 m or 1 m distance. Besides, the same figure shows the standard deviation of the difference between simulated and expected Kd and the 90% confidence interval of averaged Kd values. The results show that the average of the estimated Kd values in all the scenarios fits well with the expected Kd values. The standard deviation and the 90% confidence interval differ depending on the number of sensors or the distance between them used in the simulation. The largest the number and the distance between sensors, the lowest the standard deviation. For fixed conditions on the number and distance between sensors, the standard deviation and the 90% confidence interval remain constant. We obtain a standard deviation of 0.11 in the case of having 4 sensors separated at 0.5 m (the worst case) and a standard deviation of 0.02 in the case of 8 sensors separated 1 m (the best case).
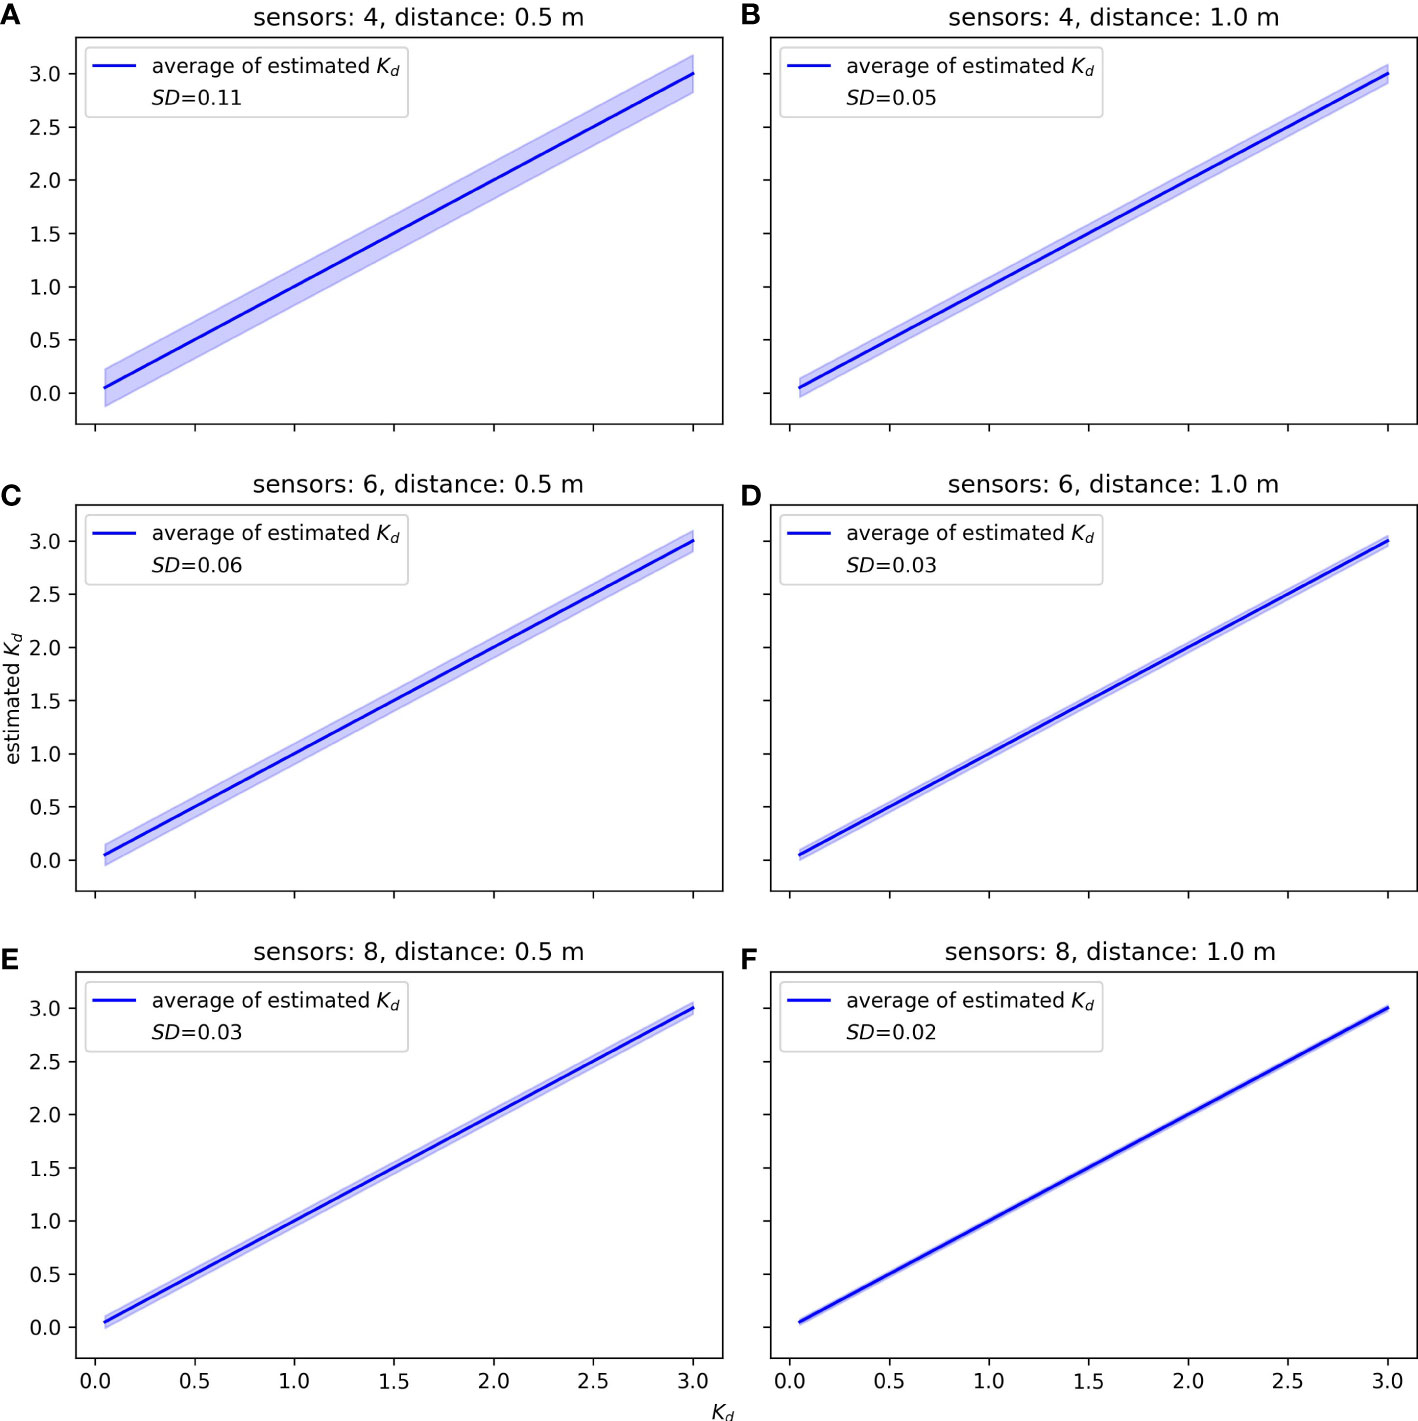
Figure 6 (A) Estimation of the error of the Kd measured with 4 modules of the KduPRO separated by 0.5 m of distance. (B) Estimation of the error of the Kd measured with 4 modules of the KduPRO separated by 1.0 m of distance. (C) Estimation of the error of the Kd measured with 6 modules of the KduPRO separated by 0.5 m of distance. (D) Estimation of the error of the Kd measured with 6 modules of the KduPRO separated by 1.0 m of distance. (E) Estimation of the error of the Kd measured with 8 modules of the KduPRO separated by 0.5 m of distance. (F) Estimation of the error of the Kd measured with 8 modules of the KduPRO separated by 1.0 m of distance. All the plots shows the average of the estimated Kd (solid blue line) and the 90% confidence interval (the shadowed sky blue region).
3.2. Comparative performance of PAR measurements between LI-COR and KduPRO
The performance of the KduPRO is analyzed by comparing the underwater downwelling PAR measurements obtained using two modules of the KduPRO and the reference sensor LI-COR LI-192 at different depths. The top plot of Figure 7 shows the time series measurements from both instruments (turquoise line for LI-COR and black dashed and continued lines for the twoKduPRO modules). Both time series are pretty consistent and present minor differences among them. At the third depth, we can see noise leading to bad handling the Lowering Frame and how LI-COR LI-192 and KduPRO modules measured it consistently.
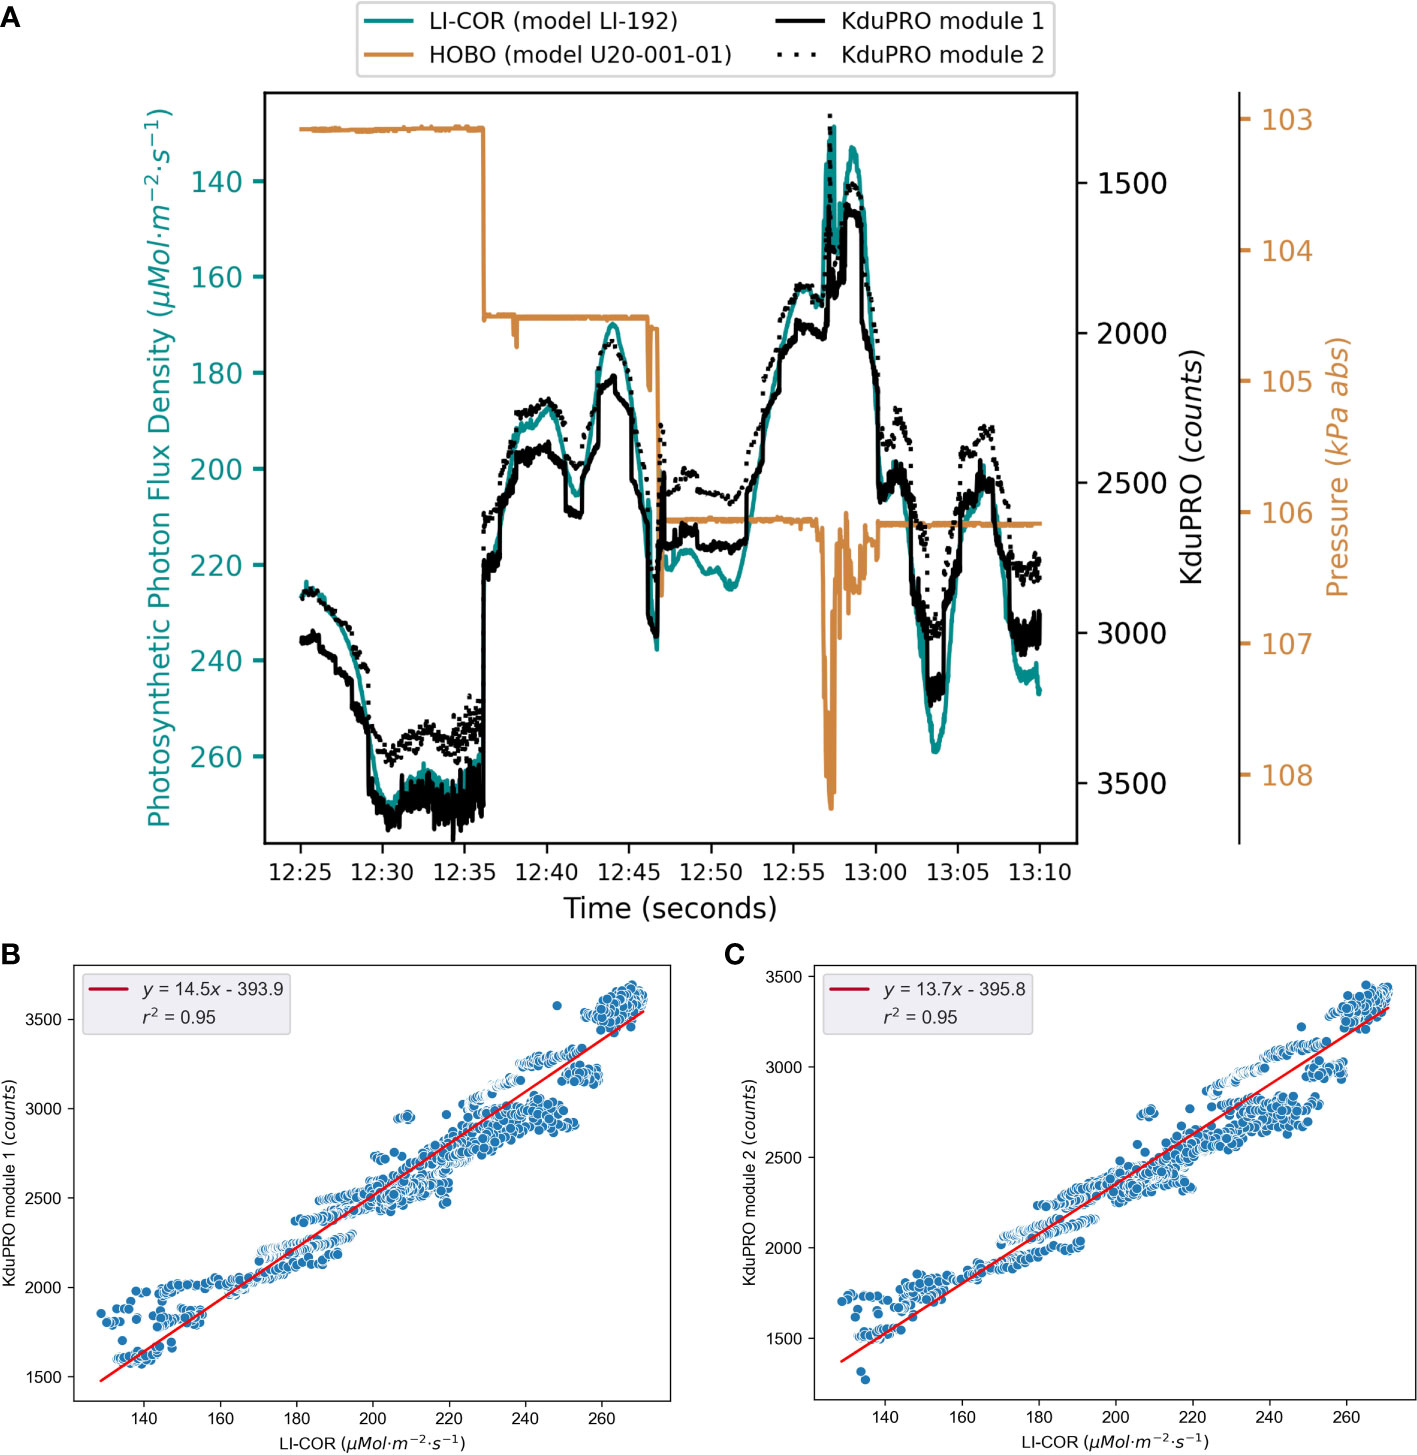
Figure 7 (A) Time series from two modules of KduPRO, LI-COR and pressure sensor HOBO. (B, C) Scatter plot between a different module of the KduPRO and the LI-COR reference sensor.
The bottom plots of Figure 7 show the linear regression of those measurements. In both analysis appear a strong linear relationship between the estimations of the modules of the KduPRO and the LI-COR LI-192 reference with a correlation coefficient of 0.95 in both cases.
3.3. Kd estimations from KduPRO
The KduPRO can provide estimations of Kd from two different ways of deployment: as an independent sensor doing a vertical profile and as a moored buoy with an array of modules. The acquisitions of the KduPRO deployed as a single sensor measuring in a vertical profile are compared with the acquisitions from LI-COR LI-192 sensor through the same profile (see Figure 8). With this measurements, Kd is estimated using the linear regression method (see section 2.2), obtaining differences of 0.1m-1 between the LI-COR LI-192 (Kd equal to 2.13m-1) and the KduPRO (Kd equal to 2.23m-1). Both Kd values have a good relationship, with a correlation coefficient very close to 1.
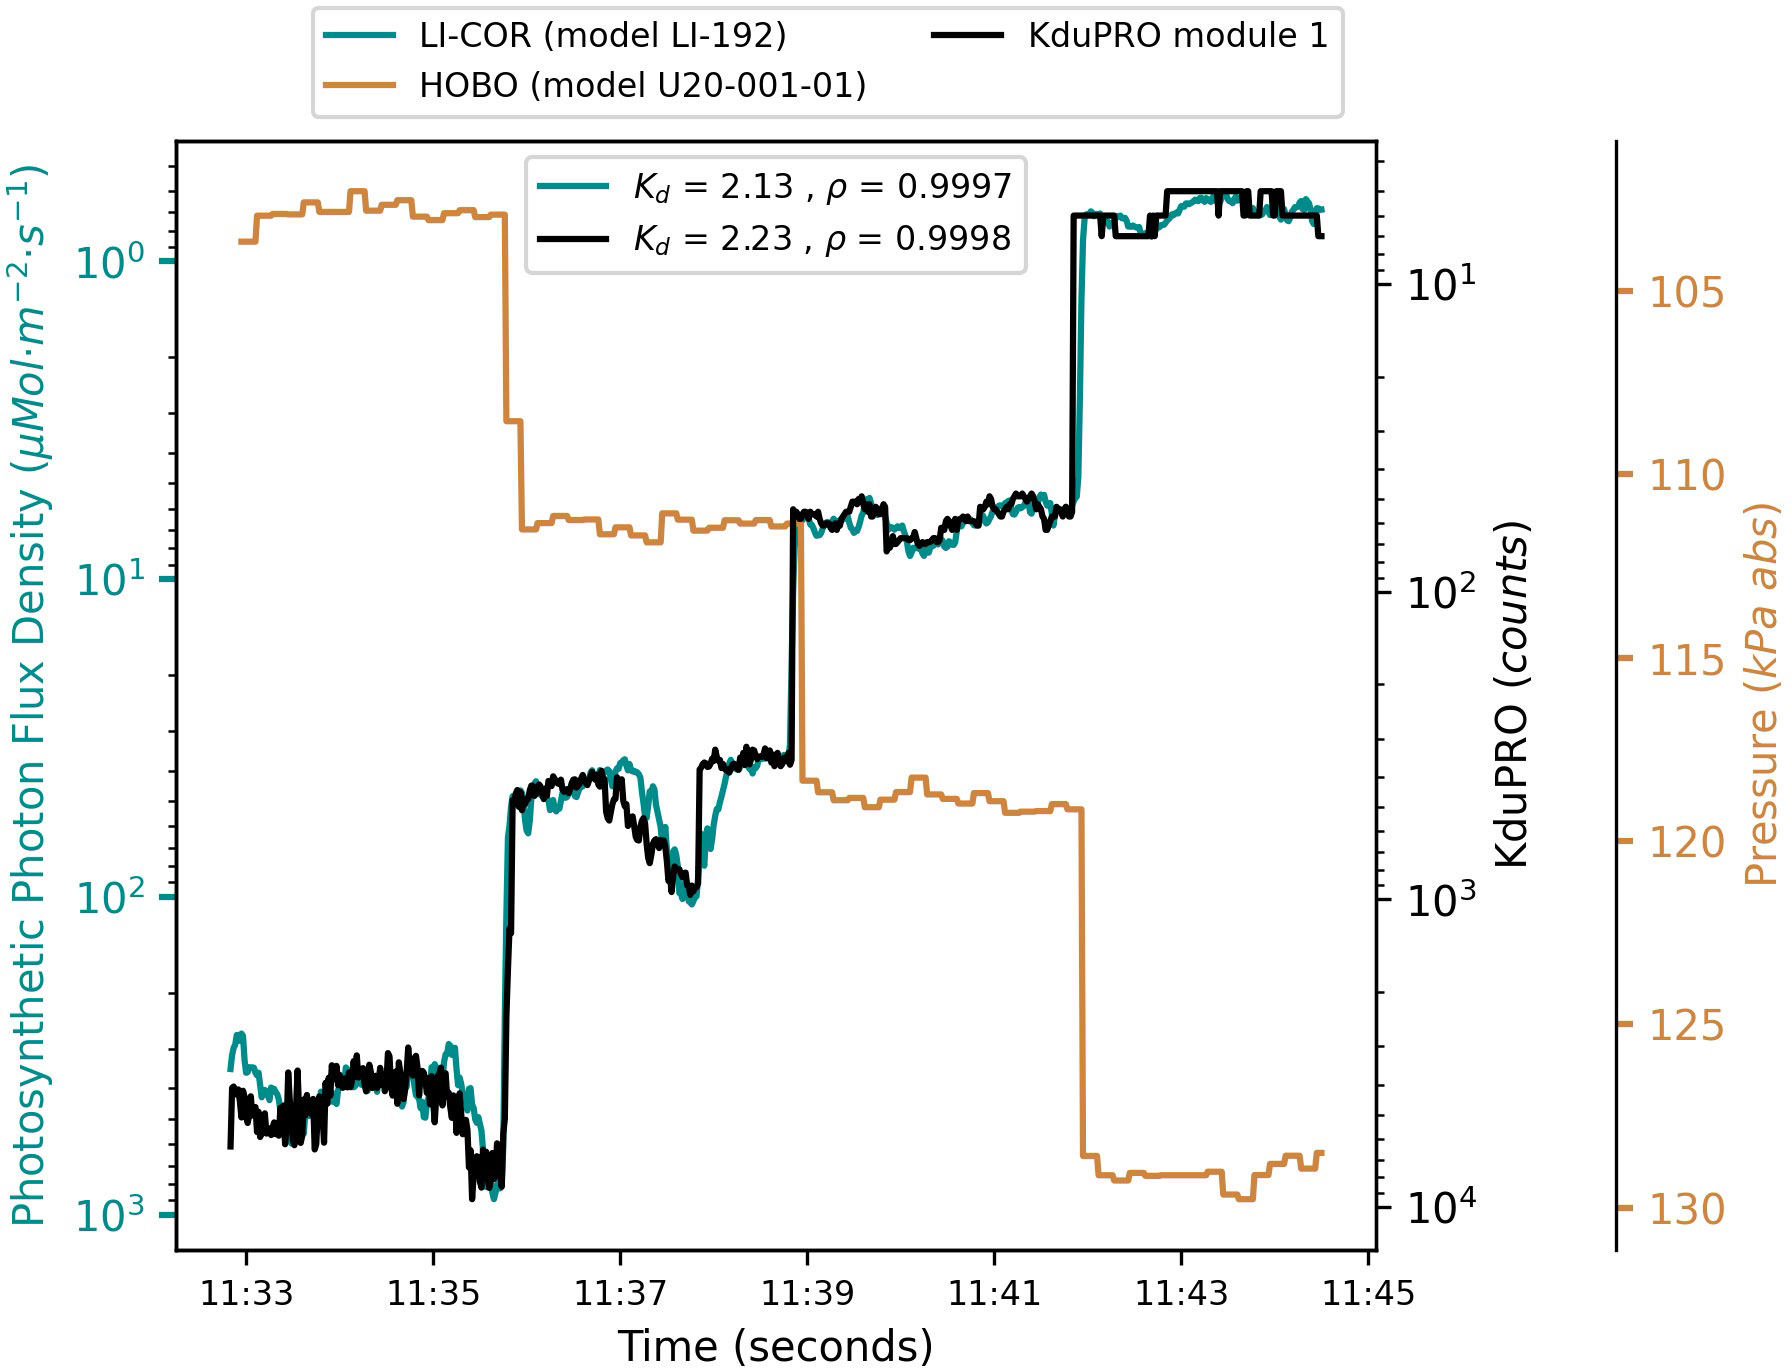
Figure 8 Vertical profile measuring the downwelling PAR with one sensor of KduPRO and the LI-COR LI-192 sensor, in logarithmic values. The pressure sensor HOBO U20-001-01 is used to measure the depths changes.
The second case used the KduPRO as a modular moored instrument, containing twelve modules separated 0.5 m between them. Figure 9 shows the time series of the Kd estimations, using all the modules up to 4.5 m depth; the reason was those modules placed deeper than 4.5 m did not measure light data in the PAR region due to the turbidity conditions of the water. During the measurement interval, Kd values mainly oscillate between 1.9 and 2.0m-1. The ρ parameter that we use as a quality indicator (see section 2.2), remains pretty constant during this time period (higher than 0.99). The top panel of Figure 9 shows the original records of Kd where some high frequency peaks appear. These peaks coincide with a drop in the ρ parameter. So, we use a threshold to filter all those measurements with ρ values lower than 0.995. In the bottom plot of Figure 9 we show the corresponding filtered Kd measurements.
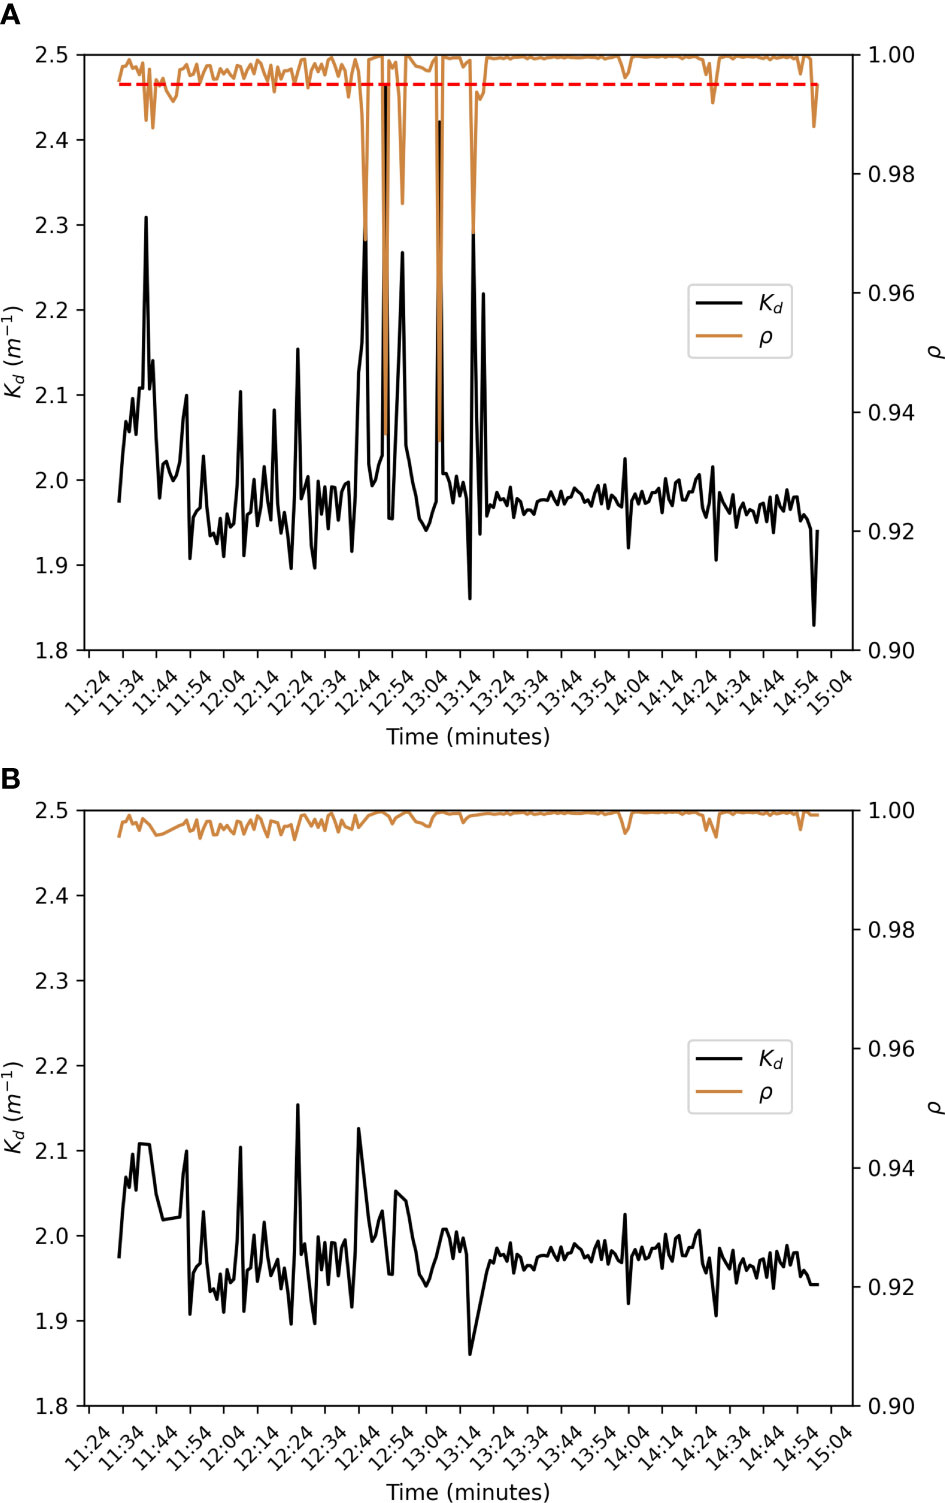
Figure 9 (A) Time series of Kd estimated from the KduPRO working as a moored array of sensors. The red dashed line indicates the threshold of ρ=0.995 used as a quality control of the measurements. (B) The time series of Kd estimated from the KduPRO, after applying the quality control and interpolating data.
There is a proper fit between the Kd value obtained in the vertical profile (Figure 8) and the Kd obtained in the time series (Figure 9), measured at the same time interval (i.e., from 11:35 to 11:45). During this time interval, and discarding Kd values with ρ lower than 0.99, there was an average of Kd value equal to 2.08m-1.
The theoretical value of the uncertainty resulting from the analysis performed in section 2.2 (by using 8 modules and 0.5 m distance between sensors) is about 0.034m-1. KduPRO provides a Kd value of 2.08, and the value provided by the LI-COR sensor is 2.13m-1. The difference between both measurements is consistent with the estimated uncertainty.
Furthermore, we measured the Secchi disk depth in the same place where we deployed the KduPRO moored instrument, at 11:00, obtaining 75 cm. From this value of ZSD, we can estimate a value of Kd in the PAR region using the equation 3, obtaining a Kd with an approximated value of 1.92m-1. As described in section 2.4 there is a large uncertainty associated with the estimation of the Kd in the PAR region from Secchi disk depth. Therefore, this measure cannot be taken as a reference for validating the KduPRo.
4. Discussion
This study presents the KduPRO as a cost-affordable and DIY modular instrument to estimate the downwelling diffuse attenuation coefficient Kd in the PAR region of coastal environment and continental waters. This instrument follows and evolves the original concept of the KdUINO buoy. The difference with the latter is that each module of the KduPRO consists of a light sensor that allows measuring in the spectral zone of PAR, red, green and blue and stores data independently. This redesign enables the encapsulation of all components inside a commercial underwater housing, including the battery. Also, it facilitates the KduPRO deployment, where each module has to be at a known depth, measuring the irradiance by itself. As we have seen in this study, the configuration of the KduPRO brings the possibility to calculate the Kd with one module doing a vertical profile (see Figure 8) or with an array of modules as a moored buoy (see Figure 9). In the second case, the module depth can be modified according to the project or the environment requirements, offering the user a custom array of sensors. However, the shading effect that the upper modules can offer concerning the lower ones must be considered, leaving a reasonable distance between the different modules. In our case, we set the study limit within a distance of 0.5 m, but it can be affected depending on the light conditions or the water column.
Compared with other reference sensors (the LI-COR LI-192 sensor, see Figure 4), we observe a good correlation between the KduPRO measurements and the reference sensor measurements (larger than 0.9, see Figure 7). Therefore, we can transform the KduPRO counts to a measure with the same physical meaning as the one provided by the reference sensor in units of μMm-2s-1 (see Figure 7). Furthermore, we study the consistency of the underwater downwelling PAR measurements between different modules of the KduPRO (see Figure 5). These results show a good reproducibility and concurrent validity of the measurements, with a coefficient of determination larger than 0.85.
These concurrent measurements allow us to perform a replicability analysis to estimate the uncertainty of the Kd estimation by using a Monte Carlo simulation. It is worth mentioning that the self-building process of the KduPRO, including the making of the cosine filter, can be a source generating errors between sensors. For this reason, this study simulates randomly different scenarios to evaluate the differences between the actual value of Kd and the simulated Kd, using the KduPRO as an array of sensors. We observe a dependency of the number of the sensors and/or the distance between them to estimate the Kd error (see Figure 6). On the one hand, when we reduce the number of sensors and the distance between them, the standard deviation and the 90% confidence interval increase, reaching values of 0.1 in the worst of the simulated cases. On the other hand, under the same configuration conditions (fixed number of sensors and distance between them), the estimated error remains pretty constant.
The Kd estimations provided by the KduPRO in the PAR spectral region at Loch Leven offer a good relationship compared with the LI-COR LI-192. As we can see in Figures 8, 9, the KduPRO estimates well the Kd doing measurements as a vertical profile or as a moored buoy. This last configuration offers an advantage over commercial sensors measuring the irradiance in the PAR spectral region (the AMOUR or PRR-800 from Biospherical Instruments Inc, the PAR sensor from Sea-Bird Scientific, the RAMSES-ACC-VIS from TriOS or the LI-COR LI-192 from LI-COR Biosciences): The low cost of KduPRO allows multiple modules to be deployed in the form of a single buoy measuring irradiance in the same water column. This feature is difficult to achieve through commercial instrumentation due to the high cost it would require (Moore et al., 2009). Additionally, observing the Figure 9, we can set a quality control for the Kd estimations provided by the KduPRO, discarding values of Kd when it matches with lower values of the coefficient of determination at the same time. The differences between the Kd estimated by KduPRO and the one estimated by LI-COR LI-192 are consistent with the theoretical Kd error estimate in section 3.1. Although the number of Kd estimations during the campaign was limited, the results are robust and encourage for using KduPRO in future campaigns.
However, KduPRO is a system with limitations when we estimate Kd. In other types of water (e.g. very transparent water), the system may reach its capacity to estimate the diffuse attenuation coefficient (the resolution of the sensor itself does not detect the differences between the most superficial and deepest layers, or there is an attenuation of the PAR region with depth). In that case, the system is prepared to detect these limits thanks to the quality control system proposed in this study. In the measurements of Loch Leven, we have not reached the system’s limit due to the quality control values obtained in the estimation of Kd PAR. Even so, we believe that it would be convenient in future studies to be able to analyze the instrument in different types of water and verify in which values the KduPRO cannot correctly estimate Kd PAR (such as, for example, in very transparent waters where the Kd values should be lower than 0.1m-1).
Further improvements are foreseen in the KduPRO design. At this moment, the KduPRO save data and metadata internally on a micro SD card and needs to be downloaded and analyzed by the user on a computer. The design of the KduPRO uses a microcontroller that can use a WIFI connection, bringing the possibility to develop a mobile application to configure and download the data from the KduPRO remotely. Another point to consider is the process of charging batteries; with the actual design, it needs to be manual. It can be a source of bad deployments because all the components of the KduPRO fit right into the underwater housing. We plan to enhance the module of KduPRO by incorporating the possibility of charging batteries inductively. A potential limitation of this instrument is the shading effect between different modules when KduPRO is used as an array of modules. Finally, we plan to analyse in future campaigns the sensors’ performance underwater because it can be affected by the stratification of the temperature of the column water, and also the use of new concepts of low-cost sensors that are specially designed for monitoring stratified waters (Rodero et al., 2021b).
Finally, KduPRO is an instrument that has the potential capability to impact administrations’ policies on water quality. In Europe, the main European Environmental Directives aimed at restoring and protecting waters, the Water Framework Directive (WFD; 2000/60/EC) and the Marine Strategy Framework Directive (MSFD; 2000/60/EC), consider this indicator within the assessments of the Ecological and Environmental Status of waters, respectively (Centre, J. R., for Environment, I and Sustainability, 2006; Piha and Zampoukas, 2011) tepdoi/10.2788/60512. Precisely and regarding the WFD, which assesses the water quality of continental and coastal waters, water transparency is a supporting physico-chemical quality element. Regarding the MSFD, which assesses the water quality of marine waters, it is a key parameter for the indicators physical, hydrological and chemical conditions (1.6.3) and water transparency related to increase in suspended algae (5.2.2) of the placed Descriptors 1(Biological Diversity) and 5(Eutrophication), respectively.
The affordable cost, ease of use, and measurement repeatability make the KduPRO a potentially valuable tool for anyone interested in monitoring water quality, including fisheries, diving clubs, citizen volunteer groups, schools, water administrations, and research groups. This new instrument's capability to continuously monitor the Kd estimations and their automatic quality control, makes KduPRO suitable for being used in low-cost oceanographic operational systems and inland and coastal water quality governmental monitoring programs.
Data availability statement
The datasets generated for this study can be found in the following repositories: Data from KdUINO - Loch Leven, https://doi.org/10.5281/zenodo.3757669, accessed on 24 July 2022. The code to generate, process and plot the datasets, https://git.csic.es/kduino/kdupro-data-analysis/-/releases/v1.0.0, accessed on 23 July 2022.
Author contributions
CR: writing manuscript. RB: hardware design. EO: mathematical methodology verification. CR and RB: software programming. CR and JP: graphical representations. EO and JP: supervision. CR, RB and EO: data analysis. CR, EO and JP: writing original draft. CR, RB and JP: field work. CR, EO, RB and JP: methodology, editing and reviewing the draft. JP: conceptualization, project administration, and funding acquisition. All authors contributed to the article and approved the submitted version.
Funding
This research was funded by Horizon 2020 Framework Programme (776480, MONOCLE and 101008724, MINKE). We also received funding from the Spanish government through the “Severo Ochoa Centre of Excellence” accreditation (CEX2019-000928-S). This work is a contribution to the CSIC Thematic Interdisciplinary Platform Teledetect.
Acknowledgments
We would like to thank the reviewers for taking the necessary time and effort to review the manuscript. We sincerely appreciate all your valuable comments and suggestions, which helped us in improving the quality of the manuscript. We thank Dra. Eva Flo and Dr. Marco Talone for their comments that greatly improve the quality of this paper.
Conflict of interest
The authors declare that the research was conducted in the absence of any commercial or financial relationships that could be construed as a potential conflict of interest.
Publisher’s note
All claims expressed in this article are solely those of the authors and do not necessarily represent those of their affiliated organizations, or those of the publisher, the editors and the reviewers. Any product that may be evaluated in this article, or claim that may be made by its manufacturer, is not guaranteed or endorsed by the publisher.
Supplementary material
The Supplementary Material for this article can be found online at: https://www.frontiersin.org/articles/10.3389/fmars.2022.1004159/full#supplementary-material
References
Adi N. S. (2015)Characterisation of the light environment and biophysical parameters of seagrass using remote sensing.
Ams-OSRAM A. G. (2022). TCS34727 color sensor – color light-to-digital converter. https://ams.com/tcs34727. Accessed November 21, 2022
Bai S., Gao J., Sun D., Tian M. (2020). Monitoring water transparency in shallow and eutrophic lake waters based on goci observations. Remote Sens. 12, 163. doi: 10.3390/rs12010163
Bardaji R., Sánchez A.-M., Simon C., Wernand M. R., Piera J. (2016). Estimating the underwater diffuse attenuation coefficient with a low-cost instrument: The kduino diy buoy. Sensors 16, 373. doi: 10.3390/s16030373
Bishop I. J., Warner S., van Noordwijk T. C., Nyoni F. C., Loiselle S. (2020). Citizen science monitoring for sustainable development goal indicator 6.3. 2 in england and zambia. Sustainability 12, 10271. doi: 10.3390/su122410271
Brewin R. J., Brewin T. G., Phillips J., Rose S., Abdulaziz A., Wimmer W., et al. (2019). A printable device for measuring clarity and colour in lake and nearshore waters. Sensors 19, 936. doi: 10.3390/s19040936
Buchaca T., Sabas I., Osorio V., Pou-Rovira Q., Miró A., Puig M., et al. (2019). Changes in lakes after the reduction of fish densities. Life+ limnopirineus : Conservation of aquatic habitats and species in high mountains of the pyrenees. Technical report Carrillo E., Ninot J., Buchaca T., Ventura M.. La Seu d’Urgell, EC, 29–40. http://www.lifelimnopirineus.eu/sites/default/files/monografia_tecnica-en-pag.pdf
Darecki M., Weeks A., Sagan S., Kowalczuk P., Kaczmarek S. (2003). Optical characteristics of two contrasting case 2 waters and their influence on remote sensing algorithms. Cont. Shelf Res. 23, 237–250. doi: 10.1016/S0278-4343(02)00222-4
Einsporn M. H., Wiedling J., Schöttner S. (2013). Recent impulses to marine science and engineering – from coast to deep sea: multiscale approaches to marine sciences. In: Proceedings of the YOUMARES 4 conference, Oldenburg. Available at: https://www.youmares.org/past-conferences/youmares-4/.
Fraisl D., Campbell J., See L., Wehn U., Wardlaw J., Gold M., et al. (2020). Mapping citizen science contributions to the un sustainable development goals. Sustain. Sci. 15, 1735–1751. doi: 10.1007/s11625-020-00833-7
George G., Menon N. N., Abdulaziz A., Brewin R. J., Pranav P., Gopalakrishnan A., et al. (2021). Citizen scientists contribute to real-time monitoring of lake water quality using 3d printed mini secchi disks. Front. Water 3. doi: 10.3389/frwa.2021.662142
Gordon H. R. (1989). Can the lambert-beer law be applied to the diffuse attenuation coefficient of ocean water? Limnol. Oceanogr. 34, 1389–1409. doi: 10.4319/lo.1989.34.8.1389
Joint Research Centre, Institute for Environment and Sustainability (2006). Indicators and methods for the ecological status assessment under the Water Framework Directive : linkages between chemical and biological quality of surface waters Cardoso A., Solimini A., Heiskanen A. (Publications Office).
Kirk J. T. O. (2011). Light and photosynthesis in aquatic ecosystems (Cambridge, England: Cambridge university press), 649.
Lee Z., Shang S., Du K., Wei J. (2018). Resolving the long-standing puzzles about the observed secchi depth relationships. Limnol. Oceanogr. 63, 2321–2336. doi: 10.1002/lno.10940
Lee Z., Shang S., Hu C., Du K., Weidemann A., Hou W., et al. (2015). Secchi disk depth: A new theory and mechanistic model for underwater visibility. Remote Sens. Environ. 169, 139–149. doi: 10.1016/j.rse.2015.08.002
Mobley C. D. (1994). Light and water: radiative transfer in natural waters (Cambridge, MA, USA: Academic Press).
Molnar P., Droujko J., Floriancic M. (2021). “A low-cost turbidity sensor for deployment in rivers,” in EGU General Assembly Conference Abstracts. (EGU General Assembly) EGU21–13337. doi: 10.5194/egusphere-egu21-13337
Moore C., Barnard A., Fietzek P., Lewis M. R., Sosik H. M., White S., et al. (2009). Optical tools for ocean monitoring and research. Ocean Sci. 5, 661–684. doi: 10.5194/os-5-661-2009
Parkinson S., Woods S. M., Sprinks J., Ceccaroni L. (2022). A practical approach to assessing the impact of citizen science towards the sustainable development goals. Sustainability 14, 4676. doi: 10.3390/su14084676
Piha H., Zampoukas N. (2011). Review of methodological standards related to the marine strategy framework directive criteria on good environmental status (Luxembourg: Publications Office of the European Union). doi: 10.2788/60512
Pitarch J. (2020). A review of secchi’s contribution to marine optics and the foundation of secchi disk science. Oceanography 33, 26–37. doi: 10.5670/oceanog.2020.301
Preisendorfer R. W. (1986). Secchi disk science: Visual optics of natural waters 1. Limnol. oceanogr. 31, 909–926. doi: 10.4319/lo.1986.31.5.0909
Rodero C., Bardaji R., Piera J. (2021a). Kdupro. user’s guide and technicaldocumentation. doi: 10.5281/zenodo.5721155
Rodero C., Olmedo E., Bardaji R., Piera J. (2021b). New radiometric approaches to compute underwater irradiances: Potential applications for high-resolution and citizen science-based water quality monitoring programs. Sensors 21, 5537. doi: 10.3390/s21165537
Salvador X., Sánchez L., Domingo O., Comaposada A., Soacha K., Piera J. (2021). Guia participativa Marina del barcelonès (Barcelona, Spain: Marcombo). doi: 10.5281/zenodo.5711223
Schaeffer B. A., Schaeffer K. G., Keith D., Lunetta R. S., Conmy R., Gould R. W. (2013). Barriers to adopting satellite remote sensing for water quality management. Int. J. Remote Sens. 34, 7534–7544. doi: 10.1080/01431161.2013.823524
Schima R., Krüger S., Bumberger J., Paschen M., Dietrich P., Goblirsch T. (2019). Mobile monitoring–open-source based optical sensor system for service-oriented turbidity and dissolved organic matter monitoring. Front. Earth Sci. 7, 184. doi: 10.3389/feart.2019.00184
Secchi P. A. (1864). Relazione delle esperienze fatte a bordo della pontificia pirocorvetta imacolata concezione per determinare la trasparenza del mare. Il Nuovo Cimento 20, 205–238. doi: 10.1007/BF02726911
Soacha Godoy K. A., Piera J., Liñán S., Rodero García C., Salvador X., Bardají R., et al. (2022). The contribution of citizen science and participatory monitoring systems to ocean knowledge and conservation (España: Consejo Superior de Investigaciones Científicas (España). doi: 10.20350/digitalCSIC/14120
Sosik H. M. (2008). “Characterizing seawater constituents from optical properties,” in Real-time coastal observing systems for ecosystem dynamics and harmful algal blooms. Eds. Babin M., Roesler C. S., Cullen J. J. (Paris: UNESCO), 281–329. http://hdl.handle.net/11329/305
Teubner K., Teubner I., Pall K., Kabas W., Tolotti M., Ofenböck T., et al. (2020). New emphasis on water transparency as socio-ecological indicator for urban water: bridging ecosystem service supply and sustainable ecosystem health. Front. Environ. Sci. 162. doi: 10.3389/fenvs.2020.573724
UN (United Nations) General Assembly (2017). Resolution adopted by the General Assembly on 6 July 2017 - Work of the Statistical Commission pertaining to the 2030 Agenda for Sustainable Development. A/RES/71/313. Retrieved from https://documents-dds-ny.un.org/doc/UNDOC/GEN/N17/207/63/PDF/N1720763.pdf?OpenElement.
Wei J., Lee Z. (2013). Model of the attenuation coefficient of daily photosynthetically available radiation in the upper ocean. Methods Oceanogr. 8, 56–74. doi: 10.1016/j.mio.2013.12.001
Wernand M. R. (2010). On the history of the secchi disc. J. Eur. Optical Society-Rapid Publ. 5. doi: 10.2971/jeos.2010.10013s.
Woods S. M., Daskolia M., Joly A., Bonnet P., Soacha K., Liñan S., et al. (2022). How networks of citizen observatories can increase the quality and quantity of citizen-science-generated data used to monitor sdg indicators. Sustainability 14, 4078. doi: 10.3390/su14074078
Keywords: water quality, diffuse attenuation coefficient, do-it-yourself, low-cost operational oceanography, KduPRO, KdUINO, marine citizen science, coastal management
Citation: Rodero C, Bardaji R, Olmedo E and Piera J (2022) Operational monitoring of water quality with a Do-It-Yourself modular instrument. Front. Mar. Sci. 9:1004159. doi: 10.3389/fmars.2022.1004159
Received: 26 July 2022; Accepted: 14 November 2022;
Published: 16 December 2022.
Edited by:
Oliver Zielinski, University of Oldenburg, GermanyReviewed by:
Zhongping Lee, University of Massachusetts Boston, United StatesNoah Lottig, University of Wisconsin-Madison, United States
Copyright © 2022 Rodero, Bardaji, Olmedo and Piera. This is an open-access article distributed under the terms of the Creative Commons Attribution License (CC BY). The use, distribution or reproduction in other forums is permitted, provided the original author(s) and the copyright owner(s) are credited and that the original publication in this journal is cited, in accordance with accepted academic practice. No use, distribution or reproduction is permitted which does not comply with these terms.
*Correspondence: Carlos Rodero, cm9kZXJvQGljbS5jc2ljLmVz