
94% of researchers rate our articles as excellent or good
Learn more about the work of our research integrity team to safeguard the quality of each article we publish.
Find out more
ORIGINAL RESEARCH article
Front. Mar. Sci. , 07 September 2022
Sec. Ocean Observation
Volume 9 - 2022 | https://doi.org/10.3389/fmars.2022.1003568
This article is part of the Research Topic Optics and Machine Vision for Marine Observation View all 25 articles
 Yu Hwan Kim
 Kang Ryoung Park*
Marine scene segmentation is a core technology in marine biology and autonomous underwater vehicle research. However, it is challenging from the perspective of having a different environment from that of the conventional traffic segmentation on roads. There are two major challenges. The first is the difficulty of searching for objects under seawater caused by the relatively low-light environment. The second problem is segmenting marine animals with protective colors. To solve such challenges, in previous research, a method of simultaneously segmenting the foreground and the background was proposed based on a simple modification of the conventional model; however, it has limitations in improving the segmentation accuracy. Therefore, we propose a parallel semantic segmentation network to solve the above issues in which a model and a loss are employed to locate the foreground and the background separately. The training task to locate the foreground and the background is reinforced in the proposed method by adding an attention technique in a parallel model. Furthermore, the final segmentation is performed by aggregating two feature maps obtained by separately locating the foreground and the background.The test results using an open dataset for marine animal segmentation reveal that the proposed method achieves performance of 87%, 97.3%, 88%, 95.2%, and 0.029 in the mean intersection of the union, structure similarities, weighted F-measure, enhanced-alignment measure, and mean absolute error, respectively. These findings confirm that the proposed method has higher accuracy than the state-of-the-art methods. The proposed model and code are publicly available via Github1.
In studies on marine life using autonomous underwater vehicles, its accurate detection is essential (Xu et al., 2021; Kandimalla et al., 2022). However, detecting marine life has more challenging issues than detecting terrestrial animals caused by the difficultly in observing objects under sea because of lesser light underwater than that on land. Furthermore, many marine animals have protective colors (Ditria et al., 2020; Panaïotis et al., 2022). To solve these problems, previous studies have been actively conducted on convolutional neural network (CNN)-based object detection (Pedersen et al., 2019; Li et al., 2021; Berg et al., 2022; Chen et al., 2022). Object detection can be classified into two types: box-based and pixel-based object detection (where latter is semantic segmentation). Box-based detection is very efficient in detecting the position of a box containing an object. However, there is a limitation in that it cannot detect exact regions of the object. Pixel-based object detection, unlike box-based object detection, can detect exact regions of an object in pixel units. Therefore, this study focused on the semantic segmentation of marine animals.
Previous studies have concentrated on CNN model modifications for the same purpose (Islam et al., 2020; Li et al., 2021; Zhang et al., 2021; Chen et al., 2022). A representative CNN model modification is to apply an attention mechanism (Zhang et al., 2021; Chen et al., 2022).
For example, the WaterSNet (Chen et al., 2022) used an attention fusion block (AFB) module, which employs an attention mechanism. The AFB module is adopted to utilize global context information. In addition, the WaterSNet was designed to extract multiscale features using a receptive field block (RFB) module. Moreover, Koch et al. (2015) reduced the impact of water degradation diversity by basically designing a model with a Siamese structure (Koch et al., 2015) and simultaneously using a random style adaption (RSA) module. Finally, they improved the performance of marine animal segmentation by combining RSA, RFB, and AFB modules. Next, Li et al. (2021) designed the ECD-Net by combining various modules, similar to WaterSNet. Specifically, first, an interactive feature enhancement module (IFEM) was proposed to consider the relationships between the features in the encoder. Furthermore, cascade decoder modules (CDMs), which integrate the features of the cross-layer, were developed to improve the performance of marine animal segmentation (Li et al., 2021). Based on the above, the combination of various modules in the WaterSNet and the ECD-Net is effective in improving the model performance.
A dual pooling-aggregated attention network called the DPANet was proposed (Zhang et al., 2021). A residual network (ResNet) is used as the backbone of a DPANet model (He et al., 2016). The feature maps output by this backbone model are input into a pooling-aggregated position attention module (PPAM) as well as a pooling-aggregated channel attention module (PCAM). The outputs of these modules are finally combined for marine animal segmentation. The existing position attention modules (Huang et al., 2019; Fu et al., 2020) do not consider fine-grained contextual detail information. However, the PPAM overcomes this drawback and generates spatial attention maps more efficiently than the previous researches. The existing channel attention modules (Fu et al., 2020) have limitations in various feature representations because they do not focus on the fine-grained inter-channel relationship. However, the PCAM improves various feature representation functions using the interdependent relationships between the channel maps in a computationally friendly manner (Zhang et al., 2021). Another research proposed the SUIM-Net (Islam et al., 2020) and introduced two versions: SUIM-NetRSB and SUIM-NetVGG. First, the SUIM-NetRSB, in which a residual skip block (RSB) is added to the decoder, is the first model designed to utilize the benefits of skip connections (Ronneberger et al., 2015) and residual learning (He et al., 2016). Furthermore, this design is aimed at ensuring real-time processing while accomplishing good segmentation performance (Islam et al., 2020). In comparison, the SUIM-NetVGG model was designed only to improve the segmentation performance using the visual geometry group (VGG) (Simonyan and Zisserman, 2015). Finally, the SUIM-NetVGG model was chosen as the final proposed model in this study to focus more on the segmentation performance.
In addition, the effects of various image quality enhancement techniques for underwater change detection on the segmentation algorithm have been investigated previously (Radolko et al., 2016; Radolko et al., 2017). Although research on CNN-based segmentation has not been conducted, experiments related to various existing segmentation algorithms have been reported (KaewTraKulPong and Bowden, 2001; Zivkovic, 2004; Zivkovic and Heijden, 2006; Radolko and Gutzeit, 2015).
The above previous studies generally focused on improving marine segmentation performance using conventional models. Specifically, they improved the segmentation performance by extracting features of the foreground and the background simultaneously. However, this method has the disadvantage of not ensuring the segmentation performance according to the ratio of the background and the foreground. Considering this aspect, the parallel semantic segmentation network (PSS-Net) proposed in this study not only extracts the background and foreground features separately but also improves the segmentation performance for the background and the foreground by designing the corresponding loss functions. Furthermore, two segmentation maps are created during segmentation by dividing an image into the foreground and the background. The PSS-Net was designed to fuse two feature maps to obtain the final segmentation result. Section 2 describes the PSS-Net in detail. In this study, the MAS3K dataset (Li et al., 2021) is used for the experiments because the object segmentation problem is more challenging than with other datasets (SUIM (Islam et al., 2020) and underwater change detection (Radolko et al., 2016). Moreover, the object segmentation problem is more challenging with the MAS3K dataset because it has more diverse entities of marine animals. The contributions of this study are as follows:
-This study proposed the PSS-Net, which is expected to achieve high performance in detecting marine animals by separately learning their foreground and background regions.
-For the PSS-Net proposed in this study, two models are designed in parallel. Moreover, an attention mechanism and separate losses (object and background losses) are established between the two models to extract the features of the foreground and background regions more efficiently.
-The PSS-Net used feature fusion segmentation to fuse the foreground and background feature maps extracted from the two models to improve the segmentation accuracy. The proposed PSS-Net and algorithm are publicly available via Github1.
The remainder of this paper is organized as follows. Section 2 describes the proposed method, and Section 3 presents the experimental results. Section 4 discusses the results, and Section 5 draws the conclusions.
This section describes the PSS-Net proposed in this study, and its overall structure is shown in Figure 1.
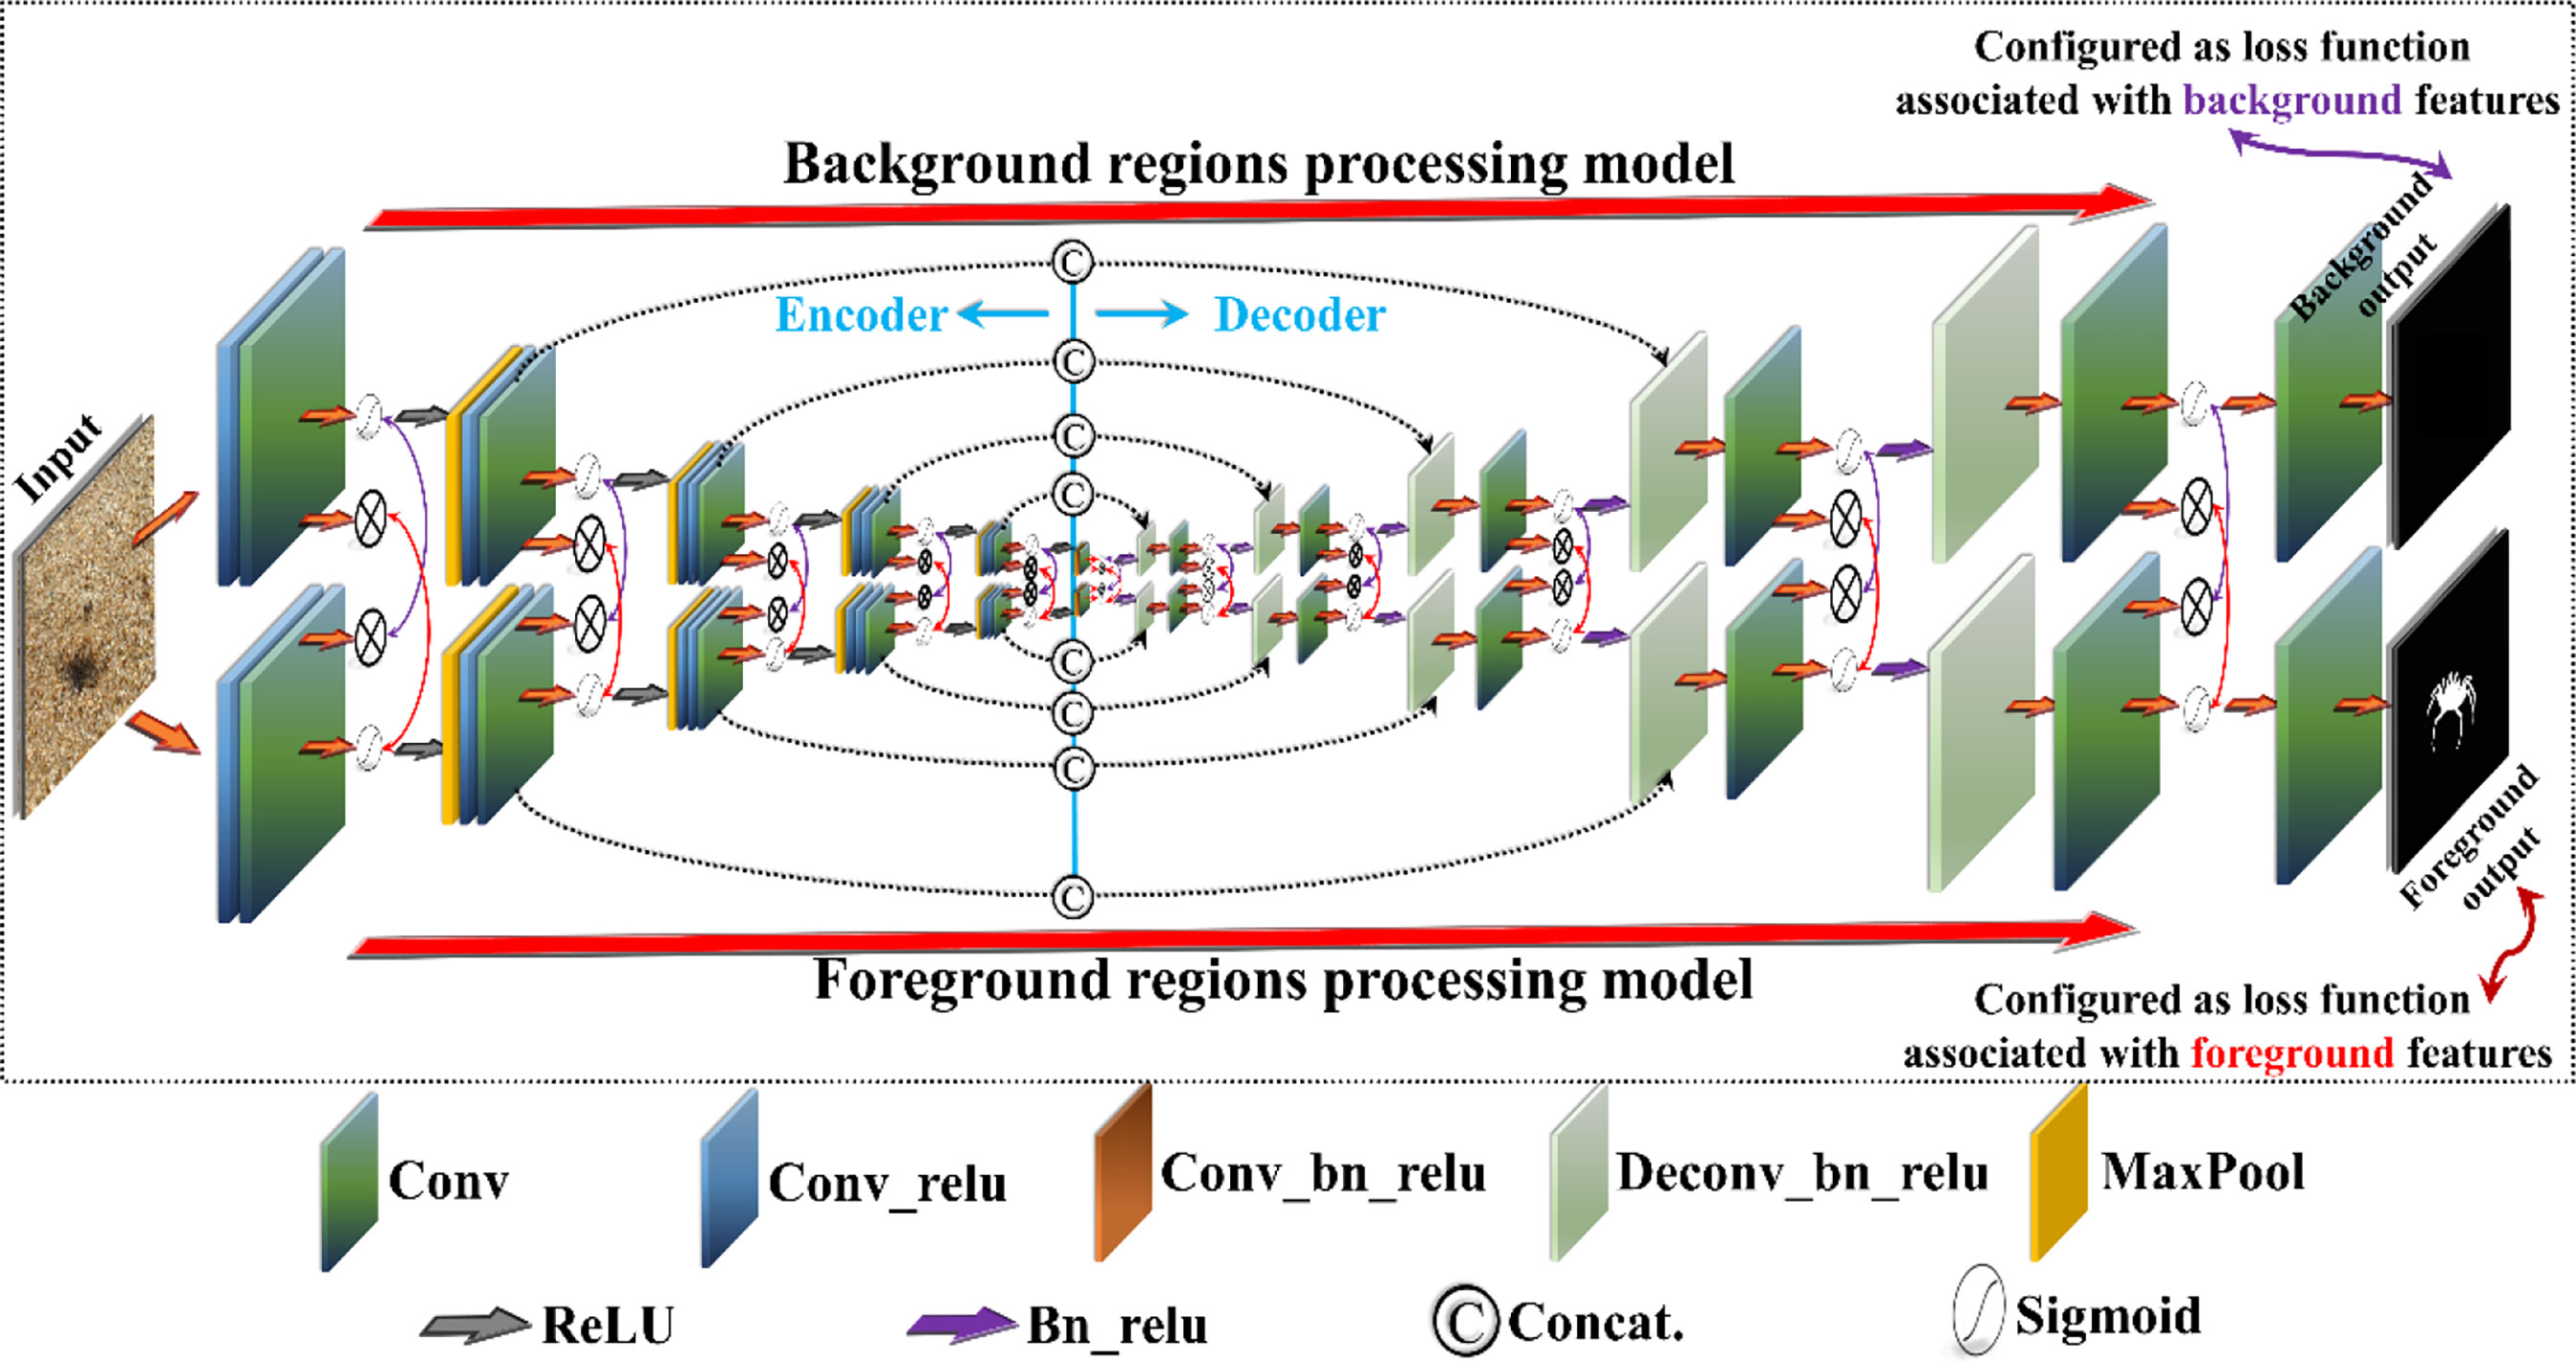
Figure 1 Structure of proposed PSS-Net.
As can be seen in Figure 1, the U-net (Ronneberger et al., 2015) is used as the backbone and VGG-16 (Simonyan and Zisserman, 2015) as the encoder of our proposed PSS-Net. The existing conventional models for semantic segmentation (Islam et al., 2020; Li et al., 2021; Zhang et al., 2021; Chen et al., 2022) train both the background and foreground from the feature map extracted from one model. However, the PSS-Net proposed in this study extracts the background and foreground feature maps from different models respectively, and trains the background and foreground based on them. Moreover, the layers between the models focus on the background and foreground components, helping to predict the final background and foreground regions.
Previously, a loss considering both the background and foreground segmentation was used. However, for the loss of the PSS-Net proposed in this study, background and foreground losses were designed to correspond to the structure of the model described in Section 2.1. This was because the class ratio of the foreground and the background is imbalanced, and overfitting may occur. Previously, the focal loss (Lin et al., 2017), as expressed in Equation (1), was used to solve this problem.
where M and N denote the height and width of the final feature map, respectively, and i and j denote the pixel coordinates, respectively. The pixel value of the feature map is expressed as y. Equation (1) is commonly derived from the final feature map extracted from one model. However, the focal loss in Equation (1) is primarily focused on solving the class imbalance problem, and it is ineffective in extracting the features of the object boundary region. Therefore, in this study, we designed a loss where the background and foreground training tasks can be performed independently of each other. First, the loss related to the foreground consists of a weighted binary cross entropy loss and a pixel perception loss (Pang et al., 2020). Equation (2) expresses the weighted binary cross entropy loss, and it was used because it was deemed effective in predicting the boundary features of object regions.
where gx,y and px,y denote the probability values that pass through the sigmoid function for the ground truth image and the predicted feature map, respectively. αi,j is calculated using the surrounding pixels (the pixel values for a specific region are used during the calculation). In addition, a weighted intersection of union (wIoU)-based pixel perception loss was used to predict object regions excluding boundaries, and it is expressed in Equation (3).
Equations (2) and (3) were used as the object (foreground) loss, as expressed in Equation (4).
The dice loss was used as the loss for the background regions, as expressed in Equation (5).
Based on Equation (5), the original dice loss only considers the case in which the ground truth label is 1 (the ground truth pixels for the object and background are 1 and 0, respectively). However, Equation (6), which is a modified version of Equation (5), was used in this study to consider the dice for the background (when the ground truth pixel is zero).
Equation (7) expresses the loss used in this study using Equations (4) and (6).
β is the ratio of the foreground and background components of an input image. It is calculated by accumulating the number of the foreground and background pixels of the input image separately and converting each accumulated number of pixels to a number less than 1 using the softmax function. We refer to the method used in a previous study (Kim and Park, 2022) for this calculation. However, in some cases, the input image may have no background or foreground component. Therefore, in this study, the loss was finally designed as expressed in Equation (8), to account for these cases.
where Oratio and Bratio denote the frequencies of the background and foreground pixels in the input image. In Equation (8), if Oratio and Bratio are each zero, False label is assigned to them. On the other hand, if Oratio and Bratio are nonzero, respectively, True label is assigned to them. Finally, the effect of the attention between the models, as described in Section 2.1, is maximized owing to these background and foreground losses, which aids in improving the segmentation performance. The causes for this performance improvement are as follows. In this study, the ground truth pixel for the background was set as zero, and the ground truth pixel for the foreground was set as one. Consequently, the px,y related to the background trains close to zero, and the px,y of the foreground trains close to one. Therefore, the features that provide attention to the background and foreground region processing focus more on the background and foreground regions.
Figure 2 shows the feature fusion-based segmentation method of the PSS-Net proposed in this study. Moreover, to explain the feature fusion-based segmentation process, the outputs before predicting zero (background) and one (foreground) are called the background final feature map and the foreground final feature map, respectively, in this study. In addition, the output after predictions is called the foreground final segmentation map.
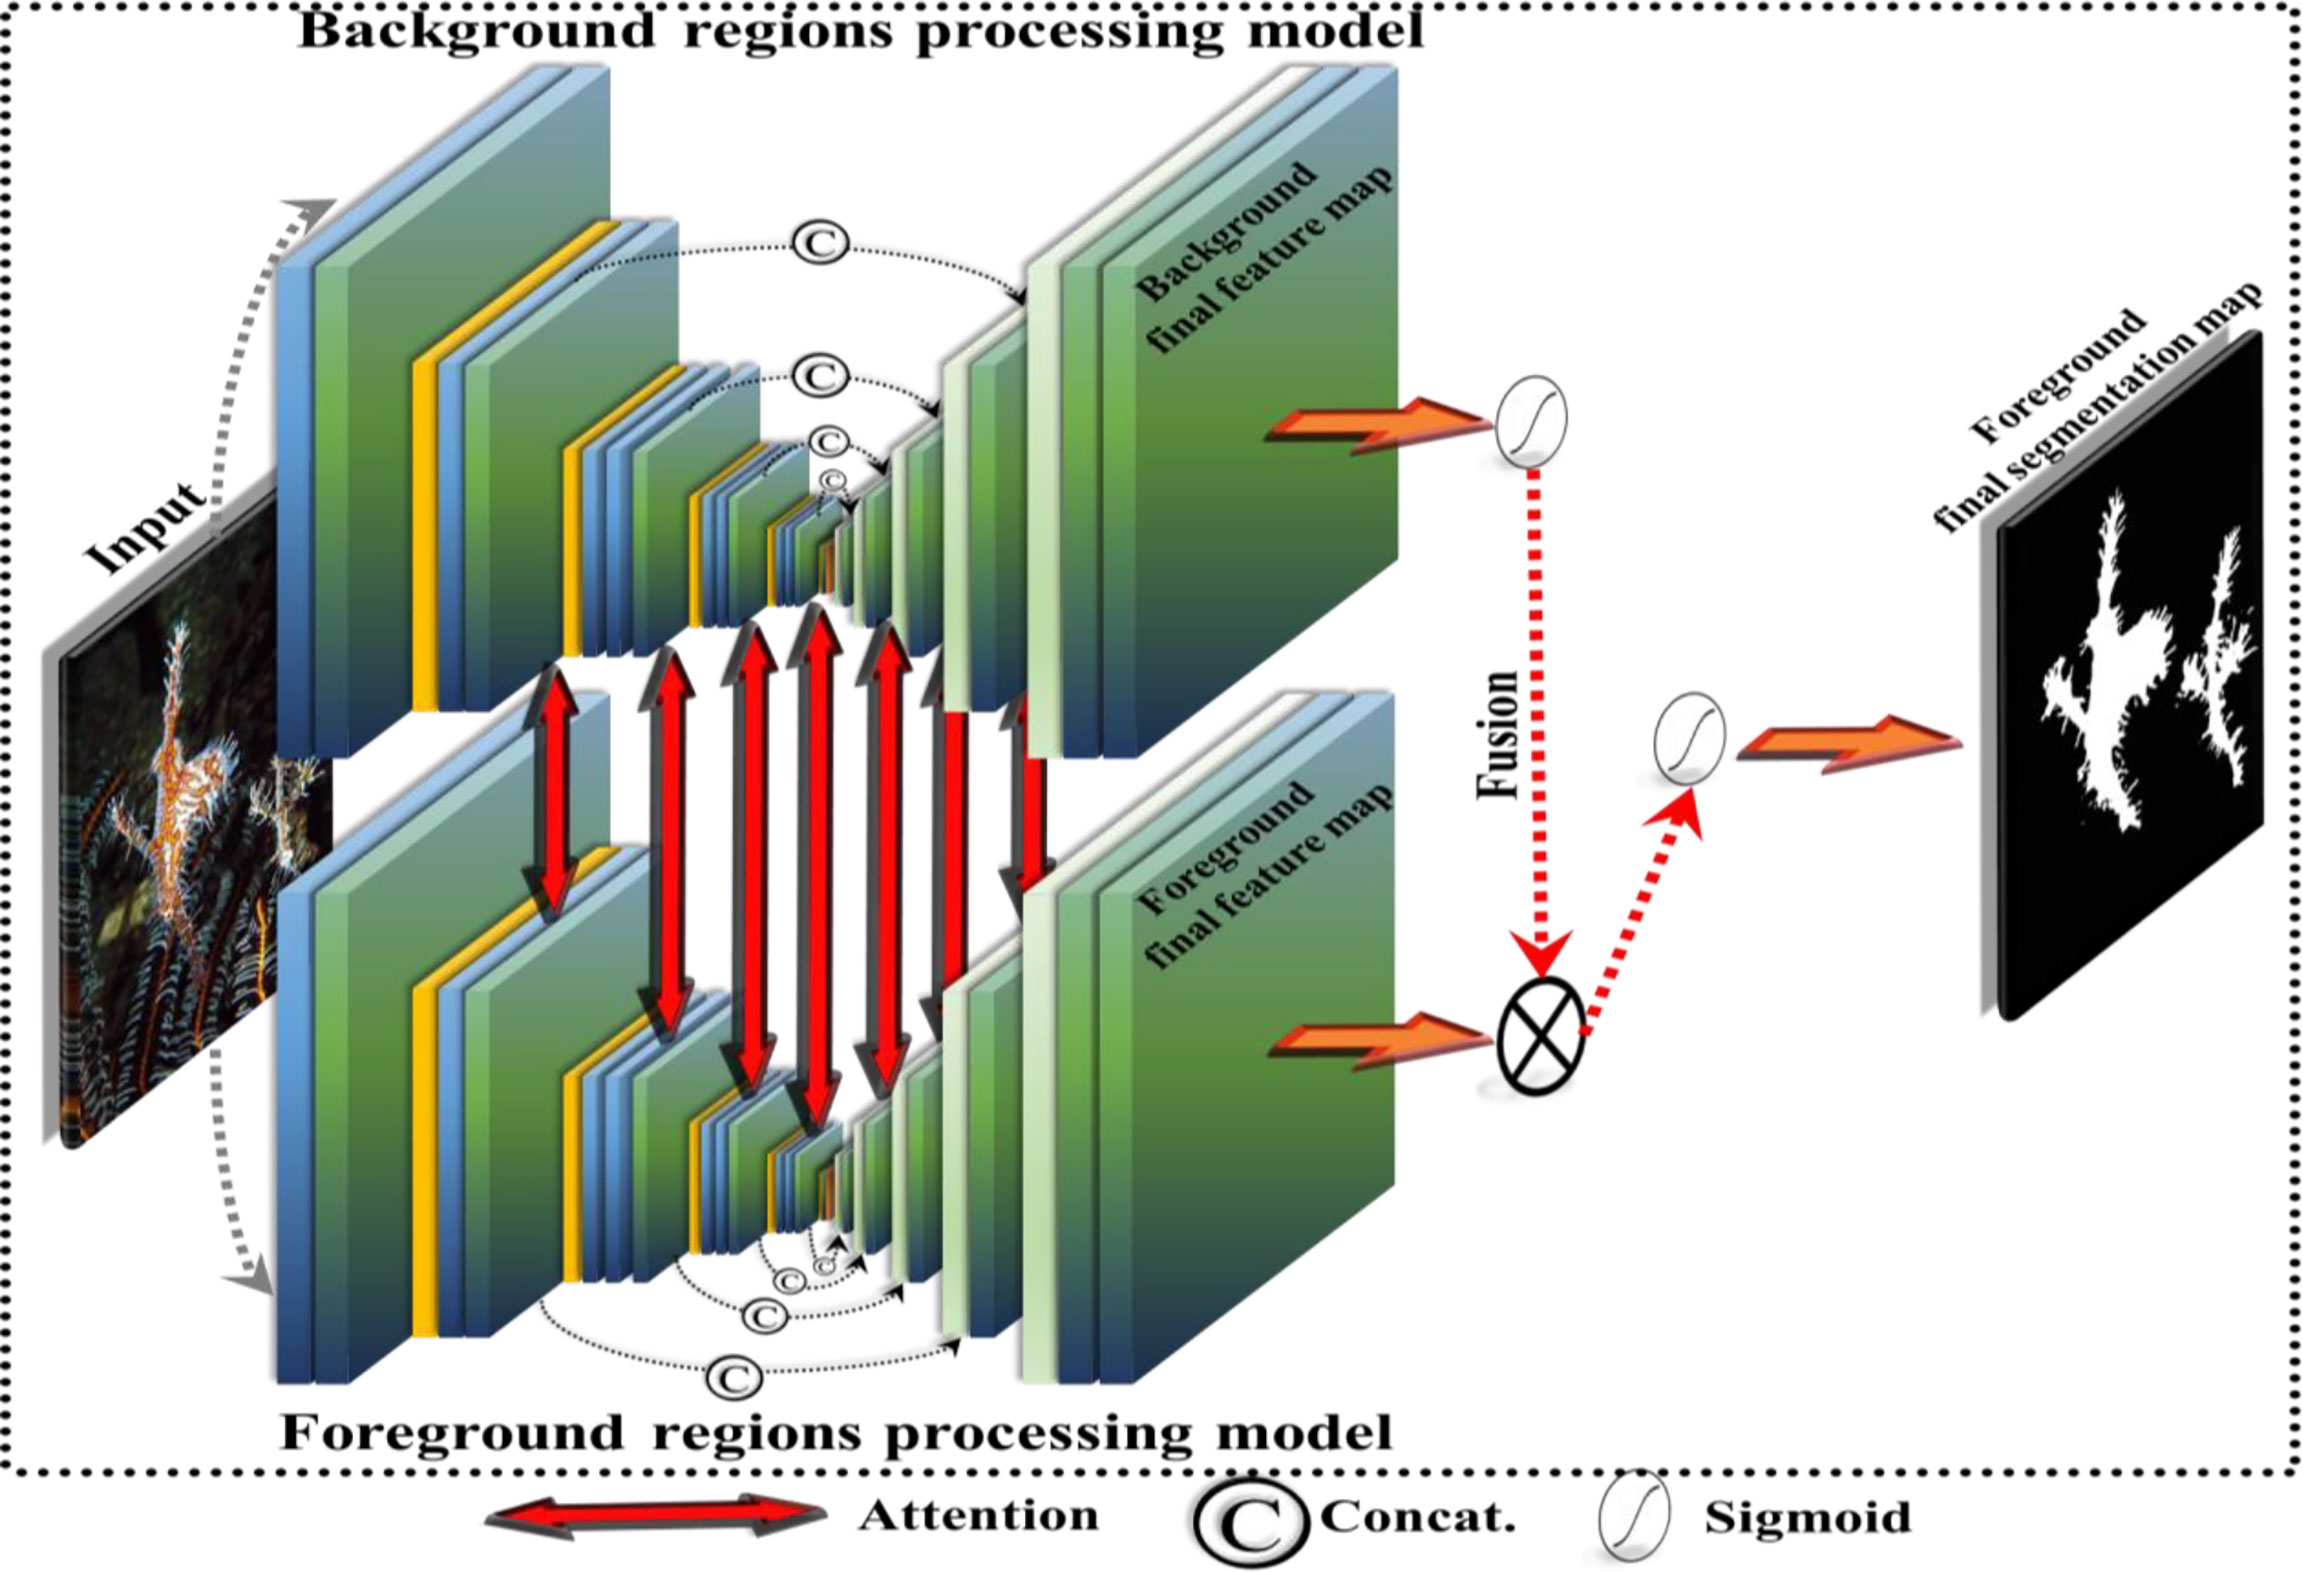
Figure 2 Feature fusion-based segmentation of PSS-Net.
As shown in Figure 2, pixel multiplication-based fusion is performed on the respective final feature maps (background and foreground final feature maps) obtained from the model that deals the background region processing and the model that deals with the foreground regions processing. This process is the same as the background final feature map-based attention operation for the foreground final feature map. Consequently, the final segmentation results are obtained by predicting the foreground and the background. The reason for fusing these two feature maps is to improve the segmentation results of the objects.
In this study, experiments were conducted using the MAS3K dataset (Li et al., 2021), which is an open database. This dataset consists of 1,588 camouflaged, 1,322 common, and 193 background images. We divided the MAS3K dataset into two cases in this study and conducted the experiments. Table 1 briefly describes cases 1 and 2 of the MAS3K dataset.
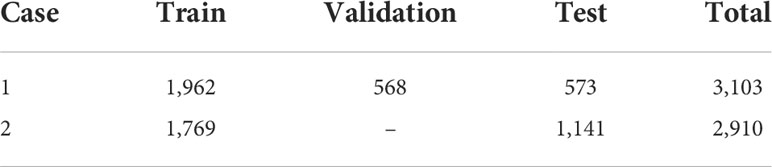
Table 1 Descriptions of two cases in MAS3K datasets for training, validation, and testing.
In case 1, the numbers of images in the train, validation, and test subsets are divided into the ratio of 6:2:2, including the background images, similarly to in a previous study (Li et al., 2021). Moreover, in Case 2, images in the dataset are included, and it excludes the background images, which are divided into only the train and test subsets similar to in a previous study (Chen et al., 2022). In addition, the resolution of the input images was 352 × 352 pixels for both Cases 1 and 2. We conducted experiments with Cases 1 and 2, as listed in Table 1, to conduct a reasonable performance evaluation using the same method (Cases 1 and 2) used in the existing studies.
The experiments were performed on a desktop computer using Ubuntu 20.04 with CPU Intel® Core™ i7-9700F CPU (Intel® Core™ i7-9700F CPU, accessed on 25 July 2022). It contains 16 GB of RAM and NVIDIA GeForce RTX 3070 graphics processing unit (GPU) card (NVIDIA GeForce RTX 3060, accessed on 25 July 2022). We used TensorFlow 2.6.0 (TensorFlow, accessed on 25 July 2022) for this implementation.
The proposed PSS-Net was trained using the adaptive moment estimation (Adam) optimizer (Kingma and Ba, 2014). Table 2 lists the hyperparameters used to train the PSS-Net. The same hyperparameters were used in the experiments for Cases 1 and 2.
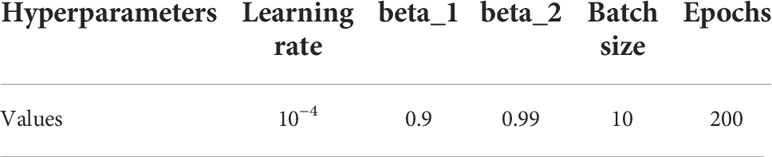
Table 2 Hyperparameters used for training of PSS-Net.
Figure 3 shows the training and validation losses and accuracy graphs of the PSS-Net.
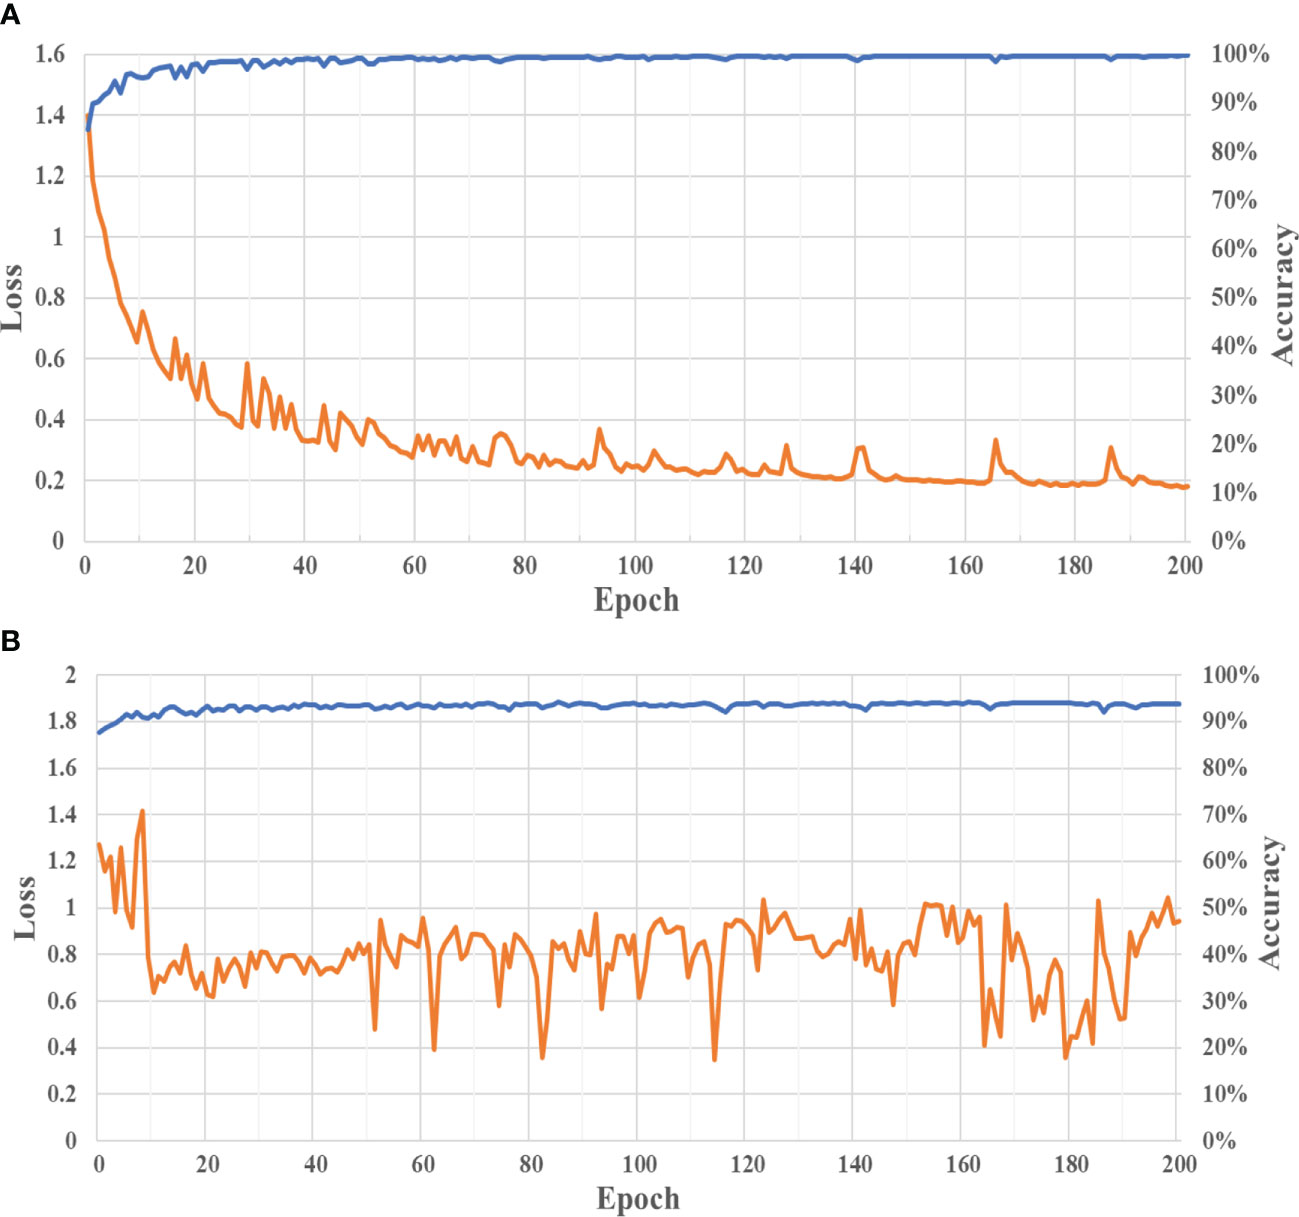
Figure 3 Graphs of losses and accuracies with (A) training and (B) validation data. (Orange and blue lines represent loss and accuracy, respectively).
As shown in Figure 3(A), the loss graph with the training data converges to a sufficiently small value as the epoch increased, whereas the accuracy graph with the training data converged to a sufficiently large value. This result indicates that the PSS-Net proposed in this study is sufficiently trained on the training data. In addition, as shown in Figure 3(B), the loss and accuracy graphs with the validation data in the experiment of case 1 converge to sufficiently small and large values, respectively, as the epoch increases. This result confirms that the PSS-Net proposed in this study was not overfitted with the training dataset.
The testing accuracy was measured using the mean intersection of union (mIoU), (weighted precision and recall) (Margolin et al., 2014), mE∅ (combination of local pixel values and image-level average values) (Fan et al., 2018), Sα object-aware and region-aware structure similarities) (Cheng and Fan, 2021), and mean absolute error (MAE). To use these metrics, precision and recall need to be measured, as expressed in Equations (9) and (10), respectively. TP, FN, and FP in Equations (9) and (10) denote the numbers of true positive, false negative, and false positive, respectively.
mE∅ and Sα are expressed in Equations (11)–(13), respectively.
Equations (11) and (13) are the equations used in (Margolin et al., 2014) and (Cheng and Fan, 2021), respectively. In addition, β 0.3 and α of 0.5 were used based on (Margolin et al., 2014) and (Cheng and Fan, 2021). In Equation (12), Y and G denote the foreground map and the ground truth image, respectively. Furthermore, μY and μG are the averages of Y and G respectively. A is a matrix in which all element values are equal to one, and its size is equal to Y and G respectively. Specifically, φG and φY denote the foreground map of the ground truth image and the foreground map of the prediction, respectively. In Equation (13), So and Sr denote the similarity to the object structure and the similarity to the structure of the boundary region (structural similarity), respectively. Moreover, high mIoU, mE∅ and Sα values imply good performance. Conversely, a small MAE value implies a good performance.
Ablation studies on case 1 of Table 1 with the MAS3K dataset were conducted first. Experiments were conducted by dividing the feature map fusion method, which is presented in Figure 2, into five cases. The first method is “testing with feature maps fusion using addition and average (Method 1).” The second method is “testing with feature maps fusion using multiplication without sigmoid function (Method 2).” The third and fourth methods are “testing with feature maps fusion using addition (Method 3)” and “testing only foreground regions model (Method 4),” respectively. Finally, the fifth method is “testing with feature maps fusion using attention based on sigmoid function (proposed method) (Method 5).” Table 3 reports the experimental results for the five methods described above.
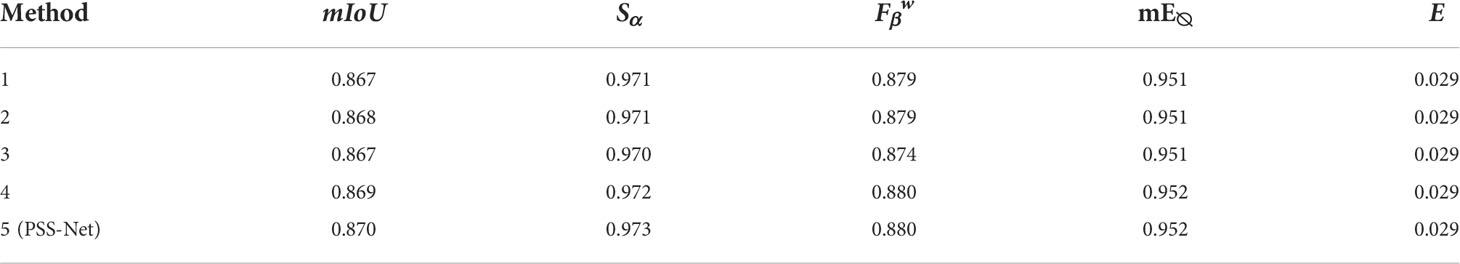
Table 3 Comparative accuracies of testing with feature maps fusion using addition and average, multiplication, addition, and attention (proposed method) on MAS3K dataset (case 1).
As can be seen from Table 3, the “feature maps fusion using attention based on sigmoid function” used in the PSS-Net proposed in this study exhibits higher segmentation accuracy than the other feature map fusion methods. This result is attributed to the fact that the combination of the attention for each layer and the last feature attention in the PSS-Net contributes to the improvement in the segmentation performance. Figure 4 shows sample segmentation images obtained from the PSS-Net.
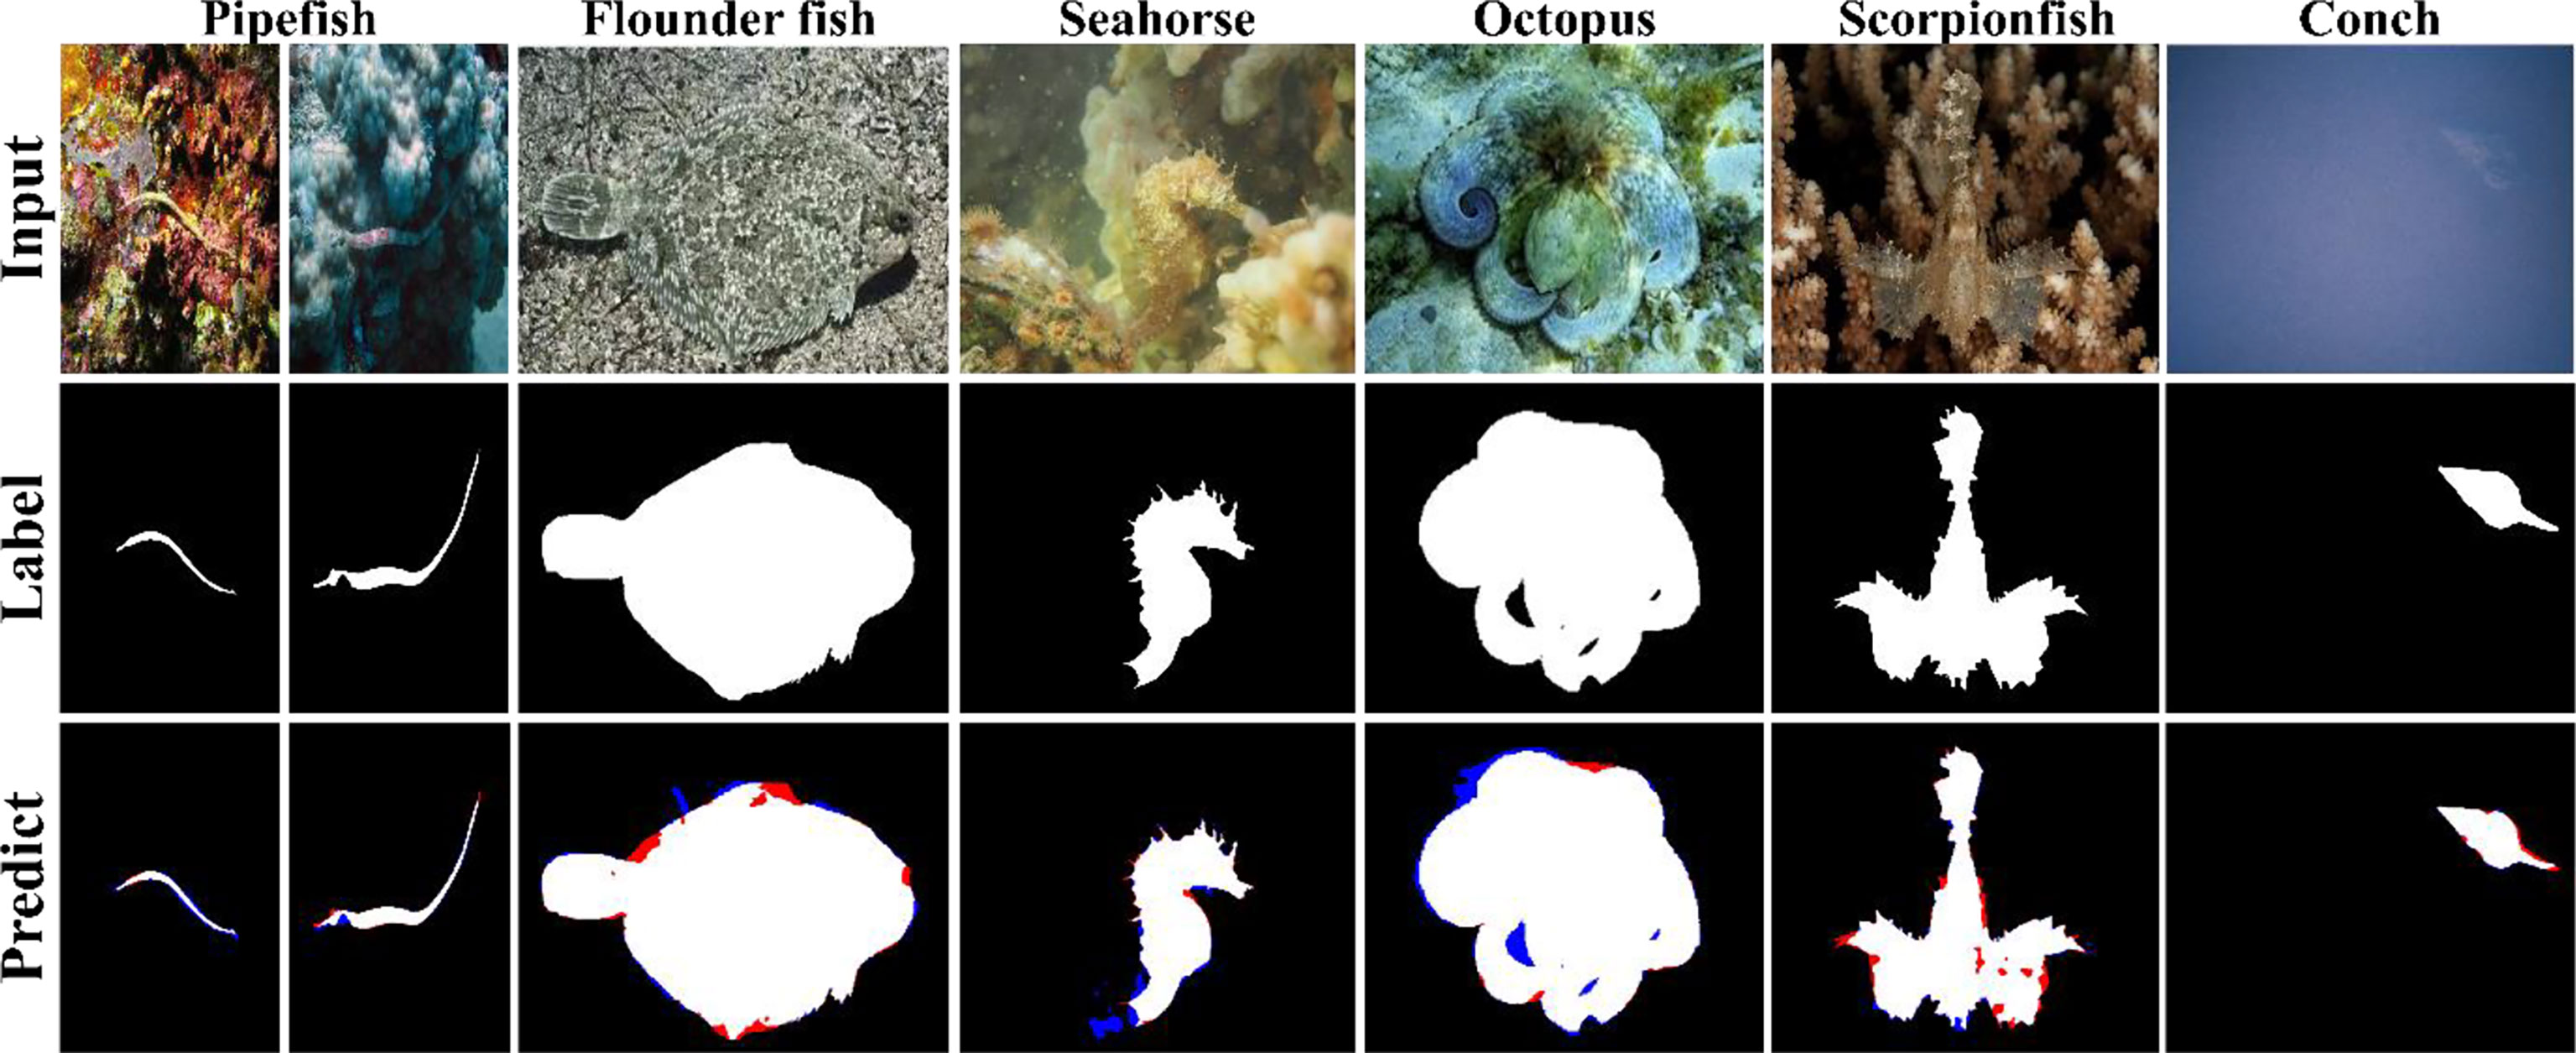
Figure 4 Input and label (ground-truth) images, and predict images obtained using PSS-Net with MAS3K dataset (case 1). TP, FP, FN, and TN are expressed in white, blue, red, and black, respectively.
Figure 5 shows sample attention feature maps in the PSS-Net. Specifically, it shows the feature maps or GradCAM (Selvaraju et al., 2017) images extracted from the third–fifth convolutional layers of the encoder and the fourth–sixth convolutional layers of the decoder in Figure 1, respectively. In Figure 5, the values that are close to red represent important features, whereas those close to blue represent unimportant features. It can be seen that the PSS-Net proposed in this study appropriately extracts important features for the foreground and background segmentation.
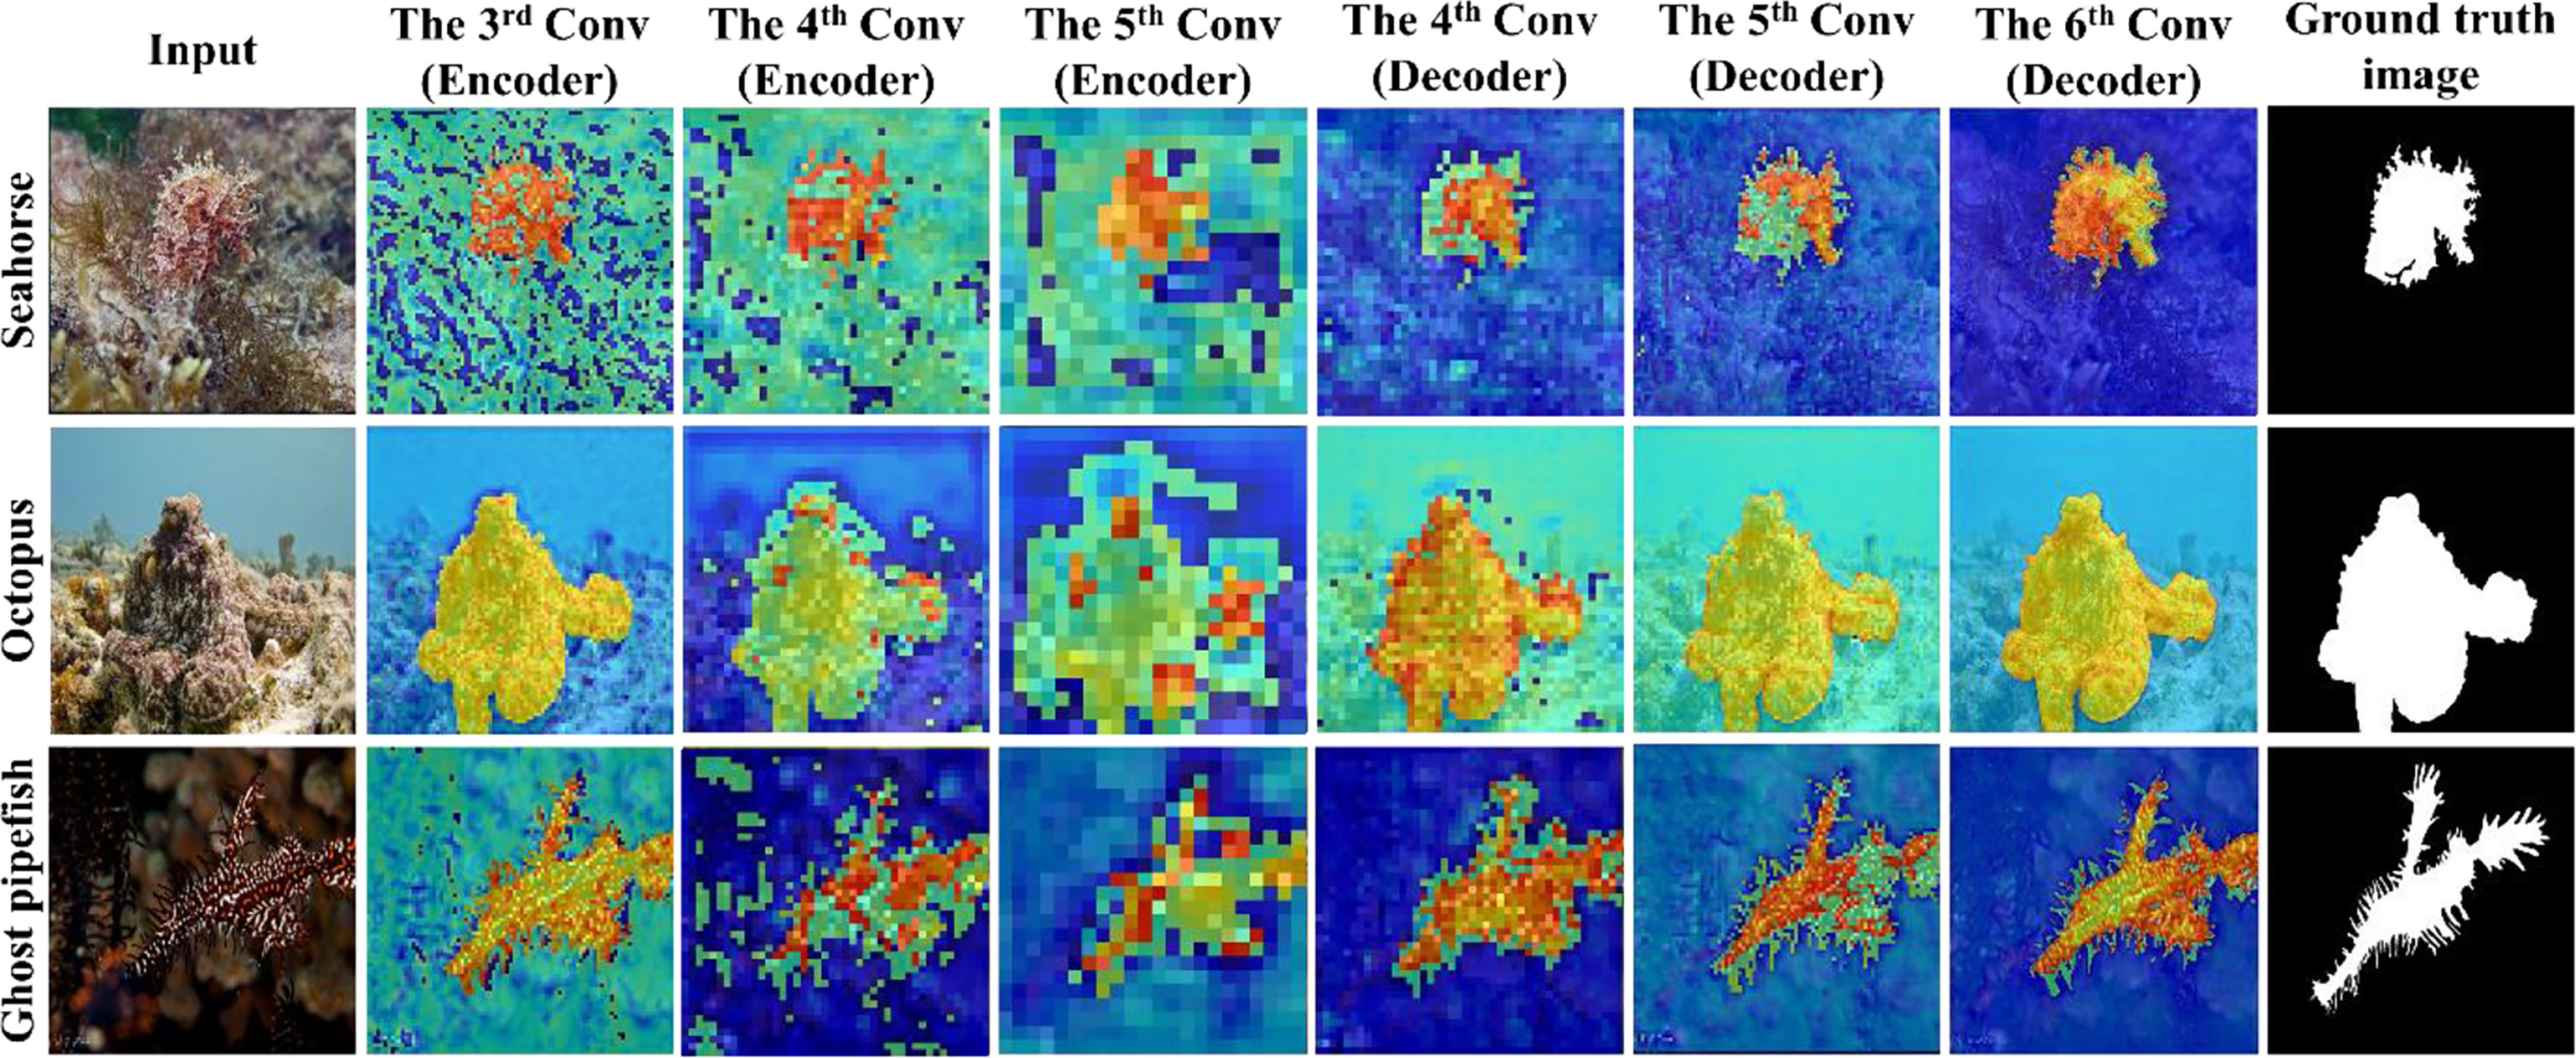
Figure 5 Examples of attention feature map with MAS3K dataset (case 1).
In the present experiments, the performances of the proposed PSS-Net and state-of-the-art methods—U-Net++ (Zhou et al., 2018), PiCANet (Liu et al., 2018), BASNet (Qin et al., 2019), CPDNet (Wu et al., 2019), PoolNet (Liu et al., 2019), EGNet (Zhao et al., 2019), SCRN (Wu et al., 2019), U2-Net (Qin et al., 2020), SINet (Fan et al., 2020), and ECD-Net (Li et al., 2021)—were compared. We referred to the results presented in a previous paper (Li et al., 2021) for the performance benchmark of these methods. Table 4 compares the PSS-Net proposed in this study and the existing state-of-the-art methods.
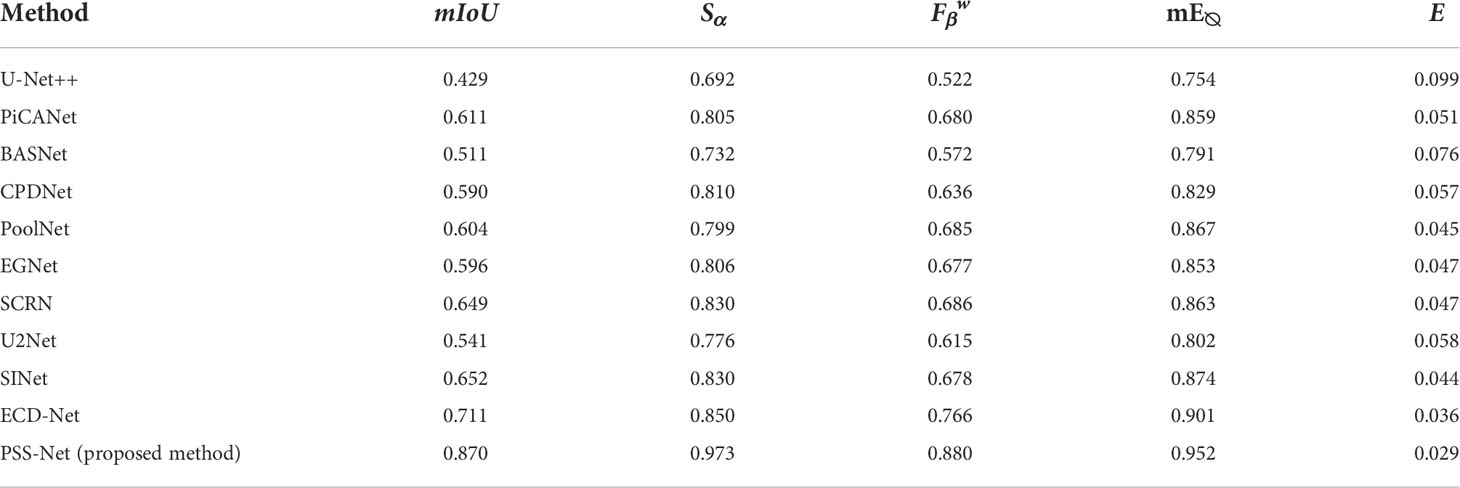
Table 4 Comparison of proposed PSS-Net and state-of-the-art methods with MAS3K dataset (case 1).
As summarized in Table 4, the proposed PSS-Net is confirmed to exhibit a higher segmentation accuracy than the existing state-of-the-art methods. In particular, the mIoU, Sα and mE∅ performance of the proposed PSS-Net are approximately 16%, 12%, 11%, and 5% higher than those of the second-best method, respectively. In addition, the MAE of the proposed PSS-Net is 0.007 lower than that of the second-best method. Therefore, the proposed PSS-Net improves the detection of the regions of the object and the background compared to the existing state-of-the-art methods.
Experiments for case 2 with the MAS3K dataset were conducted. First, an ablation experiment was performed similar to the five experiments resulting from dividing the feature maps fusion method into five cases, as discussed in Section 3.4.2.1. Table 5 summarizes the results of the ablation experiments related to case 2.
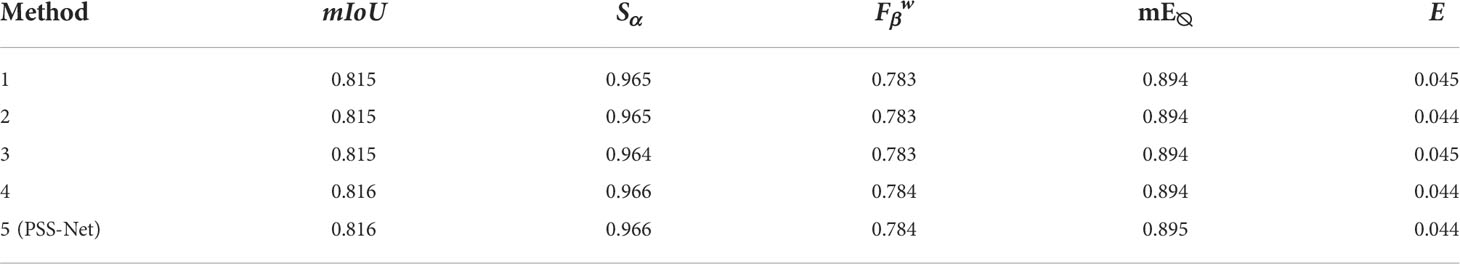
Table 5 Comparative accuracies of testing with feature maps fusion using addition and average, multiplication, addition, and using attention (proposed method) in MAS3K dataset (case 2).
Based on Table 5, the “feature maps fusion using attention based on a sigmoid function” used in this study exhibits a higher segmentation accuracy than the other feature map fusion methods for case 2. This result is attributed to the fact that the feature fusion segmentation proposed in this study is effective in improving the performance. Figure 6 shows sample segmentation result images obtained by the PSS-Net proposed in this study.
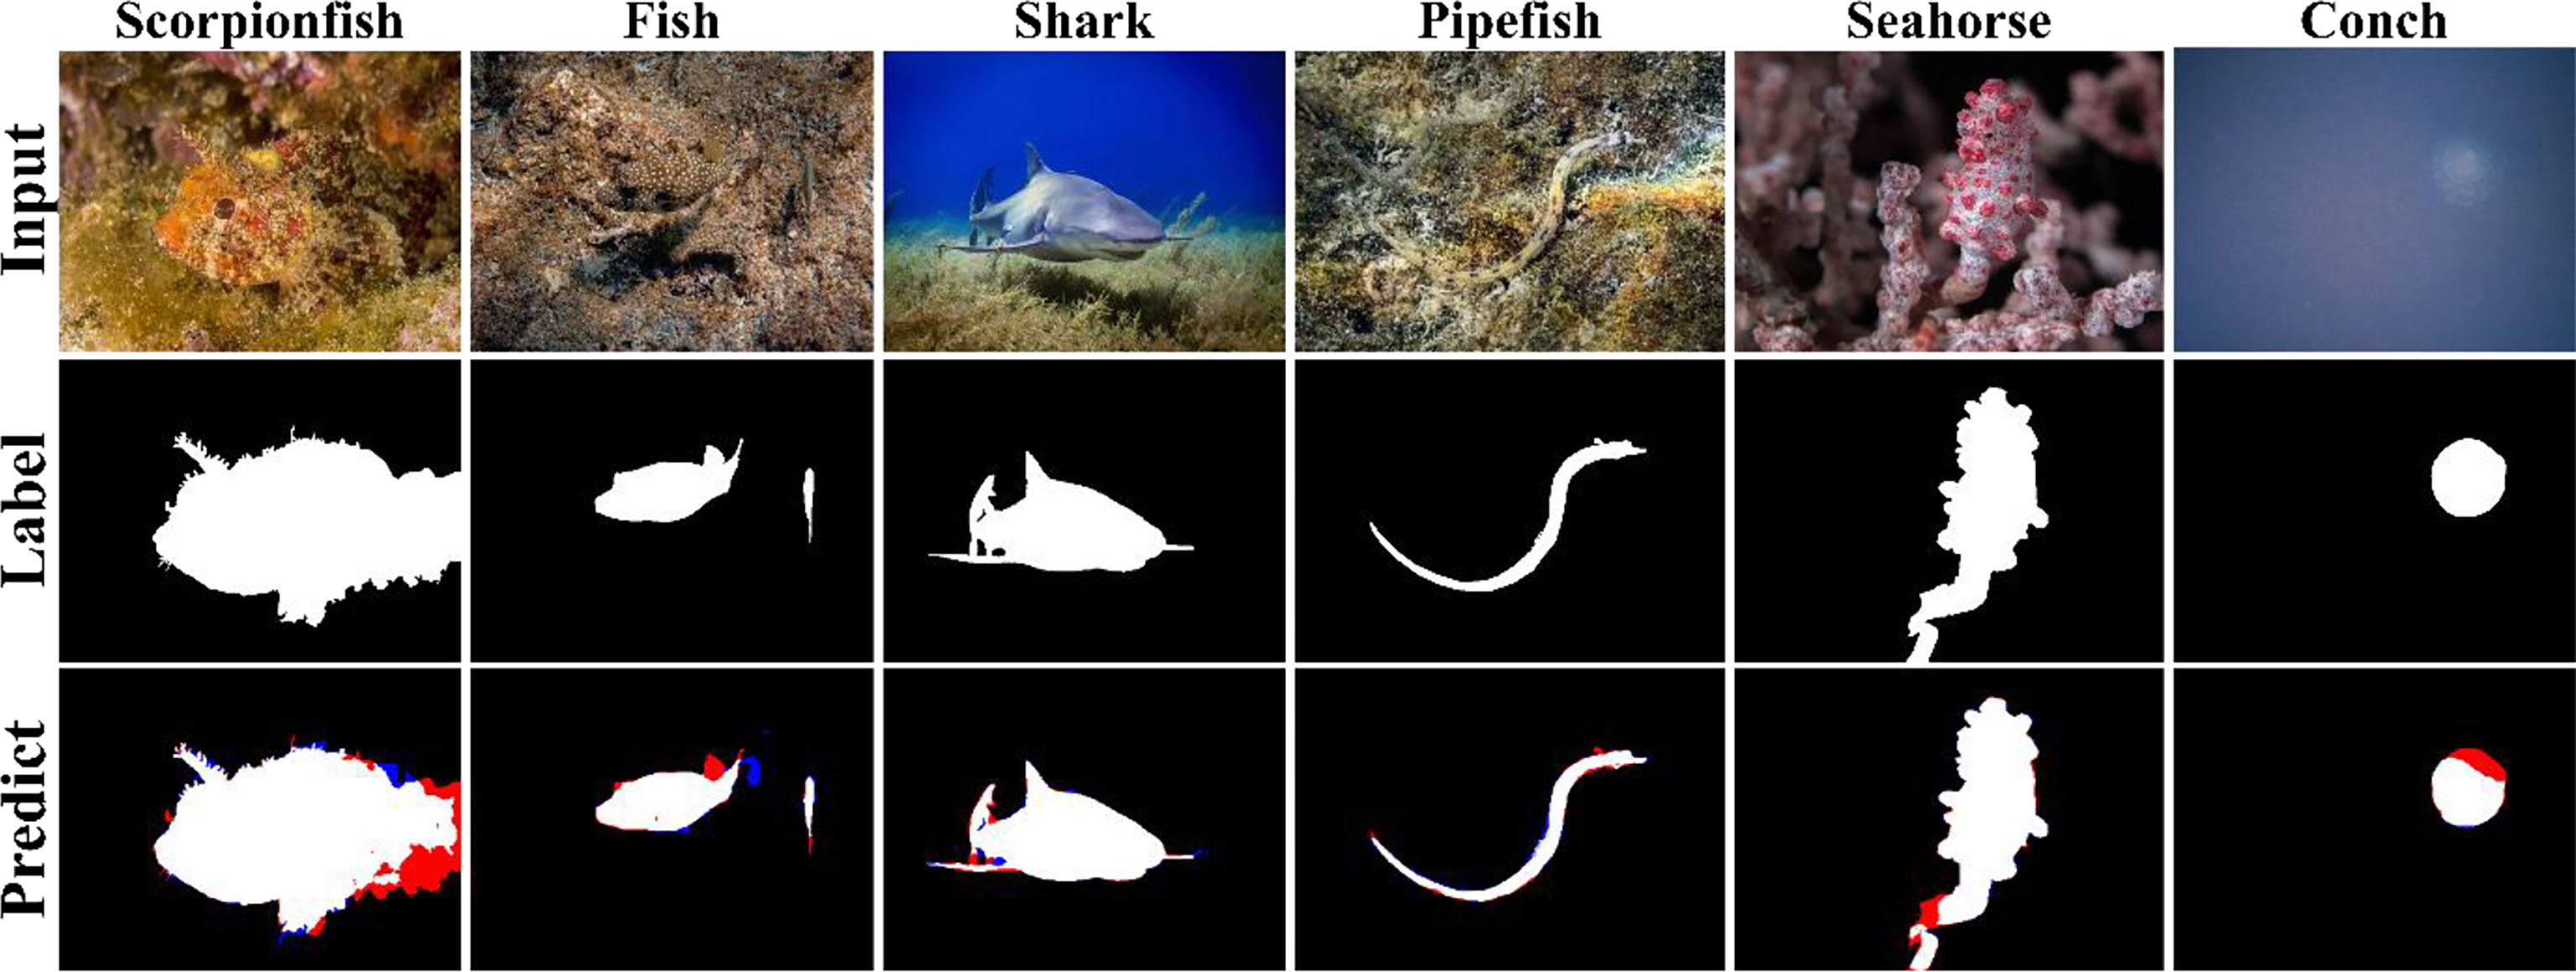
Figure 6 Result images of PSS-Net with MAS3K dataset (case 2). TP, FP, FN, and TN are expressed in white, blue, red, and black, respectively.
Figure 7 shows a sample attention feature map in the PSS-Net. It can be found that the PSS-Net appropriately extracts important features for the foreground and background segmentation, even in images in which the background and the foreground are similar.
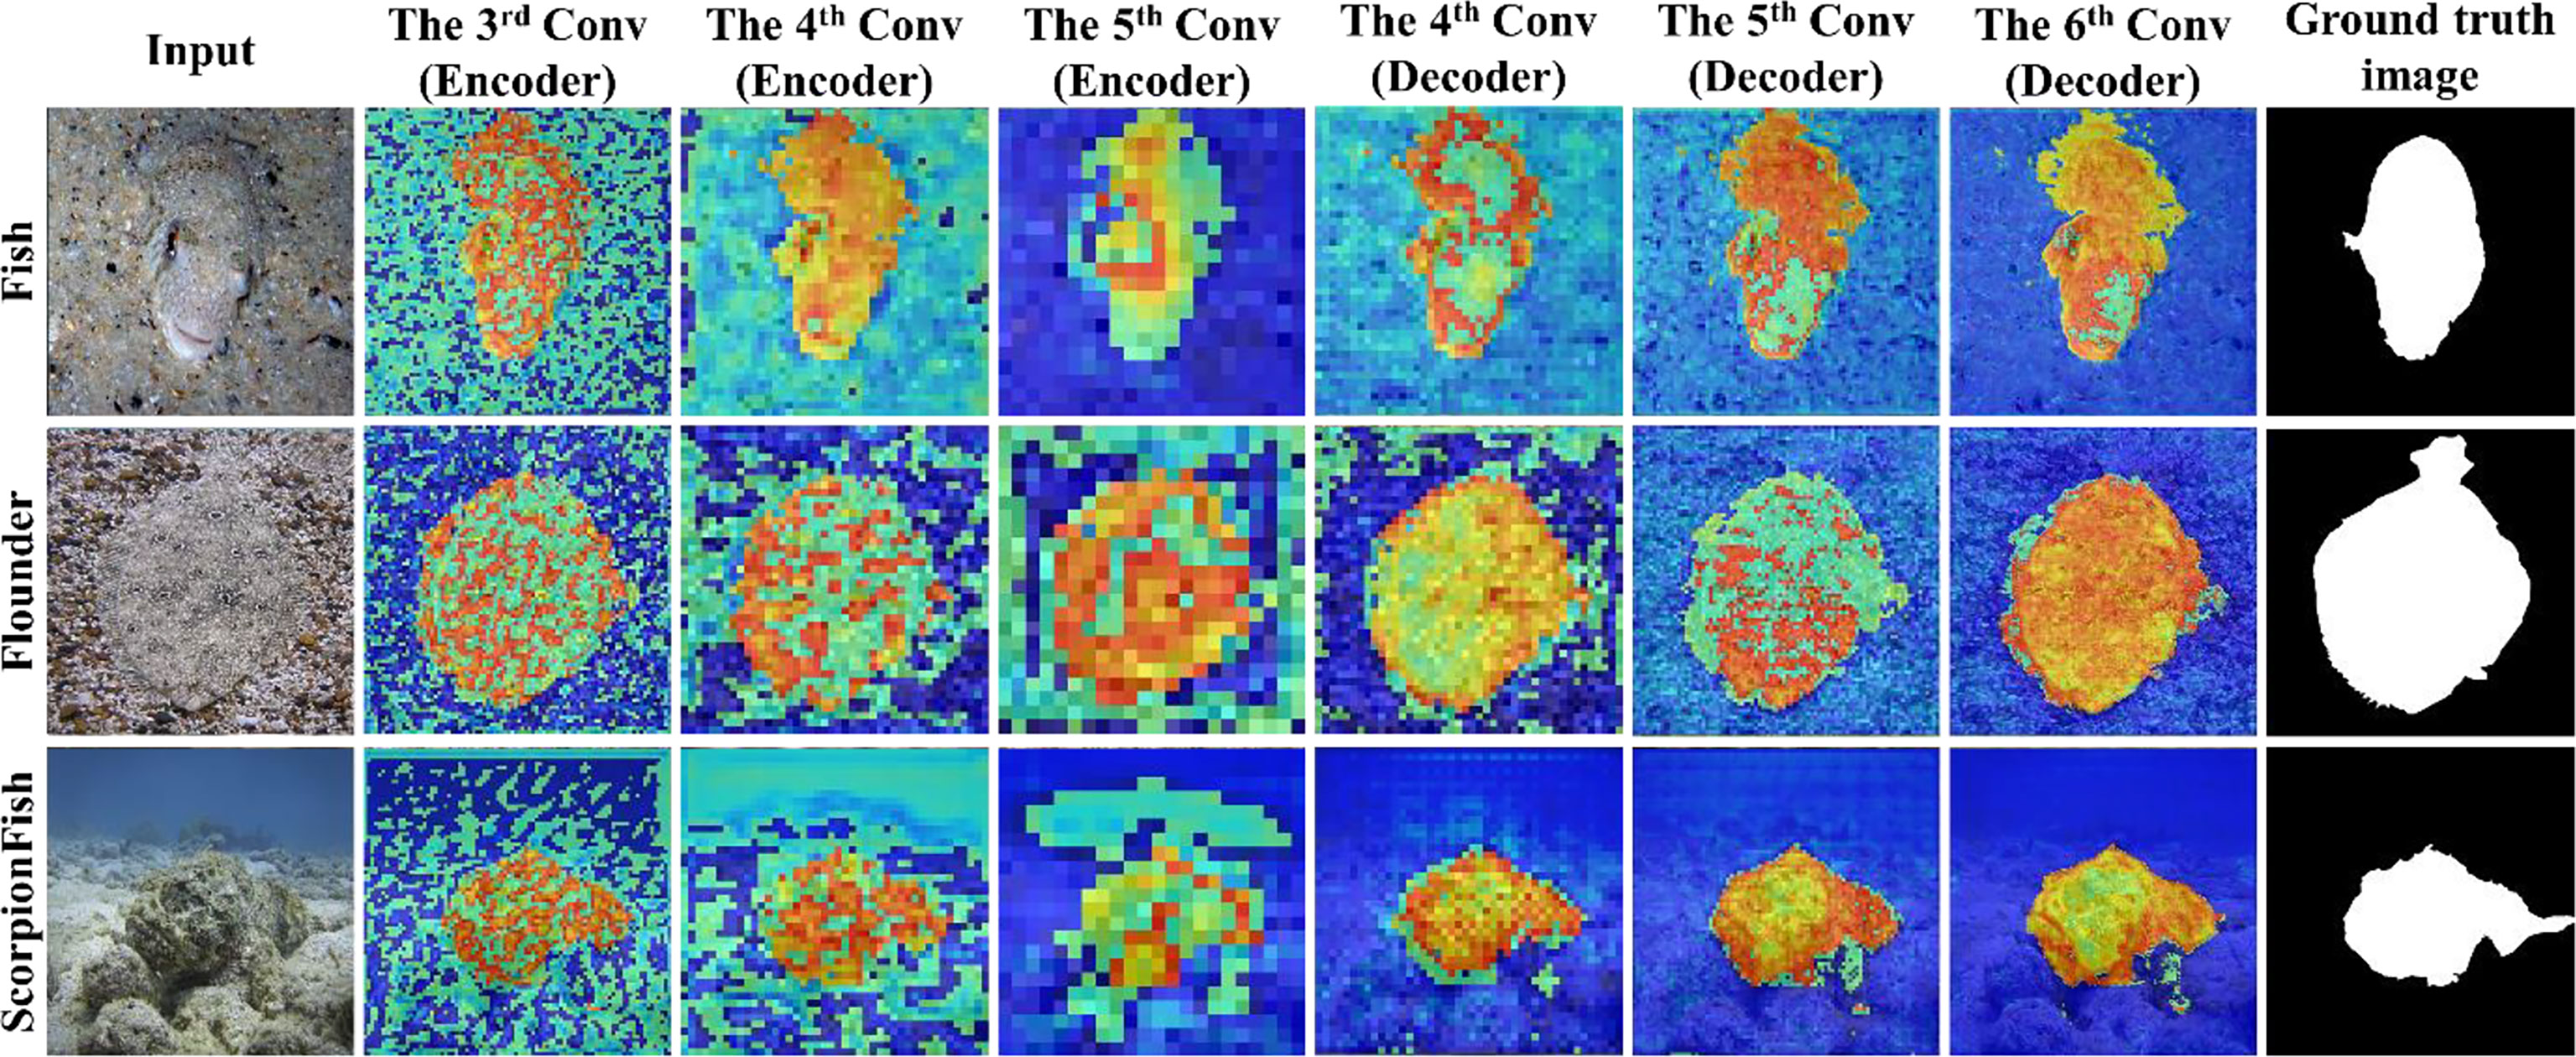
Figure 7 Examples of attention feature maps using MAS3K dataset (case 2).
In this section, we present the comparison of the experimental results of the PSS-Net proposed in this study with those of the BASNet (Qin et al., 2019), SCRN (Wu et al., 2019), SINet (Fan et al., 2020), U2-Net (Qin et al., 2020), SINet-V2 (Fan et al., 2021), C2FNet (Sun et al., 2021), and WaterSNet (Chen et al., 2022). We refer to the results of a previous study (Chen et al., 2022) for the performance benchmarking of these methods. Table 6 summarizes the comparison of the PSS-Net proposed in this study and the existing state-of-the-art methods.
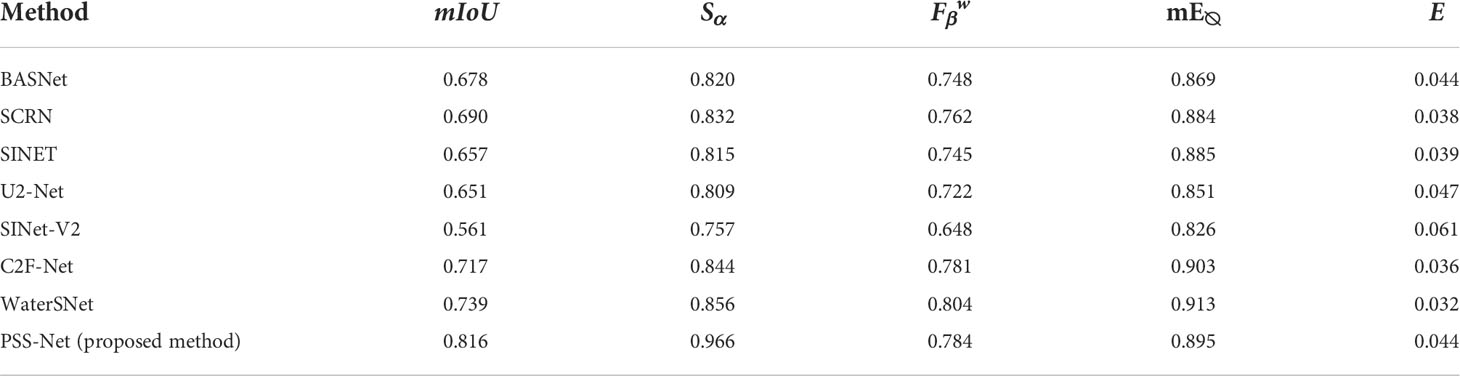
Table 6 Comparison of proposed PSS-Net and state-of-the-art methods with MAS3K dataset (case 2).
Based on Table 6, even though the existing methods slightly outperform the PSS-Net in terms of the mE∅ and MAE, the PSS-Net shows much higher segmentation accuracies than the existing state-of-the-art methods in terms of mIoU and Sα However mE∅ measures the accuracy by correcting the average values in the foreground map and the ground truth image, respectively, as expressed in Equation (12). Hence, it has a disadvantage in that the performance is affected by the average value of the foreground map and the ground truth image. In addition, because β (0.3 based on (Margolin et al., 2014) and (Cheng and Fan, 2021) considers RECALL to be more important than PRECISION, as expressed in Equation (11), it has a disadvantage in that the FPs are improperly considered in the performance evaluation, as expression in Equation (10). Moreover, as written in Equation (13), Sα does not simply represent the MAE between the predicted image and the ground truth image. It is a measure that represents the respective structure similarity-based accuracy of a detected object and the boundary region. Hence, it can be inferred that Sα along with the mIoU, shows more accurate detection results than the other metrics.
In this section, we discuss the inference time of the PSS-Net proposed in this study. First, Table 7 lists the measured inference time of the PSS-Net on a desktop and an embedded system (Jetson TX2 board) (Jetson TX2 embedded system, accessed on 25 July 2022) as shown in Figure 8. Jetson TX2 includes an NVIDIA Pascal™-family GPU (256 CUDA cores) with 8 GB of GPU memory.
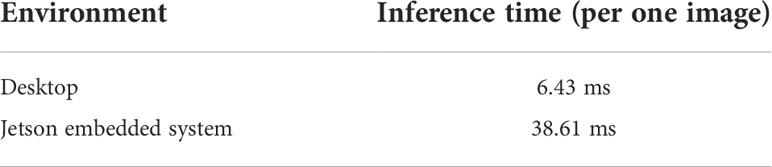
Table 7 Inference times of PSS-Net on desktop and Jetson embedded system.

Figure 8 Jetson TX2 board.
Based on Table 7, the inference times for one image on the desktop and the Jetson embedded system are 6.43 ms and 38.61 ms, respectively. These inference times imply processing speeds of 155.5 frames per second (fps) (1000/6.43) and 25.9 fps (1000/38.61), respectively. We employed the PSS-Net proposed in this study in the Jetson embedded system because an underwater vehicle is generally used in marine segmentation. In addition, because a Jetson embedded system is extensively used as an edge computing device that is attached to an underwater vehicle, the proposed PSS-Net was used in the Jetson embedded system to examine whether it can perform edge computing. Finally, based on Table 7, it is confirmed that the PSS-Net proposed in this study can operate in a limited embedded system.
For the ECD-Net (Li et al., 2021), which exhibits the second-best performance in Table 4, an IFEM is developed to extract the main features effectively when the features are compressed in the encoder. In addition, CDMs that can integrate features are designed to improve the final marine animal segmentation performance. In the WaterSNet (Chen et al., 2022), which exhibits the second-best performance in terms of the mIoU and Sα in Table 6 and slightly outperforms the PSS-Net in terms of the mE∅ and MAE, the AFB module is used to utilize the global context information. In addition, an RFB module is employed to extract multiscale features. This method is considered to use an attention mechanism. Furthermore, two models are used to reduce the overfitting, and a Siamese structure is used to allow various learning.
In contrast, the core of the PSS-Net proposed in this study can be summarized in three points. First, the proposed PSS-Net is a model designed with parallel CNNs that can be separately trained on the foreground and background of marine animal images. Second, the PSS-Net proposed in this study is a model that reinforces the foreground and background learning by adding an attention mechanism between the parallel CNNs. This mechanism allows focusing on the foreground and background learning tasks without conflicts. Third, when testing is performed, the foreground and background feature maps extracted from the parallel CNNs are fused to perform the final segmentation. Moreover, the fusion proposed in this study is regarding the attention mechanism. Thus, it is confirmed that the PSS-Net proposed in this study shows improved marine animal segmentation performance. However, the detection error of the proposed PSS-Net increases when an object has complex boundaries or the distinctiveness of the object is very low compared to background due to protective colors, as shown in Figure 9.
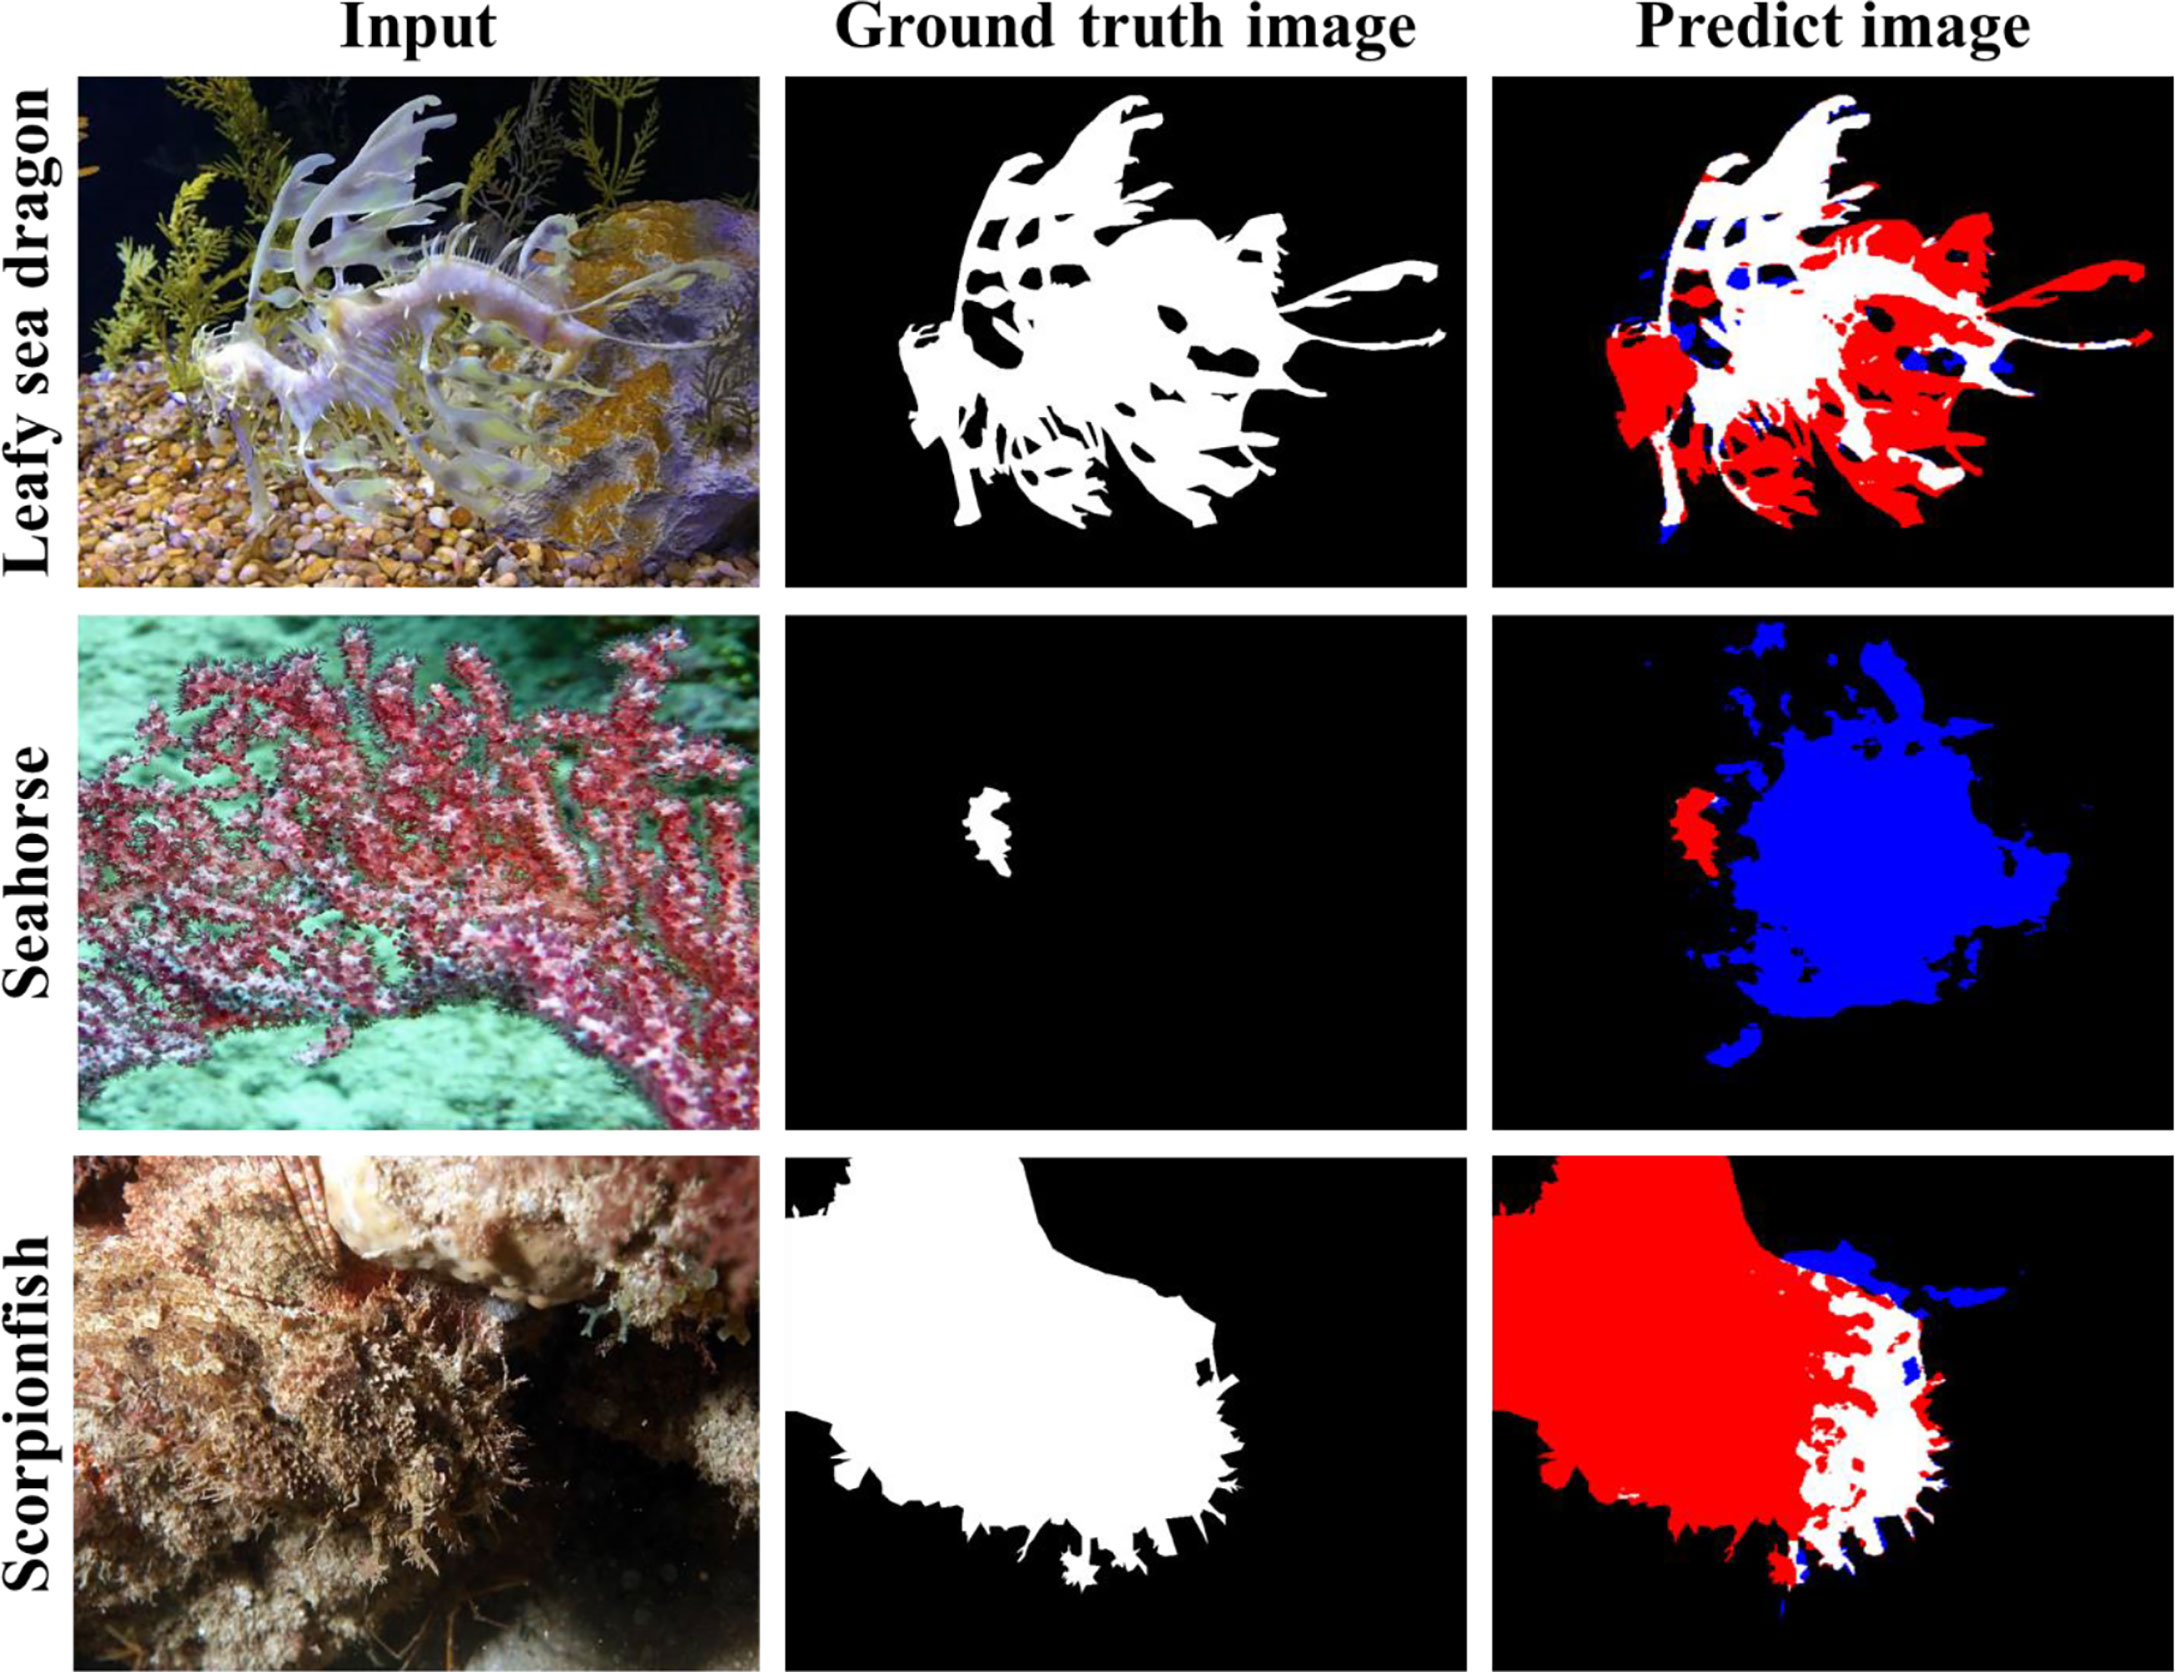
Figure 9 Examples of error cases for complex objects. TP, FP, FN, and TN are denoted in white, blue, red, and black colors, respectively.
As shown in Sections 3.4.2 and 3.4.3, the accuracies of case 1 experiments are higher than those of case 2 experiments. That is because the number of training data of case 1 is larger than that of case 2 as shown in Table 1, which makes the PSS-Net more robust to various data in case 1. In addition, the number of testing data of case 1 is smaller than that of case 2 as shown in Table 1, which can reduce the testing error in case 1.
In this study, we established the PSS-Net for marine animal segmentation. In addition, the PSS-Net was trained on the foreground and the background separately to detect marine animals accurately. This mechanism was possible because the PSS-Net was designed by connecting the foreground and background models in parallel. Moreover, an attention mechanism was connected between the parallel CNNs, and the foreground and background learning tasks were reinforced by separate losses (object and background losses). Finally, the background feature maps were fused to the foreground feature maps to perform the final segmentation when testing. Subsequently, ablation studies were conducted on this fusion. The results confirmed that the attention-based fusion proposed in this study has a high segmentation performance. Furthermore, we verified that the improved marine animal segmentation performance of the proposed PSS-Net by conducting comparison experiments with existing state-of-the-art methods. The segmentation results of case 1 experiments using the MAS3K open dataset reveal that the proposed method achieves performance of 87%, 97.3%, 88%, 95.2%, and 0.029 in the mIoU, Sα mE∅ and MAE, respectively. In addition, those of case 2 experiments using the MAS3K open dataset reveal that the proposed method achieves performance of 81.6%, 96.6%, 78.4%, 89.5%, and 0.044 in the mIoU, Sα mE∅ and MAE, respectively. However, it was found that the detection error of the proposed PSS-Net increased for cases where the object has complex boundaries and protective colors.
In future research, we plan to perform the segmentation of marine animal with severely complex boundaries and protective colors based on the segmentation approach of object within the rectangular region roughly detected by a conventional CNN detector. In addition, we aim to expand the results of this study to investigate how to improve the semantic segmentation performance for multiclass marine animals.
Publicly available datasets were analyzed in this study. This data can be found here: (MAS3K database) https://github.com/LinLi-DL/MAS.
Ethical review and approval was not required for the animal study because in our study, we used an open database of MAS3K dataset which can be freely used for academic purpose according to the instructions of database provider. Therefore, ethical review and approval was not required for this study.
Y.H.K designed the method with experiments and wrote the first draft of the manuscript supervised by K.R.P. K.R.P critically reviewed the initial manuscript and provided helpful input. All authors contributed to the article and approved the submitted version.
This research was supported in part by the National Research Foundation of Korea (NRF) funded by the Ministry of Science and ICT (MSIT) through the Basic Science Research Program (NRF-2021R1F1A1045587), in part by the NRF funded by the MSIT through the Basic Science Research Program (NRF-2022R1F1A1064291), and in part by the MSIT, Korea, under the ITRC (Information Technology Research Center) support program (IITP-2022-2020-0-01789) supervised by the IITP (Institute for Information and Communications Technology Planning and Evaluation).
The authors declare that the research was conducted in the absence of any commercial or financial relationships that could be construed as a potential conflict of interest.
All claims expressed in this article are solely those of the authors and do not necessarily represent those of their affiliated organizations, or those of the publisher, the editors and the reviewers. Any product that may be evaluated in this article, or claim that may be made by its manufacturer, is not guaranteed or endorsed by the publisher.
Berg P., Maia D. S., Pham M.-T., Lefèvre S. (2022). Weakly supervised detection of marine animals in high resolution aerial images. Remote Sens. 14, 1–17. doi: 10.3390/rs14020339
Chen R., Fu Z., Huang Y., Cheng E., Ding X. (2022). “A robust object segmentation network for underwater scenes,” in Proc. IEEE int. conf. acoust. speech signal process(Singapore: IEEE), 2629–2633.
Cheng M.-M., Fan D.-P. (2021). Structure-measure: A new way to evaluate foreground maps. Int. J. Comput. Vis. 129, 2622–2638. doi: 10.1007/s11263-021-01490-8
Ditria E. M., Lopez-Marcano S., Sievers M., Jinks E. L., Brown C. J., Connolly R. M. (2020). Automating the analysis of fish abundance using object detection: Optimizing animal ecology with deep learning. Front. Mar. Sci. 7. doi: 10.3389/fmars.2020.00429
Fan D.-P., Gong C., Cao Y., Ren B., Cheng M.-M., Borji A. (2018). “Enhanced-alignment measure for binary foreground map evaluation,” in Proc. int. joint conf. artif. intell (Stockholm, Sweden: Stockholmsmässan), 698–704. Available at: https://doi.org/10.24963/ijcai.2018/97.
Fan D.-P., Ji G.-P., Cheng M.-M., Shao L. (2021). Concealed object detection. IEEE Trans. Pattern Anal. Mach. Intell. doi: 10.1109/TPAMI.2021.3085766
Fan D.-P., Ji G.-P., Sun G., Cheng M.-M., Shen J., Shao L. (2020). “Camouflaged object detection,” in Proc. conf. comput. vis. pattern recognit(Seattle, Online, USA: IEEE), 2777–2787.
Fu J., Liu J., Jiang J., Li Y., Bao Y., Lu H. (2020). Scene segmentation with dual relation-aware attention network. IEEE Trans. Neural Netw. Learn. Syst. 32, 2547–2560. doi: 10.1109/TNNLS.2020.3006524
He K., Zhang X., Ren S., Sun J. (2016). “Deep residual learning for image recognition,” in Proc. conf. comput. vis. pattern recognit(Las Vegas, Nevada, USA: IEEE), 770–778.
Huang Z., Wang X., Huang L., Huang C., Wei Y., Liu W. (2019). “CCNet: Criss-cross attention for semantic segmentation,” in Proc. int. conf. comput. vis(Seoul, Korea (South: IEEE), 603–612.
Intel® Core™ i7-9700F CPU (2022). Available at: https://ark.intel.com/content/www/us/en/ark/products/193738/intel-core-i79700f-processor-12m-cache-up-to-4-70-ghz.html (Accessed July 25, 2022).
Islam M. J., Edge C., Xiao Y., Luo P., Mehtaz M., Morse C., et al. (2020). Semantic segmentation of underwater imagery: Dataset and benchmark. arXiv. 1–9. doi: 10.48550/arXiv.2004.01241
Jetson TX2 embedded system (2020). Available at: https://developer.nvidia.com/embedded/jetson-tx2 (Accessed July 25, 2022).
KaewTraKulPong P., Bowden R. (2001). An improved adaptive background mixture model for realtime tracking with shadow detection. Proc. Adv. Video Surveill. Syst., 135–144. doi: 10.1007/978-1-4615-0913-4_11
Kandimalla V., Richard M., Smith F., Quirion J., Torgo L., Whidden C. (2022). Automated detection, classification and counting of fish in fish passages with deep learning. Front. Mar. Sci. 8. doi: 10.3389/fmars.2021.823173
Kim Y. H., Park K. R. (2022). MTS-CNN: Multi-task semantic segmentation-convolutional neural network for detecting crops and weeds. Comput. Electron. Agric. 199, 107146. doi: 10.1016/j.compag.2022.107146
Kingma D. P., Ba J. (2014). Adam: A method for stochastic optimization. arXiv 1–15. doi: 10.48550/arXiv.1412.6980
Koch G., Zemel R., Salakhutdinov R. (2015). “Siamese Neural networks for one-shot image recognition,” in Proc. int. conf. mach. learn(Lille, France: ICML).
Li L., Dong B., Rigall E., Zhou T., Dong J., Chen G. (2021). Marine animal segmentation. IEEE Trans. Circuits Syst. Video Technol. 32, 2303–2314. doi: 10.1109/TCSVT.2021.3093890
Lin T.-Y., Goyal P., Girshick R., He K., Dollár P. (2017). “Focal loss for dense object detection,” in Proc. int. conf. comput. vis(Venice, Italy: IEEE), 2999–3007. doi: 10.1109/ICCV.2017.324
Li L., Rigall E., Dong J., Chen G. (2021). “MAS3K: An open dataset for marine animal segmentation,” in Proc. Symp. Benchmarking, Meas. Optim, Vol. 12614. doi: 10.1007/978-3-030-71058-3_12
Liu N., Han J., Yang M.-H. (2018). “PiCANet: Learning pixel-wise contextual attention for saliency detection,” in Proc. conf. comput. vis. pattern recognit(Salt Lake City, UT, USA: IEEE), 3089–3098.
Liu J.-J., Hou Q., Cheng M.-M., Feng J., Jiang J. (2019). “A simple pooling-based design for real-time salient object detection,” in Proc. conf. comput. vis. pattern recognit (Long Beach, CA, USA: IEEE), 3912–3921.
Margolin R., Zelnik-Manor L., Tal A. (2014). “How to evaluate foreground maps,” in Proc. conf. comput. vis. pattern recognit(Columbus, OH, USA: IEEE).
NVIDIA (2022). Available at: https://www.nvidia.com/ko-kr/geforce/graphics-cards/30-series/rtx-3060-3060ti/ (Accessed July 25, 2022).
Panaïotis T., Caray–Counil L., Woodward B., Schmid M. S., Daprano D., Tsai S. T., et al. (2022). Content-aware segmentation of objects spanning a large size range: Application to plankton images. Front. Mar. Sci. 9. doi: 10.3389/fmars.2022.870005
Pang Y., Zhao X., Zhang L., Lu H. (2020). “Multi-scale interactive network for salient object detection,” in Proc. conf. comput. vis. pattern recognit (Seattle, Online, USA: IEEE), 9413–9422.
Pedersen M., Haurum J. B., Gade R., Moeslund T. B. (2019). “Detection of marine animals in a new underwater dataset with varying visibility,” in Proc. conf. comput. vis. pattern recognit(Long Beach, CA: IEEE), 18–26.
Qin X., Zhang Z., Huang C., Dehghan M., Zaiane O. R., Jagersand M. (2020). U2-net: Going deeper with nested u-structure for salient object detection. Pattern Recognit. 106, 1–12. doi: 10.1016/j.patcog.2020.107404
Qin X., Zhang Z., Huang C., Gao C., Dehghan M., Jagersand M. (2019). “BASNet: Boundary-aware salient object detection,” in Proc. conf. comput. vis. pattern recognit(Long Beach, CA: IEEE), 7479–7489.
Radolko M., Farhadifard F., Lukas U. F. (2016). “Dataset on underwater change detection,” in Proc. oceans Monterey (Monterey, California, USA: IEEE). doi: 10.1109/OCEANS.2016.7761129
Radolko M., Farhadifard F., Lukas U. V. (2017). “Change detection in crowded underwater scenes - via an extended Gaussian switch model combined with a flux tensor pre-segmentation,” in Proc. int. joint conf. comput. vis, img. comput. theory appl. (Setúbal Portugal: SCITEPRESS)
Radolko M., Gutzeit E. (2015). “Video segmentation via a Gaussian switch background model and higher order Markov random fields,” in Proc. int. joint conf. comput. vis, img. comput. theory appl(Berlin, Germany: SCITEPRESS), 537–544.
Ronneberger O., Fischer P., Brox T. (2015). “U-Net: Convolutional networks for biomedical image segmentation,” in Proc. int. conf. med. comput. comput.-ASSIST. interv(Munich, Germany: Springer), 234–241. Available at: https://doi.org/10.48550/arXiv.1505.04597.
Selvaraju R. R., Cogswell M., Das A., Vedantam R., Parikh D., Batra D. (2017). “Grad-cam: visual explanations from deep networks via gradient-based localization,” in Proc. int. conf. comput. vis (Venice, Italy: IEEE).
Simonyan K., Zisserman A. (2015). “Very deep convolutional networks for large-scale image recognition,” in Proc. conf. comput. vis. pattern recognit (San Diego, CA, USA: IEEE), 1–14. Available at: https://doi.org/10.48550/arXiv.1409.1556.
Sun Y., Chen G., Zhou T., Zhang Y., Liu N. (2021). “Context-aware cross-level fusion network for camouflaged object detection,” in Proc. int. joint conf. artif. intell (Montreal-themed Virtual Reality), 1025–1031. (CA, USA: IJCAI). Available at: https://doi.org/10.48550/arXiv.2105.12555.
TensorFlow (2022). Available at: https://www.tensorflow.org/ (Accessed July 25, 2022).
Wu Z., Su L., Huang Q. (2019a). “Cascaded partial decoder for fast and accurate salient object detection,” in Proc. conf. comput. vis. pattern recognit(Long Beach, CA, USA: IEEE). Available at: https://doi.org/10.48550/arXiv.1904.08739.
Wu Z., Su L., Huang Q. (2019b). “Stacked cross refinement network for edge-aware salient object detection,” in Proc. int. conf. comput. vis (Seoul, Korea (south: COEX), 8779–8788.
Xu G., Xie W., Dong C., Gao X. (2021). Application of three deep learning schemes into oceanic eddy detection. Front. Mar. Sci. 8. doi: 10.3389/fmars.2021.672334
Zhang W., Wu C., Bao Z. (2021). DPANet: Dual pooling-aggregated attention network for fish segmentation. IET Comput. Vis. 16, 67–82. doi: 10.1049/cvi2.12065
Zhao J.-X., Liu J.-J., Fan D.-P., Cao Y., Yang J.-F., Cheng M.-M. (2019). “EGNet: Edge guidance network for salient object detection,” in Proc. int. conf. comput. vis (Seoul, Korea (south: COEX), 8779–8788.
Zhou Z., Siddiquee M. M. R., Tajbakhsh N., Liang J. (2018). “UNet++: A nested u-net architecture for medical image segmentation,” in Proc. deep learning med. img(Granada, Spain: Springer), 3–11.
Zivkovic Z. (2004). “Improved adaptive Gaussian mixture model for background subtraction,” in Proc. int. assoc. pattern recognit (Cambridge, UK: IEEE).
Keywords: detecting marine animal, underwater scene, protective colors, PSS-net, attention technique
Citation: Kim YH and Park KR (2022) PSS-net: Parallel semantic segmentation network for detecting marine animals in underwater scene. Front. Mar. Sci. 9:1003568. doi: 10.3389/fmars.2022.1003568
Received: 26 July 2022; Accepted: 15 August 2022;
Published: 07 September 2022.
Edited by:
Rizwan Ali Naqvi, Sejong University, South KoreaCopyright © 2022 Kim and Park. This is an open-access article distributed under the terms of the Creative Commons Attribution License (CC BY). The use, distribution or reproduction in other forums is permitted, provided the original author(s) and the copyright owner(s) are credited and that the original publication in this journal is cited, in accordance with accepted academic practice. No use, distribution or reproduction is permitted which does not comply with these terms.
*Correspondence: Kang Ryoung Park, cGFya2dyQGRvbmdndWsuZWR1
Disclaimer: All claims expressed in this article are solely those of the authors and do not necessarily represent those of their affiliated organizations, or those of the publisher, the editors and the reviewers. Any product that may be evaluated in this article or claim that may be made by its manufacturer is not guaranteed or endorsed by the publisher.
Research integrity at Frontiers
Learn more about the work of our research integrity team to safeguard the quality of each article we publish.