 Elin Almroth-Rosell1*
 Iréne Wåhlström1
 Martin Hansson1
 Germo Väli2
 Kari Eilola1Pia Andersson1
 Lena Viktorsson1Magnus Hieronymus1
 Lars Arneborg1
- 1Swedish Meteorological and Hydrological Institute, Norrköping, Sweden
- 2Department of Marine Systems, Tallinn University of Technology, Tallinn, Estonia
Dissolved oxygen in the sea is essential for marine fauna and biogeochemical processes. Decline in the sea water oxygen concentration is considered to be an effect of eutrophication, also exacerbated by climate change. The Baltic Sea is one of the most eutrophic seas in the world and is located in northern Europe. It is a vulnerable, brackish, semi-enclosed sea, suffering from high pressures from human activity. This leads to increased hypoxic and anoxic areas, which can be used as a measure of the environmental state. In the present study the extent of anoxic (O2 < 0 ml l–1) and hypoxic (O2 < 2 ml l–1) areas were estimated for the autumns in 1960–2019 using vertical profiles of observed oxygen concentrations in the Baltic proper and four sub-areas of the Baltic proper: the Bornholm Basin, the western, northern and eastern Gotland basins. From vertical profiles of observed salinity, the annual average of the halocline depths in the four sub-basins were estimated. The results imply regime shifts toward increased anoxic area extents in the Gotland basins around the turn of the 20th century. In autumn 2018, the extent of anoxic bottom areas in the Baltic Sea was record high since the start of the data series. During the later part of the studied period the depths of the halocline coincide with the depth of the hypoxia in the Gotland basins. This implies that in these basins a worst-case scenario for the extent of hypoxic areas seems to be reached.
Introduction
Deoxygenation has become a worldwide marine environment issue (Breitburg et al., 2018) and more than 400 dead zones have been identified since the mid-20th century (Rabalais et al., 2007; Diaz and Rosenberg, 2008; Murphy et al., 2011; Strokal and Kroeze, 2013; Su et al., 2017). The spread of hypoxia (low oxygen) and anoxia (no oxygen) areas in coastal waters is mainly due to eutrophication caused by nutrient enrichment from intensified agriculture and waste-water discharges since the mid-20 century (Rabalais et al., 2010).
Eutrophication and expansion of hypoxic areas will likely exacerbate in a warmer future climate (Altieri and Gedan, 2015; Breitburg et al., 2018). The increased temperature has effects on processes such as microbial respiration and oxygen solubility. Projections from climate models show, e.g., that high precipitation areas will become even wetter in the future (IPCC, 2013, 2019). Increased discharge of freshwater and thus, nutrient loads to coastal seas may enhance primary production and sedimentation of organic matter, which may amplify mineralization and oxygen consumption in deeper layers. Climate change may also affect the hypoxic/anoxic areas by modifying inflow dynamics and/or vertical mixing processes for deep, isolated, water masses and by that the transport of oxygen to these layers. The bottom water oxygen conditions affect the nutrient exchange in the sediment-water interface (Sundby et al., 1992; Viktorsson et al., 2013; Bonaglia et al., 2014) and a deficiency may lead to a “vicious circle” due to increased phosphorus release and nitrogen removal (Vahtera et al., 2007).
The brackish, semi-enclosed Baltic Sea in the northern Europe (Figure 1) is one of the most eutrophic seas in the world (Kemp et al., 2009; HELCOM, 2018). Carstensen et al. (2014) concluded that the increased hypoxia during the last century was driven by increased anthropogenic nutrient supply from land. Measures have been taken to reduce eutrophication, which not yet have had significant effects.
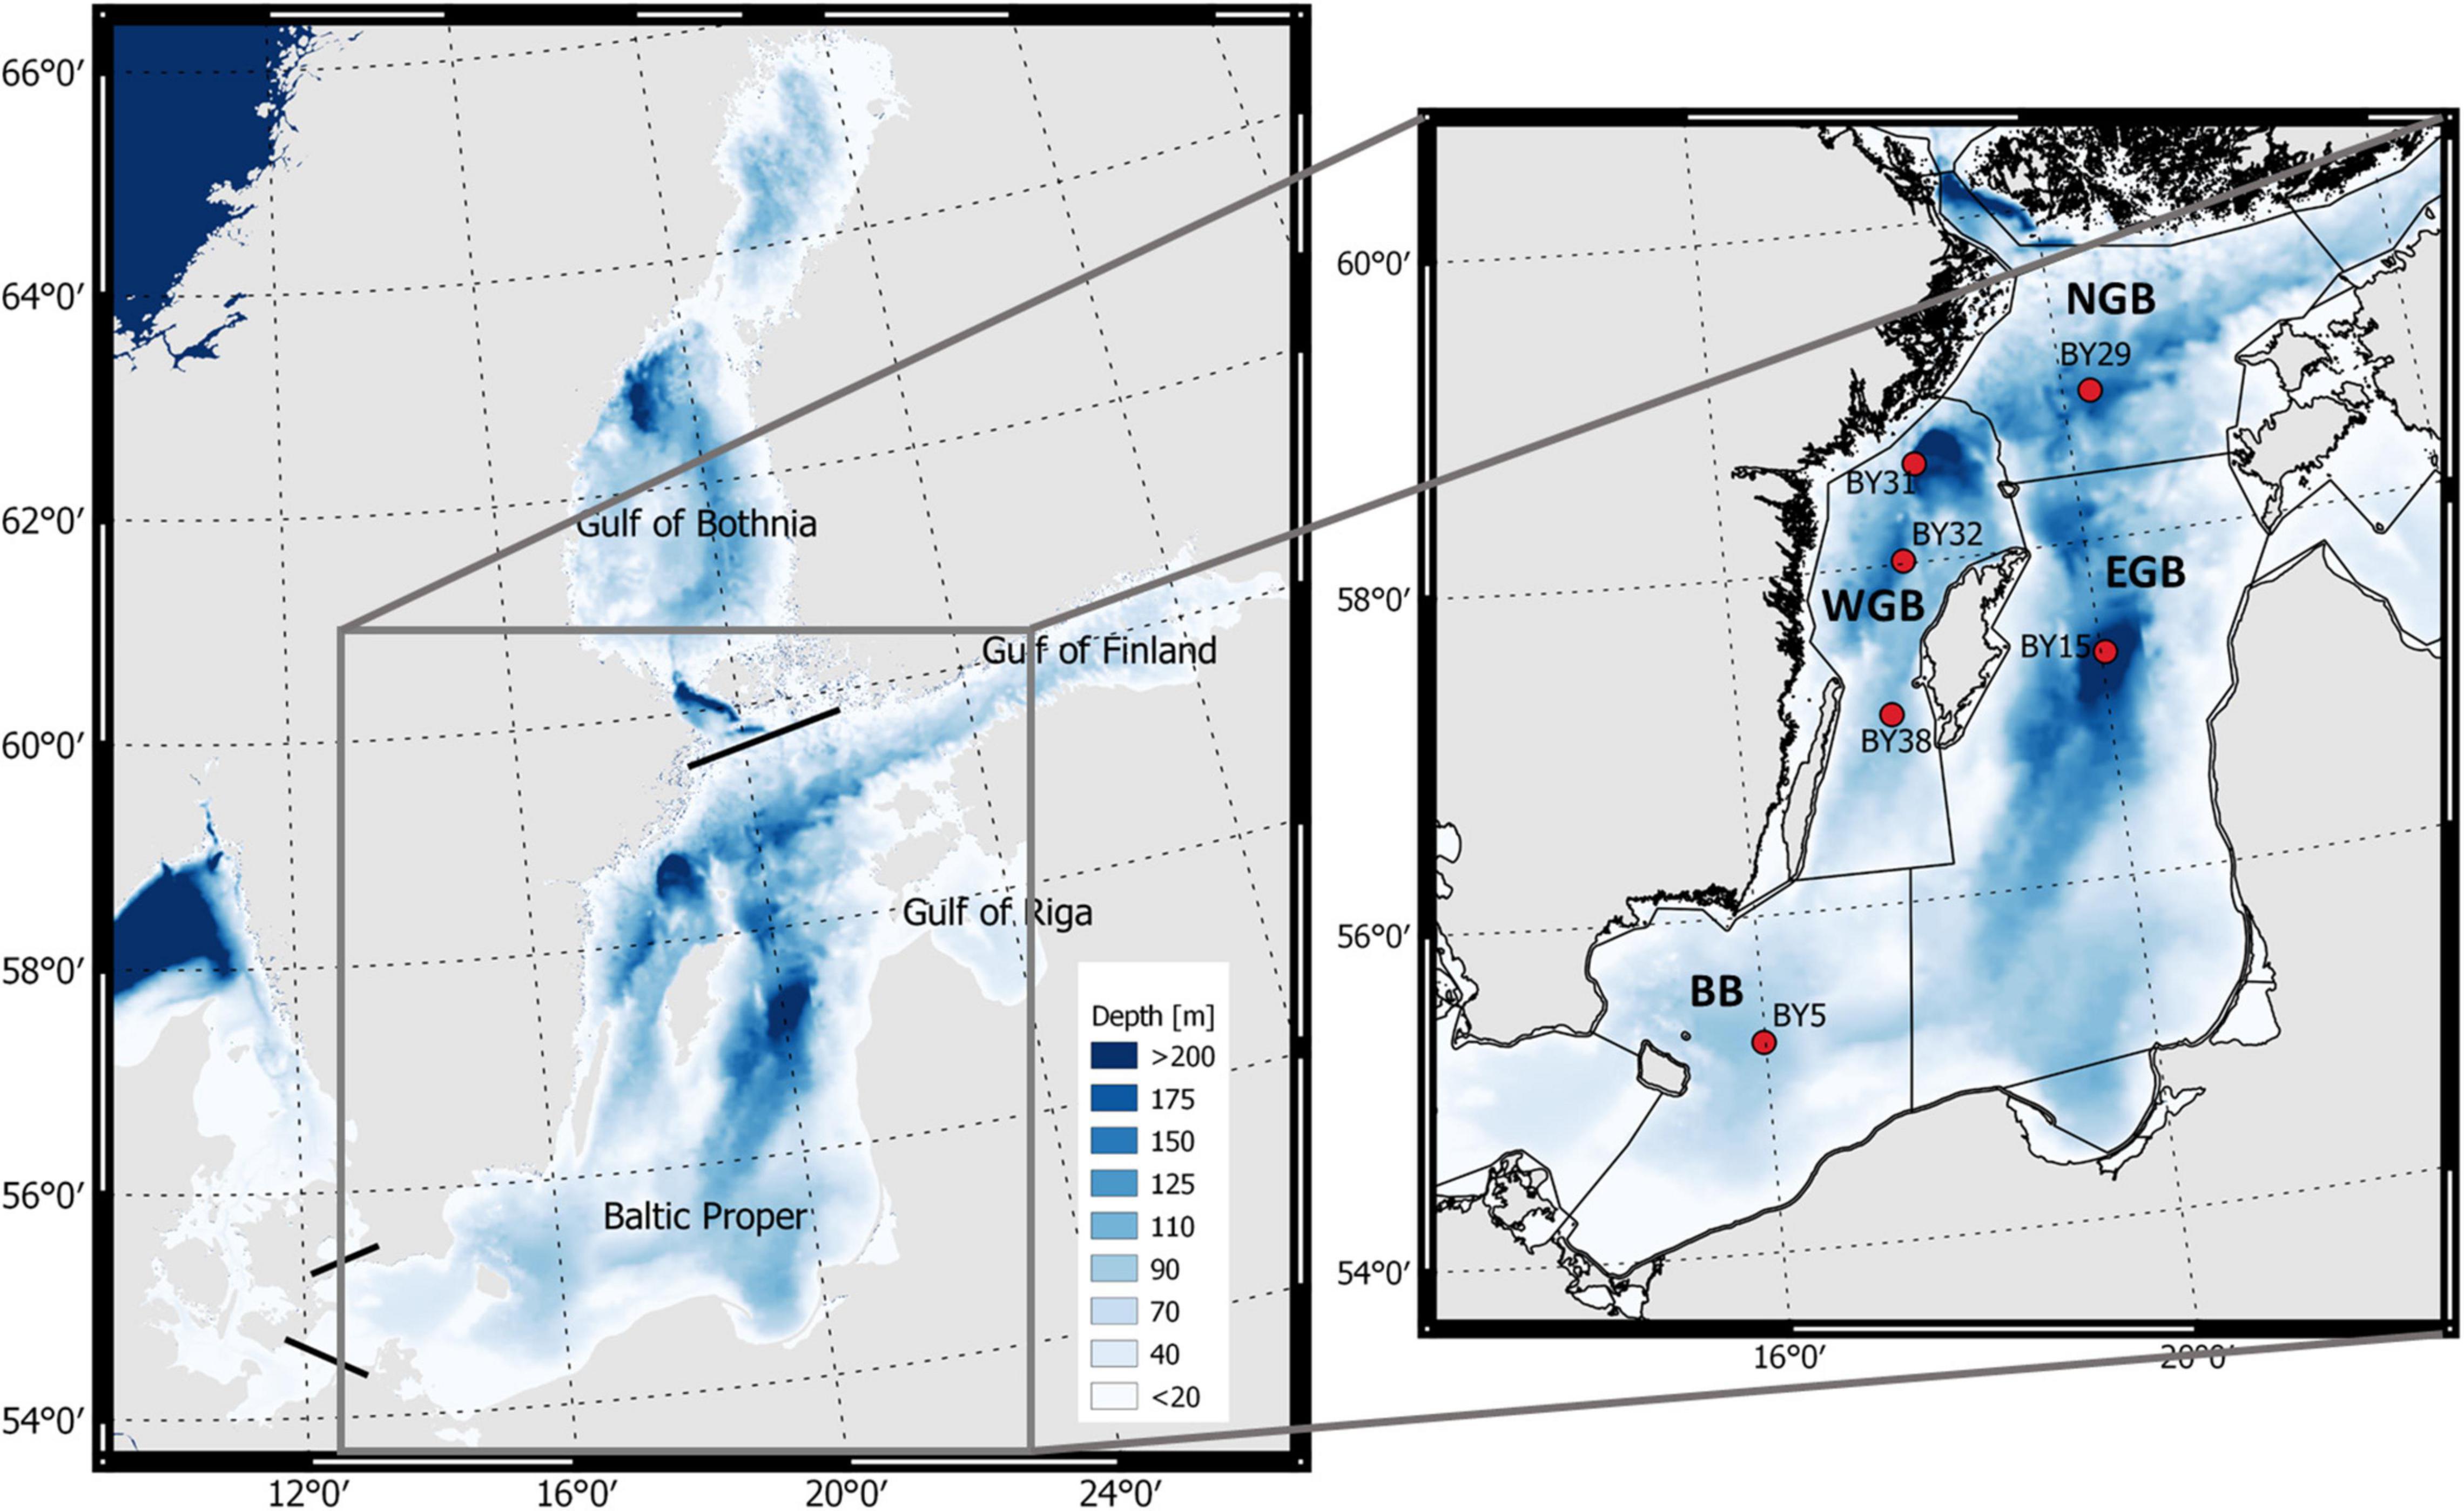
Figure 1. The Baltic Sea (left) with the Baltic proper as defined in the present study with the bathymetry as blue color (color bar). The four sub-basins (right) are separated by black lines and monitoring stations are shown as red filled circles. The monitoring station BY5 is situated in the Bornholm Basin (BB); station BY15 in the eastern Gotland Basin (EGB); stations BY31, BY32, and BY38 in the western Gotland Basin (WGB); and station BY29 in the northern Gotland Basin (NGB).
The vertical mixing between oxygenated surface water and the deep water in the Baltic proper (Figure 1) is limited by a permanent halocline at about 60–80 m depth (Stigebrandt, 1987). Therefore, the main supply of oxygen to the deeper parts comes with inflows of saltier sea water through the shallow straits connecting the Baltic Sea with the North Sea. With irregular frequency Major Baltic Inflows (MBI) may occur (Matthäus and Franck, 1992) and oxygenate larger areas in the deepest parts of the sea.
The bottom water oxygen condition is an important measure of the environmental state. We therefore estimate the temporal change in extent of anoxic and hypoxic areas in the Baltic proper. Partly, this has previously been studied using re-analyses 3D-model data (Kõuts et al., 2021). However, in the present study we divide the Baltic proper into sub-basins and use longer time-series of observational data. Division into sub-basins is important to ecological studies, e.g., recruitment of cod. The relation between the area extents and the halocline depth is also investigated and increases in bottom water temperature.
Methods
Anoxic and Hypoxic Areal Extents
Autumn is the most severe period for the low oxygen conditions in the Baltic Sea and therefore we focus on this period. The Baltic Sea is divided into 17 different sub-basins (HELCOM, 2018). We focus on (1) the Baltic proper (where the main problems with hypoxia and anoxia are found), here defined by the sub-basins Arkona Basin, Bornholm Basin, eastern, western and northern Gotland basins, Gdansk Bay, Gulf of Riga, and Gulf of Finland as in Hansson et al. (2019), as well as (2) the four sub-basins Bornholm Basin (BB), and eastern (EGB), western (WGB), and northern (NGB) Gotland basins in which the shallowest areas closest to land are not included (Figure 1).
Observed oxygen data for the Baltic proper of autumn (August-October) was extracted for the period 1960–2019 from the public database of The International Council for the Exploration of the Sea (ICES) Dataset on Ocean Hydrography1. Data from the year 1961 and 1967 was excluded for the deeper Gotland basins due to lack of measurements.
The vertical profiles of oxygen concentration were used to examine the occurrence of autumn hypoxic (<2 ml l–1) and anoxic (<0 ml l–1) (Diaz and Rosenberg, 1995) bottom areas for the different sub-basins. The requirement for the vertical profiles was a minimum of three data points. To locate the depth of the onset of hypoxia and anoxia, an interpolation between discrete measurements in each vertical profile was performed. If no hypoxia or anoxia occurred in the profile, the two deepest measurements were utilized to linearly extrapolate the oxygen concentration toward the bottom (Hansson et al., 2011). If two or more profiles were found within the 3-month period at the same position, an average profile was calculated. A quality check of the data set was performed with the result that a few vertical profiles at a few stations were not included in the analysis, due to e.g., missing data in the deep water or not reliable data. The depths of the hypoxia and anoxia were then gridded with linear interpolation (Delaunay triangulation) between sampling stations and surfaces representing hypoxia and anoxia were developed. The surfaces were then extrapolated sideways and finally compared with bathymetry data (Seifert et al., 2001) to exclude areas where the estimated depths of hypoxia and anoxia were greater than the actual water depth. The bottom areas affected by hypoxia and anoxia were then calculated for all autumns during the period in each basin, except for 1961 and 1967 as described above. Using this method, the bottom areas defined as hypoxic also include the anoxic areas. The hypoxic and anoxic areas for the different sub-basins are described in relation (%) to the maximum areas of the different sub-basins, which varies from 24,100 to 63,830 km2 (Supplementary Table 1). The hypsographic profiles, specifying the area as function of depth, for the different sub-basins was extracted from the Baltic Sea Bathymetry Database (Baltic Sea Hydrographic Commission, 2013).
To detect possible significant regime shifts in anoxic and hypoxic areal extent, the mean values during the period were analyzed for changepoints using MATLAB findchangepts algorithm. These changepoints are defined to minimize the sum of the residual (squared) error from the local mean in the two periods it separates. Thus, the changepoint splits the data into two parts, where the departure from the local mean in each part is minimized. This method has been used in several studies within different disciplines (e.g., Maikranz et al., 2020; Khodaverdi et al., 2021). As a secondary test we verified that these or very similar changepoints were detectable with a Mann–Whitney test with paired sliding windows (Trauth et al., 2009). We also used the MATLAB findchangepts to analyze bottom water temperature data for changepoints in the corresponding sub-basins. The temperature data were extracted from the Swedish archive for oceanographic data (SHARK)2 for the same period as above.
Halocline Depth and Strength
Annual averages of the halocline depths and the halocline strengths were compiled using the data series (1961–2007) from Väli et al. (2013) with addition of new estimates for the years 2008–2019 using sea water salinity data from monitoring stations extracted from SHARK. The vertical resolution of the extracted salinity data was 0.5 m. We used the monitoring stations: BY5 to represent the Bornholm Basin; BY15 to represent the eastern Gotland Basin; BY32 to represent the western Gotland Basin; and BY29 to represent the northern Gotland Basin (Figure 1).
The halocline depth was defined as the vertical location of the maximum salinity gradient, calculated using the difference between the salinities in two vertically neighboring grid cells divided by the distance between these grid cells. The same definition for the halocline depth has been used in the Baltic Sea by Elken et al. (2006), Meier (2007), and Väli et al. (2013). The vertical salinity gradient might have a secondary maximum due to large freshwater input during spring. Therefore, the seasonal halocline is excluded from the analysis by searching the maxima only from below the 30-m depth and downward thus, focusing only on the perennial halocline of the sea. The size of the areas at the depth of the haloclines in the sub-basins were extracted from the same hypsographic profiles as used above (see section “Anoxic and Hypoxic Areal Extents”).
Results
Extent of Anoxic and Hypoxic Area in the Baltic Proper
The areal extents of anoxic and hypoxic bottom waters (August–October, 1960–2019) were larger in the later part of the period (Figures 2A, 3). The record high (since 1960) anoxic bottom area in 2018 covered 24% (60,600 km2) of the total area in the Baltic proper. The hypoxic area extent in 2018 that covered about 33% (84,600 km2) of the Baltic proper bottom area was only seen once before, in autumn 2007 (Figure 2A, Hansson et al., 2019).
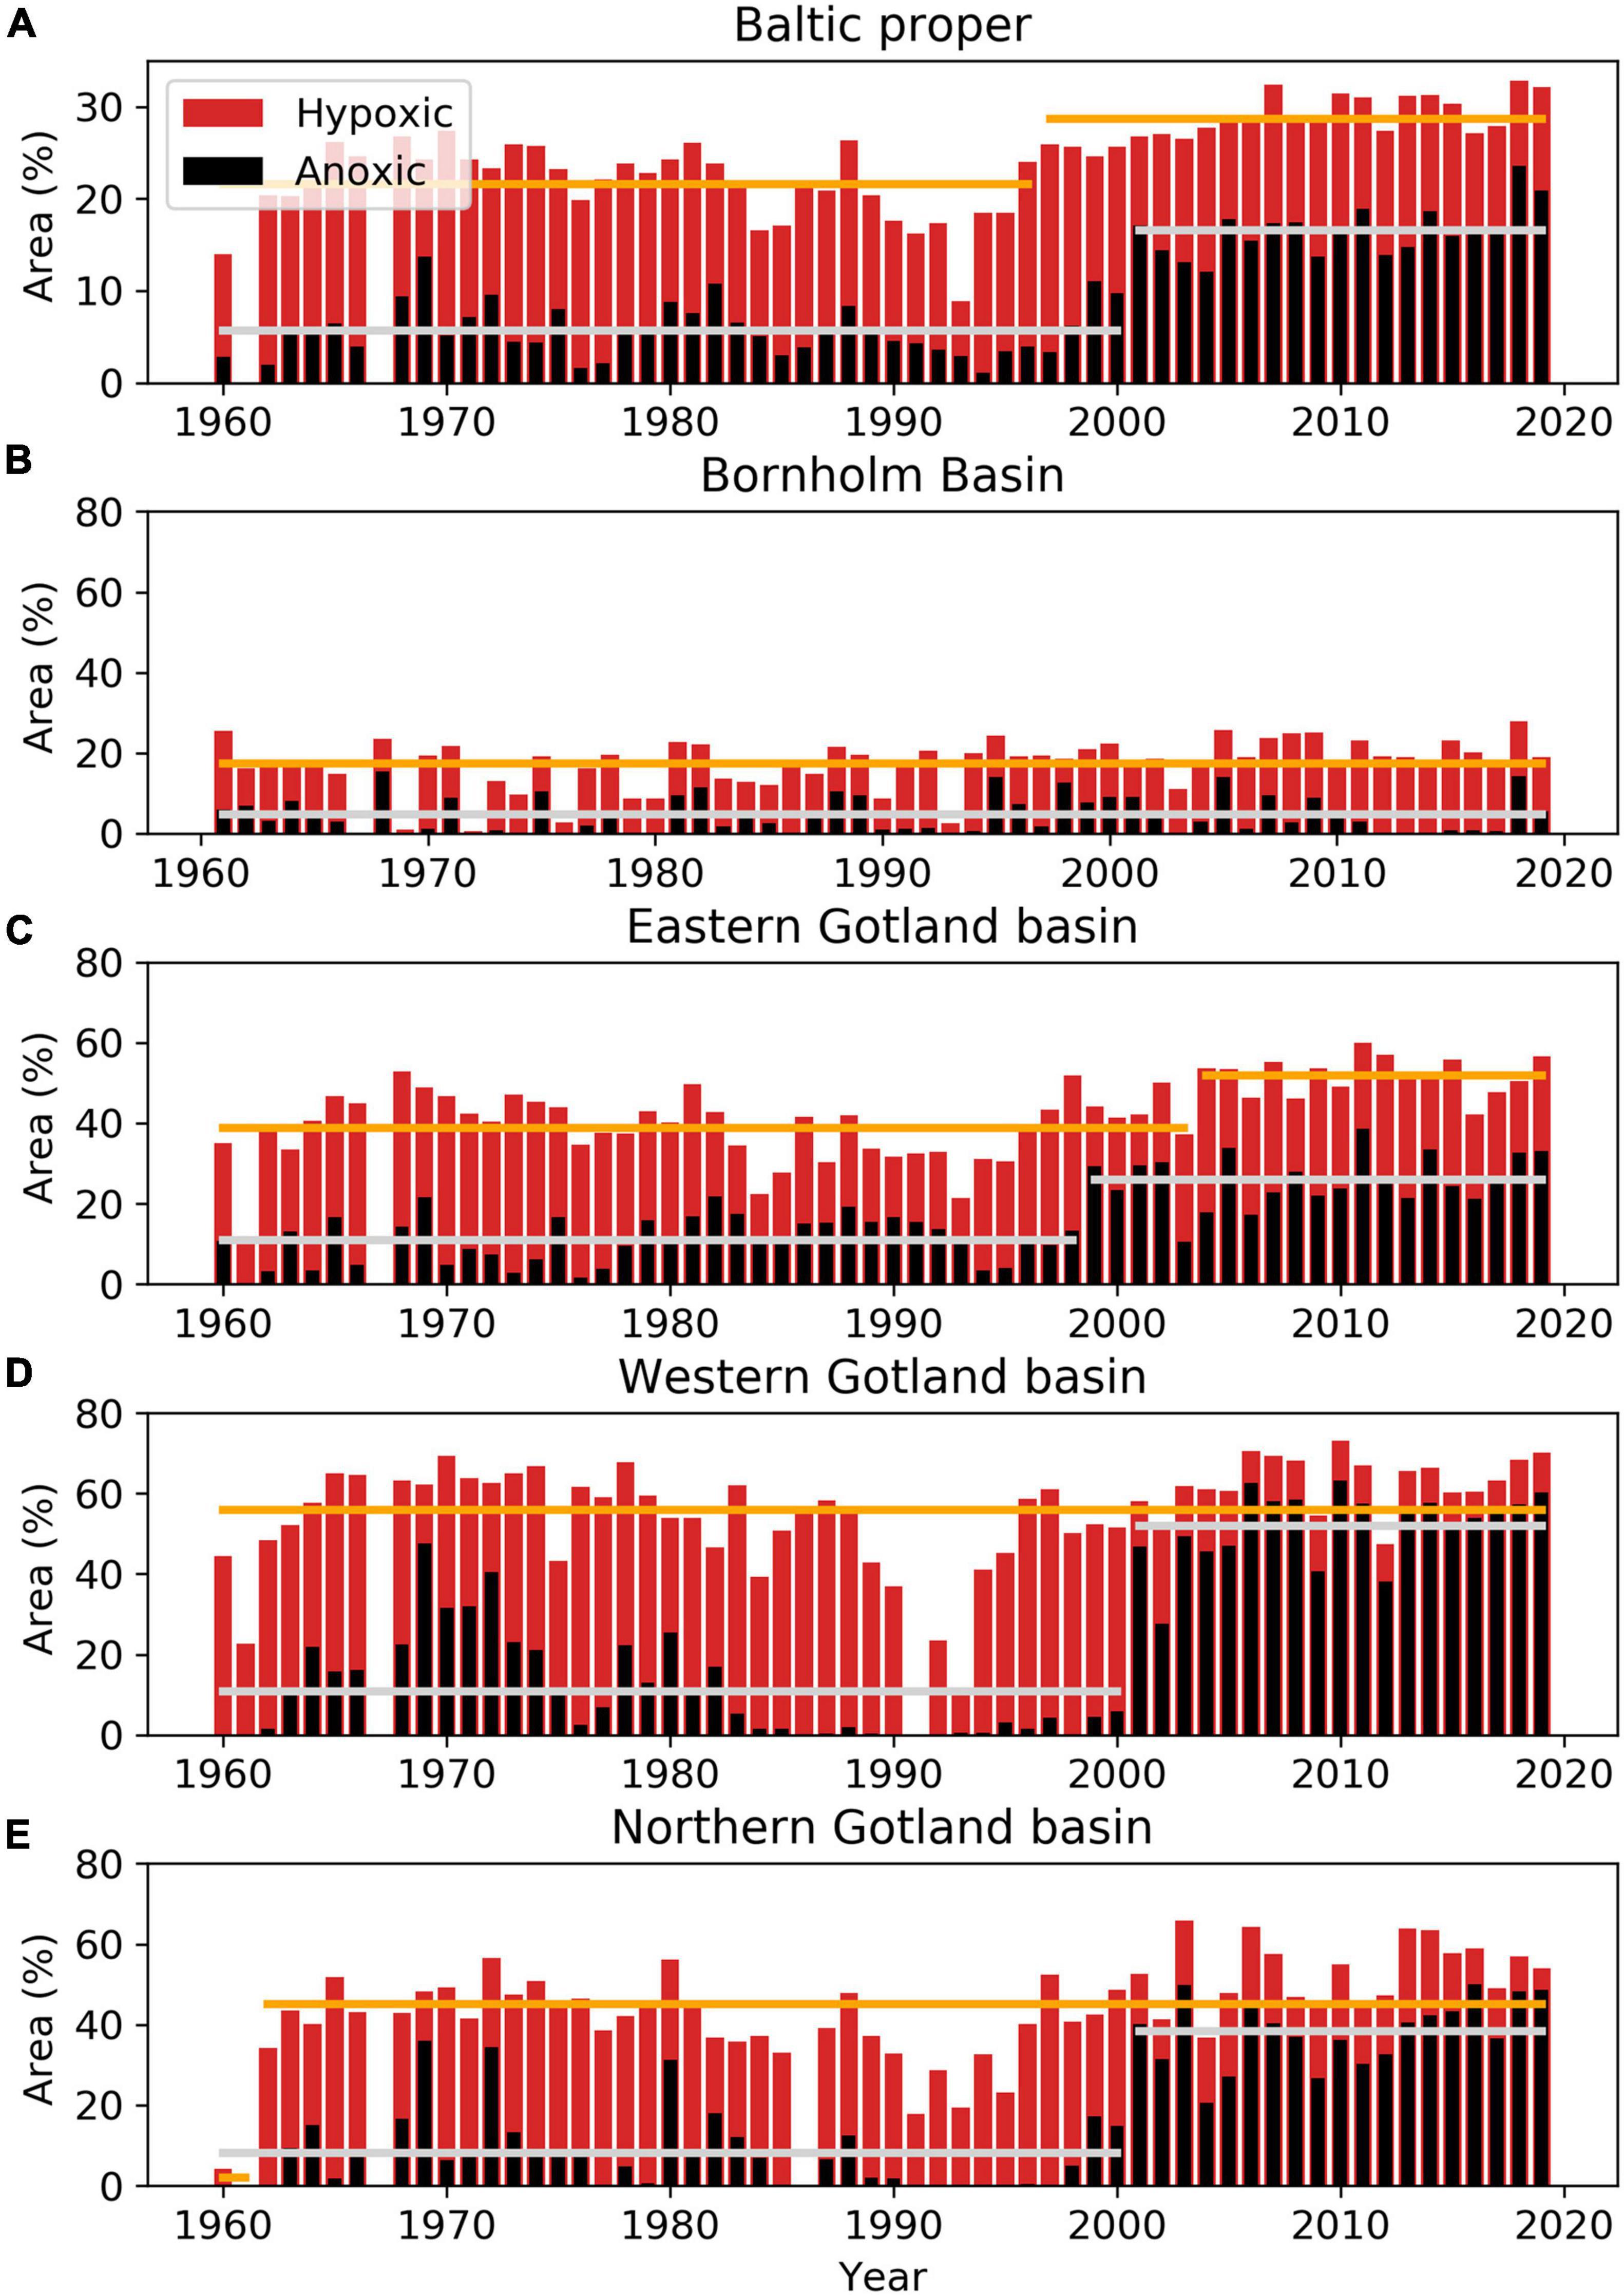
Figure 2. The yearly proportions (%) of the total bottom areas overlaid with anoxic (black) and both hypoxic and anoxic (red) bottom water during the period 1960–2019 in the Baltic proper, which includes the Arkona Basin, Bornholm Basin, eastern, western and northern Gotland basins, Gulf of Finland, Gulf of Riga, and Gdańsk Bay (A) and the four sub-basins; the Bornholm Basin (B), eastern (C), western (D), and northern (E) Gotland basins. The long-term means (solid lines) of anoxic (gray) and hypoxic (orange) area extents are shown for the periods before and after identified changepoints representing regime shifts.
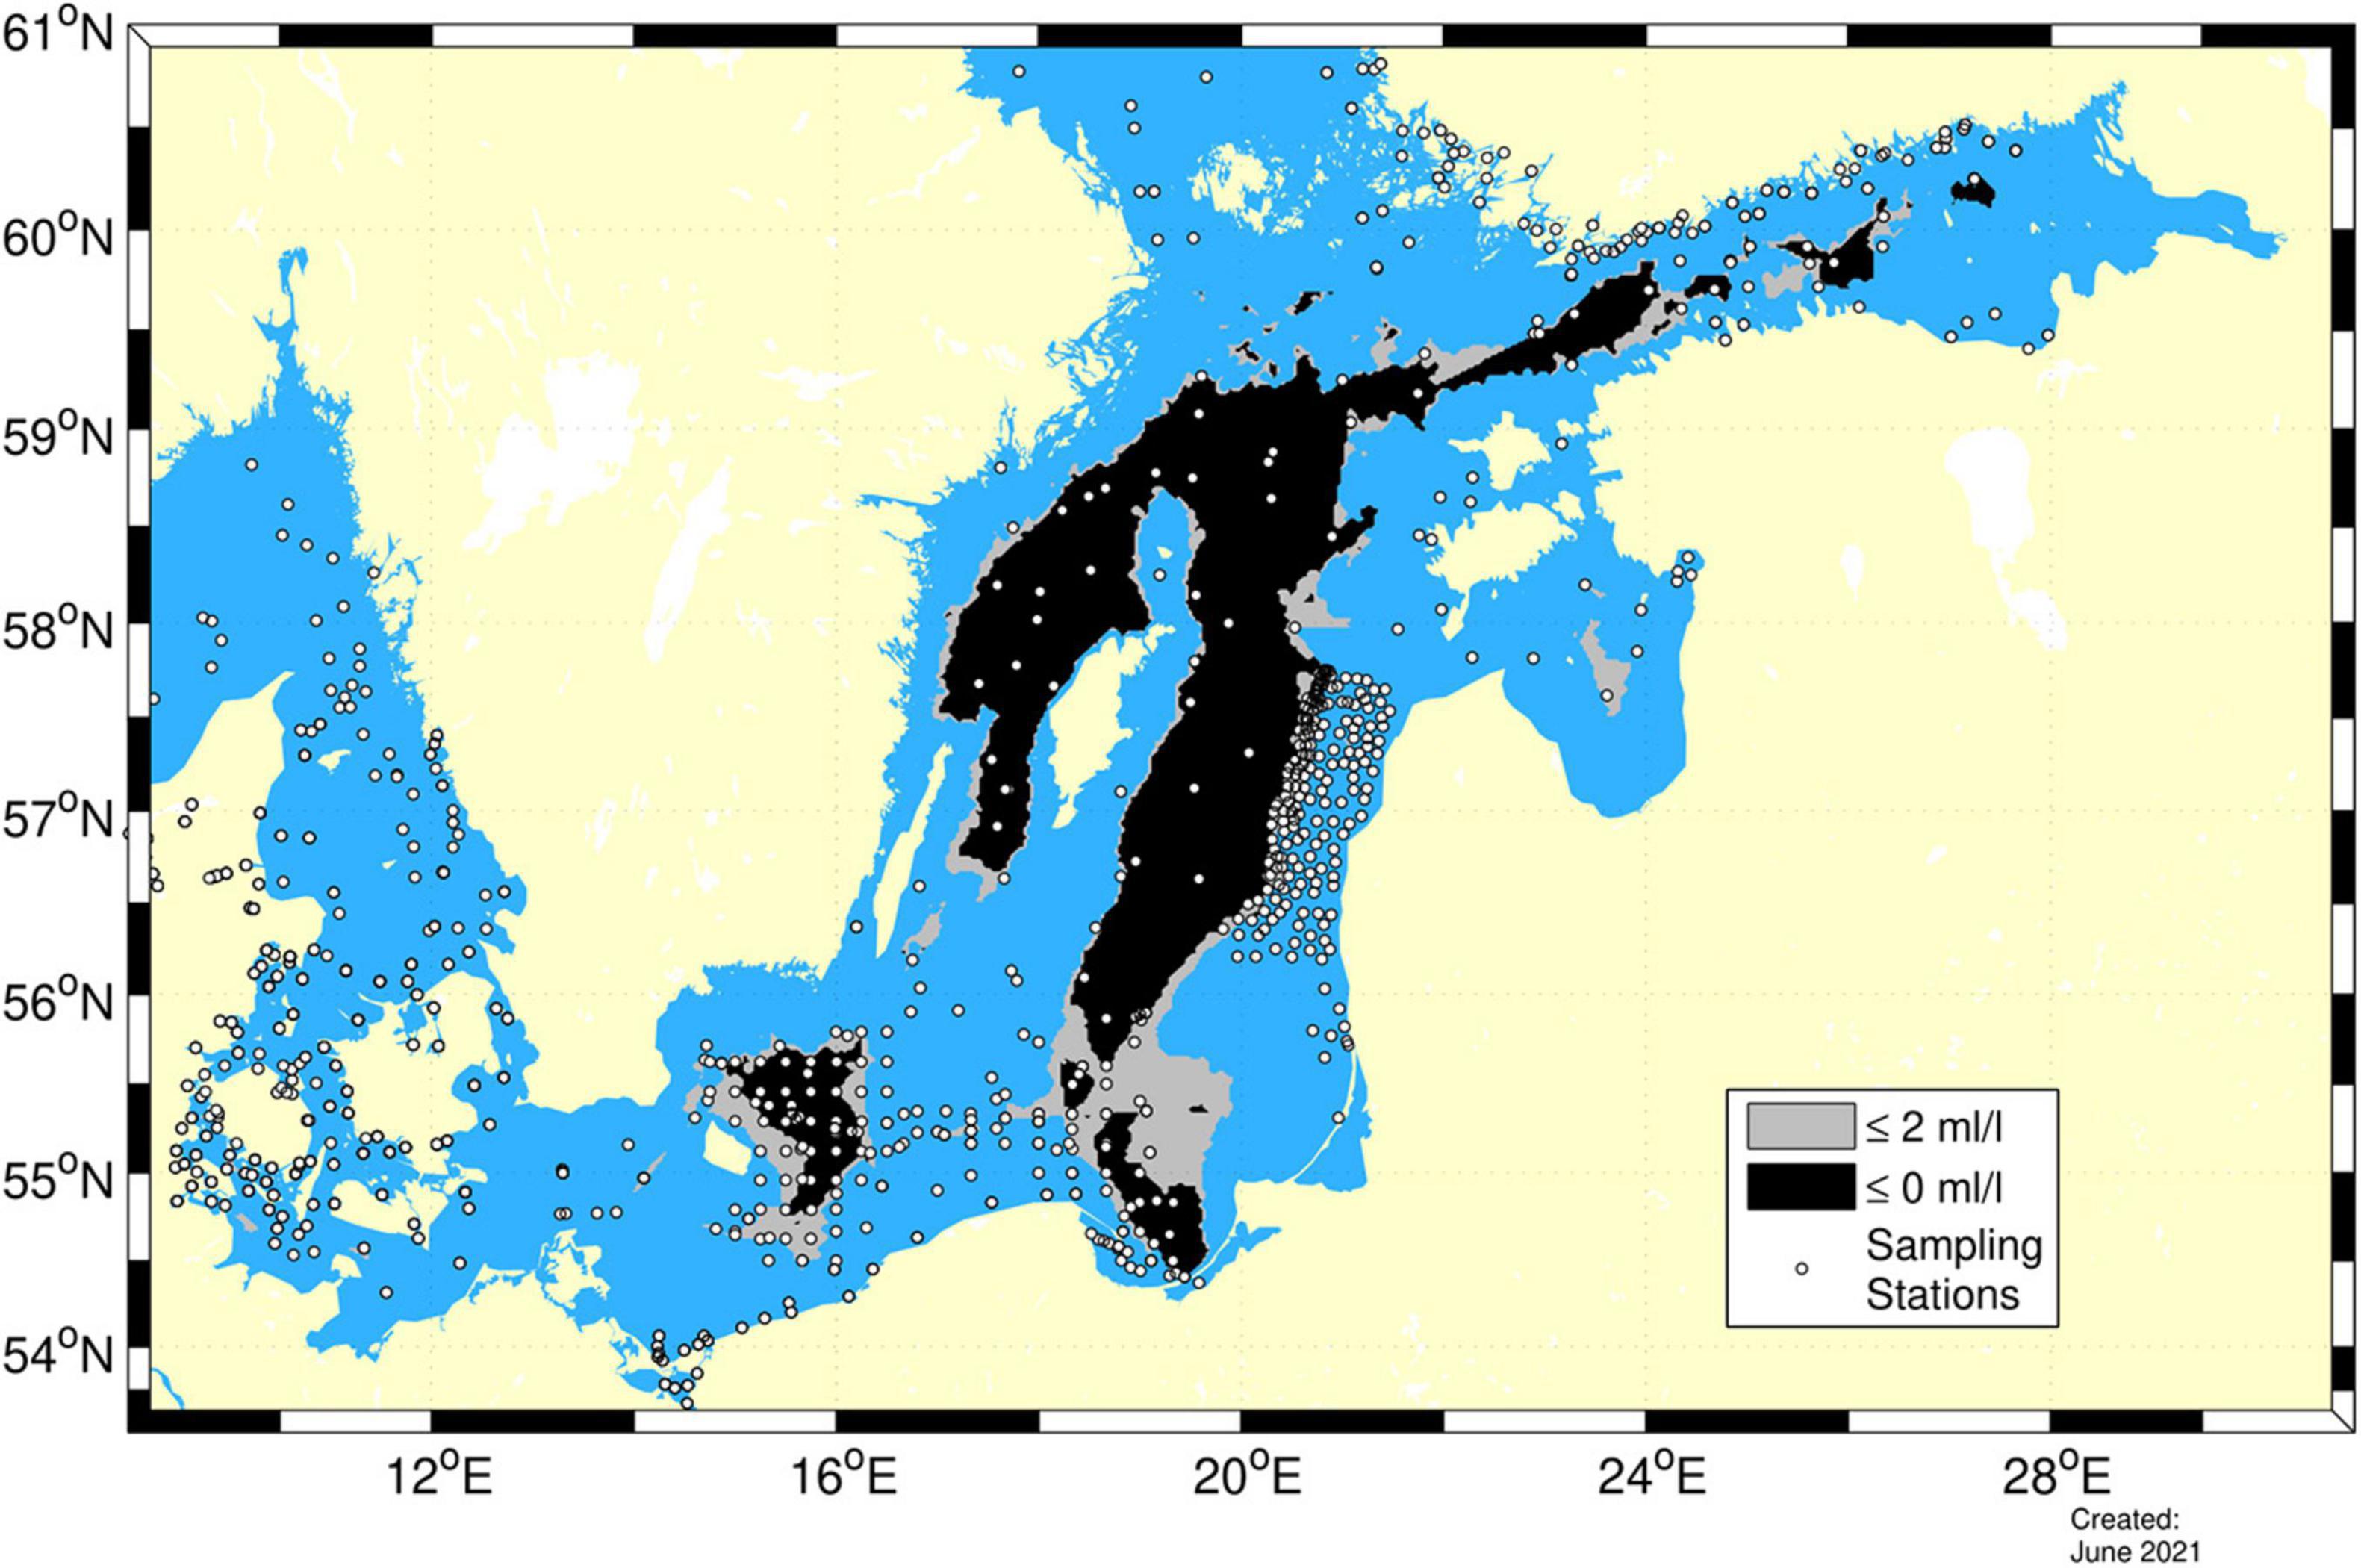
Figure 3. The total area extent calculated from observations (white dots) of anoxic (black) and hypoxic (gray) bottoms in the Baltic proper in autumn 2018. The figure is modified from Hansson et al. (2019).
Extent of Anoxic and Hypoxic Areas in Sub-Basins
In the Bornholm Basin the area extent with anoxic bottom water varies between 0 and 15% of the total bottom area during the period, with no significant trend (Figure 2B). In 2018, about 14% of the bottom area was covered with anoxic bottom water. This was the second largest extent during the period, only exceeded in 1968 (15.4%). The mean anoxic area extent for the entire period was about 5% (standard deviation 4.5), corresponding to an area of 1,580 km2 (Supplementary Table 1).
In the three Gotland basins, years with large anoxic area extent are relatively more frequent in the end of the period compared to the beginning. The largest anoxic area extents in: (i) the eastern Gotland Basin, 39% (about 24,600 km2), were found in 2011 (Figure 2C); (ii) the western Gotland Basin, 60–63% (about 15,000 km2), were found in 2006, 2010, and 2019 (Figure 2D); and (iii) in the northern Gotland Basin, 48–50% (about 13,000 km2), were found in 2003, 2016, 2018, and 2019 (Figure 2E). In the -80’s and -90’s, several years without anoxia occurred in the western and northern Gotland basins.
The areas covered by hypoxic waters in the Gotland basins indicate rather similar extents during the beginning and the end of the period. The exception is seen in the late-80’s to mid-90’s when there were reductions of both anoxic and hypoxic areas (Figure 2). The Bornholm Basin has a weak increasing trend (not shown) of areas covered by hypoxic bottom water and there is no obvious reduction in the -90’s comparable to the Gotland basins, only a temporary decrease in 1993.
Regime Shifts in Extent of Anoxic and Hypoxic Areas
In the Baltic proper, changepoints in 1997 and 2001 indicate regime shifts in the hypoxic and anoxic area extent, respectively. The long-term mean hypoxic area extent before 1997 (about 22%) increased to about 29% after 1997. This regime shift corresponds to an increase of the mean hypoxic area with about 18,000 km2. The long-term mean anoxic area extent increased from 6% before 2001 to 17% after 2001 (Figure 2A). This corresponds to an increase of mean anoxic area with about 28,300 km2.
Similar regime shifts in the anoxic area extent occurred in the eastern Gotland Basin in 1999, and in western and northern Gotland basins in 2001 (Figures 2C–E). The mean anoxic area extent increased from 11, 11, and 8% in the first regime, to 26, 52, and 38% in the second regime in the eastern, western and northern Gotland basins, respectively. All changepoints were also clearly visible in a Mann–Whitney test with paired sliding windows (Trauth et al., 2009) (not shown). No significant changepoint was found in the Bornholm Basin (Figure 2B).
A changepoint for the hypoxic area extent is detected in 2004 for the eastern Gotland but no significant changepoints are detected for the western Gotland Basin nor the Bornholm Basin (Figure 2). The changepoint for the hypoxic area extent in 1962 for the northern Gotland Basin (Figure 2) will not be discussed since the first regime is based on only one data point.
Halocline Depth
In the Bornholm Basin the average halocline depth for the entire period is 59 m and varies between 45 and 67 m (Figure 4A). Shallowest halocline depth of 45 m was estimated for 2019. In the eastern, western, and northern Gotland basins the average halocline depths are between 71 and 76 m and vary between 64 and 94 m, 58 and 82 m, and 61 and 92 m, respectively. In the 80’s and -90’s the halocline depths were deeper, especially in the eastern and northern Gotland basins (Figures 4B,D). This deepening coincides with lower salinity and weaker halocline strength at the depth of the halocline (Supplementary Figure 1).
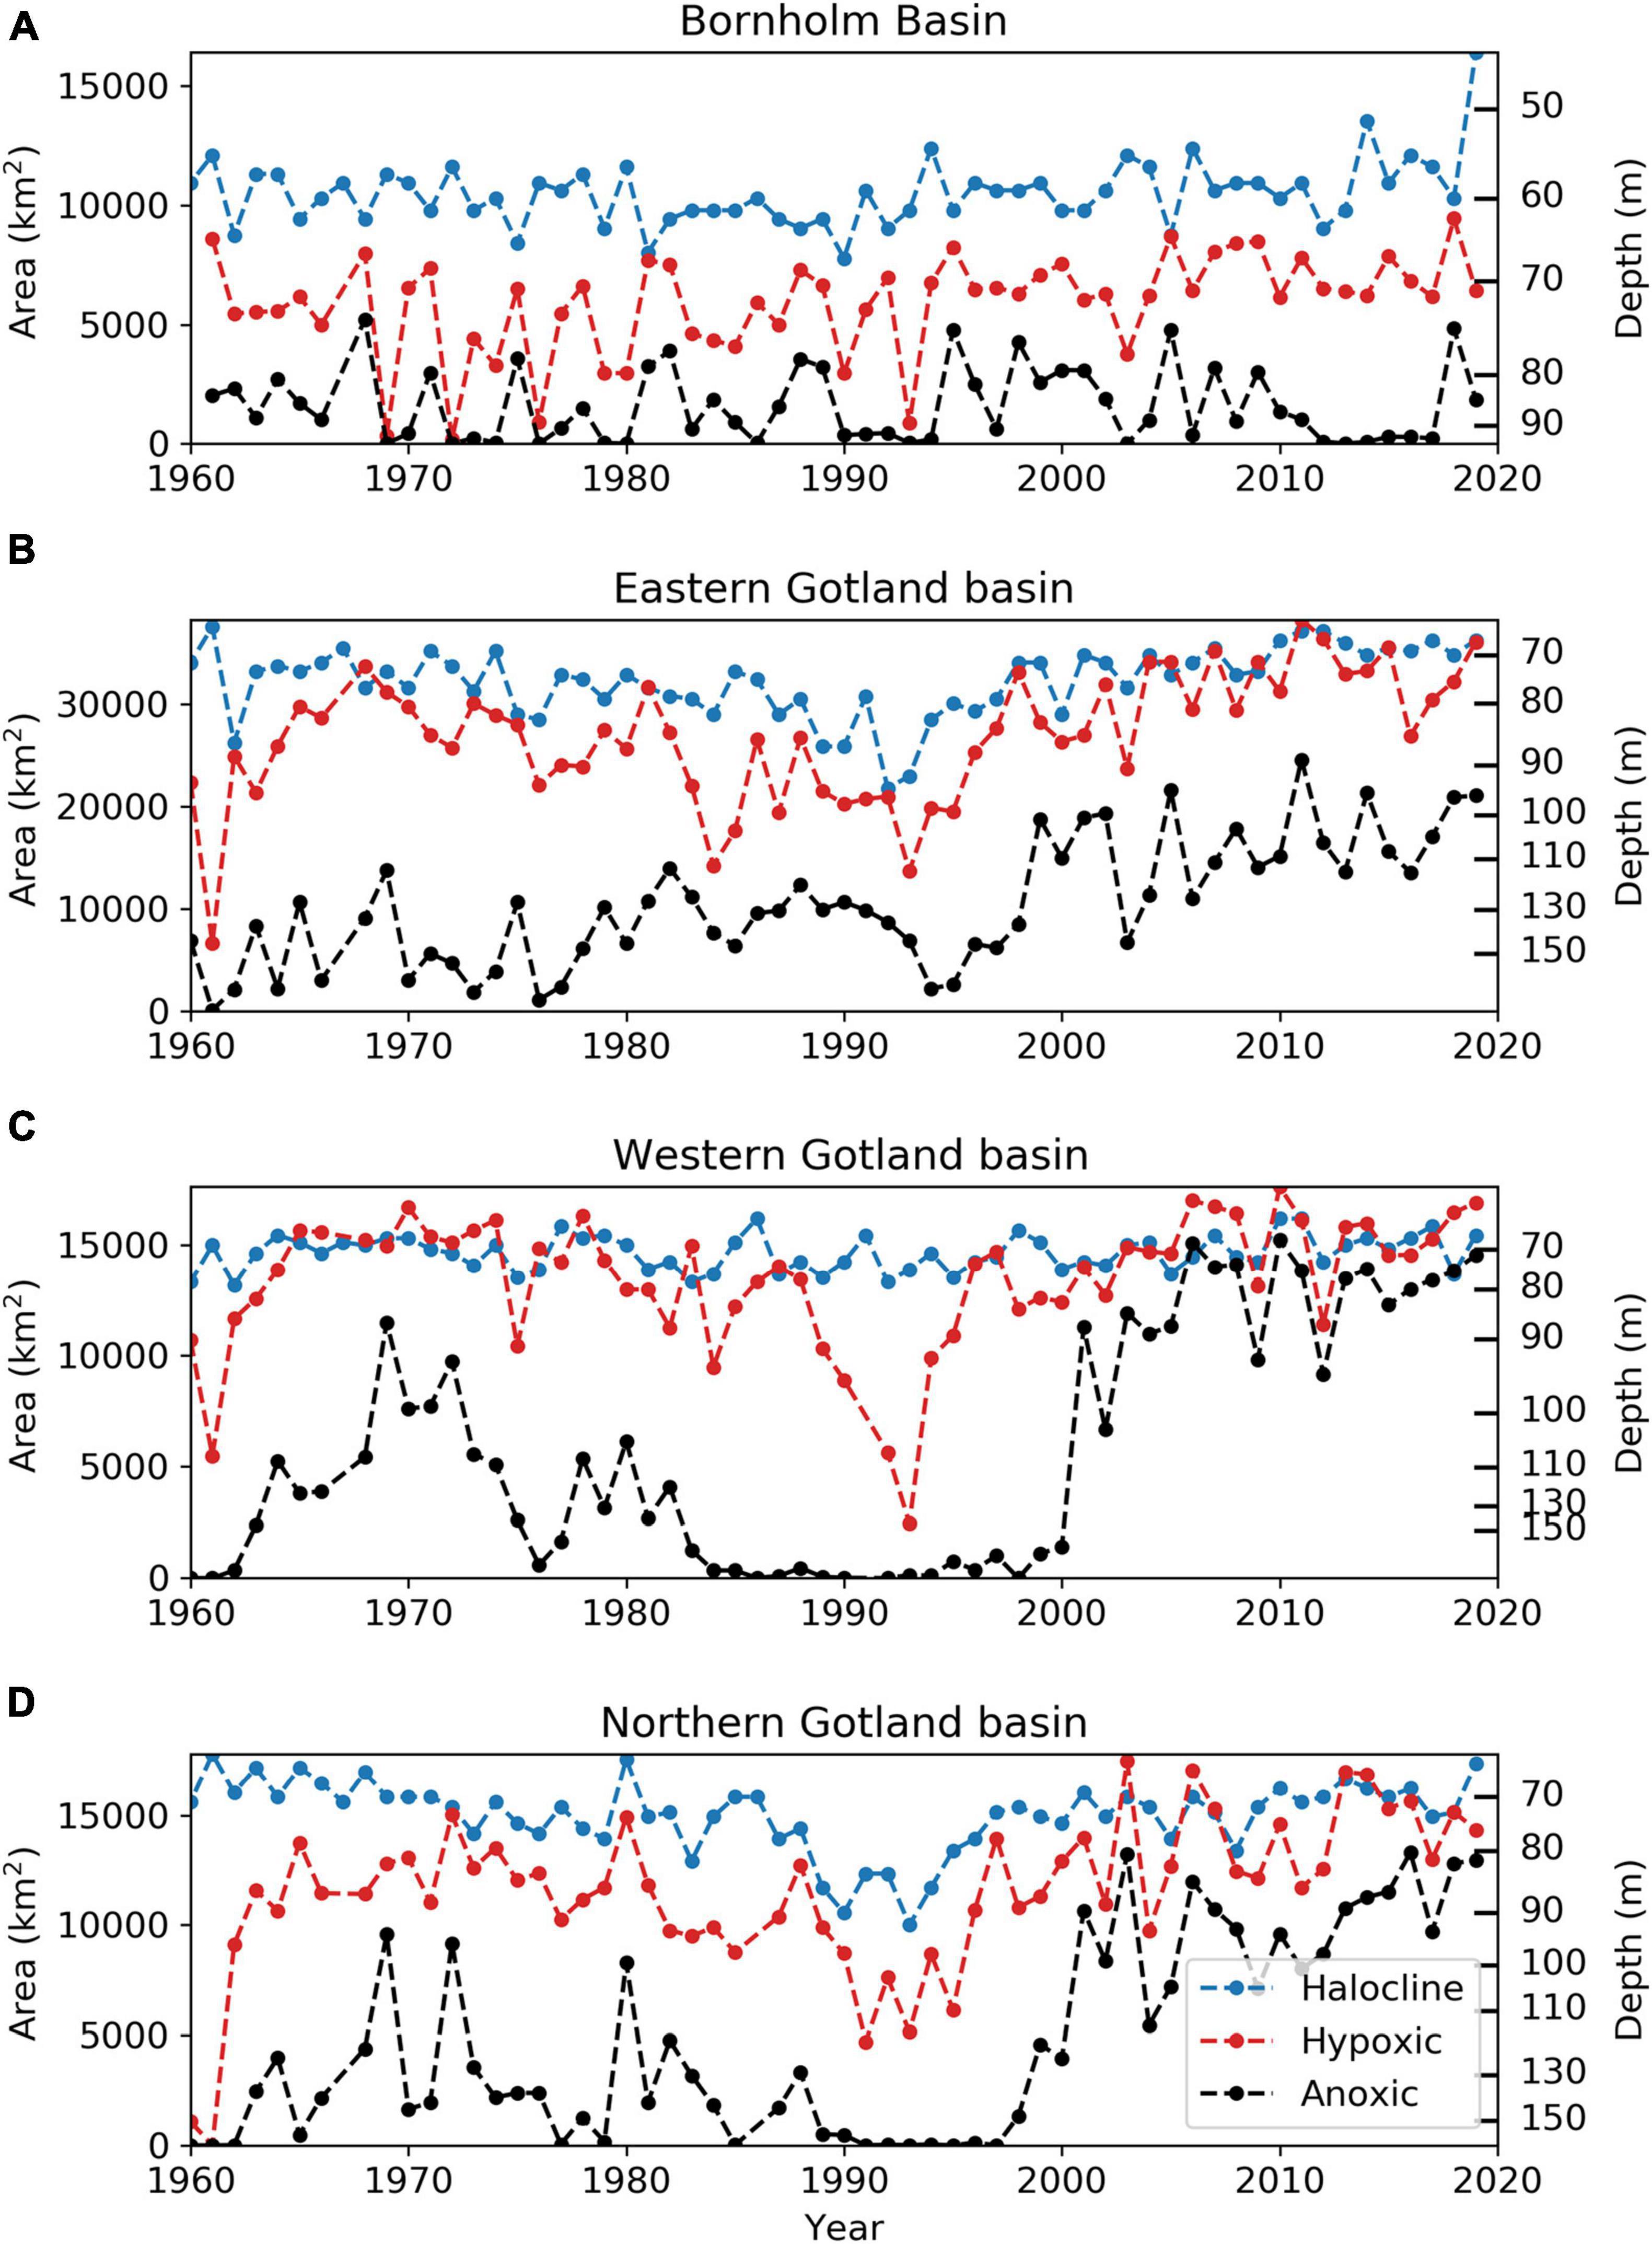
Figure 4. The depth (m, right y-axis) of the halocline (blue) and corresponding area (km2, left y-axis) with time (year), plotted together with the hypoxic (red) and anoxic (black) area extents (km2), and corresponding depths (m), in the Bornholm Basin (A), eastern Gotland Basin (B), northern Gotland Basin (C), and western Gotland Basin (D). Hypsographic profiles are used for transformation between areas and depths.
The hypoxic area in the Bornholm Basin is much smaller than the horizontal surface area at the halocline depth indicating that hypoxia occurs well below the depth of the halocline during the entire period (Figure 4A). Anoxia occurs even deeper. There is a weak significant trend of a shallowing halocline (p-value < 0.5) and increasing hypoxic area (p-value < 0.005).
The correlation between the halocline depths and the hypoxic area extent in the Gotland basins are high (p-value < 0.0001, not shown). The hypoxic areas often coincide with the horizontal areas at the halocline depth (Figures 4B–D). This is the case in the western Gotland Basin during almost the entire period, with exception for the 90’s when there is a decline in hypoxic area extent (Figure 4C). Anoxia is found deeper in the beginning of the period compared to the later part. The change toward increased anoxic area extents and shallower occurrences in the later part of the period is large and almost stepwise. The depth of anoxia is very close to both the halocline and hypoxia during the second regime. In the eastern and northern Gotland basins the occurrence of anoxia has not reached the halocline depth yet (Figures 4B,D).
Discussion
Ventilation of the Baltic Sea Deep Water
Deep water oxygen deficiency evolves when the rates of respiration are higher than the oxygen supply. The supply mainly occurs with inflows from the Kattegat through the sounds and through vertical mixing from above. The density of inflowing water and its mixing with less saline ambient water on the path toward the Baltic Sea regulates the depth of intrusion. Smaller inflows occur more frequently but do not penetrate as deep or flow as far east as the rare and irregular Major Baltic inflows (MBI). MBI’s are of large importance for the environmental state of the entire Baltic Sea and have the capability to replace hypoxic and anoxic deep water with oxygen rich water (Matthäus et al., 2008).
During the period of this study (1960–2019) one extreme MBI occurred in 2014, and several medium to strong inflows occurred, e.g., in 1969, 1972, 1975, 1982/1983, 1993, and 2003 (Fischer and Matthäus, 1996; Mohrholz, 2018) that also increased the deep-water salinity. Although the MBI’s renew the deeper water oxygen, they also increase the stratification and raise the halocline. The rise of the halocline increases the bottom areas and the volume of water isolated from the wind mixed, oxygenated surface layers in winter. Thus, the bottom areas that have potential to become hypoxic or anoxic are larger after an inflow when the halocline is at a shallower depth. There were expectations that the extreme MBI in 2014 that reached the eastern Gotland Basin (Hall et al., 2017) would oxygenate the deep water in the Baltic Sea after a long time of oxygen deficiency. However, the increased oxygen levels in the central Baltic proper quickly declined (Hylén et al., 2021), and instead of contributing to a long-term improvement of the oxygen conditions in the deep water, the anoxic and hypoxic area reached an all-time high extent in the Baltic proper in 2018.
It should be noted that the estimations of the area extents do not account for potentially water layers with oxic water below any anoxic or hypoxic intermediate layers. Those can emerge from inflow events when the denser and more oxygen rich water from an MBI reaches the deep water and the old oxygen poor bottom water is lifted to levels above. As a result, an intermediate layer with low oxygen concentrations or even hydrogen sulfide in the water can be found above oxic/hypoxic waters. This was the case for the MBI 2014, when an anoxic water layer was observed in July 2015 in the eastern Gotland Basin at about 100–140 m depth (Hylén et al., 2021). Below the anoxic layer the water was hypoxic down to the bottom. Therefore, there is a risk that our method slightly overestimates the anoxic areas at these rare events. However, these deeper oxic/hypoxic zones are problematic for most benthic species because they are trapped below an anoxic or hypoxic layer that prevents migration and recolonization.
Regime Shifts in the Extent of Anoxic and Hypoxic Area
A possible regime shift in the levels of anoxic area extent in the Baltic proper have previously been reported by Hansson et al. (2011) and Kõuts et al. (2021) to occur in 1999. In the present study, we added observation data from another 9 years to the analysis by Hansson et al. (2011) and included data prior to 1993 compared to the model study by Kõuts et al. (2021). According to the analysis of our longer time series a regime shift in the anoxic area extent occurred in 2001. We additionally identified a regime shift in the hypoxic area extent in 1997. The hypoxic area extent of 22% in the first regime corresponds to about 56,600 km2, which is somewhat larger than the previously estimated hypoxic area of 49,000 km2 for approximately the same period (Conley et al., 2009). The increase of average anoxic areas with 28,300 km2 between the two regimes is more severe compared to the increase of hypoxic areas of 18,000 km2.
The regime shift in anoxic area extent for the Baltic proper around the turn of the 20th century is also seen in the Gotland basins, but not in the Bornholm Basin. In the western Gotland Basin on average 12,500 km2, or about 50% of the basin area became anoxic in the second regime.
Väli et al. (2013) estimated halocline depths for the period 1961–2007 from observations at standard depths. We extended the period until 2019 and included data with higher vertical resolution (0.5 m). Present depth ranges are therefore better constrained and the largest difference was found in the Bornholm Basin where the shallowest halocline depth was 45 m instead of the previous 55 m.
The deeper halocline (Figure 4) and the decrease in salinity and halocline strength in the end of the 1980’s (not shown) could be a result of the lack of inflows during this period (Fischer and Matthäus, 1996; Mohrholz, 2018) as well as increased freshwater supply (Stigebrandt and Gustafsson, 2007; Johansson, 2016). The regime shifts in the anoxic area extents in the Gotland basins coincides with the time when the frequency of larger inflows increased again (Mohrholz, 2018).
We identified regime shifts also for the bottom water temperature: in Bornholm Basin in 1997, and in eastern, western and northern Gotland basins in 1998, 2003, and 2000, respectively (Supplementary Figure 2) thus, all around the turn of the 20th century. The average temperature increase is about one degree Celsius in all sub-basins which indicates that the inflows during the latter regime were warmer than before. Increased water temperature may result in less dissolved oxygen as the gas solubility decreases with increased temperature. Increased temperature may also cause increased oxygen consumption since biological process rates are elevated with increasing temperature. Meier et al. (2018) concludes that oxygen consumption has increased after the latest MBI’s. However, their model results suggest it’s mainly due to increased transport of organic material to the deep as a result of entrainment of organic-rich surface water during inflows, rather than an increased temperature effect.
The regime shift toward increased anoxic area extent can be a result of a combination of coincident causes. (1) Historically, high loads of nutrients accumulated in the Baltic Sea, leading to severe eutrophication and frequent large blooms of cyanobacteria. A large pool of nutrients, especially phosphorus, has built up in the sediment leading to increased recycling of the mobile fractions and less efficient burial as the anoxic area extent increases, the so called “vicious circle” (Vahtera et al., 2007). Increased reflux of phosphorus from the sediment back to the water column would change the N/P-molar balance giving nitrogen fixing cyanobacteria prerequisites to increase, leading to larger surface blooms and larger transport of organic material sinking to the sediment consuming oxygen. (2) The period with a low frequency of inflows during the 80’s, later followed by several larger inflows rising the halocline increases the area that potentially can be oxygen deficient and puts fuel on the vicious circle as anoxic area extent increases. (3) An increased temperature in the inflowing bottom water, which partly is due to climate change, but also is influenced by a shift of the Atlantic Multidecadal Oscillation (AMO) from a cold phase in the last decades of the 20th century to a warm phase since then (Kniebusch et al., 2019).
Worst-Case Reached?
Assuming that winter mixing will restore oxygen in the waters above the halocline, in a worst-case scenario the hypoxic and/or anoxic water would reach a maximum extent filling up the entire volume below and partly within the halocline. This is actually the present state of the Gotland basins (Figure 4) where the depth of hypoxia coincides with the halocline depth for many of the years in the second regime. It should be noted that the estimation of the halocline depths is based on the data from one monitoring station in each basin and represents an annual mean while the estimations of hypoxic and anoxic area extension includes all available quality controlled vertical profiles of autumn oxygen data. In the beginning of the period, in the eastern and northern Gotland basins, the depths of hypoxia are deeper than the halocline depths for most of the years. In the western Gotland Basin, on the other hand, the hypoxia is approximately on the same level as the halocline also before the 90’s. Thus, the worst-case scenario for hypoxia can be considered to be fulfilled for a large number of the years, especially at the end of the period in the Gotland basins. This would mean that the hypoxic area extent could be limited by the depth of the halocline and not get any worse. A shallower halocline might cause a worsening, but we find no clear evidence in the literature of changing halocline depths due to e.g., climate change. Halocline depth is most strongly controlled by the sill depth at the western entrance of the Stolpe Channel (Elken et al., 2006; Väli et al., 2013), with secondary effects from inflows, winter storms mixing as well as buoyancy from fresh water runoff.
The anoxic area extent is in the second regime still found at depths 10–30 m below the halocline depth. Thus, the worst-case scenario with hypoxia completely replaced by anoxia is not yet reached.
Conclusion
Regime shifts in the Baltic proper of the anoxic and hypoxic area extent occurred in 2001 and in 1997, respectively. This is seen as significant increases in the long-term averages of anoxic and hypoxic area extents, which divides the time series into two regimes in the Baltic proper. Regime shifts for anoxia were also identified in the individual sub-basins in 1999, 2001, and 2001 for the eastern, western and northern Gotland basins, respectively. For hypoxic areas there was a regime shift detected in 2004 in the eastern Gotland Basin. In the Bornholm Basin there were no regime shifts detected at all. There were also regime shifts detected for the bottom water temperature as the average long-term temperature increased with about 1°C in all the sub-basins at about the turn of the 20’s century. Regime shifts toward more anoxic conditions is probably caused by a combination of coincident causes such as long-term eutrophication, changed frequencies of major Baltic inflows, change in freshwater supplies and increased bottom water temperatures.
Record high coverage of the anoxic area extent was reached in autumn 2018, when about 24% of the Baltic proper bottoms were covered with anoxic water. Also, the hypoxic area extent was high this year, covering about 33% of the bottom area, which is one of the highest coverages since 1960.
The worst-case scenario for hypoxia can be considered to be fulfilled for a large number of years, especially at the end of the period in the Gotland basins. For anoxia, on the other hand, the depth of anoxia is still some 10–30 m below the depth of the halocline.
Data Availability Statement
The datasets presented in this study can be found the online repository: 10.5281/zenodo.5571723.
Author Contributions
EA-R coordinated the work, made all the graphs, and wrote the main draft of the manuscript with substantial contributions from IW. EA-R, IW, and PA formulated the first draft of the concept for the study. MHa and LV compiled all oxygen data and produced the maps. PA compiled salinity and temperature data. GV performed the halocline depth calculations. MHi performed the estimations of the regime shifts. KE and LA contributed substantially to improvements of the text. All authors contributed to the scientific discussions and text.
Funding
This work was financed by the ClimeMarine project, funded by the Swedish Research Council for Sustainable Development (Formas) within the framework of the National Research Program for Climate (grant 2017-01949). GV was supported by the Estonian Research Council (grant nos. PRG602 and IUT19-6).
Conflict of Interest
The authors declare that the research was conducted in the absence of any commercial or financial relationships that could be construed as a potential conflict of interest.
Publisher’s Note
All claims expressed in this article are solely those of the authors and do not necessarily represent those of their affiliated organizations, or those of the publisher, the editors and the reviewers. Any product that may be evaluated in this article, or claim that may be made by its manufacturer, is not guaranteed or endorsed by the publisher.
Supplementary Material
The Supplementary Material for this article can be found online at: https://www.frontiersin.org/articles/10.3389/fmars.2021.799936/full#supplementary-material
Footnotes
References
Altieri, A. H., and Gedan, K. B. (2015). Climate change and dead zones. Glob. Change Biol. 21, 1395–1406. doi: 10.1111/gcb.12754
Baltic Sea Hydrographic Commission. (2013). Baltic Sea Bathymetry Database Version 0.9.3. Available online at: http://data.bshc.pro/ (accessed June 30, 2017).
Bonaglia, S., Deutsch, B., Bartoli, M., Marchant, H. K., and Brüchert, V. (2014). Seasonal oxygen, nitrogen and phosphorus benthic cycling along an impacted Baltic Sea estuary: regulation and spatial patterns. Biogeochemistry 119, 139–160. doi: 10.1007/s10533-014-9953-6
Breitburg, D., Levin, L. A., Oschlies, A., Gregoire, M., Chavez, F. P., Conley, D. J., et al. (2018). Declining oxygen in the global ocean and coastal waters. Science 359:eaam7240. doi: 10.1126/science.aam7240
Carstensen, J., Conley, D., Bonsdorff, E., Gustafsson, B., Hietanen, S., Janas, U., et al. (2014). Hypoxia in the Baltic Sea: biogeochemical cycles, benthic Fauna, and management. AMBIO 43, 26–36. doi: 10.1007/s13280-013-0474-7
Conley, D., Bjorck, S., Bonsdorff, E., Carstensen, J., Destouni, G., and Gustafsson, B. (2009). Hypoxia-related processes in the Baltic Sea. Environ. Sci. Technol. 43, 3412–3420. doi: 10.1021/es802762a
Diaz, R. J., and Rosenberg, R. (1995). Marine Benthic Hypoxia: A Review of Its Ecological Effects and the Behavioural Responses of Benthic Macrofauna. London: UCL PRESS LTD.
Diaz, R. J., and Rosenberg, R. (2008). Spreading dead zones and consequences for marine ecosystems. Science 321, 926–929. doi: 10.1126/science.1156401
Elken, J., Malkki, P., Alenius, P., and Stipa, T. J. O. (2006). Large halocline variations in the Northern Baltic proper and associated meso-and basin-scale processes. Oceanologia 48, 91–117.
Fischer, H., and Matthäus, W. (1996). The importance of the drogden sill in the sound for major Baltic inflows. J. Mar. Syst. 9, 137–157. doi: 10.1016/S0924-7963(96)00046-2
Hall, P. O. J., Almroth-Rosell, E., Bonaglia, S., Dale, A. W., Hylén, A., Kononets, M., et al. (2017). Influence of natural oxygenation of Baltic proper deep water on benthic recycling and removal of Phosphorus, Nitrogen, Silicon and Carbon. Front. Mar. Sci. 4:27. doi: 10.3389/fmars.2017.00027
Hansson, M., Andersson, L., and Axe, P. O. (2011). Areal extent and volume of anoxia and hypoxia in the Baltic Sea, 1960–2011. Rep. Oceanogr. 42, 1–63.
Hansson, M., Viktorsson, L., and Andersson, L. (2019). Oxygen Survey in the Baltic Sea 2019 - Extent of Anoxia and Hypoxia, 1960-2019”, Report Oceanography. Norrköping: Swedish Meteorological and Hydrological Institute.
HELCOM (2018). State of the Baltic S ea – Second HELCOM holistic assessment 2011-2016”, in: Baltic Sea Environment Proceedings. Available online at: https://helcom.fi/baltic-sea-trends/holistic-assessments/state-of-the-baltic-sea-2018/reports-and-materials/
Hylén, A., van de Velde, S. J., Kononets, M., Luo, M., Almroth-Rosell, E., and Hall, P. O. J. (2021). Deep-water inflow event increases sedimentary phosphorus release on a multi-year scale. Biogeosciences 18, 2981–3004. doi: 10.5194/bg-18-2981-2021
IPCC (2013). “Summary for policymakers,” in Climate Change 2013: The Physical Science Basis. Contribution of Working Group I to the Fifth Assessment Report of the Intergovernmental Panel on Climate Change, eds T. F. Stocker, D. Qin, G.-K. Plattner, M. Tignor, S. K. Allen, J. Boschung, et al. (Cambridge: Cambridge University Press).
IPCC (2019). “Technical summary,” in IPCC Special Report on the Ocean and Cryosphere in a Changing Climate, eds H.-O. Pörtner, D. C. Roberts, V. Masson-Delmotte, M. T. P. Zhai, E. Poloczanska, K. Mintenbeck, et al. (Geneva: IPCC).
Johansson, J. (2016). Total and Regional Runoff to the Baltic Sea. HELCOM Baltic Sea Environmental Fact Sheet. Available online at: https://helcom.fi/media/documents/BSEFS_Total-and-regional-runoff-to-the-Baltic-Sea-in-2015.pdf (accessed September, 2020).
Kemp, W., Testa, J., Conley, D., Gilbert, D., and Hagy, J. (2009). Temporal responses of coastal hypoxia to nutrient loading and physical controls. Biogeosciences 6, 2985–3008.
Khodaverdi, A., Erlöv, T., Hult, J., Reistad, N., Pekar-Lukacs, A., Albinsson, J., et al. (2021). Automatic threshold selection algorithm to distinguish a tissue chromophore from the background in photoacoustic imaging. Biomed. Opt. Express 12, 3836–3850. doi: 10.1364/BOE.422170
Kniebusch, M., Meier, H. E. M., Neumann, T., and Börgel, F. (2019). Temperature variability of the Baltic Sea since 1850 and attribution to atmospheric forcing variables. J. Geophys. Res. Oceans 124, 4168–4187. doi: 10.1029/2018JC013948
Kõuts, M., Maljutenko, I., Elken, J., Liu, Y., Hansson, M., Viktorsson, L., et al. (2021). Recent regime of persistent hypoxia in the Baltic Sea. Environ. Res. Commun. 3:075004. doi: 10.1088/2515-7620/ac0cc4
Maikranz, E., Spengler, C., Thewes, N., Thewes, A., Nolle, F., Jung, P., et al. (2020). Different binding mechanisms of Staphylococcus aureus to hydrophobic and hydrophilic surfaces. Nanoscale 12, 19267–19275. doi: 10.1039/D0NR03134H
Matthäus, W., and Franck, H. (1992). Characteristics of major Baltic inflows—a statistical analysis. Cont. Shelf Res. 12, 1375–1400. doi: 10.1016/0278-4343(92)90060-w
Matthäus, W., Nehring, D., Feistel, R., Nausch, G., Mohrholz, V., and Lass, H.-U. (2008). “The inflow of highly saline water into the Baltic Sea,” in State and Evolution of the Baltic Sea, eds R. Feistel, G. Nausch, and N. Wasmund (Hoboken, NJ: John Wiley & Sons, Inc), 265–309. doi: 10.1002/9780470283134.ch10
Meier, H. E. M. (2007). Modeling the pathways and ages of inflowing salt- and freshwater in the Baltic Sea. Estuar. Coast. Shelf Sci. 74, 610–627.
Meier, H. E. M., Väli, G., Naumann, M., Eilola, K., and Frauen, C. (2018). Recently accelerated oxygen consumption rates amplify deoxygenation in the Baltic Sea. J. Geophys. Res. Oceans 123, 3227–3240. doi: 10.1029/2017JC013686
Mohrholz, V. (2018). Major Baltic inflow statistics – revised. Front. Mar. Sci. 5:384. doi: 10.3389/fmars.2018.00384
Murphy, R. R., Kemp, W. M., and Ball, W. P. (2011). Long-term trends in chesapeake bay seasonal hypoxia, stratification, and nutrient loading. Estuar. Coast. 34, 1293–1309. doi: 10.1007/s12237-011-9413-7
Rabalais, N. N., Diaz, R. J., Levin, L. A., Turner, R. E., Gilbert, D., and Zhang, J. (2010). Dynamics and distribution of natural and human-caused hypoxia. Biogeosciences 7, 585–619. doi: 10.5194/bg-7-585-2010
Rabalais, N. N., Turner, R. E., Sen Gupta, B. K., Boesch, D. F., Chapman, P., and Murrell, M. C. (2007). Hypoxia in the northern Gulf of Mexico: does the science support the plan to reduce, mitigate, and control hypoxia? Estuar. Coast. 30, 753–772. doi: 10.1007/Bf02841332
Seifert, T., Tauber, F., and Kayser, B. (2001). “A high resolution spherical grid topography of the Baltic Sea,” in Poster at the Baltic Sea Science Congress, #147, (Stockholm).
Stigebrandt, A. (1987). A model for the vertial circulation of the Baltic deep water. J. Phys. Oceanogr. 17, 1772–1785. doi: 10.1175/1520-04851987017<1772:AMFTVC<2.0.CO;2
Stigebrandt, A., and Gustafsson, B. G. (2007). Improvement of Baltic proper water quality using large-scale ecological engineering. AMBIO 36, 280–286. doi: 10.1579/0044-7447(2007)36[280:iobpwq]2.0.co;2
Strokal, M., and Kroeze, C. (2013). Nitrogen and phosphorus inputs to the Black Sea in 1970-2050. Region. Environ. Change 13, 179–192. doi: 10.1007/s10113-012-0328-z
Su, J. Z., Dai, M. H., He, B. Y., Wang, L. F., Gan, J. P., Guo, X. H., et al. (2017). Tracing the origin of the oxygen-consuming organic matter in the hypoxic zone in a large eutrophic estuary: the lower reach of the Pearl River Estuary, China. Biogeosciences 14, 4085–4099. doi: 10.5194/bg-14-4085-2017
Sundby, B., Gobeil, C., Silverberg, N., and Mucci, A. (1992). The phosphorus cycle in coastal marine sediments. Limnol. Oceanogr. 37, 1129–1145.
Trauth, M. H., Larrasoana, J. C., and Mudelsee, M. (2009). Trends, rhythms and events in plio-pleistocene African climate. Quat. Sci. Rev. 28, 399–411. doi: 10.1016/j.quascirev.2008.11.003
Vahtera, E., Conley, D. J., Gustafsson, B. G., Kuosa, H., Pitkänen, H., Savchuk, O. P., et al. (2007). Internal ecosystem feedbacks enhance nitrogen-fixing cyanobacteria blooms and complicate management in the Baltic Sea. AMBIO 36, 186–194. doi: 10.1579/0044-7447(2007)36[186:iefenc]2.0.co;2
Väli, G., Meier, H. E. M., and Elken, J. (2013). Simulated halocline variability in the Baltic Sea and its impact on hypoxia during 1961–2007. J. Geophys. Res. Oceans 118, 1–19. doi: 10.1002/2013JC009192
Keywords: anoxic area, hypoxic area, halocline depth, oxygen concentration, major baltic inflow, eutrophication, Baltic Sea
Citation: Almroth-Rosell E, Wåhlström I, Hansson M, Väli G, Eilola K, Andersson P, Viktorsson L, Hieronymus M and Arneborg L (2021) A Regime Shift Toward a More Anoxic Environment in a Eutrophic Sea in Northern Europe. Front. Mar. Sci. 8:799936. doi: 10.3389/fmars.2021.799936
Received: 22 October 2021; Accepted: 29 November 2021;
Published: 24 December 2021.
Edited by:
Wei-Bo Chen, National Science and Technology Center for Disaster Reduction (NCDR), TaiwanReviewed by:
Sabine Schmidt, Centre National de la Recherche Scientifique (CNRS), FranceLech Kotwicki, Institute of Oceanology, Polish Academy of Sciences (PAN), Poland
Copyright © 2021 Almroth-Rosell, Wåhlström, Hansson, Väli, Eilola, Andersson, Viktorsson, Hieronymus and Arneborg. This is an open-access article distributed under the terms of the Creative Commons Attribution License (CC BY). The use, distribution or reproduction in other forums is permitted, provided the original author(s) and the copyright owner(s) are credited and that the original publication in this journal is cited, in accordance with accepted academic practice. No use, distribution or reproduction is permitted which does not comply with these terms.
*Correspondence: Elin Almroth-Rosell, ZWxpbi5hbG1yb3RoLnJvc2VsbEBzbWhpLnNl