 Xueliang Nan
 Hao Wei
 Haiyan Zhang
 Hongtao Nie
- School of Marine Science and Technology, Tianjin University, Tianjin, China
Understanding how environmental factors impact the interannual variation in scallop growth and subsequently developing an easily obtained parameter to indicate this variation could provide a scientific basis for optimizing their aquaculture. In this study, we have set a growth scenario of uniformly sowed scallops of the same initial size in the Changhai sea area. The Yesso scallop culture ecosystem model was used to simulate the growth of bottom-cultured Yesso scallop each year from December 1, 2006 to November 30, 2017. The results show that the annual growth rate was higher in the northwest than in the southeast, and there were obvious high-value areas near the islands. The scallop biomass was significantly lower in 2009–2010 and reached its highest point in 2013–2014. Based on the match-mismatch conditions of bottom-water temperature, food availability, and the Yesso scallop growth process, three factors were determined: suitable growth days (SGD), restricted growth days (RGD), and food accumulation (FA). Subsequently, a multiple regression relationship was proposed with scallop biomass to explore the reasons affecting the interannual variations in scallop growth. We found that the anomaly of the contribution of SGD and FA for the scallop growth was small, and the interannual variation in scallop biomass was mainly regulated by RGD in winter. Our results indicated that the interannual variation in RGD in winter was closely related to the regional averaged air temperature in early winter. The air temperature in early winter is easily obtained in practice. Consequently, it could be used to predict the interannual growth of bottom-cultured scallops to improve aquaculture planning and management.
Introduction
The Yesso scallop (Patinopecten yessoensis) is one of the most important aquaculture species in the northern parts of China (Jiang et al., 2018). The main culture methods used are bottom culture and raft culture techniques (Yuan et al., 2010; Li et al., 2012). Although many factors have to be considered for developing scallop aquaculture, the most important one depends on the culture system (Aura et al., 2016). The impacts of water temperature, food availability, sediment, and bathymetry on the growth of scallops have been well documented (Radiarta et al., 2008). Temperature and food availability are environmental factors that affect the growth of the Yesso scallop (Radiarta et al., 2008; Liu et al., 2014; Aura et al., 2016; Jiang et al., 2020). The temperature has a significant effect on their feeding, respiration, excretion, and enzyme activities (His et al., 1989; Verween et al., 2007; Rico-Villa et al., 2009; Jiang et al., 2020). Low-level food availability directly limits their growth (Nan et al., 2021). The match-mismatch conditions of temperature and food availability affect the growth of organisms (Laurel et al., 2011). To obtain high production levels for the Yesso scallops, it is necessary to understand the influences of the match-mismatch conditions on the growth of scallops and the cause for the interannual variation. Furthermore, a better understanding of the spatial and temporal variations as well as related factors that affect the Yesso scallop growth could improve marine resource protection and management (Aura et al., 2016).
The Changhai sea area is now the largest Yesso scallop culture zone in the North Yellow Sea (NYS) and encompasses a rich array of physical and biological processes (Guan, 1963; Chen, 2009). The area is affected by the northern Yellow Sea cold water mass (NYSCWM) in summer and the Yellow Sea warm current (YSWC) in winter (Guan, 1963). The NYSCWM is the cold-water leftover from the previous winter. When the temperature of the surrounding shallow water and surface seawater rises in spring, a thermocline is formed. This makes it difficult for the heat of the upper surface water to transfer downward, thus maintaining the characteristics of low temperature and high salinity winter water (Guan, 1963; Zhao, 1985). The development, maturity, decline, and extinction of the NYSCWM are synchronized with the evolution of the thermocline, and its range and intensity are related to the interannual difference in temperature variations during the summer and winter (Guan, 1963). The NYSCWM and the coastal water mass are divided by tidal fronts (Zhao, 1985; Wei et al., 2003; Huang et al., 2010), with large temperature and salinity gradients. Some areas in the Changhai sea are near the tidal front and are affected by its swing, causing the warm water and cold water to alternate. This results in large temperature changes in the study area (Nan et al., 2020). In winter half-year, the YSWC carries high temperature and high salinity water into the NYS and forms a temperature front between the cooler nearshore water and the YSWC. This makes the water temperature higher in the south of the NYS than the nearshore (Chen, 2009). The path of the YSWC is related to the intensity of the winter monsoon, and interannual variations also exist (Qiao et al., 2011). The interannual variations in the region as well as the intensity of the NYSCWM and the YSWC lead to significant interannual variations in the bottom-water temperatures of the Changhai sea area.
The Yesso scallop is filtered mainly on phytoplankton (Shumway et al., 1987, 1997), while detritus is not a significant food resource for this species (Silina and Zhukova, 2007). However, Aya and Kudo (2010) found that the food resources for the Yesso scallop related to culture habitats. Lake Saroma and Lake Tokoro, in the Sea of Okhotsk, are only 5 km apart, but the two culture sites differed in the food source composition. Scallops reared at Lake Saroma feed on both suspended particulate organic matter and plankton, whereas scallops cultured at Lake Tokoro feed only on suspended particulate organic matter (Aya and Kudo, 2010). Therefore, we consider both plankton and organic detritus as the potential food sources for the Yesso scallop. The tempo-spatial variation in abundance and species of plankton are affected by temperature, salinity, and water mass (Yin et al., 2013; Liu et al., 2014), which makes the food availability of scallop also has obvious tempo-spatial variations in the NYS (Yuan et al., 2010; Nan et al., 2021). Due to the tempo-spatial variations between temperature and food availability, there will be a match and mismatch period between temperature and food availability for the growth of the Yesso scallop. Previous studies have provided useful insights into the interannual growth variations in hanging-cultured Yesso scallops (Radiarta et al., 2008; Liu et al., 2014; Aura et al., 2016). However, few studies have been reported on the interannual differences of the bottom-cultured Yesso scallop, especially without considering the relationship between the match-mismatch conditions of temperature and food availability and the interannual variations in the Yesso scallop.
The objective of this study was to understand how bottom-water temperature and food availability affects interannual variations in bottom-cultured scallop growth and to develop an easily obtained parameter to indicate these variations. By coupling the high-resolution ecosystem model and the energy dynamic budget model, we built a Yesso scallop culture ecosystem (YeSCE) model for the Changhai sea area (Nan et al., 2021). The model includes physical processes such as advection, diffusion, and mixing, as well as biological processes such as planktonic ecosystems and scallop growth. Preliminarily models suggested that the spatial variations in the scallop growth rates were mainly affected by the cumulative time of the suitable temperature and food availability (Nan et al., 2021). However, the interannual variations in the scallop growth have not been considered. This study compared the interannual variations in scallop biomass from December 2006 to November 2017, the causes for the interannual variations in scallop biomass were revealed, and the influence of the match-mismatch conditions by natural environmental factors was evaluated.
Materials and Methods
Study Area and Data
The Changhai sea area is located in the NYS (Figure 1A), and it includes traditionally cultured areas such as Zhangzi Island, the Changshan Islands, and Haiyang Island (Figure 1B). The status quo of Changhai sea area use is illustrated with traditional raft culture areas (blue polygons) and bottom-culture areas (yellow polygons) (Yuan et al., 2010; Li et al., 2012; Figure 1B). At present, the promotion of the development of green aquaculture is actively accelerating the transformation of aquaculture techniques (Chen, 2019). In this study, the whole Changhai sea area was treated as a bottom-cultured area, which is different from the present situation. Consequently, the results can be used as a basis for future aquaculture area planning and mode selection.
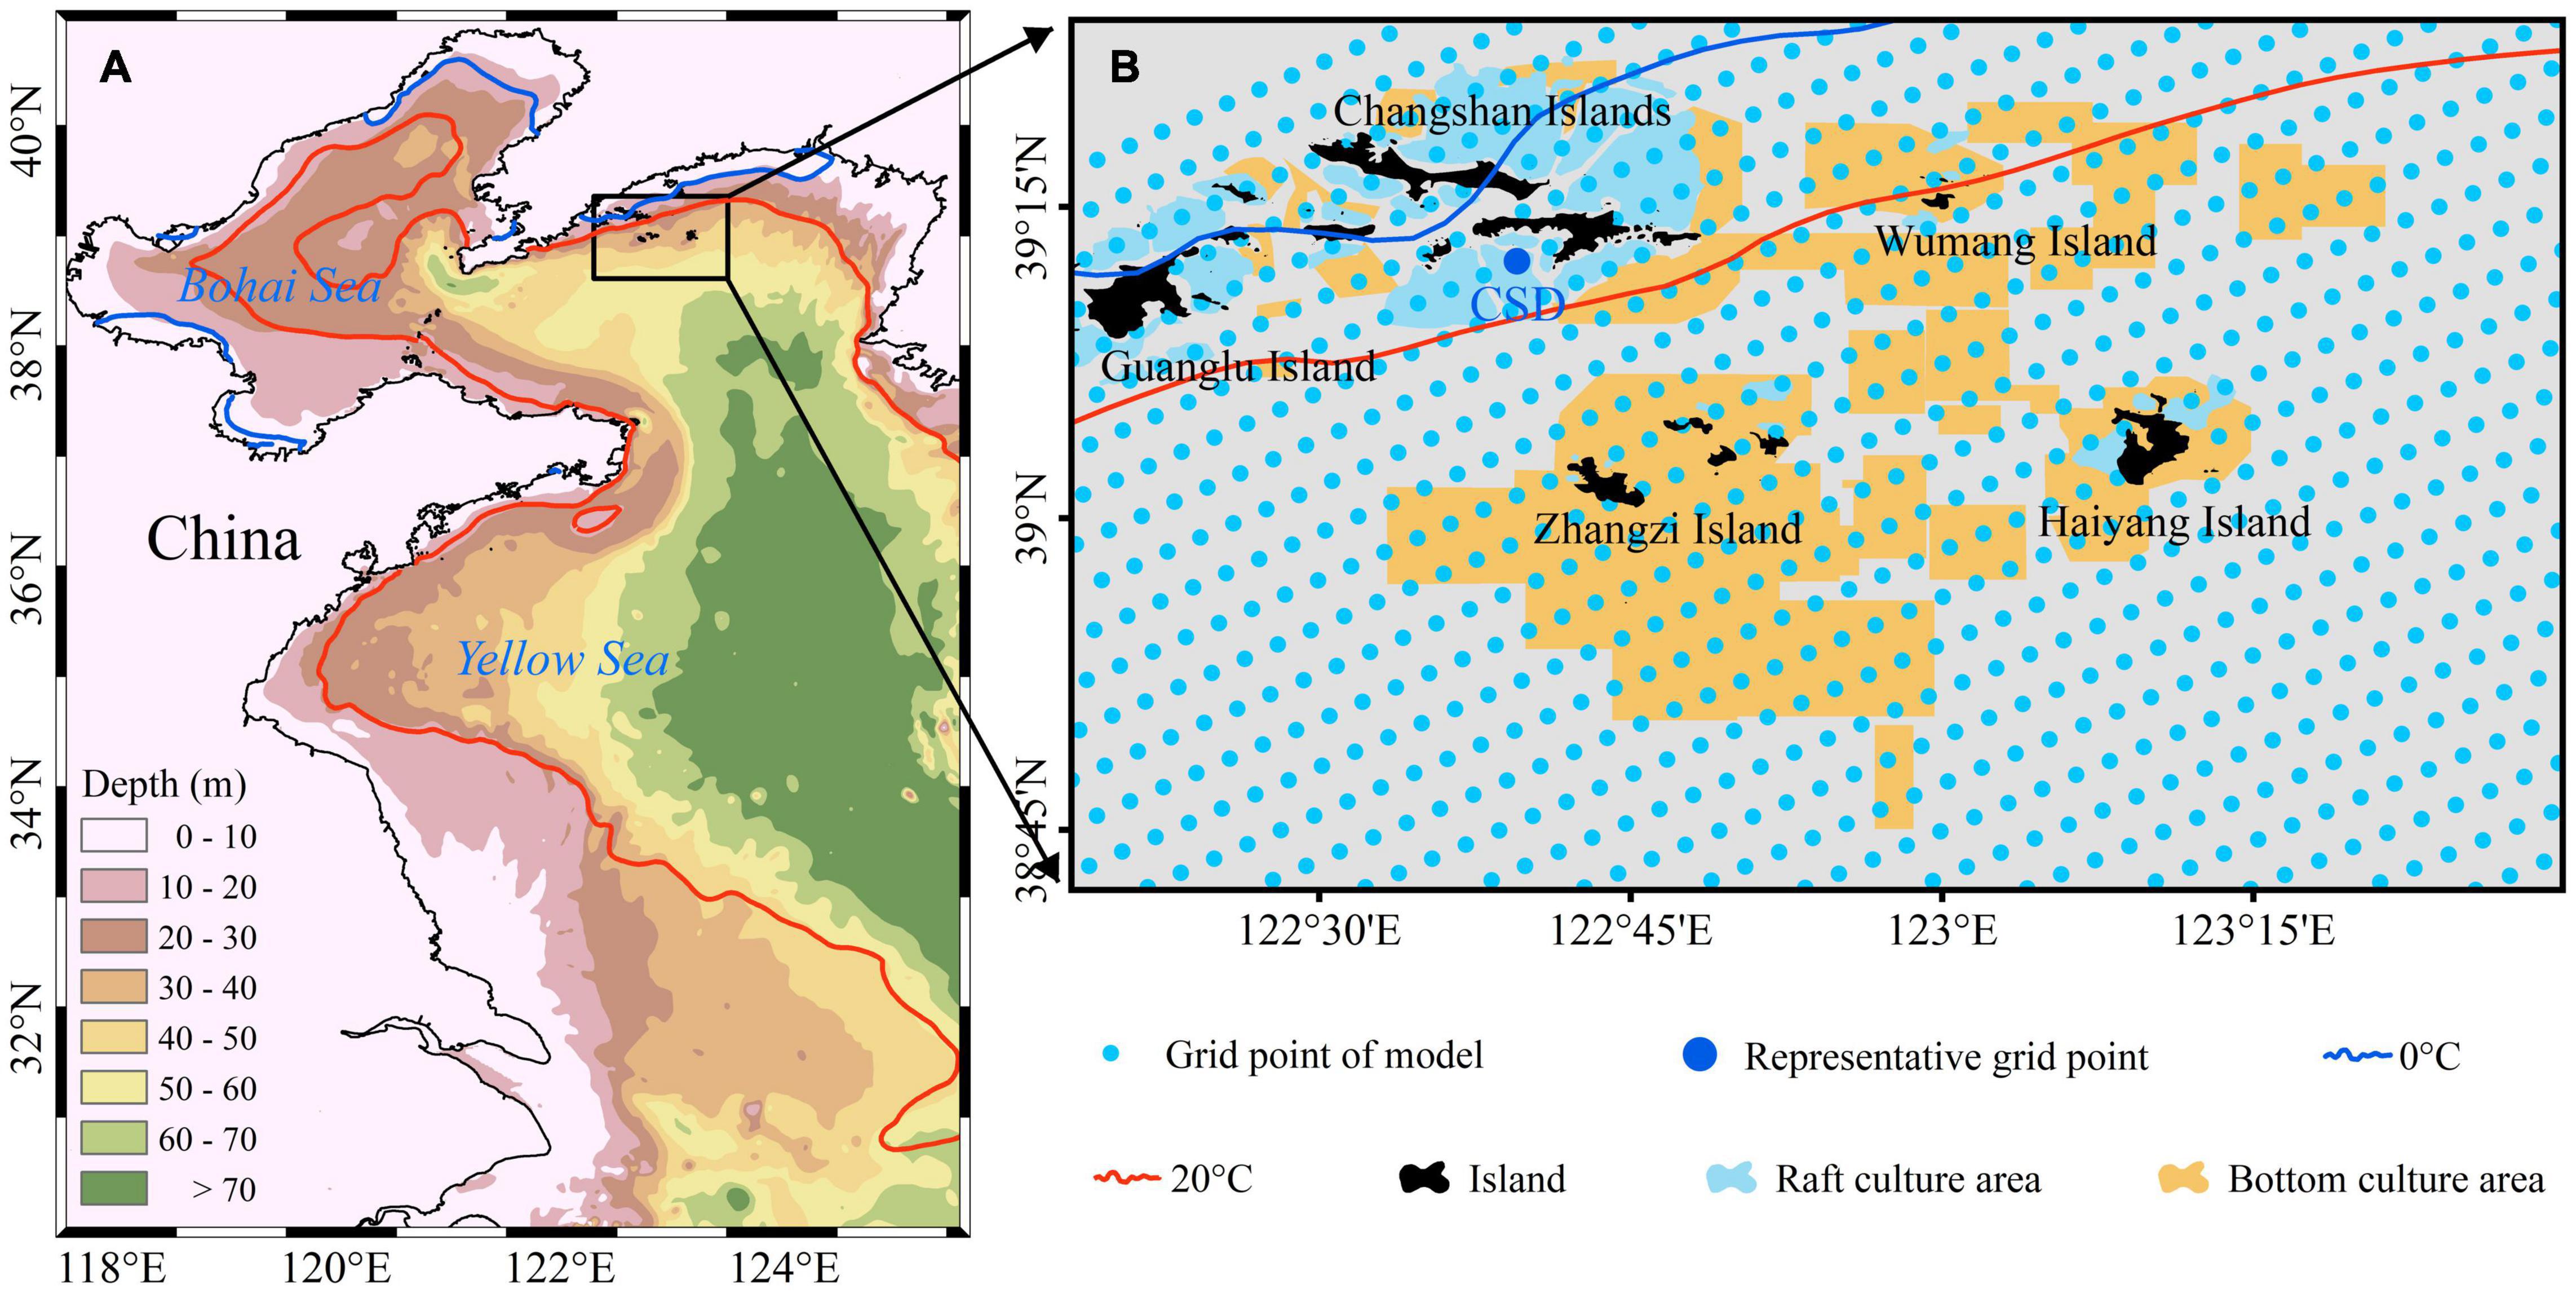
Figure 1. Topography (background) and study area, Changhai sea, China (black box) (A). Status quo of sea use with traditional raft culture areas (blue polygons) and bottom-culture areas (yellow polygons). The representative grid point CSD (blue point) was chosen from grid points of the YeSCE model (light blue point) for dividing the growth process under different match-mismatch conditions. The contour lines represent a multiyear average temperature of 0°C isotherm on February 1 (blue solid line) and 20°C isotherm on September 1 (red solid line) (B).
The datasets used to find an easily obtained parameter to indicate interannual variations are air temperature (2 m above the surface of the sea), surface net solar radiation, surface sensible heat flux, surface net thermal radiation, and surface latent heat flux from the reanalysis product of the ERA51 for 2006–2017. The data were extracted according to the study area and the region averaged in early winter (November to next January). The East Asian winter monsoon index measured by the v-component of wind at 850 hPa averaged over 20–40°N and 100–140°E from November to January (Yang et al., 2002).
Model Simulation Settings
The YeSCE model (Nan et al., 2021) consists of a hydrodynamic model, Regional Ocean Modeling System (ROMS; Shchepetkin and McWilliams, 2005), an ecosystem model, carbon, silicate, and nitrogen ecosystem (CoSiNE; Xiu and Chai, 2014), and an offline dynamic energy budget (DEB) model (Kooijman, 2010) for the Yesso scallop. ROMS and CoSiNE were run simultaneously at 240 s time intervals with a homogeneous 1/24° resolution in each horizontal direction (810 grid points in the study area) and 30 terrain-following vertical levels. The DEB model based on the dynamic energy budget theory is used to describe the energetic processes of an individual organism. This model determines the rates at which the organism assimilates and uses energy for maintenance, growth, and reproduction as a function of the state of the organism and its environment (Kooijman, 2010). The daily-averaged water temperature and food availability of the bottom layer from ROMS-CoSiNE were recorded and used to run the offline DEB model with a time step of 1 day. The resolution in each horizontal direction of the DEB model is the same as the ROMS-CoSiNE.
Model temperature, salinity, nutrients (nitrate, phosphate, and silicate), and dissolved oxygen were initialized using data from the World Ocean Atlas 2013 Version 22 (WOA13 V2; Boyer et al., 2015). The initial condition for chlorophyll a was prescribed from the hydrodynamical and biogeochemical model NEMOPISCES, and the model was forced with the climatological air-sea fluxes of momentum, wind stress, heat flux, and freshwater flux derived from the ERA-Interim reanalysis (Dee et al., 2011). An Orlanski-type radiation condition was applied at the open boundaries for temperature, salinity, and baroclinic velocities (Zhou et al., 2017). The temperature, salinity, water level, and velocity fields were prescribed using the Hybrid-Coordinate Ocean Model (Cummings, 2005) simulation outputs, and the model was forced (data input) at the outer boundary by M2, S2, K2, N2, K1, O1, Q1, and P1 tide. Monthly mean values of the rivers that surround the study realm in the model are taken from previous studies (Zhang, 1996; Liu et al., 2009; Tong et al., 2015; Wang et al., 2015).
To analyze the interannual variations in the Yesso scallop growth, the YeSCE model was run year by year from December 1, 2006 to November 30, 2017 with a time step of 1 day. The Yesso scallop initial uniform seeding was performed every year with a shell length of 3.8 cm and a dry flesh weight of 0.23 g. The seeding time and individual size of scallops are the same as reported by Jiang et al. (2020). The YeSCE model can output many variables such as temperature, food, shell length, and biomass in each spatial grid point near the bottom layer with a homogeneous 1/24° resolution in each horizontal direction. Biomass is the dry flesh weight of the Yesso scallop in a unit area. The model has strictly evaluated and satisfactorily simulated the bottom-water temperature, food availability, shell length, and dry flesh weight, and has been used to explore the causes of the spatial variations in the net growth rate of the Yesso scallop (Nan et al., 2021). Preliminary models suggested that the spatial variations in the scallop growth rates were mainly affected by the cumulative time of the suitable temperature and food availability (Nan et al., 2021).
The bottom-water temperature tolerance range for ingestion of feeding by the Yesso scallop is from 0 to 20°C (Zhang et al., 2017). The monthly average bottom-water temperature of the study area is the lowest in February and the highest in September (Nan et al., 2021). The areas with bottom-water temperatures less than 0°C on February 1 (RAW) and those with bottom-water temperatures of more than 20°C on September 1 (RAS) are selected as the areas where the scallop growth is limited by the bottom-water temperature, which are used to analyze the interannual variations in scallop growth.
To more intuitively analyze the relationship between bottom-water temperature, food availability, and the Yesso scallop growth process, the growth process under different match-mismatch conditions between bottom-water temperature and food availability in the representative grid point CSD (Figure 1B, blue point) was selected for dividing because the growth process of the Yesso scallop in the grid point covers all stages of scallop growth in the study area (Nan et al., 2021).
Typical Growth Stages and Match-Mismatch Conditions
Typical Growth Stages
The Yesso scallop growth process exhibits seasonal variations and is limited by bottom-water temperature and food availability in different periods (Nan et al., 2021). According to the temporal variations in the relationships among bottom-water temperature (Figure 2, blue solid line), food availability (Figure 2, green solid line), and scallop growth process (Figure 2, red solid line) in CSD grid point from December 1 to November 30. The growth process is divided into five stages under the varying match-mismatch conditions. In stage I, the Yesso scallop grew slowly. This stage is characterized by bottom-water temperatures ranging from 0 to 6°C and a lower than the half-saturation coefficient of food availability (XK = 53.3 mg C m–3; Nan et al., 2021), which gradually decreased. Consequently, in this stage, the growth of scallops was mainly limited by food availability. Stage II typically had a bottom-water temperature lower than 0°C, and the food availability was lower than XK. These conditions led to the stagnation of scallop growth. In stage III, the bottom-water temperature was between 0 and 20°C, and the food availability was higher than XK and thus suitable for the scallop growth. Stage IV was characterized by the bottom-water temperatures higher than 20°C and food availability greater than XK. Therefore, the scallop growth was mainly limited by high temperatures. In stage V, the bottom-water temperature ranged from 0 to 20°C, and the food availability was greater than XK. However, food availability was lower than the level observed in stage III.
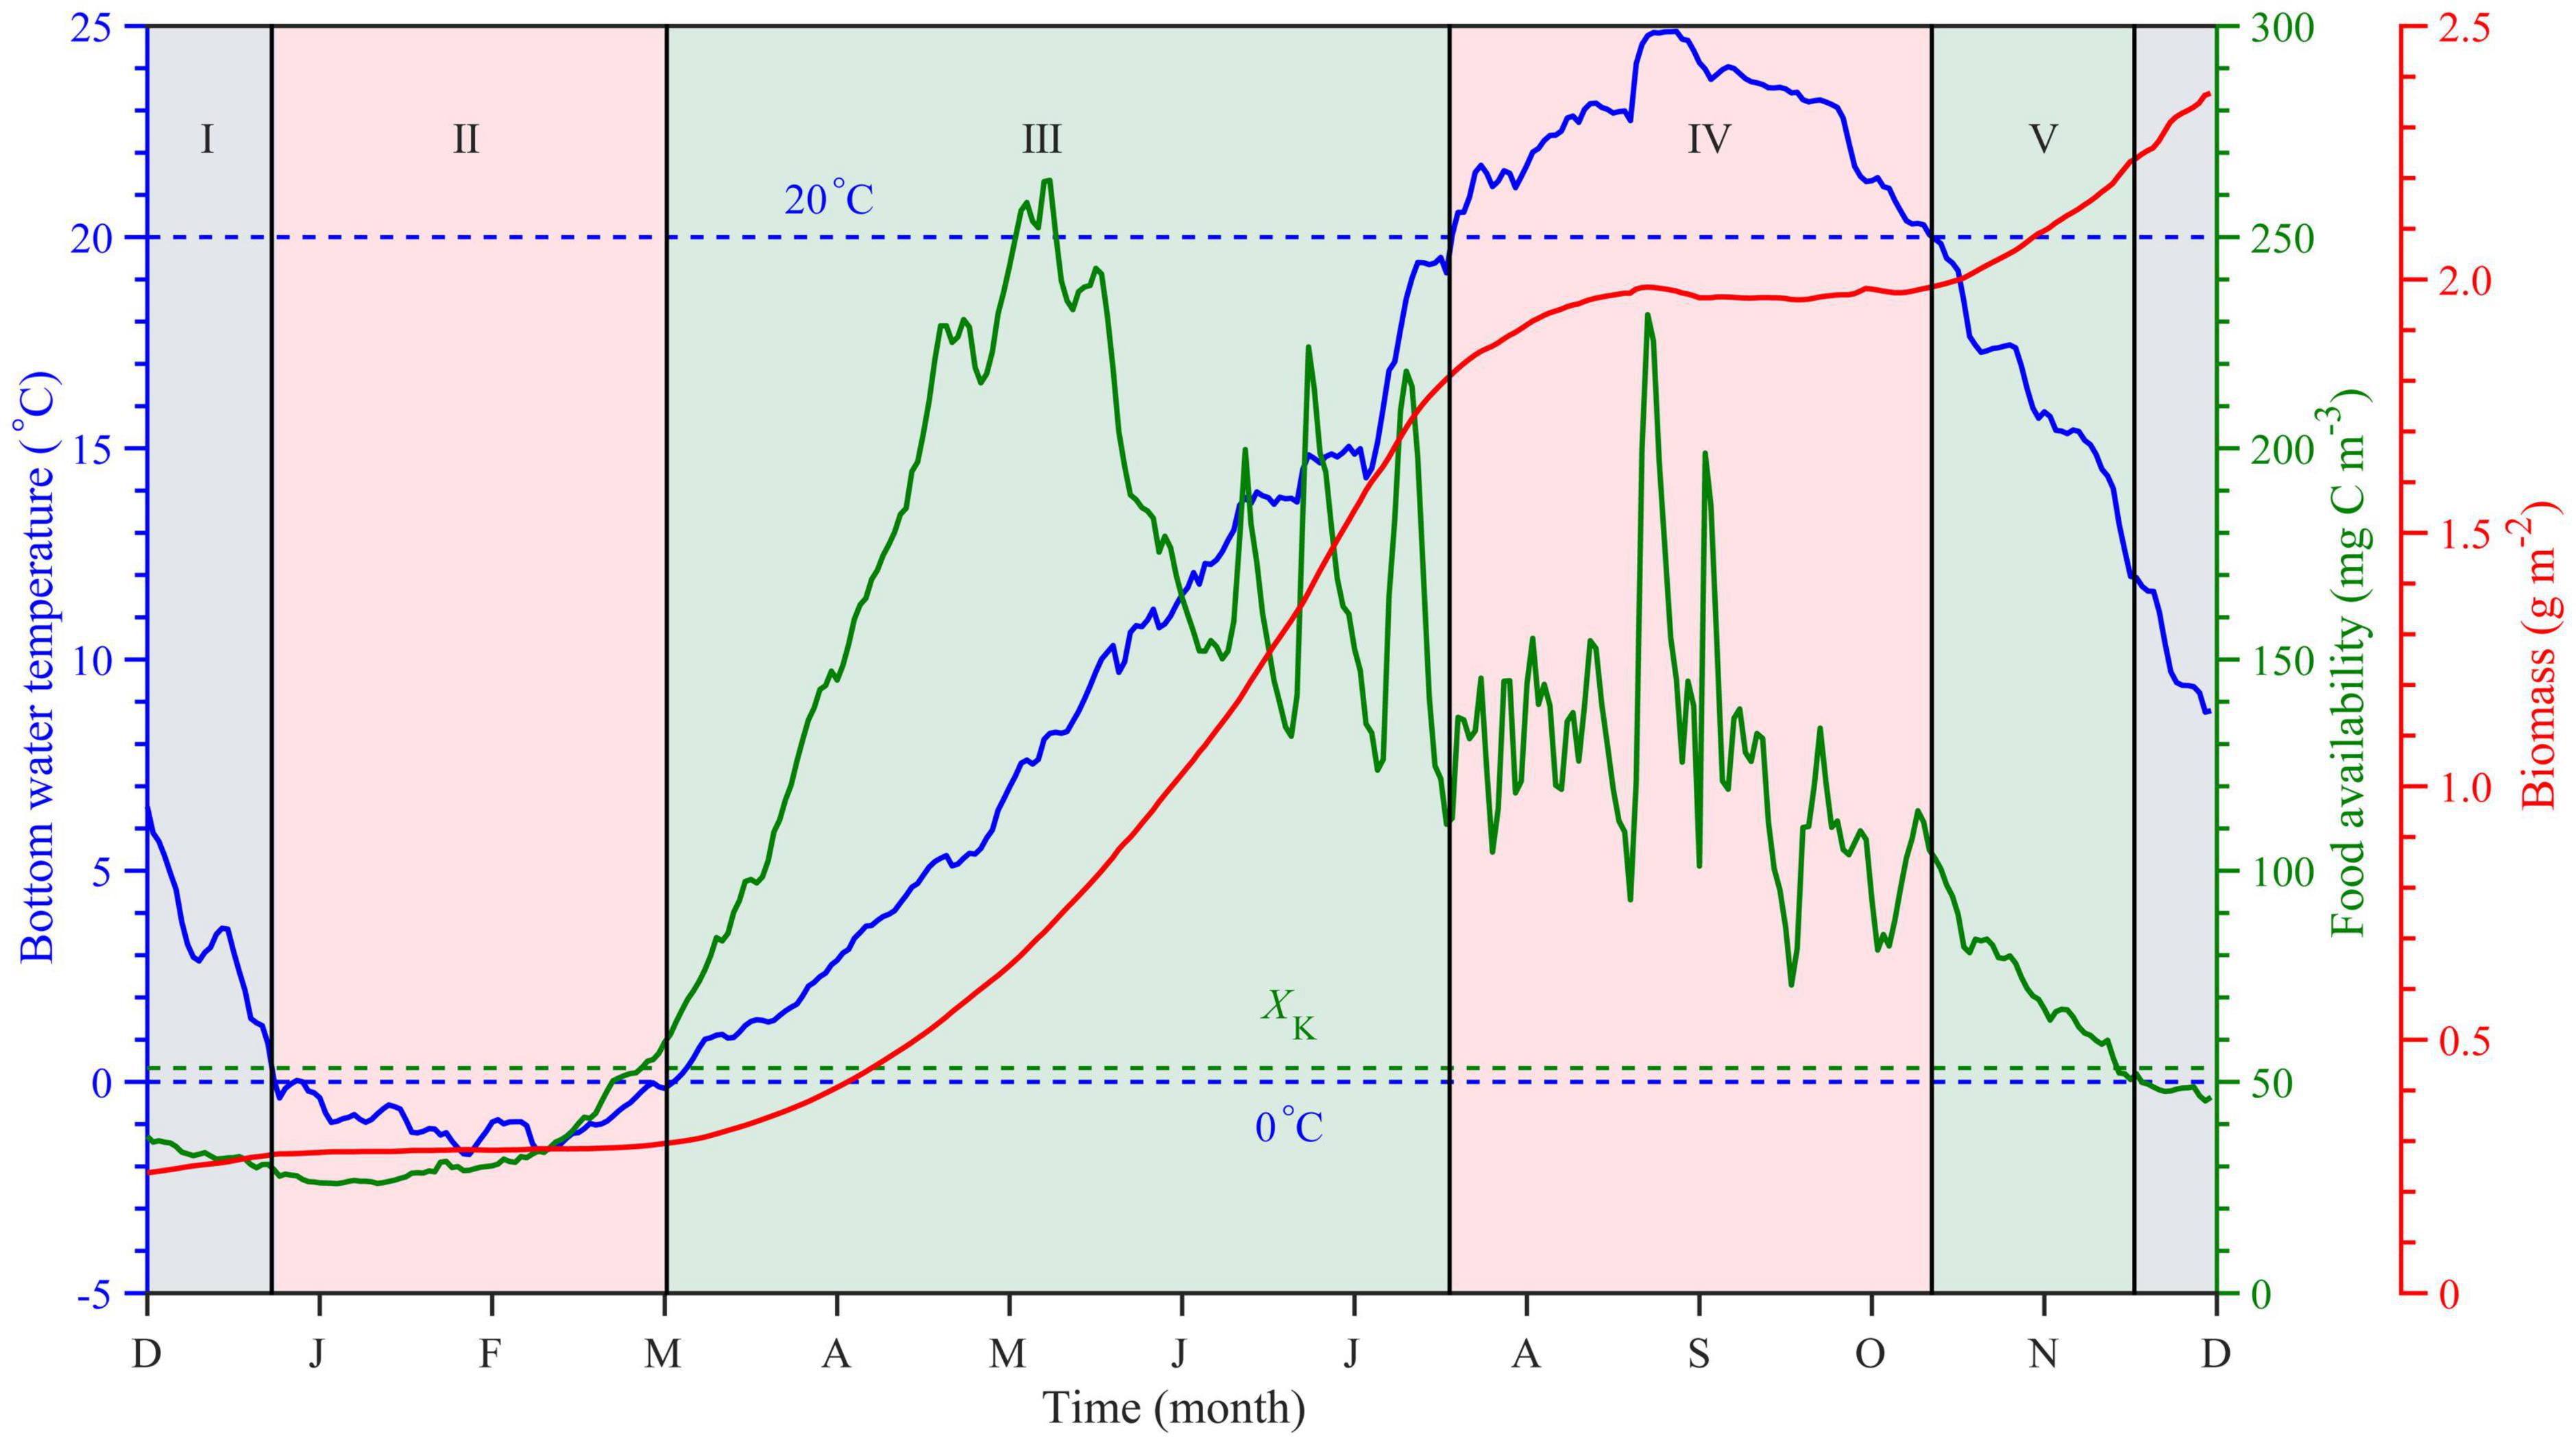
Figure 2. Typical growth stages and match-mismatch conditions between bottom-water temperature and food availability of the Yesso scallops (Patinopecten yessoensis) in the Changhai sea area, China. Time series of multiyear average bottom-water temperature (blue solid line), food availability (green solid line), and simulated biomass (red solid line), with auxiliary blue lines of 0 and 20°C and half-saturation constant XK (green dotted line), also shown. The growth process of scallops can be divided into five stages expressed in Roman numerals. Stage I: The growth of the scallops was mainly limited by the food availability; Stage II: Low temperature and insufficient food led to the stagnation of the scallop growth; Stage III: suitable for scallop growth; Stage IV: The growth of the scallops was mainly limited by high temperature; Stage V: Suitable for growth, but food availability was lower than that in stage III.
Match-Mismatch Conditions
Based on the five stages of scallop growth, three key match-mismatch conditions between bottom-water temperature and food availability were introduced to the scallop growth. These conditions are suitable growth days (SGD), restricted growth days (RGD), and food accumulation (FA). SGD was defined as the total number of days when the bottom-water temperature ranged from 0 to 20°C and the food availability was greater than XK, which means that the bottom-water temperature and the food availability were highly suitable for scallop growth. These days are the rapid growth period of the Yesso scallop, corresponding to stages III and V in Figure 2. RGD was defined as the sum of days when the bottom-water temperature was less than 0°C in winter (RGDW) or greater than 20°C in summer (RGDS). This corresponds to a situation where the bottom-water temperature and the food availability were completely mismatched for the Yesso scallop growth. Due to bottom-water temperature restrictions, RGD is the slow growth or weight-loss period, corresponding to stages II and IV in Figure 2. FA, defined as the sum of the annual food availability, is used to represent the variations when the bottom-water temperature and food availability were mismatched for scallop growth due to food restrictions (stage I; Figure 2) or the variations in food availability in the SGD (stages III and V; Figure 2).
To make three key match-mismatch conditions comparable, they were normalized. Multiple linear correlations were proposed with these match-mismatch conditions and the simulated biomass (BIO) was as follows:
where a1, a2, and a3 represent the growth rate corresponding to each match-mismatch condition, respectively, and the product with each represented the contributions to scallop growth for each match-mismatch condition, such as the contributions from suitable growth days (CSGD), contributions from restricted growth days (CRGD), and contributions from food accumulation (CFA); b is a constant, and the error term is omitted here.
Results and Discussion
Interannual Variations in Biomass of Yesso Scallop
The BIO of the bottom-cultured scallops varied from 0.80 to 3.60 g m–2. In addition, it showed that their distribution characteristics were high in the north and low in the south and that there was a high-value belt extending from Zhangzi Island to the northeast of the study area (Figure 3). The BIO of the scallops around Zhangzi Island and Haiyang Island was higher than that of the area northwest of Xiaochangshan Island. In 2009–2010, the BIO was the lowest, and the highest value was only 2.50 g m–2 (Figure 3D); in 2012–2013, the BIO was 0.20 g m–2 lower than that of the annual averaged biomass; and in 2013–2014, the BIO was significantly higher than that in other years, reaching 3.60 g m–2 near Zhangzi Island (Figure 3H). The spatial differences of the net growth rate were largely affected by the length of the match timing of temperatures and food availability (Nan et al., 2021).
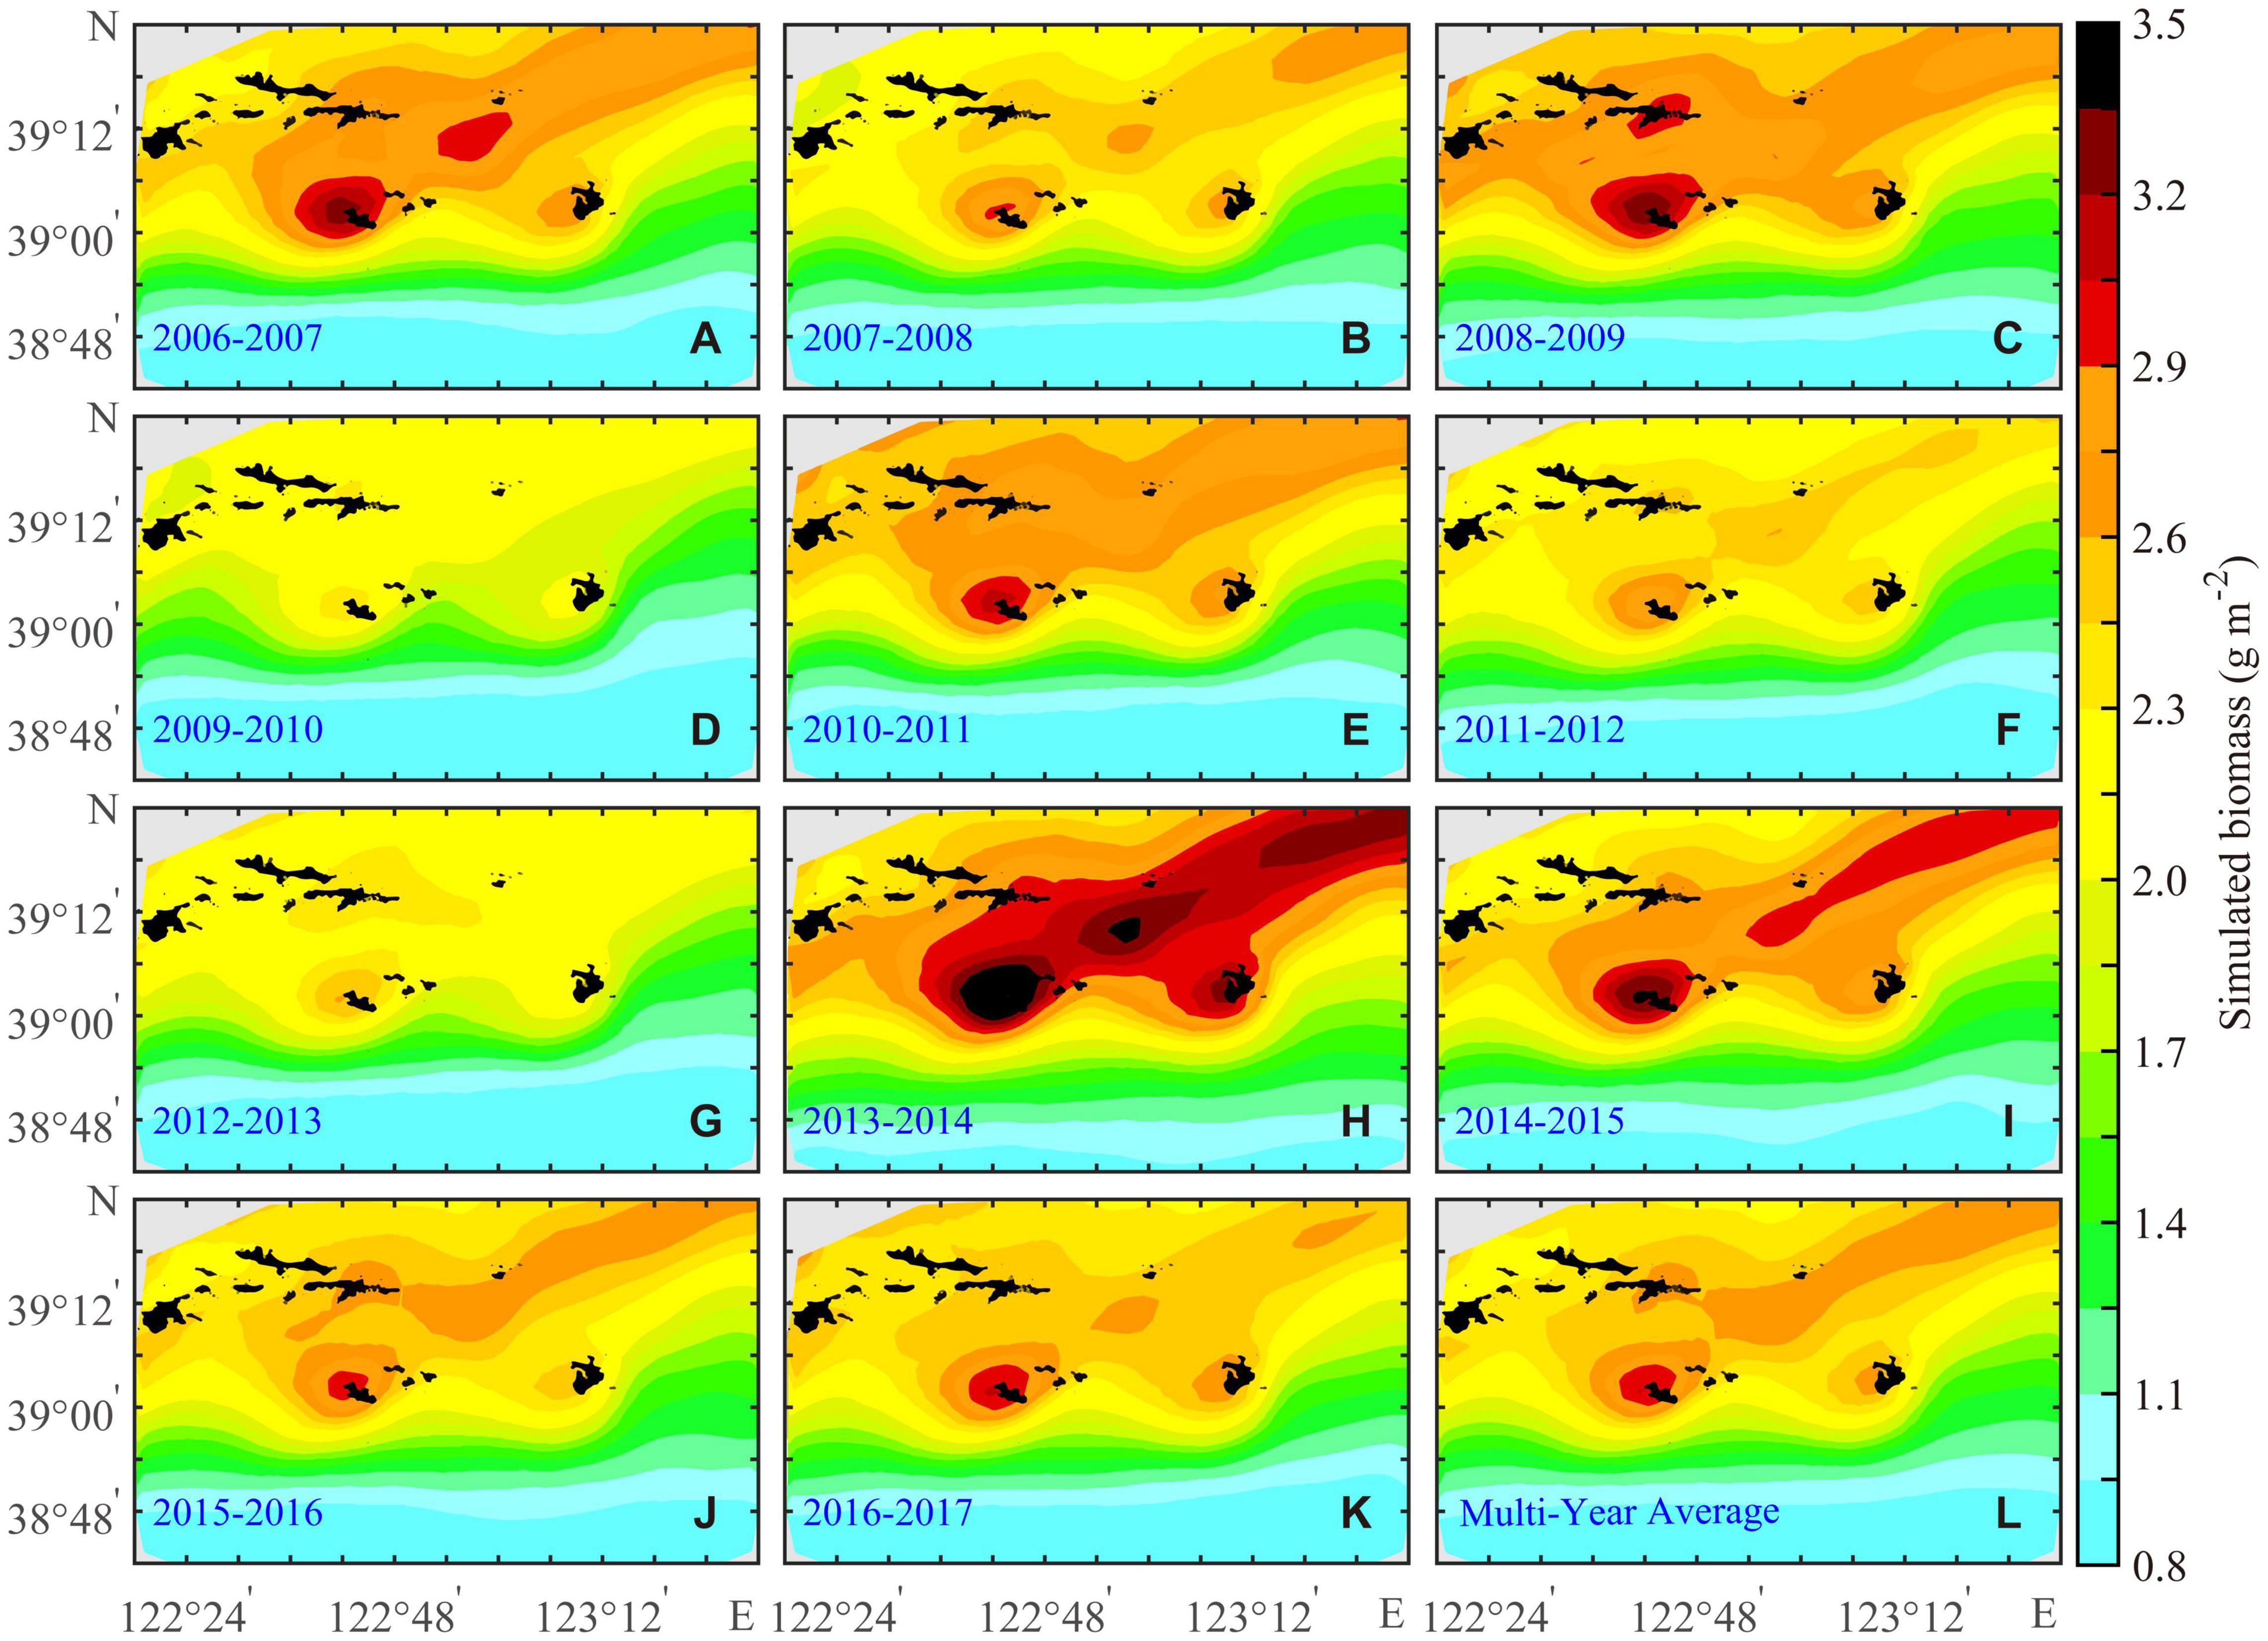
Figure 3. Annual (A–K) and the multiyear average (L) of the bottom-cultured Yesso scallop (P. yessoensis) biomass in the Changhai sea area, China, from December 1, 2006 to November 30, 2017.
Interannual Variations in Match-Mismatch Conditions
Suitable Growth Day
During SGD, the Yesso scallop can grow rapidly because the bottom-water temperature and food availability are highly matched. The spatial variations in the BIO of the Yesso scallop could be characterized by the SGD (Nan et al., 2021). Multiyear-averaged SGD in the north of the study area is significantly higher than that in the south with a range from 0 to 274 days, and there is a high-value zone extending from the sea area near Zhangzi Island to the northeast of the study area (Figure 4). The interannual variations in SGD were also consistent with BIO, with the lowest SGD in 2009–2010 and the highest SGD in 2013–2014.
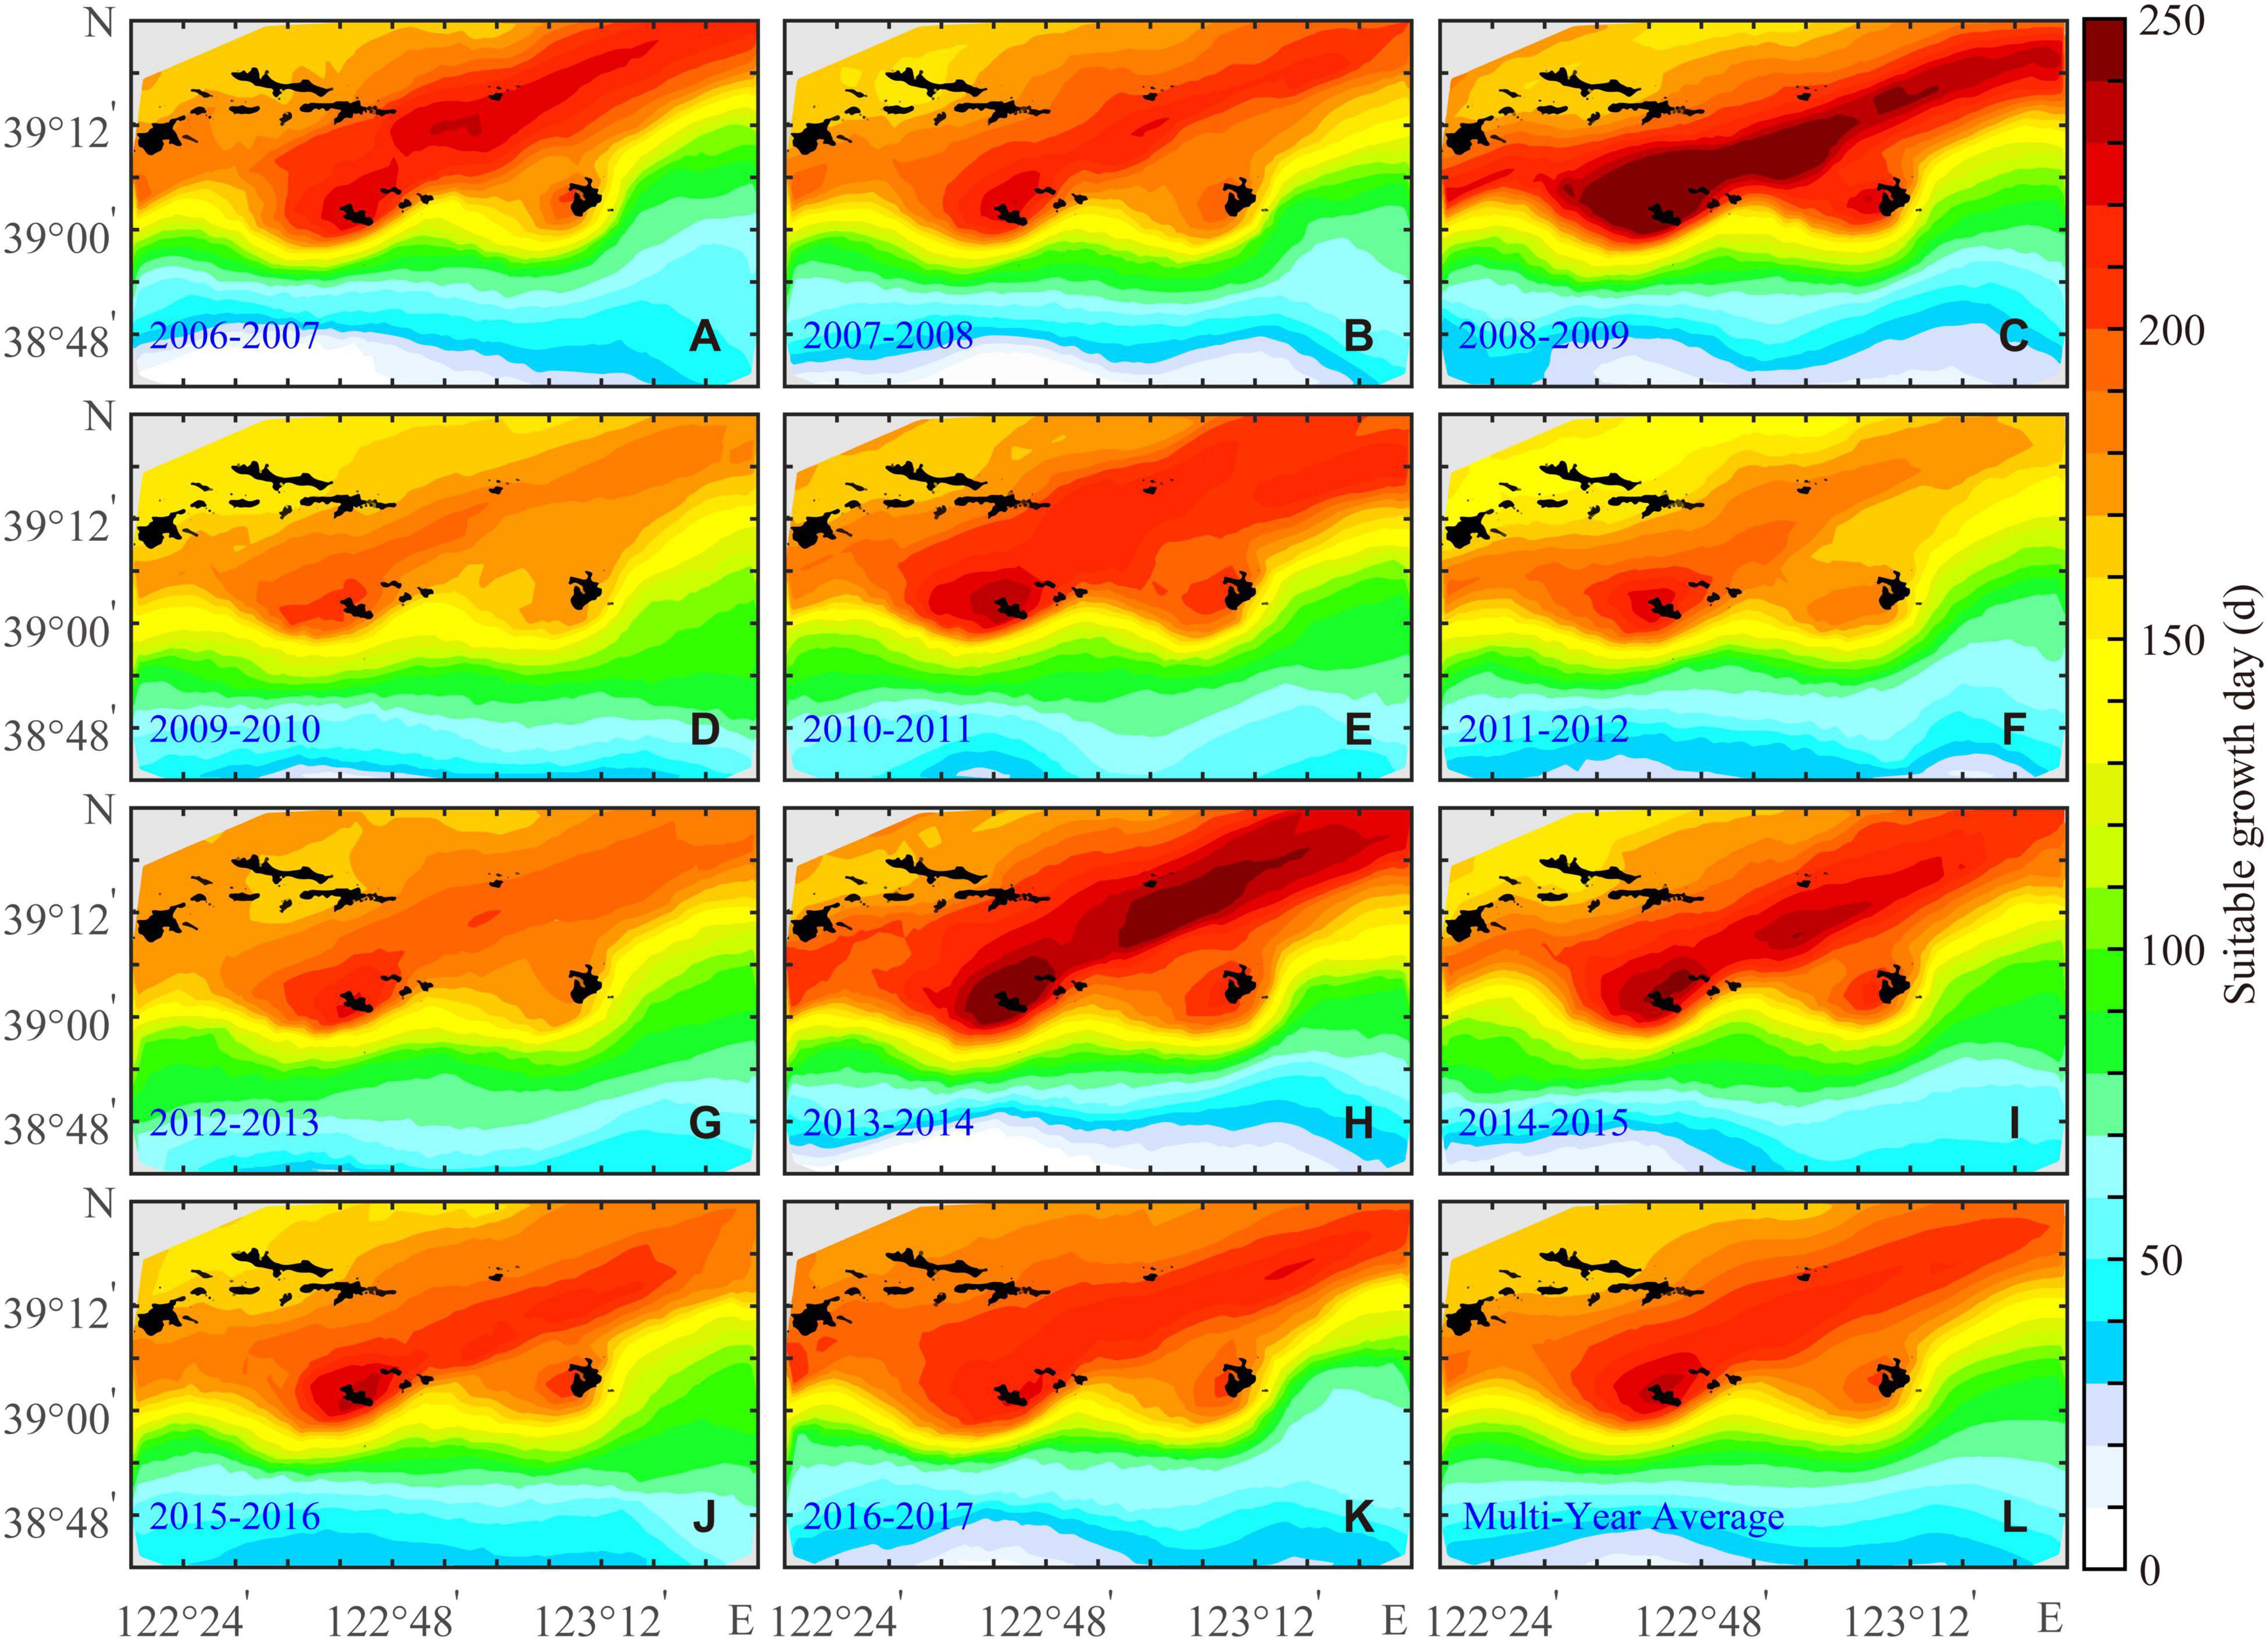
Figure 4. Annual (A–K) and the multiyear average (L) of suitable growth days for the Yesso scallop (P. yessoensis) in the Changhai sea area, China, from December 1, 2006 to November 30, 2017.
Restricted Growth Day
The ingestion of the Yesso scallop was limited by the bottom-water temperature during RGD (Figure 2). Moreover, the bottom-water temperature and food availability were completely mismatched for the Yesso scallop growth. At this time, the energy stored in the structure or gonad of the scallop was used for survival (Kooijman, 2010). The longer the RGD period (Figure 5), the greater the restriction on scallop growth. Multiyear-averaged RGD gradually decreases from northwest to south (Figure 5L) with a range from 0 to 190 days. During 2009–2010, the scope of RGD covered the whole study area (Figure 5D), and the maximum value of multiyear-averaged RGD (190 days) was found. The boundary of RGD only reached Zhangzi Island in 2013–2014 (Figure 5H), and the maximum value was 151 days.
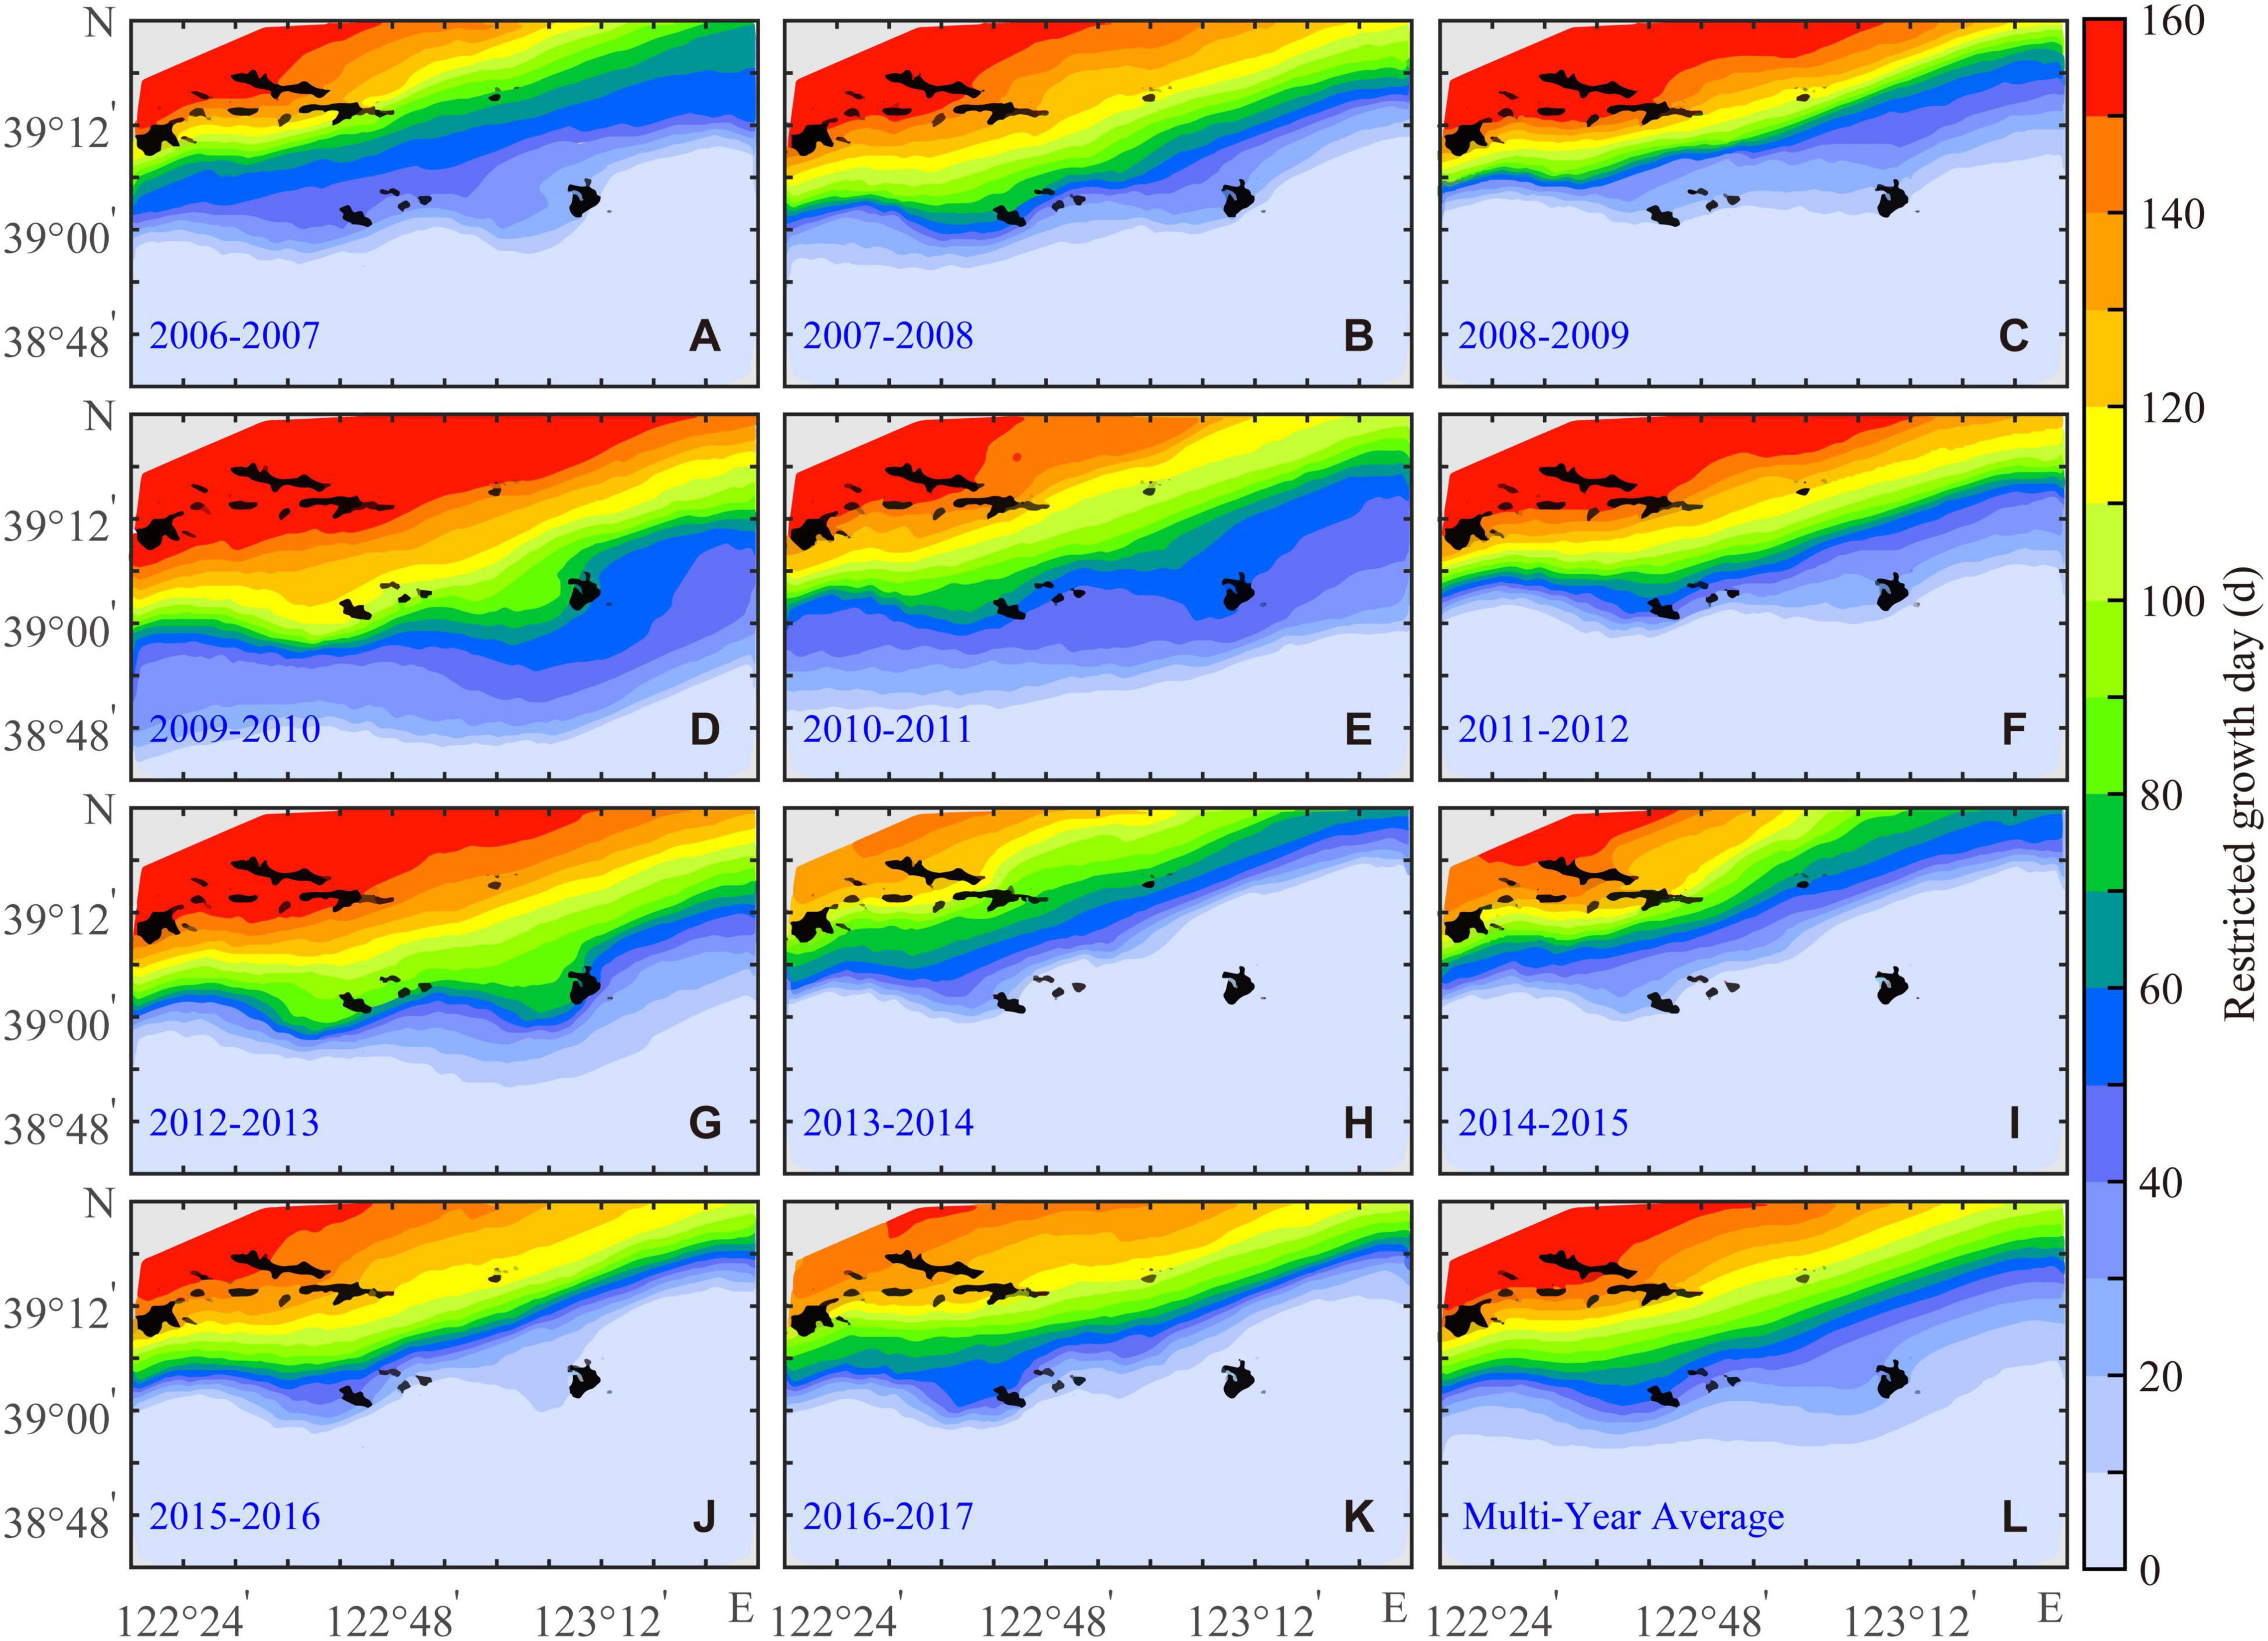
Figure 5. Annual (A–K) and the multiyear average (L) of restricted growth days for the Yesso scallop (P. yessoensis) in the Changhai sea area, China, from December 1, 2006 to November 30, 2017.
Food Accumulation
Food accumulation is defined as the sum of the annual food availability with a multiyear range from 0.68 × 10⁴ to 5.36 × 10⁴ mg C m–3. The growth of the Yesso scallop is not limited by temperature or food availability in the SGD, but the higher the food availability, the faster the growth of the scallop (Kooijman, 2010). FA can supplement the contribution of the part of food availability higher than the half-saturation coefficient of food (XK) to biomass in the SGD. When the bottom-water temperature is suitable and the food availability is less than the XK, the growth, maintenance, and weight-loss of scallop are mainly limited by the food availability. Bottom-water temperature limits the ingestion of the Yesso scallop in RGD, and food availability also affects the growth of scallop. The spatial distribution of FA was higher in the north of the study area and lower in the south. The interannual variations in FA were not obvious except northwest of the study area (Figure 6). The range of FA greater than 4.5 × 10⁴ mg C m–3 was the largest in 2013–2014 and the smallest in 2009–2010. FA in the sea area south of Zhangzi Island is basically less than 2 × 10⁴ mg C m–3, with little interannual difference, but the lowest in 2009–2010.
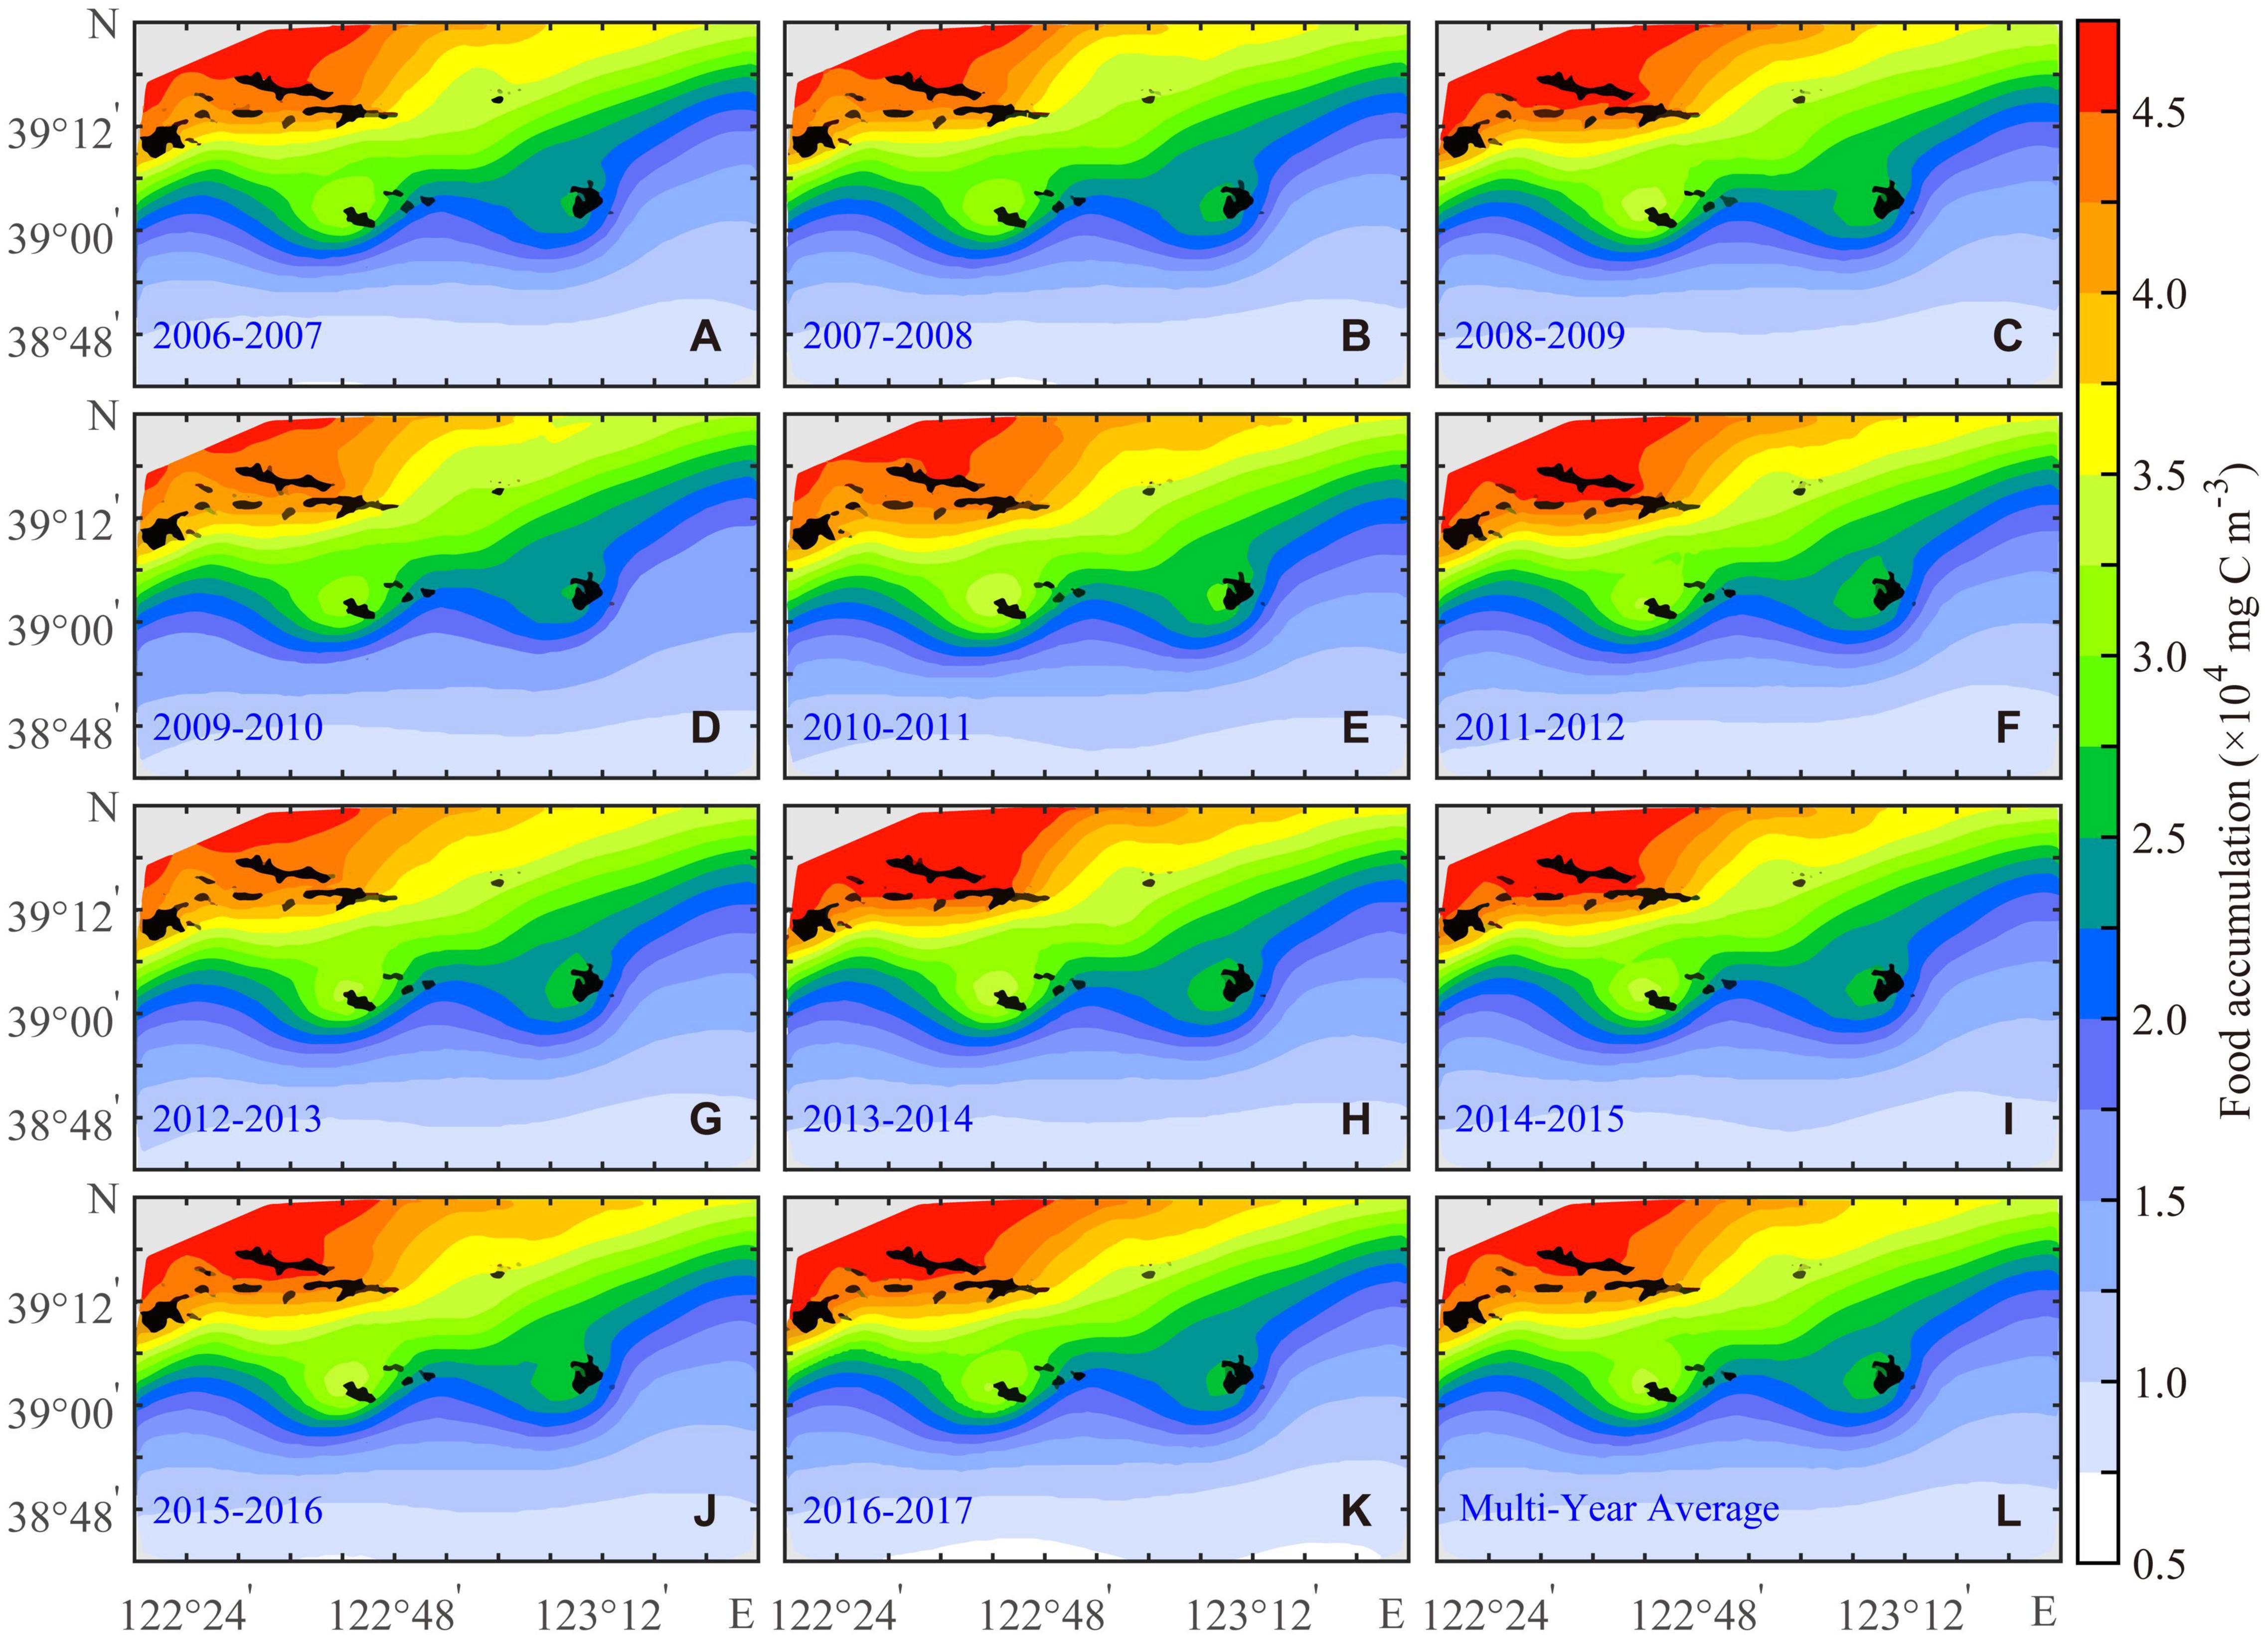
Figure 6. Annual (A–K) and the multiyear average (L) of food accumulation for the Yesso scallop (P. yessoensis) in the Changhai sea area, China, from December 1, 2006 to November 30, 2017.
Relationship Between Biomass and Match-Mismatch Conditions
The BIO, SGD, RGD, and FA values were randomly selected from 80% of the grid points in the study area from 2006 to 2017, and a parametric regression was carried out using the least-square method:
The BIO was highly correlated with the regression results (R2 = 0.95, P < 0.001) (Figure 7A). The remaining 20% of the grid points were used to test the regression Eq. (2). A more thorough assessment of simulation-regression agreement was conducted quantitatively using the Taylor diagram (Taylor, 2001). The regressed biomass of each year was highly correlated with the BIO (r > 0.95, P < 0.001) (Figure 7B). Therefore, SGD, RGD, and FA could be used to regress the annual biomass of the scallops. SGD and FA contributed positively to biomass, while RGD contributed negatively. The normalized coefficient showed that SGD played the main role in affecting spatial variation in the BIO (Nan et al., 2021).
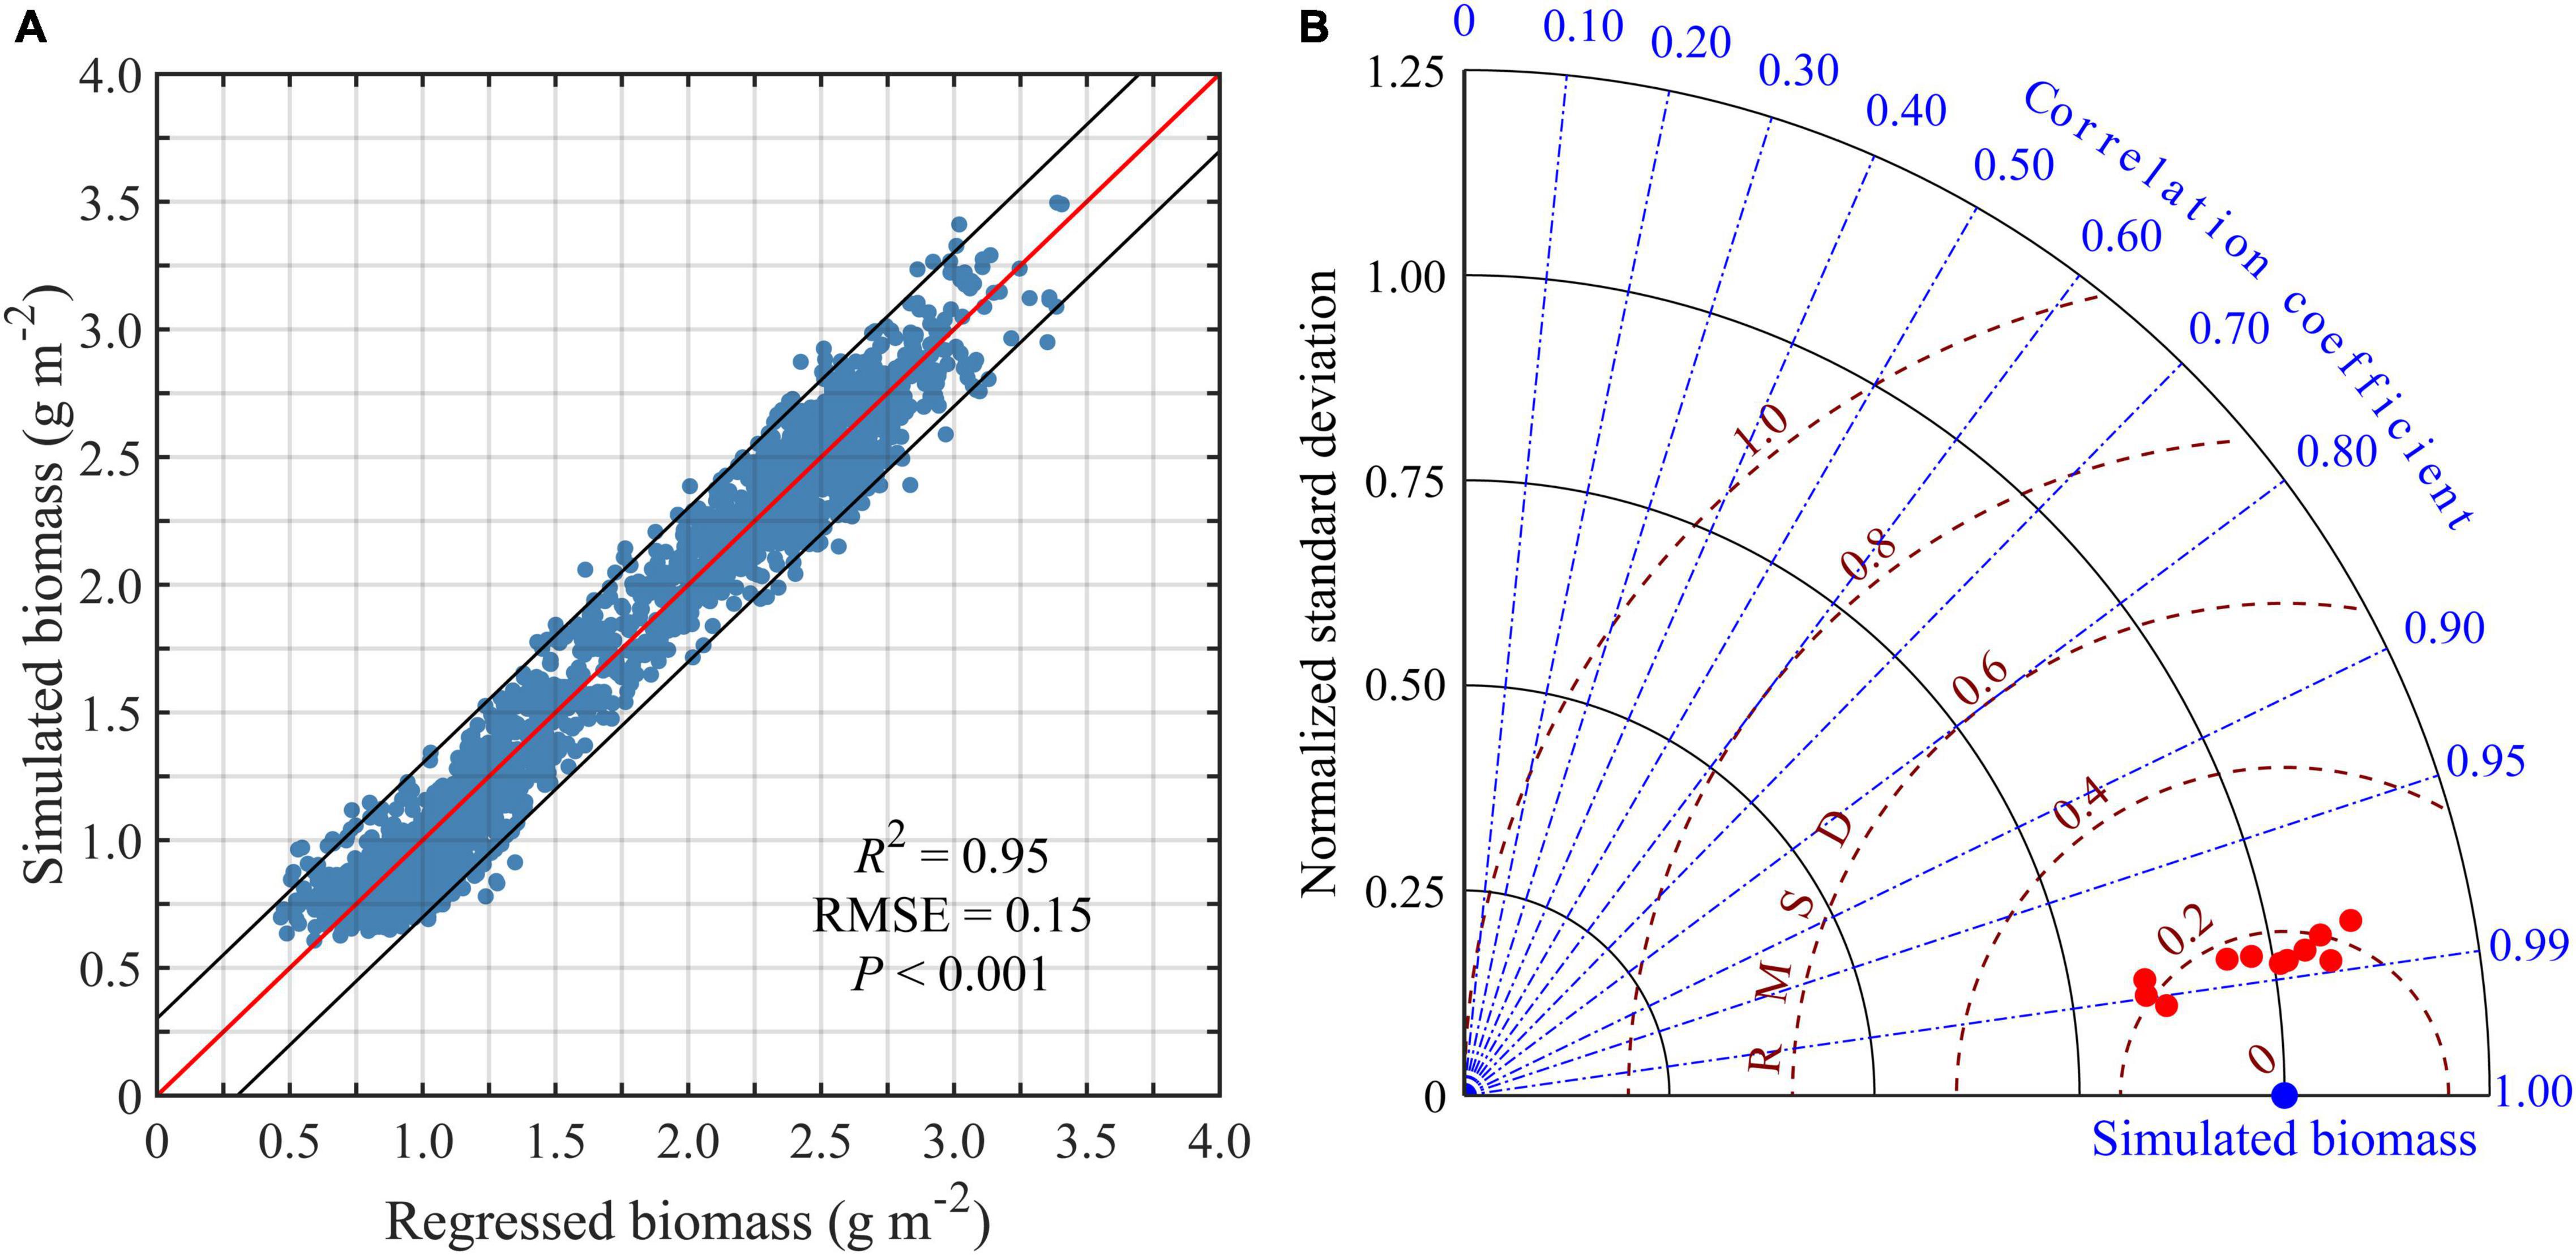
Figure 7. Comparison between the regressed and the simulated biomass of the Yesso scallop (P. yessoensis) in the Changhai sea area, China. The correlations between the regressed and the simulated biomass from December 1, 2006 to November 30, 2017. The red solid line is the regression line and the black solid line is the 95% confidence interval (A). Taylor diagram comparing regressed biomass (red dot) and simulated biomass (blue dot) from December 1, 2006 to November 30, 2017. The radial distance from the origin is proportional to the ratio of regressed and simulated biomass standard deviations (gray solid curves), and the azimuthal position corresponds to the correlation between regressed and simulated biomass (blue dashed lines). The distance from each regressed value to the simulated value is proportional to the normalized root mean square deviation (RMSD) between the simulated and regressed biomass (red dashed curves) (B).
Reasons for Interannual Variation in Biomass
There was a significant interannual variation in the regional averaged BIO, CSGD, CRGD, and CFA from 2006 to 2017 (Figure 8). The BIO was the highest in 2013–2014 and the lowest in 2009–2010. Based on the regression Eq. (2), SGD and FA contributed positively to BIO, while RGD contributed negatively. The interannual variations in CFA and CSGD were smaller than CRGD, with an anomaly range of −0.07 to 0.06 g m–2, −0.04 to 0.03 g m–2, and −0.10 to 0.18 g m–2, respectively (Figure 8).
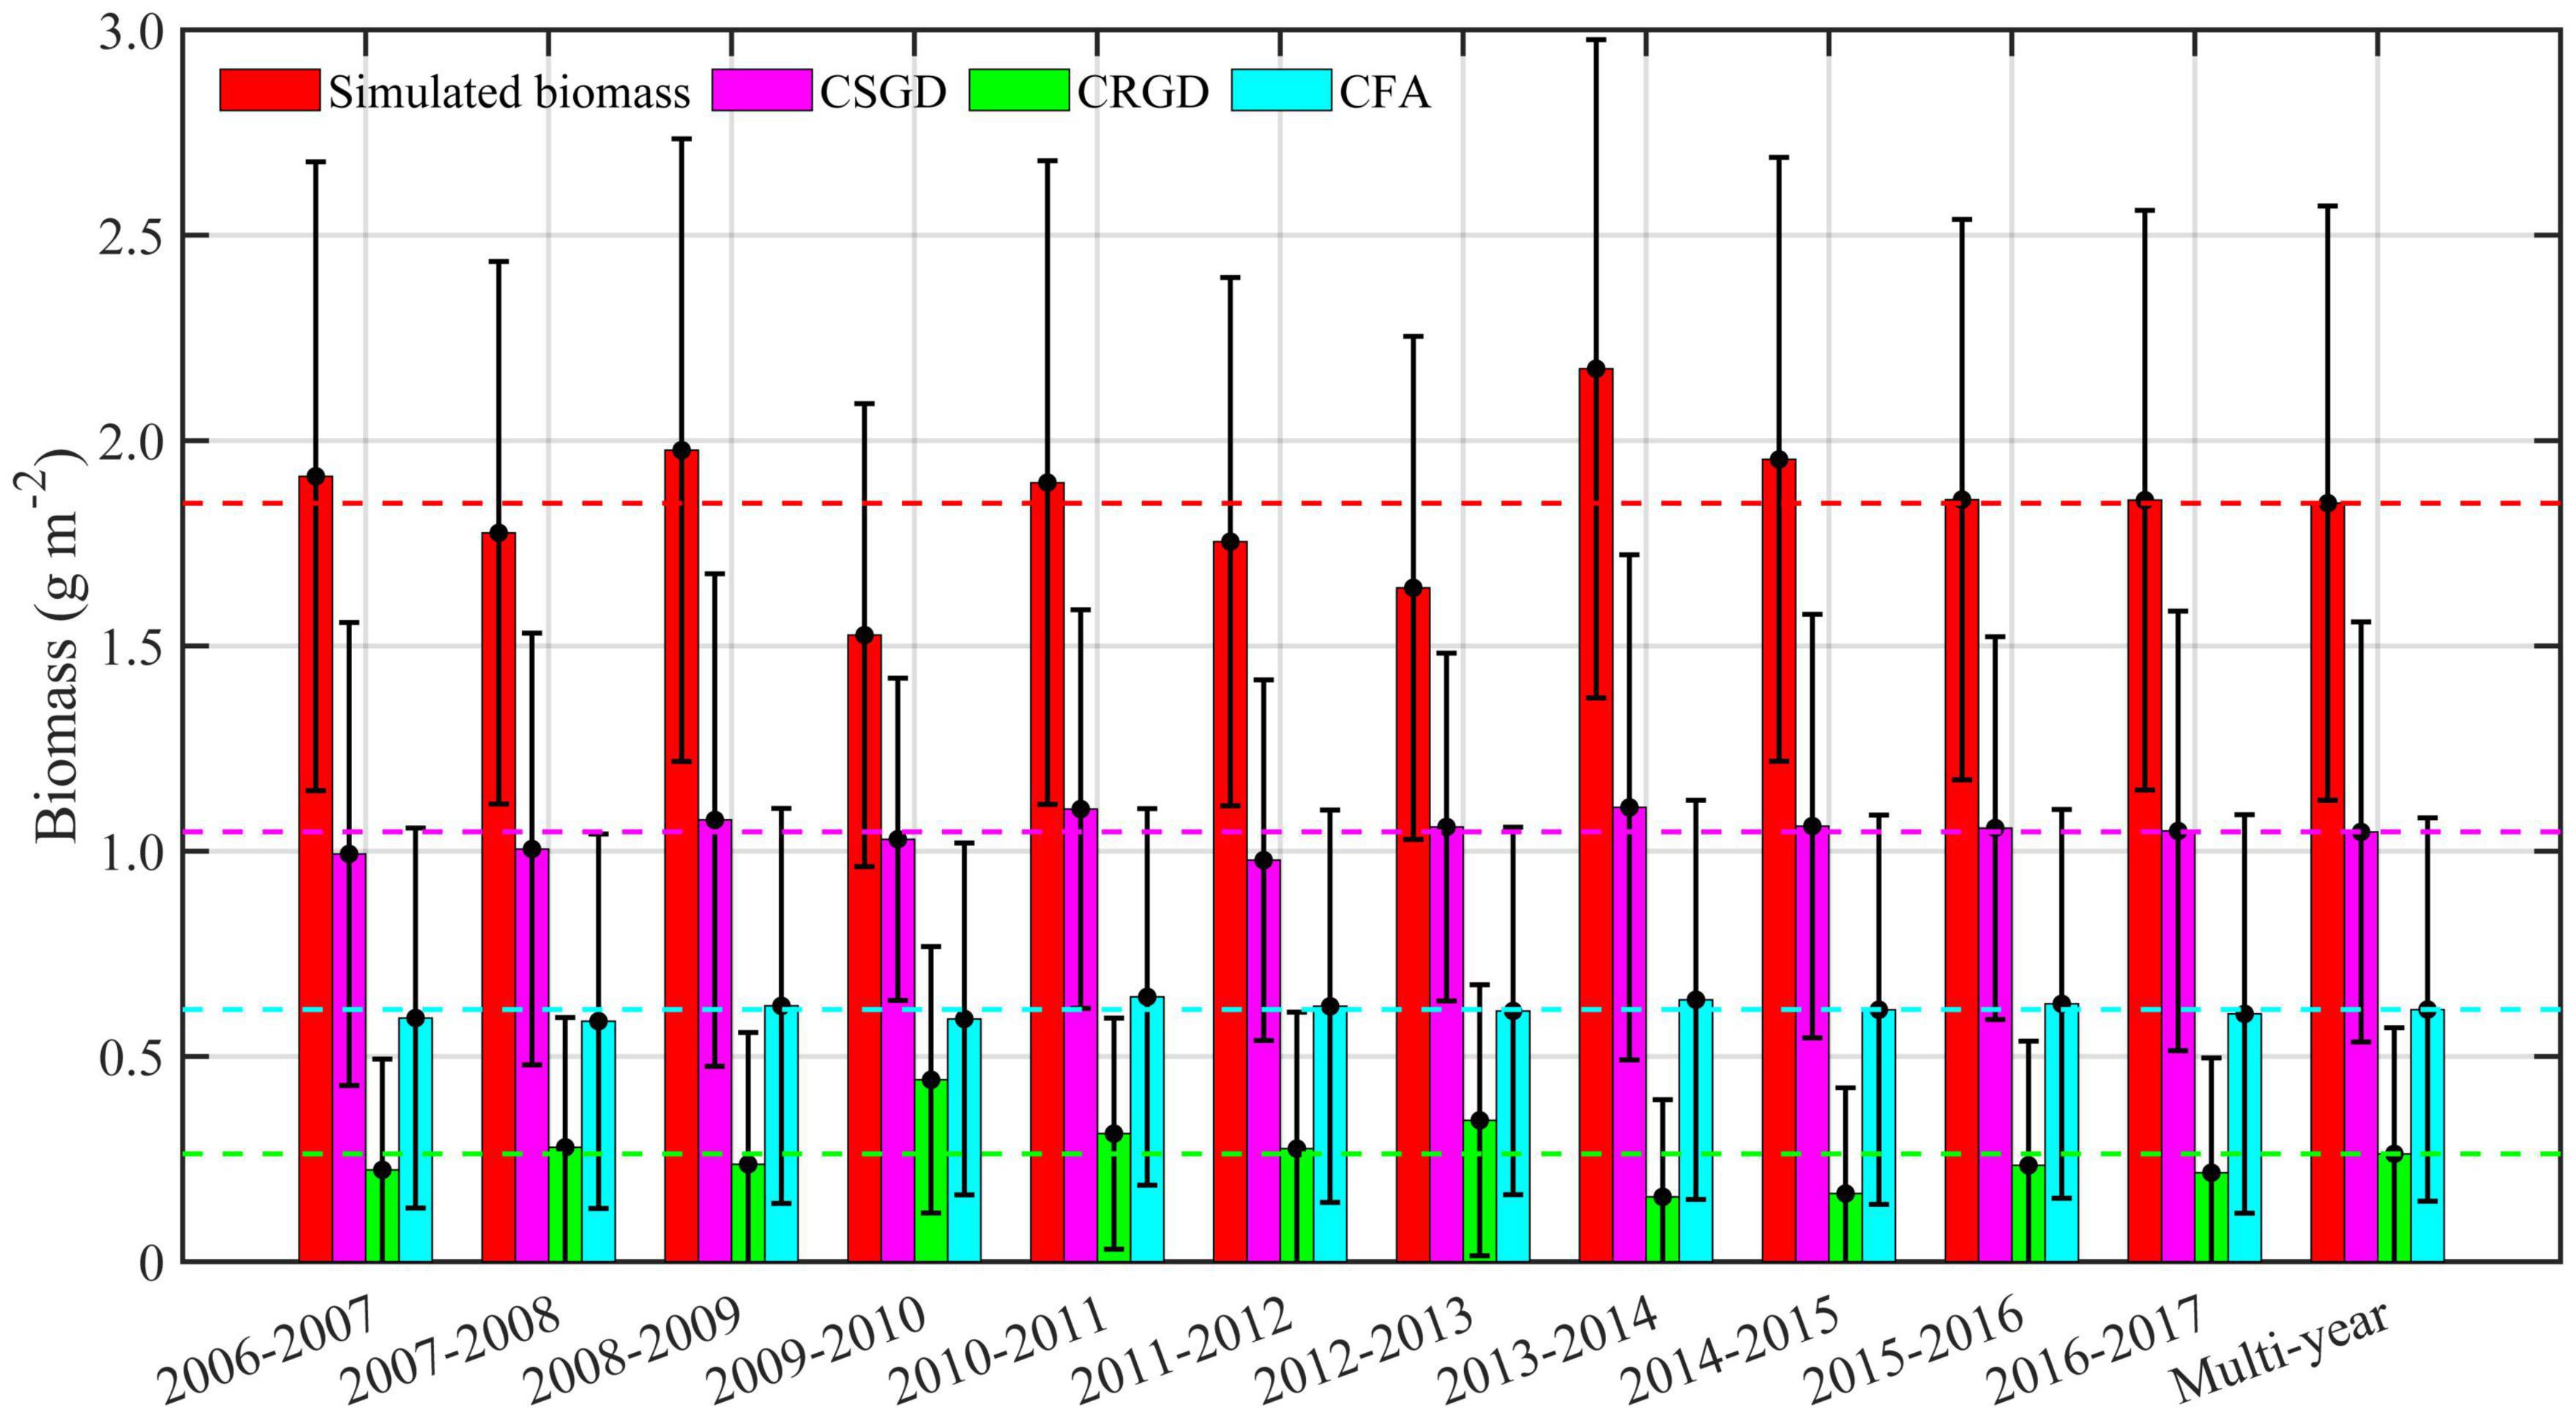
Figure 8. Histogram of the annual and the multiyear average of regional mean simulated biomass, contributions from suitable growth days (CSGD), contributions from restricted growth days (CRGD), and contributions from food accumulation (CFA) from 2006 to 2017 for the Yesso scallop (P. yessoensis) in the Changhai sea area, China.
The correlation coefficients between the anomaly in the BIO and the anomaly in the regressed biomass (Figure 9A), CSGD (Figure 9B), CRGD (Figure 9C), and CFA (Figure 9D) were 0.73, 0.44, 0.77, and 0.29, respectively. The results of the correlation analysis showed that the interannual variation in BIO in the study area was mainly affected by RGD. Therefore, the growth of the scallops could be estimated by the factors that caused the interannual variation in RGD. RGD included RGDW and RGDS. From 2006 to 2017, the range of the bottom-water temperature, which was less than 0°C on February 1 and greater than 20°C on September 1 of each year, could be represented as ratios of grid points in the range to total grid points in the study area as RAW and RAS, respectively.
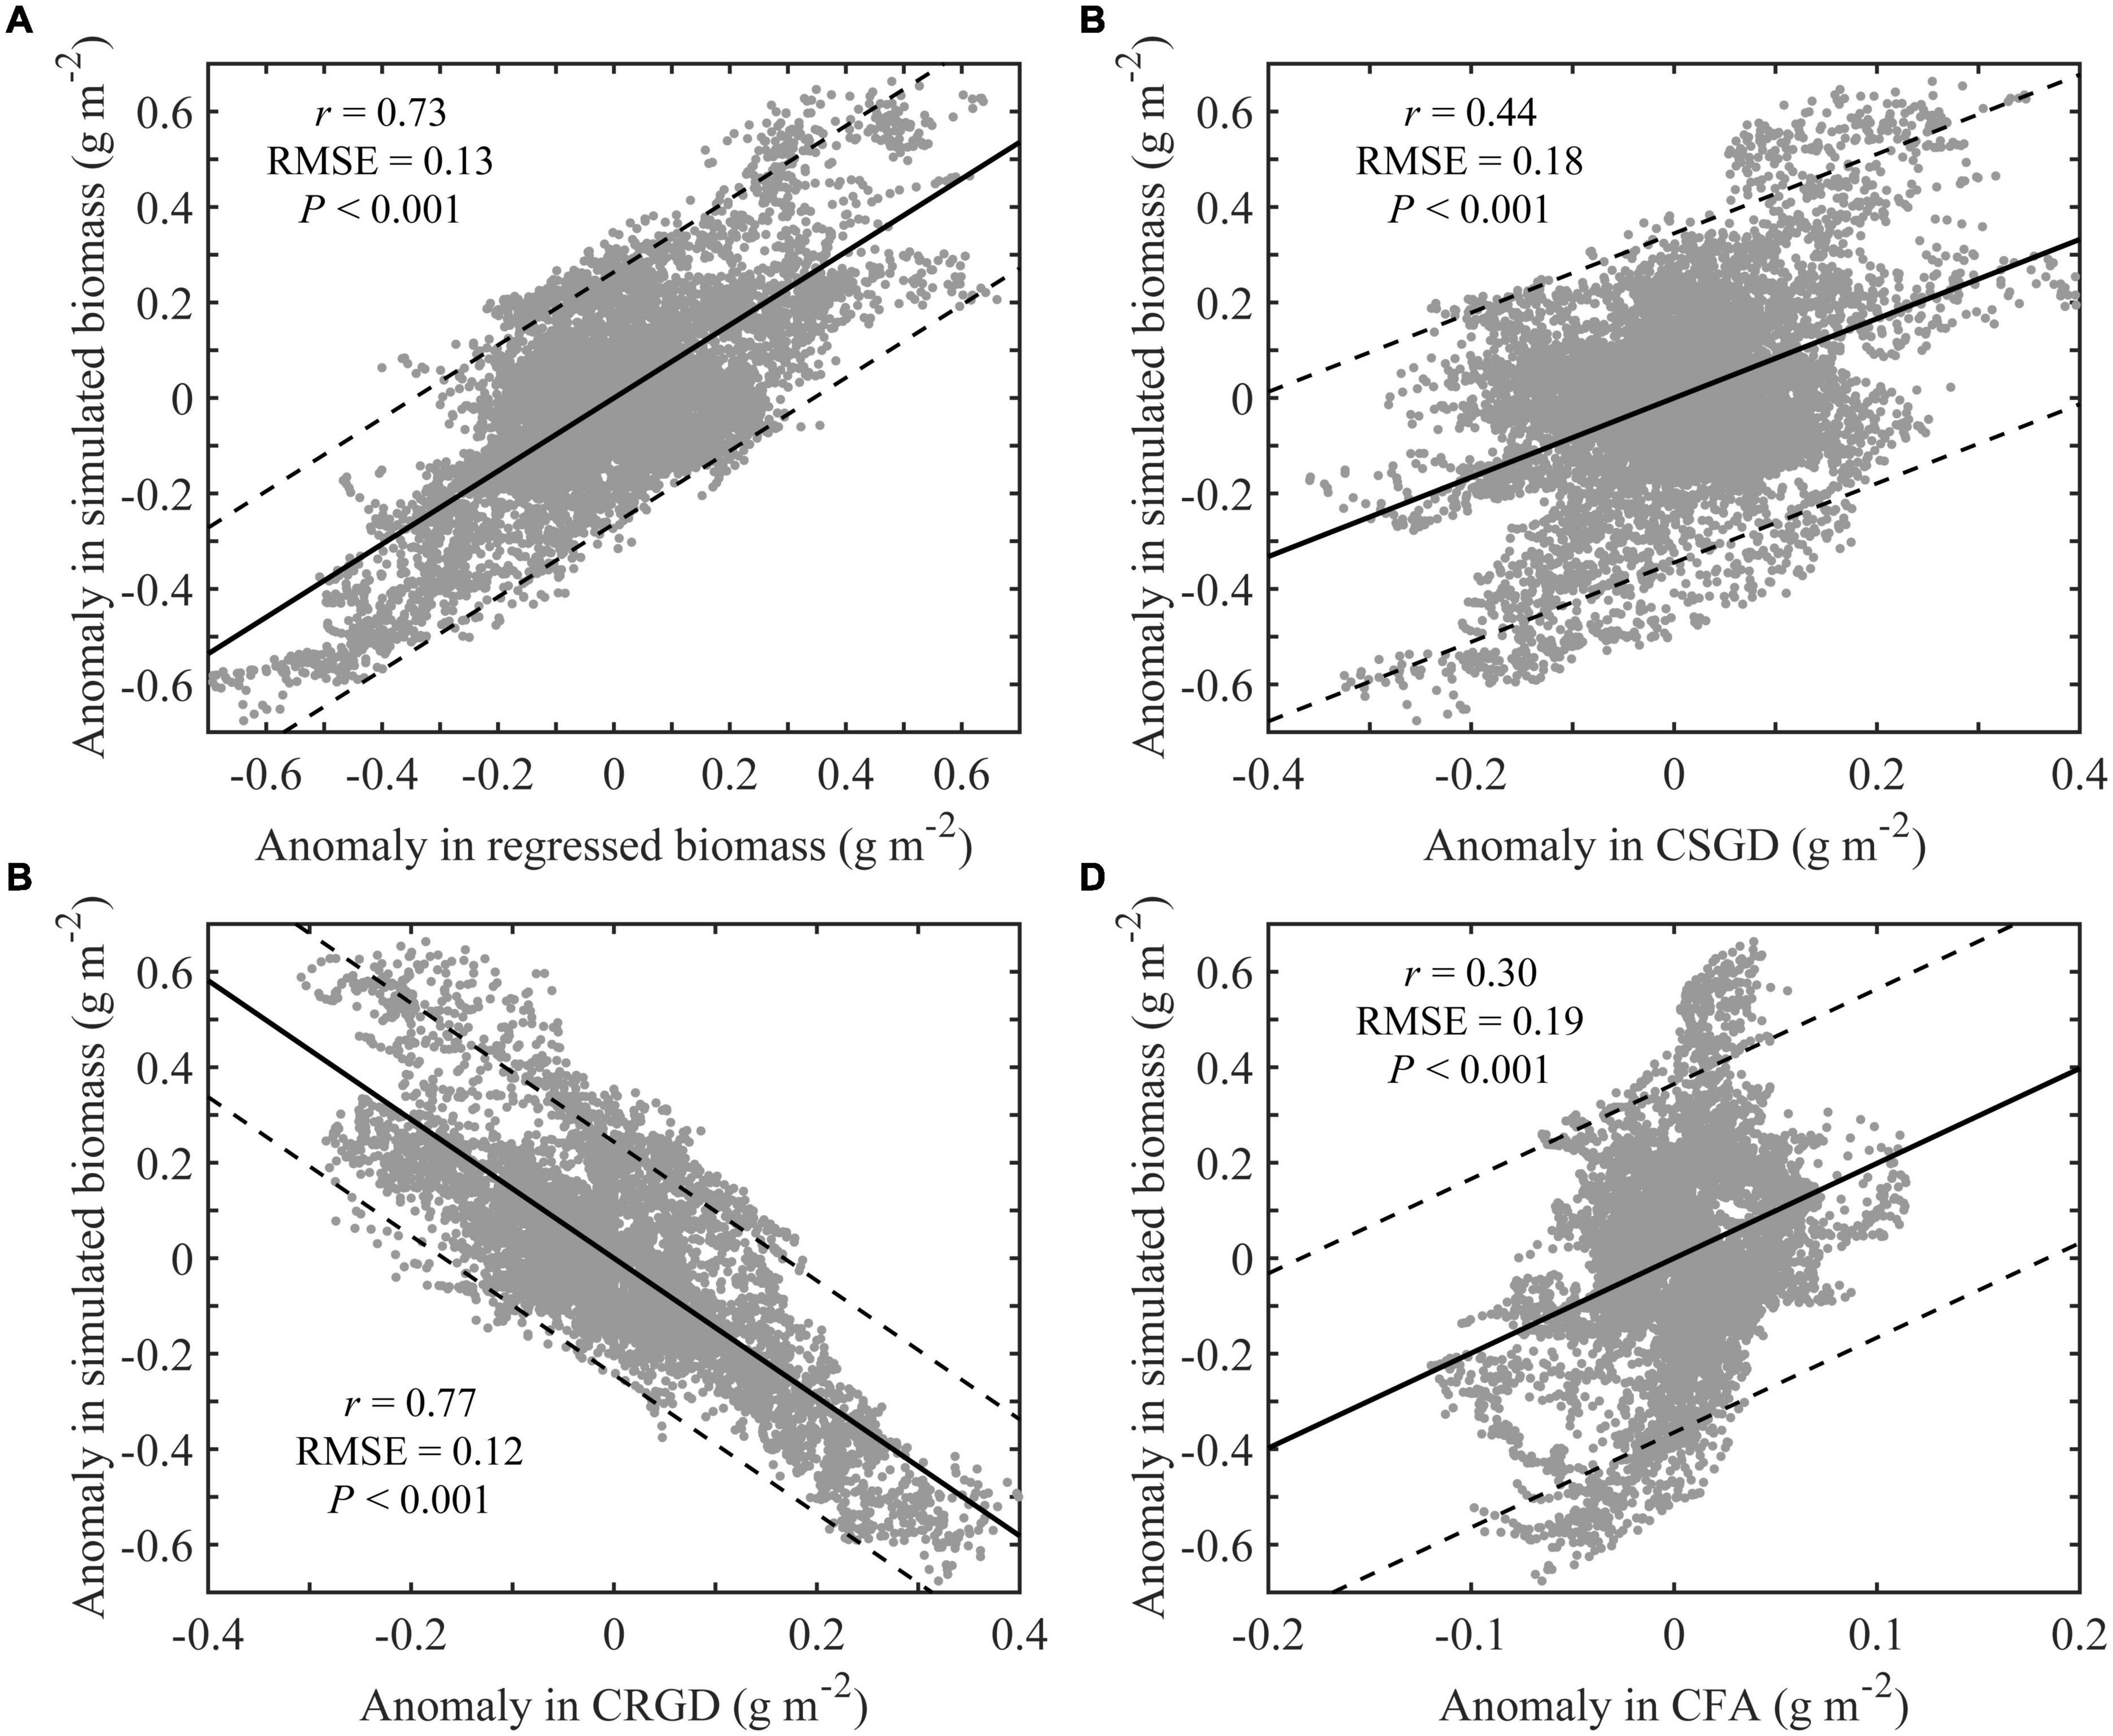
Figure 9. Correlation of the anomalies in simulated biomass and regressed biomass (A); CSGD (B); CRGD (C); and CFA (D) for the Yesso scallop (P. yessoensis) in the Changhai sea area, China. The black lines show regressed lines and the black solid line is the 95% confidence interval.
The correlation coefficients of RAW and RGDW (Figure 10, red dot A) and RAS and RGDS (Figure 10, red dot B) were 0.91 and 0.77, respectively, indicating that the range of growth restriction in each period could be used to indicate the change in unsuitable growth days. The correlation coefficients between the RGD and RGDW (Figure 10, red dot E) and RGDS (Figure 10, red dot F) were 0.96 and 0.19, respectively. This shows that the RGD in the study area was significantly affected by the RGDW. Further analysis of the correlation coefficients between RGD and RAW (Figure 10, red dot C) and RAS were 0.87 and 0.48, respectively. Correlation analysis shows that RAW could be used to characterize the interannual variations in RGD. In other words, the interannual variation in BIO could be inferred from the factors causing the interannual variation resulting in a bottom-water temperature was less than 0°C on February 1.
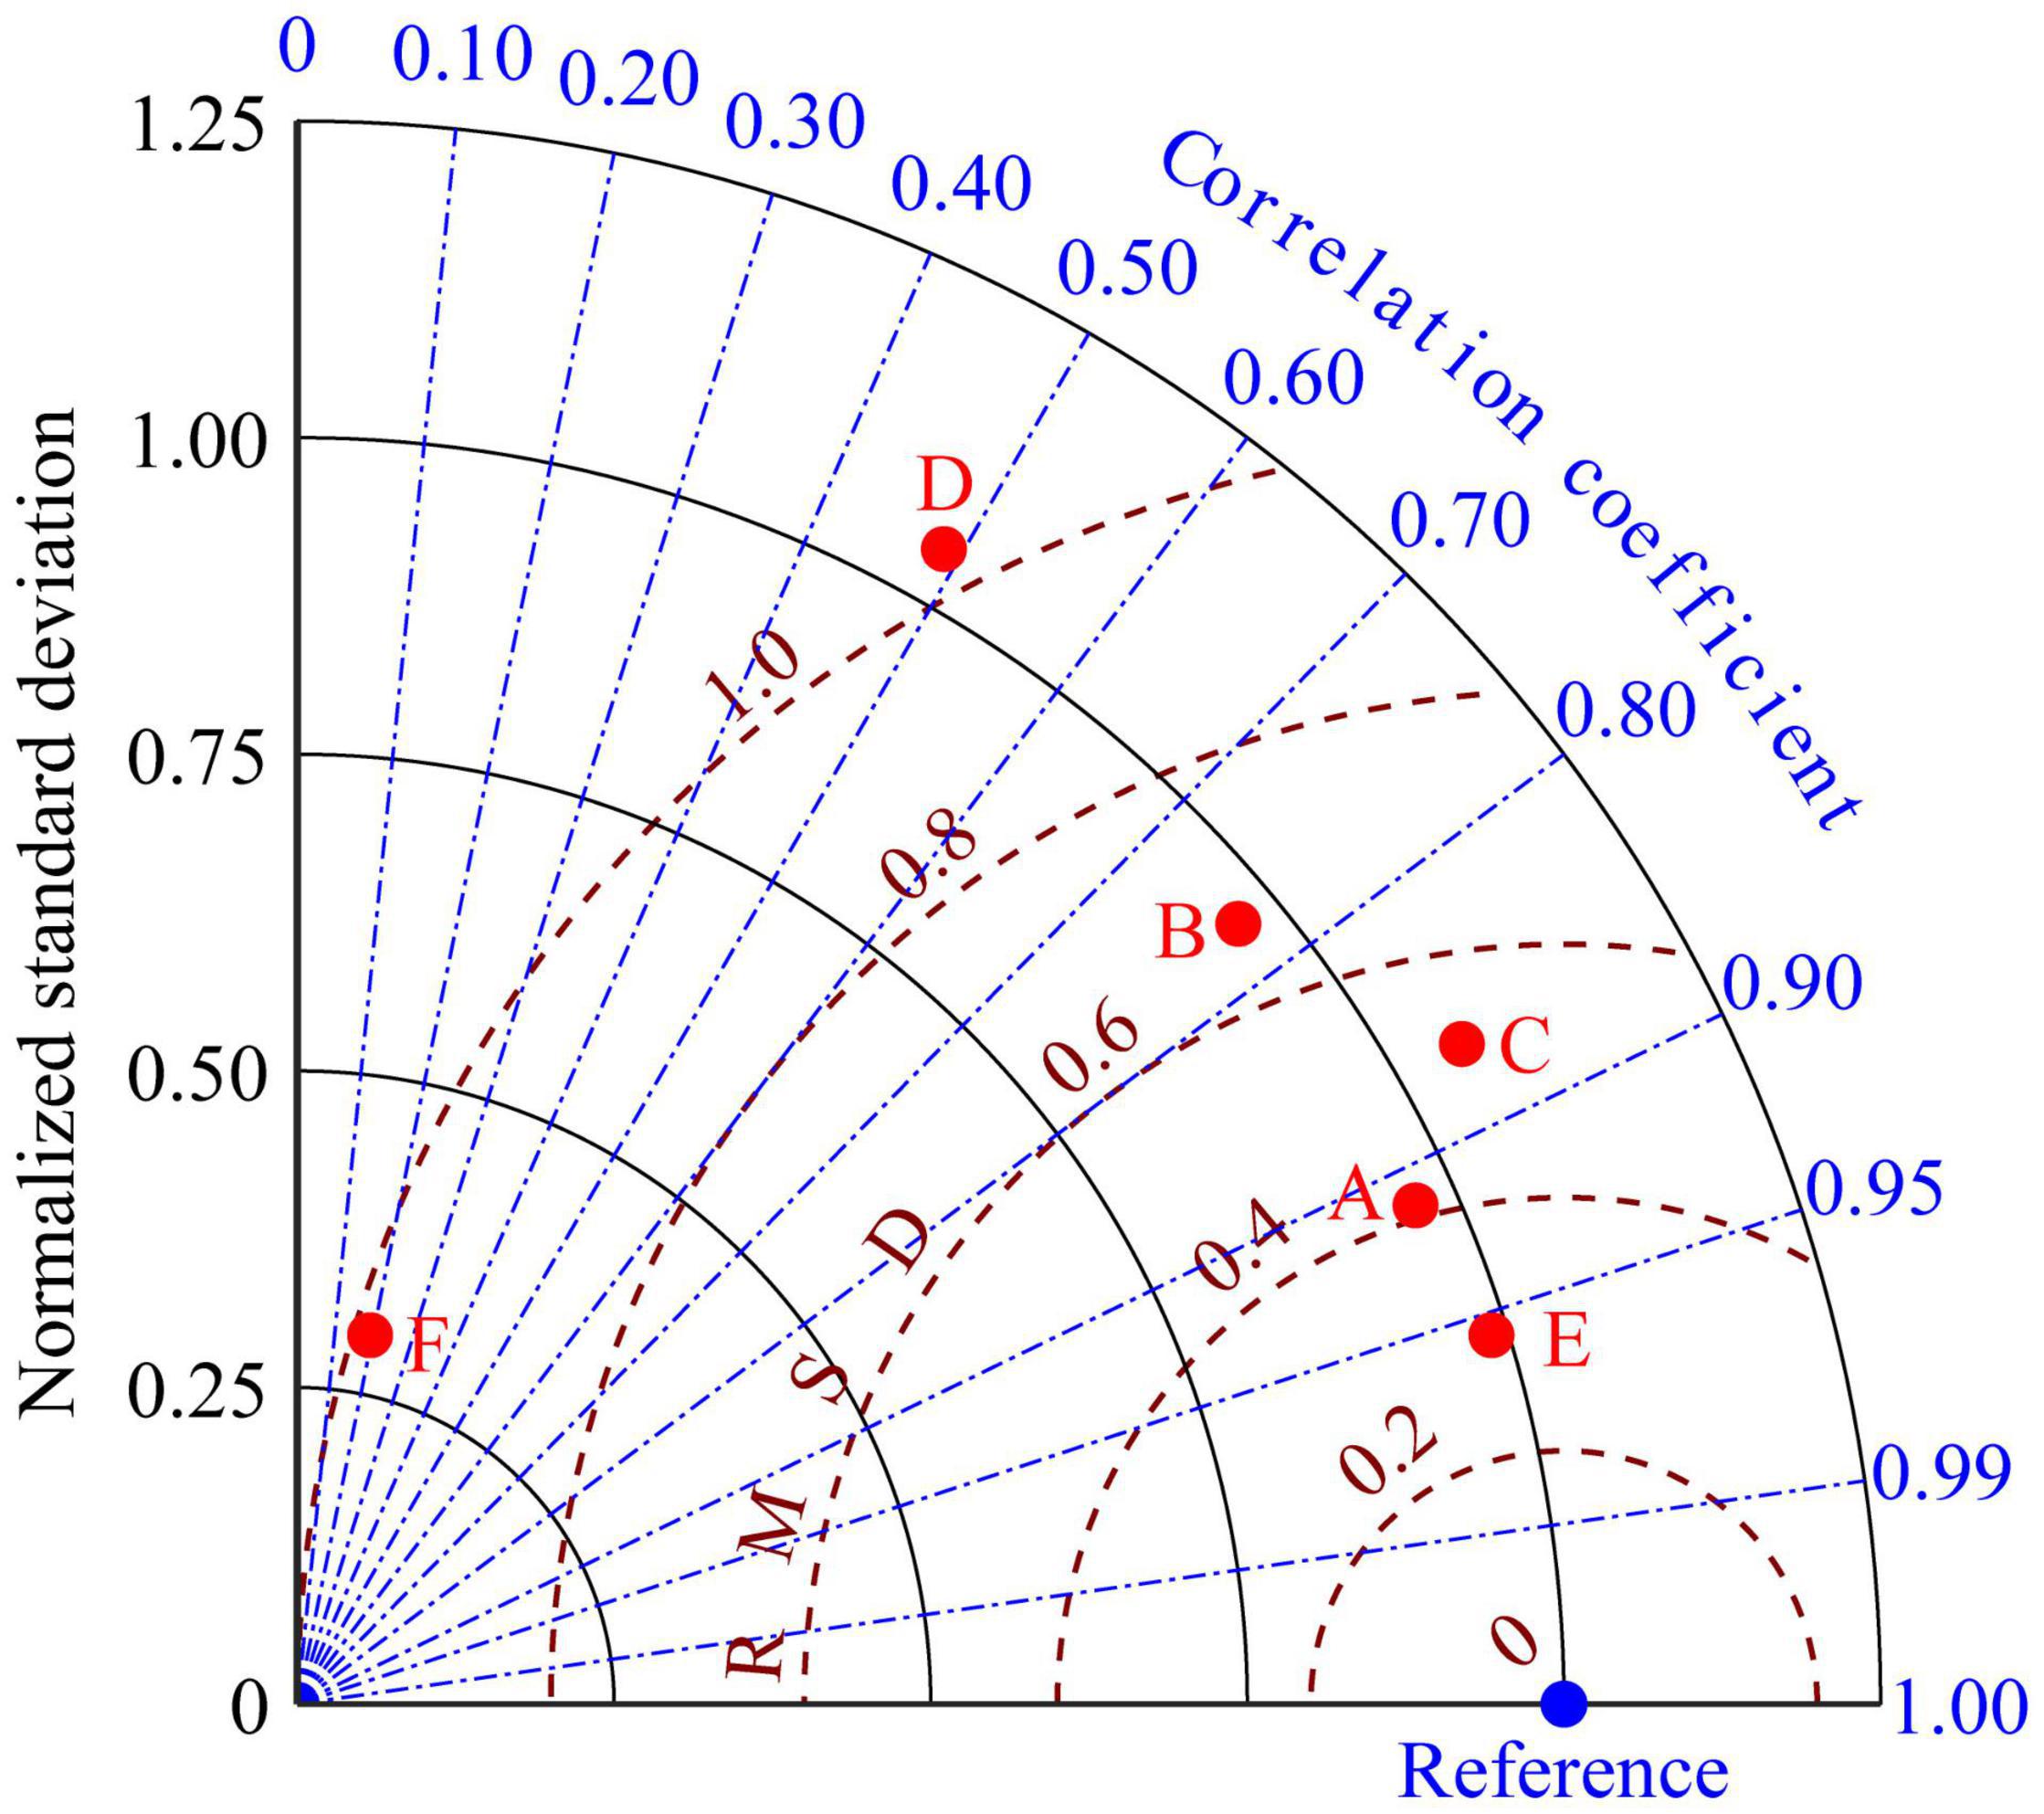
Figure 10. Taylor diagram comparing the temperature when the bottom-water temperature was less than 0°C in winter (RGDW) (blue dot) and when the bottom-water temperatures were less than 0°C on February 1 (RAW) (red dot A); when the bottom-water temperature was greater than 20°C in summer (RGDS) (blue dot) and when bottom-water temperatures of more than 20°C on September 1 (RAS) (red dot B), restricted growth days (RGD) (blue dot) and RAW (red dot C), RGD (blue dot) and RAS (red dot D), RGD (blue dot) and RGDW (red dot E), and RGD (blue dot) and RGDS (red dot F), respectively, for the Yesso scallop (P. yessoensis) in the Changhai sea area, China.
Deducing Interannual Variation in the Growth Ability of Scallop
The upward buoyancy flux at the air-sea interface (thermal forcing), together with the strong wind stress (mechanical forcing), generates turbulence and mixes the surface water with the deeper water (Chu et al., 1997). In winter, the deepening of the mixed layer (75 m in winter; Zhai et al., 2014) led to the water mixed evenly in the NYS, and the seawater temperature difference between the surface and bottom was small (Zhai, 2018). Additionally, the bottom-water temperature could be affected by the radiation flux, monsoon, and air temperature (Chu et al., 2005; Royer, 2005; Qiao et al., 2011; Li et al., 2015; Turner et al., 2017). The regional averaged air temperature, surface net solar radiation, surface sensible heat flux, surface net thermal radiation, and surface latent heat flux were extracted for the study area in early winter (November to next January). The correlation coefficients between the RAW and air temperature in early winter, surface net solar radiation, surface net thermal radiation, and the East Asian winter monsoon index were −0.75, −0.22, 0.09, and 0.48, respectively. RAW is closely related to the air temperature in the early winter and the East Asian winter monsoon index because the mixed layer is at its deepest (it usually fills the whole water column) during winter owing to both convection and wind mixing by the strong northeast monsoon winds (Chu et al., 1997). The air-sea heat budget at the sea surface is dominated by the incoming solar radiation balanced by latent and longwave heat energy loss (Chu et al., 2005). Further analysis of the correlation between the RAW with sensible heat flux and latent heat flux showed the correlation coefficients of −0.90 and −0.78, respectively. It was observed that the stronger the prevailing northerly wind was in winter, the greater the decrease in air temperature. The greater the air temperature decrease in the study area, the more heat is lost from the seawater, resulting in a decrease in seawater temperature. In early winter, the whole water column is uniformly cooled (Chu et al., 2005) and the more the seawater temperature decreases, the bigger the RAW. Based on this analysis, regional averaged air temperature in early winter can be used to characterize the variations in RAW. Moreover, RAW has a significant correlation with the regional averaged RGDW. Consequently, regional averaged air temperature in early winter can be directly correlated with RGDW (r = 0.84). In the previous section, we showed that RGDW is significantly related to RGD. Therefore, the regional averaged air temperature in early winter can be used to indicate the interannual variations in the growth ability of scallops.
Notably, this study assumed that the bottom-culture mode is adopted in the whole of the Changhai sea area and the same size of the scallop is sown evenly in each grid point, without considering the influence of different culture modes. There are 11 years of data (air temperature in early winter, RAW, RGDW, and RGD) as samples have been used to correlate. We hope that through the follow-up research can continue to expand the number of samples, to obtain more reliable results.
Conclusion
Under the premise of uniform seeding with scallops of the same size, the interannual variation in the growth of the scallops was simulated and analyzed by the YeSCE model in the Changhai sea area. The biomass of the bottom-cultured Yesso scallop could be expressed well linearly using SGD, RGD, and FA. SGD contributed the most to the spatial variations in biomass, but the interannual variations in the biomass were mainly affected by the RGD. The interannual variations in RGD were significantly correlated with RGD in winter. The RAW areas could characterize the interannual difference variations in RGD. The deepening of the mixed layer in winter makes the water mix evenly and maintains the uniform temperature at the surface and the bottom. Consequently, the regional averaged air temperature in the early winter could be used to predict the interannual growth in the bottom-cultured Yesso scallop, which could be useful for disaster warning and prevention of damage to the scallops. In this study, the interannual variations in bottom-cultured Yesso scallop biomass are discussed based on the two main influencing factors, namely, bottom-water temperature and food availability. However, the growth of the Yesso scallop is also affected by scallop density, disease, acidification, and other factors, and further research should be carried out in the future.
Data Availability Statement
The raw data supporting the conclusions of this article will be made available by the authors, without undue reservation.
Author Contributions
XN established the YeSCE model and completed the first draft. HN guided the data analysis and the structure of the manuscript. HW and HZ provided the suggestions on the revision of the manuscript. All authors contributed to revising the manuscript.
Funding
This study was funded by the Strategic Priority Research Program of the Chinese Academy of Sciences (Grant No. XDA23050502), the National Key Research and Development Program of China (Grant Nos. 2017YFC1404403 and 2016YFC1401602), and the National Natural Science Foundation of China (Grant No. 41806018).
Conflict of Interest
The authors declare that the research was conducted in the absence of any commercial or financial relationships that could be construed as a potential conflict of interest.
Publisher’s Note
All claims expressed in this article are solely those of the authors and do not necessarily represent those of their affiliated organizations, or those of the publisher, the editors and the reviewers. Any product that may be evaluated in this article, or claim that may be made by its manufacturer, is not guaranteed or endorsed by the publisher.
Acknowledgments
The authors thank numerous colleagues for their generous support of this study and also the editor and reviewers for their constructive suggestions to our work.
Footnotes
References
Aura, C. M., Saitoh, S. I., Liu, Y., Hirawake, T., Baba, K., and Yoshida, T. (2016). Implications of marine environment change on Japanese scallop (Mizuhopecten yessoensis) aquaculture suitability: a comparative study in Funka and Mutsu Bays. Japan. Aquac. Res. 47, 2164–2182. doi: 10.1111/are.12670
Aya, F. A., and Kudo, I. (2010). Isotopic shifts with size, culture habitat, and enrichment between the diet and tissues of the Japanese scallop Mizuhopecten yessoensis (Jay, 1857). Mar. Biol. 157, 2157–2167. doi: 10.1007/s00227-010-1480-y
Boyer, T., Locarnini, R. A., Zweng, M. M., Mishonov, A. V., Reagan, J. R., Antonov, J. I., et al. (2015). Changes to Calculations of the World Ocean Atlas 2013 for Version 2.
Chen, C. T. A. (2009). Chemical and physical fronts in the Bohai, Yellow and East China seas. J. Mar. Syst. 78, 394–410. doi: 10.1016/j.jmarsys.2008.11.016
Chen, J. Y. (2019). Seize opportunities to accelerate the green development of aquaculture. Chin. Fish. Qual. Stand. 9, 1–4.
Chu, P. C., Chen, Y. C., and Kuninaka, A. (2005). Seasonal variability of the yellow sea/east china sea surface fluxes and thermohaline structure. Adv. Atmos. Sci. 22, 1–20. doi: 10.1007/BF02930865
Chu, P. C., Wells, S. K., Haeger, S. D., Szczechowski, C., and Carron, M. (1997). Temporal and spatial scales of the yellow sea thermal variability. J. Geophys. Res. 102, 5655–5667. doi: 10.1029/96JC03428
Cummings, J. A. (2005). Operational multivariate ocean data assimilation. Q. J. R. Meteorol. Soc. 131, 3583–3604. doi: 10.1256/qj.05.105
Dee, D. P., Uppala, S. M., Simmons, A. J., Berrisford, P., Poli, P., Kobayashi, S., et al. (2011). The ERA-Interim reanalysis: configuration and performance of the data assimilation system. Q. J. R. Meteorol. Soc. 137, 553–597. doi: 10.1002/qj.828
Guan, B. X. (1963). A preliminary study of the temperature variations and the characteristics of the circulation of the Cold Water Mass in Yellow Sea. Oceanol. Limnol. Sin. 5, 255–284.
His, E., Robert, R., and Dine, A. (1989). Combined effects of temperature and salinity on fed and starved larvae of the Mediterranean mussel Mytilus galloprovincialis and the Japanese oyster Crassostrea gigas. Mar. Biol. 100, 455–463. doi: 10.1007/BF00394822
Huang, D. J., Zhang, T., and Zhou, F. (2010). Sea-surface temperature fronts in the Yellow and East China Seas from TRMM microwave imager data. Deep Sea Res. Part II Top. Stud. Oceanogr. 57, 1017–1024. doi: 10.1016/j.dsr2.2010.02.003
Jiang, W. W., Du, M. R., Fang, J. G., Gao, Y. P., Mao, Y. Z., Chen, Q. L., et al. (2018). Response of yesso scallop Patinopecten yessoensis to acute temperature challenge: physiological and biochemical parameters. J. Oceanol. Limnol. 37, 321–329. doi: 10.1007/s00343-019-7245-7
Jiang, W. W., Lin, F., Du, M. R., Fang, J. G., Fang, J. H., and Gao, Y. P. (2020). Simulation of Yesso scallop, Patinopecten yessoensis, growth with a dynamic energy budget (DEB) model in the mariculture area of Zhangzidao Island. Aquac. Int. 28, 59–71. doi: 10.1007/s10499-019-00447-6
Kooijman, S. A. L. M. (2010). Dynamic Energy Budget Theory for Metabolic Organisation. Cambridge: Cambridge University Press, 1–514. doi: 10.1017/CBO9780511805400
Laurel, B. J., Hurst, T. P., and Ciannelli, L. (2011). An experimental examination of temperature interactions in the match–mismatch hypothesis for Pacific cod larvae. Can. J. Fish. Aquat. Sci. 68, 51–61. doi: 10.1139/F10-130
Li, A., Yu, F., and Diao, X. Y. (2015). Interannual salinity variability of the northern yellow sea cold water mass. Chin. J. Ocean. Limnol. 33, 779–789. doi: 10.1007/s00343-015-4210-y
Li, H. B., Liang, Y. B., and Yuan, X. T. (2012). The effect of raft-culture on distribution of Synchococcus in Changhai waters. Liaoning. Acta Oceanol. Sin. 34, 221–225.
Liu, S. M., Hong, G. H., Zhang, J., Ye, X. W., and Jiang, X. L. (2009). Nutrient budgets for large Chinese estuaries. Biogeosciences 6, 2245–2263. doi: 10.5194/bg-6-2245-2009
Liu, Y., Saitoh, S. I., Radiarta, I. N., Igarashi, H., and Hirawake, T. (2014). Spatiotemporal variations in suitable areas for Japanese scallop aquaculture in the Dalian coastal area from 2003 to 2012. Aquaculture 422–423, 172–183. doi: 10.1016/j.aquaculture.2013.11.033
Nan, X. L., Wei, H., Fan, R. F., and Yang, W. (2020). Rapid changes in the near-bottom temperature of the bottom aquaculture area around the Zhangzi Island in summer. Acta Oceanol. Sin. 39, 46–54. doi: 10.1007/s13131-020-1605-1
Nan, X. L., Wei, H., Zhang, H. Y., and Nie, H. T. (2021). Spatial difference in net growth rate of Yesso scallop Patinopecten yessoensis revealed by an aquaculture ecosystem model. J. Ocean. Limnol. doi: 10.1007/s00343-021-0423-4 [Epub ahead of print].
Qiao, L. L., Wang, X. H., Wang, Y. Z., Wu, D. X., Bao, X. W., and Mu, L. (2011). Winter heat budget in the Huanghai Sea and the effect from Huanghai Warm Current (Yellow Sea Warm Current). Acta Oceanol. Sin. 30, 56–63. doi: 10.1007/s13131-011-0147-y
Radiarta, I. N., Saitoh, S. I., and Miyazono, A. (2008). GIS-based multi-criteria evaluation models for identifying suitable sites for Japanese scallop (Mizuhopecten yessoensis) aquaculture in Funka Bay, southwestern Hokkaido. Japan. Aquac. 284, 127–135. doi: 10.1016/j.aquaculture.2008.07.048
Rico-Villa, B., Pouvreau, S., and Robert, R. (2009). Influence of food density and temperature on ingestion growth and settlement of Pacific oyster larvae Crassostrea gigas. Aquaculture 287, 395–401. doi: 10.1016/j.aquaculture.2008.10.054
Royer, T. C. (2005). Hydrographic responses at a coastal site in the northern Gulf of Alaska to seasonal and interannual forcing. Deep Sea Res. Part II Top. Stud. Oceanogr. 52, 267–288. doi: 10.1016/j.dsr2.2004.09.022
Shchepetkin, A. F., and McWilliams, J. C. (2005). The regional oceanic modeling system (ROMS): a split-explicit, free-surface, topography-following-coordinate oceanic model. Ocean Model. 9, 347–404. doi: 10.1016/j.ocemod.2004.08.002
Shumway, S. E., Cucci, T. L., Lesser, M. P., Bourne, N., and Bunting, B. (1997). Particle clearance and selection in three species of juvenile scallops. Aquac. Int. 5, 89–99. doi: 10.1007/BF02764790
Shumway, S. E., Selvin, R., and Shick, D. F. (1987). Food resources related to habitat in the scallop, Placopecten magellanicus (Gmelin, 1791): a qualitative study. J. Shellfish Res. 6, 89–95.
Silina, A. V., and Zhukova, N. V. (2007). Growth variability and feeding of scallop Patinopecten yessoensis on different bottom sediments: evidence from fatty acid analysis. J. Exp. Mar. Biol. Ecol. 348, 46–59. doi: 10.1016/j.jembe.2007.03.018
Taylor, K. E. (2001). Summarizing multiple aspects of model performance in a single diagram. J. Geophys. Res. 106, 7183–7192. doi: 10.1029/2000JD900719
Tong, Y. D., Zhao, Y., Zhen, G. C., Chi, J., Liu, X. H., Lu, Y. R., et al. (2015). Nutrient loads flowing into coastal waters from the main rivers of China (2006-2012). Sci. Rep. 5:16678. doi: 10.1038/srep16678
Turner, R. E., Rabalais, N. N., and Justić, D. (2017). Trends in summer bottom-water temperatures on the northern Gulf of Mexico continental shelf from 1985 to 2015. PLoS One 12:e0184350. doi: 10.1371/journal.pone.0184350
Verween, A., Vincx, M., and Degraer, S. (2007). The effect of temperature and salinity on the survival of Mytilopsis leucophaeata larvae (Mollusca, Bivalvia): The search for environmental limits. J. Exp. Mar. Biol. Ecol. 348, 111–120. doi: 10.1016/j.jembe.2007.04.011
Wang, J. N., Yan, W. J., Chen, N. W., Li, X. Y., and Liu, L. S. (2015). Modeled long-term changes of DIN: DIP ratio in the Changjiang River in relation to Chl-a and DO concentrations in adjacent estuary. Estuar. Coast. Shelf Sci. 166, 153–160. doi: 10.1016/j.ecss.2014.11.028
Wei, H., Su, J., Wan, R. J., Wang, L., and Lin, Y. A. (2003). Tidal front and the convergence of anchovy (Engraulis japonicus) eggs in the Yellow Sea. Fish. Oceanogr. 12, 434–442. doi: 10.1046/j.1365-2419.2003.00259.x
Xiu, P., and Chai, F. (2014). Connections between physical, optical and biogeochemical processes in the Pacific Ocean. Prog. Oceanogr. 122, 30–53. doi: 10.1016/j.pocean.2013.11.008
Yang, S., Lau, K. M., and Kim, K. M. (2002). Variations of the East Asian jet stream and Asian-Pacific-American winter climate anomalies. J. Clim. 15, 306–325.
Yin, J. H., Zhang, G. T., Zhao, Z. X., Wang, S. W., and Wan, A. Y. (2013). Annual variation in Calanus sinicus abundance and population structure in the northern boundary area of the Yellow Sea Cold Water Mass. Chin. J. Ocean. Limnol. 31, 1284–1294. doi: 10.1007/s00343-013-3004-3
Yuan, X. T., Zhang, M. J., Liang, Y. B., Liu, D., and Guan, D. M. (2010). Self-pollutant loading from a suspension aquaculture system of Japanese scallop (Patinopecten yessoensis) in the Changhai sea area, Northern Yellow Sea of China. Aquaculture 304, 79–87. doi: 10.1016/j.aquaculture.2010.03.026
Zhai, W. D. (2018). Exploring seasonal acidification in the Yellow Sea. Sci. China Earth Sci. 61, 647–658. doi: 10.1007/s11430-017-9151-4
Zhai, W. D., Zheng, N., Huo, C., Xu, Y., Zhao, H. D., Li, Y.-W., et al. (2014). Subsurface pH and carbonate saturation state of aragonite on the Chinese side of the North Yellow Sea: seasonal variations and controls. Biogeosciences 11, 1103–1123. doi: 10.5194/bg-11-1103-2014
Zhang, J. (1996). Nutrient elements in large Chinese estuaries. Cont. Shelf Res. 16, 1023–1045. doi: 10.1016/0278-4343(95)00055-0
Zhang, J. H., Wu, W. G., Liu, Y., Lin, F., Wang, W., and Niu, Y. L. (2017). A dynamic energy budget (DEB) growth model for Japanese scallop Patinopecten yessoensis cultured in China. J. Fish. Sci. China 24, 497–506.
Zhao, B. R. (1985). The fronts of the Huanghai Sea Cold Water Mass induced by tidal mixing. Oceanol. Limnol. Sin. 16, 451–459.
Keywords: interannual variation, shellfish aquaculture, Yesso scallop, match-mismatch condition, Changhai sea area
Citation: Nan X, Wei H, Zhang H and Nie H (2022) Factors Influencing the Interannual Variation in Biomass of Bottom-Cultured Yesso Scallop (Patinopecten yessoensis) in the Changhai Sea Area, China. Front. Mar. Sci. 8:798359. doi: 10.3389/fmars.2021.798359
Received: 20 October 2021; Accepted: 10 December 2021;
Published: 10 January 2022.
Edited by:
JInghui Fang, Yellow Sea Fisheries Research Institute, Chinese Academy of Fishery Sciences (CAFS), ChinaReviewed by:
I. Nyoman Radiarta, Marine Research Center, IndonesiaXiutang Yuan, Yantai Institute of Coastal Zone Research, Chinese Academy of Sciences (CAS), China
Copyright © 2022 Nan, Wei, Zhang and Nie. This is an open-access article distributed under the terms of the Creative Commons Attribution License (CC BY). The use, distribution or reproduction in other forums is permitted, provided the original author(s) and the copyright owner(s) are credited and that the original publication in this journal is cited, in accordance with accepted academic practice. No use, distribution or reproduction is permitted which does not comply with these terms.
*Correspondence: Hongtao Nie, aHRuaWVAdGp1LmVkdS5jbg==