
94% of researchers rate our articles as excellent or good
Learn more about the work of our research integrity team to safeguard the quality of each article we publish.
Find out more
ORIGINAL RESEARCH article
Front. Mar. Sci., 06 January 2022
Sec. Marine Pollution
Volume 8 - 2021 | https://doi.org/10.3389/fmars.2021.794636
 Bavo De Witte1*†
 Ana I. Catarino2†
 Loes Vandecasteele1†
 Michael Dekimpe1
 Nelle Meyers1,2
 Daphné Deloof1
 Steven Pint2
 Kris Hostens1‡
 Gert Everaert2‡
 Els Torreele1‡
Monitoring the occurrence and trends of microplastic contamination in the marine environment is key to establish microplastic (MP) data baselines, to work out policy mitigation measures, and to assess the effectiveness of waste regulations. To establish MP contamination baselines in the marine environment, marine biota species can be selected as monitoring matrices to track plastic pollution in the environment. The aim of this work was to evaluate the feasibility of biomonitoring MPs in fish gastrointestinal tract (GIT). A selection of suitable fish species was performed, based on species distribution, sampling effort, commercial value of species, sustainable development of fish populations, migration behaviour, and scientific evidence for occurrence of MPs in the fish GIT. Sampling and MP extraction protocols were developed and validated on fish GIT samples acquired in the Southern North Sea. The fish species selection protocol enabled the selection of ubiquitous distributed and non-endangered fish species relevant for MP monitoring in the North Sea. The fish GIT sampling protocol considered background contamination measures and sampling fillet as procedural blanks. Advantages and disadvantages of onboard dissection were discussed. The MPs extraction protocol was based on matrix digestion, density separation, and Nile red staining of particles followed by fluorescent microscopy observation. The confirmation of MPs identification and the analysis of the polymer composition was done using micro-Fourier transform infrared (μFTIR) spectroscopy. The MP analysis indicated a low number of MPs in the fish GIT. The mean number of particles per single fish GIT was 0.48 ± 0.81 (Nile red staining observations) to 0.26 ± 0.64 (corrected for background contamination). A power analysis (sampling effort) indicated that to detect significant differences, in a balanced-ANOVA type of analysis, between species and/or sampling areas, the sample size would require a minimum of 109 up to 370 individual fish. The feasibility of MP biomonitoring in fish GIT was assessed by a SWOT-analysis, which indicated that fish GIT is a suitable matrix for biomonitoring of MPs, but that the large number of samples needed to identify significant differences can be a major drawback. A potential implementation strategy for MP biomonitoring within Europe was suggested.
Plastic pollution is an issue of increased environmental concern and the establishment of monitoring campaigns is key to assess the spatiotemporal presence of marine litter. Accumulation of litter in the marine environment is linked to increased plastic production (Geyer et al., 2017), to poor waste management (GESAMP, 2019) and to the persistency of plastics (Derraik, 2002). More than 80% of all litter items in the oceans are made of plastic (GESAMP, 2019). Environmental plastic contamination can enter directly the marine environment, or can be secondary generated into smaller ones after degradation of larger objects (GESAMP, 2019). Plastic litter can be further categorised according to size range: macroplastics (>5 mm), microplastics (MPs, 1 μm–5 mm), and nanoplastics (<1 μm) (Lippiatt et al., 2013; GESAMP, 2019). Of these three size categories, microplastics are of particular concern, since they are readily ingested by organisms in the field, and they might cause physiological effects to biota. For example, it has been suggested that MPs induce inhibition of digestive processes (Blarer and Burkhardt-Holm, 2016), cause gut abrasion and lesions (Ahrendt et al., 2020), and induce a false sensation of satiation, leading to malnutrition and hunger (Martins and Guilhermino, 2018). The information on MPs accumulation over time will inform on the exposure of organisms to micro-litter items and chemical components associated to MPs (GESAMP, 2019). Only with well-established good quality data baselines, will policymakers have tools to propose mitigation measures, and to assess the effectiveness of plastic reduction measures (GESAMP, 2019).
The gastrointestinal tract (GIT) content of fish is a broadly used matrix to assess MP contamination in the marine environment (Lusher et al., 2017a,b). Microplastics have been detected in a large number of GIT from fish species of different geographical areas and trophic levels (Collard et al., 2017b; Güven et al., 2017; Jabeen et al., 2017; Lusher et al., 2017a; Kühn et al., 2020). Although translocation of small MPs (<5 μm) through intestinal epithelium to the circulatory system cannot be fully excluded (Avio et al., 2015; Collard et al., 2017a; Abbasi et al., 2018), fish muscle, for instance, seems not to be a suitable matrix for MP surveying as the occurrence of MPs in the fillet is considered negligible (Lusher et al., 2017a; Gouin, 2020). Fish GIT content, however, is a potentially valuable matrix for MP monitoring as it can temporary accumulate environmental plastic particles, and as fish fulfils different important monitoring criteria (MSFD Technical Subgroup on Marine Litter, 2013), being: (1) accessibility to sample; (2) present in high abundance; (3) available in a wide geographical distribution; (4) covering different ecological niches; and (5) MPs have been reported in a wide range of fish species (GIT). For example, MPs ingestion by fish has been reported in the North Sea, ranging between upper limits of 36.5% of MP presence in the observed individuals (Lusher et al., 2013), to lower limits of 2.6% (Foekema et al., 2013), 1.8% (Kühn et al., 2020) or 0.25% (Hermsen et al., 2017). Previous studies suggest that the number of MPs found in the fish GIT can depend on species feeding behaviour, size, trophic level, and ecological niche (Claessens et al., 2011; Rummel et al., 2016; Ory et al., 2017; Beer et al., 2018; ICES, 2018; Kühn et al., 2020). Moreover, habitat (e.g., pelagic habitats, sediment type) and time of sampling can influence the type and number of MPs found in the fish GIT (Romeo et al., 2015; Rummel et al., 2016; Jabeen et al., 2017; Bray et al., 2019; Gouin, 2020; Kühn et al., 2020). According to Gouin (2020) MPs do not bioaccumulate and do not appear to be subject to biomagnification, but are available for fish at any level of the food web (via ingestion). The expected low abundances of MPs in fish GIT implies that large sample sizes may be needed to acquire data on the spatial distribution of plastic particles. The South-European INDICIT consortium, that aims to develop tools for monitoring the impact of marine litter in fish, indicates that sample sizes should be of at least 30 individuals (Matiddi et al., 2021), however, without a power or any other statistical analysis backing up this suggestion.
The selection of species to implement a feasible MPs monitoring programme requires the use of objective selection criteria based on available fisheries and aquaculture data. The North Sea is a geographic area with well-covered information on fisheries data, and a good candidate area to pilot a study on the potential implementation of a MPs biomonitoring programme using fish GIT. In the North East Atlantic, fisheries data for scientific advice is collected and managed under the European Data Collection Framework (EC 2021/1167) (European Commission, 2021). Scientific fisheries surveys are part of this framework and are organised by the different countries on a national level under the National Data Gathering Programme (NDGP) (Joint Research Centre of Commission of the European, 2021). On behalf of Belgium, the Flanders Research Institute for Agriculture, Fisheries and Food (ILVO) is responsible for the execution of two of these surveys: The North Sea Beam Trawl Survey (NS-BTS) and Demersal Young Fish Survey (DYFS) in the southern North Sea (ICES, 2021a). These surveys run annually and are internationally coordinated by the Working Group on Beam Trawl Surveys (WGBEAM) at the International Council for the Exploration of the Sea (ICES). The BTS focusses on the offshore areas of the central and southern North Sea and the offshore areas along the eastern English, Belgian, Dutch, German, and Danish coast. The DYFS only runs in the southern North Sea and focusses on the inshore areas of the Belgium, German and Dutch coast. When combining the fisheries surveys of the United Kingdom, the Netherlands and Germany, each with their own NDGP, as good as the entire central and southern part of the North Sea is covered with sampling locations.
The goal of this work was to assess the feasibility of using the GIT of commercial fish to quantify the level of MP pollution in the North Sea. The work includes the development of procedures to select appropriate fish species, as well as protocols to sample fish GIT onboard and to extract and identify MPs. The number of MPs detected in fish GIT was used to calculate the required sample sizes to obtain meaningful results about potential regional differences in MP pollution with sufficient discriminative power. All data was considered in the analysis of the strengths, weaknesses, opportunities and threats (SWOT) of MP biomonitoring in fish GIT.
To establish a biomonitoring programme for microplastics in fish GIT, a workflow was established, including a development phase, validation of the developed protocols and the assessment of the feasibility of the biomonitoring programme implementation (Figure 1).
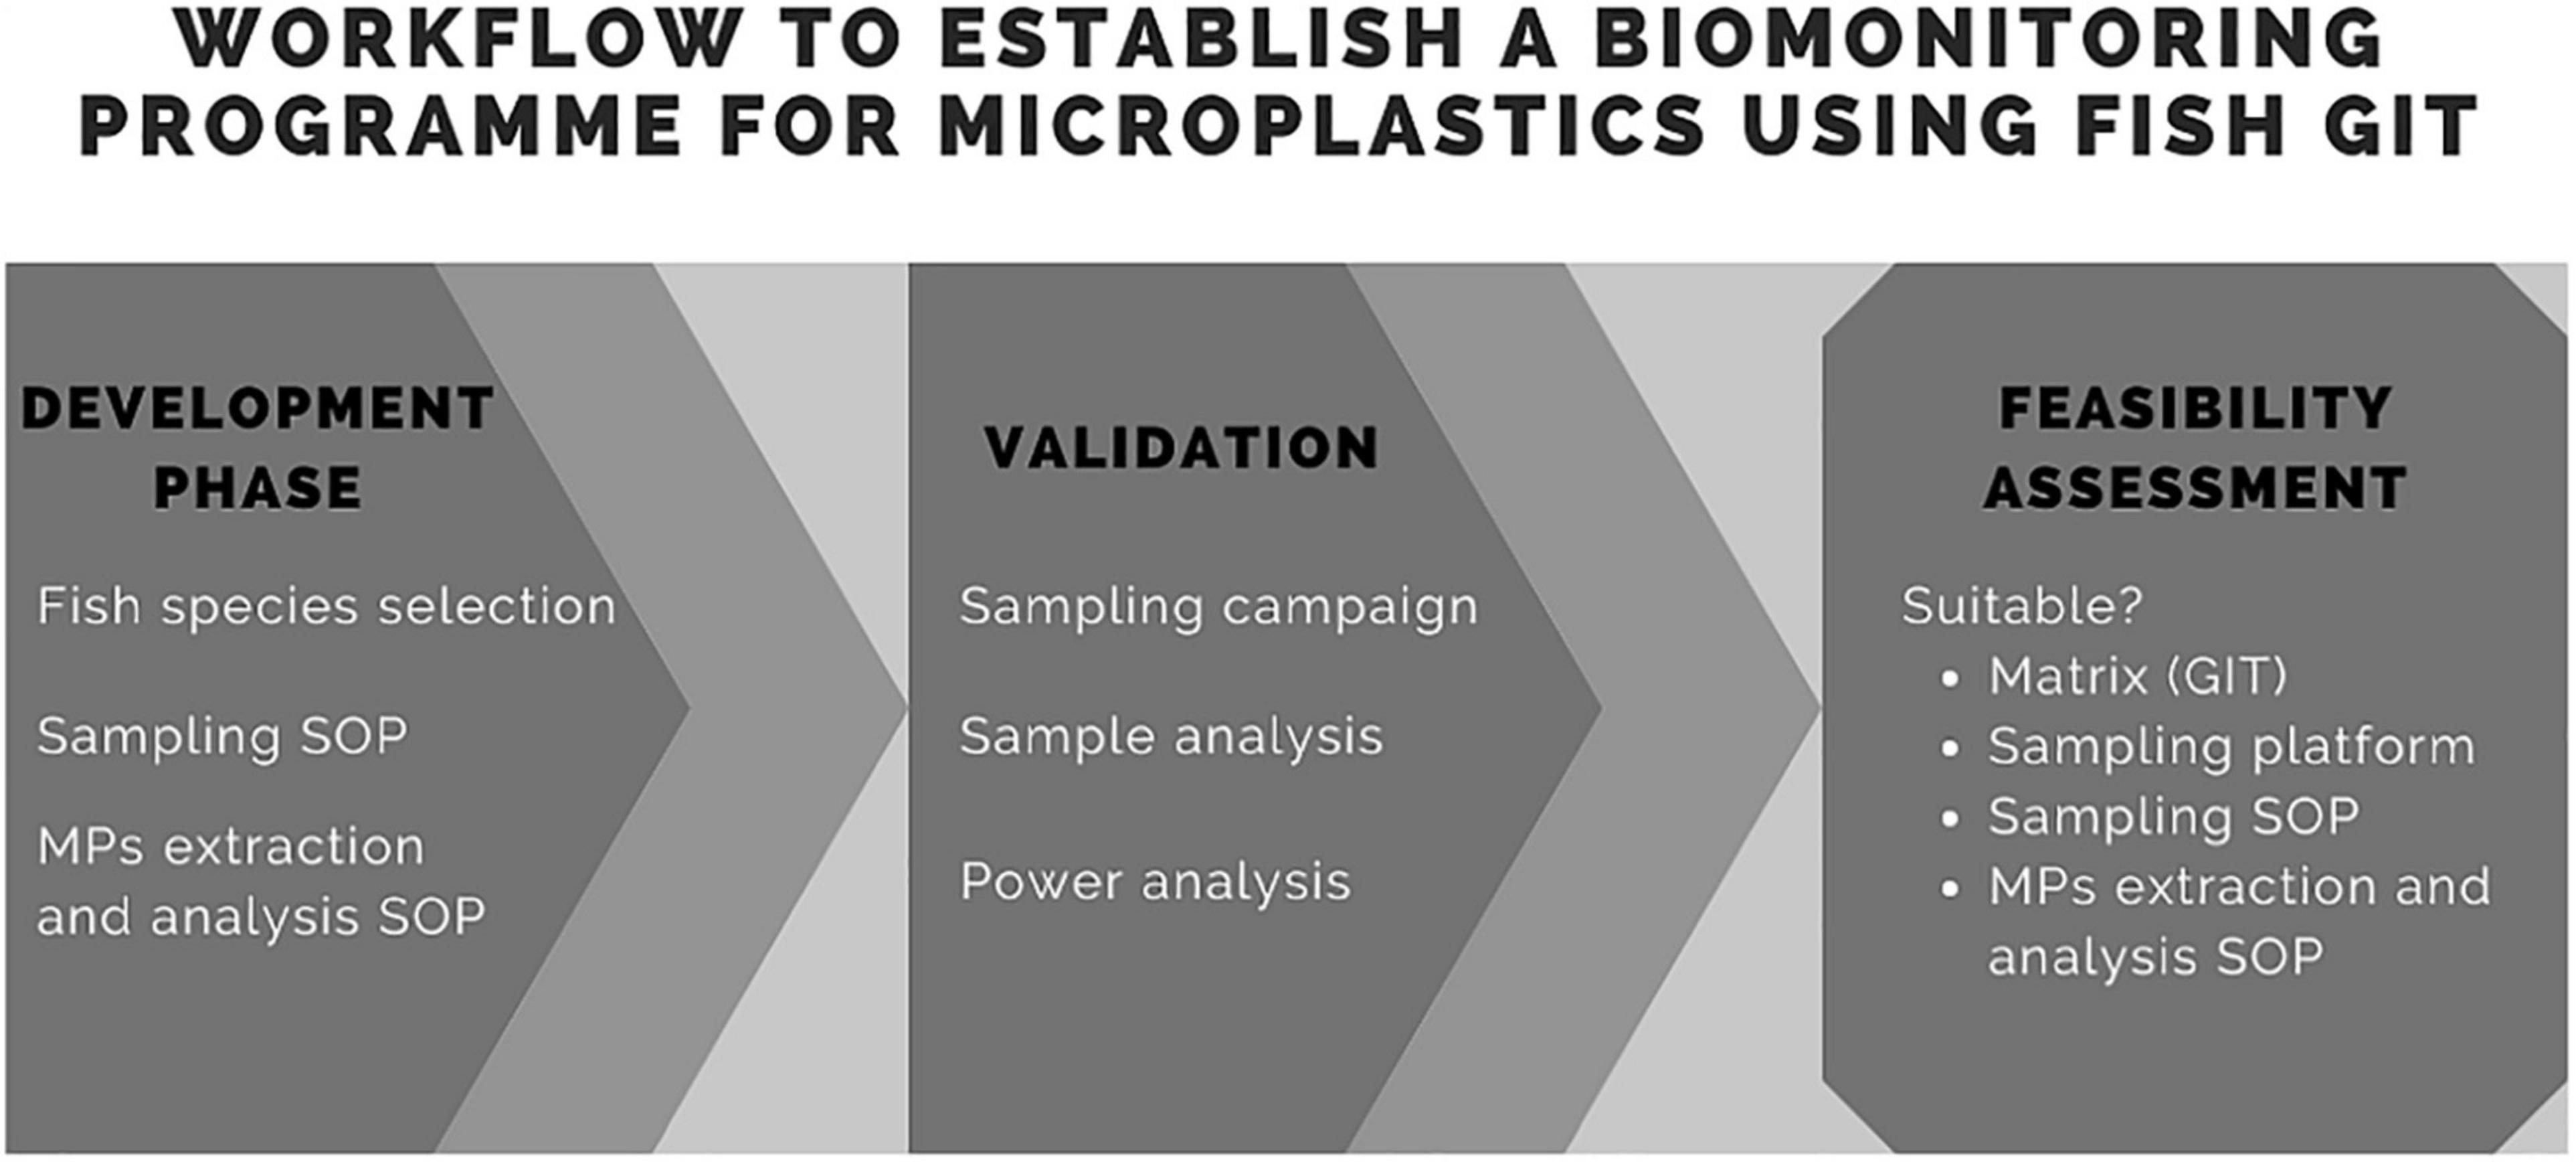
Figure 1. Overview of the stepwise approach used to establish an assessment on microplastic biomonitoring in fish GIT.
The North Sea Beam Trawl Survey (NS-BTS) and Demersal Young Fish Survey (DYFS) data was used for species selection, for the period 2010–2019, and was downloaded from The Database of Trawl Surveys (DATRAS) on 05/11/2020 (DATRAS, 2020). The survey dataset was filtered for the southern North Sea region (ICES area 27.4c). This resulted in a dataset derived from 98, 35, and 46 hauls in total from the Belgian, United Kingdom, and Dutch BTS, respectively, and 231 and 1,630 hauls in total from the Belgian and Dutch DYFS, respectively. Species were ranked based on descending total catch numbers and only the first 30 species with highest catch numbers were selected for further analysis (Table 1). When species identification was inconsistent between surveys carried out by the different Member States, they were excluded from the list. Species were grouped according to habitat (pelagic, benthopelagic, or strictly benthic) and feeding behaviour (planktivorous, piscivorous, and benthic feeding). Classification was done based on the information obtained from FishBase (Froese and Pauly, 2021) and resulted in seven different groups: pelagic planktivorous fish, pelagic piscivorous fish, benthopelagic planktivorous fish, benthopelagic benthic feeding fish, benthopelagic piscivorous fish, benthic feeding fish, and benthic piscivorous fish (Table 1). The aim was to select several suitable species for biomonitoring over the different groups. Survey catches were standardised to catches per unit of effort (CPUE) in numbers per km2.
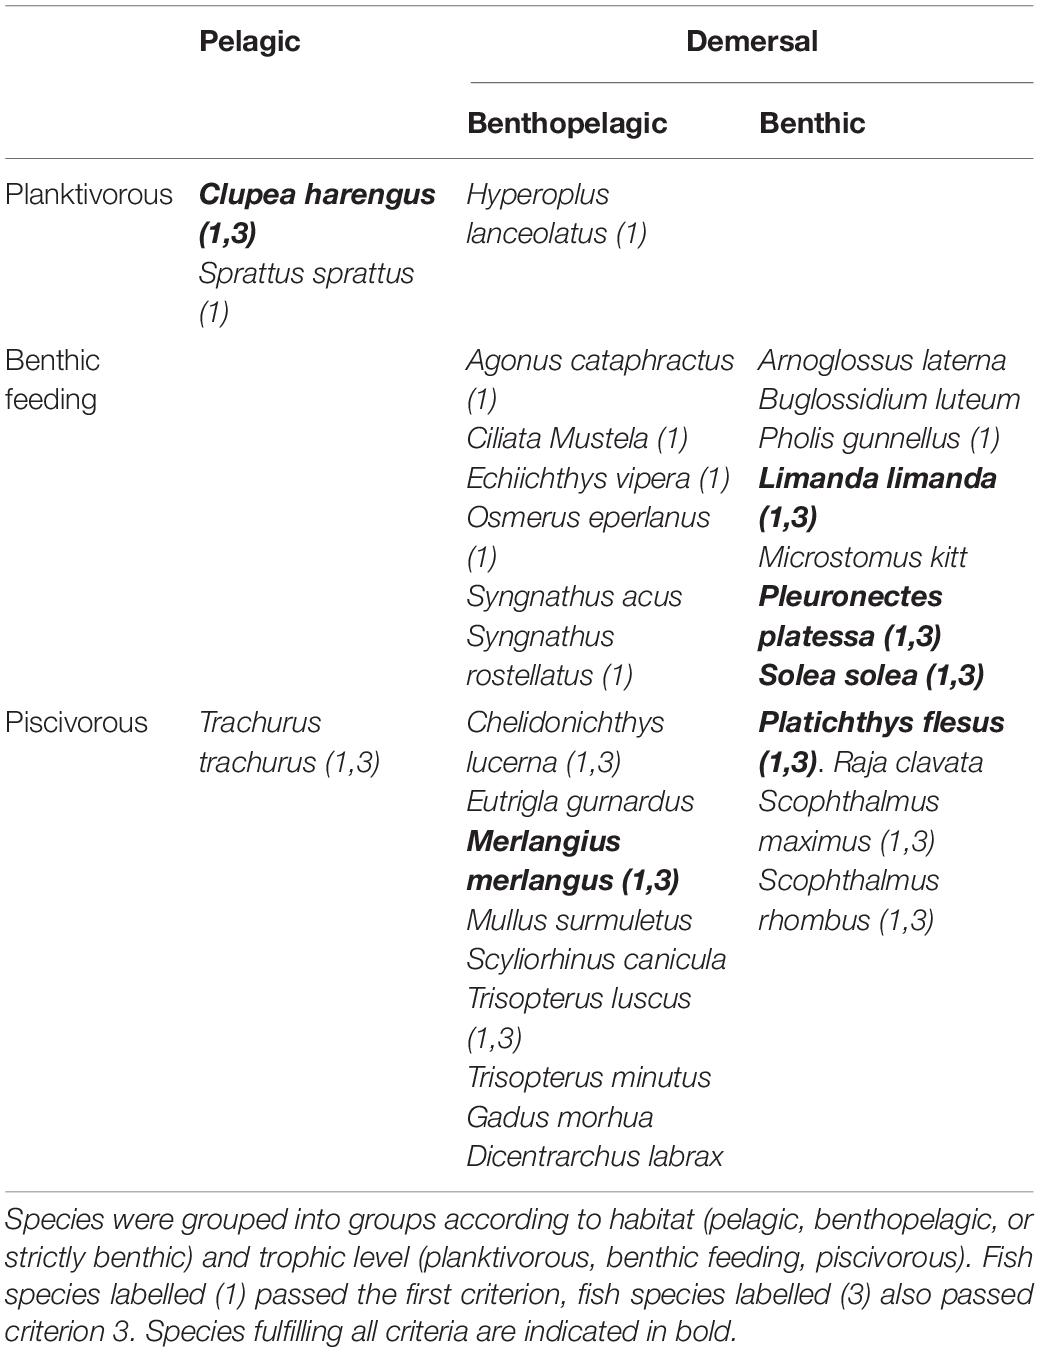
Table 1. Top 30 species based on catch numbers on Sea Beam Trawl Survey (BTS) and Demersal Young Fish Survey (DYFS) in the southern North Sea, and used to establish selection criteria for the implementation of a microplastics biomonitoring programme.
For the selection of suitable fish species for biomonitoring of MPs in fish GIT, information was gathered from DATRAS (the BTS database hosted by ICES) on an extensive list of fish species that are frequently found on beam trawl surveys in the southern part of the North Sea. Selection criteria were also established at the EU Task Group Marine Litter (TGML) (MSFD Technical Subgroup on Marine Litter, 2013) which were the basis for the criteria used in this work: (1) species distribution, (2) sampling effort, (3) commercial value of species, (4) sustainable development of fish populations (5) migration behaviour, and (6) scientific evidence for occurrence of MPs in the fish GIT (detailed selection procedure provided as Supplementary Material).
The six criteria were successively applied on a list of 30 species until a selection of the most suitable species remained. In order to investigate the species distribution under criterium 1 (species distribution), mean CPUEs over time (year) and space (ICES statistical rectangle) were examined. For criterium 3, the commercial values of the fish species were calculated with data obtained from ICES and the Flemish Agriculture and Fisheries Department: total landings (tonnes) were obtained from the ICES Catch Statistics 2018 on 23/06/2021 for ICES area IVc, i.e., the southern North Sea (ICES, 2020b), the commercial value (€/yr) of each species was calculated by multiplying the total landings with the average price (€/kg) in Belgian ports (prices obtained from the report “De Belgische zeevisserij” (DLV, 2018). The sustainable development of fish populations (criterion 4) was assessed by looking at (i) survey trends (using DATRAS data), (ii) the stock status determined by ICES and (iii) the protection status by the IUCN Red List (IUCN, 2021). The International Council for the Exploration of the Sea uses a methodology that divides stocks into six main categories based on the amount of information (both biological and technical) that is available, and therefore the level of accuracy to which the stock status can be estimated. The most occurring categories were 1, 3, and 5. The category 1 stocks were considered the most data rich and include the stocks with full analytical assessments and forecasts as well as stocks with quantitative assessments based on production models. Category 3 stocks were less data rich and include stocks for which survey or other indices are available that provide reliable indications of trends in stock metrics, such as total mortality, recruitment, and biomass. Category 5 stocks only relied on the available landings data and were considered data poor stocks. We further used the IUCN Red List to determine species status, such as threatened or under protection. For criterion 5 (migration behaviour), the expected travel distances of fish were assessed, based on expert judgement. Most benthic fish were assumed to be relatively resident, while pelagic fish were considered to travel over long distances in a shorter period of time. For example, when species migrate over large distances, they might contain MPs in their GIT distant from the particles sources, making interpretation of the results challenging (Bray et al., 2019). We assume that the distances travelled by benthopelagic species are larger than for benthic species but smaller than for pelagic fish (Froese and Pauly, 2021). To assess criterion 6 (occurrence of MPs in the GIT content), we performed a free literature search in Web of Science accessed in April 2020 (Clarivite, 2020), applying the search terms “microplastic*” AND “fish,” to verify the reported occurrence of MPs in fish GIT. All data analysis was done in R Studio (R Core Team, 2020) (R version 3.6.1).
In this study, the feasibility to dissect fish GIT for MP analysis onboard, shortly after catching the fish, was investigated. To do so, we developed a sampling protocol (De Witte et al., 2021b), based on guidelines from Hermsen et al. (2017) and the ICES working group on marine litter (WGML) (ICES, 2021b), that included specific measures to minimise background contamination, and specified: (1) background contamination control measures, (2) the dissection of fillet that is used as procedural blank, and (3) the dissection of fish GIT. We specifically focused on background control measures that combined the reduction of MP contamination with the feasibility to be applied onboard by the fishing vessel crew or seagoing observers during fisheries surveys. Background control measures included the rinsing of dissection material with tap or seawater, where possible using prefiltered water, the maximum coverage of all storage containers, instructions on clothing, e.g., to not wear fleece or other synthetic based fabrics, and the registration of all plastic and rubber items that are present in the neighbourhood of the dissection area. To have an overview on the efficiency of the background contamination measures, and to quantify possible remaining background contamination, a fillet sample was taken at each sampling day at each sample location (Table 2) and processed on board, and subsequently in the laboratory, using the same procedures as for the fish GIT samples. Protocol instructions on fish GIT dissection included labelling instructions as well as the registration of metadata such as sampling coordinates, fish weight, and length. The fish GIT was dissected and sampled avoiding sampling of any other organ. Our samples did not include fish specimens with plastic or other materials in the mouth, nor everted or empty stomachs, as these are indications of regurgitation behaviour, and such samples would have biased results. Samples were stored at −20°C in metal containers shortly after dissection. If no freezer was available onboard, samples could alternatively be stored on ice.
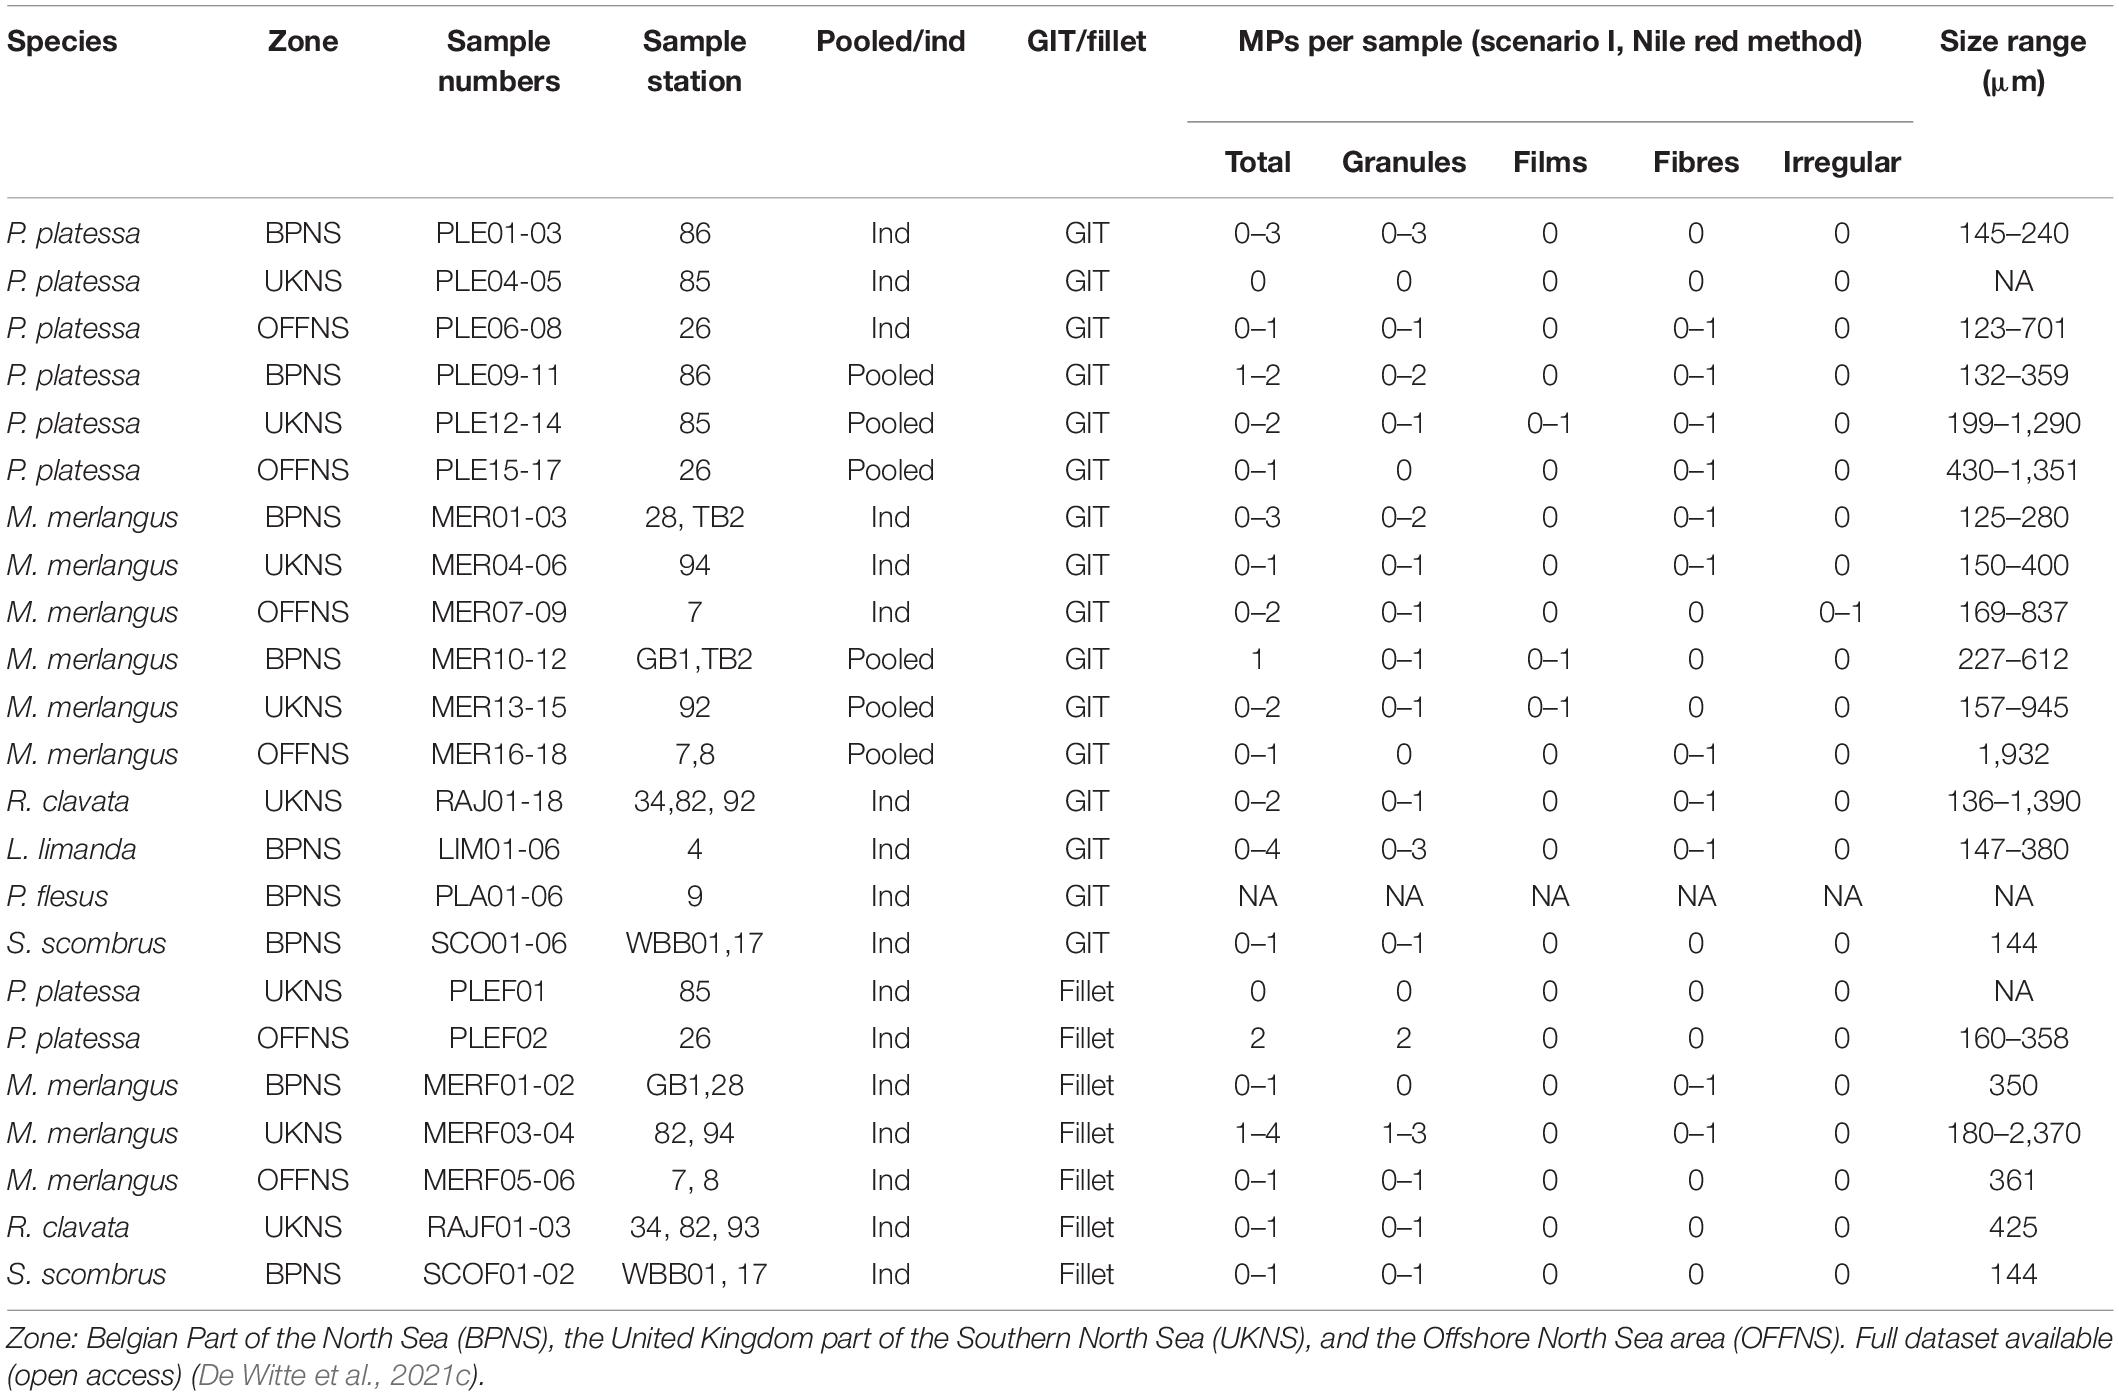
Table 2. Number of MPs (range) for each sample type per shape for fish GIT and fillet blank samples (scenario i, Nile red observations) (NA–not applicable).
Fish GIT and fillet samples were dissected on board, before laboratory sample processing, i.e., digestion, density separation, and analysis (De Witte et al., 2021a). Samples were processed individually or GIT contents from three fish were pooled prior to a two-step digestion, according to the protocol validation analysis scheme (section “Protocol Validation”). For sample processing, samples were first digested using 10 mL of 10% KOH (v/v) solution per g of sample for 24 h at 60°C at a stirring speed of 150 rpm. After 48 h, each sample was filtered over a custom-made stainless-steel filter (pore size 20 μm). The remaining layer on the filter was then resuspended in 300 ml 15% hydrogen peroxide for 10 min in a sonication bath (USC2600 TH, VWR International). The sample underwent a second digestion at 60°C with stirring at 150 rpm. After 72 h, the sample was filtered once more through a stainless-steel filter and was resuspended in 150 mL of a saturated sodium tungstate solution for 10 min in the sonication bath. The salt solution was used for density separation purposes, in a solution of 700 g of Na2WO4.2H2O in 1 L of demineralised water. After a settling phase of 24 h, the upper layer was decanted and underwent a second density separation step in saturated sodium tungstate solution. Saturated sodium tungstate is expected to separate plastic particles with density up to 1.4 g/cm3 from heavier particles (Frias et al., 2018). The final decanted solution was filtered over the polytetrafluoroethylene (PTFE) filter (10 μm, 47 mm, Merck Omnipore membrane filter), to which 1 mL of Nile red dye (10 μg/mL in acetone) was applied using a Pasteur pipette, to stain retained particles. After 15 min, the filter was thoroughly rinsed with filtered demineralised water. The PTFE filter containing the filtered and stained sample was transferred to a petri dish and stored in the dark until further analysis. For particle identification, filters were observed using a fluorescence stereomicroscope (M205 FA) with an ET GFP LP filter (Leica) with excitation wavelength of 480 nm, bandwidth 40 nm and emission wavelength of 510 nm.
The size of each particle was measured along its maximum Feret diameter using the scale bar function of the Leica Application Suite (LAS) microscope software (size calibration done by the supplier), while fibre length was measured as the shortest distance between the two fibre tips, which results in an underestimation of the exact fibre length. The fluorescence intensity of particles was calculated based on the “mean grey value” feature in ImageJ (Schindelin et al., 2012), calculated by converting each pixel from Red-Green-Blue (RGB) code to greyscale (8 bit) images, using the formula:
Next, a region of interest (ROI) including at least 50% of the particle was selected, and the mean grey value of all pixels situated within the selected area was determined. The mean grey value of the background was calculated in the same way. Particle fluorescence intensity was then calculated by subtracting the mean grey value of the background from the mean grey value of the selected particle ROIs in each photo. Microplastics were classified by colour and shape according to MSFD Technical Subgroup on Marine Litter (MSFD Technical Subgroup on Marine Litter, 2013).
A micro-Fourier Transform Infrared Spectroscopy (μFTIR) analysis was performed using a Spotlight 200i FT-IR microscope (Perkin Elmer) to distinguish between synthetic (i.e., plastic) and natural (i.e., non-plastic) particles, and to further identify the polymers of selected 52 particles (size > 50 μm), 36 out of 54 potential plastic particles and 16 out of 61 identified non-plastic particles. Particles were observed on a PTFE filter and spectra were captured in a transmittance mode, in a range between 4,000 and 450 cm–1, with a resolution of 4 cm–1, with 64 recorded scans. To identify the spectra, a search was performed in a spectra commercial library (Perkin Elmer), excluding the range 1,250–1,100 cm–1, and polymers were accepted when a match was over 60% (with one exception for a Fluorocarbon particle, where the match was 55%). Quality controls (n = 4) were ran by identifying MPs of known origin (high-density polyethylene, n = 2, and polystyrene, n = 2) and confirming their polymeric composition viaμFTIR analysis. All quality control samples were correctly identified with polymer identification matches over 84%.
Stringent quality control measures were taken throughout the entire analysis procedure (De Witte et al., 2021b). As a background control measure, all materials were covered as much as possible to avoid deposition of airborne fibres. The equipment and devices used in the fume hood for digestion and density separation were daily cleaned with wet white cotton towels and all glassware was rinsed two times with filtered water before use. Filtered water and working solutions were prepared by filtration through a paper folding filter (VWR 310, particle retention 13 μm). Laboratory technicians wore white cotton clothing, a cotton white laboratory coat and washed hands between each procedure step. No other laboratory members were allowed in the dedicated analysis area. Procedural blanks were checked daily. Procedural blanks were acquired as per the protocol of fish GIT and fillet samples, and did not include any matrix. By doing so, the quality of the analysis and the contamination prevention measures were verified. As a positive control, recovery tests with spiked particles were also performed daily. To do so, 20 g mussels tissue spiked with 10 colourless PVC particles with an average Feret diameter of 251 ± 32 μm was analysed and a recovery rate was calculated. PVC particles were obtained after cryomilling commercial PVC by Centexbel (Spex Sample Prep 6875D-Freezer/Mill Dual-Chamber Cryogenic Grinder).
Based on the outcome of the fish species selection procedure, sampling and analysis protocols were validated by a sampling campaign in which plaice [Pleuronectes platessa (PLE)], whiting [Merlangius merlangus (WHG)], thornback ray [Raja clavata (RJC)], atlantic mackerel [Somber scombrus (MAC)], common dab [Limanda limanda (DAB)], and flounder [Platichthys flesus (FLE)] were caught. Three distinct sampling areas at the Southern North Sea were defined: the Belgian part of the North Sea (BPNS), the United Kingdom part of the Southern North Sea (UKNS) and an offshore area (OFFNS), and sampling was done within the scientific surveys of the ICES BTS and DYFS. To complement the sampling design, a few additional samples of M. merlangus and S. scombrus were acquired within an additional environmental campaign at the BPNS (Figure 2; De Witte et al., 2021c). All samples were taken by seagoing observers and technical scientific staff, following the guidelines of the developed sampling protocol (section “Sampling and Analysis Protocols”). A detailed analysis plan was made, including analysis of species from different sampling areas. The analyses plan included analysis on individual and pooled fish GIT samples (Table 3). For P. platessa and M. merlangus, samples were taken at each area to compare MP contamination in fish GIT in different regions. We processed individual as well as pooled GIT samples, as in which case GITs were expected to have a higher MP load. For R. clavata, S. scombrus, L. limanda, and P. flesus, only individual samples were taken with the aim to assess differences between species.
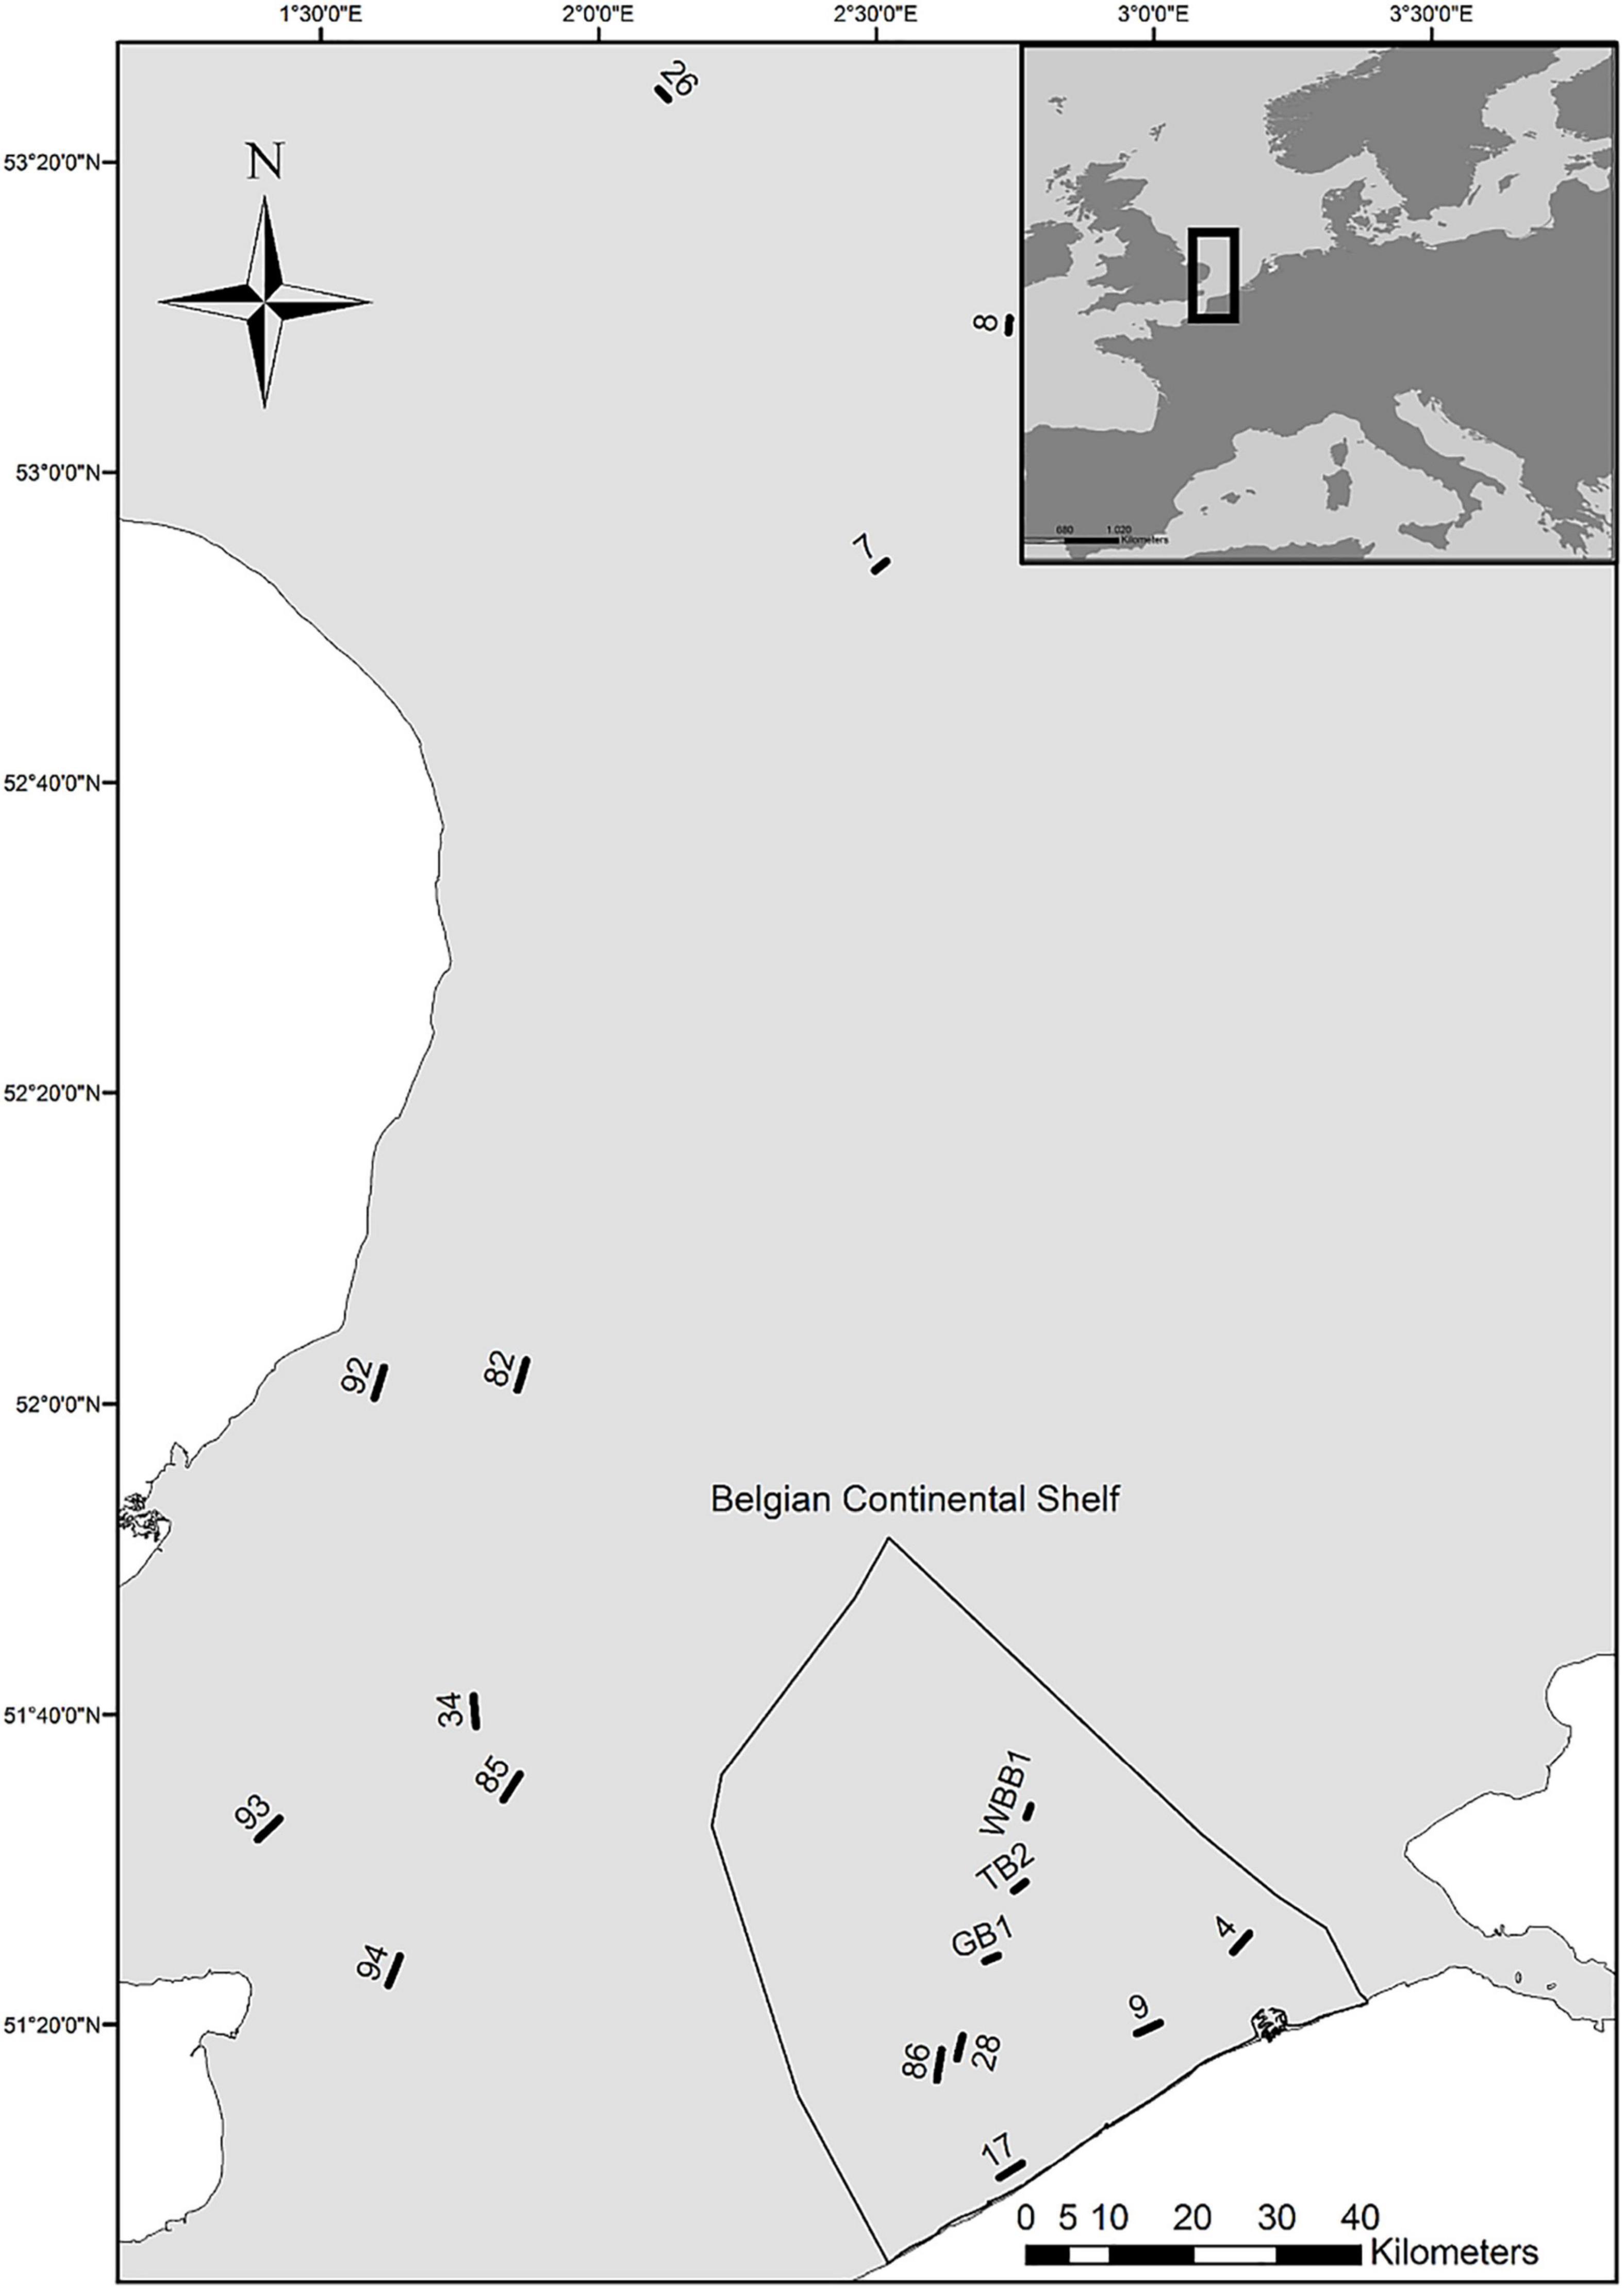
Figure 2. Overview of fish sampling locations at the Southern part of the North Sea. Locations BPNS: 4, 9, 17, 28, 86, TB01, GB01, WBB01; locations UKNS: 34, 82, 85, 92, 93, 94; locations OFFNS: 7, 8, 26.
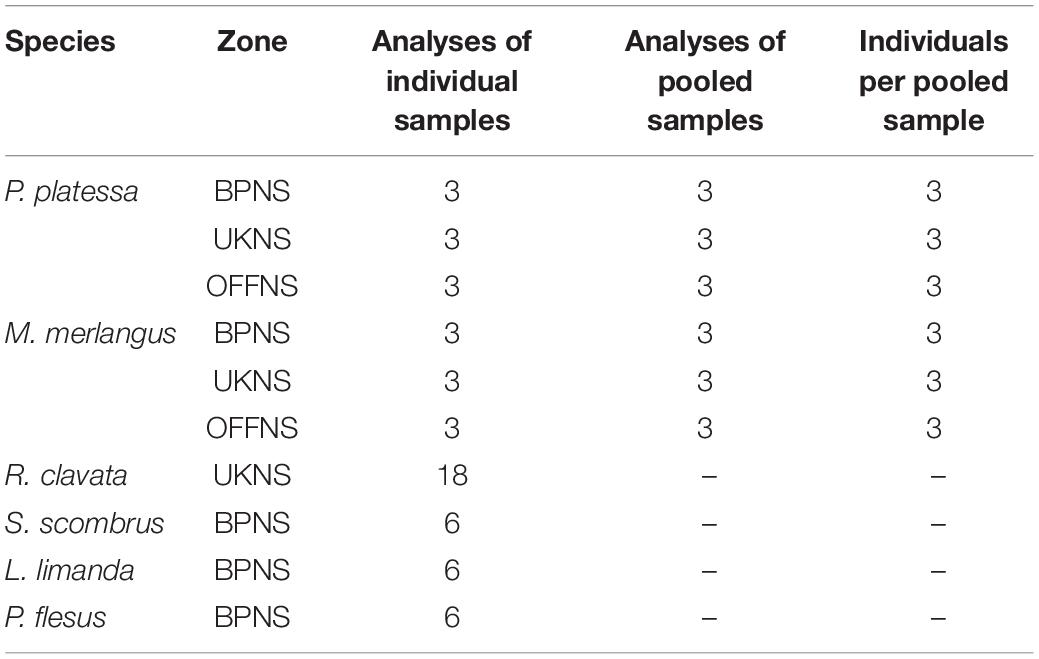
Table 3. Sample processing scheme for fish GIT analysis (n: sample size, i.e., number of fish).
To assess the sampling effort (power analysis) and the differences between species and areas (factorial design), we considered three data scenarios: i–Nile red observations, ii–μ-FTIR observations, and iii–Positive control corrected scenario. These scenarios were based on the same original dataset (De Witte et al., 2021c), i.e., on the number of MPs per GIT observed in this study, after Nile red identification and after progressive correction factors. In the case of pooled samples, we calculated the mean number of MPs per single GIT sample for comparison purposes (see section “Statistical Analysis”).
Scenario i, Nile red observations: all particles identified as plastic using the Nile red method were considered to be MPs, present in a total of 65 single fish GITs (samples). In this scenario, samples of the species P. flesus were excluded, as when using the Nile red identification methodology, non-synthetic matrix particles were coloured on the P. flesus samples (see results) and identification of MPs was inconclusive.
Scenario ii, μ-FTIR observations: the same dataset based on particles identified as plastic using the Nile red method was adjusted after μFTIR identification and correction for polymer identification. The overall match between the two methods (85%) was used to correct the dataset from scenario i. As not all particles were confirmed as being plastic by μFTIR analysis, 4 samples out of the 29 considered to have plastic were randomly allocated and set to zero MPs per sample, to account for the correction factor (15% incorrect identified particles as plastic). The particles retrieved from the six samples of P. flesus were included in this scenario (and scenario iii) after μFTIR identification, resulting in a new dataset totalising 71 samples (individual fish GIT).
Scenario iii, Positive control corrected scenario: this scenario was based on the dataset scenario ii with an added correction for potential contamination. This correction was estimated based on the presence of plastic particles (μFTIR confirmed) in positive control samples (fillets), with an estimated contamination ratio of 0.43. Eight out of the nineteen samples containing plastic were randomly allocated and set to zero MPs per sample, to account for the correction factor, and the outcome of this scenario was dependent on the eight samples randomisation. For reproducibly purposes, this scenario was fixed using the function “set seed” of R (using a random number generator, useful for simulations).
The number of MPs present in each sample was calculated for each scenario of this study. Prior to the data analysis, we calculated the mean number of MPs per single GIT (for pooled samples). To assess our data processing approach, we evaluated whether there was a significant difference between the number of MPs in pooled and unpooled fish GIT samples, using a two-sided t-test (α = 0.05). As there was no significant difference (pt–test = 0.088), we used the calculated mean number of MPs per single GIT throughout the statistical analysis, for comparison purposes. The datasets were tested for normality (Shapiro-Wilk test, p < 0.05) and the homogeneity (Levene test, p > 0.05). As data did not follow a normal distribution (in each scenario), we used a Kruskal-Wallis rank sum test to assess differences between five or six species, depending on the considered scenario (i.e., L. limanda, M. merlangus, P. platessa, R. clavata, S. scombrus, and P. flesus) and between three areas (i.e., Belgian coast, United Kingdom coast, offshore). The statistical tests were performed in R using the packages “stats,” “car,” and “base” (R Core Team, 2020), and graphs were plotted using the package “ggplot2” (Wickham, 2016).
We performed a power analysis to establish the required sample size (sampling effort) to identify significant differences on the number of MPs per fish between the selected species and between the sampled geographic areas of the North Sea, for each of the three scenarios. Our analysis used three components to estimate the sample size (Cohen, 1988): (1) significance level (α = 0.05), i.e., the probability of finding in case this effect is existing (type I error); (2) power (0.8), which is the probability of finding an effect when there is one; and (3) effect size, i.e., the quantification of the difference between two (or more) levels of a factor (values are statistical test-dependent, Supplementary Table 1). In our statistical analysis, one fish GIT was considered to be one sample; and in the case of pooled samples during processing, we determined the mean number of particles observed per sample for the power analysis calculations. We then estimated the sample size for the scenarios i, ii and iii. Each analysis was performed based on a two-way ANOVA, with a power of 0.8 and an effect size calculated for each scenario specifically (Cohen, 1988; Montgomery and Runger, 1994), and we considered two factors: species (with 5 or 6 levels, see Table 4) and geographic areas (with 3 levels). All analyses were performed in R (R Core Team, 2020) (version 3.6.1) using the packages “pwr” (Champely, 2020), “car” (Fox and Weisberg, 2018), and “power” (Sassi Pereira, 2021).
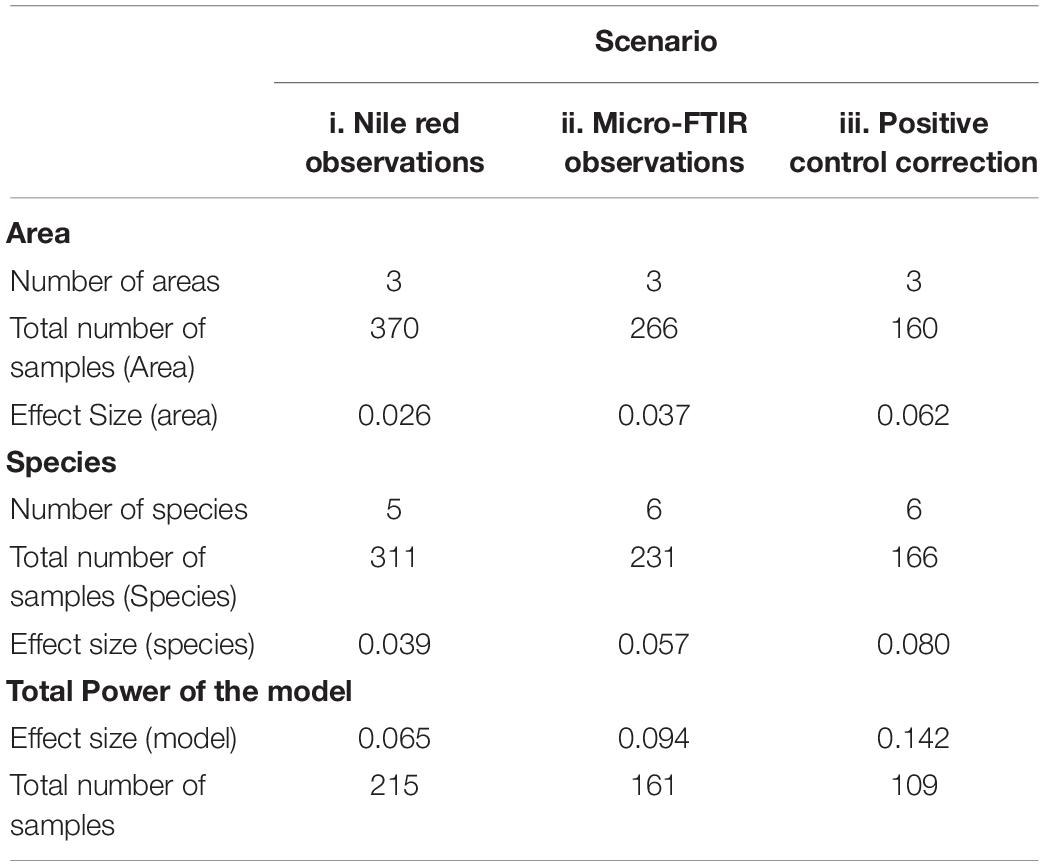
Table 4. Sample size estimates (power analysis) for three scenarios (with a balanced set-up), based on the results obtained for the number of MPs in single fish GIT samples observed. Power was set at 0.8.
We conducted a SWOT (“strengths,” “weaknesses,” “opportunities,” and “threats”) analysis of the implementation of a biomonitoring programme for MPs extracted from fish GIT matrices based on data collected along the project, as well as on the expertise of the authors and the available literature on MP biomonitoring. This type of qualitative analysis has been previously used in the fisheries sector for example to discuss the sustainable exploitation of stocks (Glass et al., 2015), and in plastic pollution research to evaluate a marine litter clean-up technology (Morrison et al., 2019). In the SWOT analysis, “strengths” are defined as characteristics that give a project or organisation competitive advantage; “weaknesses” as limitations or disadvantages; “opportunities” as external factors that may be beneficial and “threats” as external factors that may be harmful (Morrison et al., 2019). We have focused our analysis on following SWOT themes: (1) Fish GIT as MP biomonitoring matrix; (2) Monitoring via scientific fisheries surveys; (3) Monitoring via commercial fishing vessels; (4) Sampling protocol implementation with dissection on board within scientific fisheries surveys; (5) Sampling protocol implementation with dissection in the laboratory; (6) Identification and quantification of microplastics. Themes 1–3 were analysed under the topic “fish species selection, sampling platform and sampling effort” while themes 4–6 were analysed under the topic “sampling and microplastics extraction protocols.”
The average beam trawl survey catches (mean catch per unit, CPUE) in the southern North Sea (ICES area IVc) were calculated for the 30 fish species with highest catch number (Table 1), as shown in Figure 3 for plaice. Only the species that were observed in each survey year and had at least 1 individual per km2 were selected for further analysis, resulting in an intermediate selection of nineteen out of the thirty species, labelled in Table 1. Within the nineteen selected species, differences can be found in distribution pattern. E.g., herring (C. harengus) and sprat (S. sprattus) are rather restricted to the near shore and inshore areas of the Netherlands whereas sole (S. solea) is more concentrated in the near shore areas of the United Kingdom and flounder (P. flesus) is restricted to the inshore areas of the Netherlands and occurs here and there along the Dutch, Belgian and United Kingdom coast. Plaice (P. platessa), dab (L. limanda), whiting (M. merlangus), pogge (A. cataphractus), pouting (T. luscus), tub gurnard (C. lucerna), great sandeel (H. lanceolatus) covered a wider area of the southern North Sea. Detailed distribution patterns are provided for plaice in Figure 4 and for all 30 species in Supplementary Material.
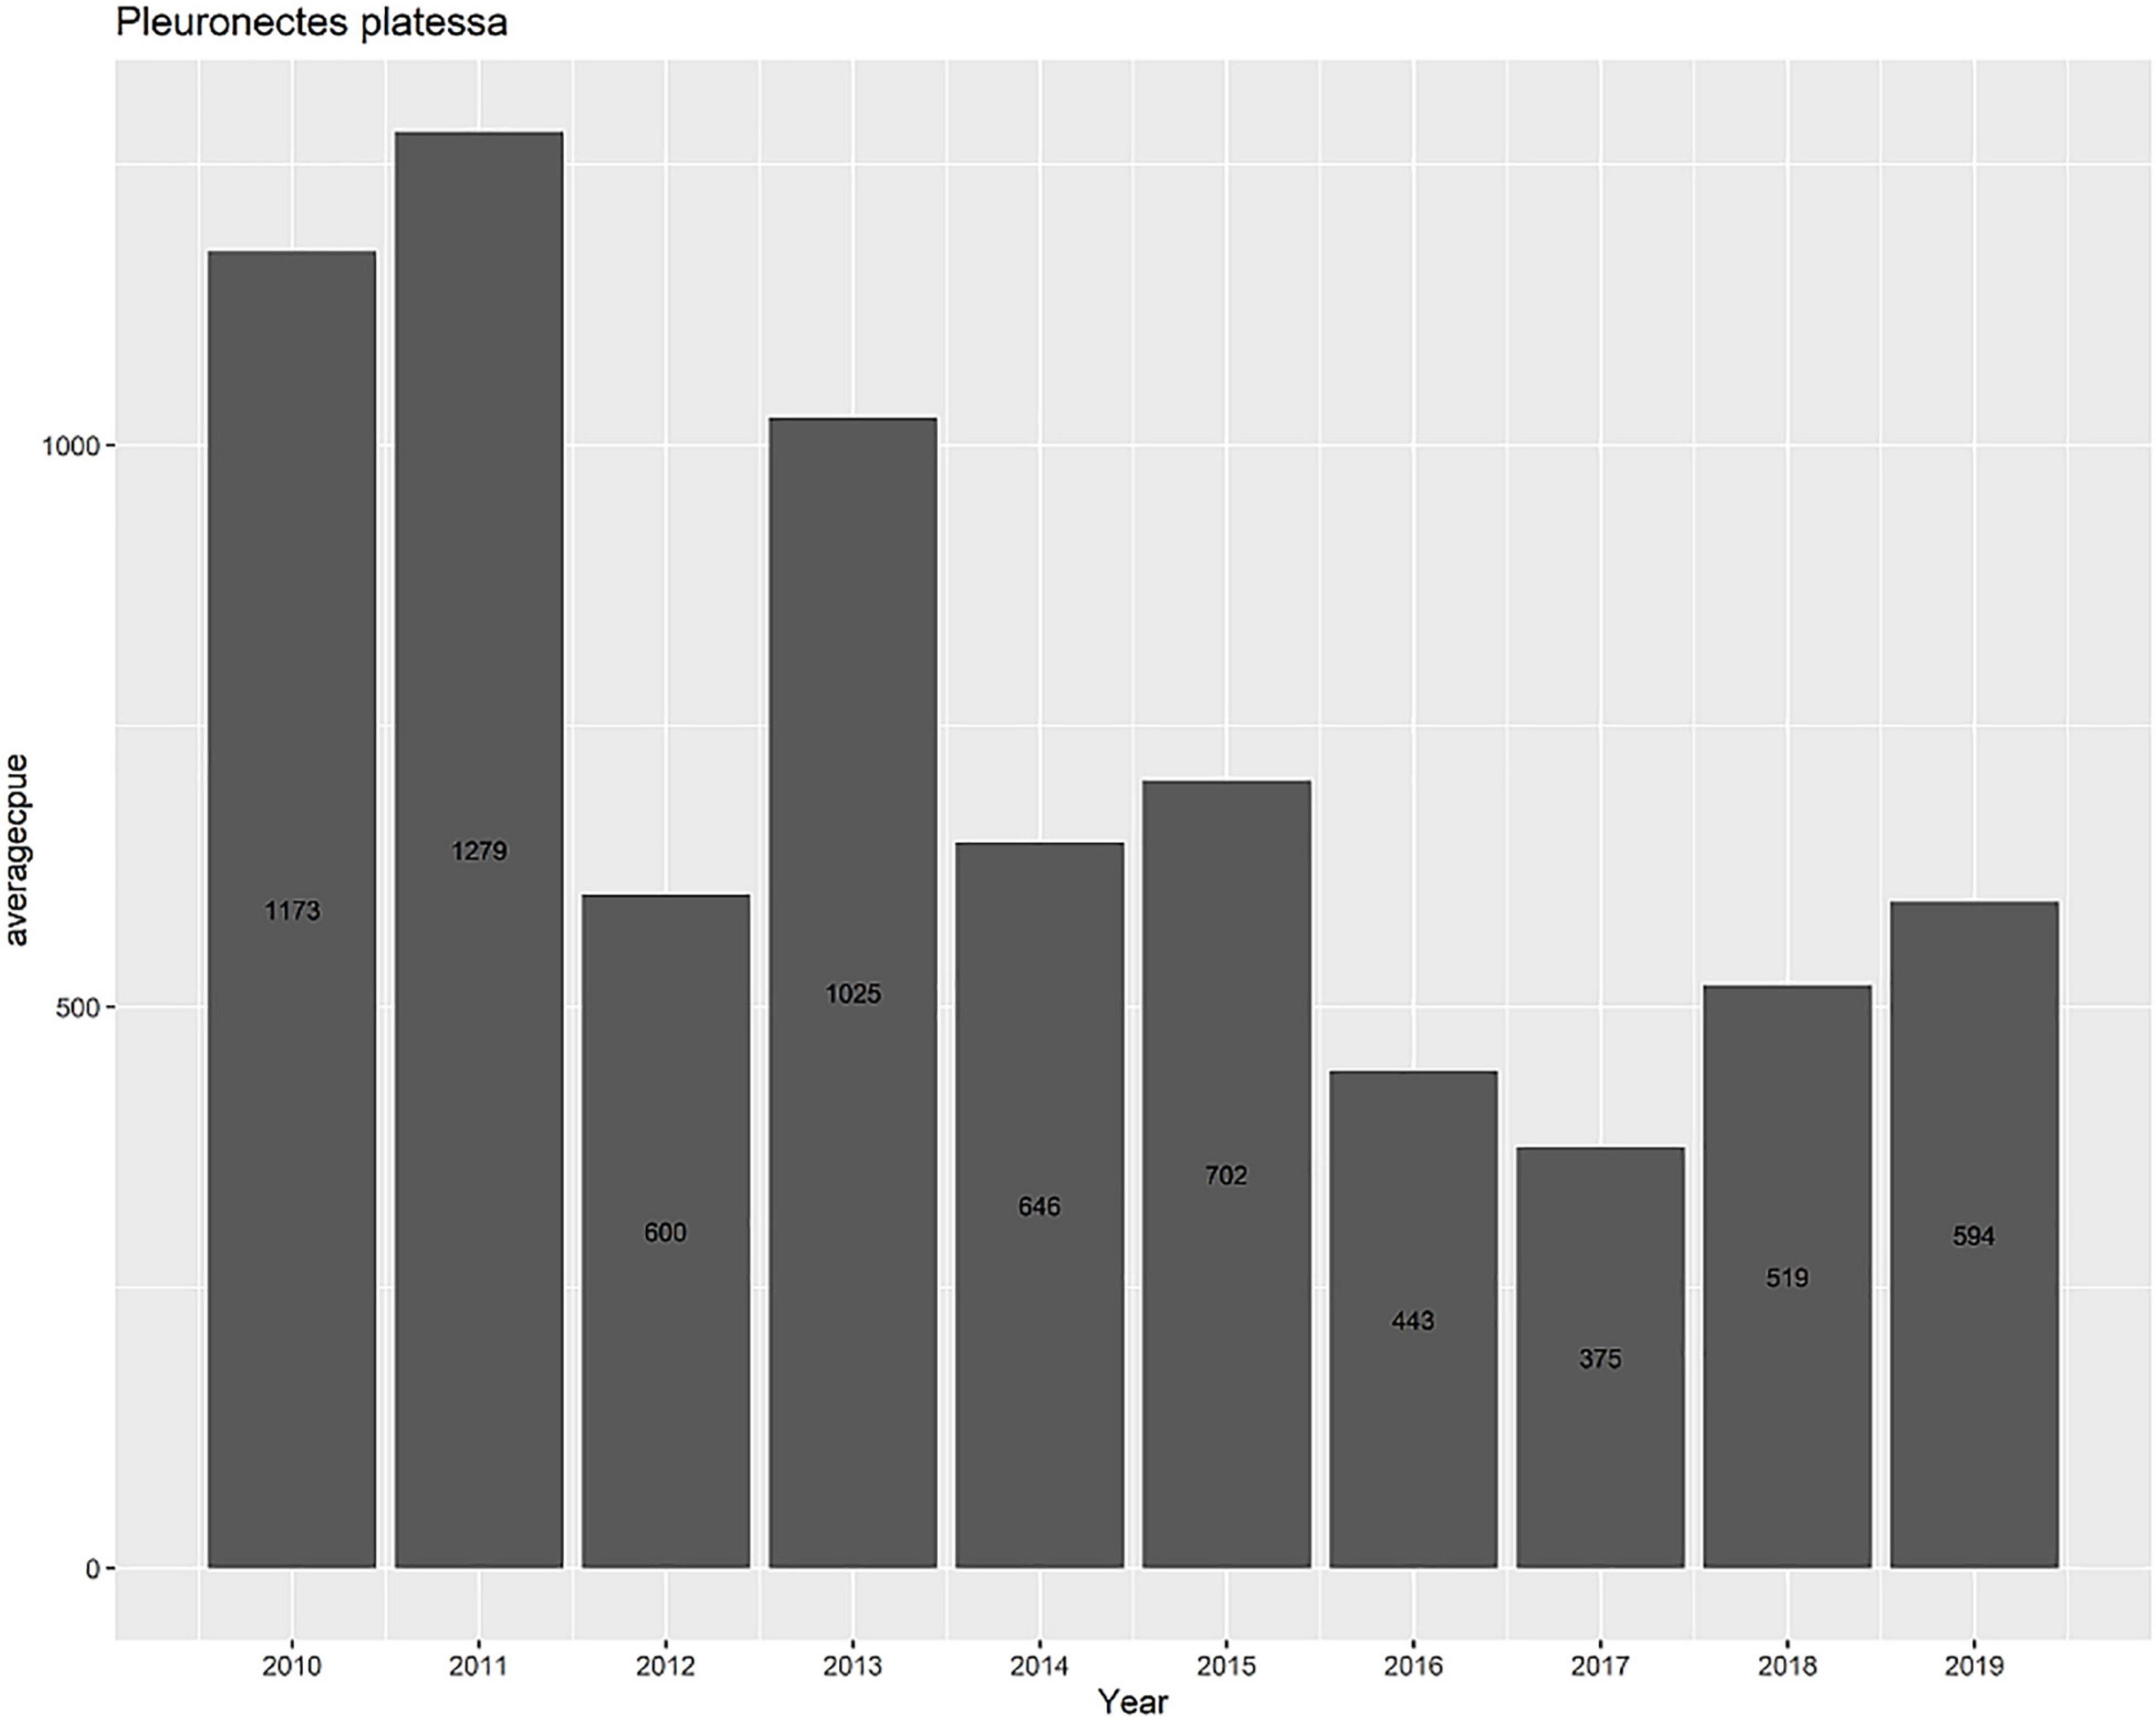
Figure 3. Average beam trawl survey catches (numbers/km2) for plaice (Pleuronectes platessa) in the southern North Sea (ICES area IVc) for the period 2010–2019. CPUE, catch per unit effort.
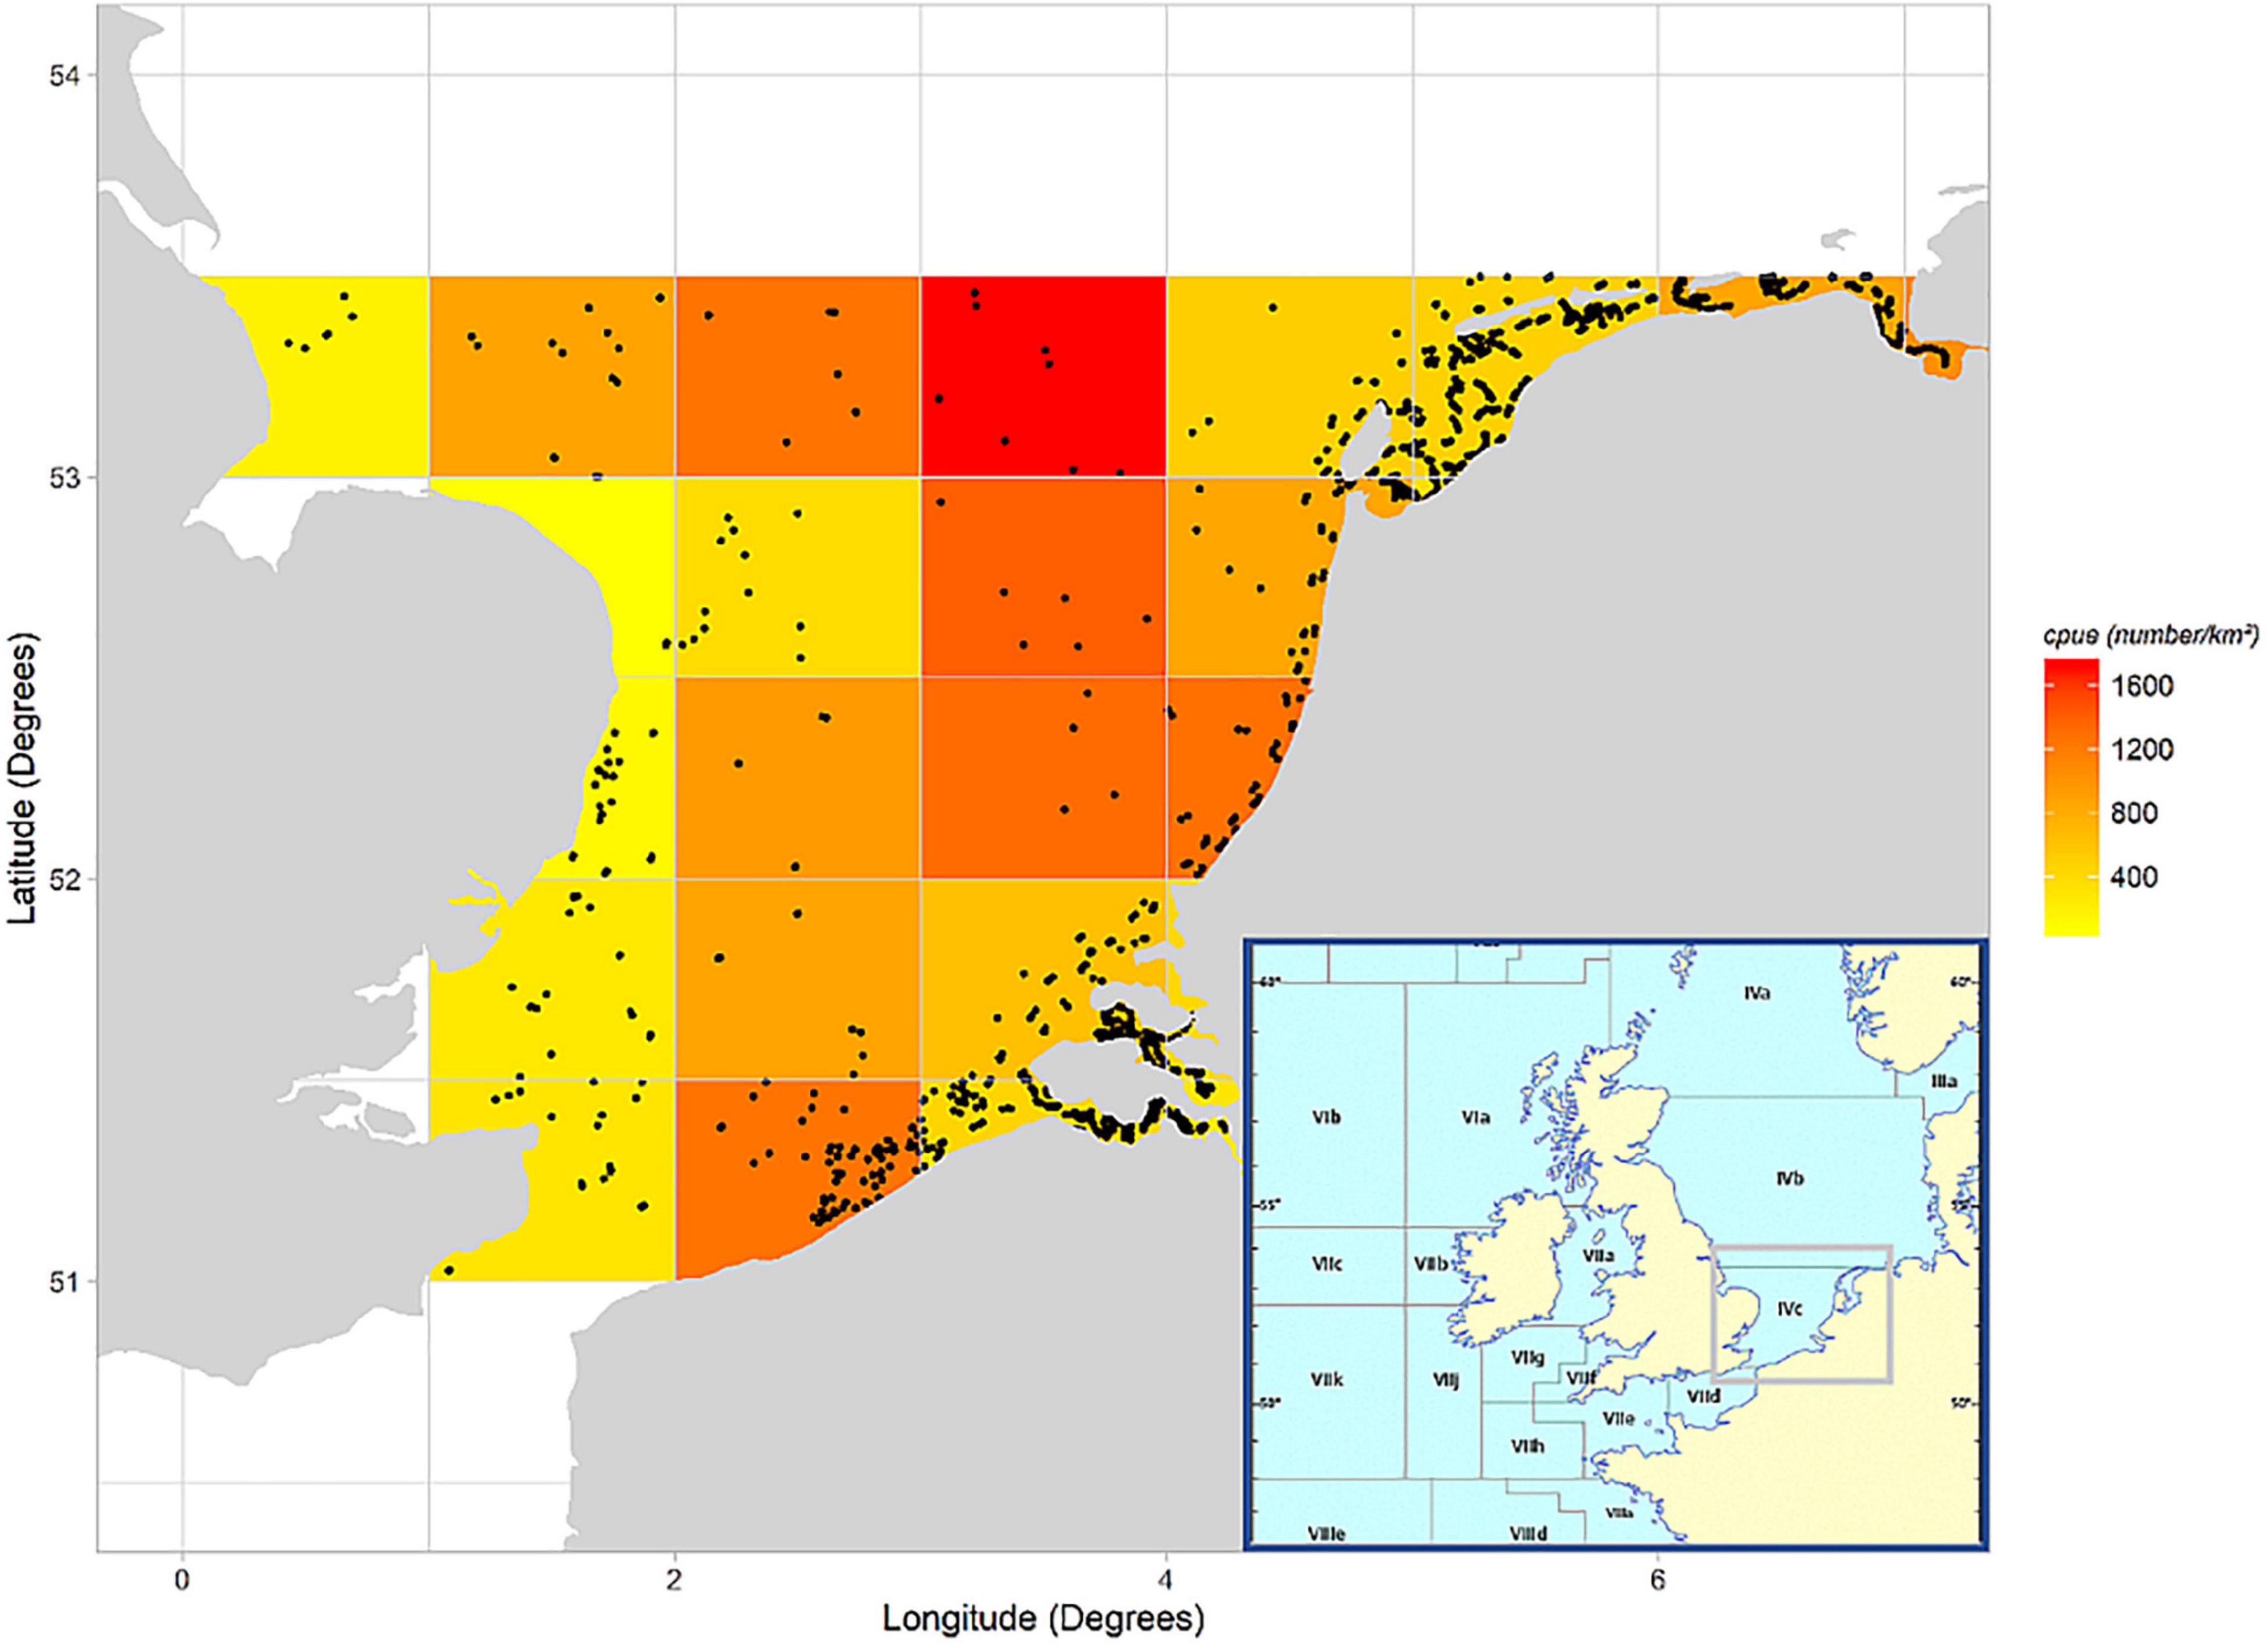
Figure 4. Distribution of plaice (Pleuronectes platessa) in the southern North Sea, based on beam trawl surveys (BTS and DYFS) from 2010 to 2019. The colour shading yellow, orange, and red represent low, medium, and high average CPUEs (numbers/km2), respectively. Black dots depict sampling positions. CPUE, catch per unit effort.
A species was considered eligible in case it was identified in each survey year conducted in the period 2010–2019. The inherent assumption is that all suggested species are catchable in the Southern North Sea as long as the existing data collection programmes continue to exist.
From the selection of nineteen fish species from criterion 1, only 11 species were considered as commercially valuable, as indicated in Tables 1, 5. Based on 2018 data, the estimated commercial value varied from 115,100 EUR/year for horse mackerel (Trachurus trachurus) to 101, 409, 679 EUR/year for S. solea.
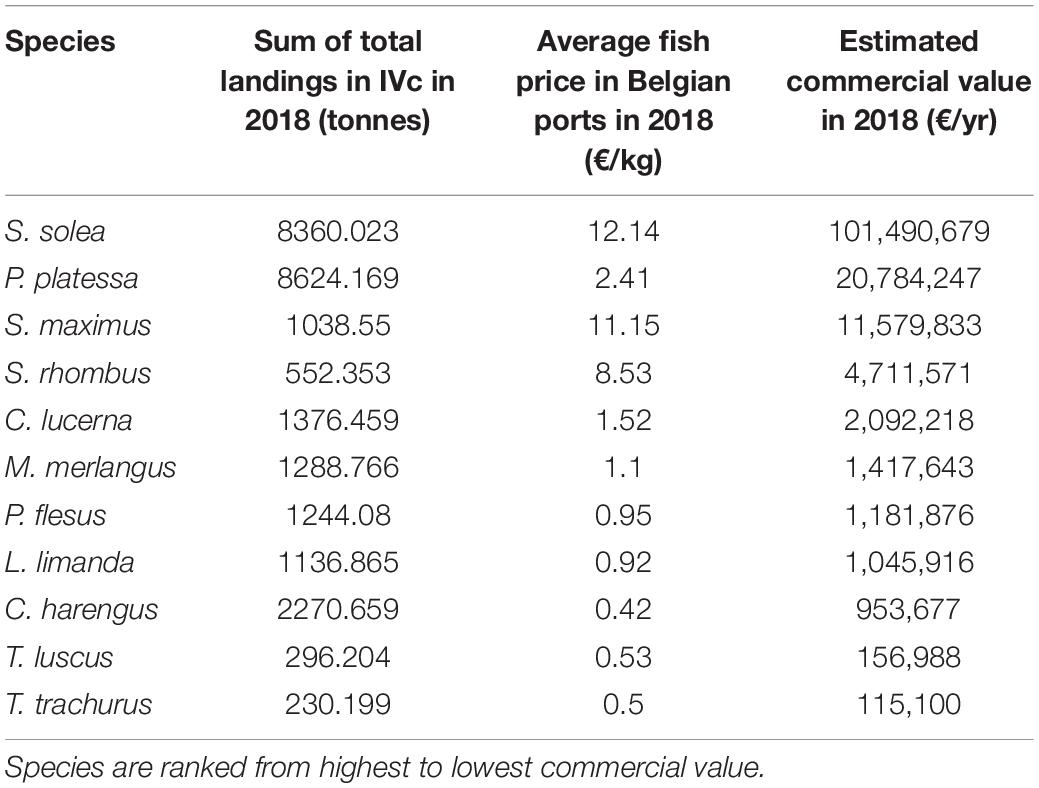
Table 5. The commercial value (€/yr) for selected fish species, in 2018, based on the sum of the total landings in ICES area IVc (i.e., the Southern North Sea at Belgium, the Netherlands, and Southern United Kingdom) from the ICES Catch Statistics and the average fish price in Belgian ports.
According to the IUCN Red list of threatened species, all of the 11 species have the status of “least concern” in Europe (Freyhof, 2010, 2015; Golani et al., 2011; Monroe et al., 2014, 2015; Nedreaas et al., 2014; Lorance et al., 2015a,b; Smith-Vaniz et al., 2015; Cardinale et al., 2021). Based on survey catches in the period of 2010–2019 in the southern North Sea, only the following species show stable or positive trends: M. merlangus, P. platessa, S. solea, and P. flesus (see fish species selection document in SI for details). According to the latest ICES advice (ICES, 2019a,b,c,d,e,2020a), only C. harengus, M. merlangus, P. platessa, S. solea, and L. limanda are within acceptable biological limits. For T. luscus and C. lucerna, no ICES assessments could be found. The other species were not within safe limits or there was insufficient data available (see fish species selection document in SI). Combining the results from the survey trends, ICES advice and the IUCN Red List for Europe we could conclude that only six species were eligible for biomonitoring of MPs: C. harengus, M. merlangus, P. platessa, S. solea, L. limanda, and P. flesus.
The six remaining fish species were all migratory species with their own specific migration behaviour. P. platessa was the only species reported as a resident species with homing behaviour (Gibson, 1999). P. platessa is active at night, but during the day they bury in the sand. Tagging experiments have shown that plaice can be stationary for long periods and therefore spawning migration can take a long time (Froese and Pauly, 2021).
The presence of MPs has been reported in the GIT of all six remaining fish species (Supplementary Material).
The fish species selection protocol retained six species for biomonitoring MP in fish GIT at the Southern North Sea. Taking into account the habitat and feeding behaviour, P. flesus was retained as benthic piscivorous, M. merlangus as benthopelagic piscivorous and C. Harengus as pelagic planktivorous fish species, although distribution pattern of C. Harengus along the Southern North Sea was not optimal (criterion 1). Within the group of benthic feeding fishes, three species fulfilled all criteria: P. platessa, L. limanda, and S. solea. P. platessa is more equally distributed over the Southern North Sea compared to S. solea (criterion 1). Moreover, P. platessa has higher total landings and a higher commercial value (criterion 3, Table 5) than L. limanda and has limited migration behaviour (criterion 5). Therefore, P. platessa is considered a better choice as monitoring species than S. solea and L. limanda within the benthic feeding fish species.
Within the protocol validation exercise, the highest number of samples (fish GIT) analysed were from Belgian coastal waters (n = 36), followed by fish from the United Kingdom coast (n = 29) and fish sampled offshore (n = 12) (summary information in Table 2, detailed information in Supplementary Table 2; De Witte et al., 2021c). Particles were analysed in the fish GIT samples applying the Nile red staining methodology. The Nile red method was a suitable identification methodology for five out of six fish species (see Figure 5 for an example of a sample of P. platessa). However, in the analysis of P. flesus, digestion was not complete and confounding particles were observed (Figure 6). Six particles with fluorescence intensity varying from 126 to 166 were submitted for further analysis, i.e., for identification using μFTIR. Only one particle, having the largest fluorescence intensity of 166, was identified as being of synthetic origin, indicating that the high amount of less fluorescent particles in P. flesus is probably related to contamination of matrix background. It is unclear why matrix interference differs for P. flesus compared to the GIT content of other fish species. With the Nile red method, 45% of all samples (pooled and unpooled) contained MPs, varying from 1 to 4 particles per sample (Table 2 and Supplementary Table 2). The most observed type of particles (considering only the Nile red identification scenario (i) were granules (n = 19), followed by fibres (n = 12), film (n = 4) and irregular shaped particles (n = 1) (Table 2 and Supplementary Table 2). For fish fillet, seven out of 13 samples contained MPs, varying from one to four (Table 2 and Supplementary Table 2).
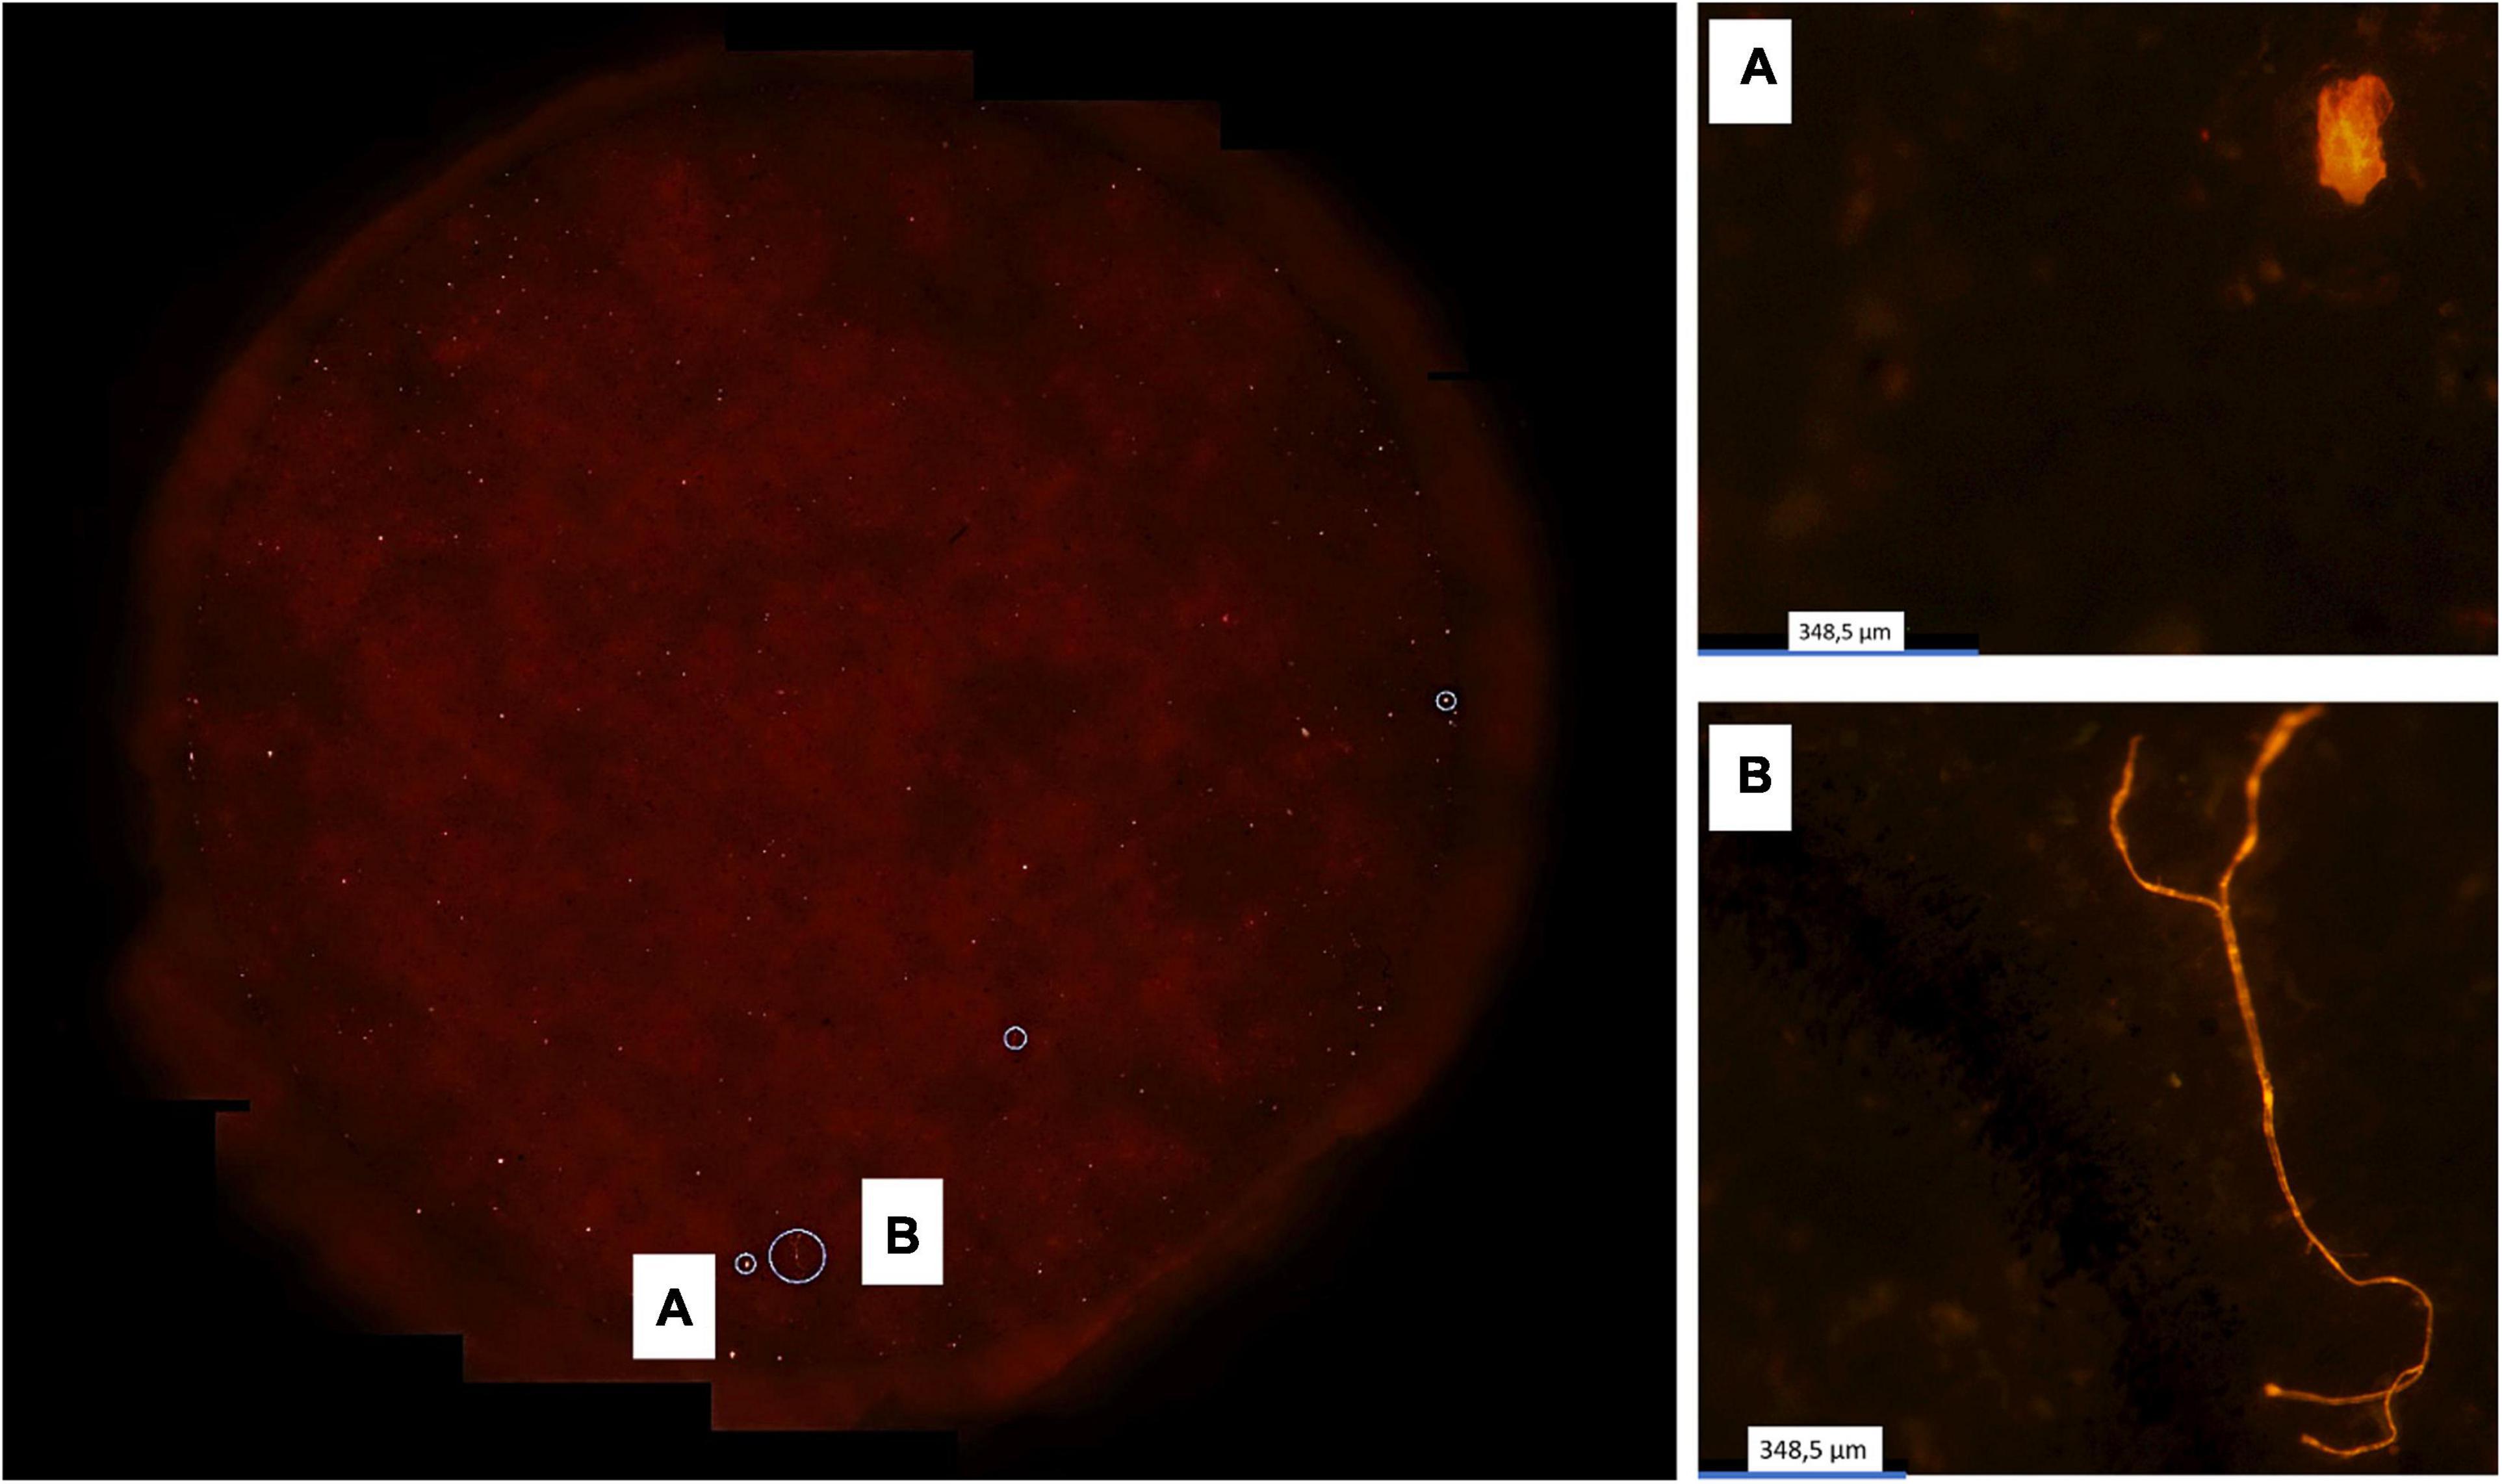
Figure 5. Nile red imaging analysis of pooled sample 2 of Pleuronectes platessa from UKNS with identification of two particles identified as plastic, larger than 120 μm.
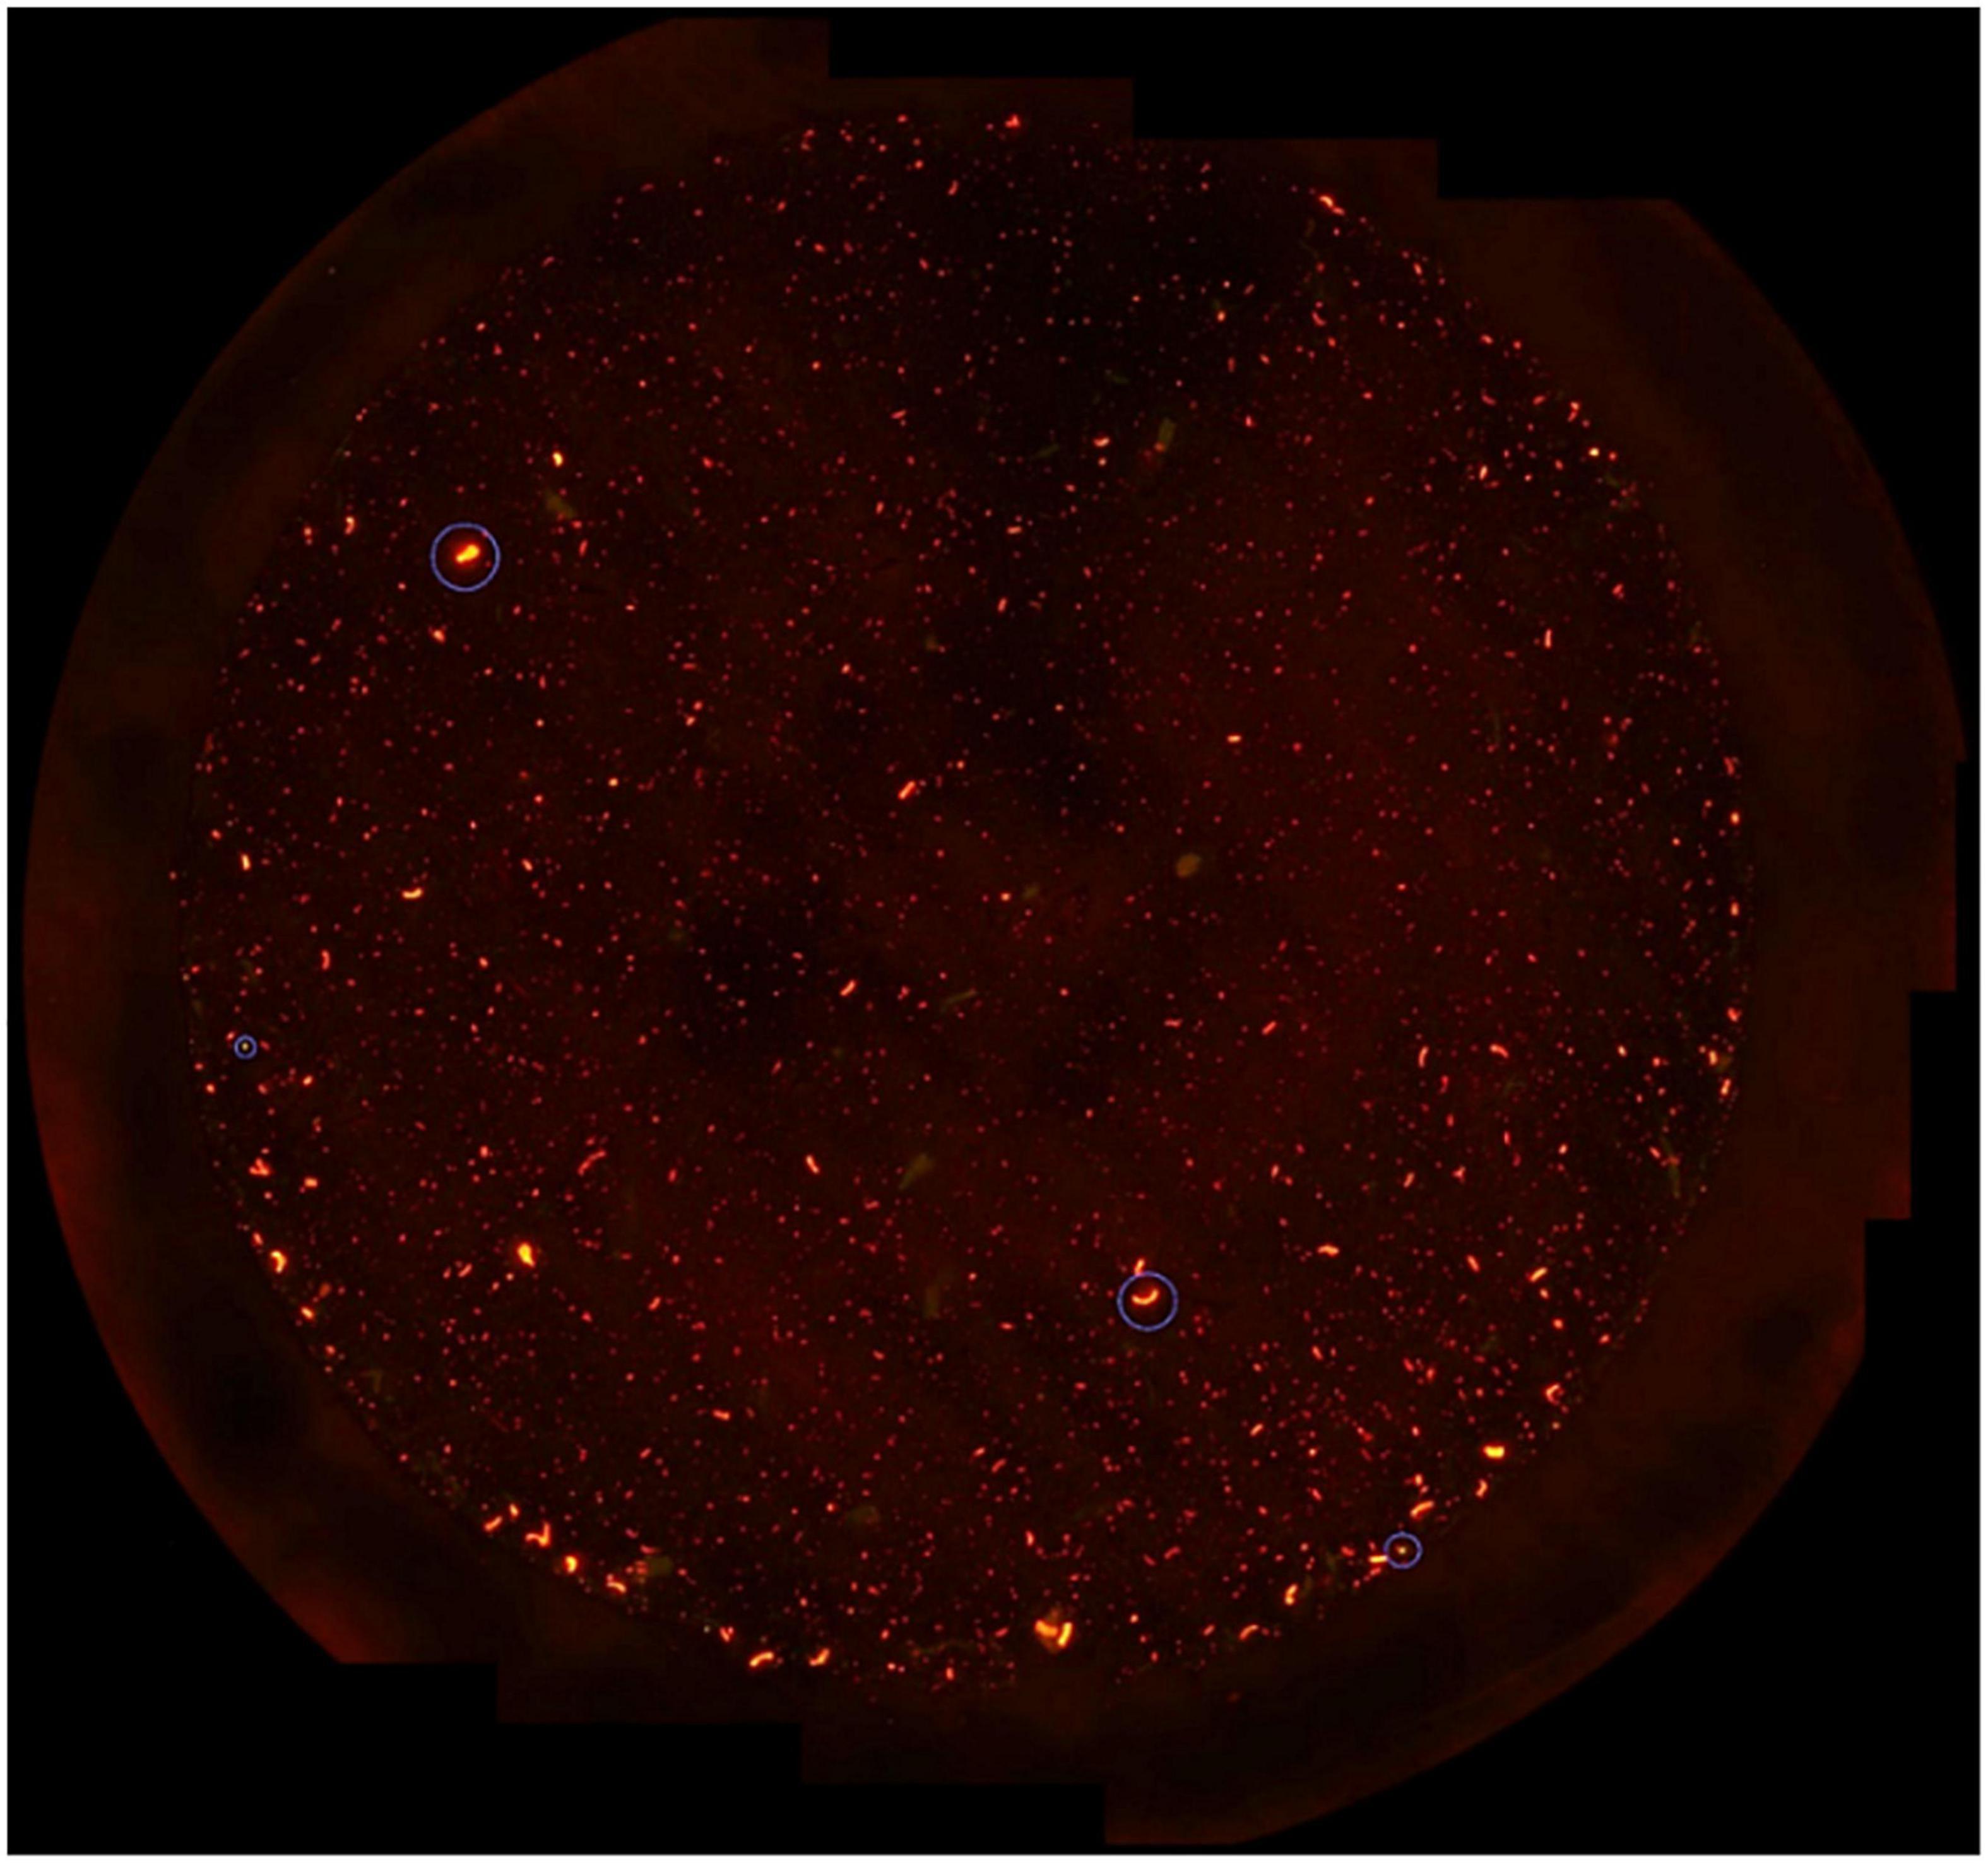
Figure 6. Imaging analysis of individual sample 2 of Platichthys flesus from BPNS stained with Nile red.
The Nile red observation methodology for MPs identification was validated using μFTIR, and we have observed that 85% of the predictions (for plastics and non-plastic particles) from the Nile red methodology are correct. Specifically, the Nile red methodology was 88% successful in identifying particles of non-polymer-based origin correctly (non-plastics), and 83% successful in identifying polymer-based particles (plastics). In the selected dataset of particles observed using μFTIR (n = 52) 32 MPs of synthetic origin were identified, with a mean match value of 79% ± 11.8 (SD), of which epoxy resin was the most common observation (n = 10), followed by polypropylene (PP) (n = 6) and polyethylene terephthalate (PET) (n = 4) (Table 6).
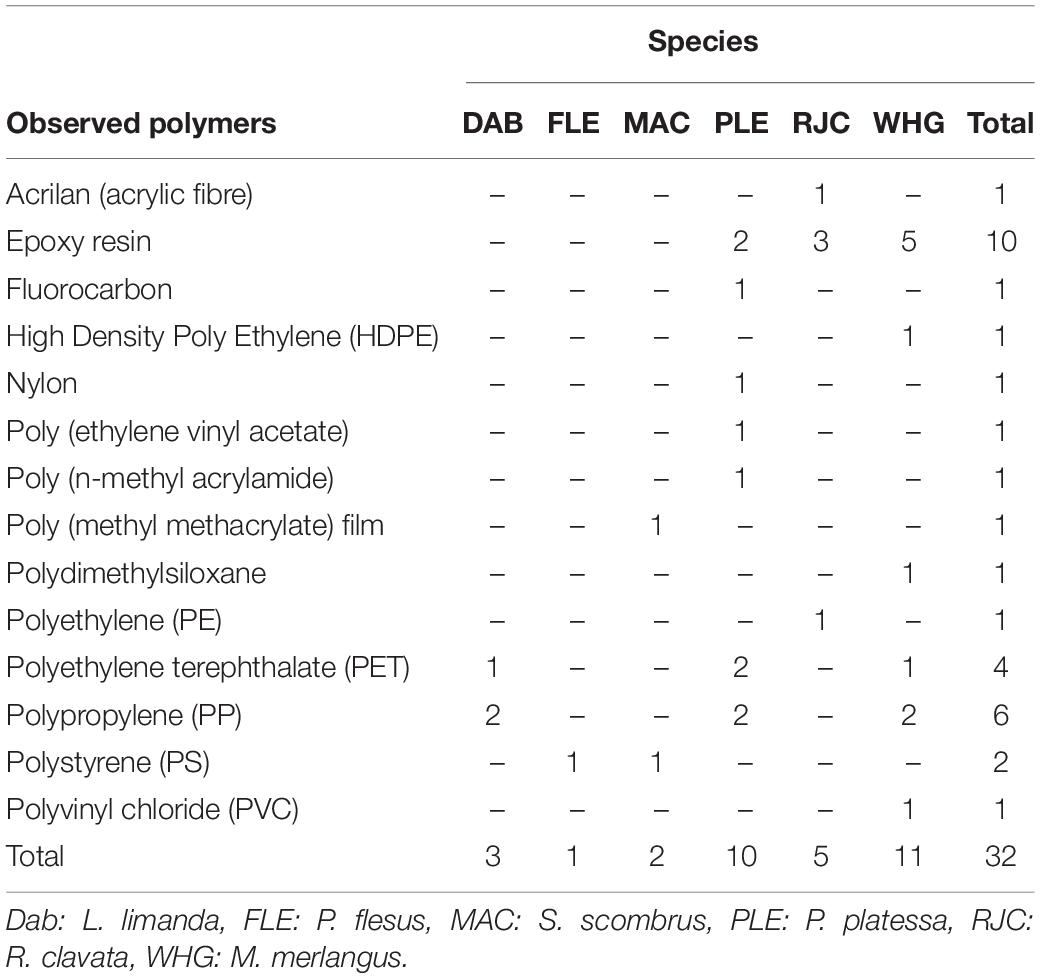
Table 6. Number of particles identified as synthetic-based microplastics (MPs) using μFTIR, per species (total of 32 particles out of a selection of 52 particles).
The proportion of single fish GIT samples where plastic particles were observed was 45% when the Nile red methodology scenario was considered, 37% after using the correction factor from μFTIR observations, and 21% after further considering the contamination factor of positive control samples (fish fillet). There was no significant difference on the number of MPs per sample (pKruskal–Wallis > 0.05) between species or between areas in all three considered scenarios, and the mean number of MPs per single fish GIT (± standard deviation) was i: 0.48 ± 0.81, n = 65; ii: 0.42 ± 0.79, n = 71; iii: 0.26 ± 0.64, n = 71 (n refers to sample size, i.e., number of single fish GIT samples). According to scenario i, most samples that contained plastic particles had only one observed particle per GIT content (Figure 7). Moreover, most observed particles had a granule-like shape or were fibres (Figure 7).
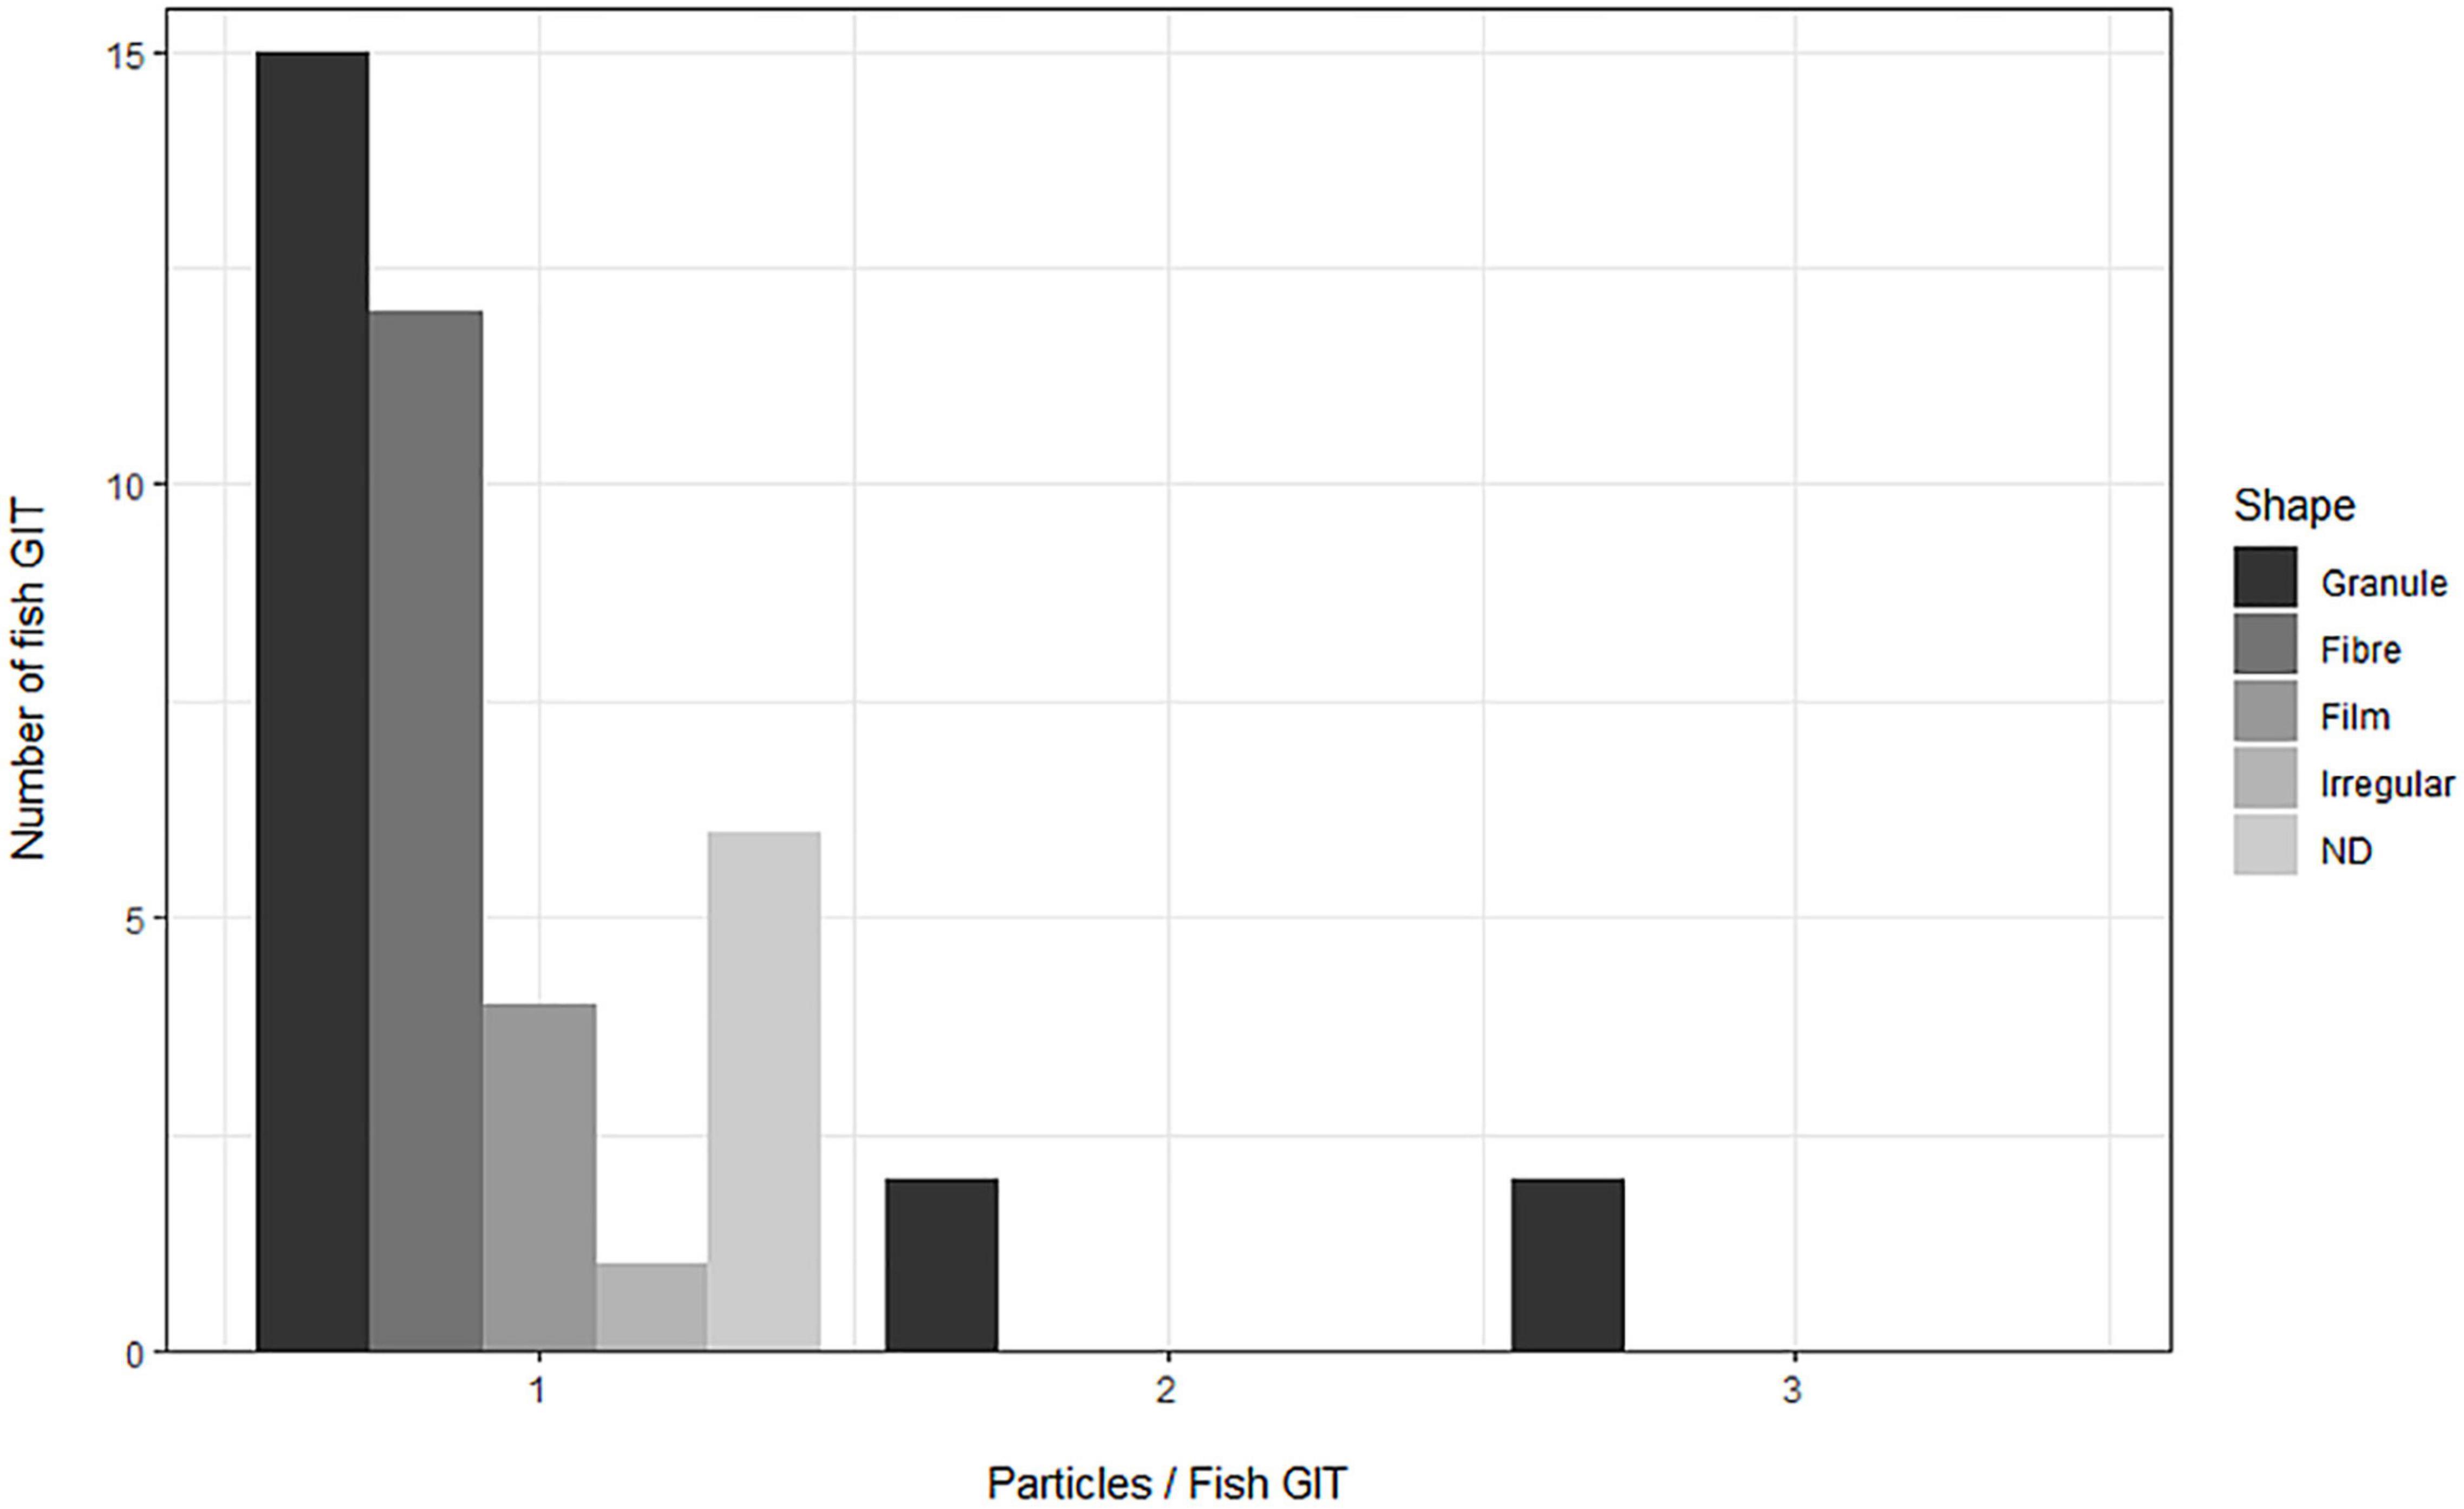
Figure 7. Number of samples (fish GIT) where one, two, or three particles per sample were observed, per particle shape (fibres, films, granules, or of irregular shape). Observations done in scenario i (Nile red observations). ND, not determined.
We estimated that the sample size to detect significant differences in the number of MPs in fish GIT between species and areas varies between 109 and 215 samples for the total model (fish GIT), depending on the considered scenario (Table 4). When estimating the sample size to detect significant differences in the number of MPs in fish GIT between only the areas or only the species, the estimated sample size increased for all scenarios. To identify differences between three areas, 160 (scenario iii)–370 (scenario i) samples are needed, and 166 (scenario iii)–311 (scenario i) samples are needed to detect difference between six species. Scenario iii was based on a theoretical exercise, and results may differ when the theoretical number of MPs, estimated after using the correction factor, will be randomly allocated to other samples.
Based on literature assessment, the protocol validation results, and based on the authors expertise, we identified the strengths, weaknesses, opportunities, and threats (SWOT analysis) on implementing a MP biomonitoring programme based on the extraction and identification of particles from fish GIT (Tables 7, 8). Fish GIT is a ubiquitous and available matrix for MPs surveying and monitoring, covering different functional niches (Table 7). However, the number of observed MP in fish GIT is low, there are potential background contamination issues of samples acquired onboard, and there can be potential time competition challenges that may constrain a monitoring implementation programme (Table 7). Sampling fish GIT during scientific fisheries surveys offers possibilities to time-efficiently acquire samples within an existing framework with trained technical staff and integration in an existing routine of metadata recording. However, implementation on larger scale and international coordination may remain challenging (Table 7), particularly in the case of sampling being done by commercial fishing vessels crew, who would require extra training in fish GIT sampling for MP biomonitoring purposes. Moreover, this activity may interfere with the commercial tasks of the crew (Table 7). Dissection of fish GIT can be done onboard or in a laboratory setting. While dissection onboard offers the advantage of being done time-efficiently by experienced sea-going observers, the risk of background contamination is larger compared to dissection in a dedicated laboratory to microplastics work (Table 8). For MP analysis, the use of Nile red staining techniques complementary to the FTIR analysis of MPs, offer high microplastic detection rates, although further optimisation and harmonisation of this technique is still required (Table 8).
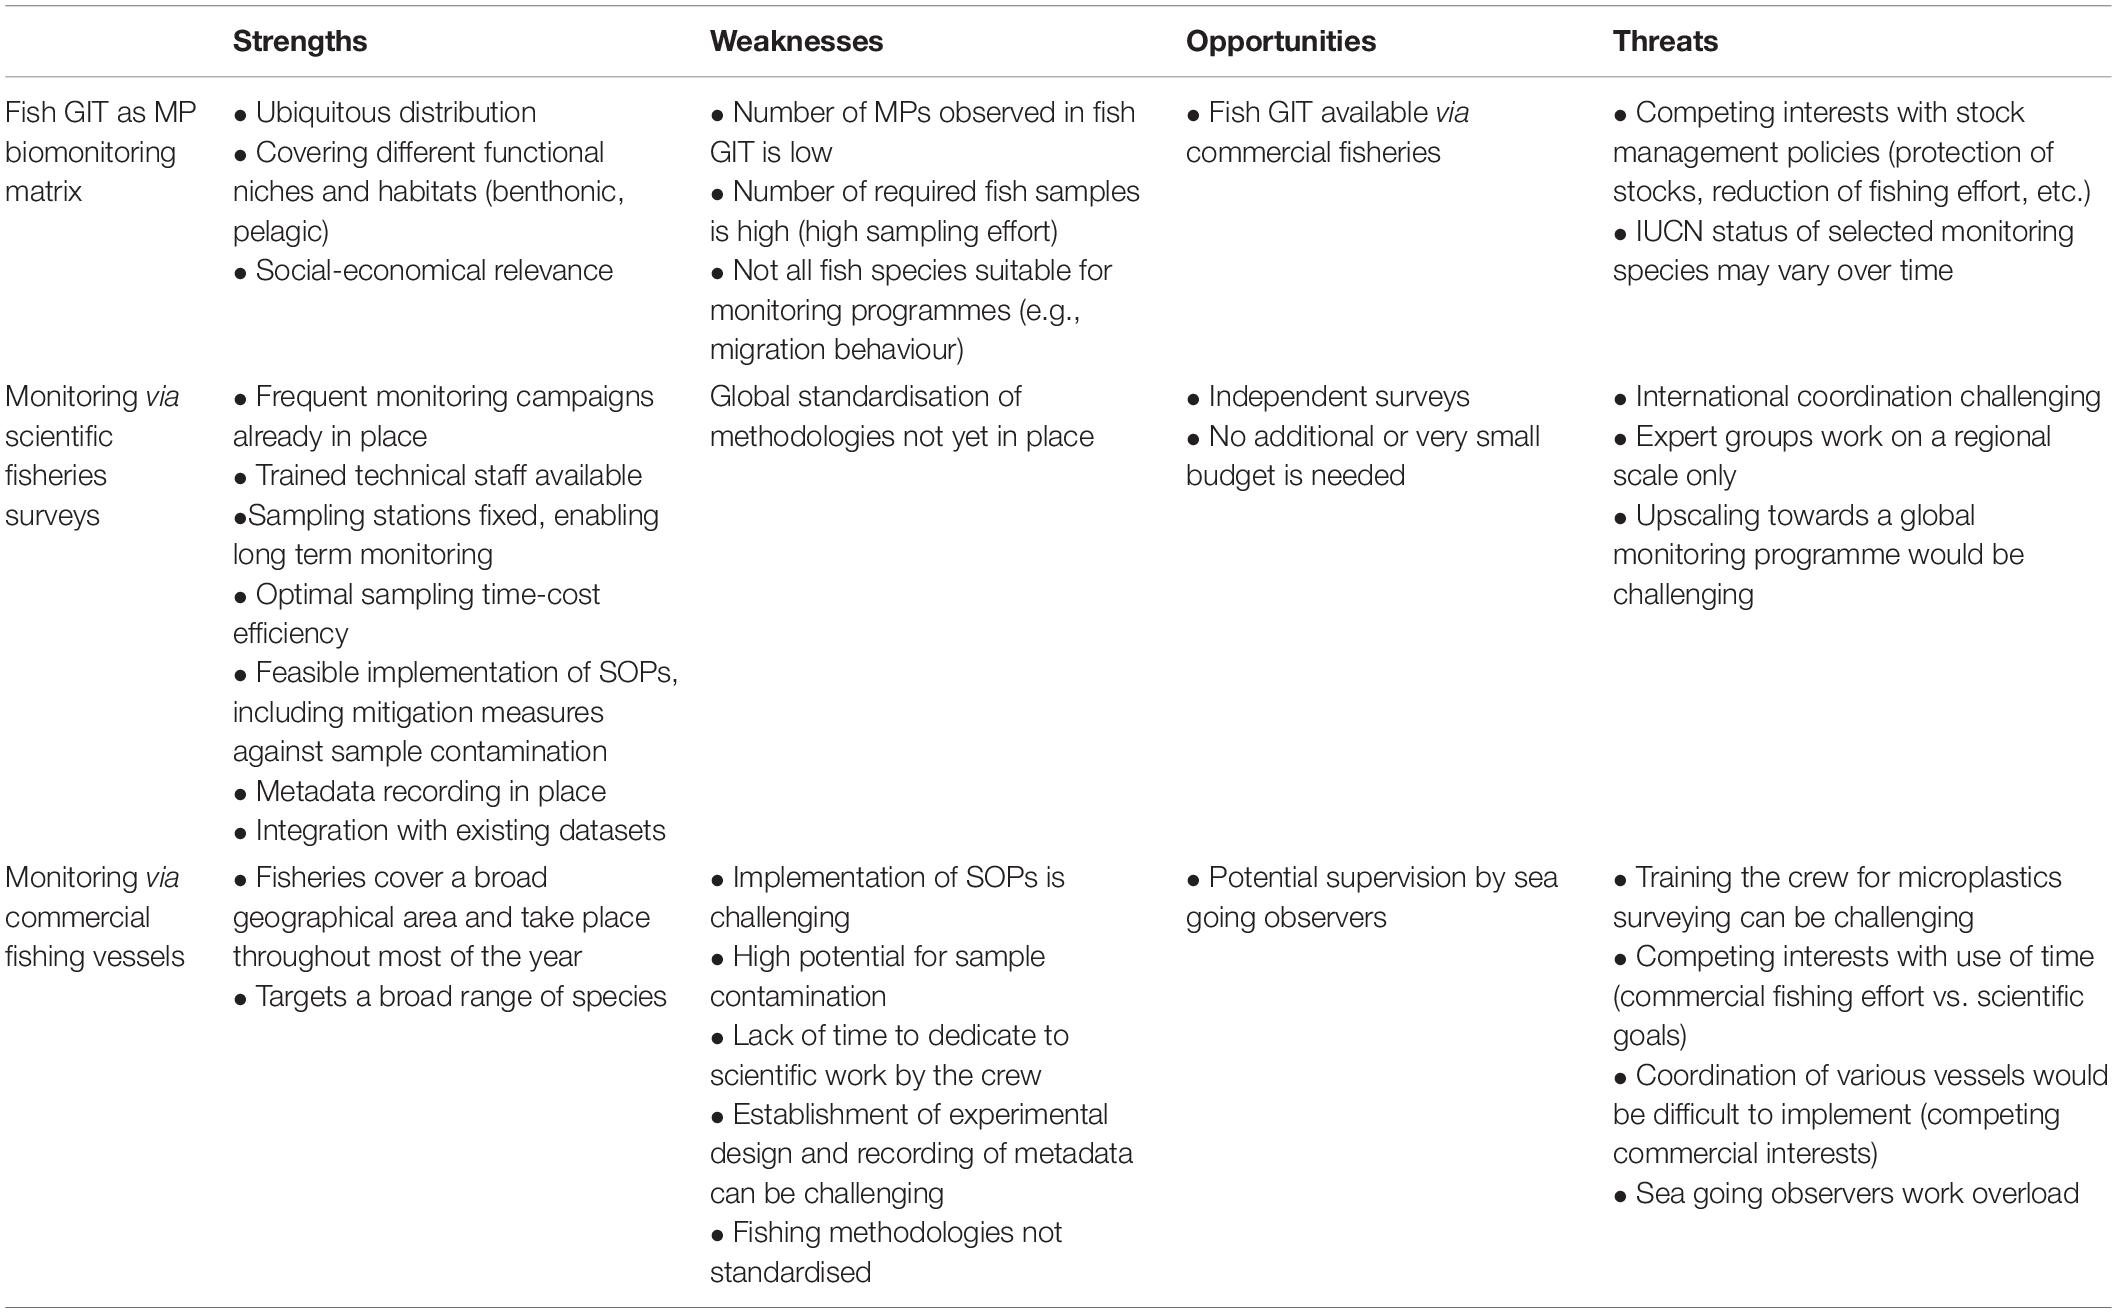
Table 7. SWOT analysis on implementing MP biomonitoring in fish GIT: fish GIT as biomonitoring matrix and sampling platform.
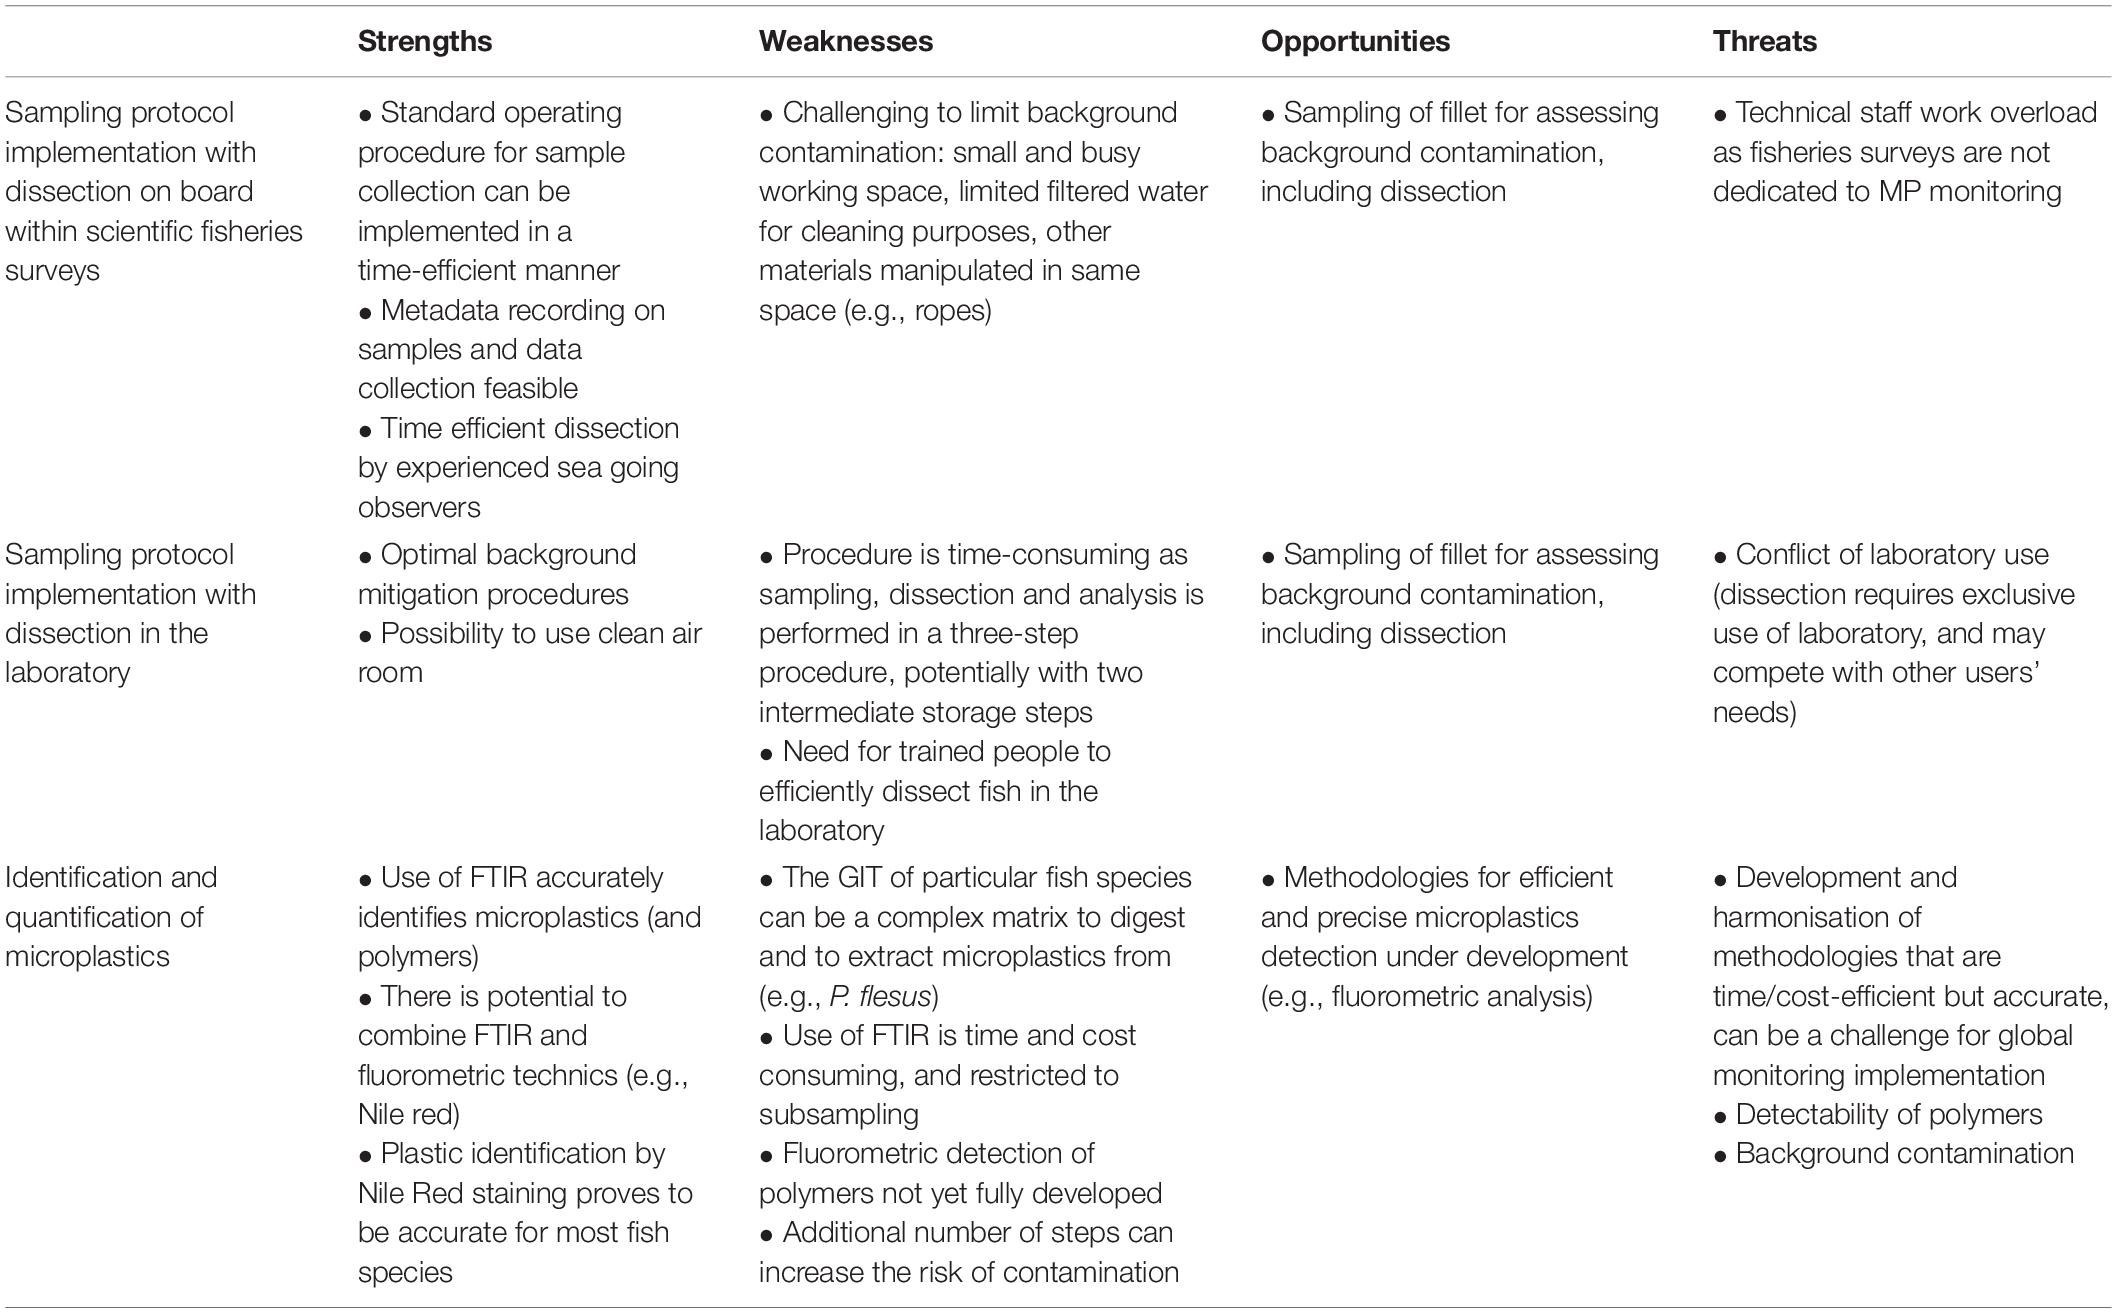
Table 8. SWOT analysis on implementing MP biomonitoring in fish GIT: sampling and analysis protocols.
The fish GIT is a suitable matrix to quantify MPs for biomonitoring purposes, thanks to its availability and accessibility, and the use of commercial species provides the opportunity to cover a broad geographical area (Pellini et al., 2018). Particularly at the North Sea, no systematic monitoring of MPs in fish or other biotic species is currently in place, and so far, a selection of fish species for monitoring has not been put forward. In our work we developed a tool for fish species selection, based on EU TGML guidelines (MSFD Technical Subgroup on Marine Litter, 2013) which included six feasibility criteria for MPs monitoring purposes. Our analysis suggests that for the southern North Sea, the benthic feeding P. platessa, and the piscivorous M. merlangus and P. flesus were the most suitable candidate species for MPs biomonitoring. Platichthys flesus was also a good candidate based on the fish selection procedure, but was more prone to issues regarding MPs identification due to matrix interference by non-plastics particles and materials when applying our MP analysis protocol (section “Microplastics Quantification in Fish Gastrointestinal Tract Samples”). Within the pelagic community, the planktivorous C. harengus is a suitable alternative species, while suggested alternative species within the benthic community are L. limanda and S. solea.
Previous work has suggested the use of cod (Gadus morhua) as an optimum fish species for MP monitoring, thanks to a higher MP prevalence in the GIT and their limited migration displacements, as well as S. sprattus, because of the broad species distribution and limited migration pattern (Kühn et al., 2020). Matiddi et al. (2021) suggest to select Anchovy (Engraulis encrasicolus), Sprat (S. sprattus), Atlantic horse mackerel (T. trachurus) and Atlantic mackerel (S. scombrus) for MP biomonitoring in fish within the entire MSFD region, including the North Sea. However, for the Southern North Sea, E. encrasicolus and S. scombrus were not in the list of 30 most caught species within BTS and DYFS. Gadus morhua did not meet the proposed distribution criterium considered: the species list limited to yearly BTS or DYFS captures, with a density of at least 1 individual/km2 at the southern North Sea (BTS and DYFS data 2010–2019). Sprattus sprattus, was not considered due to the fact that this species is not evenly distributed at the North Sea (BTS and DYFS data 2010–2019), and has limited commercial value for the southern North Sea. Trachurus trachurus did not pass criterion 4 on sustainable development (ICES, 2020b) as stocks are not within acceptable biological limits at the Southern North Sea.
The major discriminating criteria within our selection protocol were the occurrence and distribution pattern (criterion 1), the commercial value (criterion 3) and sustainable development (criterion 4). Because the selected species considered in our study are under the European Union (EU) management and are assessed by the International Council for the Exploration of the Sea (ICES), their stock undergoes proper management and there is accessibility to data on current stock status. The ecological relevance was considered to select species of different habitats and with different feeding behaviour. Similarly to our work, earlier selection protocols have considered for instance habitat, trophic level and feeding behaviour, spatial distribution, commercial importance, conservation status and ingestion of marine litter (Fossi et al., 2018) or included environmental representativeness, commercial value, distribution and litter occurrence (Matiddi et al., 2021). While the referred published protocols resulted in a selection which included multiple pelagic species, our selection mainly withheld benthic and benthopelagic species, mostly due to regional differences, rather than selection criteria differences. Our selection criteria rely on available data resulting from mostly beam trawling activities, due to the bathymetry of the Southern North Sea, which is a shallow shelf sea, which capture mainly benthic species.
The criteria applied within our protocol can also be applied to other world regions, considering local fishing techniques, stock management, and protection status of species. The final selection of species will always reflect regional specificities.
In this work, the assessment of using fish GIT for monitoring purposes was done within scientific fisheries surveys, but we further considered the alternative use of commercial fishing vessels. The joint use of fisheries independent surveys, such as the BTS, International Beam Trawl Survey (IBTS), MEDITS or SOLEMEON, with MPs biomonitoring programmes are a potential valuable framework as limited additional budget is required since the logistics for a full monitoring campaign are already in place. Furthermore, sampling of GIT for MP monitoring purposes can be added to the existing protocols in place and training the technical staff guarantees that collection is done in a scientifically sound manner, reducing the risk of contamination. Data on sampling location and sampling time is digitally collected, and environmental data on e.g., temperature or salinity is routinely registered within these cruises. Within the North Sea region, where our pilot study took place, fish data is collected within Collection Framework EC 2017/1004 (The European Parliament, and The Council of The European Union, 2017). Different surveys, such as the BTS or the IBTS are carried out in this region by several countries that border the North Sea which implies that almost the entire North Sea area is covered by these surveys and samples are taken on a regular basis of minimum once a year (ICES, 2015, 2019d). Some of these surveys have been done for decades, indicating that long-term monitoring and times series data can be established. The use of standardised sampling designs gives the ability to compare results between areas and over time. To succeed in obtaining standardised and quality-controlled fish GIT monitoring within fisheries surveys, collaboration between fisheries and MP expert groups is essential. However, as fisheries surveys are region specific, defined by international agreements, implementing standardised methodologies for MP monitoring across regions can become more challenging.
The alternative to the use of fisheries surveys for MP monitoring purposes, is making use of commercial fishing trips to monitor fish GIT for MPs presence. The advantage of this practice is that the activities of commercial fishing vessels cover an even broader geographical area, take place throughout most of the year, and target a broader range of species, both demersal and pelagic fish. However, implementing a standardised sampling protocol in fishing vessels with untrained crew can represent a challenge in this approach. Sample collection for MP monitoring purposes is not part of the tasks on a fishing vessel, so additional training would have to be provided to the crew, or seagoing observers should accompany the fisheries cruise. There can be further limitations in terms of costs for sampling and available crew/staff time. Additionally, the monitoring experimental design can present an extra challenge, as fishing vessels regularly change planned trips, according to the location of target species, or due to commercial interest. Finally, the coordination of sampling campaigns using various vessels would be problematic to implement, as fleets have frequently competing interests and use differing fishing gear, methods, etc., which would make standardisation complex. Upscaling these monitoring programmes towards a global coordinated effort, would be challenging.
We have developed a sampling protocol for sampling of fish GIT for MP extraction and quantification, suitable to be implemented by technical staff onboard scientific research vessels (De Witte et al., 2021b). This sampling protocol was based on guidelines from Hermsen et al. (2018) and ICES (2021b) which suggest detailed reporting of the sampling method, sample storage and transport. Recorded metadata in situ includes the fish species, length, weight, sampling day, and sampling location (De Witte et al., 2021c). Within fisheries surveys, data on gear type and sampling depth are also recorded. Both Hermsen et al. (2018) and ICES (2021b) advise on the recording of details concerning the sampling environment (e.g., colour of staff gear and garments), to ensure that potential contamination from sampling can be linked to its source. A dedicated table was included in the sampling protocol in which information on plastic and rubber material near the sampling area could be recorded. The sampling protocol contained indications to reduce sample contamination, and the collection of fillet samples, to be used as positive controls for airborne fibres and other particles. Samples were recommended to be stored on ice or at -20°C, to avoid excessive degradation (Hermsen et al., 2018).
Analytical procedural blanks that include all laboratory processes are essential to quantify background MP contamination (Hermsen et al., 2018), but do not correct for contamination during sampling, dissection and storage. Previous reports have suggested that the use of clean petri dishes displaced at the sampling and dissection area can correct for airborne MP contamination (Hermsen et al., 2018). However, we suggested an alternative approach to check for MP contamination which included the dissection of fillet samples (selected fish) as blank samples. Fillet blanks can be integrated in procedures with dissection onboard as well in the laboratory. Translocation of MPs to liver and tissue may be possible (Avio et al., 2015; Collard et al., 2017a; Abbasi et al., 2018), but this is limited to particles of the lower μm-size (Lu et al., 2016). In our work, we considered the detection and identification of plastic particles with sizes above 50 μm, and so the presence of MPs in fish fillet was expected to be negligible, as particles >50 μm would not be able to cross epithelium membranes such as in the GIT (Lusher et al., 2017a). As fish fillet sampling requires a similar handling as taking a fish GIT sample, performed in the same workspace and on a similar timescale, the analysis of fish fillet can be a proxy to estimate procedural blank contamination. Because stress on fish in the net might cause regurgitation or stomach inversion (Lusher et al., 2017b), specific guidelines to not include fish with everted or empty stomachs, or with a filled mouth, were also incorporated in the protocol. A protocol briefing was done prior to each sampling campaign and dedicated seagoing observers performed all sampling steps from dissection to storage. Collaboration with existing fisheries survey staff enabled a time-efficient dissection in situ, a major advantage compared to planning the dissection within the laboratory activities on land.
The major challenge with fish dissection and GIT/fillet sample collection onboard is mitigating the risk of background contamination. By dissecting fish in the laboratory, optimal mitigation measures of background MPs contamination can be taken, as it is possible to work in a clean air environment, e.g., in a flow cabinet (Hermsen et al., 2018). Onboard of most research vessels the implementation of mitigation measures is limited. For instance, the availability of filtered water when cleaning dissection material can be limited, it is difficult to limit background contamination by airborne fibres, the manipulation of other materials (ropes, garments, etc.) in the working area can also take place. To account for airborne particles contamination, we included a series of control measures in the dissection and sampling protocol (De Witte et al., 2021b), and accounted for contamination using fillet samples as blank samples. Our results indicate that although the mean number of MPs in the blank fillet samples was low, 54% of the samples still contained at least one particle (Table 2 and Supplementary Table 2). This indicates that contamination is only contained to a certain extent. Due to the low observed number of MPs in fish GIT, this background contamination can still significantly affect the results and interpretation of the fish GIT monitoring programme. Although dissection in controlled laboratory settings may reduce background contamination, airborne fibres can be identified in procedural blanks even using controlled forensic techniques (Woodall et al., 2015). The decision of performing the dissection activities onboard or not, will be subject to the trade-off analysis of final users after considering sampling cost vs. quality of the analysis.
The extraction, identification, and quantification of MPs from environmental matrices is currently based on a wide range of analytical and standardised techniques. However, to be used in monitoring programmes, analytical methods should be time- and cost-efficient, with an acceptable level of accuracy and precision. In our work, a KOH-based digestion was combined with a density separation to remove fish GIT matrix and to allow quantitative analysis of MPs. Saturated sodium tungstate was used as salt within the density separation step, due to its low health hazard and relatively high density of 1.4 g.cm–3 (Frias et al., 2018). However, other alternative salts with higher density might also be applied, such as ZnCl2 or NaI (Frias et al., 2018). We further combined methodologies based on Nile red staining and FTIR for improved MPs identification in a cost-efficient manner. Desirable factors for the selection of identification methods include the detectability of polymers, mostly achievable using spectroscopic techniques such as FTIR or Raman (Bessa et al., 2019), which are often considered time consuming and costly for routine analysis and monitoring (Maes et al., 2017). Therefore polymer identification is mostly restricted to a sub-sample of the observed MPs. Identification of MPs based solely on microscopic observations is prone to observers bias and errors and it does not enable polymer identification (Löder and Gerdts, 2015). Recent methodologies based on the fluorometric analysis of dyed particles (e.g., by Nile red) have, however, demonstrated potential to efficiently screen field samples and identify MPs (Erni-Cassola et al., 2017; Maes et al., 2017), including polymers (Meyers et al., 2021) in a time effective manner. We have successfully applied the use of the fluorometric method based on Nile red staining for MP analysis from fish GIT matrices, with an overall 85% of correct predictions (for plastics and non-plastic particles), confirmed using μFTIR.
The Nile red staining method is a cost-efficient methodology to fast screen samples and to differentiate between plastic materials and natural materials (Maes et al., 2017). Earlier work on Nile red based MP analysis methods reported mainly the feasibility to identify plastics from non-plastics in water and sediment matrices (Shim et al., 2016; Erni-Cassola et al., 2017; Maes et al., 2017), and up to now, only a limited number of studies used Nile red identification of MPs in biota, especially invertebrates (Catarino et al., 2018; Iannilli et al., 2019; Wang et al., 2019). To our knowledge, this study is the first to demonstrate that a high accuracy in identifying synthetic polymers can also be met in fish GIT samples, which are known to be of high complexity to analyse due to the presence of natural lipophilic structures. Results for P. flesus indicate that an efficient matrix digestion is fundamental when applying coulometric methodologies. For five out of six fish species, the use of Nile red assisted in the MP identification, with low cost and with no particular addition of processing time.
Even though fish GIT is an accessible and suitable matrix for MPs extraction, our results indicate a low number of MPs observed in fish GIT. We have observed a maximum number of four MPs per fish GIT, but only <45% of fish contained at least a plastic particle, with mean 0.48 ± 0.81 MPs per fish GIT (n = 65) based solely on Nile red observations, and 0.42 ± 0.79 (SD; n = 71) MPs per fish GIT after μFTIR correction. When we applied a correction factor based on the blank (fillet) observations for background contamination assessment, this number was even further reduced (21% of the observed fish ingested MPs). Similarly, other publications on MPs in fish GIT report <10% of samples containing MPs in various fish species including C. harengus, L. limanda, M. merlangus, P. platessa, and S. scombrus (Foekema et al., 2013; Bråte et al., 2016; Rummel et al., 2016; Hermsen et al., 2017; Kühn et al., 2020), or values of between 20 and 95%, but with low mean numbers of plastics per fish GIT (<2 MPs per sample) (Lusher et al., 2013; Neves et al., 2015; Collard et al., 2017b; Güven et al., 2017). Specifically, in the North Sea, a low incidence of MPs in fish GIT has been observed, with only 1.8% of samples containing MPs in one report (Kühn et al., 2020), and only two plastic particles observed in 1 of 400 sampled individual fish in another (Hermsen et al., 2017). Hermsen et al. (2017) estimated that the ingestion incidence of MPs in North Sea fish is between 0.09 and 1.1%, which can be linked to low retention times in the GIT (4–25 h, compatible with normal processing of food items) (Ohkubo et al., 2020; Roch et al., 2021) or potential low ingestion incidence (Hermsen et al., 2017). The low number of MPs observed in the samples affects the power to determine significant differences between species, as well as at spatial and temporal scales (Cohen, 1988; Goldstein et al., 2013). In our study, there were no significant differences observed in the number of MPs found in sampled species and from fish GIT from species caught in different geographic areas.
We have determined that the low numbers of MPs observed can result in a requirement for high sampling numbers to establish a monitoring programme. The power analyses based in this study results indicate that the number of required samples varied between 109 and 370, depending on the considered statistical analysis scenario (Table 4). Our suggested number of fish samples needed to detect statistically significant differences are higher than those previously advised by The INDICIT consortium, which suggest a sampling effort of 30 individuals per species per area (Matiddi et al., 2021), although not based on statistical methodologies. Similar to our work, Goldstein et al. (2013) used a power analysis to assess whether it would be possible to detect areas of high plastic concentration in surface waters. These authors stated that the variability of surface MPs requires a high sample number to be able to detect temporal changes in their abundance, with a substantial sampling effort (Goldstein et al., 2013), a conclusion that supports our results. To our knowledge, both our work and Goldstein et al. (2013) are currently the only two reports that considered the use of a power analysis to establish the sampling effort of survey and/or monitoring campaigns of MPs. Logistical limitations on sampling collection and processing (e.g., limited ship time, digestion, filtration, Nile red analysis together with μFTIR, etc.) can, in practical terms, limit access to required number of samples for monitoring purposes of MPs in fish GIT. So, although fish is a readily accessible sampling matrix and it is possible to acquire a high number of fish GIT, processing samples for MPs quantification can represent a challenge in the implementation of large-scale monitoring programmes.
To our knowledge, no systematic biomonitoring of MP in fish GIT is currently implemented (2021). However, implementation opportunities at regional scale may lay in enhanced cooperation with fisheries surveys. Within Europe, EU and ICES expert groups have taken actions to integrate key aspects of the ecosystem and relevant parameters for fish populations such as temperature, food availability and habitat structure in the current fisheries surveys. Examples of such initiatives are the ICES Working Group on Integrating Surveys for the Ecosystem Approach (WGISUR) and Workshop on the Realigning of the Ecosystem Observation Steering Group (WKREO). According to the experts of WGISUR, the next step would be to work towards integrated ecosystem-based monitoring platforms in which the separate national surveys would no longer exist, and the entire ecosystem would be monitored and coordinated by all nations together through regional ecosystem monitoring platforms. As a parallel initiative, the Regional Coordination Group (RCG for North Atlantic, North Sea and East Artic, and RCG Baltic) are working on adding fish stomach sampling to the fisheries surveys in the North Sea. The integration of stomach sampling in the survey protocol is mandatory under the new data collection framework EC 2017/1004 (The European Parliament, and The Council of The European Union, 2017), and will be stepwise integrated in the regional work plans from 2022 onwards. A proportion of these samples could for example be used for MPs extraction and quantification. To achieve these important milestones, thorough communication and collaboration between MPs and fisheries expert groups of the EU and ICES will be essential to guarantee quality and successful implementation.
To assess the extent of biota exposure to MPs in the marine environment, it is essential to establish systematic monitoring programmes. In this work, we assessed the feasibility of using fish GIT of commercial caught fish in MP biomonitoring at the Southern North Sea. Six indicator species were suggested, based on the applied fish species selection protocol: benthic and benthopelagic M. merlangus, P. platessa, S. solea, L. limanda, and P. flesus, and pelagic C. harengus. Our sampling and analysis protocols were successfully validated, and can be applied when monitoring MPs in fish GIT. The use of fishery surveys is recommended as they offer low-cost opportunities for sampling in a scientific sound manner, also ensuring the strict registration of essential metadata. For MP analysis, a Nile red staining method was applied combined with confirmation of a part of the MPs by μFTIR, with accurate (85%) MP identification. If applied in large scale monitoring programmes, the Nile red methodology can enable time-efficient MPs identification and quantification. The required high number of fish GIT samples to identify significant differences between, for instance, sampling areas or species, can increase the cost of the implementation of large-scale biomonitoring programmes. On a regional scale, the cost of sampling and analysing a large number of samples should, however, be outweighed against the importance to assess the spatial-temporal distribution and trends of MP contamination in environmental biotic matrices.
The original contributions presented in the study are publicly available. The datasets on the species selection analysis are available in the Supplementary Material. The datasets concerning the fish collection for microplastics quantification in fish gastrointestinal tract content, sample processing, and microplastics characterisation are available via: De Witte et al. (2021c).
Ethical review and approval was not required for the animal study because analysis was done on wild caught fish, sampled within existing fisheries monitoring campaigns.
BD: conceptualisation, investigation, methodology, data curation, writing original draft, and writing–review and editing. AC: conceptualisation, formal analysis, investigation, methodology, data curation, writing original draft, and writing–review and editing. LV: conceptualisation, investigation, methodology, writing original draft, and writing–review and editing. MD and DD: investigation and writing–review and editing. NM: methodology and writing–review and editing. SP: formal analysis, data curation, and writing–review and editing. KH: supervision and writing–review and editing. GE: formal analysis, supervision, and writing–review and editing. ET: conceptualisation, supervision, and writing–review and editing. All authors contributed to the article and approved the submitted version.
The MICROFISH project was financed by CEFIC. We also acknowledge the “marine plastics” project (18-UP6-02-DIV), funded by the European Maritime and Fisheries Fund (EMMF).
The authors declare that the research was conducted in the absence of any commercial or financial relationships that could be construed as a potential conflict of interest.
All claims expressed in this article are solely those of the authors and do not necessarily represent those of their affiliated organizations, or those of the publisher, the editors and the reviewers. Any product that may be evaluated in this article, or claim that may be made by its manufacturer, is not guaranteed or endorsed by the publisher.
We acknowledge the seagoing observers of the Marine Biology group of ILVO, the laboratory technicians of the marine analytical laboratory of ILVO, and laboratory technicians Julie Muyle and Mattias Bossaer of VLIZ. We also want to thank Joanna Marie Goley and Olga Trela for the support in the fish species selection procedure. North Sea samples were obtained by the research vessels Belgica (operated by the Belgian Navy under charter of RBINS) and Simon Stevin (VLIZ).
The Supplementary Material for this article can be found online at: https://www.frontiersin.org/articles/10.3389/fmars.2021.794636/full#supplementary-material
Abbasi, S., Soltani, N., Keshavarzi, B., Moore, F., Turner, A., and Hassanaghaei, M. (2018). Microplastics in different tissues of fish and prawn from the Musa Estuary, Persian Gulf. Chemosphere 205, 80–87. doi: 10.1016/j.chemosphere.2018.04.076
Ahrendt, C., Perez-Venegas, D. J., Urbina, M., Gonzalez, C., Echeveste, P., Aldana, M., et al. (2020). Microplastic ingestion cause intestinal lesions in the intertidal fish Girella laevifrons. Mar. Pollut. Bull. 151:110795. doi: 10.1016/j.marpolbul.2019.110795
Avio, C. G., Gorbi, S., and Regoli, F. (2015). Experimental development of a new protocol for extraction and characterization of microplastics in fish tissues: first observations in commercial species from Adriatic Sea. Mar. Environ. Res. 111, 18–26. doi: 10.1016/j.marenvres.2015.06.014
Beer, S., Garm, A., Huwer, B., Dierking, J., and Nielsen, T. G. (2018). No increase in marine microplastic concentration over the last three decades – A case study from the Baltic Sea. Sci. Total Environ. 621, 1272–1279. doi: 10.1016/j.scitotenv.2017.10.101
Bessa, F., Frias, J., Kögel, T., Lusher, A., Andrade, J. M., Antunes, J., et al. (2019). Harmonized Protocol for Monitoring Microplastics in Biota. Brussels: Baseman project, JPI Oceans. doi: 10.13140/RG.2.2.28588.72321/1
Blarer, P., and Burkhardt-Holm, P. (2016). Microplastics affect assimilation efficiency in the freshwater amphipod Gammarus fossarum. Environ. Sci. Pollut. Res. 23, 23522–23532. doi: 10.1007/s11356-016-7584-2
Bråte, I. L. N., Eidsvoll, D. P., Steindal, C. C., and Thomas, K. V. (2016). Plastic ingestion by Atlantic cod (Gadus morhua) from the Norwegian coast. Mar. Pollut. Bull. 112, 105–110. doi: 10.1016/j.marpolbul.2016.08.034
Bray, L., Digka, N., Tsangaris, C., Camedda, A., Gambaiani, D., de Lucia, G. A., et al. (2019). Determining suitable fish to monitor plastic ingestion trends in the Mediterranean Sea. Environ. Pollut. 247, 1071–1077. doi: 10.1016/j.envpol.2019.01.100
Cardinale, M., Chanet, B., Martínez Portela, P., Munroe, T. A., Nimmegeers, S., Shlyakhov, V., et al. (2021). Scophthalmus Maximus. The IUCN Red List of Threatened Species 2021. Gland: ICUN. doi: 10.2305/IUCN.UK.2021-2.RLTS.T198731A144939322.en
Catarino, A. I., Macchia, V., Sanderson, W. G., Thompson, R. C., and Henry, T. B. (2018). Low levels of microplastics (MP) in wild mussels indicate that MP ingestion by humans is minimal compared to exposure via household fibres fallout during a meal. Environ. Pollut. 237, 675–684. doi: 10.1016/j.envpol.2018.02.069
Champely, S. (2020). pwr: Basic Functions for Power Analysis. Available online at: https://cran.r-project.org/package=pwr (accessed March 17, 2020).
Claessens, M., De Meester, S., Van Landuyt, L., De Clerck, K., and Janssen, C. R. (2011). Occurrence and distribution of microplastics in marine sediments along the Belgian coast. Mar. Pollut. Bull. 62, 2199–2204. doi: 10.1016/j.marpolbul.2011.06.030
Clarivite (2020). Web of Science. Available online at: https://www.webofscience.com/ (accessed April 27, 2020).
Cohen, J. (1988). Statistical Power Analysis for the Behavioral Sciences, 2nd Edn. Mahwah, NJ: Lawrence Erlbaum Associates, Publishers.
Collard, F., Gilbert, B., Compère, P., Eppe, G., Das, K., Jauniaux, T., et al. (2017a). Microplastics in livers of European anchovies (Engraulis encrasicolus, L.). Environ. Pollut. 229, 1000–1005. doi: 10.1016/j.envpol.2017.07.089
Collard, F., Gilbert, B., Eppe, G., Roos, L., Compère, P., Das, K., et al. (2017b). Morphology of the filtration apparatus of three planktivorous fishes and relation with ingested anthropogenic particles. Mar. Pollut. Bull. 116, 182–191. doi: 10.1016/j.marpolbul.2016.12.067
DATRAS (2020). The Database of Trawl Surveys, DATRAS. Available online at: https://www.ices.dk/data/data-portals/Pages/DATRAS.aspx (accessed November 5, 2020).
De Witte, B., Catarino, A. I., Vandecasteele, L., Dekimpe, M., Meyers, N., Deloof, D., et al. (2021a). Extraction and Quantification of Microplastics in the Gastrointestinal Tract of Fish. Version 2, 31/08/2021. Ostend: ILVO, doi: 10.48470/7
De Witte, B., Catarino, A. I., Vandecasteele, L., Dekimpe, M., Meyers, N., Deloof, D., et al. (2021b). Fish Gastrointestinal Sampling Protocol for Microplastics Extraction and Quantification. Version 2, 31/08/2021. Ostend: ILVO, doi: 10.48470/6
De Witte, B., Catarino, A. I., Vandecasteele, L., Dekimpe, M., Meyers, N., Deloof, D., et al. (2021c). Microplastics in fish gastrointestinal tracts sampled in 2020 in the North Sea (MICROFISH project). Flanders research institute for agriculture, fisheries and food (ILVO); Flanders Marine Institute (VLIZ). Mar. Data Arch. 5. doi: 10.14284/516 (accessed September 30, 2021).
Derraik, J. G. (2002). The pollution of the marine environment by plastic debris: a review. Mar. Pollut. Bull. 44, 842–852. doi: 10.1016/S0025-326X(02)00220-5
DLV (2018). De Belgische Zeevisserij 2018 – Aanvoer En Besomming. Available online at: www.vlaanderen.be/landbouw (accessed November 5, 2020).
Erni-Cassola, G., Gibson, M. I., Thompson, R. C., and Christie-Oleza, J. A. (2017). Lost, but found with Nile Red: a novel method for detecting and quantifying small microplastics (1 mm to 20 μm) in environmental samples. Environ. Sci. Technol. 51, 13641–13648. doi: 10.1021/acs.est.7b04512
European Commission (2021). Commission Delegated Decision (EU) 2021/1167 of 27 April 2021. Available online at: https://eur-lex.europa.eu/legal-content/EN/TXT/PDF/?uri=CELEX:32021D1167&from=EN. (accessed July 16, 2021).
Foekema, E. M., De Gruijter, C., Mergia, M. T., van Franeker, J. A., Murk, A. J., and Koelmans, A. A. (2013). Plastic in North Sea Fish. Environ. Sci. Technol. 47, 8818–8824. doi: 10.1021/es400931b
Fossi, M. C., Pedà, C., Compa, M., Tsangaris, C., Alomar, C., Claro, F., et al. (2018). Bioindicators for monitoring marine litter ingestion and its impacts on Mediterranean biodiversity. Environ. Pollut. 237, 1023–1040. doi: 10.1016/j.envpol.2017.11.019
Fox, J., and Weisberg, S. (2018). An R Companion to Applied Regression, 3 Edn. San Diego, CA: SAGE Publications, Inc.
Freyhof, J. (2010). Platichthys flesus (Errata Version Published in 2018). The IUCN Red List of Threatened Species 2010. Gland: ICUN.
Freyhof, J. (2015). Pleuronectes platessa. The IUCN Red List of Threatened Species 2015. Gland: ICUN.
Frias, J., Pagter, E., Nash, R., O’Connor, I., Carretero, O., Filgueiras, A., et al. (2018). Standardised Protocol for Monitoring Microplastics in Sediments. Brussels: Baseman project, JPI Oceans. doi: 10.13140/RG.2.2.36256.89601/1
Froese, R., and Pauly, D. (2021). FishBase. World Wide Web Electronic Publication. Version (06/2021). Available online at: www.fishbase.org (accessed November 5, 2020).
GESAMP (2019). “Guidelines for the monitoring and assessment of plastic litter in the ocean,” in IMO/FAO/UNESCO-IOC/UNIDO/WMO/IAEA/UN/UNEP/UNDP/ISA Joint Group of Experts on the Scientific Aspects of Marine Environmental Protection, eds P. J. Kershaw, A. Turra, and F. Galgani (London: GESAMP).
Geyer, R., Jambeck, J. R., and Law, K. L. (2017). Production, use, and fate of all plastics ever made. Sci. Adv. 3:e1700782. doi: 10.1126/sciadv.1700782
Gibson, R. N. (1999). “Movement and homing in intertidal fishes,” in Intertidal Fishes: Life in Two Worlds, 1st Edn, eds M. H. Horn, K. L. M. Martin, and M. A. Chotkowski (San Diego, CA: Academic Press), 97–125. doi: 10.1016/b978-012356040-7/50007-x
Glass, J. R., Kruse, G. H., and Miller, S. A. (2015). Socioeconomic considerations of the commercial weathervane scallop fishery off Alaska using SWOT analysis. Ocean Coast. Manag. 105, 154–165. doi: 10.1016/j.ocecoaman.2015.01.005
Golani, D., Kada, O., Nouar, A., Quignard, J. P., and Cuttelod, A. (2011). Scophthalmus rhombus. The IUCN Red List of Threatened Species 2011. Gland: ICUN.
Goldstein, M. C., Titmus, A. J., and Ford, M. (2013). Scales of spatial heterogeneity of plastic marine debris in the Northeast Pacific Ocean. PLoS One 8:e80020. doi: 10.1371/journal.pone.0080020
Gouin, T. (2020). Toward an improved understanding of the ingestion and trophic transfer of microplastic particles: critical review and implications for future research. Environ. Toxicol. Chem. 39, 1119–1137. doi: 10.1002/etc.4718
Güven, O., Gökdağ, K., Jovanović, B., and Kıdeyş, A. E. (2017). Microplastic litter composition of the Turkish territorial waters of the Mediterranean Sea, and its occurrence in the gastrointestinal tract of fish. Environ. Pollut. 223, 286–294. doi: 10.1016/j.envpol.2017.01.025
Hermsen, E., Mintenig, S. M., Besseling, E., and Koelmans, A. A. (2018). Quality criteria for the analysis of microplastic in biota samples: a critical review. Environ. Sci. Technol. 52, 10230–10240. doi: 10.1021/acs.est.8b01611
Hermsen, E., Pompe, R., Besseling, E., and Koelmans, A. A. (2017). Detection of low numbers of microplastics in North Sea fish using strict quality assurance criteria. Mar. Pollut. Bull. 122, 253–258. doi: 10.1016/j.marpolbul.2017.06.051
Iannilli, V., Pasquali, V., Setini, A., and Corami, F. (2019). First evidence of microplastics ingestion in benthic amphipods from Svalbard. Environ. Res. 179:108811. doi: 10.1016/j.envres.2019.108811
ICES (2018). Report of the Working Group on Ecosystem Effects of Fishing Activities (WGECO). Available online at: www.ices.dk (accessed April 27, 2020).
ICES (2019a). Dab (Limanda limanda) in Subarea 4 and Division 3.a (North Sea, Skagerrak and Kattegat). ICES Advice on Fishing Opportunities, Catch, and Effort. Copenhagen: ICES, 1–10. (accessed November 5, 2020).
ICES (2019b). Flounder (Platichthys flesus) in Subarea 4 and Division 3.a (North Sea, Skagerrak and Kattegat). ICES Advice on Fishing Opportunities, Catch, and Effort. 1–10. Available online at: http://www.ices.dk/sites/pub/PublicationReports/Advice/2017/2017/fle.27.3a4.pdf (accessed November 5, 2020).
ICES (2019c). Herring (Clupea harengus) in Subarea 4 and Divisions 3.a and 7.d, Autumn Spawners (North Sea, Skagerrak and Kattegat, eastern English Channel). Report of the ICES Advisory Committee. 1–11. Available online at: https://doi.org/10.17895/ices.advice.4716 (accessed November 5, 2020).
ICES (2019d). Manual for the Offshore Beam Trawl Surveys, V. 3.4 Working Group on Beam Trawl Surveys (WGBEAM). Copenhagen: ICES. doi: 10.17895/ices.pub.5353
ICES (2019e). Plaice (Pleuronectes platessa) in subarea 4 (North Sea) and subdivision 20 (Skagerrak). Rep. ICES Advis. Comm. 4, 1–11. doi: 10.17895/ices.advice.5644
ICES (2019f). Sole (Solea solea) in Subarea IV (North Sea), ICES Advice on Fishing Opportunities, Catch, and Effort, Vol. 4. Copenhagen: ICES, 1–9.
ICES (2019g). Turbot (Scophthalmus maximus) in Subarea 4 (North Sea) ICES Advice on Fishing Opportunities. ICES Advice Fish. Oppor. Catch, Effort Gt. North Sea ecoregion 4. 1–7. Available online at: https://doi.org/10.17895/ices.advice.4876 (accessed November 5, 2020).
ICES (2019h). Whiting (Merlangius merlangus) in Subarea 4 and Division 7.d (North Sea and eastern English Channel). ICES Advice on Fishing Opportunities, Catch, and Effort. 1–15. Available online at: http://ices.dk/sites/pub/PublicationReports/Advice/2017/2017/whg.27.47d.pdf (accessed November 5, 2020).
ICES (2020a). Brill (Scophthalmus rhombus) in Subarea 4 and Divisions 3.a and 7.d–e (North Sea, Skagerrak and Kattegat, English Channel). Report of the ICES Advisory Committee. ICES Advice 2020. Copenhagen: ICES, 1–12. (accessed November 5, 2020).
ICES (2020b). Catches in FAO area 27 by Country, Species, Area and Year as Provided by the National Authorities. Source: Eurostat/ICES Data Compilation of Catch Statistics. Version: 22-06-2020. Available online at: https://www.ices.dk/data/Documents/CatchStats/OfficialNominalCatches.zip (accessed November 5, 2020).
ICES (2021a). Working Group on Beam Trawl Surveys (WGBEAM). ICES Sci. Reports 2. 86. Available online at: http://doi.org/10.17895/ices.pub.6028 (accessed June 1, 2021).
ICES (2021b). Working Group on Marine Litter (WGML, Outputs of 2020 Meeting). ICES Sci. Reports 3. 51. Available online at: http://doi.org/10.17895/ices.pub.8185 (accessed June 1, 2021).
IUCN (2021). IUCN Red List of Threatened Species. Version 2021-2. Available online at: https://www.iucnredlist.org/
Jabeen, K., Su, L., Li, J., Yang, D., Tong, C., Mu, J., et al. (2017). Microplastics and mesoplastics in fish from coastal and fresh waters of China. Environ. Pollut. 221, 141–149. doi: 10.1016/j.envpol.2016.11.055
Joint Research Centre of Commission of the European (2021). WP 2020-2021. Available online at: https://datacollection.jrc.ec.europa.eu/wp/2020-2021 (accessed October 1, 2021).
Kühn, S., van Franeker, J. A., O’Donoghue, A. M., Swiers, A., Starkenburg, M., van Werven, B., et al. (2020). Details of plastic ingestion and fibre contamination in North Sea fishes. Environ. Pollut. 257:113569. doi: 10.1016/j.envpol.2019.113569
Lippiatt, S., Opfer, S., and Arthur, C. (2013). Marine Debris Monitoring and Assessment. NOAA Tech. Memo. NOS-OR&R-46. Available online at: http://marinedebris.noaa.gov/sites/default/files/Lippiatt_et_al_2013.pdf (accessed June 1, 2021).
Löder, M. G. J., and Gerdts, G. (2015). “Methodology used for the detection and identification of microplastics—a critical appraisal,” in Marine Anthropogenic Litter, eds M. Bergmann, L. Gutow, and M. Klages (Cham: Springer International Publishing), 201–227. doi: 10.1007/978-3-319-16510-3_8
Lorance, P., Cook, R., Herrera, J., de Sola, L., Papaconstantinou, C., Florin, A., et al. (2015a). Chelidonichthys lucerna. The IUCN Red List of Threatened Species 2015. Gland: ICUN.
Lorance, P., Nedreaas, K., Fernandes, P., Kjellén, N., and Florin, A. (2015b). Clupea harengus. The IUCN Red List of Threatened Species 2015. Gland: ICUN.
Lu, Y., Zhang, Y., Deng, Y., Jiang, W., Zhao, Y., Geng, J., et al. (2016). Uptake and accumulation of polystyrene microplastics in zebrafish (Danio rerio) and toxic effects in liver. Environ. Sci. Technol. 50, 4054–4060. doi: 10.1021/acs.est.6b00183
Lusher, A. L., McHugh, M., and Thompson, R. C. (2013). Occurrence of microplastics in the gastrointestinal tract of pelagic and demersal fish from the English Channel. Mar. Pollut. Bull. 67, 94–99. doi: 10.1016/j.marpolbul.2012.11.028
Lusher, A. L., Hollman, P., and Mandoza-Hill, J. (2017a). Microplastics in Fisheries and Aquaculture: Status of Knowledge on their Occurrence and Implications for Aquatic Organisms and Food Safety. Rome: FAO.
Lusher, A. L., Welden, N. A., Sobral, P., and Cole, M. (2017b). Sampling, isolating and identifying microplastics ingested by fish and invertebrates. Anal. Methods 9, 1346–1360. doi: 10.1039/C6AY02415G
Maes, T., Jessop, R., Wellner, N., Haupt, K., and Mayes, A. G. (2017). A rapid-screening approach to detect and quantify microplastics based on fluorescent tagging with Nile Red. Sci. Rep. 7:44501. doi: 10.1038/srep44501
Martins, A., and Guilhermino, L. (2018). Transgenerational effects and recovery of microplastics exposure in model populations of the freshwater cladoceran Daphnia magna Straus. Sci. Total Environ. 631–632, 421–428. doi: 10.1016/j.scitotenv.2018.03.054
Matiddi, M., Pham, C. K., Anastasopoulou, A., Andresmaa, E., Avio, C. G., Bianchi, J., et al. (2021). Monitoring Micro-Litter Ingestion in Marine Fish: A Harmonized Protocol for MSFD and RSCS Areas, Version 1. Available online at: https://indicit-europa.eu/cms/wp-content/uploads/2021/06/Monitoring-microlitter-ingestion-in-marine-fish-1.pdf (accessed September 23, 2021).
Meyers, N., Catarino, A. I., Declerq, A. M., Brenan, A., Devriese, L., Vandegehuchte, M., et al. (2021). Microplastic detection and identification by Nile red staining: towards a semi-automated, cost- and time-effective technique. Sci. Total Environ. Submitted for publication.
Monroe, T., Costa, M., Nielsen, J., Herrera, J., and de Sola, L. (2014). Limanda limanda,” in The IUCN Red List of Threatened Species 2014. Gland: ICUN, doi: 10.2305/IUCN.UK.2014-3.RLTS.T18214863A45790133.en
Monroe, T., Keskin, Ç, Costa, M., and Rijnsdorp, A. D. (2015). Solea solea (errata version published in 2016). The IUCN Red List of Threatened Species 2015. Gland: ICUN.
Montgomery, D. C., and Runger, G. C. (1994). Applied Statistics and Probability for Engineers. Hoboken, NJ: John Wiley and Sons, doi: 10.1080/03043799408928333
Morrison, E., Shipman, A., Shrestha, S., Squier, E., and Stack Whitney, K. (2019). Evaluating the ocean cleanup, a marine debris removal project in the North Pacific Gyre, using SWOT analysis. Case Stud. Environ. 3, 1–6. doi: 10.1525/cse.2018.001875
MSFD Technical Subgroup on Marine Litter (2013). Guidance on Monitoring of Marine Litter in European Seas. Luxembourg: Publications Office of the European Union, doi: 10.2788/99475
Nedreaas, K., Florin, A., Cook, R., Fernandes, P., and Lorance, P. (2014). Merlangius merlangus. The IUCN Red List of Threatened Species 2014. Gland: ICUN, doi: 10.2305/IUCN.UK.2014-3.RLTS.T198585A45097610.en
Neves, D., Sobral, P., Ferreira, J. L., and Pereira, T. (2015). Ingestion of microplastics by commercial fish off the Portuguese coast. Mar. Pollut. Bull. 101, 119–126. doi: 10.1016/j.marpolbul.2015.11.008
Ohkubo, N., Ito, M., Hano, T., Kono, K., and Mochida, K. (2020). Estimation of the uptake and gut retention of microplastics in juvenile marine fish: mummichogs (Fundulus heteroclitus) and red seabreams (Pagrus major). Mar. Pollut. Bull. 160:111630. doi: 10.1016/j.marpolbul.2020.111630
Ory, N. C., Sobral, P., Ferreira, J. L., and Thiel, M. (2017). Amberstripe scad Decapterus muroadsi (Carangidae) fish ingest blue microplastics resembling their copepod prey along the coast of Rapa Nui (Easter Island) in the South Pacific subtropical gyre. Sci. Total Environ. 586, 430–437. doi: 10.1016/j.scitotenv.2017.01.175
Pellini, G., Gomiero, A., Fortibuoni, T., Ferrà, C., Grati, F., Tassetti, A. N., et al. (2018). Characterization of microplastic litter in the gastrointestinal tract of Solea solea from the Adriatic Sea. Environ. Pollut. 234, 943–952. doi: 10.1016/j.envpol.2017.12.038
R Core Team (2020). R: A Language and Environment for Statistical Computing. Vienna: R Foundation for Statistical Computing.
Roch, S., Ros, A. F. H., Friedrich, C., and Brinker, A. (2021). Microplastic evacuation in fish is particle size-dependent. Freshw. Biol. 66, 926–935. doi: 10.1111/fwb.13687
Romeo, T., Pietro, B., Pedà, C., Consoli, P., Andaloro, F., and Fossi, M. C. (2015). First evidence of presence of plastic debris in stomach of large pelagic fish in the Mediterranean Sea. Mar. Pollut. Bull. 95, 358–361. doi: 10.1016/j.marpolbul.2015.04.048
Rummel, C. D., Löder, M. G. J., Fricke, N. F., Lang, T., Griebeler, E.-M., Janke, M., et al. (2016). Plastic ingestion by pelagic and demersal fish from the North Sea and Baltic Sea. Mar. Pollut. Bull. 102, 134–141. doi: 10.1016/j.marpolbul.2015.11.043
Sassi Pereira, G. (2021). Power, R Package Version 0.1.0. Available online at: http://github.com/gilberto-sassi/power (accessed January 11, 2021).
Schindelin, J., Arganda-Carreras, I., Frise, E., Kaynig, V., Longair, M., Pietzsch, T., et al. (2012). Fiji: an open-source platform for biological-image analysis. Nat. Methods 9, 676–682. doi: 10.1038/nmeth.2019
Shim, W. J., Song, Y. K., Hong, S. H., and Jang, M. (2016). Identification and quantification of microplastics using Nile Red staining. Mar. Pollut. Bull. 113, 469–476. doi: 10.1016/j.marpolbul.2016.10.049
Smith-Vaniz, W. F., Sidibe, A., Nunoo, F., Lindeman, K., Williams, A. B., Quartey, R., et al. (2015). Trachurus trachurus. The IUCN Red List of Threatened Species 2015. Gland: ICUN, doi: 10.2305/IUCN.UK.2015-4.RLTS.T198647A43157137.en
The European Parliament, and The Council of The European Union (2017). Regulation (EU) 2017/1004 of the European Parliament and of the Council of 17 May 2017. European Union. Available Online at: https://eur-lex.europa.eu/legal-content/EN/TXT/?uri=CELEX%3A32017R1004 (accesed June 26, 2017).
Wang, J., Coffin, S., Sun, C., Schlenk, D., and Gan, J. (2019). Negligible effects of microplastics on animal fitness and HOC bioaccumulation in earthworm Eisenia fetida in soil. Environ. Pollut. 249, 776–784. doi: 10.1016/j.envpol.2019.03.102
Wickham, H. (2016). ggplot2: Elegant Graphics for Data Analysis. New York, NY: Springer-Verlag. doi: 10.1007/978-3-319-24277-4_9
Keywords: species selection, sampling effort, SWOT analysis, North Sea, Nile red
Citation: De Witte B, Catarino AI, Vandecasteele L, Dekimpe M, Meyers N, Deloof D, Pint S, Hostens K, Everaert G and Torreele E (2022) Feasibility Study on Biomonitoring of Microplastics in Fish Gastrointestinal Tracts. Front. Mar. Sci. 8:794636. doi: 10.3389/fmars.2021.794636
Received: 13 October 2021; Accepted: 03 December 2021;
Published: 06 January 2022.
Edited by:
Víctor M. León, Spanish Institute of Oceanography, SpainReviewed by:
Alessio Gomiero, Norwegian Research Institute (NORCE), NorwayCopyright © 2022 De Witte, Catarino, Vandecasteele, Dekimpe, Meyers, Deloof, Pint, Hostens, Everaert and Torreele. This is an open-access article distributed under the terms of the Creative Commons Attribution License (CC BY). The use, distribution or reproduction in other forums is permitted, provided the original author(s) and the copyright owner(s) are credited and that the original publication in this journal is cited, in accordance with accepted academic practice. No use, distribution or reproduction is permitted which does not comply with these terms.
*Correspondence: Bavo De Witte, YmF2by5kZXdpdHRlQGlsdm8udmxhYW5kZXJlbi5iZQ==
†These authors share first authorship
‡These authors share last authorship
Disclaimer: All claims expressed in this article are solely those of the authors and do not necessarily represent those of their affiliated organizations, or those of the publisher, the editors and the reviewers. Any product that may be evaluated in this article or claim that may be made by its manufacturer is not guaranteed or endorsed by the publisher.
Research integrity at Frontiers
Learn more about the work of our research integrity team to safeguard the quality of each article we publish.