 Yanru He
 Yihe Wang
 Hui Wu
- 1State Key Laboratory of Estuarine and Coastal Research, East China Normal University, Shanghai, China
- 2Southern Marine Science and Engineering Guangdong Laboratory, Zhuhai, China
- 3School of Marine Sciences, East China Normal University, Shanghai, China
Massive large-scale engineering projects have been built in river estuaries around the world, but their effects on environments in the surrounding coastal waters were less emphasized compared to those due to the watershed projects. In this study, we used the Changjiang River Estuary as an example to show that a significant consequence can be resulted in such a situation. Through analyzing the harmful algal bloom events data and the chlorophyll satellite data, we investigate the spatiotemporal variations of algal blooms in the estuary and its adjacent water. The results indicate that the location of algal bloom hotspot changed over the period of the estuarine constructions. Furthermore, using a well-validated numerical model, we explored the mechanisms responsible for such an ecosystem regime shift. It was found that after the estuarine constructions were built, the surface chlorophyll maximum was attenuated and part of it migrated landward north of the river mouth but was strengthened south of the river mouth and extended seaward. Alternations of the nutrient concentration distribution and turbidity distribution induced by river plume deviation are responsible for the redistribution of the high chlorophyll concentration area. By contrast, the direct impact of the Three Gorges Dam through changing the runoff and sediments flux, which has been highlighted in numerous studies, was less important than expected. Given the fact that Three Gorges Dam and mega estuarine constructions were built in a similar period, any observed regime shift of hydrodynamic and ecological status outside the estuary should be interpreted with particular caution.
Introduction
The estuarine and coastal zone, which is a key area for human being inhabiting, is economically developed and densely populated. Various natural dynamic processes, including runoff, tide, wind, and shelf circulation, altogether transport nutrients and regulate the turbidity in the estuary, which is essential for algal growth, thereby controlling the aquatic ecosystem (Caffrey et al., 1998; Anderson et al., 2002; Gao and Song, 2005; Tang et al., 2006; Statham, 2012; Fan and Song, 2014; Liu et al., 2015; Wang et al., 2019a). In addition, poorly managed human activities have been recognized as another key driver to cause severe environmental issues, such as eutrophication, harmful algal blooms, hypoxia, and habitat fragmentation, among many others (May et al., 2003; Chen et al., 2017; Zhang et al., 2018; Boesch, 2019).
The human activities that affect the estuarine environment can be classified into two categories in terms of the locations they take place. The first is conducted in the river basin, such as dam constructions, river diversion, and industrial or agricultural wastewater drainage, which directly scales up or down the amount of terrestrial freshwater and other materials entering the estuary (Humborg et al., 1997; Jiao et al., 2007). The other one occurs in the estuary, such as sea-crossing bridges, tidal flat reclamation, and deep-water channel constructions, which directly regulate the spatial characteristics of the hydrodynamic environment in the estuary and adjacent waters (Luan et al., 2016; Wu et al., 2018). Numerous attention have been paid to how the river basin engineering projects affect the physical processes and ecosystem in the receiving coastal waters (e.g., Humborg et al., 1997; Pelletier et al., 2016; Bargu et al., 2019). By contrast, the impacts of estuarine engineering constructions were often considered to be at a local scale, with very few studies discussing its far-reaching consequence in the coastal water. Several exceptions are as follows: the port expansion in the Ems River Estuary, which aggravated the estuarine eutrophication (Van Maren et al., 2015); the land reclamation in the Johor Estuary, which caused the adjacent aquatic environmental degradation (Wang et al., 2019c); and the wetlands reclamation and dike construction in the San Francisco Bay estuary which reduced the habitats for fish and waterfowl (Nichols et al., 1986).
The estuary is the starting point of the buoyant river plume, which is often nutrient-rich and turbid. A series of classic works indicated that the extension pathway and horizontal/vertical structure of the river plume are sensitive to the hydrodynamics and the geometric characteristics in the estuary. For example, the width and depth of river mouth essentially determine whether a river plume is surface-advected (i.e., floating on the surface with a strong stratification) or bottom-trapped (i.e., propagating along the coast with a strong horizontal front) (Yankovsky and Chapman, 1997), and the initial adjustment of river plume inside the river mouth can enhance the plume extension to the down-shelf direction (i.e., in the sense of Kelvin wave direction, with land on the right side in the Northern Hemisphere) (Garvine, 2001).
Estuarine engineering is a vital factor that regulates the geometry of estuaries, and thus induces hydrodynamic adjustments. One extreme example occurs in the Changjiang River Estuary. The mega-sized shipping channel constructions and the massive land reclamation on the tidal flats (Figure 1) substantially change the hydrodynamic structures in the estuary, thus regulating the Changjiang River plume extension in the adjacent sea with a much larger area than the estuary itself (Wu et al., 2018). Previous studies also showed that these engineering constructions have a remarkable impact on saltwater intrusion (Wu et al., 2010; Zhu L. et al., 2016) and sediment transport (Ma et al., 2013). The regulated plume extension (and thus, the nutrient it carries) and water turbidity could change the growth condition for the phytoplankton. However, these potential consequences have not received sufficient attention in the past.
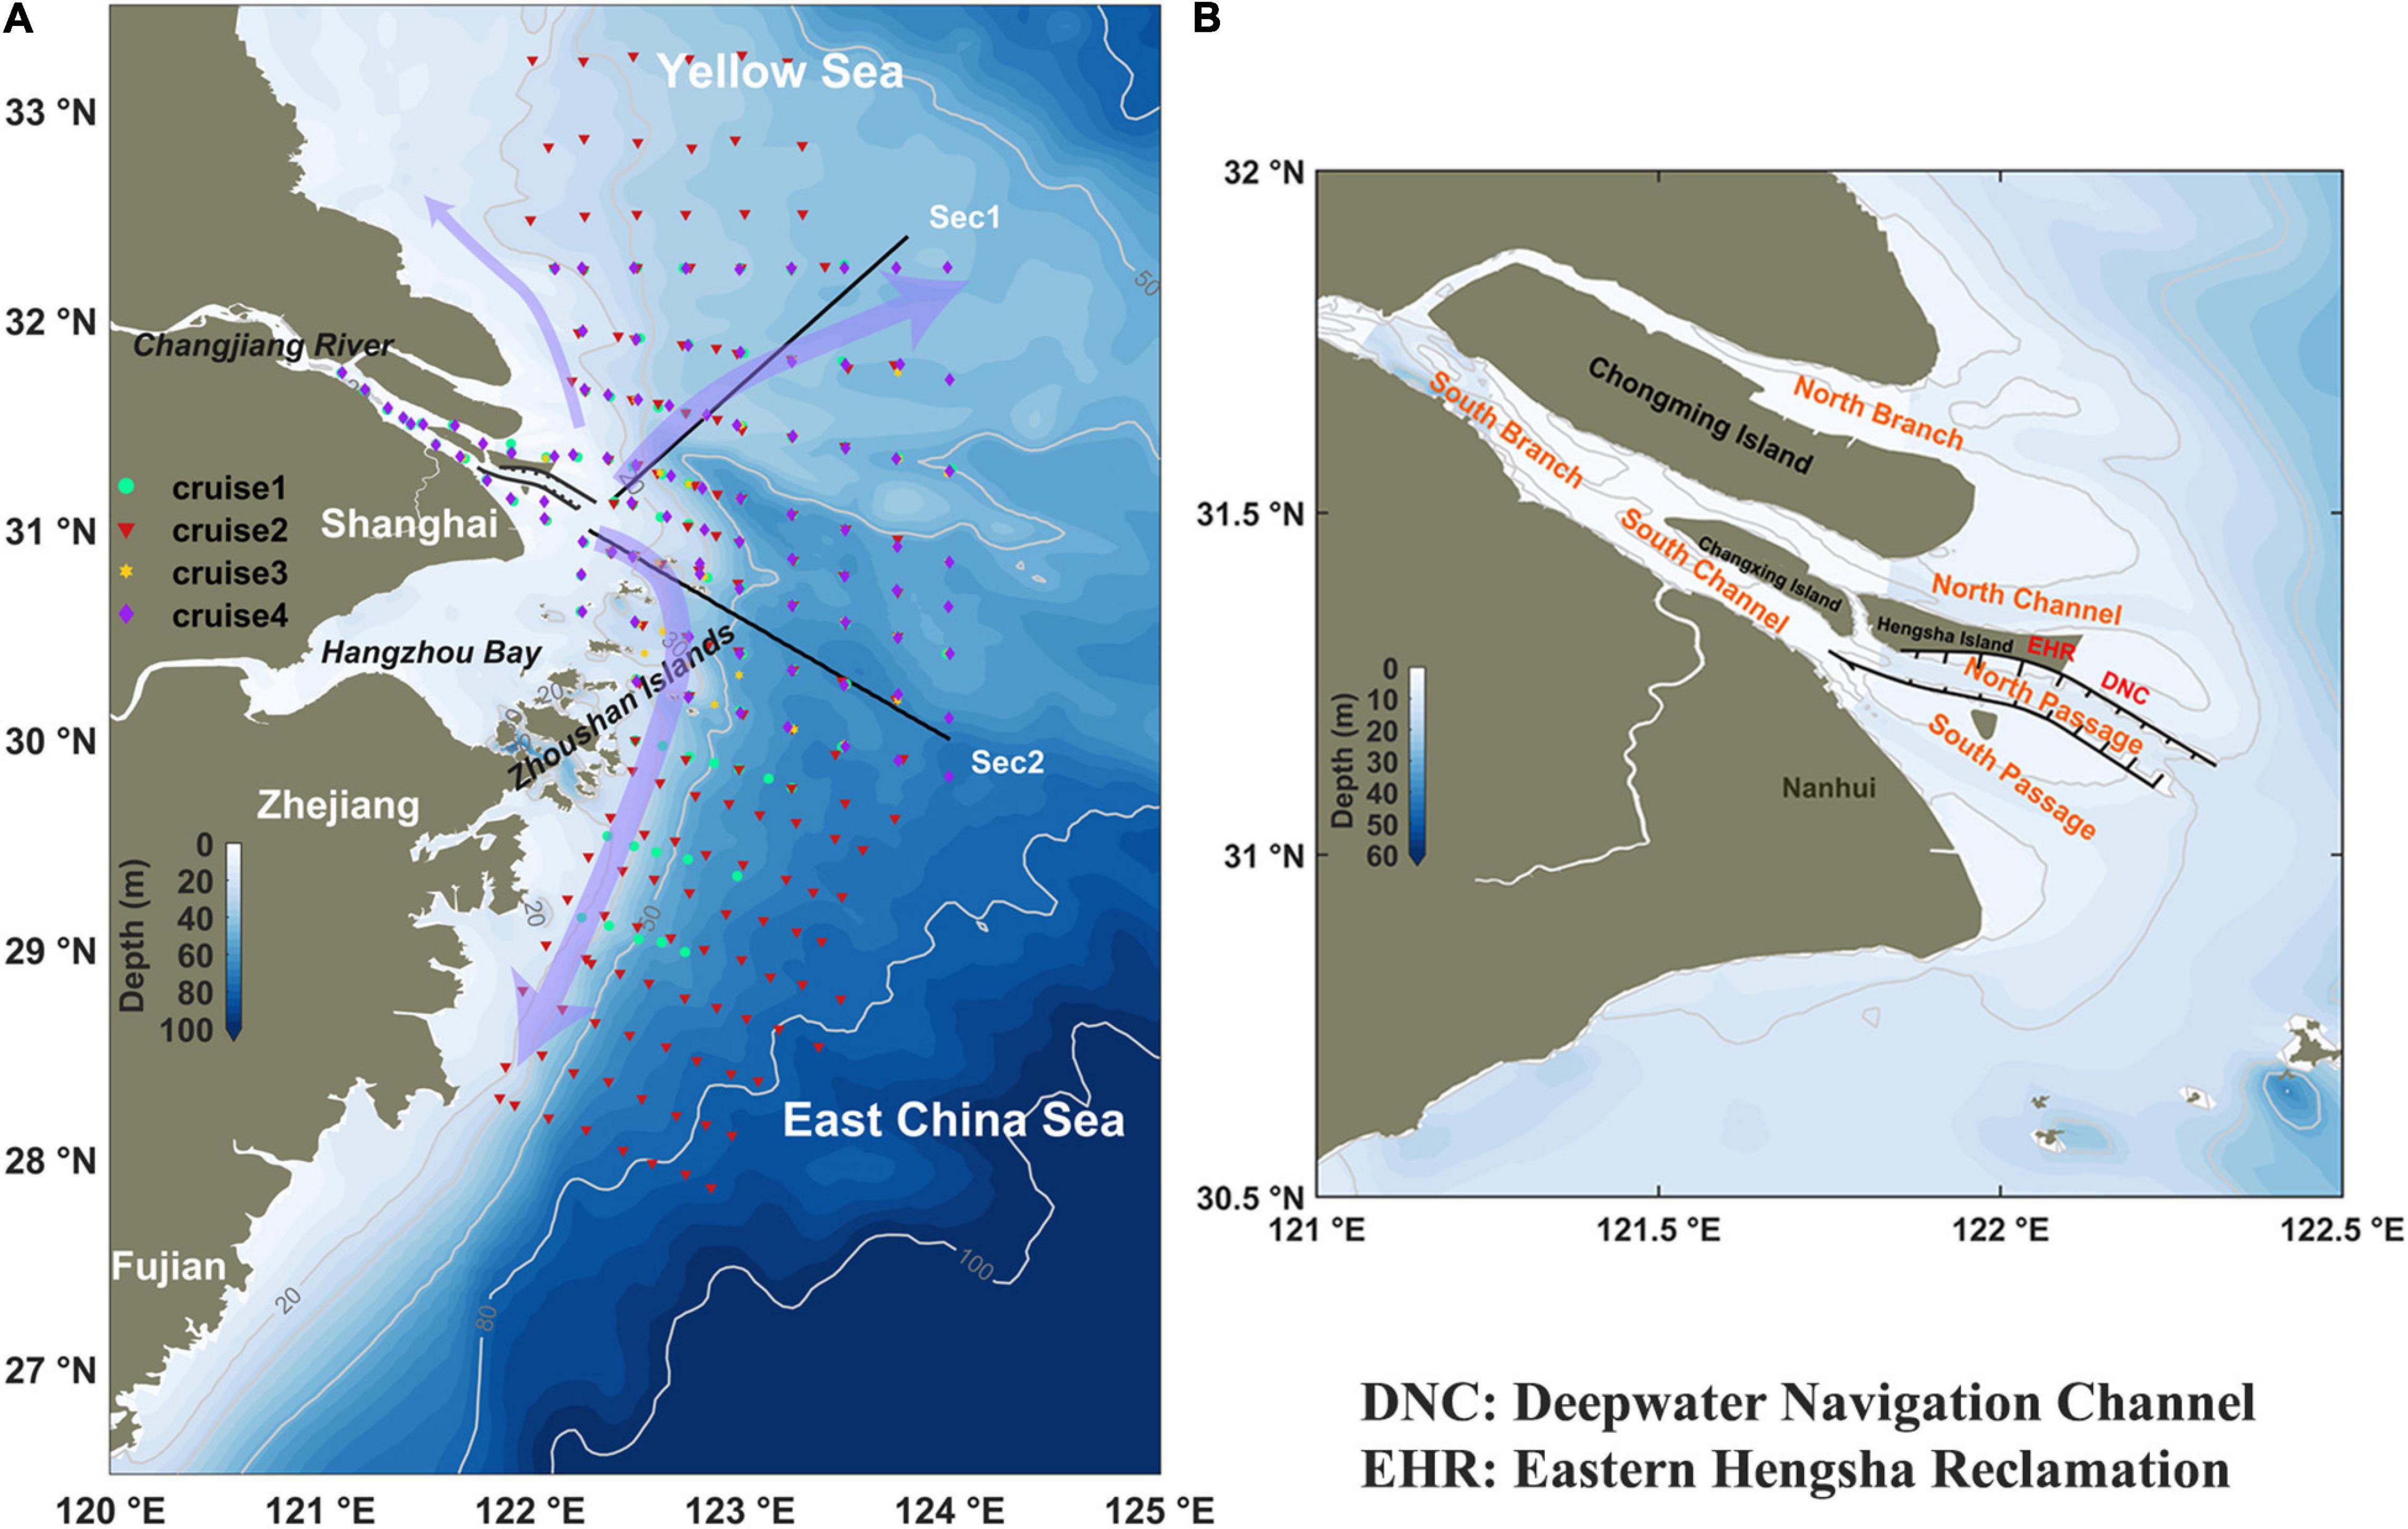
Figure 1. (A) Map of the Changjiang River Estuary and its adjacent water. The arrows are the pathways of the Changjiang River plume. Dots denote the survey sites for the four cruises in 2016. The light gray lines represent the isobaths. Two solid black lines are the representative model output statistical sections discussed in the manuscript. (B) Zoom-in view map of the Changjiang River Estuary. The locations of the Deep Navigation Channel (DNC), the Eastern Hengsha Reclamation project (EHR), and four major outlets of Changjiang River Estuary are marked.
To clarify whether and how the estuarine constructions change the characteristics of algal blooms in the vicinity of the large river estuary and to further demonstrate its contribution compared with the upstream constructions, here in this study, we investigated this question using the Changjiang River Estuary as an example. A multi-method investigation was carried out with numerical modeling, field data, and satellite remote sensing data. Details of the study area, data, model configuration, and validation were described in section “Materials and Methods.” In section “Results,” the interannual variation of harmful algal bloom events, the spatiotemporal distribution of algal bloom probability, which is derived from remote sensing chlorophyll, and the model results before and after the estuarine constructions were shown. The influences of human activities on the phytoplankton distribution were analyzed in detail in section “Discussion,” including a comparison with the influence of the upstream project. Finally, conclusions were drawn in section “Summary”.
Materials and Methods
Study Area
This study focused on the vicinity of the Changjiang River Estuary, that is, the inner shelf of the East China Sea (Figure 1). The Changjiang River is the largest river in China and ranks the fifth in the world in terms of freshwater discharge with a huge amount of freshwater (900km3/year; Yang et al., 2015), sediments (1.52×10⁸tons/year; The Changjiang Water Resources Commission [CWRC] of The Ministry of Water Resources, 2016), and nutrients (nitrate of 1.15×10¹¹mol/year, phosphate of 1.05×10⁹mol/year; Gao et al., 2012). Due to the discharge of huge amounts of terrestrial materials by the Changjiang River, its estuary features a maximum turbidity zone around the river mouth and suffers from frequent harmful algal bloom and hypoxia events (Li and Zhang, 1998; Li et al., 2002; Chai et al., 2006; Wu et al., 2012; Zhu J. et al., 2016). It is reported that aquatic disasters have become systematically serious since 2000, as evidenced by nutrient characteristics and ratios (Chai et al., 2009), acceleration of eutrophication (Wang et al., 2021), and frequently occurred jellyfish blooms (Xian et al., 2005). One perspective is the increased frequency of harmful algal bloom. The main causative species is dinoflagellate during April to June and, in particular, the Prorocentrum donghaiense Lu and Karenia mikimotoi in recent decades (Tang et al., 2006; Zhou et al., 2017).
The Changjiang River is significantly regulated by upstream river dams and mega-sized estuarine engineering constructions. Among them, the Three Gorges Dam (TGD), the Deepwater Navigation Channel (DNC), and the Eastern Hengsha Reclamation (EHR) are representative. The upstream river dam, TGD, was closed in 2003. During a similar period, estuarine engineering was constructed. The DNC project was built in three phases. In the first phase (1998–2002), two 30-km-long dikes and 10 strips of groins were built on both flanks of the North Passage. In the second phase (2002–2005), the two guide dikes were lengthened to ∼50 km and nine additional strips of groins were constructed. The most important part of DNC project had been finished in phases one and two. In the third phase (2006–2010), the dikes were further elevated to 1.9 m above mean sea level. The EHR project also began to implement in this period, and now the large shallow tidal flat has become emerged land (Figure 1). In this study, we call all these engineering constructions as mega estuarine constructions (MEC).
Harmful Algal Bloom Event Data
Harmful algal bloom event data were collected in the spring season (April to June) from 2000 to 2010 in the vicinity of the Changjiang River Estuary to reveal interannual variations of phytoplankton distribution. The data sources were from Liang (2012) and Bulletin of China Marine Disasters (The Ministry of Natural Resources of the People’s Republic of China, 2010). Key information on each harmful algal bloom event such as location, size, and occurrence period were recorded and displayed in Figure 4.
Satellite Remote Sensing Data
Chlorophyll is often used as a first-order proxy for phytoplankton biomass, and its concentration can be an effective description of biomass intensity for routine monitoring purposes (Morel, 1988). In this study, we collected surface chlorophyll concentration from Sea-viewing Wide Field-of-view Sensor (SeaWiFS) daily products during 1998–2010, and the Moderate Resolution Imaging Spectroradiometer (MODIS-Aqua) Level-3 standard mapped daily products from 2011 to 2016. The dataset from SeaWiFS has a spatial resolution of 9 km and that from MODIS-Aqua of 4 km. The accurate retrieval of remote sensing chlorophyll data in high turbid water is still under challenge (Shen et al., 2010, 2019; Le et al., 2013; Cui et al., 2020; Polikarpov et al., 2021). To reduce the disturbance signal of turbidity nearshore, a method of algal bloom occurrence probability was used. He et al. (2013) suggested that a credible threshold (e.g., 10 mg/m3) is suitable for identifying algal blooms that can avoid false algal bloom signals caused by water turbidity.
The SeaWiFS product covered the period from August 1997 to December 2010. Due to the time-span limitation of the dataset, we shifted the remote sensing data source from SeaWiFS to MODIS-Aqua after 2010. The chlorophyll data was chosen during the period from May to June since 1998 when the algal bloom was dominated by dinoflagellate. Furthermore, to reduce the impact of cloud cover and invalid data, the monthly averaged chlorophyll concentration was calculated from the daily data. A threshold was set for each image to quantify the chlorophyll data availability retrieved by satellite. If the proportion of available data in the study area (121–125°E, 28–32.5°N) was greater than 50%, then it was used to calculate the long-term mean. This method was consistent with that used in Chen et al. (2017). To ensure data consistency, we compared the SeaWiFS and MODIS data in the overlapped period of 2006–2010, and the results were qualitatively similar (not shown).
The remote sensing chlorophyll has a considerable error in its absolute value although numerous efforts have been made (Hu, 2009; Son and Kim, 2018). Hence, its long-term mean might be biased. As the focus of this study is the effect of the MEC on algal blooms, and also since the previous study (Wu et al., 2018) showed that its hydrodynamic consequence is to regulate the river plume transport pathway, we calculated the occurrence probability of high concentration of chlorophyll based on the remote sensing data. The probability of algal bloom occurrence was calculated as follows:
where Ai represents each pixel of the study area, P(A) is the probability of algal bloom occurrence, N is the number of valid chlorophyll data image at that pixel, and p(Ai) is defined as follows:
The threshold of chlorophyll was set to 10 mg/m3 in this study. Such a threshold can reduce the interference of turbid water bodies (e.g., He et al., 2013).
In addition, the instantaneous Geo-stationary Ocean Color Imager (GOCI) data on May 12 and July 26 of 2016 were collected to validate the numerical model. The GOCI-L1B images were processed using the GOCI data processing system, and chlorophyll concentration was inverted using the Yellow Sea Large Marine Ecosystem Ocean Color Project (YOC) algorithm (Tassan, 1994; Siswanto et al., 2011).
Numerical Model
A hydrodynamics-sediments-ecosystem-coupled numerical model was used in this study. The hydrodynamic module was developed and explained in detail in previous studies (Wu et al., 2011, 2018). The model domain covered the entire East China Sea, Yellow Sea, Bohai Sea, and part of the northwestern Pacific Ocean. To better characterize the hydrological environment of the Changjiang River Estuary under the large-scale estuarine projects, we locally refined the model grid in the estuary with a resolution <500 m in the DNC area and 1–2 km in the near-field river plume area. The model was driven by realistic physical forcings to explore phytoplankton distribution characteristics in the Changjiang River Estuary before and after the MEC, including the hourly monitoring Changjiang River discharge at Datong Hydrological Station (∼630 km upstream of the river mouth), six hourly wind data, and other atmospheric parameters from the European Centre for Medium-Range Weather Forecasts (ERA-interim reanalysis products).
The ecosystem module used a vertical one-dimensional N2P2ZD model which was derived from the Flexible Biological Module in Finite-Volume Coastal Ocean Model (Chen et al., 2006) by Lin (2011). The state variables had two kinds of nutrients [dissolved inorganic nitrogen (DIN) and phosphate], two phytoplankton species (dinoflagellate and diatom), one zooplankton species, and one kind of detritus (Wang et al., 2019a). The settings of the upstream nutrient flux boundary used the data reported by Gao et al. (2012). Moreover, the initial and open boundary conditions for nutrients were derived from the climatological monthly World Ocean Atlas. For a complete set of biological equations, the readers are referred to Wang et al. (2019a).
The model includes a sediments transport module, with details described in Luo et al. (2017). The simulated suspended sediments concentration was used to calculate the light limitation for phytoplankton growth. Previous studies proved that the model has the capability of sediment simulation (Luo et al., 2017; Wang et al., 2019a). The settings of the upstream suspended sediment flux boundary used the data reported by Yang et al. (2015). The initial and open boundary conditions for suspended sediment were set to zero. The hydrodynamic model coupled with the sediment module was initiated in January 2014. After 1-year spin-up of the hydrodynamic model, the ecosystem model started to run. The model ended in December 2016. Hourly model output was used to analyze phytoplankton dynamics in 2016.
To assess the impact of MEC on ecological dynamic processes of the Changjiang River Estuary and its adjacent water, four experiments (Exps.) were configured (Table 1). In the control experiment (Exp. 1), the estuarine constructions were treated as land grid, and the river discharge used the realistic data in 2014–2016. In Exp. 2, the estuarine constructions (including the DNC and the EHR) were removed, i.e., the associated model grids were considered as water regions with natural water depth before the constructions. It should be noted that these engineering projects were built continuously since 1998, and we were unable to know their actual status in each year during this period. Hence, this experiment should be considered as a “natural” status, although for the purpose of comparison, we keep other conditions unchanged. Exps. 3 and 4 were designed to compare the relative influences of estuarine and upstream constructions. In Exp. 3, we changed the upstream freshwater discharge influenced by the TGD from Exp. 1. To do this, we added the runoff influence of the TGD to the realistic runoff in 2014–2016 according to the method of Wu et al. (2018). Details will be shown in section “Effect of the Three Gorges Dam-Induced Freshwater and Sediment Flux Variations.” In Exp. 4, we further changed the upstream sediment flux influenced by TGD according to Yang et al. (2015) to estimate the effects of upper sediment flux changes on the turbidity, hence, the phytoplankton growth in the estuary and its adjacent water. Detailed settings of these experiments were shown in Table 1.
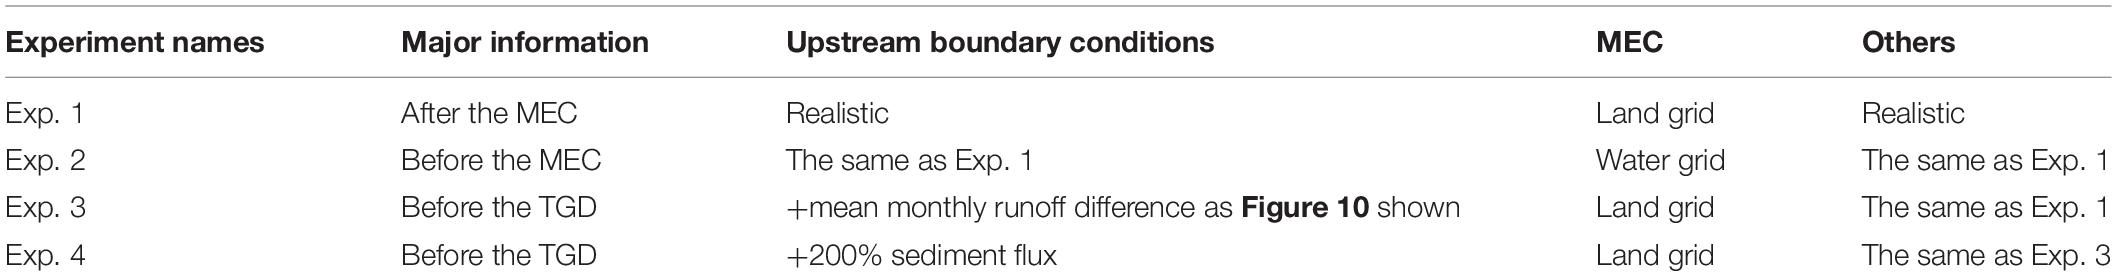
Table 1. Numerical experiments settings.
Model Validation
The numerical model used in this study has been extensively validated for hydrodynamics (e.g., Wu et al., 2011; Wu and Wu, 2018), sediments (Luo et al., 2017), and ecological variables (Wang et al., 2019a). Here in this study, we showed more validations on ecological variables. The model results were first compared with the remote sensing data derived from GOCI on May 12 and July 26 of 2016 (Figure 2). High chlorophyll concentration areas can be found with a couple of hotspots situating northeast to the river mouth and around the Zhoushan Islands (Figures 2A,C), which exhibited representative chlorophyll distribution characteristics as previous studies described (e.g., Chen et al., 2003; Tang et al., 2006; Zhou et al., 2008; Wang and Wu, 2009; Wang et al., 2019b). Model results well captured this pattern (Figures 2B,D).
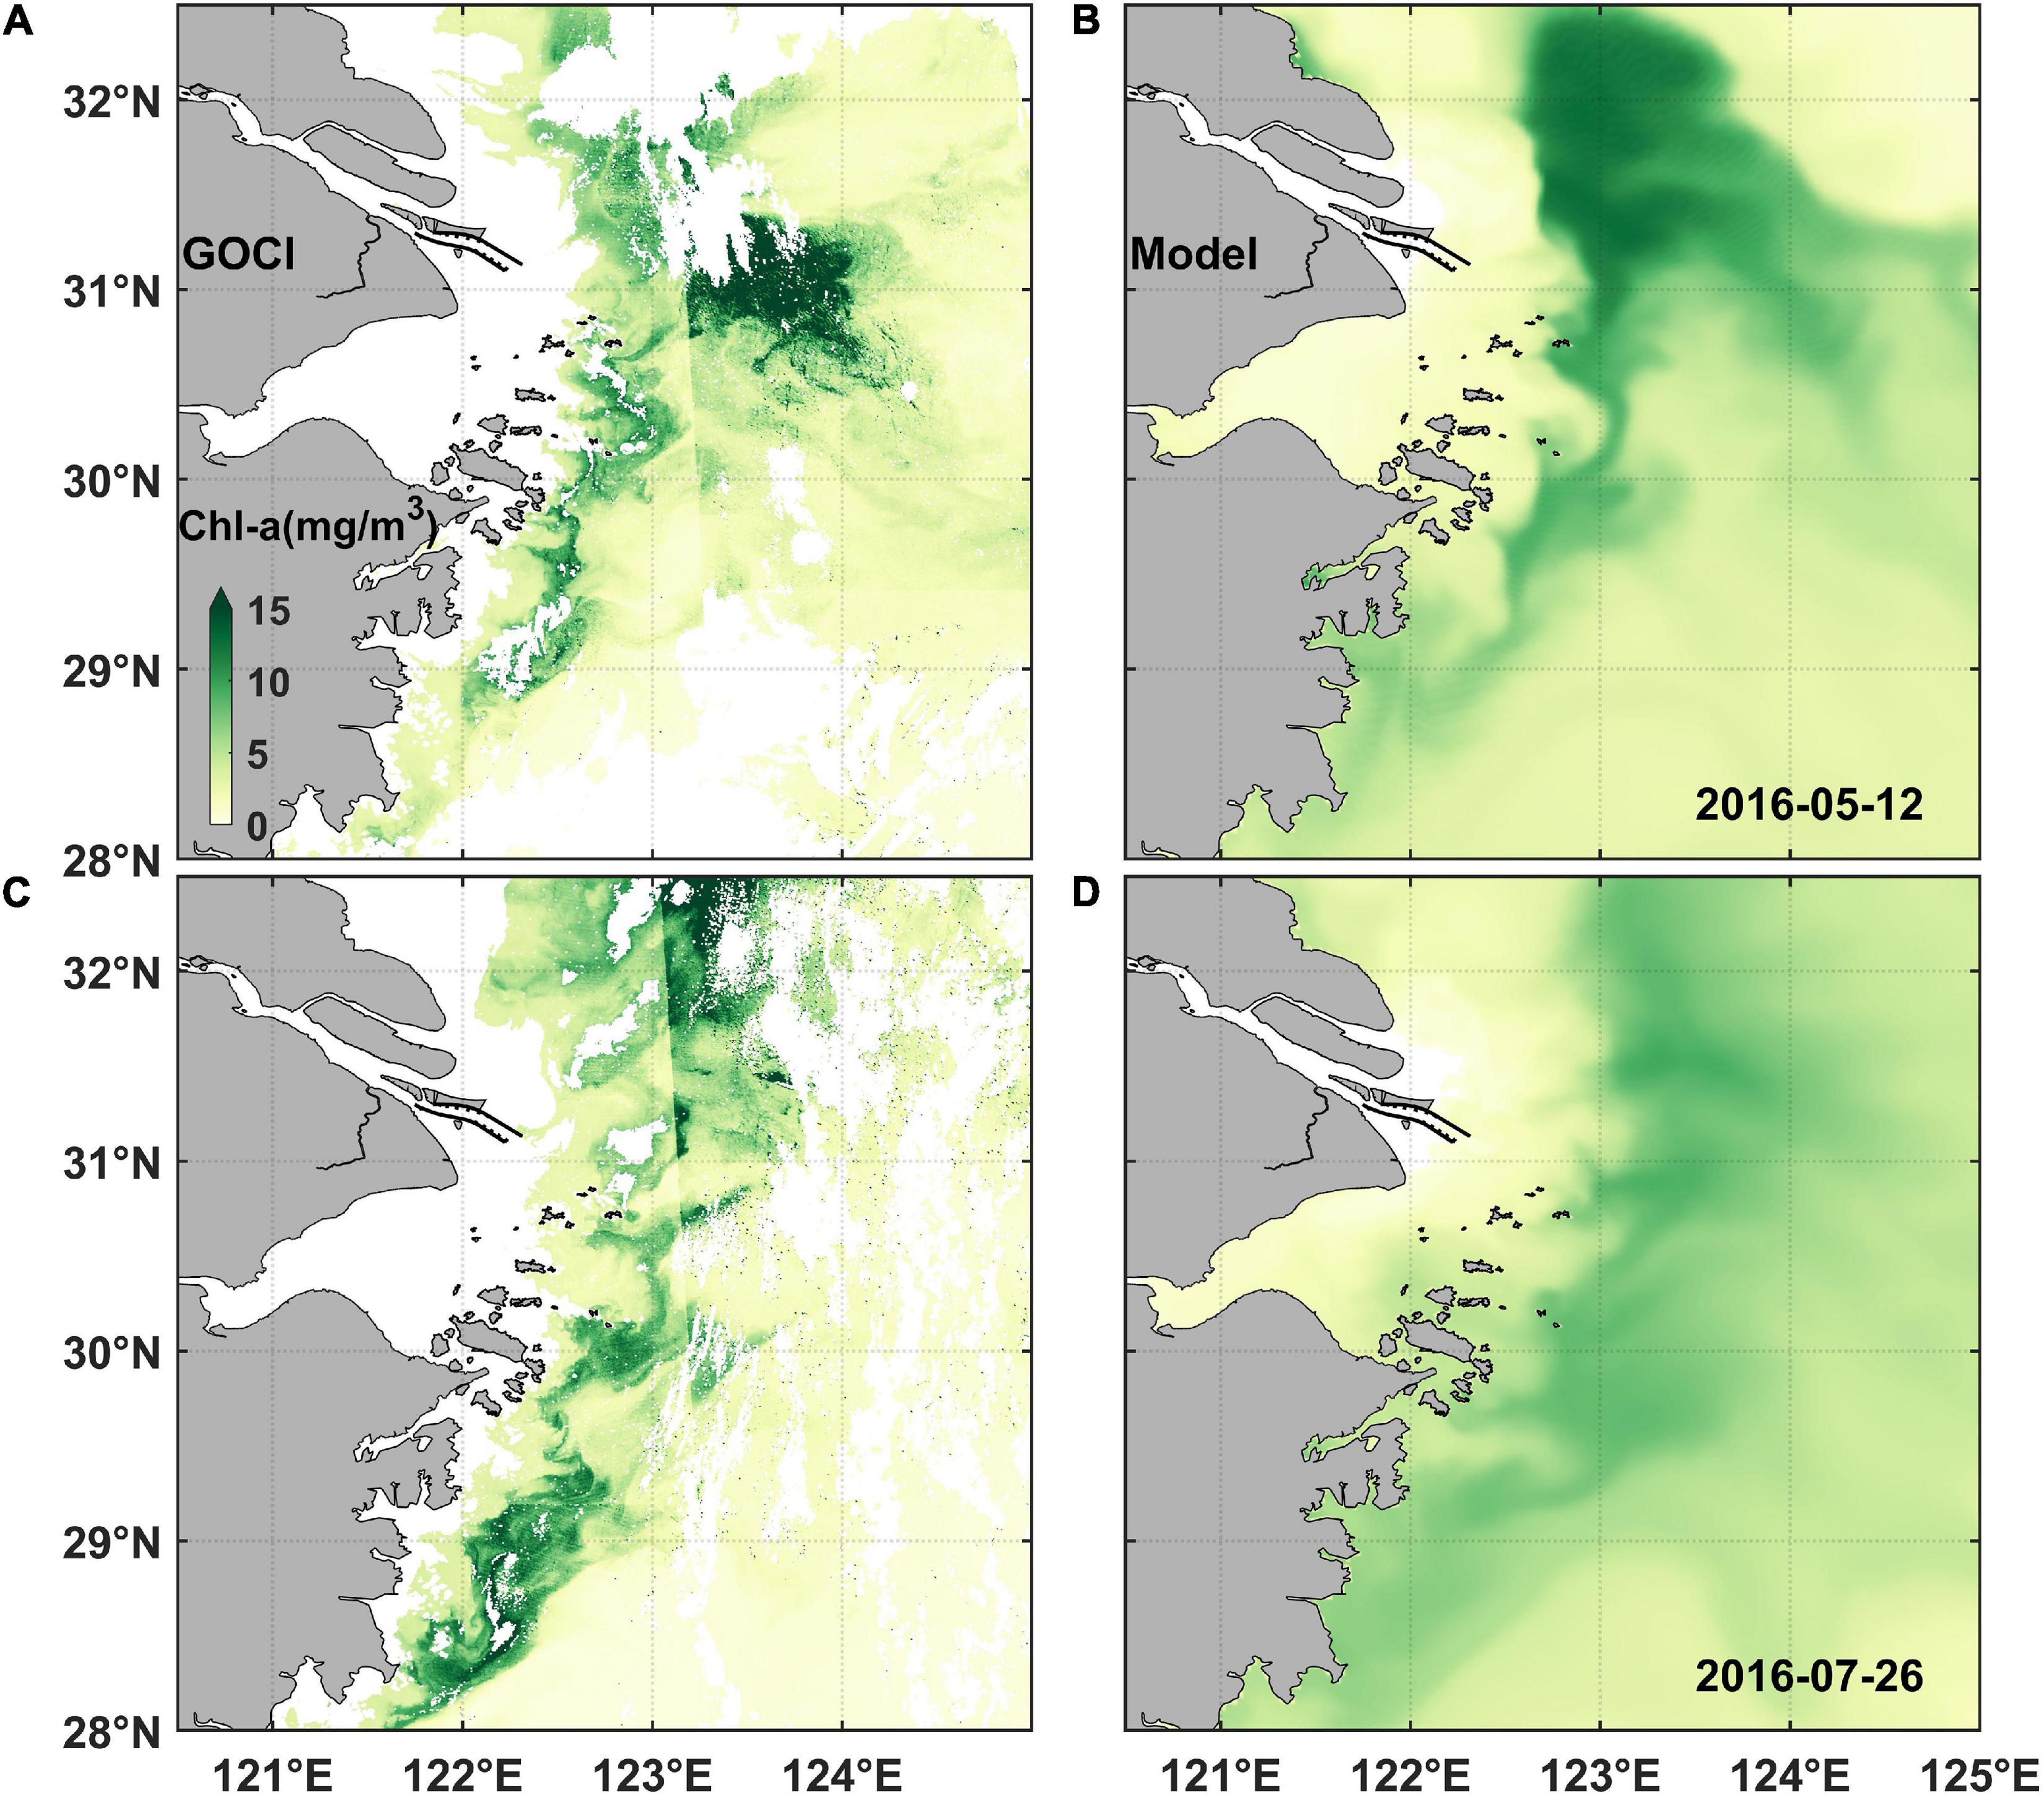
Figure 2. Comparative snapshots of satellite-derived and modeled chlorophyll concentration images. (A) Geo-stationary Ocean Color Imager (GOCI) snapshot on May 12, 2016; (B) modeled chlorophyll concentration on May 12, 2016; (C) GOCI snapshot on July 26, 2016; and (D) modeled chlorophyll concentration on July 26, 2016. The white areas in the satellite-derived images indicate invalid data due to cloud shading.
The data collected onboard of the R/V Runjiang in March and July (twice) in 2016 and of the R/V Zhehaike I in May in 2016 (details in Table 2) were used for further validation. The former three cruises were supported by the National Natural Science Foundation of China, and the latter was conducted by the State Key Laboratory of Estuarine and Coastal Research, East China Normal University. To better quantify the simulated results, the following scatter diagram showed the observed and simulated data in March, May, and July of 2016 with some calculated metrics (Figure 3), including the correlation coefficient (CC), skill score (SS), and root mean square error (RMES). The SS (Murphy, 1988) was defined as:
where Xm is the modeled result, Xo is the observed data, is the mean of observed data, and N is the number of samples.

Table 2. Research cruise survey information.
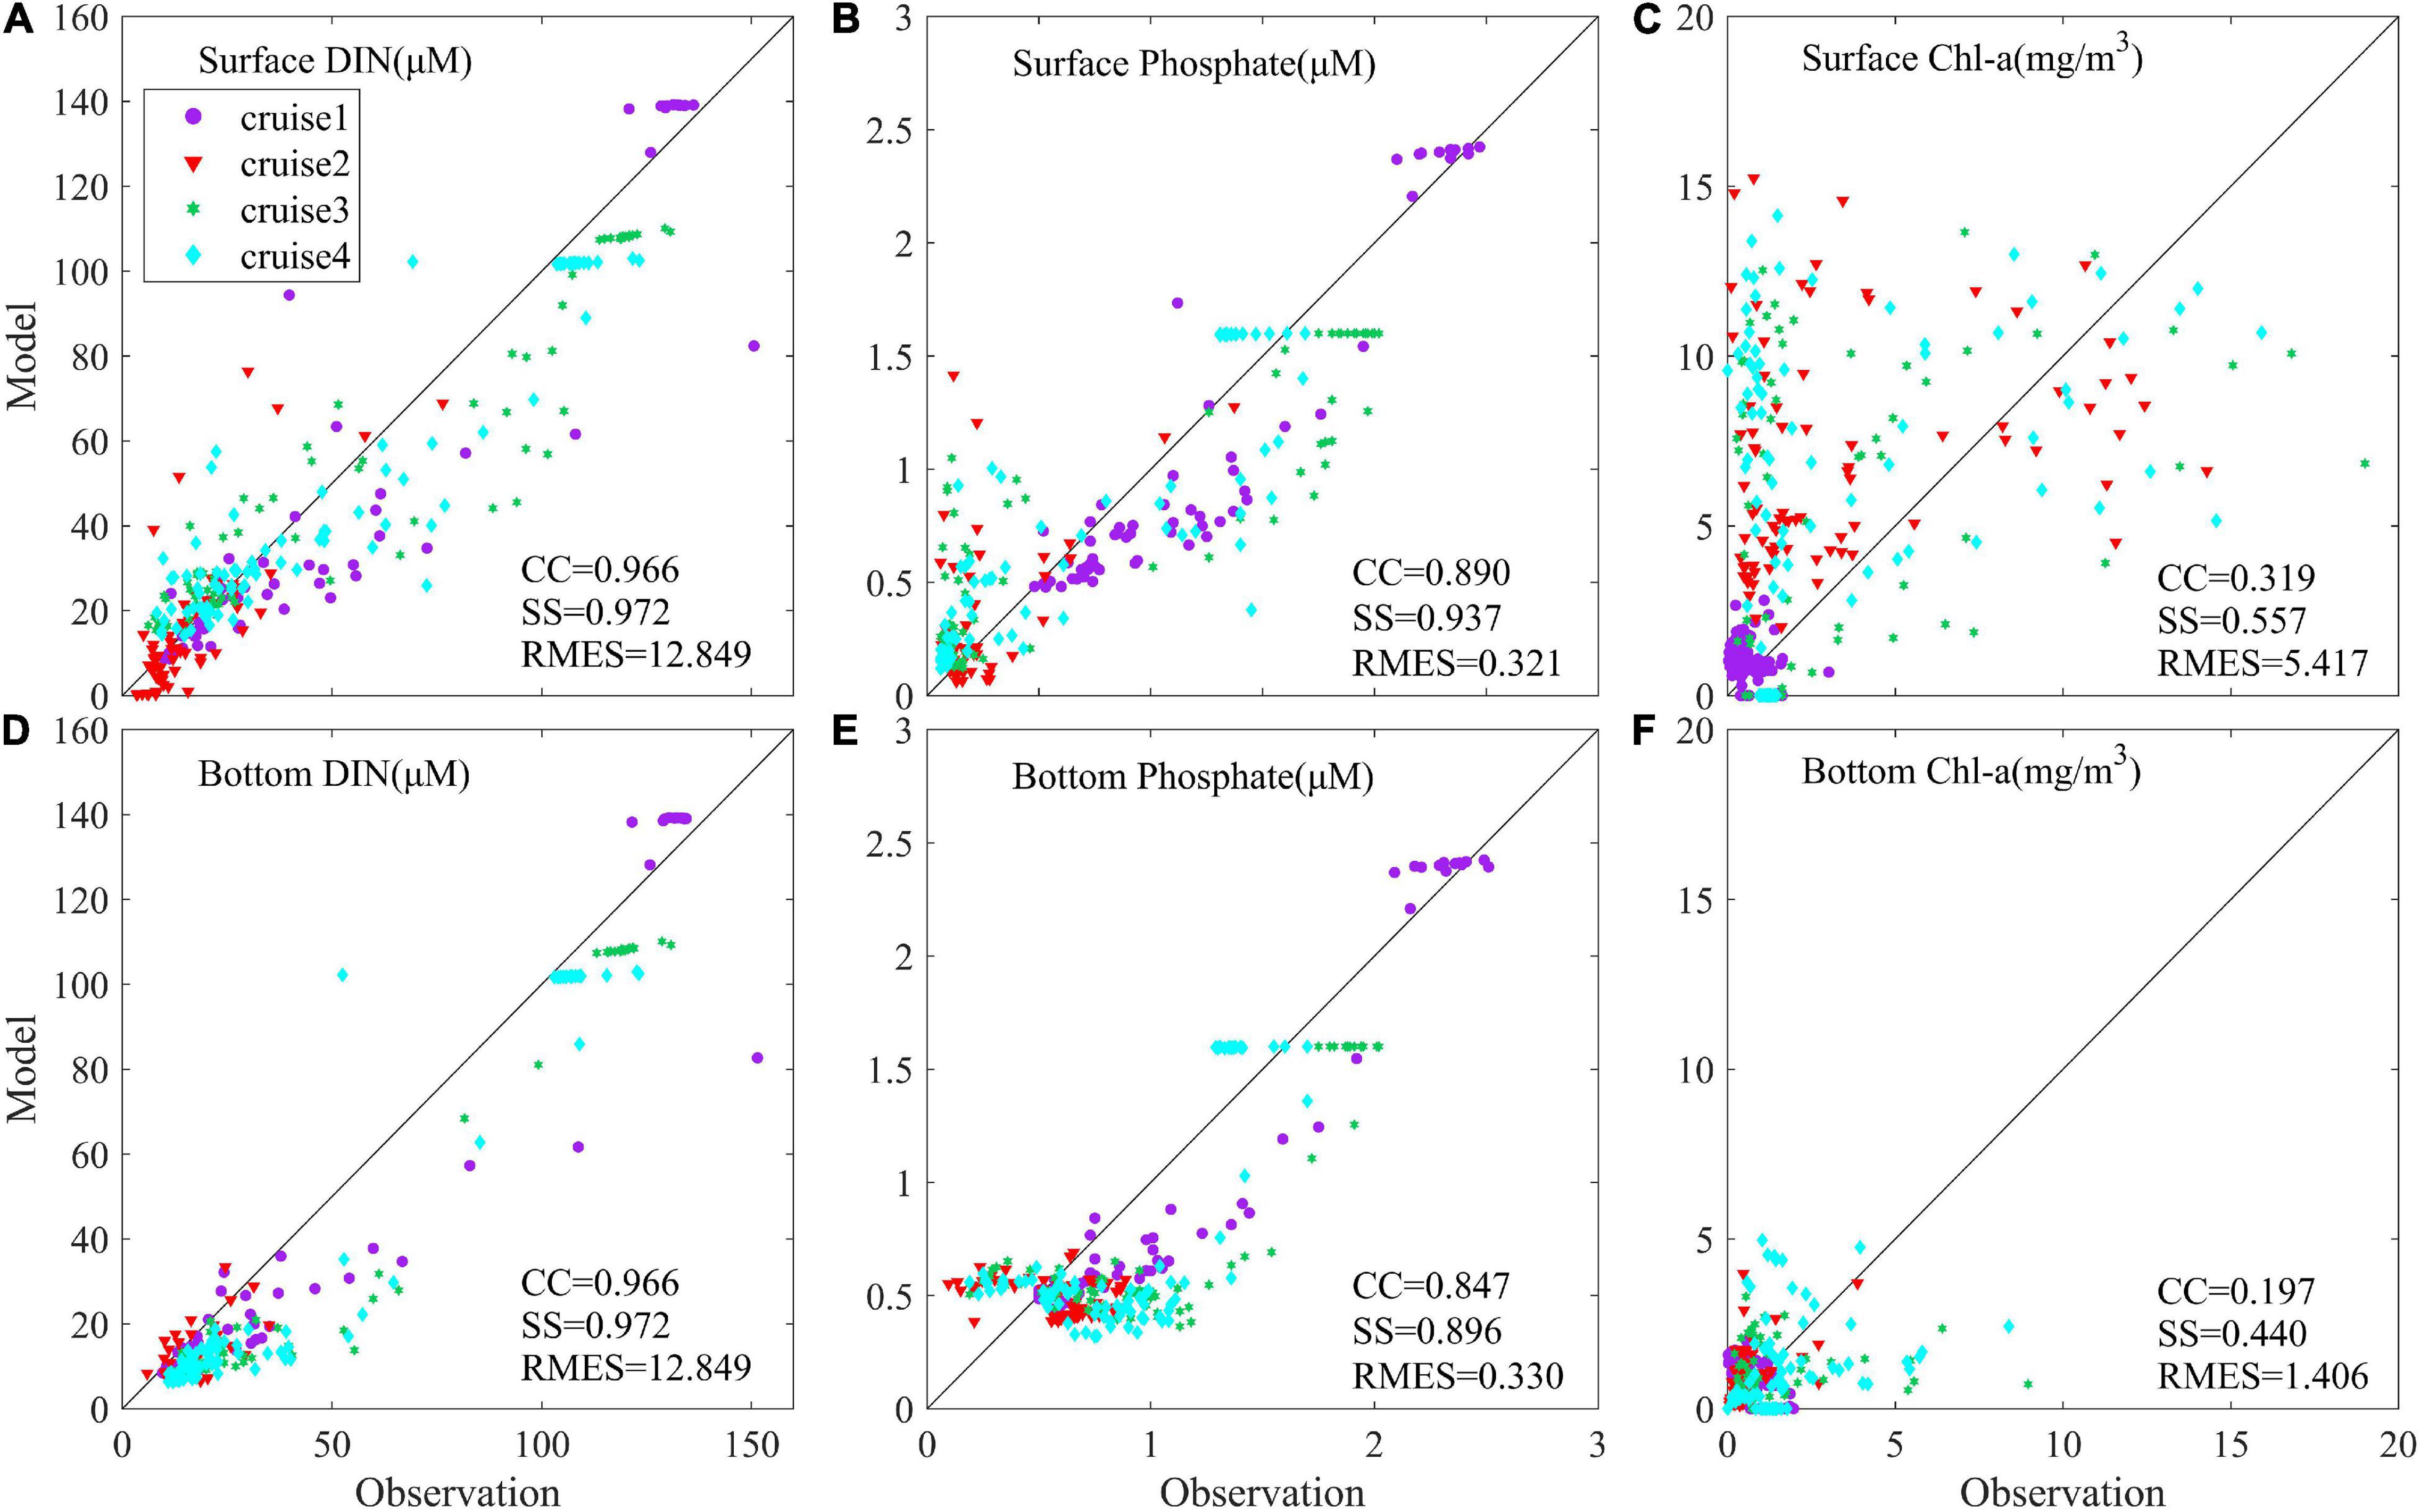
Figure 3. Point-to-point comparison between modeled and observed nutrients and chlorophyll concentration. (A) Surface DIN, (B) surface phosphate, (C) surface chlorophyll concentration, (D) bottom DIN, (E) bottom phosphate, and (F) bottom chlorophyll. CC is the correlation coefficient, RMSE is the root mean square error, and SS is the skill score.
The CC of DIN and surface phosphate were above 0.89 and SS was above 0.93, which implied that the nutrients simulation was in good agreement with the observed data (Figure 3). In addition, the modeled bottom phosphate concentration was relatively smaller than the observed data. The reason might be that phosphorus released from deposition (Meng et al., 2014) was not considered in the model simulation. The releasing phosphate flux is difficult to estimate in the model due to complicated environmental factors in the bottom layer. The simulated surface chlorophyll concentration was a bit high (Figure 3C). Overestimated model results of chlorophyll could be found in the offshore water (as seen in Figure 2). Riverine abundant nutrients were depleted and the phytoplankton growth condition became worse in the pelagic offshore water. Hence, the contribution of phytoplankton growth rate on biomass declined, and more other uncertain biological cycling processes took effect, which gave rise to more difficulty in biological parameterization. Given this complexity, an accurate simulation on phytoplankton growth remains a challenge. Nevertheless, the location of low chlorophyll concentration around the river mouth as well as the locations and patterns of surface chlorophyll maximum outside the river mouth were all well captured by the model, which was consistent with the remote sensing data (Figure 2). As our focus was on the location where algal bloom occurs, the model is suitable for the present study.
Results
Long-Term Trend of Observed Algal Bloom Distribution
Two sets of observed data, i.e., harmful algal bloom events data and satellite derived chlorophyll, were used to analyze the long-term trend of algal bloom distribution. The harmful algal bloom event data from 2000 to 2010 in the spring season (April to June) showed that algae is likely to bloom along isobaths east and south of the Changjiang River mouth (Figure 4). The frequency is increased for the long-term trend, especially in the region between 30°N and 32°N out of the Changjiang River mouth. Despite of strong randomness and variations, a landward shift trend can be observed with more events occurring in the region between 31°N and 32°N and a seaward shift trend appeared with more events and longer duration in the region between 30°N and 31°N.
The satellite-derived chlorophyll data from SeaWiFS and MODIS-aqua were also analyzed to get the long-term trend. A chlorophyll concentration threshold of 10 mg/m3 was adopted to calculate the probability of algal bloom in the spring season (from May to June). The result indicated that algae were likely to bloom out of the Changjiang River Estuary along the coast (Figure 5). The seaward boundary of high probability was located around 123°E out of the Changjiang River mouth and tended to cling to the coast gradually toward the south. The patchy distribution of high probability (Figure 5), especially in the area adjacent the DNC, was in accordance with previous studies on the algal bloom distribution in this area (Zhou et al., 2008; Wang and Wu, 2009; Shen et al., 2011, 2019).
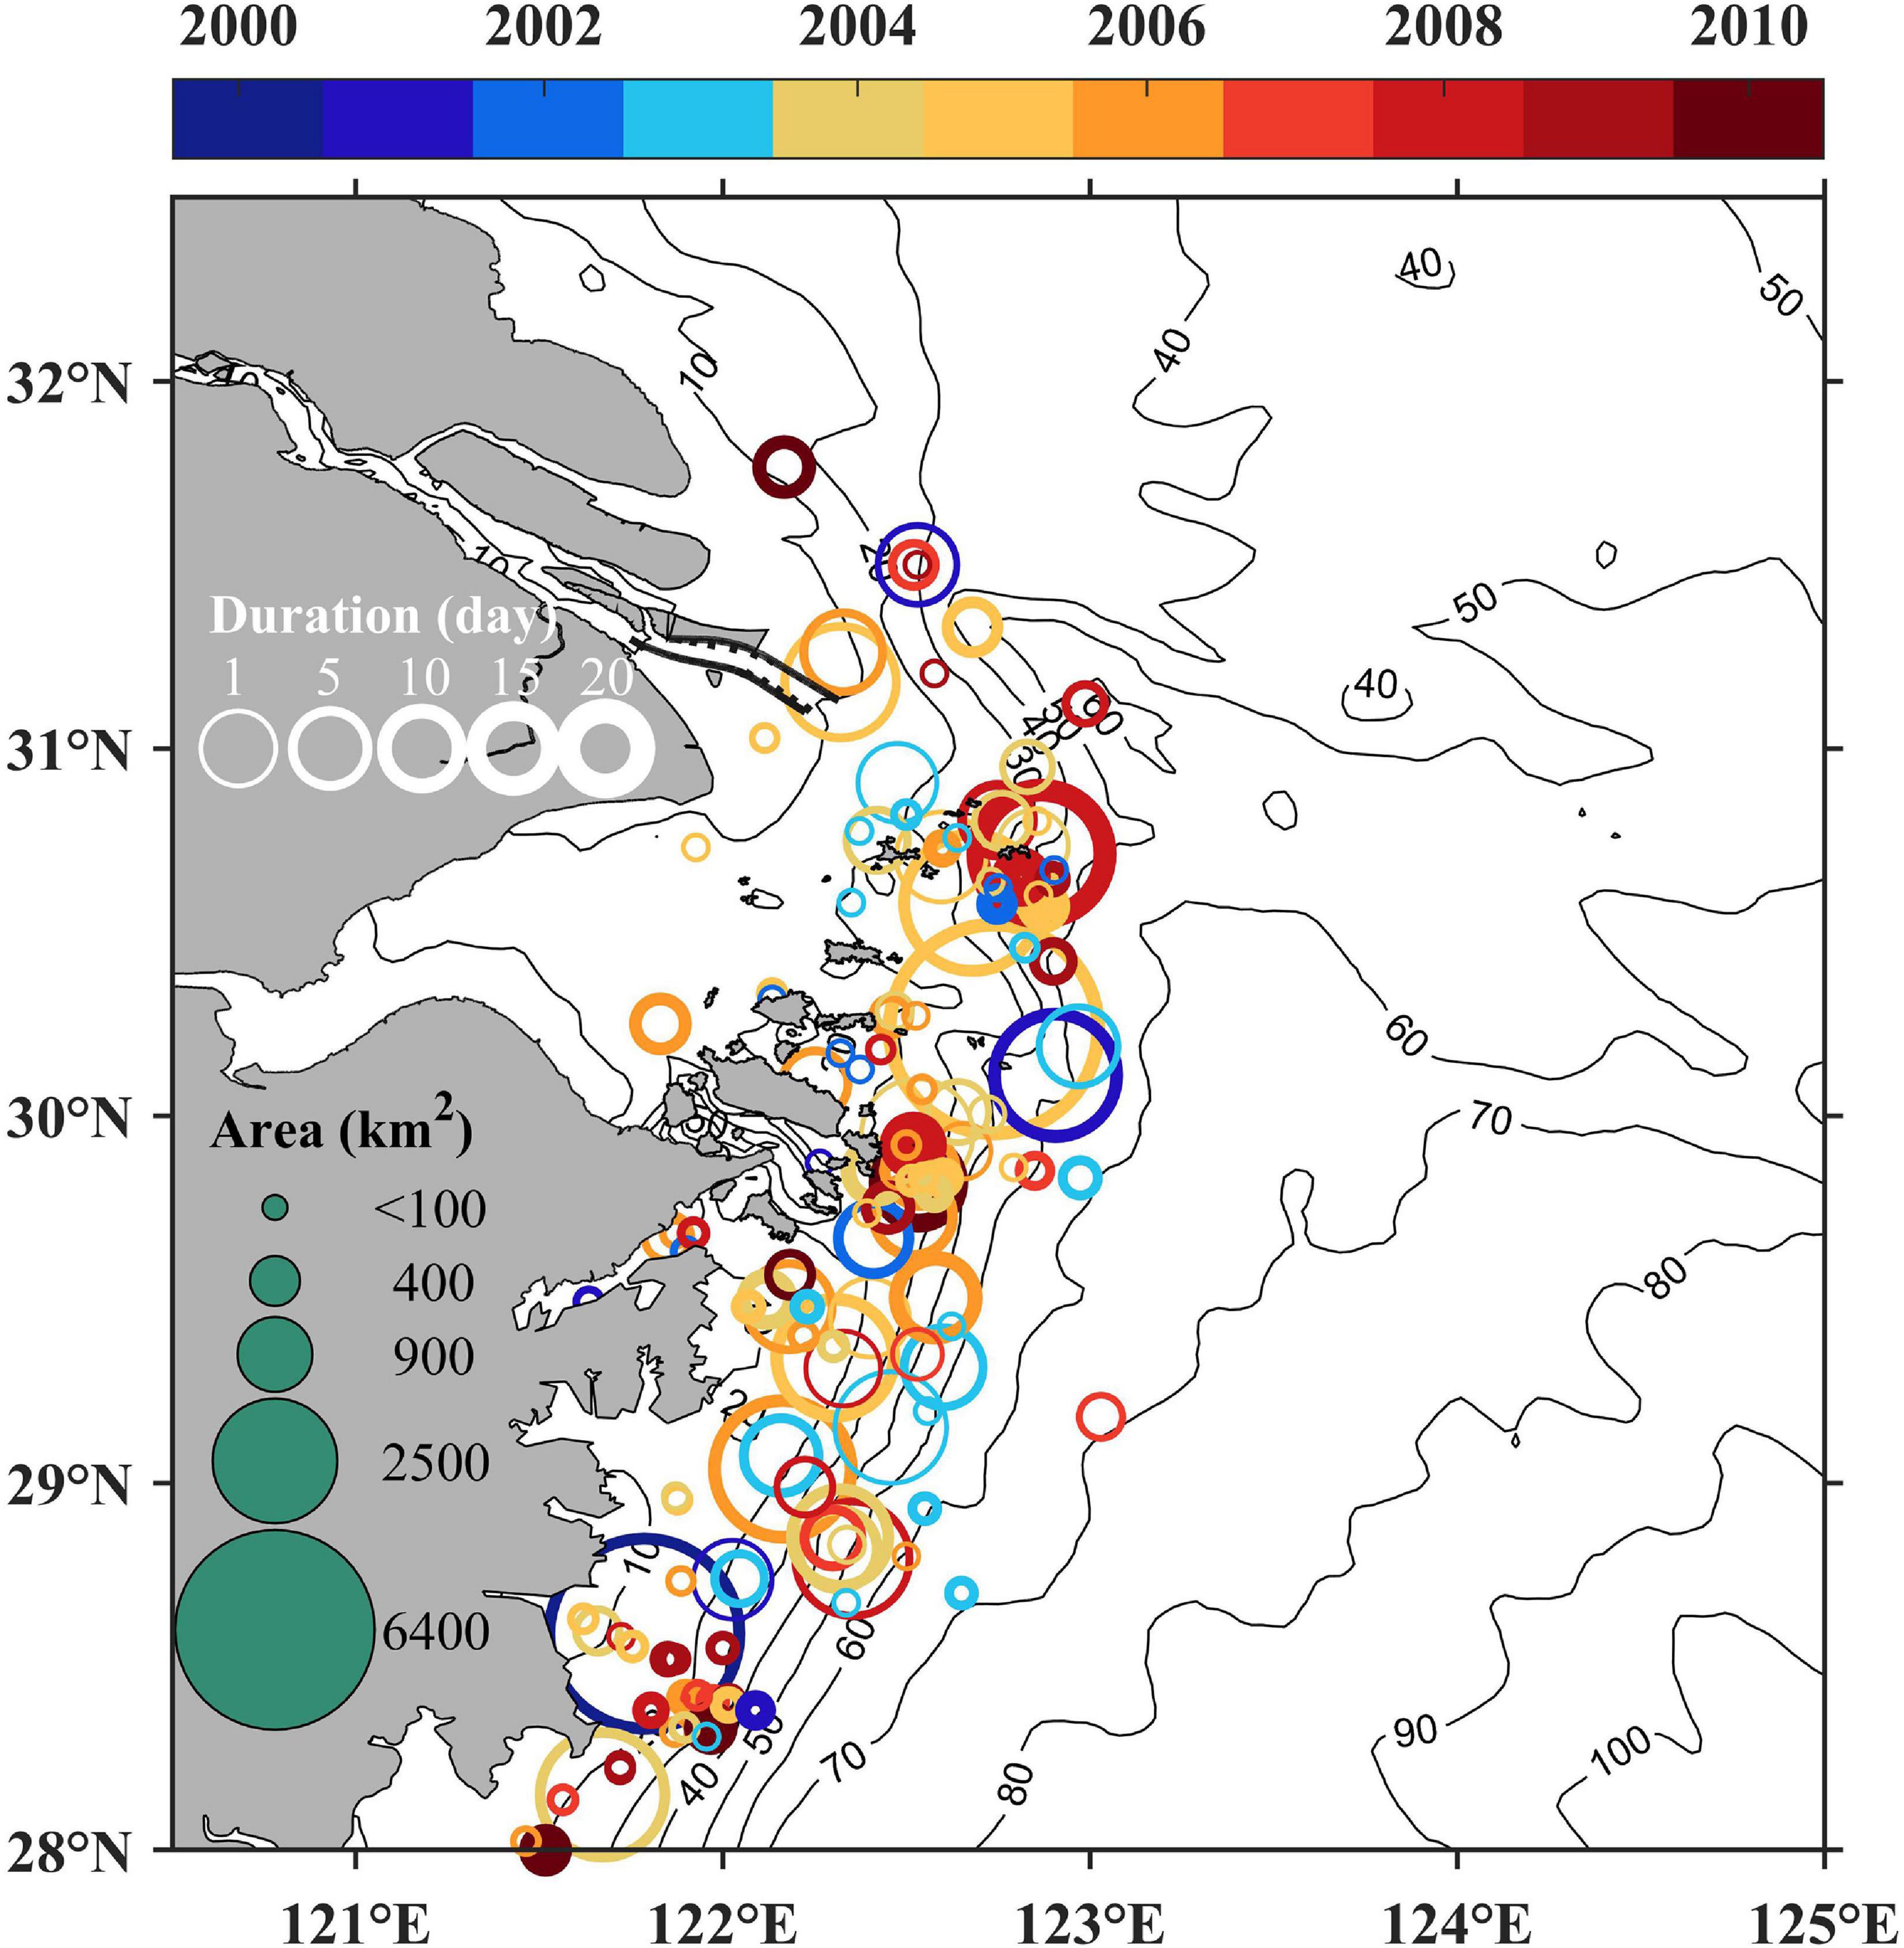
Figure 4. Interannual variations of harmful algal bloom events during 2000 to 2010.
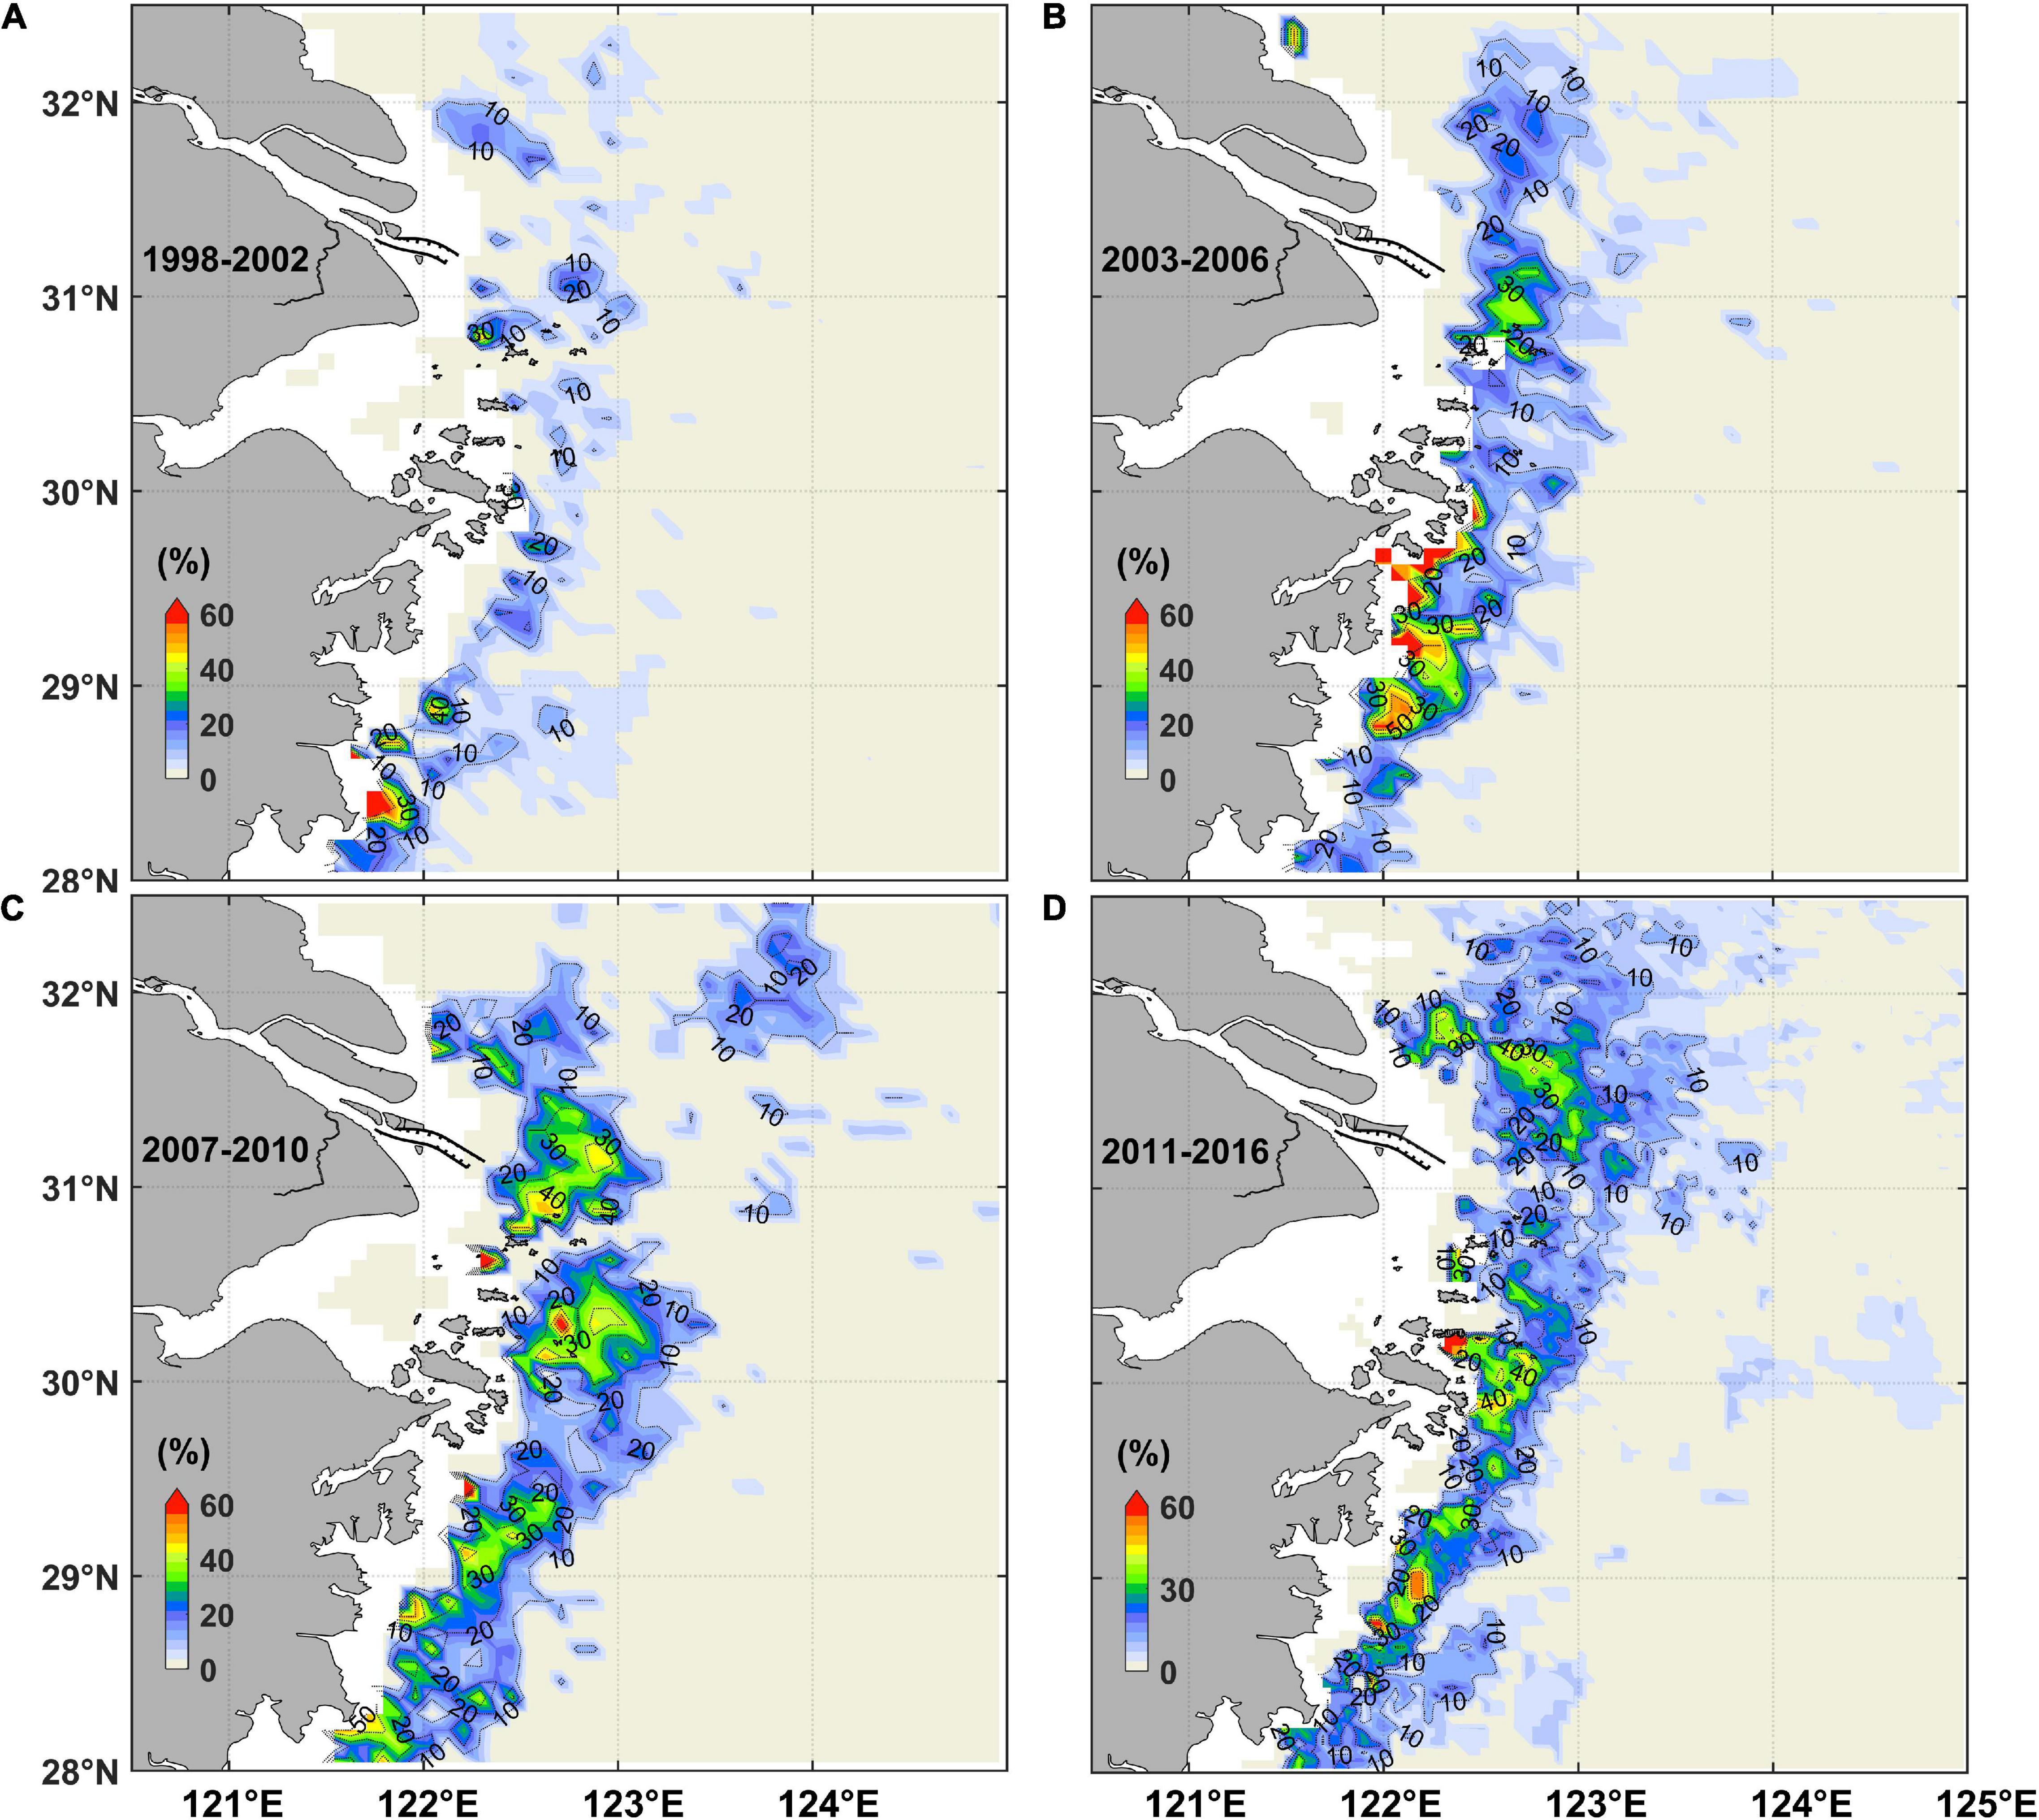
Figure 5. The probability of algal bloom occurrence (the threshold of chlorophyll adopted 10 mg/m3) based on satellite-derived chlorophyll concentration during (A) 1998–2002, (B) 2003–2006, (C) 2007–2010, and (D) 2011-2016.
The algal bloom probability increased for the long-term trend in the Changjiang River Estuary region. The probability of algal bloom was rarely larger than 30% from 1998 to 2002. However, after 2002, some patches occurred east of the Changjiang River mouth and Zhoushan Islands where the probabilities were larger than 30%. The high probability area became even larger after 2006. Besides the temporal variation, the probability of algal bloom also had a spatial variation. The probability of algal bloom occurrence in the east and northeast of the Changjiang River mouth had been increased and moved landward especially after 2006 (Figures 5B,C). Meanwhile, in the direction of North Passage extension, a frequent algal bloom area was gradually formed after 2006 (Figures 5B–D). In the far field of the Changjiang River Estuary, including east and southeast of the Zhoushan Island and the Jiangsu coastal water, the region of high probability emerged alternatively.
The long-term variation of satellite-derived chlorophyll showed a significant trend as described above. To characterize the spatiotemporal variation and to identify the influence of human activities, numerical experiments were further conducted.
Horizontal Variations Under the Influence of Mega Estuarine Constructions
Two sets of numerical experiments were conducted to explore the effect of MEC on variations of the phytoplankton spatial distribution and the hydrological and ecological environmental characteristics.
The tidal-averaged results in May 2016 were plotted to analyze their differences. Both model results with and without the MEC demonstrated that the surface chlorophyll maximum is distributed like a long-curved belt with a couple of hotspots some distance from the river mouth (Figures 6A,B). However, some subtle differences could be found. It indicated that after the MEC, the surface chlorophyll maximum was attenuated, part of which migrated landward north of the river mouth around 31.5°N. By contrast, south of the river mouth, the surface chlorophyll maximum was strengthened, and some of that extended seaward around 30.5°N (Figure 6C). In addition, in the far field of the Changjiang River Estuary, the shape of surface chlorophyll maximum was also slightly adjusted in response to the near-field variation after the MEC was built. These horizontal variation characteristics under the influence of MEC were similar to the long-term trend of satellite-derived chlorophyll data (Figure 5).
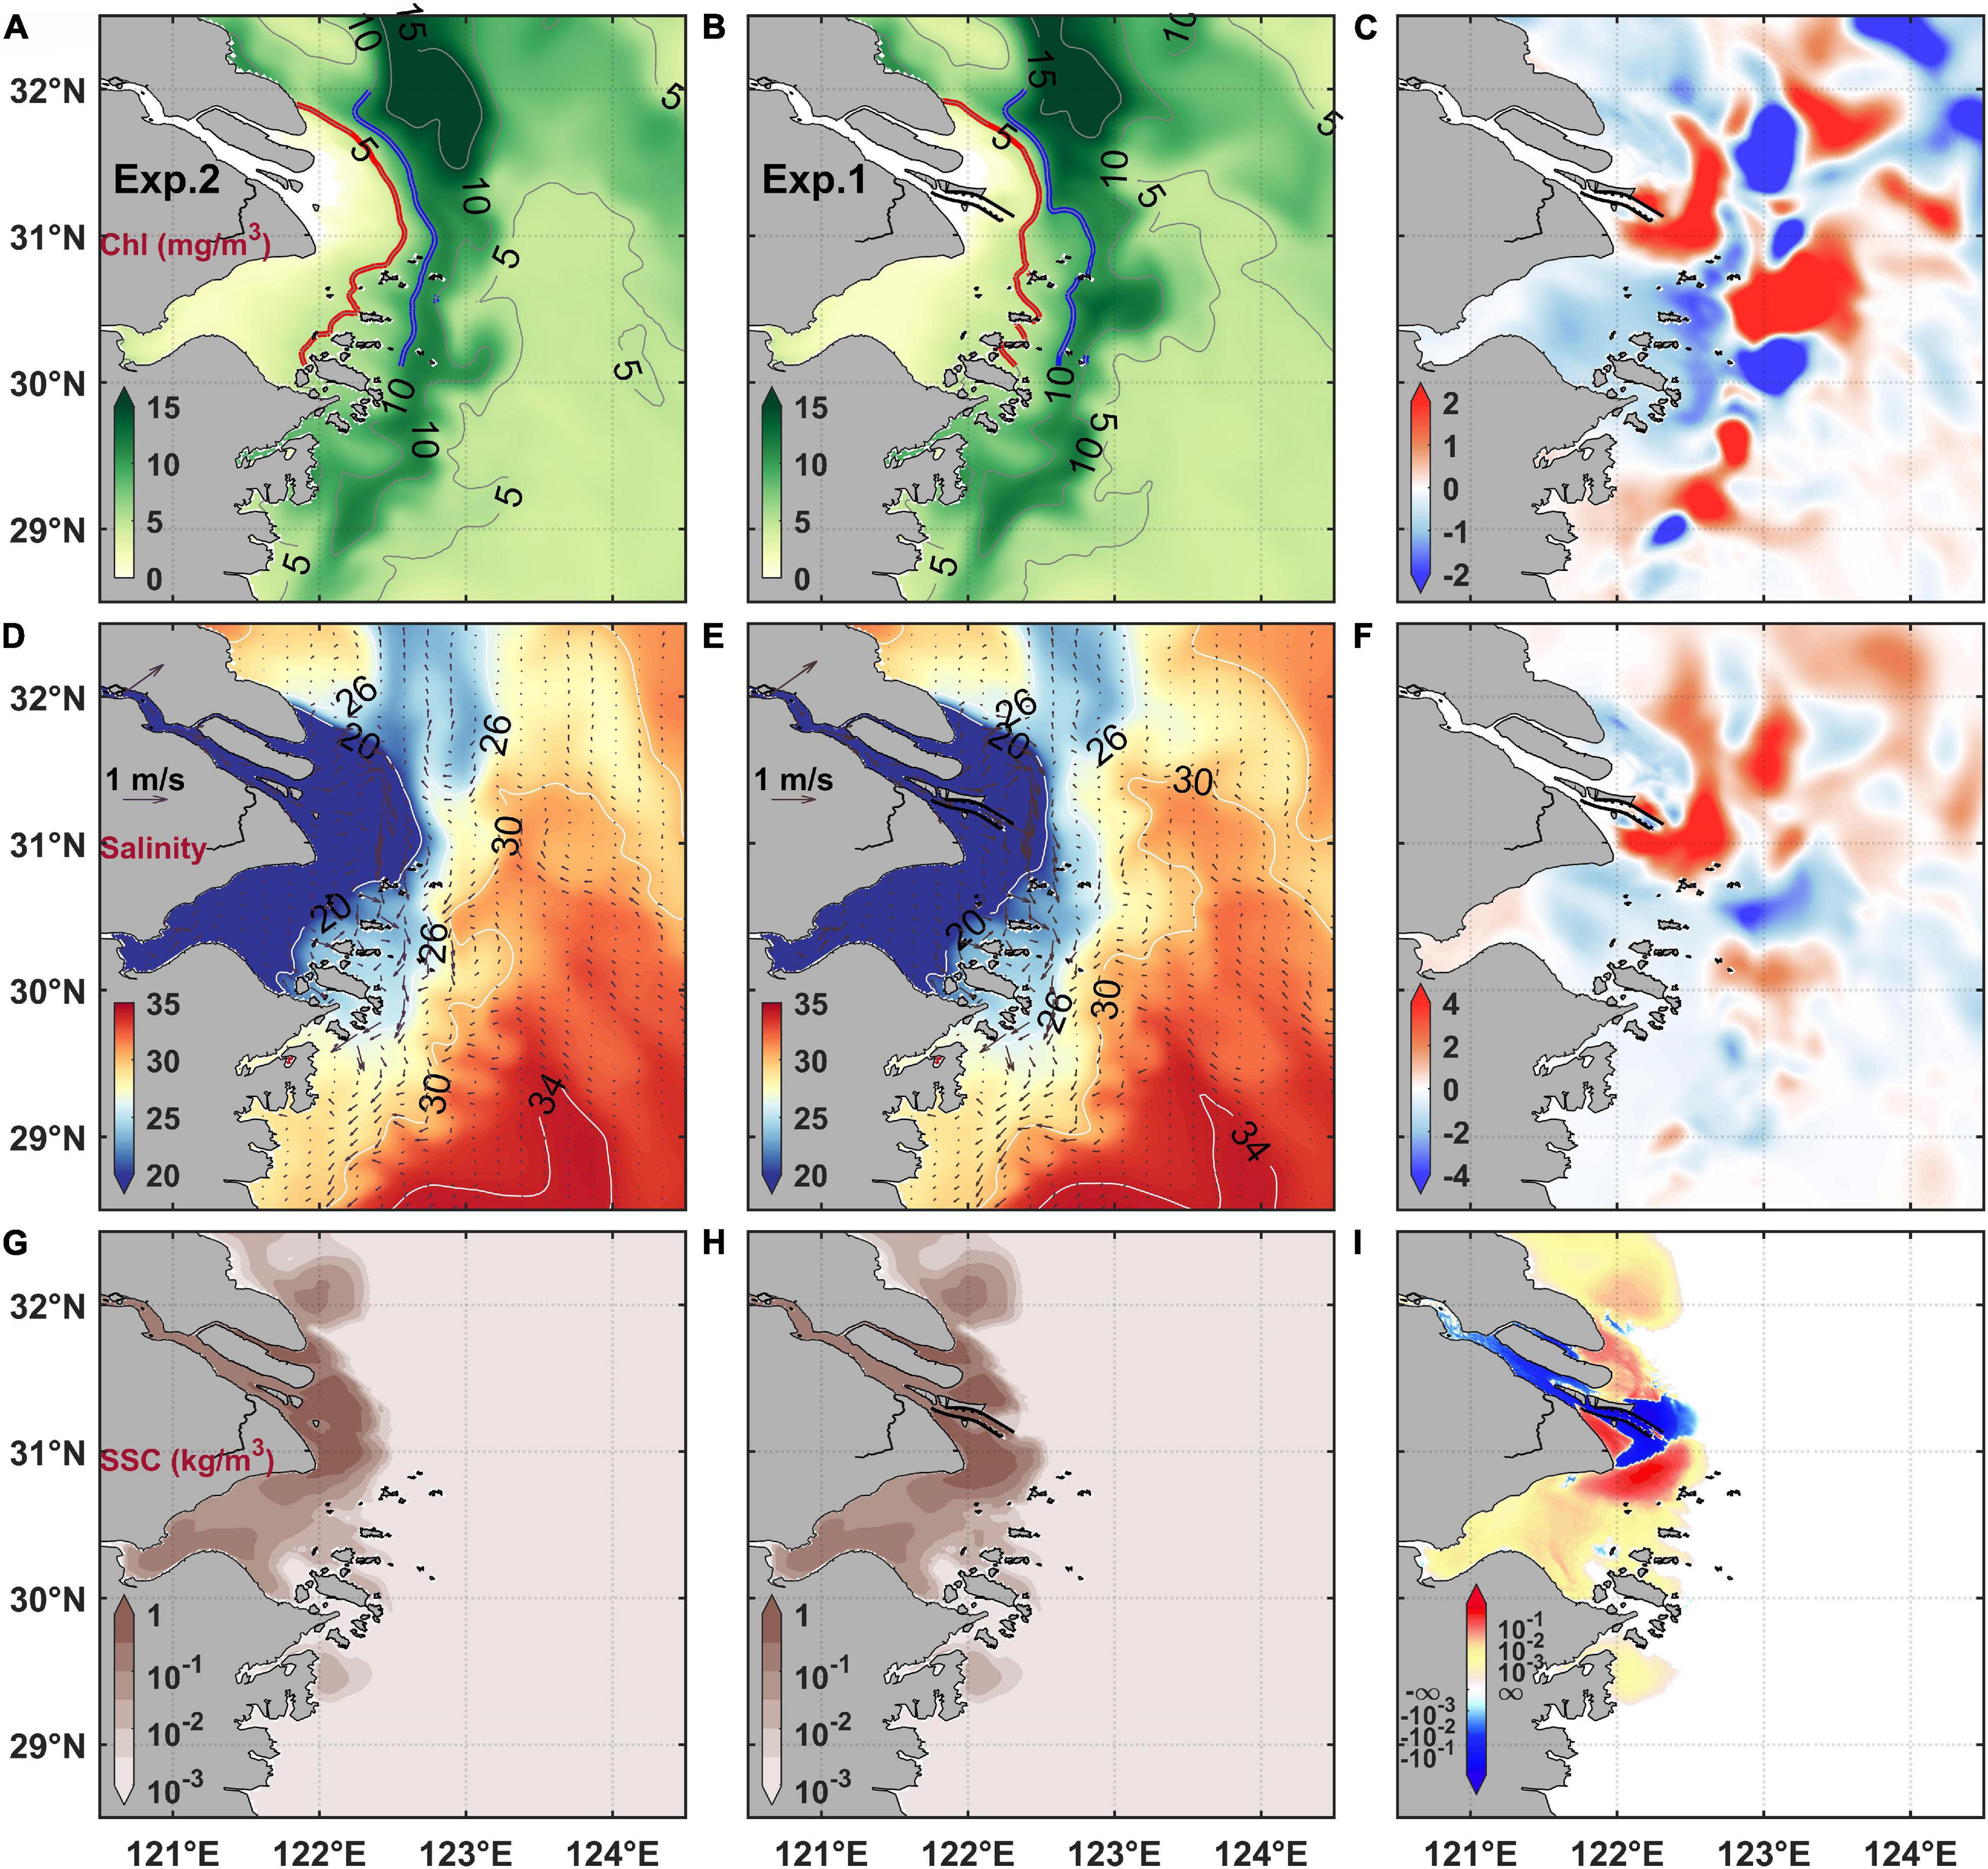
Figure 6. Modeled tide-averaged surface (A) chlorophyll concentration (Chl) before the mega estuarine constructions (MEC), (B) chlorophyll concentration after the MEC, and (C) difference of chlorophyll concentration [(B) minus (A)]; salinity with residual current overlaid (D) before the MEC, (E) after the MEC, and (F) their difference [(E) minus (D)]; suspended sediment concentration (SSC) (G) before the MEC, (H) after the MEC, and (I) their difference [(H) minus (G)].
To explore the mechanism responsible for chlorophyll distribution variations, more numerical results were analyzed. Salinity manifests the extension of the Changjiang River plume. The numerical results showed that after the MEC, the surface salinity increased northeast to the river mouth and decreased southeast from the Hangzhou Bay to the Zhoushan Island adjacent waters. The variation of salinity distribution indicated that the northeastward extension of the Changjiang River plume was weakened, whereas its southward extension was strengthened (Figures 6D–F).
On the other hand, based on the results of numerical experiments, high suspended sediment concentration appeared inside the estuary and around the river mouth area. Remarkable variations of suspended sediment concentration could also be found adjacent to the DNC (Figures 6G–I). After the MEC, more suspended sediments were pushed out of the South Passage, whereas the suspended sediment concentration in the North Passage and the North Channel decreased. Notably, the sharp variation of suspended sediment occurred landward of the surface chlorophyll maximum (Figure 6).
The results of nutrient variations were also examined. The Changjiang River exported abundant nutrients (including DIN and phosphate) to the sea, which caused sharp gradient of nutrients in the estuarine area (Figure 7). The terrigenous nutrients led to a large N/P ratio outside the estuary (Figure 7), which could form a phosphate limiting condition due to phytoplankton consumption. Under the influence of MEC, the surface DIN and phosphate concentration distribution both indicated that the nutrient concentration decreased northeast of the river mouth and increased southeast from the Hangzhou Bay to the Zhoushan Island (Figure 7). The results were similar to salinity distribution, which could be referred to the influence of deflection of plume extension. However, under the consumption of phytoplankton in the shelf, the nutrient variations, especially the N/P ratio variations, were highly correlated with the variations of chlorophyll concentration (Figures 6C, 7I) in the surface chlorophyll maximum region.
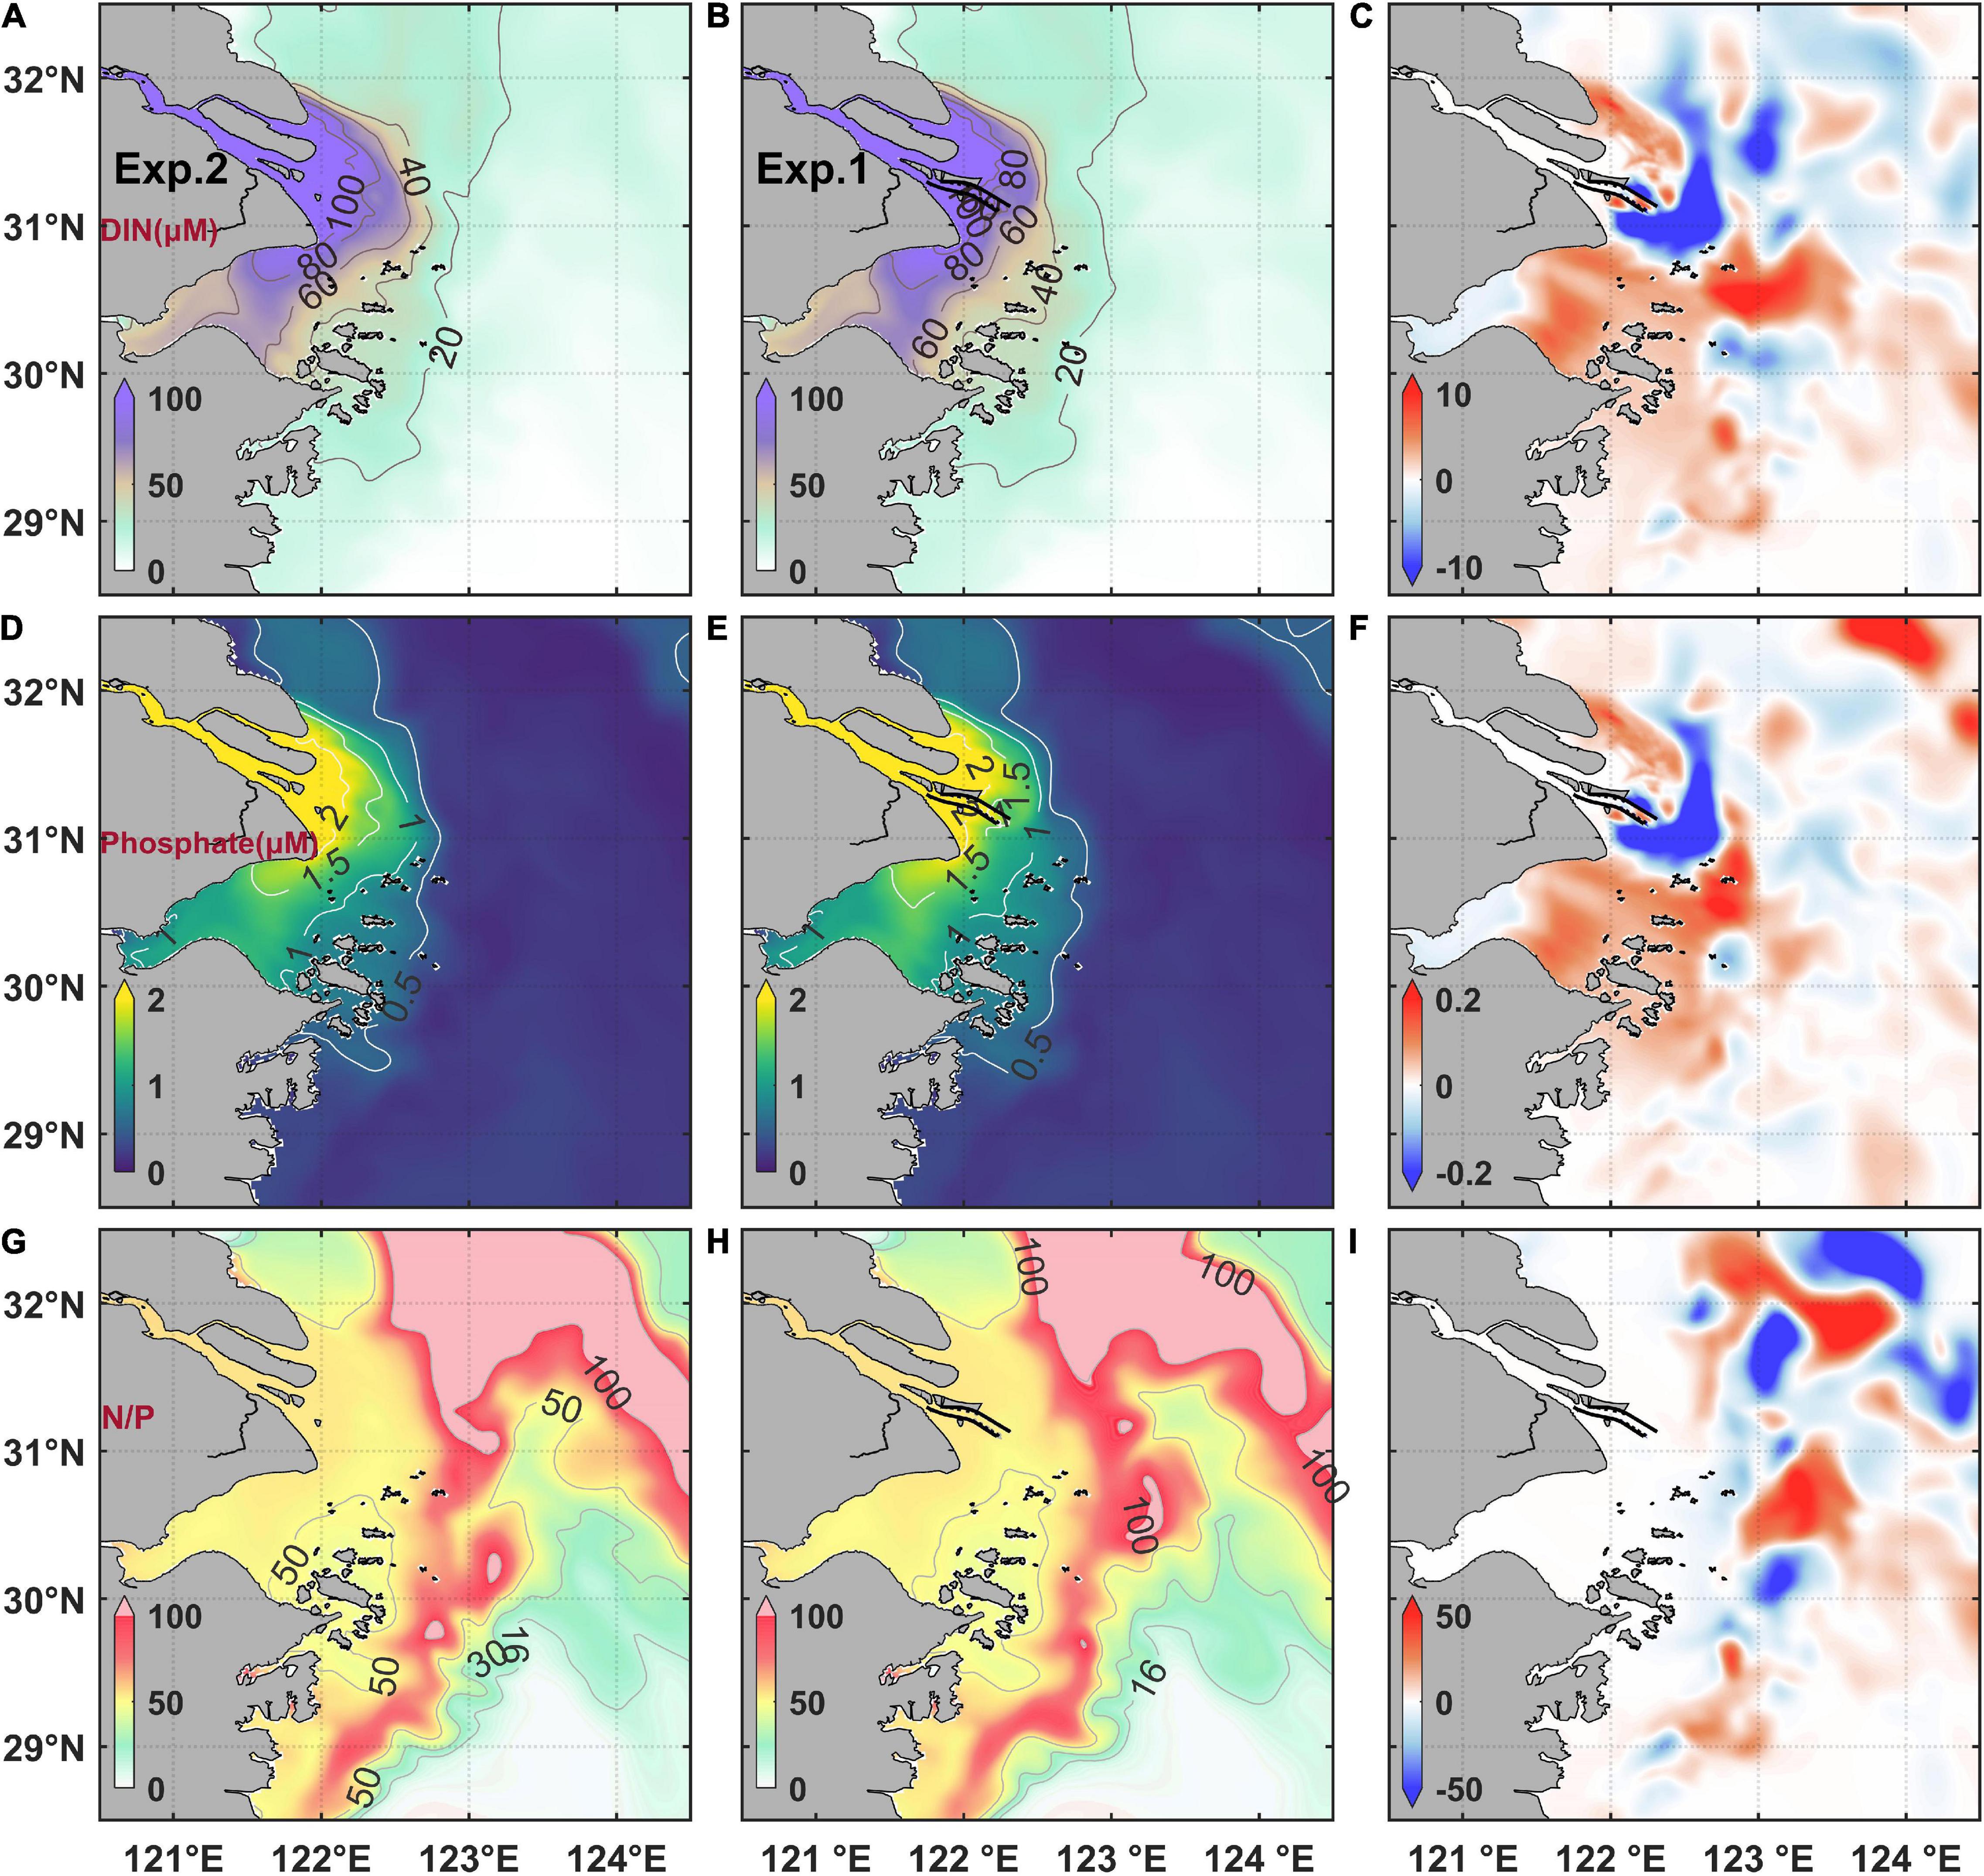
Figure 7. Modeled tidal-averaged surface dissolved inorganic nitrogen concentration (DIN) (A) before the MEC, (B) after the MEC, and (C) their difference [(B) minus (A)]; phosphate concentration (D) before the MEC, (E) after the MEC, and (F) their difference [(E) minus (D)]. N/P ratio (G) before the MEC, (H) after the MEC, and (I) their difference [(H) minus (G)].
Vertical Variations Under the Influence of Mega Estuarine Constructions
The model results demonstrated that different variations of plume extension and chlorophyll distributions in response to the MEC could be found in the northern and southern areas off the Changjiang River Estuary, respectively. Hence, two sections were selected to further illustrate the vertical profiles. Sec1 and Sec2 were along the northeastward and southeastward extending direction of the Changjiang River plume, respectively (for location, see Figure 1A). The chlorophyll concentration, salinity, suspended sediment concentration, nutrients concentration, and euphotic depth were displayed on both sections (Figures 8, 9). The euphotic depth is the layer in the water column where the sea surface light intensity attenuates to 1% (Strickland, 1958; Ralph et al., 2007). In the estuary region, the euphotic depth is mainly influenced by the suspended sediments.
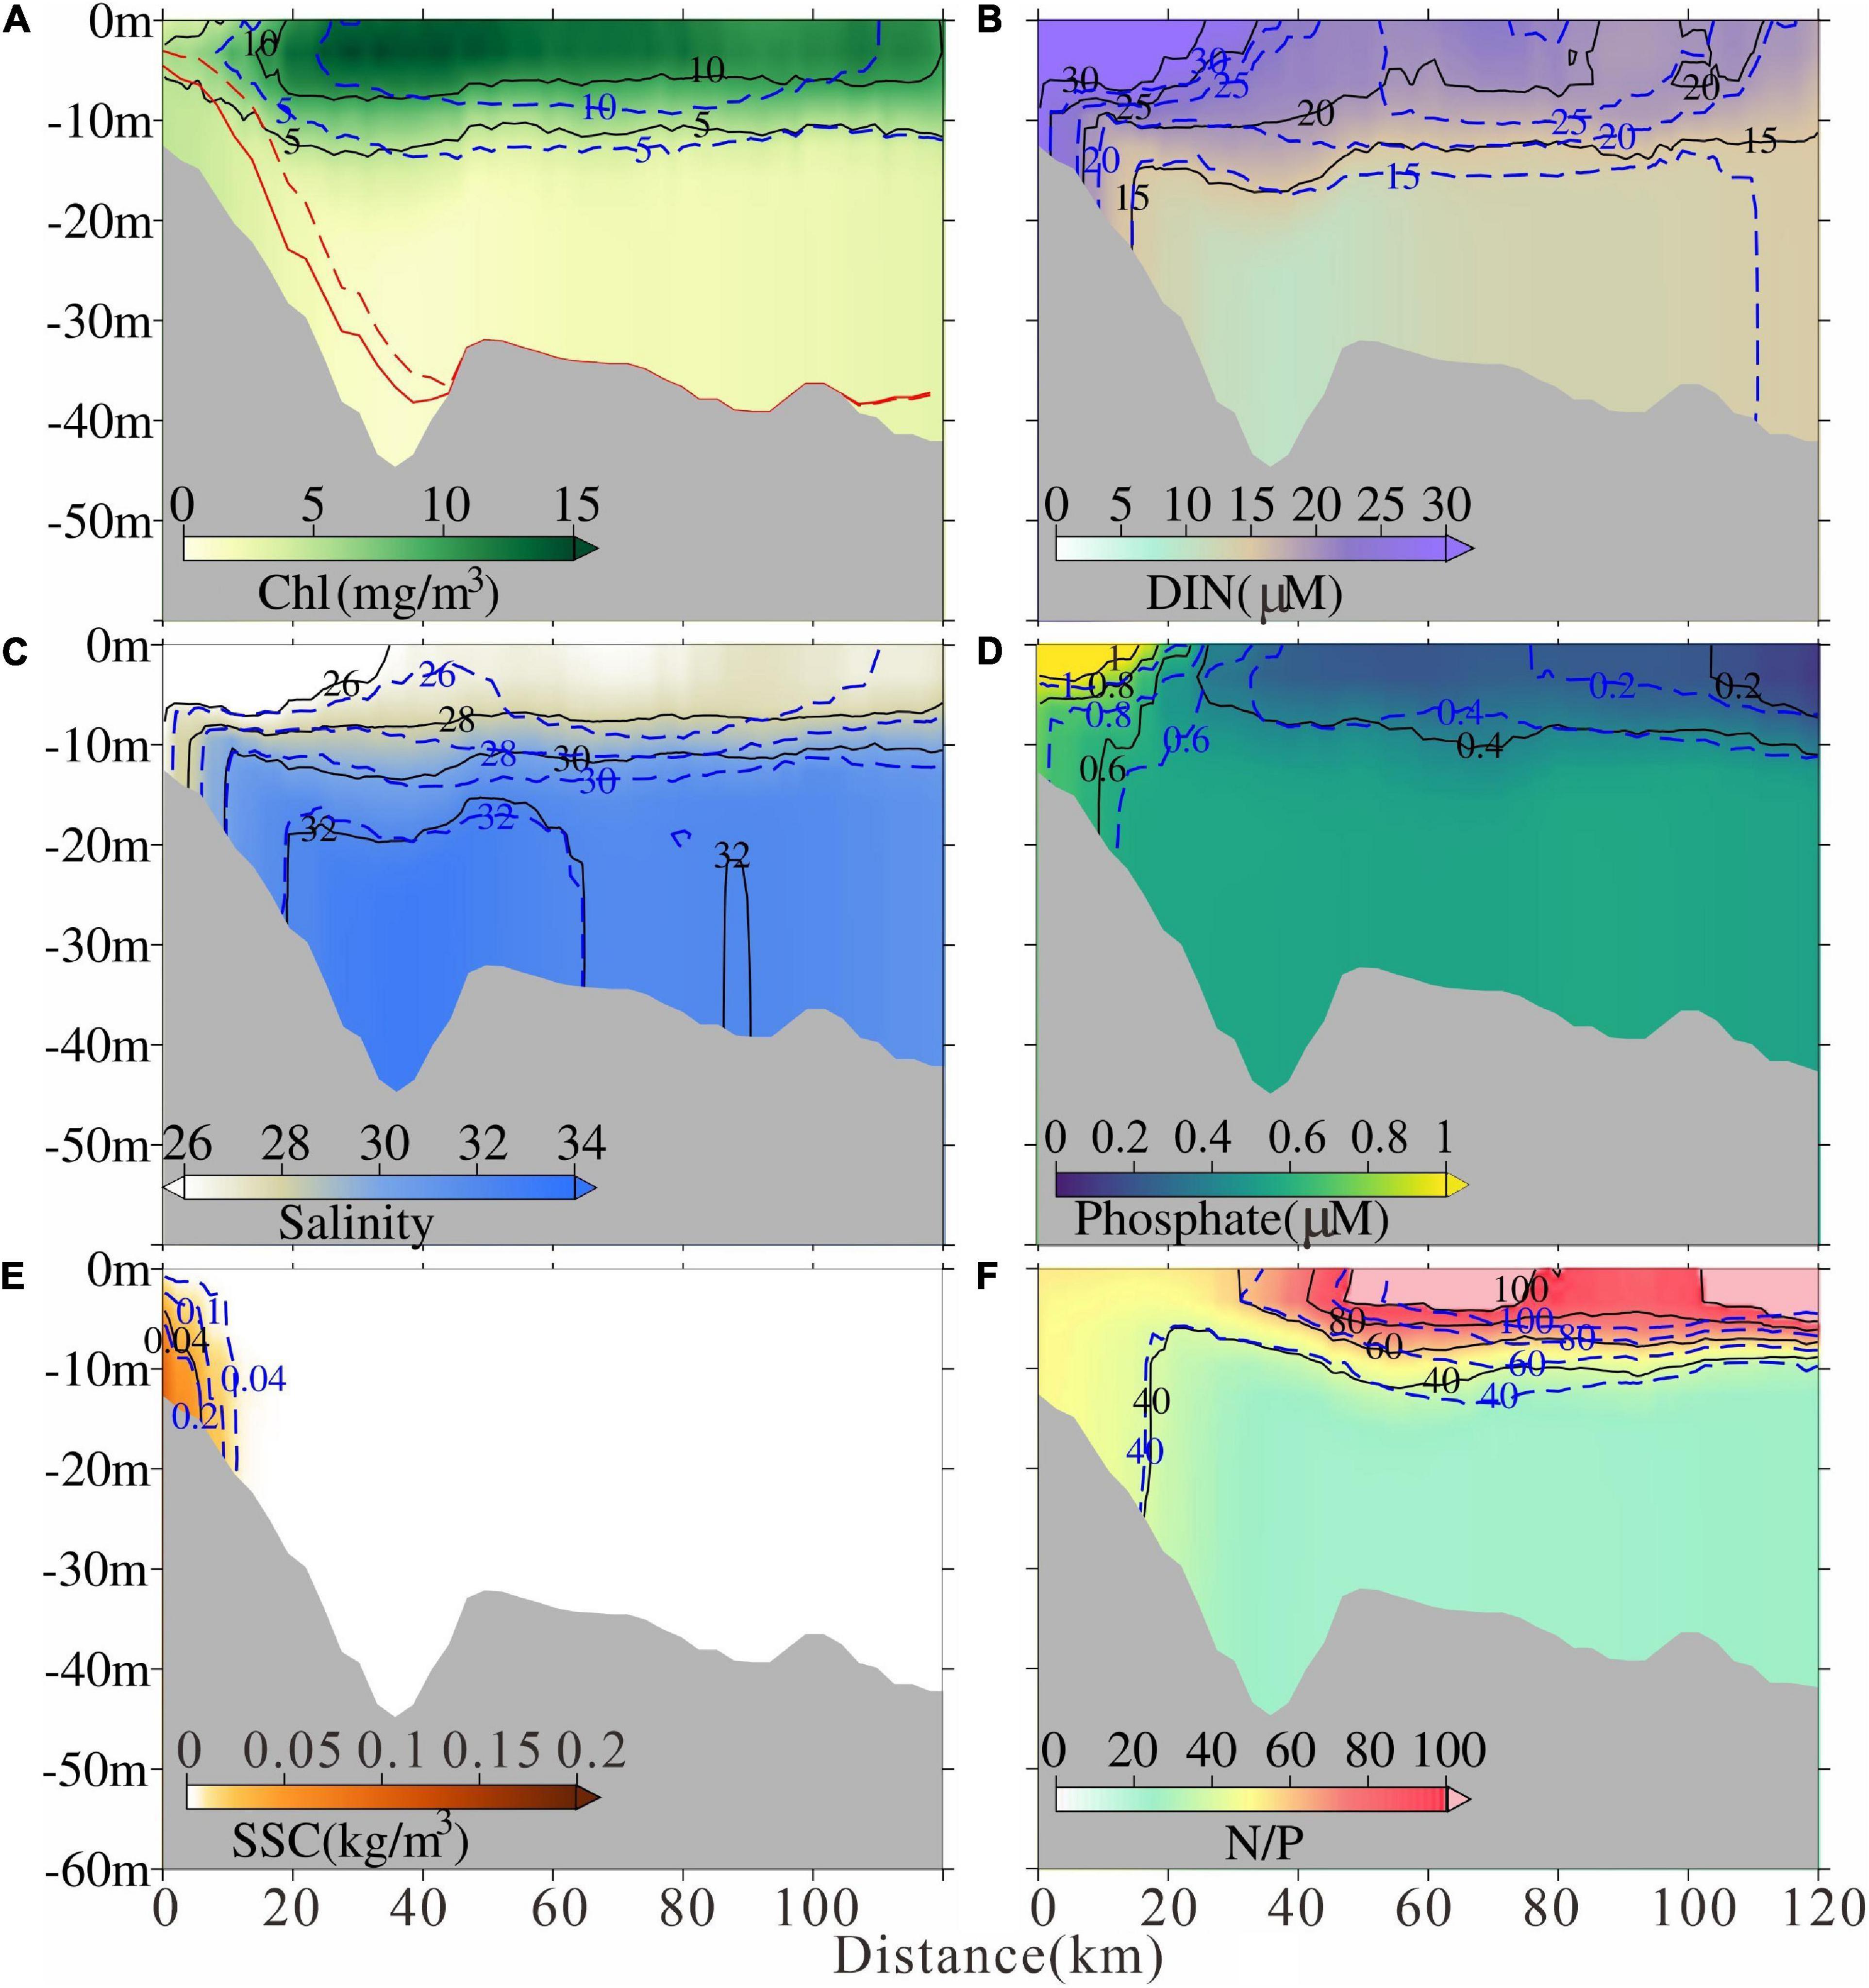
Figure 8. Modeled tidal-averaged (A) chlorophyll concentration, (B) dissolved inorganic nitrogen concentration, (C) salinity, (D) phosphate, (E)suspended sediment concentration, and (F) N/P ratio in Sec1 after the MEC. The solid lines indicate the contour after the MEC and the dashed lines indicate the contour before the MEC, respectively. Euphotic depth was also marked in (A) with red lines.
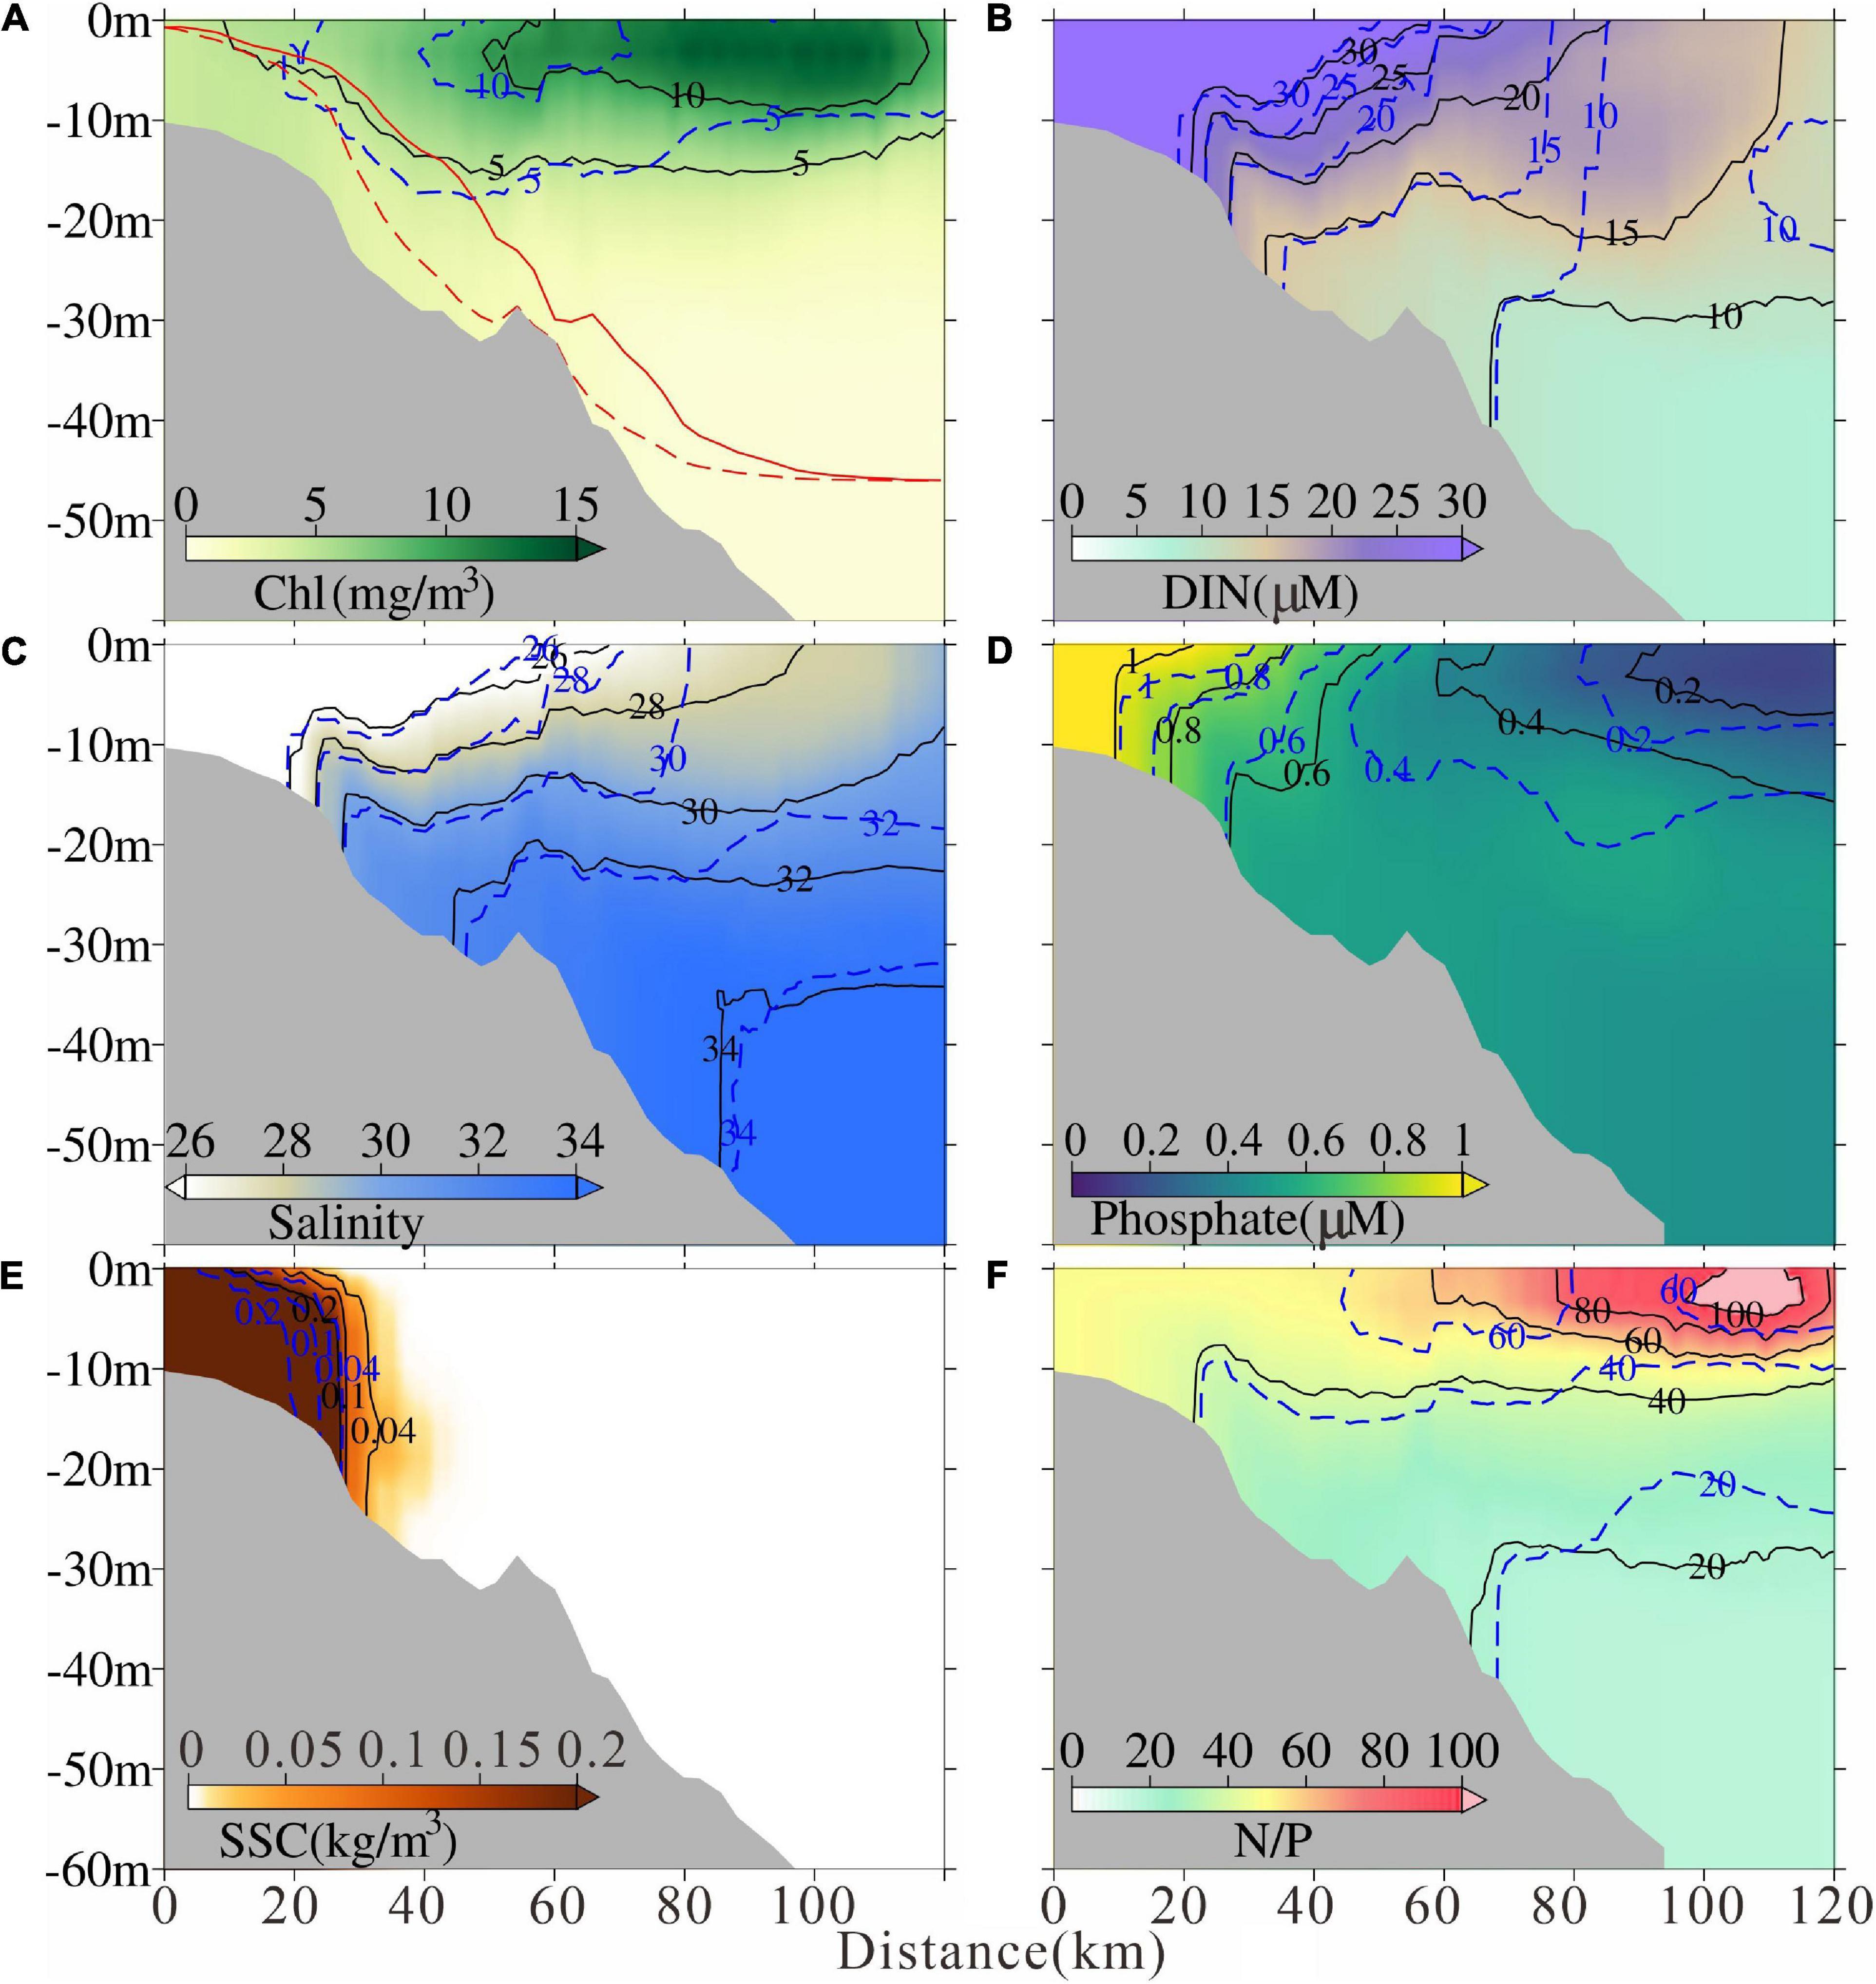
Figure 9. Modeled tidal-averaged (A) chlorophyll concentration, (B) dissolved inorganic nitrogen concentration, (C) salinity, (D) phosphate, (E) suspended sediment concentration, and (F) N/P ratio in Sec2 after the MEC. The solid lines indicate the contour after the MEC and the dashed lines indicate the contour before the MEC, respectively. Euphotic depth was also marked in (A) with red lines.
Northeast to the Changjiang River Estuary, along the Sec1, the intensity of chlorophyll maximum decreased and a landward moving trend of high chlorophyll maximum emerged with a distance of ∼ 5 km after the MEC (Figure 8A). Similar landward moving trends of low salinity and high suspended sediment concentration were found (Figures 8C,E). The euphotic depth near the river mouth deepened (Figure 8A). Hence, after the MEC, the northeastern Changjiang River plume extension was weakened and light conditions for phytoplankton growth improved. The DIN and phosphate concentration inside the river mouth also decreased after the MEC due to the weakened river plume extension (Figures 8B,D). However, in the shelf region, the nutrients varied complicatedly due to superimposed biological cycling (Figures 8B,D).
By contrast, along Sec2, the 5 mg/m3 contour of chlorophyll concentration moved landward, and the 10mg/m3 contour moved seaward after the MEC (Figure 9A). A seaward moving trend of low salinity and high suspended sediment concentration occurred (Figures 9C,E). The euphotic depth near the river mouth shoaled (Figure 9A). Previous study indicated that the southward Changjiang River plume extension was strengthened under the effect of MEC (Wu et al., 2018). Along Sec2, the DIN and phosphate concentration inside the river mouth also increased after the MEC due to the strengthened river plume extension (Figures 9B,D). The increasing trend could be found in the DIN concentration in the shelf region, while the phosphate concentration decreased (Figures 9B,D). The nutrient variation corresponded to the chlorophyll and plume variations based on the phosphate limiting condition in this area. The specific mechanism will be explored and discussed in the next section.
Discussion
Effect of the Mega Estuarine Constructions-Induced Nutrient Distribution Variation
The numerical results indicated that, after the MEC, the intensity of surface chlorophyll maximum was weakened and the hotspot moved landward northeast of the Changjiang River Estuary, whereas it migrated seaward south of the river mouth. The high chlorophyll concentration patches in the far field of the river plume were also modulated under the influence of MEC (Figures 6, 8, 9). The variation of chlorophyll distribution largely matched the long-term spatial variation trend of satellite-derived algal bloom probability (Figure 5), which indicated the influence of MEC on the variation of phytoplankton distribution. The underlying mechanisms were discussed as follows.
The numerical results of surface salinity indicated that, after the MEC, the river plume extension to the northeast was weakened, while that to the south was strengthened. Wu et al. (2018) suggested that the construction of these mega constructions block the lateral tide-induced residual transport among three estuarine outlets, and thus regulate the water diversion ratio between the North Channel and the South Channel. This modulation consequently strengthens the southward plume extension but weakens the northeastward one. The Changjiang River load is the dominant nutrient source in the estuarine area, especially in the river mouth region. Many studies have focused on the response of variation of riverine nutritional load on the phytoplankton species and abundance (Zhou et al., 2017; Ge et al., 2020; Xu et al., 2020). We believe that the modulation of plume structure could also induce the regulation of nutrient distribution, thus ultimately resulting in the variation of phytoplankton distribution.
The simulated results of nutrients revealed that under the modulation of plume extension, the DIN and phosphate concentration decreased northeast of the river mouth and increased south of the river mouth after the MEC. The adjustment of nutrient supplement caused the corresponding variant condition of phytoplankton growth and led to the variation of chlorophyll concentration. However, due to the consumption of phytoplankton and the potential phosphate limiting condition (Huang et al., 2007; Yang et al., 2013), the nutrient concentration further varied in the shelf region. The DIN concentration decreased and the phosphate concentration increased in the northeast, whereas the DIN concentration increased and the phosphate concentration decreased in the south. The sustenance of phytoplankton biomass relied on the biological recycling in the shelf region (Wang et al., 2019a). Hence, the far-field modulation of chlorophyll maximum alternatively occurred under this effect.
Effect of the Mega Estuarine Constructions-Induced Suspended Sediment Concentration Variation
The numerical results of suspended sediments indicated that the suspended sediment concentration decreased northeast of the river mouth and increased south of the river mouth after the MEC. The changed suspended sediment concentration regulated the turbidity distribution, which has a significant influence on the phytoplankton growth in the estuarine area (Kromkamp and Peene, 1995; Horemans et al., 2020). Zhu et al. (2009) demonstrated that high turbidity restrained the phytoplankton growth at the Changjiang River mouth, and a good correlation between turbidity and phytoplankton biomass can be established through seasonal field observations adjacent to the Changjiang River Estuary. Wang et al. (2019a) argued that the turbidity front could be the inner boundary of the surface phytoplankton maximum region under the plume regulating mechanisms. These are reasons we believe that the suspended sediment redistribution induced by the constructions of mega projects could adjust the light condition of phytoplankton growth.
The dynamic mechanisms of why the suspended sediments concentration distribution was changed were beyond the focus of this study; hence, readers are referred to previous studies (e.g., Zhu L. et al., 2016; Xie et al., 2017; Teng et al., 2021). Basically, it is a consequence of the change of currents. Our simulated results of euphotic depth exhibited the variations at the river mouth under the MEC. The euphotic depth deepened northeast of the river mouth and shoaled south of the river mouth. In addition, the corresponding chlorophyll variation was also coupled with the variation of light condition (Figures 8A, 9A). However, it is notable that the numerical results of suspended sediment variations occurred mainly at the river mouth. Therefore, the modulation of plume structure and adjustment of nutrient condition should play a more important role in the variation of chlorophyll concentration on the shelf.
Besides the alternation of the growth environment of phytoplankton, the regulation of hydrodynamics could also induce the redistribution of phytoplankton. One representative hydrodynamic feature is the front. Previous studies suggested that algal blooms are prone to emerge in the front region (Franks, 1992; Tang et al., 2003). Phytoplankton blooms are often associated with fronts not only because of the optimal growth environment but also since hydrodynamics transport phytoplankton horizontally and aggregates phytoplankton in the front region (Tang et al., 2006; Wang et al., 2019b; Li et al., 2021). After the MEC, the plume structure was modulated, and the front region should also be dislocated. The simulated results showed that the front of the river plume migrated landward in the northeastward extension and moved seaward in the southward extension. It could also be one reason for the modulation of chlorophyll distribution.
Effect of the Three Gorges Dam-Induced Freshwater and Sediment Flux Variations
The well-known TGD was closed in 2003, hence, it is reasonable to infer that this huge riverine project could also influence the dynamics and environment in the estuary. In fact, previous studies often attributed many observed phenomena around the estuary to the influence of TGD (Chen et al., 2012). The MEC was constructed in a similar period as the TGD, hence, it is questionable to simply draw a conclusion that the observed changes must be a result of the TGD.
To clarify their relative significance, extra numerical experiments were conducted regarding the effect of the TGD. The first one was configured by altering the river discharge (Exp. 3 in Table 1), while the second one was set up by altering both the water discharge and sediment discharge (Exp. 4 in Table 1). The TGD-induced river runoff change was quantified with the method of Wu et al. (2018). The runoff difference was calculated by subtracting the monthly discharge in the period before the TGD construction (1950–2002) from the monthly river discharge since then (2003–2016) (Figure 10). Then, this difference was added to the realistic runoff in 2016. It was noted that after the completion of the TGD, the monthly discharge change increased from December to March (most notably in March, with an increase of ∼3,000 m3/s), whereas, it decreased from April to November. It was reported that after the TGD, the sediment flux was reduced from ∼4.1×10⁸tons/year to ∼1.2 × 10⁸tons/year (Yang et al., 2015). The TGD-induced sediment flux change was considered in Exp. 4. The upstream sediment flux in Exp. 4 is three times of that in Exp. 3.
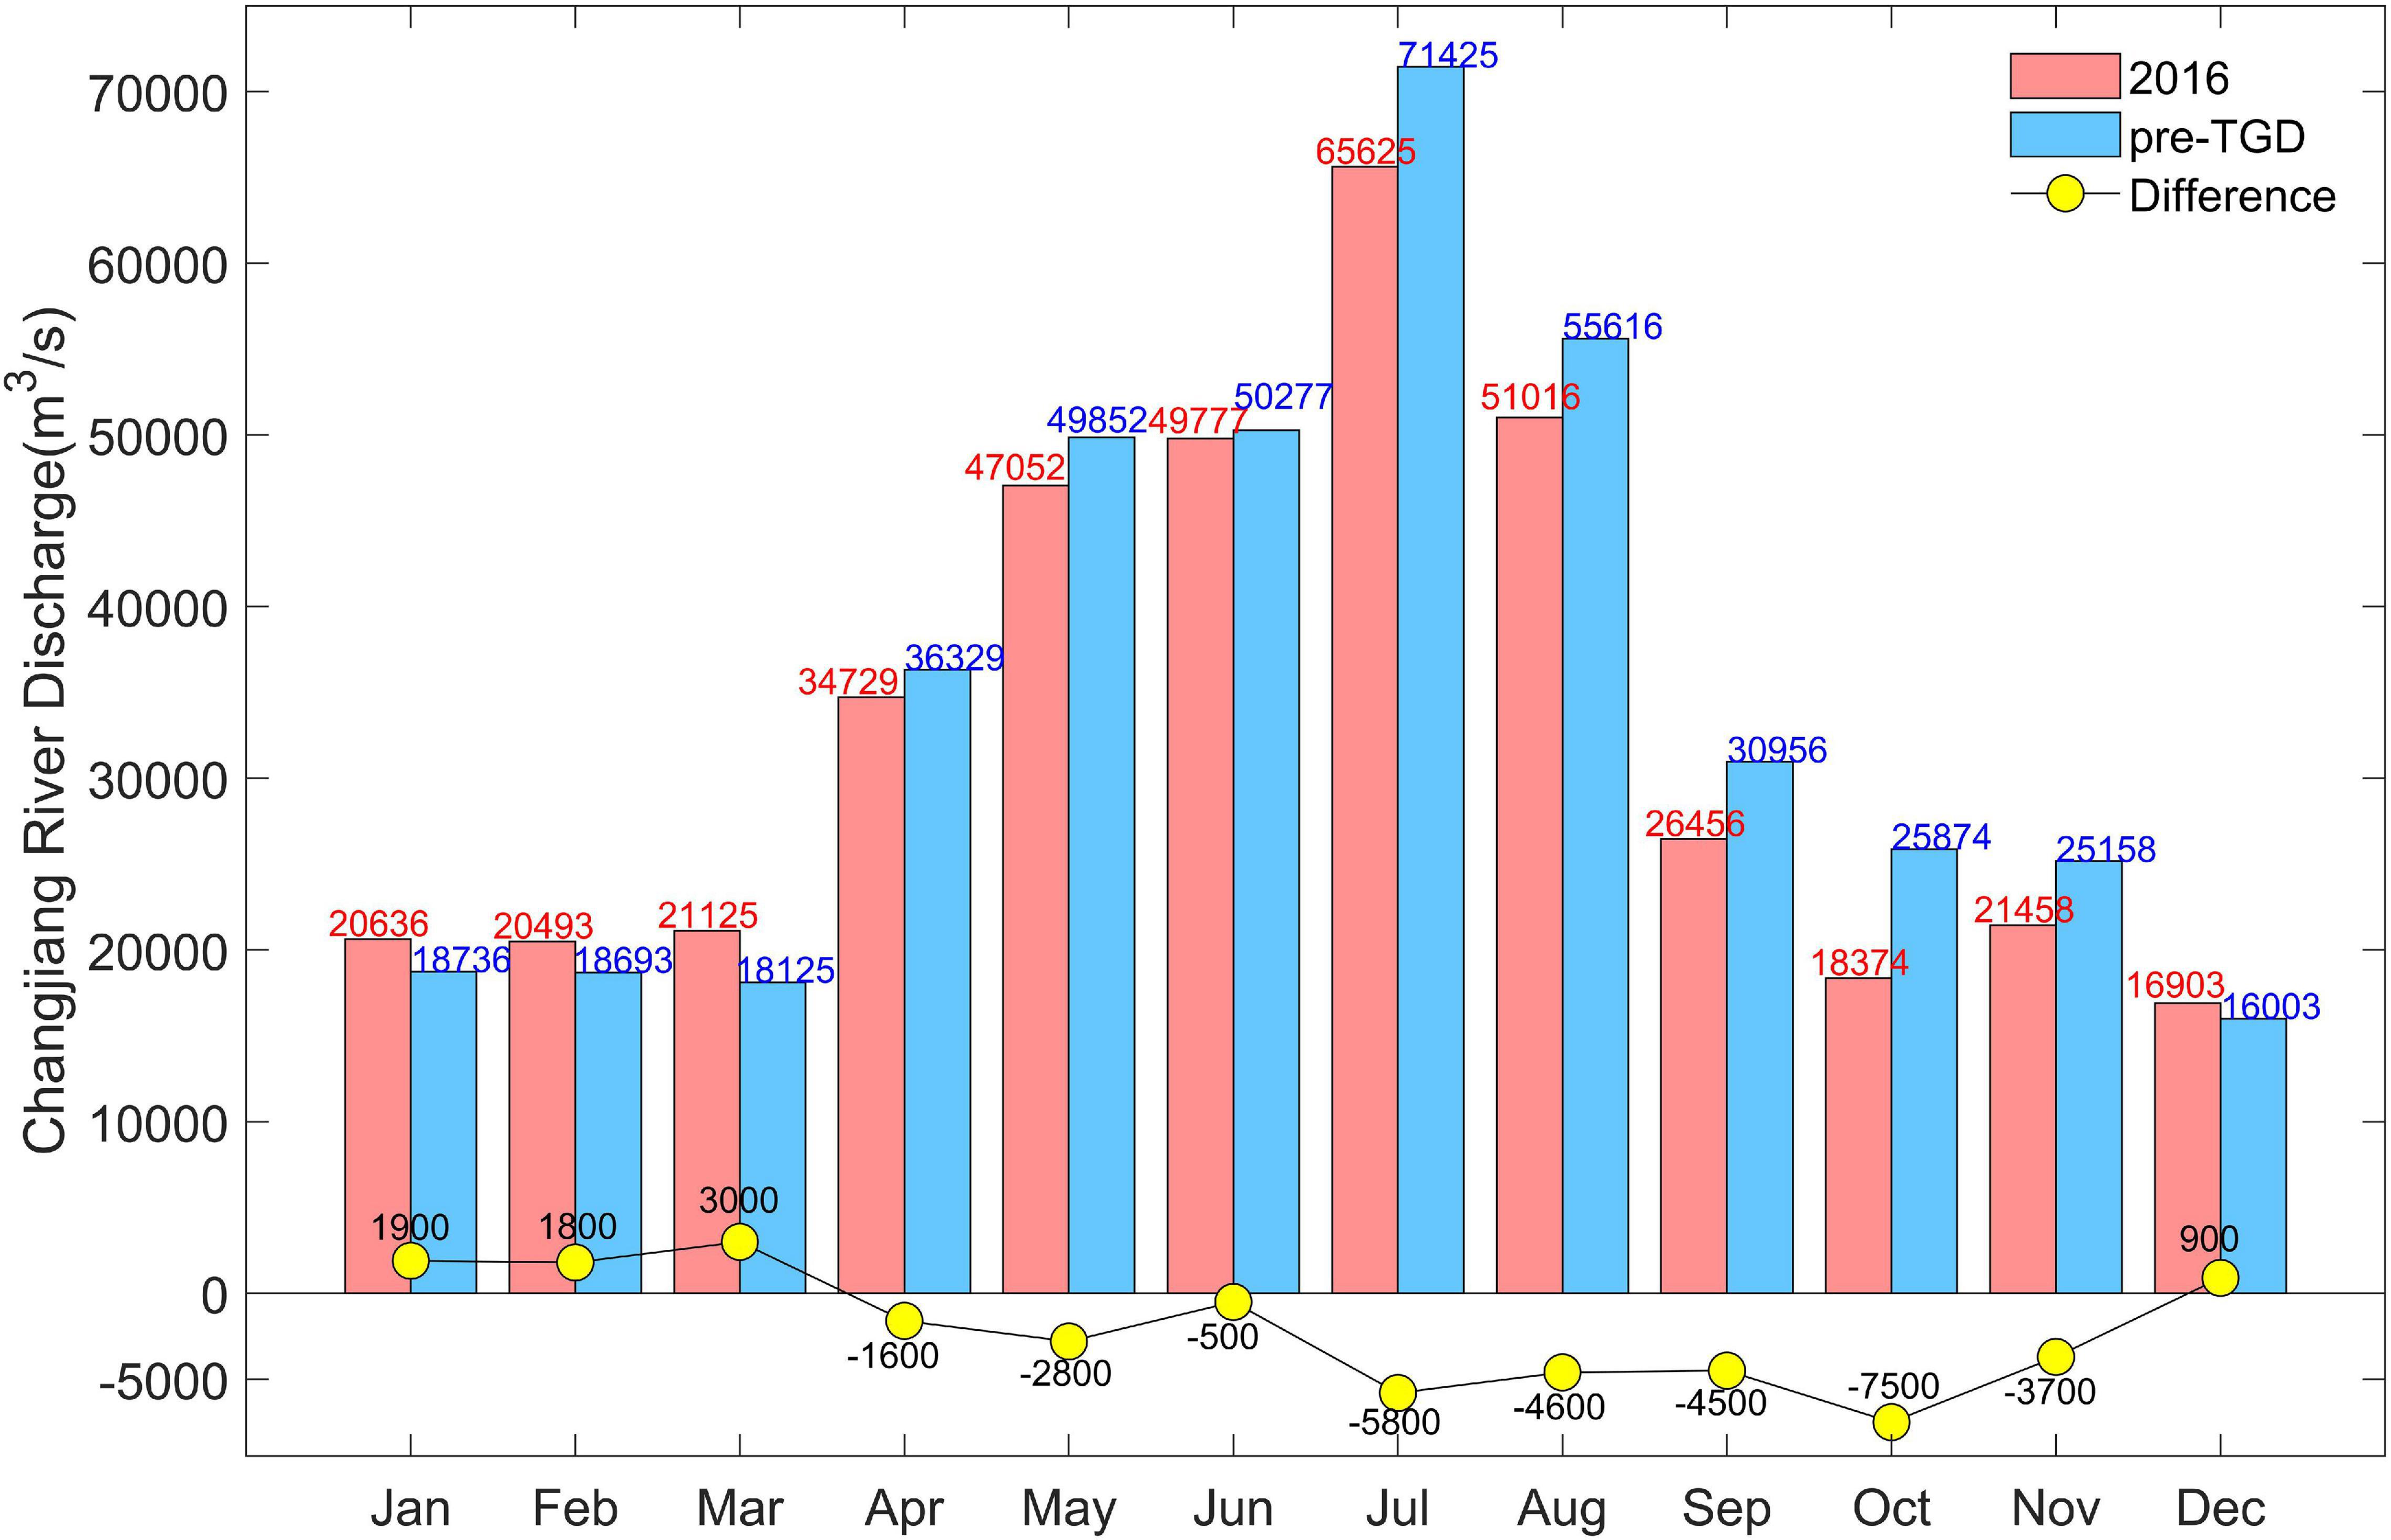
Figure 10. Monthly Changjiang River discharges in 1950–2002 (before the TGD period, blue pillars) and in 2003–2015 (after TGD period, red pillars), respectively, and the yellow dots indicate the difference (red pillars minus blue pillars).
The results of numerical experiments revealed that the surface chlorophyll maximum also migrated landward under the effect of TGD (Figures 11A–C), which was similar to the consequence of the MEC (Figure 6C). However, their differences were that the chlorophyll maximum on the southward plume branch also migrated landward after the TGD. On the other hand, the chlorophyll maximum area expanded landward both in the northeast and south parts of the estuary after the TGD (Figure 11C). Nevertheless, it should be emphasized that the TGD-induced variation was weaker than that due to the MEC (Figures 6C, 11C). The surface salinity slightly increased and suspended sediment concentration decreased in the Changjiang River Estuary and its adjacent water after the TGD if only considering the change of runoff (Figures 11D–I). Even considering the change of sediment flux caused by the TGD (Exp. 4), the chlorophyll concentration in the Changjiang River Estuary was still only slightly affected (Figure 12). The chlorophyll differences with Exp. 4 minus Exp. 3 were 2 orders of magnitude less than the differences with Exp. 1 minus Exp. 3.
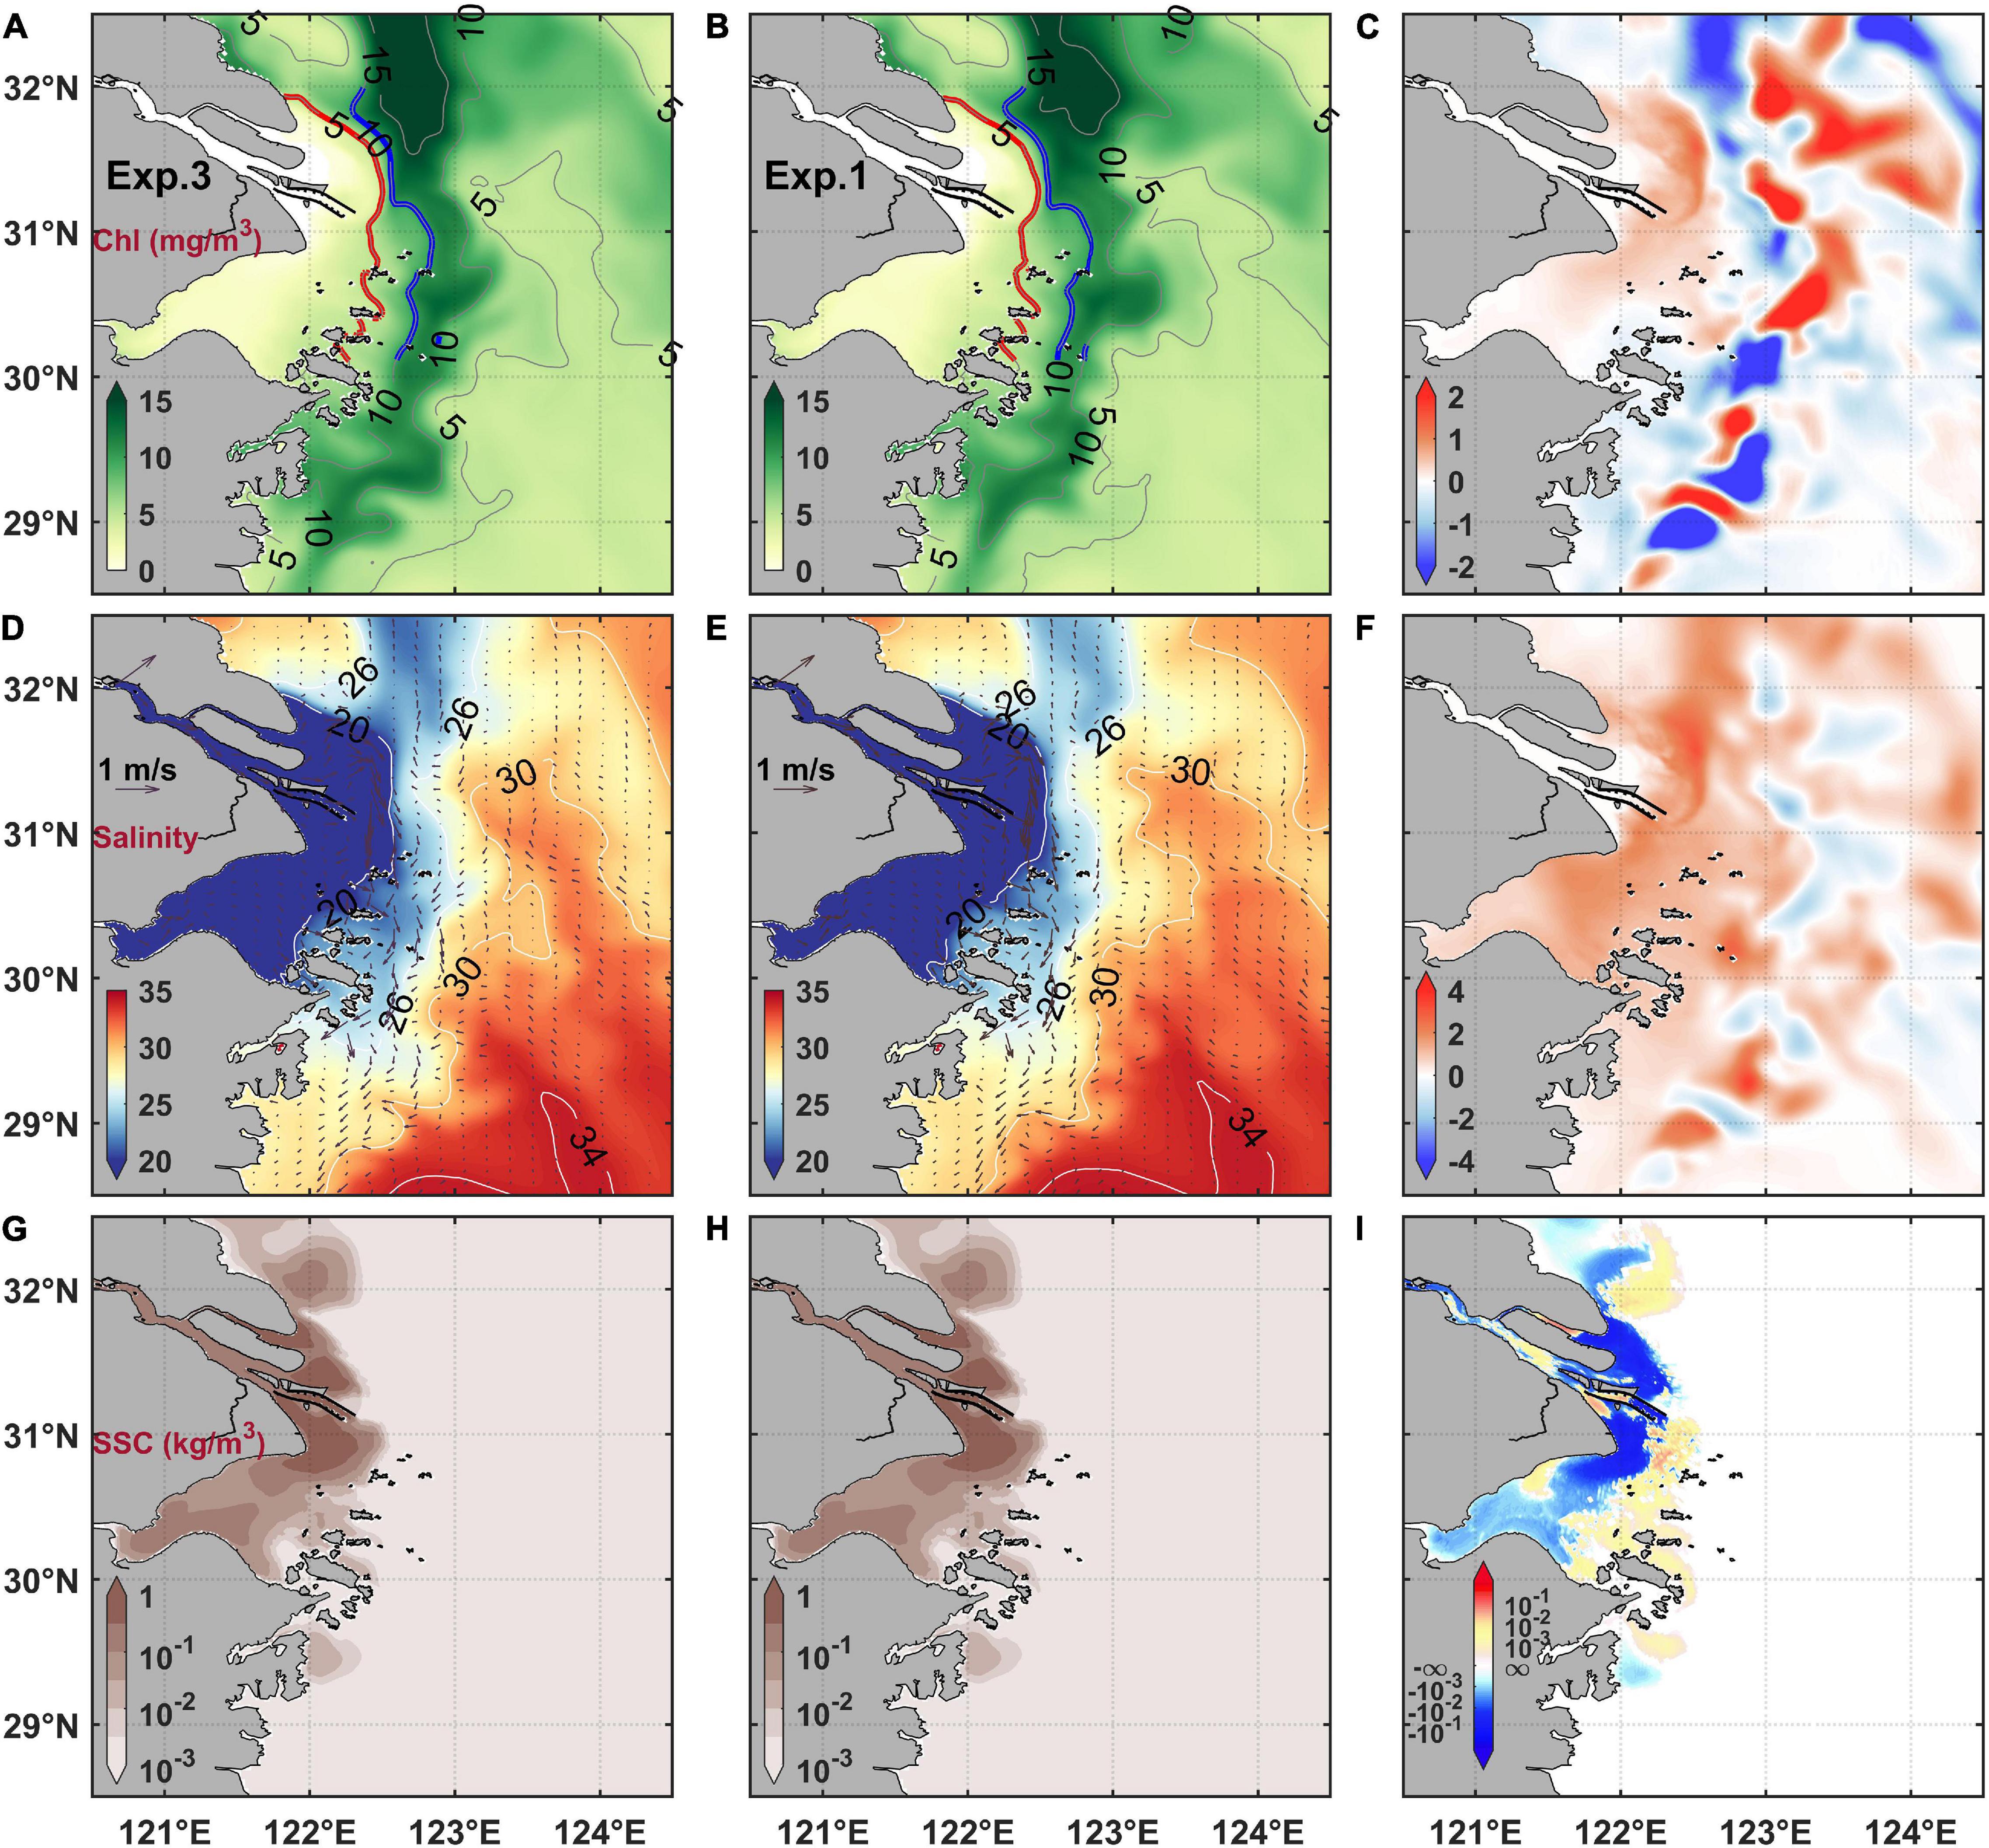
Figure 11. Changes of chlorophyll concentration (A–C), salinity (D–F), and suspended sediment concentration (G–I) under the TGD-induced discharge change. The left column (A,D,G) are results with discharge subtracting the TGD influence (i.e., Exp. 3), the middle column (B,E,H) are results with realistic discharge (i.e., Exp. 1), and the right column are their difference (Exp. 1 minus Exp. 3).
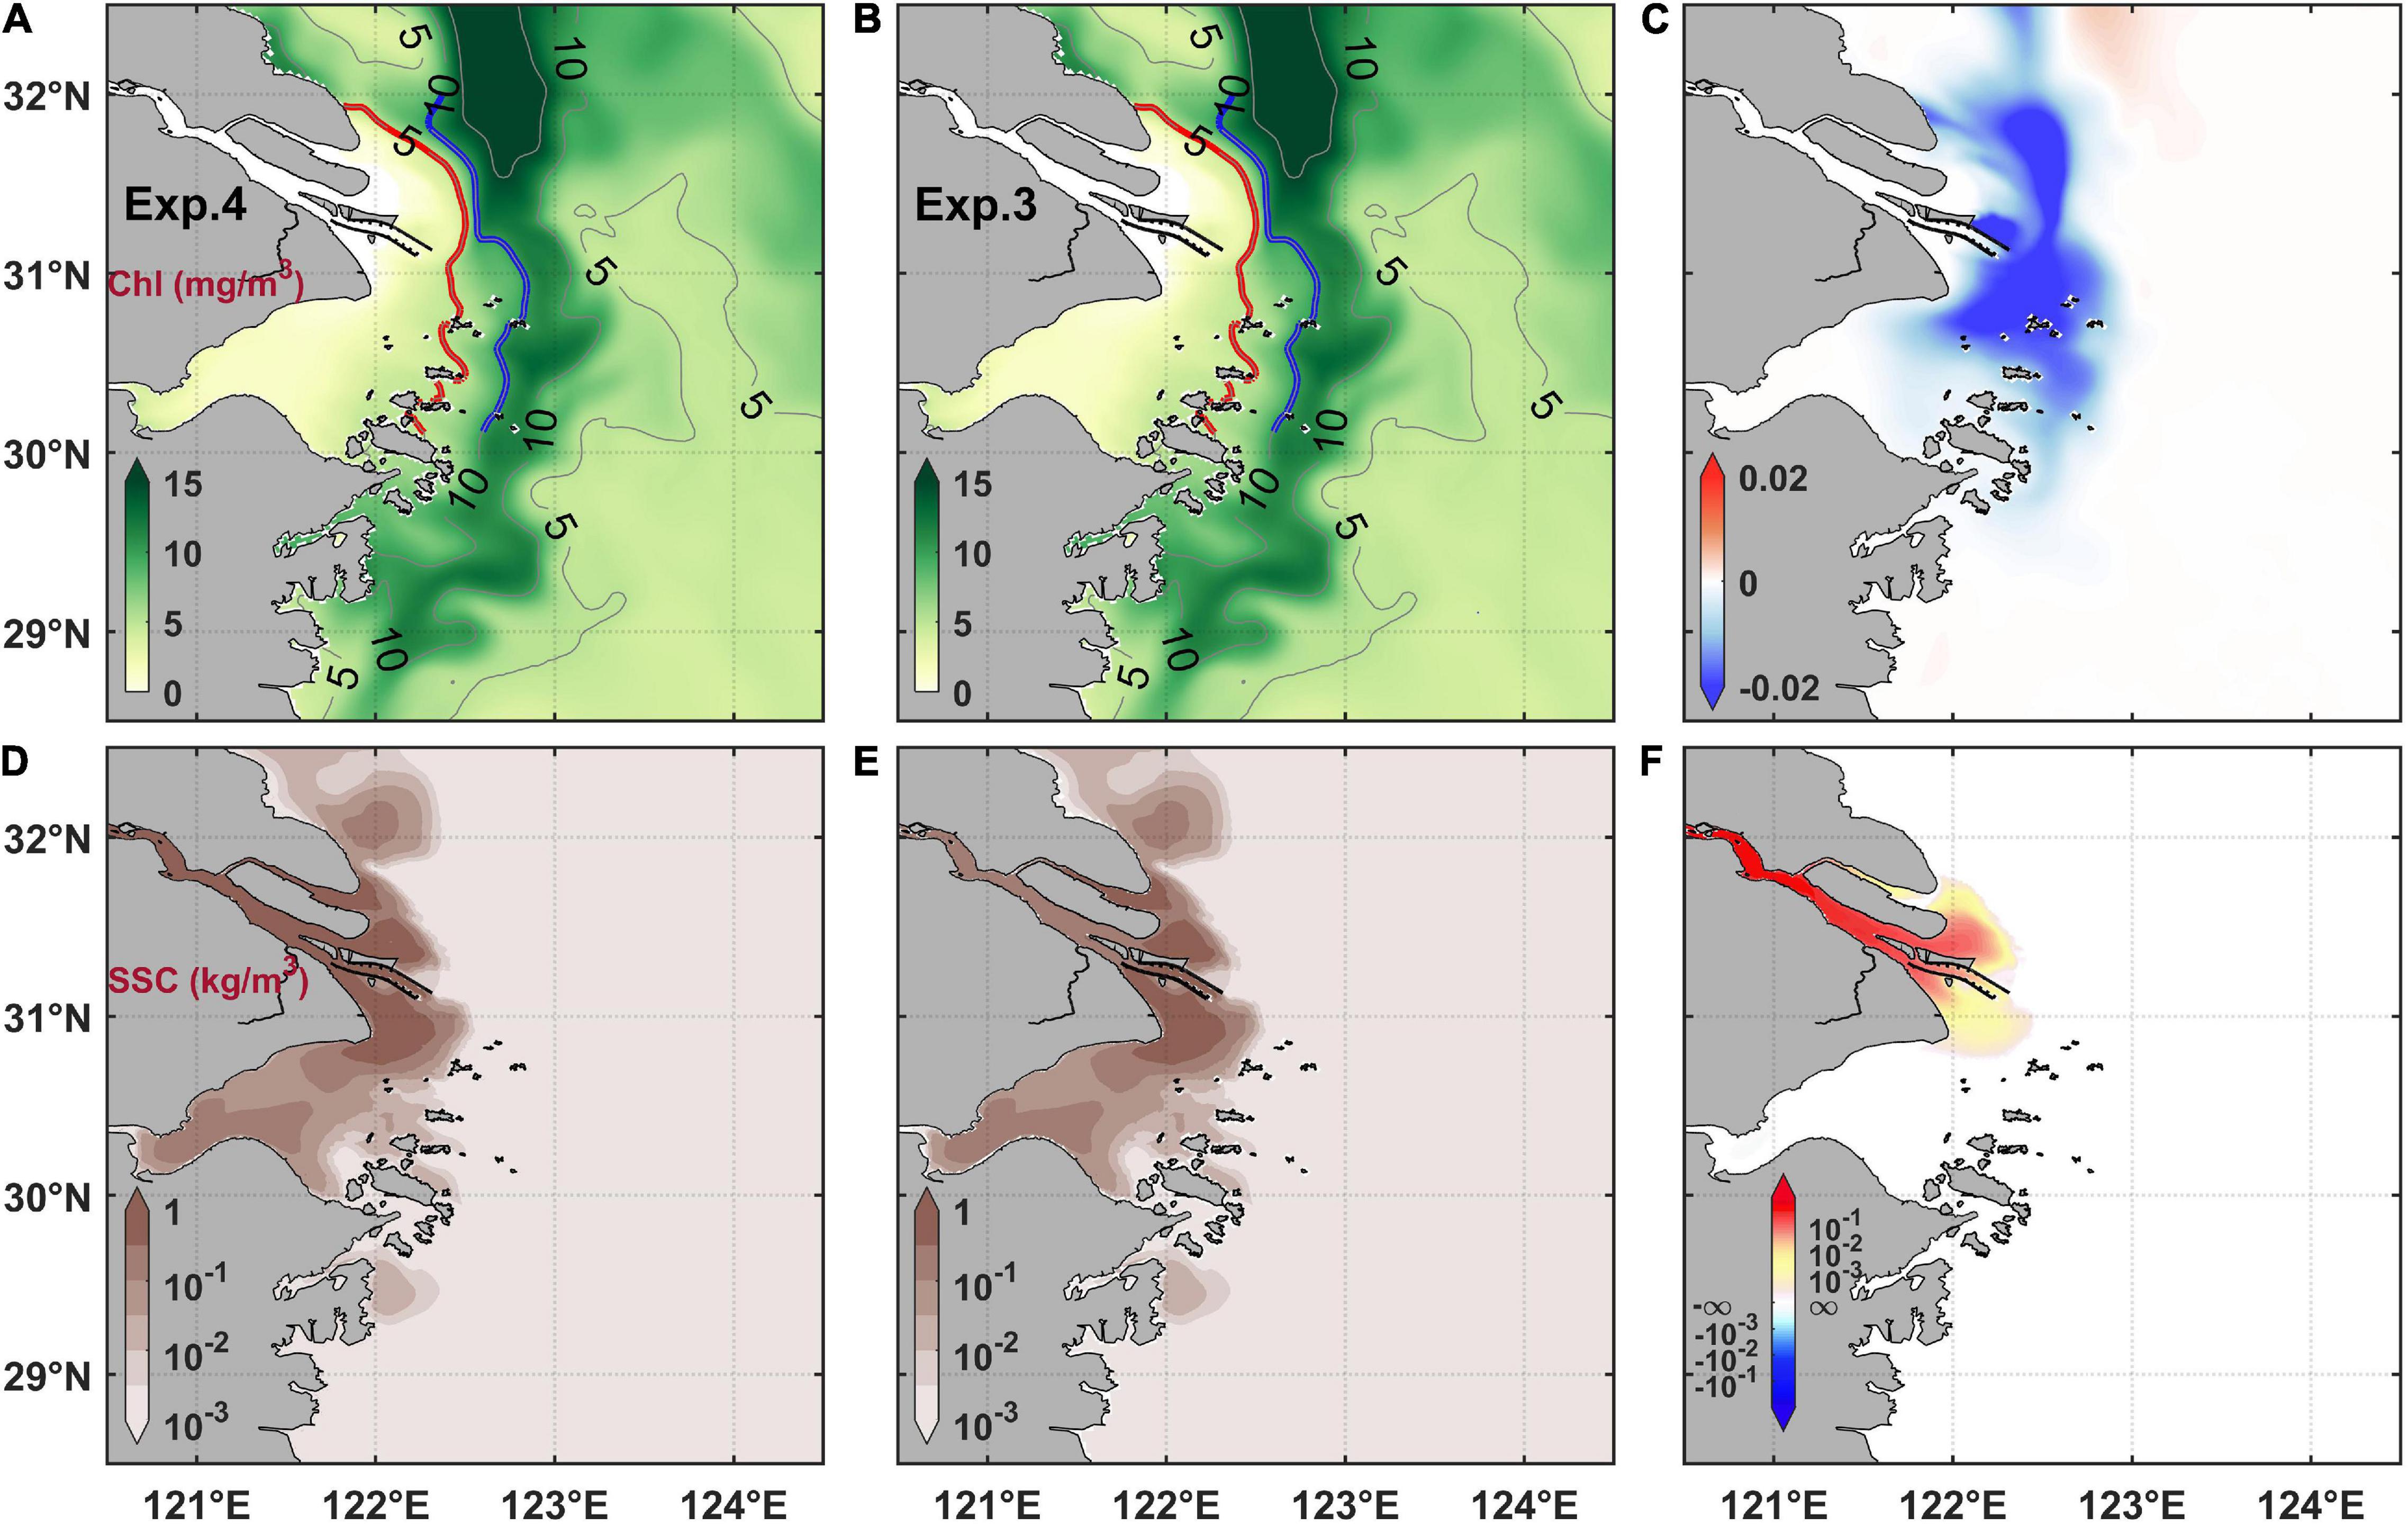
Figure 12. Changes of chlorophyll concentration (A–C) and suspended sediment concentration (D–F) under the TGD-induced sediments flux change. The left column (A,D) are results with pre-TGD sediments flux (i.e., Exp. 4), the middle column (B,E) are results with post-TGD sediments flux (i.e. Exp. 3), and the right column are their difference (Exp. 4 minus Exp. 3).
Some previous studies suggested that the decrease of watershed sediment flux induced by TGD has caused a decline of suspended sediment concentration in the Changjiang River Estuary (Hu et al., 2009; Li et al., 2012; Yang et al., 2015). However, some others demonstrated that there is still a deposition tendency in the delta area though the numerous watershed constructions have been built (Dai et al., 2014; Zhu L. et al., 2016). The long and short-term influences of TGD and other riverine constructions on the estuary are uncertain with controversy and is beyond the focus of this study. Here in this study, we only simplify the influence of TGD on the variations of the freshwater amount and watershed sediment flux. The subsequent transformation of bed sediment load is out of consideration. The long-term influence of TGD on the sediment variation in the estuary and the further influence on the ecosystem still need more exploration.
Nevertheless, our model results demonstrated that even the load of runoff and sediment flux changed significantly after the TGD, their influence on the plume diversion and suspended sediments concentration might not be seen immediately. Hence, the influence on the spatial phytoplankton variation could be less significant than expected.
Limitations
Based on the long-term trend of satellite-derived chlorophyll data and numerical modeling, we discussed the potential effects of engineering constructions. However, in such a complex circumstance, the mechanisms controlling the phytoplankton distribution and its interannual variation are far more complex.
The growth and distribution of phytoplankton in the estuaries are mainly affected by ecological and hydrodynamic factors such as nutrient, temperature, turbidity, and current. The variation of the estuarine ecological environment and hydrodynamics is determined by riverine and oceanic processes and sources, which are complicatedly influenced by climatic variation and anthropogenic factors. For riverine factors, previous studies have demonstrated that the variation of nutrient load and component has regulated the phytoplankton species and biomass in the Changjiang River Estuary (Tang et al., 2006; Zhou et al., 2019; Xu et al., 2020). The nitrogen and phosphorous concentrations and their ratio (N/P) in the persistent riverine load increased for a few decades, but silicon level remained constant (Jiang et al., 2014), which caused an alternation of dominant phytoplankton species from diatom to dinoflagellate and a significant biomass increase trend that is sustained in the East China Sea (Zhou et al., 2017; Ge et al., 2020). Regarding oceanic factors, for instance, Yang et al. (2013) suggested that the nutrient supplement induced by Kuroshio subsurface water intrusion partially influences the phytoplankton uptake and the distribution of primary production adjacent to the Changjiang River Estuary. Jiang et al. (2014) suggested that the variations of the summer phytoplankton community are highly related to the spatiotemporal variability in physiochemical properties that are controlled by the Taiwan Warm Current, which is the continuation of the Kuroshio intrusion on the shelf. It is reported that the intensity of the Kuroshio intrusion is also influenced by El Niño-Southern Oscillation and Pacific Decadal Oscillation (Qiu and Lukas, 1996; Wu, 2013), which has obvious interannual characteristics. The resultant interannual variation of sea surface temperature should also result in the response of phytoplankton growth (He et al., 2013).
Nevertheless, although this work can not completely answer the question of a long-term trend of phytoplankton variation in the Changjiang River Estuary, it highlighted the important influence of the MEC, which has been largely overlooked previously. The scale of estuarine projects will further expand in the foreseeable future. Hence, the result of this study reminds us to be very cautious about their potential consequences. More estuaries around the world are constructed with large-scale projects, and our study could provide a reference for other estuaries that also have mega constructions.
Summary
Through analyzing the harmful algal bloom events data from bulletins during 2000–2010 and the spatiotemporal probability of algal blooms derived from chlorophyll remote sensing data from 1998 to 2016, we investigated the long-term trend of algal bloom distribution in the Changjiang River Estuary and its adjacent water. The results showed that the frequency of algal blooms east and northeast of the Changjiang River mouth had been increased and the high-value region moved landward gradually after 2003. Then, by using the model simulation, we explored the mechanisms of this variation before and after the MEC.
After the MEC, the river plume extensions were deflected, which is one main reason for the regulation of environmental elements distribution and high chlorophyll concentration area. Northeast to the river mouth, the terrigenous nutrients export declined, the suspended sediment concentration decreased, and, consequently, the high chlorophyll concentration area moved landward after the MEC due to the weakening of northward river plume extension. In contrast, the southward river plume extension was enhanced, carrying more riverine nutrients to the vicinity of the Zhoushan Islands, thus the corresponding algal bloom hotspots moved seaward.
The impact of the TGD on the phytoplankton distribution outside the Changjiang River Estuary was also discussed through numerical experiments. The variations of the freshwater amount and sediment discharge due to TGD constructions were considered in the experiments. The results indicated that the river plume extension in the algal blooming season weakened, suspended sediment concentration decreased, and the high chlorophyll area integrally moved landward after the TGD, but these effects were less significant than that induced by the MEC.
Given the interaction of the above identified and unidentified processes, the phytoplankton distribution and its interannual variation in the estuarine area could be far more complex. Here in this study, we highlighted the influence of MEC on phytoplankton distribution, which could provide a new aspect on the long-term regulation of algal bloom in the coastal and estuarine area.
Data Availability Statement
The raw data supporting the conclusions of this article will be made available by the authors, without undue reservation.
Author Contributions
HW and YW designed the research and revised the manuscript. YH collected the remote sensing data, conducted the numerical experiments, and wrote an original draft of the manuscript. YH and YW analyzed the results. All authors contributed to the article and approved the submitted version.
Funding
This study was jointly supported by the project supported by the Innovation Program of Shanghai Municipal Education Commission (Grant No. 2021-01-07-00-08-E00102), the National Natural Science Foundation of China (Grant No. 42106162), Scientific Research Project of Shanghai Municipal Oceanic Bureau (Grant No. Huhaike-202105), and the Innovation Group Project of Southern Marine Science and Engineering Guangdong Laboratory (Zhuhai) (Grant No. 311020003).
Conflict of Interest
The authors declare that the research was conducted in the absence of any commercial or financial relationships that could be construed as a potential conflict of interest.
Publisher’s Note
All claims expressed in this article are solely those of the authors and do not necessarily represent those of their affiliated organizations, or those of the publisher, the editors and the reviewers. Any product that may be evaluated in this article, or claim that may be made by its manufacturer, is not guaranteed or endorsed by the publisher.
Acknowledgments
The sea surface wind and heat flux data obtained from European Centre for Medium-Range Weather Forecasts (ECMWF) are available at http://apps.ecmwf.int/datasets/. Initial and open ocean boundary conditions were derived from SODA at http://iridl.ldeo.columbia.edu/SOURCES/.CARTON-GIESE/.SODA/.v2p0p2-4/. The satellite-derived surface chlorophyll concentration data were obtained from the NASA Moderate Resolution Imaging Spectroradiometer (MODIS) and the Sea-viewing Wide Field-of-view Sensor (SeaWiFS) daily products at http://oceancolor.gsfc.nasa.gov/. And the instantaneous Geo-stationary Ocean Color Imager (GOCI) data and GOCI data processing system were obtained at http://kosc.kiost.ac.kr/.
Supplementary Material
The Supplementary Material for this article can be found online at: https://www.frontiersin.org/articles/10.3389/fmars.2021.791956/full#supplementary-material
References
Anderson, D. M., Glibert, P. M., and Burkholder, J. M. (2002). Harmful algal blooms and eutrophication: nutrient sources, composition, and consequences. Estuaries 25, 704–726. doi: 10.1007/Bf02804901
Bargu, S., Justic, D., White, J. R., Lane, R., Day, J., Paerl, H., et al. (2019). Mississippi River diversions and phytoplankton dynamics in deltaic Gulf of Mexico estuaries: a review. Estuar. Coast. Shelf Sci. 221, 39–52. doi: 10.1016/j.ecss.2019.02.020
Boesch, D. F. (2019). Barriers and bridges in abating coastal eutrophication. Front. Mar. Sci. 6:123. doi: 10.3389/fmars.2019.00123
Caffrey, J. M., Cloern, J. E., and Grenz, C. (1998). Changes in production and respiration during a spring phytoplankton bloom in San Francisco Bay, California, USA:implications for net ecosystem metabolism. Mar. Ecol. Prog. Ser. 172:1998. doi: 10.3354/meps172001
Chai, C., Yu, Z., Shen, Z., Song, X., Cao, X., and Yao, Y. (2009). Nutrient characteristics in the Yangtze River Estuary and the adjacent East China Sea before and after impoundment of the Three Gorges Dam. Sci. Total Environ. 407, 4687–4695. doi: 10.1016/j.scitotenv.2009.05.011
Chai, C., Yu, Z., Song, X., and Cao, X. (2006). The status and characteristics of eutrophication in the Yangtze River (Changjiang) Estuary and the adjacent East China Sea, China. Hydrobiologia 563, 313–328. doi: 10.1007/s10750-006-0021-7
Chen, C., Cowles, G., and Beardsley, R. C. (2006). An Unstructured Grid, Finite-Volume Coastal Ocean Model: FVCOM User Manual. SMAST/UMASSD Technical Report-06-0602, 2nd Edn. New Bedford, MA: School for Marine Science and Technology, University of Massachusetts Dartmouth, 315.
Chen, C. S., Zhu, J. R., Beardsley, R. C., and Franks, P. J. S. (2003). Physical-biological sources for dense algal blooms near the Changjiang river. Geophys. Res. Lett. 30, 405–414. doi: 10.1029/2002GL016391
Chen, J. Y., Pan, D. L., Liu, M. L., Mao, Z. H., Zhu, Q. K., Chen, N. H., et al. (2017). Relationships between long-term trend of satellite-derived chlorophyll-a and hypoxia off the Changjiang Estuary. Estuar. Coasts 40, 1055–1065. doi: 10.1007/s12237-016-0203-0
Chen, Y., Liu, R., Sun, C., Zhang, P., Feng, C., and Shen, Z. (2012). Spatial and temporal variations in nitrogen and phosphorous nutrients in the Yangtze River Estuary. Mar. Pollut. Bull. 64, 2083–2089. doi: 10.1016/j.marpolbul.2012.07.020
Cui, T. W., Zhang, J., Wang, K., Wei, J. W., Mu, B., Ma, Y., et al. (2020). Remote sensing of chlorophyll a concentration in turbid coastal waters based on a global optical water classification system. ISPRS J. Photogramm. Remote Sens. 163, 187–201. doi: 10.1016/j.isprsjprs.2020.02.017
Dai, Z. J., Liu, J. T., Wei, W., and Chen, J. Y. (2014). Detection of the Three Gorges Dam influence on the Changjiang (Yangtze River) submerged delta. Sci. Rep. 4:6600. doi: 10.1038/srep06600
Fan, W., and Song, J. B. (2014). A numerical study of the seasonal variations of nutrients in the Changjiang River estuary and its adjacent sea area. Ecol. Modell. 291, 69–81. doi: 10.1016/j.ecolmodel.2014.07.026
Franks, P. J. S. (1992). Phytoplankton blooms at fronts: patterns, scales, and physical forcing mechanisms. Rev. Aquat. Sci. 6, 121–137.
Gao, L., Li, D. J., and Zhang, Y. W. (2012). Nutrients and particulate organic matter discharged by the Changjiang (Yangtze River): seasonal variations and temporal trends. J. Geophys. Res. 117:G04001. doi: 10.1029/2012JG001952
Gao, X., and Song, J. (2005). Phytoplankton distributions and their relationship with the environment in the Changjiang Estuary, China. Mar. Pollut. Bull. 50, 327–335. doi: 10.1016/j.marpolbul.2004.11.004
Garvine, R. W. (2001). The impact of model configuration in studies of buoyant coastal discharge. J. Mar. Res. 59, 193–225. doi: 10.1357/002224001762882637
Ge, J. Z., Shi, S. Y., Liu, J., Xu, Y., Chen, C. S., Bellerby, R., et al. (2020). Interannual variabilities of nutrients and phytoplankton off the Changjiang Estuary in response to changing river inputs. J. Geophys. Res. Oceans 125:e2019JC015595. doi: 10.1029/2019JC015595
He, X. Q., Bai, Y., Pan, D. L., Chen, C. T. A., Cheng, Q., Wang, D. F., et al. (2013). Satellite views of the seasonal and interannual variability of phytoplankton blooms in the eastern China seas over the past 14 yr (1998–2011). Biogeosciences 10, 4721–4739. doi: 10.5194/bg-10-4721-2013
Horemans, D. M. L., Meire, P., and Cox, T. J. S. (2020). The impact of temporal variability in light-climate on time-averaged primary production and a phytoplankton bloom in a well-mixed estuary. Ecol. Modell. 436:109287. doi: 10.1016/j.ecolmodel.2020.109287
Hu, B. Q., Yang, Z. S., Wang, H. J., Sun, X. X., and Bi, N. S. (2009). Sedimentation in the Three Gorges Dam and its impact on the sediment flux from the Changjiang (Yangtze river), china. Hydrol. Earth Syst. Sci. Discuss. 6, 5177–5204. doi: 10.5194/hessd-6-5177-2009
Hu, C. M. (2009). A novel ocean color index to detect floating algae in the global oceans. Remote Sens. Environ. 113, 2118–2129. doi: 10.1016/j.rse.2009.05.012
Huang, B. Q., Ou, L. J., Wang, X. L., Huo, W. Y., Li, R. X., Hong, H. S., et al. (2007). Alkaline phosphatase activity of phytoplankton in East China Sea coastal waters with frequent harmful algal bloom occurrences. Aquat. Microb. Ecol. 49, 195–206. doi: 10.3354/ame01135
Humborg, C., Ittekkot, V., Cociasu, A., and VonBodungen, B. (1997). Effect of Danube River dam on Black Sea biogeochemistry and ecosystem structure. Nature 386, 385–388. doi: 10.1038/386385a0
Jiang, Z. B., Liu, J. J., Chen, J. F., Chen, Q. Z., Yan, X. J., Xuan, J. L., et al. (2014). Responses of summer phytoplankton community to drastic environmental changes in the Changjiang (Yangtze River) estuary during the past 50 years. Water Res. 54, 1–11. doi: 10.1016/j.watres.2014.01.032
Jiao, N., Zhang, Y., Zeng, Y., Gardner, W. D., Mishonov, A. V., Richardson, M. J., et al. (2007). Ecological anomalies in the East China Sea: impacts of the Three Gorges Dam? Water Res. 41, 1287–1293. doi: 10.1016/j.watres.2006.11.053
Kromkamp, J. C., and Peene, J. (1995). Possibility of net phytoplankton primary production in the turbid Schelde Estuary (SW Netherlands). Mar. Ecol. Prog. Ser. 121, 249–259. doi: 10.3354/meps121249
Le, C. F., Hu, C. M., Cannizzaro, J., English, D., Muller-Karger, F., and Lee, Z. (2013). Evaluation of chlorophyll-a remote sensing algorithms for an optically complex estuary. Remote Sens. Environ. 129, 75–89. doi: 10.1016/j.rse.2012.11.001
Li, D., Zhang, J., Huang, D., Wu, Y., and Liang, J. (2002). Oxygen depletion off the Changjiang (Yangtze River) estuary. Sci. China Ser. D Earth Sci. 45, 1137–1146.
Li, J., and Zhang, C. (1998). Sediment resuspension and implications for turbidity maximum in the Changjiang Estuary. Mar. Geol. 148, 117–124.
Li, P., Yang, S. L., Milliman, J. D., Xu, K. H., Qin, W. H., Wu, C. S., et al. (2012). Spatial, temporal, and human-induced variations in suspended sediment concentration in the surface waters of the Yangtze Estuary and adjacent coastal areas. Estuar. Coasts 35, 1316–1327. doi: 10.1007/s12237-012-9523-x
Li, W. Q., Ge, J. Z., Ding, P. X., Ma, J. F., Glibert, P. M., and Liu, D. Y. (2021). Effects of dual fronts on the spatial pattern of Chlorophyll-a concentrations in and off the Changjiang River estuary. Estuar. Coasts 44, 1408–1418. doi: 10.1007/s12237-020-00893-z
Liang, Y. (2012). China’s Red Tide Disaster Survey and Evaluation (1933-2009). Beijing: Ocean Press. (In Chinese).
Lin, J. (2011). A modeling Study of the Phytoplankton Dynamics off the Changjiang Estuary (in Chinese). Shanghai: East China Normal University.
Liu, X., Huang, B. Q., Huang, Q., Wang, L., Ni, X. B., Tang, Q. S., et al. (2015). Seasonal phytoplankton response to physical processes in the southern Yellow Sea. J. Sea Res. 95, 45–55. doi: 10.1016/j.seares.2014.10.017
Luan, H. L., Ding, P. X., Wang, Z. B., Ge, J. Z., and Yang, S. L. (2016). Decadal morphological evolution of the Yangtze Estuary in response to river input changes and estuarine engineering projects. Geomorphology 265, 12–23. doi: 10.1016/j.geomorph.2016.04.022
Luo, Z. F., Zhu, J. R., Wu, H., and Li, X. Y. (2017). Dynamics of the sediment plume over the Yangtze Bank in the Yellow and East China Seas. J. Geophys. Res. Oceans 122, 10073–10090. doi: 10.1002/2017jc013215
Ma, G. F., Shi, F. Y., Liu, S. G., and Qi, D. M. (2013). Migration of sediment deposition due to the construction of large-scale structures in Changjiang Estuary. Appl. Ocean Res. 43, 148–156. doi: 10.1016/j.apor.2013.09.002
May, C. L., Koseff, J. R., Lucas, L. V., Cloern, J. E., and Schoellhamer, D. H. (2003). Effects of spatial and temporal variability of turbidity on phytoplankton blooms. Mar. Ecol. Prog. Ser. 254, 111–128. doi: 10.3354/meps254111
Meng, J., Yao, P., Yu, Z., Bianchi, T. S., Zhao, B., Pan, H., et al. (2014). Speciation, bioavailability and preservation of phosphorus in surface sediments of the Changjiang Estuary and adjacent East China Sea inner shelf. Estuar. Coast. Shelf Sci. 144, 27–38. doi: 10.1016/j.ecss.2014.04.015
Morel, A. (1988). Optical modeling of the upper ocean in relation to its biogenous matter content (case I waters). J. Geophys. Res. 93:10749. doi: 10.1029/JC093iC09p10749
Murphy, A. H. (1988). Skill scores based on the mean square error and their relationships to the correlation coefficient. Mon. Weather Rev. 116, 2417–2424. doi: 10.1175/1520-049319881162.0.CO;2
Nichols, F. H., Cloern, J. E., Luoma, S. N., and Peterson, D. H. (1986). The modification of an estuary. Science 231, 567–573. doi: 10.1126/science.231.4738.567
Pelletier, M., El-Fityani, T., Graham, A., Rutter, A., Michelutti, N., Zeng, D. M., et al. (2016). Tracking pesticide use in the Saint Lawrence River and its ecological impacts during the World Exposition of 1967 in Montreal, Canada. Sci. Total Environ. 572, 498–507. doi: 10.1016/j.scitotenv.2016.08.064
Polikarpov, I., Al-Yamani, F., Petrov, P., Saburova, M., Mihalkov, V., and Al-Enezi, A. (2021). Phytoplankton bloom detection during the COVID-19 lockdown with remote sensing data: using Copernicus Sentinel-3 for north-western Arabian/Persian Gulf case study. Mar. Pollut. Bull. 171:112734. doi: 10.1016/j.marpolbul.2021.112734
Qiu, B., and Lukas, R. (1996). Seasonal and interannual variability of the North Equatorial Current, the Mindanao Current, and the Kuroshio along the Pacific western boundary. J. Geophys. Res. Oceans 101, 12315–12330. doi: 10.1029/95jc03204
Ralph, P. J., Durako, M. J., Enriquez, S., Collier, C. J., and Doblin, M. A. (2007). Impact of light limitation on seagrasses. J. Exp. Mar. Biol. Ecol. 350, 176–193. doi: 10.1016/j.jembe.2007.06.017
Shen, F., Tang, R. G., Sun, X. R., and Liu, D. Y. (2019). Simple methods for satellite identification of algal blooms and species using 10-year time series data from the East China Sea. Remote Sens. Environ. 235:111484. doi: 10.1016/j.rse.2019.111484
Shen, F., Zhou, Y. X., Li, D. J., Zhu, W. J., and Salama, M. S. (2010). Medium resolution imaging spectrometer (MERIS) estimation of chlorophyll-a concentration in the turbid sediment-laden waters of the Changjiang (Yangtze) Estuary. Int. J. Remote Sens. 31, 4635–4650. doi: 10.1080/01431161.2010.485216
Shen, L., Xu, H., Guo, X., and Li, M. (2011). Characteristics of large-scale harmful algal blooms (HABs) in the Yangtze River Estuary and the adjacent East China Sea (ECS) from 2000 to 2010. J. Environ. Prot. 02, 1285–1294. doi: 10.4236/jep.2011.210148
Siswanto, E., Tang, J., Yamaguchi, H., Ahn, Y.-H., Ishizaka, J., Yoo, S., et al. (2011). Empirical ocean-color algorithms to retrieve chlorophyll-a, total suspended matter, and colored dissolved organic matter absorption coefficient in the Yellow and East China Seas. J. Oceanogr. 67, 627–650. doi: 10.1007/s10872-011-0062-z
Son, Y. S., and Kim, H. C. (2018). Empirical ocean color algorithms and bio-optical properties of the western coastal waters of Svalbard, Arctic. ISPRS J. Photogramm. Remote Sens. 139, 272–283. doi: 10.1016/j.isprsjprs.2018.03.024
Statham, P. J. (2012). Nutrients in estuaries — an overview and the potential impacts of climate change. Sci. Total Environ. 434, 213–227. doi: 10.1016/j.scitotenv.2011.09.088
Strickland, J. D. H. (1958). Solar radiation penetrating the ocean. A review of requirements, data and methods of measurement, with particular reference to photosynthetic productivity. J. Fish Res. Board Can. 15, 453–493. doi: 10.1139/f58-022
Tang, D. L., Di, B. P., Wei, G. F., Ni, I. H., Oh, I. S., and Wang, S. F. (2006). Spatial, seasonal and species variations of harmful algal blooms in the South Yellow Sea and East China Sea. Hydrobiologia 568, 245–253. doi: 10.1007/s10750-006-0108-1
Tang, D. L., Kester, D. R., Ni, I. H., Qi, Y. Z., and Kawamura, H. (2003). In situ and satellite observations of a harmful algal bloom and water condition at the Pearl River estuary in late autumn 1998. Harmful Algae 2, 89–99. doi: 10.1016/S1568-9883(03)00021-0
Tassan, S. (1994). Local algorithms using SeaWiFS data for the retrieval of phytoplankton, pigments, suspended sediment, and yellow substance in coastal waters. Appl. Opt. 33, 2369–2378. doi: 10.1364/ao.33.002369
Teng, L. Z., Cheng, H. Q., de Swart, H. E., Dong, P., Li, Z. H., Li, J. F., et al. (2021). On the mechanism behind the shift of the turbidity maximum zone in response to reclamations in the Yangtze (Changjiang) Estuary. China. Mar. Geol. 440:106569. doi: 10.1016/j.margeo.2021.106569
The Changjiang Water Resources Commission [CWRC] of The Ministry of Water Resources (2016). Changjiang Sediment Bulletin. Available online at: http://www.cjw.gov.cn/zwzc/bmgb (accessed December 21, 2021).
The Ministry of Natural Resources of the People’s Republic of China (2010). Bulletin of China Marine Disasters. Available online at: http://www.mnr.gov.cn/sj/sjfw/hy/gbgg/zghyzhgb/ (accessed December 21, 2021).
Van Maren, D. S., Van Kessel, T., Cronin, K., and Sittoni, L. (2015). The impact of channel deepening and dredging on estuarine sediment concentration. Cont. Shelf Res. 95, 1–14. doi: 10.1016/j.csr.2014.12.010
Wang, J., and Wu, J. (2009). Occurrence and potential risks of harmful algal blooms in the East China Sea. Sci. Total Environ. 407, 4012–4021. doi: 10.1016/j.scitotenv.2009.02.040
Wang, Y. H., Wu, H., Lin, J., Zhu, J. R., Zhang, W. X., and Li, C. (2019a). Phytoplankton blooms off a high turbidity estuary: a case study in the Changjiang River Estuary. J. Geophys. Res. Oceans 124, 8036–8059. doi: 10.1029/2019jc015343
Wang, Y. H., Wu, H., Gao, L., Shen, F., and Liang, X. S. (2019b). Spatial distribution and physical controls of the spring algal blooming off the Changjiang River Estuary. Estuar. Coasts 42, 1066–1083. doi: 10.1007/s12237-019-00545-x
Wang, X. G., Su, F. Z., Zhang, J. J., Cheng, F., Hu, W. Q., and Ding, Z. (2019c). Construction land sprawl and reclamation in the Johor River Estuary of Malaysia since 1973. Ocean Coast. Manag. 171, 87–95. doi: 10.1016/j.ocecoaman.2019.01.006
Wang, Y., Liu, D., Xiao, W., Zhou, P., Tian, C., Zhang, C., et al. (2021). Coastal eutrophication in China: trend, sources, and ecological effects. Harmful Algae 107:102058. doi: 10.1016/j.hal.2021.102058
Wu, C. R. (2013). Interannual modulation of the Pacific decadal oscillation (PDO) on the low-latitude western North Pacific. Prog. Oceanogr. 110, 49–58. doi: 10.1016/j.pocean.2012.12.001
Wu, H., Wu, T. N., and Bai, M. (2018). Mega estuarine constructions modulate the Changjiang River plume extension in adjacent seas. Estuar. Coasts 41, 1234–1252. doi: 10.1007/s12237-017-0357-4
Wu, H., Zhu, J. R., and Choi, B. H. (2010). Links between saltwater intrusion and subtidal circulation in the Changjiang Estuary: a model-guided study. Cont. Shelf Res. 30, 1891–1905. doi: 10.1016/j.csr.2010.09.001
Wu, H., Zhu, J. R., Shen, J., and Wang, H. (2011). Tidal modulation on the Changjiang River plume in summer. J. Geophys. Res. Oceans 116:C08017. doi: 10.1029/2011jc007209
Wu, J., Liu, J. T., and Wang, X. (2012). Sediment trapping of turbidity maxima in the Changjiang Estuary. Mar. Geol. 303, 14–25.
Wu, T. N., and Wu, H. (2018). Tidal mixing sustains a bottom-trapped river plume and buoyant coastal current on an energetic continental shelf. J. Geophys. Res. Oceans 123, 8026–8051. doi: 10.1029/2018jc014105
Xian, W., Kang, B., and Liu, R. (2005). Jellyfish blooms in the Yangtze Estuary. Science 307:41c. doi: 10.1126/science.307.5706.41c
Xie, D. F., Pan, C., Wu, X. G., Gao, S., and Wang, Z. B. (2017). The variations of sediment transport patterns in the outer Changjiang Estuary and Hangzhou Bay over the last 30 years. J. Geophys. Res. Oceans 122, 2999–3020. doi: 10.1002/2016jc012264
Xu, L. J., Yang, D. Z., Greenwood, J., Feng, X. R., Gao, G. D., Qi, J. F., et al. (2020). Riverine and oceanic nutrients govern different algal bloom domain near the Changjiang Estuary in summer. J. Geophys. Res. Biogeosci. 125:e2020JG005727. doi: 10.1029/2020JG005727
Yang, D. Z., Yin, B. S., Sun, J. C., and Zhang, Y. (2013). Numerical study on the origins and the forcing mechanism of the phosphate in upwelling areas off the coast of Zhejiang province, China in summer. J. Mar. Syst. 123, 1–18. doi: 10.1016/j.jmarsys.2013.04.002
Yang, S. L., Xu, K. H., Milliman, J. D., Yang, H. F., and Wu, C. S. (2015). Decline of Yangtze River water and sediment discharge: impact from natural and anthropogenic changes. Sci. Rep. 5:12581. doi: 10.1038/srep12581
Yankovsky, A. E., and Chapman, D. C. (1997). A simple theory for the fate of buoyant coastal discharges. J. Phys. Oceanogr. 27, 1386–1401. doi: 10.1175/1520-048519970272.0.CO;2
Zhang, W. X., Wu, H., and Zhu, Z. Y. (2018). Transient hypoxia extent off Changjiang River Estuary due to mobile Changjiang River plume. J. Geophys. Res. Oceans 123, 9196–9211. doi: 10.1029/2018jc014596
Zhou, M. J., Shen, Z. L., and Yu, R. C. (2008). Responses of a coastal phytoplankton community to increased nutrient input from the Changjiang (Yangtze) River. Cont. Shelf Res. 28, 1483–1489.
Zhou, Z. X., Yu, R. C., Sun, C. J., Feng, M., and Zhou, M. J. (2019). Impacts of Changjiang River discharge and Kuroshio intrusion on the Diatom and Dinoflagellate blooms in the East China Sea. J. Geophys. Res. Oceans 124, 5244–5257. doi: 10.1029/2019jc015158
Zhou, Z. X., Yu, R. C., and Zhou, M. J. (2017). Seasonal succession of microalgal blooms from diatoms to dinoflagellates in the East China Sea: a numerical simulation study. Ecol. Modell. 360, 150–162. doi: 10.1016/j.ecolmodel.2017.06.027
Zhu, J., Zhu, Z. Y., Lin, J., Wu, H., and Zhang, J. (2016). Distribution of hypoxia and pycnocline off the Changjiang Estuary, China. J. Mar. Syst. 154, 28–40. doi: 10.1016/j.jmarsys.2015.05.002
Zhu, L., He, Q., Shen, J., and Wang, Y. (2016). The influence of human activities on morphodynamics and alteration of sediment source and sink in the Changjiang Estuary. Geomorphology 273, 52–62. doi: 10.1016/j.geomorph.2016.07.025
Keywords: algal bloom hotspot, mega estuarine construction, Changjiang River Estuary, Three Gorges Dam, river plume dynamics, suspended sediments
Citation: He Y, Wang Y and Wu H (2022) Regulation of Algal Bloom Hotspots Under Mega Estuarine Constructions in the Changjiang River Estuary. Front. Mar. Sci. 8:791956. doi: 10.3389/fmars.2021.791956
Received: 09 October 2021; Accepted: 08 December 2021;
Published: 21 January 2022.
Edited by:
Alexander Yankovsky, University of South Carolina, United StatesReviewed by:
Bin Zhao, Ocean University of China, ChinaWei-dong Zhai, Shandong University (Qingdao), China
Copyright © 2022 He, Wang and Wu. This is an open-access article distributed under the terms of the Creative Commons Attribution License (CC BY). The use, distribution or reproduction in other forums is permitted, provided the original author(s) and the copyright owner(s) are credited and that the original publication in this journal is cited, in accordance with accepted academic practice. No use, distribution or reproduction is permitted which does not comply with these terms.
*Correspondence: Yihe Wang, d3loZTExOTA5MDQ1QGdtYWlsLmNvbQ==; Hui Wu, aHd1QHNrbGVjLmVjbnUuZWR1LmNu