 Junpei Shinji
 Ryutaro Kamiyama
 Tsubasa Nakamura3
- 1Center for Ocean Literacy and Education, Graduate School of Education, The University of Tokyo, Tokyo, Japan
- 2Yokohama Field Station, Fisheries Resources Institute, Japan Fisheries Research and Education Agency, Kanagawa, Japan
- 3Department of Marine Policy and Culture, School of Marine Life Science, Tokyo University of Marine Science and Technology, Tokyo, Japan
- 4Meiwa Food Tourism Council, Mie, Japan
The importance of local knowledge as a relevant information resource for ecosystem conditions has recently been the focus of sustainable ecosystem management. However, the accuracy of economic evaluation based on local knowledge regarding ecosystems has not yet been discussed, despite most activities in human society, including ecological conservation, being monetarily mediated. This study reports the correspondence between the economic value estimated by the fisher community and the analyzed environmental factors in the marine areas sectioned for oyster farming in Japan. At the study site, community-agreed usage fees for the area sections showed a gradient from the inner to the outer part of the bay. Our numerical modeling showed that the gradient of the economic value correlated with oyster feeding efficiency, indicating that a better location for feeding was empirically evaluated at a high price by the local fisher community. This suggests that the economic evaluation based on the local knowledge was biologically reasonable and could be a reliable information source for the aim of the area use in the study site.
Introduction
The sustainability of fisheries production has become an important subject worldwide (Eigaard et al., 2014). Although sustainability has been discussed based on the scientific data in sociological or ecological studies, local and experiential knowledge has only recently been focused on as a relevant information source to understand human–environment relationships (Berkes, 2004). Local knowledge is defined as “the cumulative body of knowledge, practices, and beliefs regarding the relationships of living things to their environment (Díaz et al., 2015).” Recent studies have revealed that there are complex levels of correspondence between local knowledge and scientific evidence (Silvano et al., 2006; Lozano-Montes et al., 2008; Anadón et al., 2009; Berkström et al., 2019; Morales-Reyes et al., 2019). However, these studies have only documented the accuracy between local ecological knowledge and biological scientific data, such as abundance and population dynamics. Few studies have discussed the link between recognized economic value based on local knowledge and actual ecosystem quality. The economic value refers to the context of ecosystem services (Pagiola et al., 2004). As most human activities are mediated by money, it is important to determine how accurate those living in a particular location recognize the economic value of that ecosystem when it is utilized for any industry. The easiest value that the local ecosystem user can recognize is a consumptive value by the direct use of an ecosystem. In fisheries, this might be affected by the number of fish produced from the target ecosystem (Guerra et al., 2017). However, the amount of trials representing the link between the empirical economic evaluation of an ecosystem on use in a community and the actual environmental conditions is limited. Is the economic evaluation by local knowledge scientifically reliable? We focused on oyster farming as an ideal research target to answer this question.
Oyster farming is one of the largest aquaculture systems in the world (Botta et al., 2020). The practice is believed to have begun in 1st century BC in ancient Rome, making oyster farming one of the oldest aquaculture systems in human history (Botta et al., 2020). The continuous history of oyster farming until now implies high interest in oysters as a preferable target for aquaculture. Global aquaculture production in oyster farming has continuously increased over the past 70 years, and the total production has increased 1.5-fold from 4 million tons in 2009 to 6 million tons in 2019 (Food and Agriculture Organization [FAO], 2021). With the increase in the market value of farmed oysters, the production value doubled from 3 billion USD to 6 billion USD 2009–2019. The importance of oyster farming has been increasing worldwide. In most types of oyster farming, oysters feed on natural phytoplankton in areas where they are farmed and grown without artificial feeding (Oluniyi Solomon and Olawale Ahmed, 2016). Preferrable ecosystem conditions for oyster farming are that with abundant consumptive resource that have the potential to return the production from the input of the oyster seeds. The economic value of oyster production in this farming style is considered as the direct use value of the consumptive use of the target ecosystem resources. Oyster farming is supported by a simple ecosystem comprising target oysters (primary consumers), phytoplankton (primary producers), and the physical environment. This characteristic makes it simple to analyze the ecosystem which controls the productivity of oyster farming. Therefore, we believed oyster farming would be a good target to determine the validity of the empirical economic evaluation based on local knowledge of successful fisheries management. However, the number of studies on oyster farming in this field is very limited. Despite the large industrial impacts, an approach based on an interest similar to ours has not been considered in the studies on this topic.
In this study, we researched the link between the value of the marine sections recognized in the target community and the ecosystem conditions in oyster farming in a village in Japan. As is the general practice of oyster farming in Japan (Inui, 2013), these fishers often moved their oyster farming from one marine section to another. Therefore, the actual oyster growth was not clear. Nevertheless, the fishers were required to pay a fee for the usage of different sectionized marine areas for oyster farming, that is, the areas were subject to monetary evaluation. We analyzed the correlation between environmental conditions and the community’s perception of this usage fee for marine sections designated for oyster farming. Our numerical analysis suggested that there is a validity in the perceived economic value of the individual marine area sections within the community for the growth of oysters. This case study reports that the fishers’ local knowledge can be a source of reliable information for understanding an ecosystem in terms of fisheries management.
Materials and Methods
Study Site
The study site was a local village near Ohnoura Bay in Uramura, Mie, Japan (Figure 1A; 34°26′N, 136°53′E). The village has less than 900 people in an approximately 16 km2 area and is surrounded by mountains and the sea. The major industry in this village is oyster farming, targeting the Pacific oyster Crassostrea gigas, which has been practiced since around 1926 (Toba, 1992). The oysters were cultured using the common oyster farming method in Japan of hanging clumps using a raft (Figure 1B). Oyster farming in this area is managed by a single institution, namely the Uramura Fisheries Cooperative. By targeting this area, this study intended to minimize the difference in the sociological background that determined the variability in management rule through the top-down control caused by the difference in institutions. The number of rafts used for hanging oyster clumps for cultivation in the managed area was limited to 1,250 around 40 years ago. This is because the overuse of the capacity of the bay decreased the productivity of oyster farming, which was a challenge. Since the establishment of this rule, oyster farming has continued sustainably in the bay to the present day.
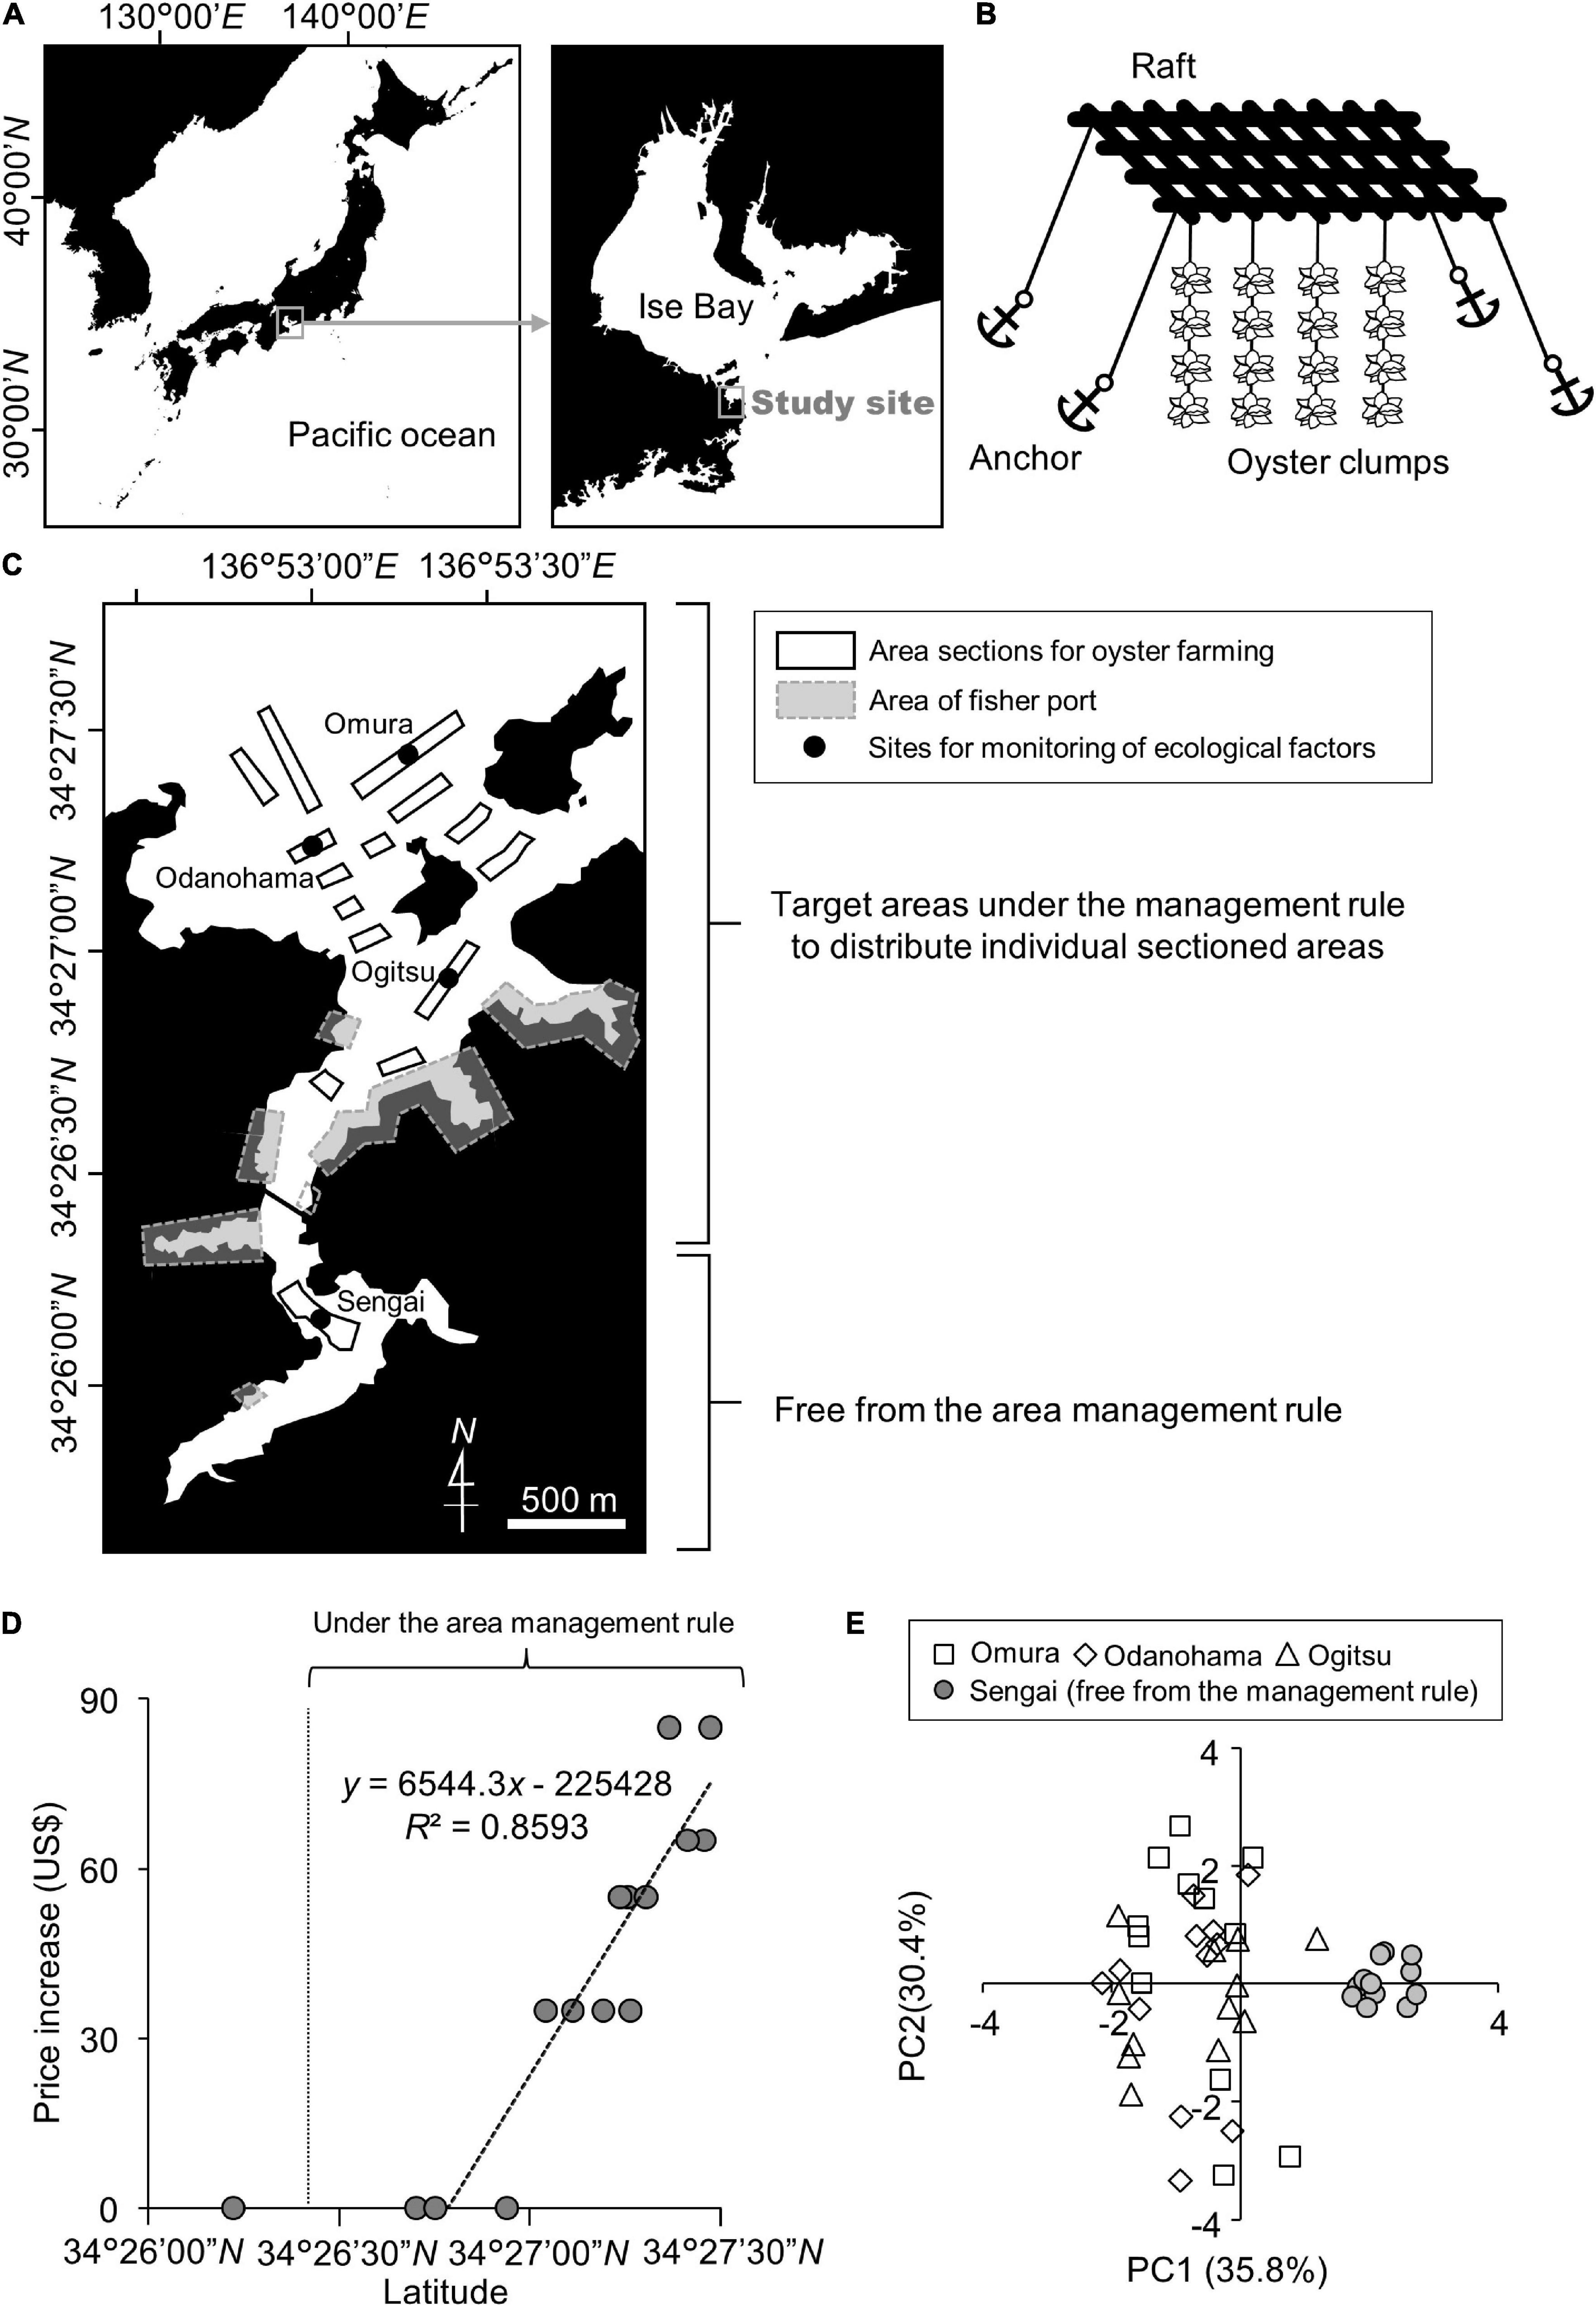
Figure 1. Changes in the economic values and environmental characteristics of the area sections for oyster farming in the study area. (A) Map indicating the study site. The original map of Japan was obtained from the web system for generating a map, CraftMap (http://www.craftmap.box-i.net/). (B) Hanging culture method for oyster farming at the study site. (C) Map of the sectioned marine areas for oyster farming at the study site. (D) Correlation between the latitude and the increase in the usage fee for a single area section (t-test for Pearson’s correlation coefficient; P < 0.05). The number of the plots corresponds to the number of the area sections in Figure 1C. (E) Biplot of the principal component scores representing the differences in environmental conditions between the area with area management rules (white squares and triangles) and that free from management (gray circles).
Interview Survey for Socioeconomical Conditions
This study focused on the usage fees for sectioned marine areas for oyster farming. The imposition of different usage fees implies that the empirical economic evaluations differing in area sections are perceived by the fishers and are agreed to within the community based on their local knowledge. We expected that this economic value would be a consumptive value by the direct use of ecosystem resources for oyster production. Accordingly, the price list and the area map with the details of the area sections designated for oyster farming at the study site were obtained from the three representatives of the local fisheries cooperative in February 2020, together with a qualitative explanation of oyster farming. The obtained data were used to analyze the relationship between this usage fee and the environmental factors analyzed in the subsequent field survey.
Correlation Analysis Between the Usage Fee and the Locations
We first performed a correlation analysis to reveal the link between the economic value and the locations of the area sections under the area management rule. The distribution of the marine area sections for oyster farming at the study site was wide along the vertical axis of the bay. Based on the information on the area map obtained from the fisher community, the usage fee appeared to be related to the latitude represented as the distance from the inner part of the bay. Accordingly, we analyzed the correlation between the usage fee for the respective area sections and latitude using linear regression analysis with the optimized least squares method. The significance of the correlation was tested using a t-test for Pearson’s correlation coefficient.
Field Survey for Environmental Conditions
Next, we performed a field survey to collect environmental data characterizing the respective marine sections. In this study, environmental conditions were monitored continuously at four data sampling points. The locations of the sampling points were established at almost equivalent intervals. The detailed locations of the sampling points are shown in Figure 1C. Each sampling point had three replicates at intervals of approximate 15–30 m. The field survey was conducted once a month, approximately midway between the low tide and high tide during the day on the low tide days. The duration of the study was from November 22, 2020, to February 19, 2021, which is the growth and harvesting period at the study site and follows the spawning period. Dissolved oxygen (DO), water temperature, and water velocity were measured directly at the respective sampling sites using commercial analytical instruments (DO and water temperature: DO-5519E, FUSO Corporation, Tokyo, Japan; water velocity: CM-1BD, Toho Dentan Co. Ltd., Tokyo, Japan). A 1-L water sample was collected from a depth of 1 m at each sampling point. This water depth is generally used for actual oyster farming using the hanging method with a basket. The collected water samples were transported on ice to the laboratory. The salinity, turbidity, and abundance of chlorophyll-a were measured using commercial instruments (salinity: YK-31SA, Mothertool Co. Ltd., Nagano, Japan; turbidity: Hanna instruments, Woonsocket, RI, United States; chlorophyll-a: CHL-30, Kasahara Chemical Instruments Corp., Saitama, Japan). The salinity was first analyzed using the NaCl standard in accordance with the manual provided by the manufacturer, and corrected to the salinity of seawater based on the difference in the electroconductivity between the NaCl solution and seawater caused by the difference in the ionic compositions. The respective data were used for the statistical analyses.
Modeling Based on Statistical Analyses
To eliminate the effect of seasons on the environmental conditions, the collected environmental data were transformed into differences considering data from the management-free area as the base. We first analyzed the change trends in the environmental factors using principal component analysis (see Supplementary Information for the validation of this procedure). Principal component (PC) scores were calculated and plotted as a biplot to represent the characteristics of the respective sampling points.
Finally, to evaluate the relationship between the economic value and environmental conditions via the positional characteristics (latitude), we analyzed the correlation between the latitudes and the PC scores representing the ecological trends. The data according to sampling time were used to estimate the tidal fluctuation from low tide to high tide. Multiple regression analysis using the optimized least-squares method was used to estimate the parameters. The best model was determined using a stepwise method, in accordance with Akaike’s information criterion. The homoscedasticity of the variance was tested using the Breusch–Pagan test. The significance of the parameters was examined using the likelihood-ratio test. All statistical analyses were performed using R software version 4.0.2 (R Core Team, 2020).
Results and Discussion
The division of the study site for the management of resources by the local fisher community has been historically followed based on their subjective analysis and understanding of local marine resources. During oyster farming, the raft size is limited to 5.4 m × 7.2 m and the rope for hanging oyster clumps must be less than 7 m to restrict the overuse of marine ecosystem resources in a single area section. Within the fisher community, there are rules for determining the distribution of resources and the allocation of the different divisions in the area. The bay is divided into two large areas: the area which uses a lottery system to allocate the section areas, and the area free from this rule (Figure 1C). The usage fees differed based on the determined sectioned marine areas and were the lowest in the area free from any management rules. This was considered the baseline usage fee and increased as the farming location moved to the outer part of the bay at higher latitudes. This usage fee was designated for the area used in oyster farming. Although there is a chance to change the usage fee every 5 years when updating the demarcated fishery rights during the fisheries cooperative meeting, the price has not been revised in at least 20 years. At the study site, almost all of the used marine area was occupied with oyster farming, so the price for the area use was not considered to be affected by other marine industries (such as other fisheries and marine leisure). This usage fee for the area section used by the oyster farmers is paid to the fisheries cooperative that manages oyster farming at the study site and is used for operating this institution. This pricing rule is provided by the fisheries cooperative managing the oyster farming covering all of this area to fix the usage fee. Like general oyster farmers in Japan (Inui, 2013), the fishers often move their oyster rafts from one section to another within their designated area sections because they believe it is beneficial for the growth of the oysters. Accordingly, there is no available data regarding which area section shows the largest production in the fisher community; nevertheless, a price gradient exists.
As long as the usage fee is accepted by a local community, the fee difference for a specific area can be regarded as the difference in the economic values agreed upon by the community. The price increase in the usage fee compared to that in the rule-free sections was highly correlated with the latitudinal distance from the management-free division (Figure 1D). Given the map of the study site (Figure 1C), further areas from the fisher ports seemed to be recognized as good places for oyster farming. This implies that better access to the respective area sections was less evaluated in the economic value of the area sections for the oyster farmers. This indicates that the environmental conditions of the outer area of the bay were recognized as a better place for oyster farming than the inner bay, which seemed to be used more easily by the fishers. This expectation supported our hypothesis that fishers at the study site value oyster productivity rather than workability. Accordingly, we examined the environmental conditions for oyster growth.
Our principal component analysis showed reasonable environmental trends at the study site. The PC1 score was positively correlated with turbidity and chlorophyll-a as indicators of phytoplankton abundance. Although the turbidity was initially intended to be analyzed as an indicator for determining light conditions for phytoplanktonic proliferation, this indicated that most of the suspended turbidity-inducing particles were assumed to be phytoplankton themselves. PC1 was consequently considered to represent phytoplankton abundance as a food for oysters. Initially, the negative correlation between PC1 and water temperature appeared to conflict with the generally accepted theory that phytoplanktonic activity is high at high temperatures (Eppley, 1972; Norberg, 2004). However, phytoplankton blooms have been reported to occur even in winter owing to water transport among the water layers (Lacour et al., 2017). In this study, the structure of the water layers at the study site was not analyzed; however, our result was considered to not contradict the conditions in a natural ecosystem. Both PC2 and PC4 scores were correlated with water velocity and tidal fluctuation from low to high tide (Table 1). This indicates that these PCs are related to water flow due to tides. However, the two scores were distinct in the direction of flow. The coefficient between PC2 and the sampling time corresponding with the tide fluctuation toward high tide showed a positive value; however, for PC4, this relationship was negative. This implies that PC2 represents the water flow coming from the outside of the bay at high tide, and PC4 represents the water flow coming from the inside of the bay at low tide. This hypothesis was supported by the negative correlation between PC2 and DO. It has been reported that a hypoxic water mass often emerges outside the study site in Ise Bay (Tanaka and Ikeda, 2015). The low oxygen content and high PC2 value at high tide seemed to correspond to this possibility. The biplot from our principal component analysis suggested that there were two environmental groups at the study sites (Figure 1E). The management-free divisions were clearly distinct from those under the area management rule along the PC1 axis (Figure 1D). As mentioned above, PC1 was positively correlated with phytoplankton abundance and PC2 positively correlated with changes in water flow along the tide. According to the high PC1 value and the small variation of the PC2 scores in the rule-free area, it was considered that this was abundant with phytoplankton but with low levels of change in water flow along with the tide. In fact, the water velocity was almost zero. Generally, the feeding efficiency in oysters is considered to be the product of phytoplankton abundance and water velocity (Comeau et al., 2010) because oysters eat phytoplankton using open-shell mouths to catch phytoplankton as they are carried by the flowing water. Accordingly, the area management rule-free sections for oyster farming seemed to be rich in food abundance but did not seem to be an effective location for the oysters to utilize these food resources owing to the lack of tidal water flow. However, our biplot analysis could not characterize the areas under the area management rule with a gradient of the usage fee. Therefore, in the subsequent analysis, we focused only on the area sections that were shared under the area management rule and required additional financial charge by the fishers.
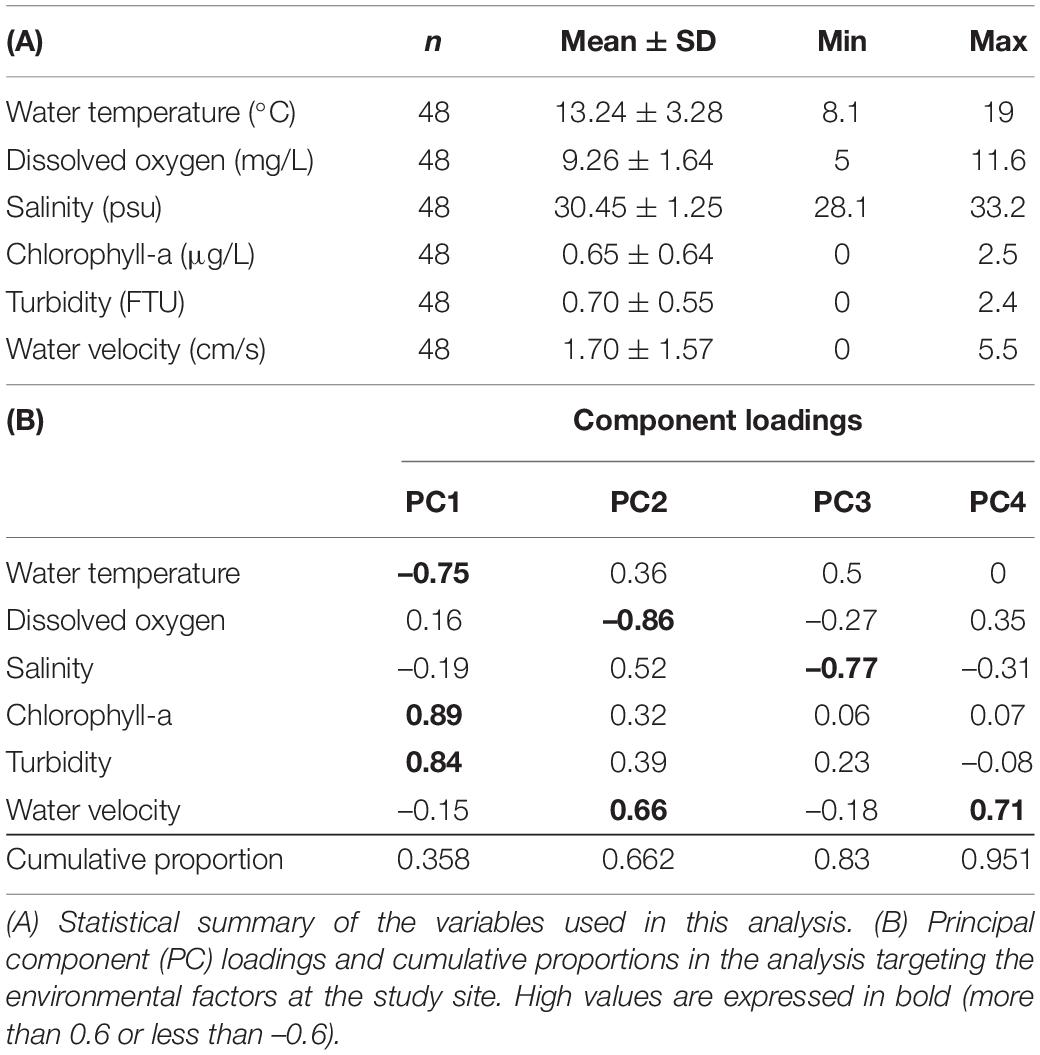
Table 1. Summary of the principal component analysis using the environmental data.
In our multiple regression analysis, the PC2 and PC4 scores correlated with latitude (Table 2), indicating that the latitudinal difference in the economic value as recognized by the fisher community was based on the water flow caused by tides. In contrast, the latitude did not show any correlation with PC1, representing food abundance for the oysters (Table 2). This implies that food abundance was similar along the latitudinal gradient in the sections under the area management rule. Given these factors, feeding efficiency was considered to be affected by the difference in the water flow strength rather than the food abundance in this area. Feeding efficiency as a product of food abundance, and water flow was considered to be higher in the outer part of the bay located at higher latitudes than in the inner part of the bay at lower latitudes (Figure 2). This indicates that the economic values of the respective area sections empirically estimated by the fishers were scientifically appropriate for oyster growth. Generally, a strong tide flow disturbs fisher work. However, our results implied that the strong tide flow in the study area was preferred for oyster farming in the target fisher community. Therefore, the pricing rule seemed to be based on productivity of oyster growth rather than the workability of fishers.
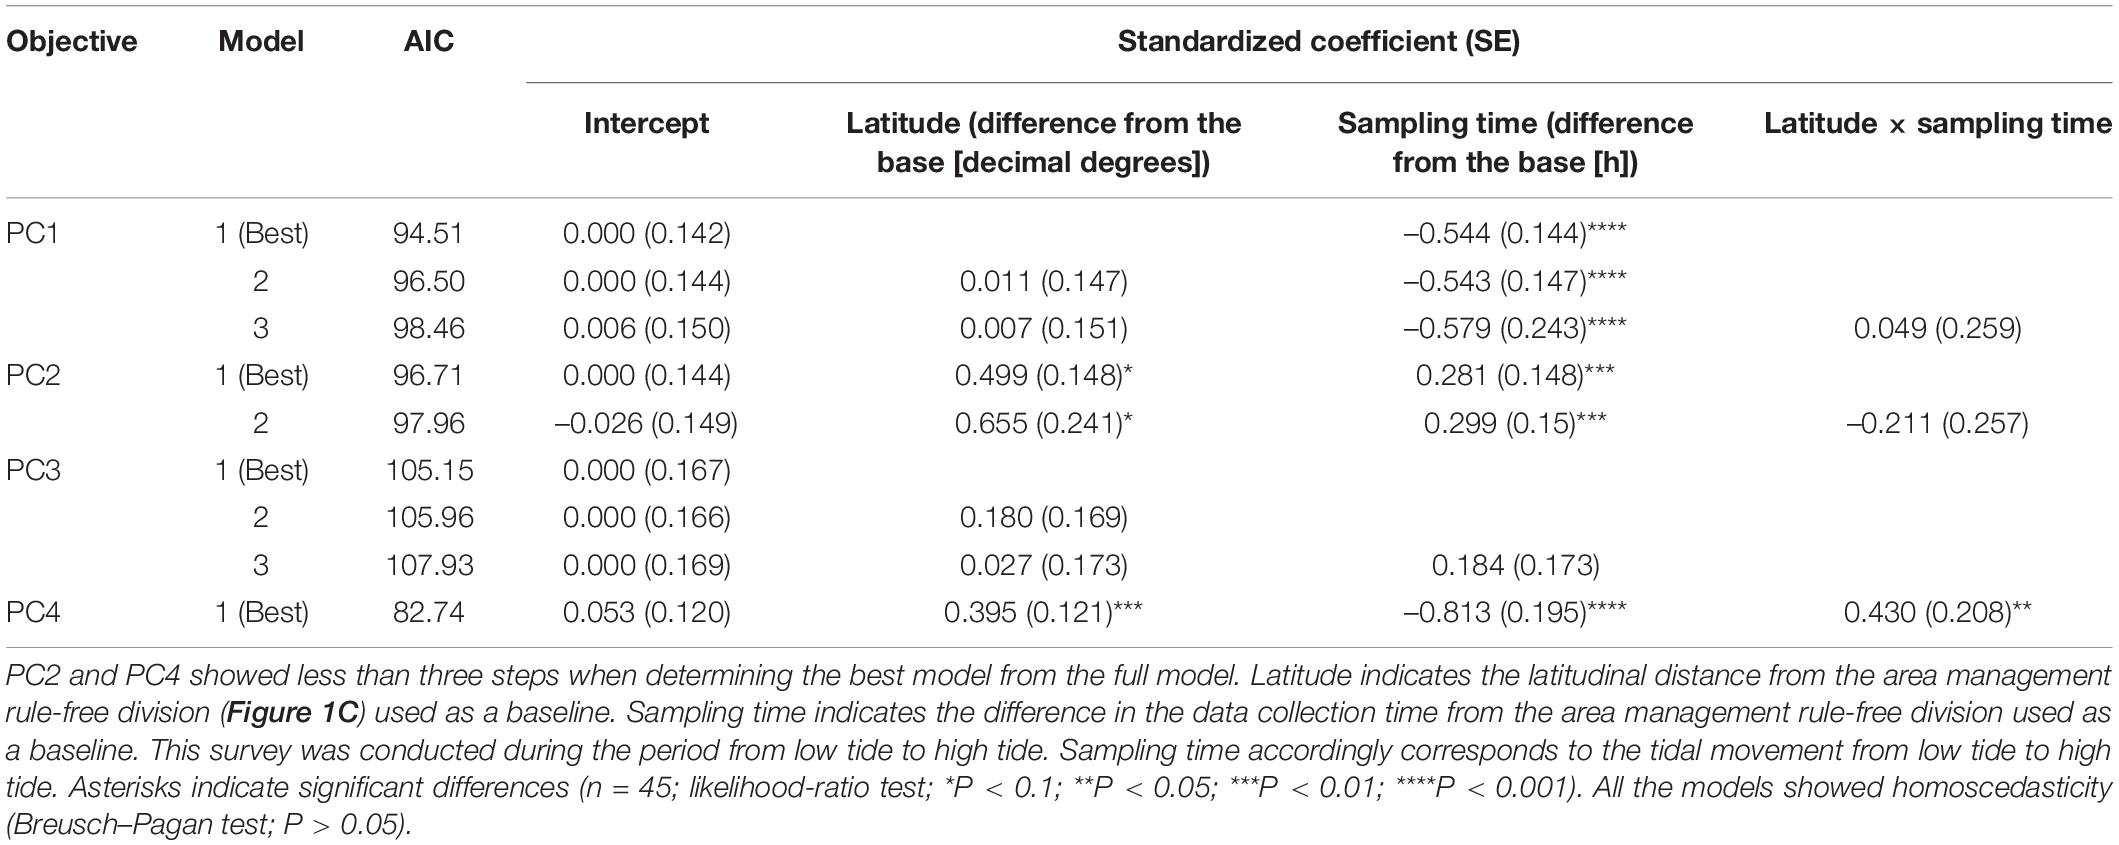
Table 2. Top three models explaining the respective principal component (PC) scores.
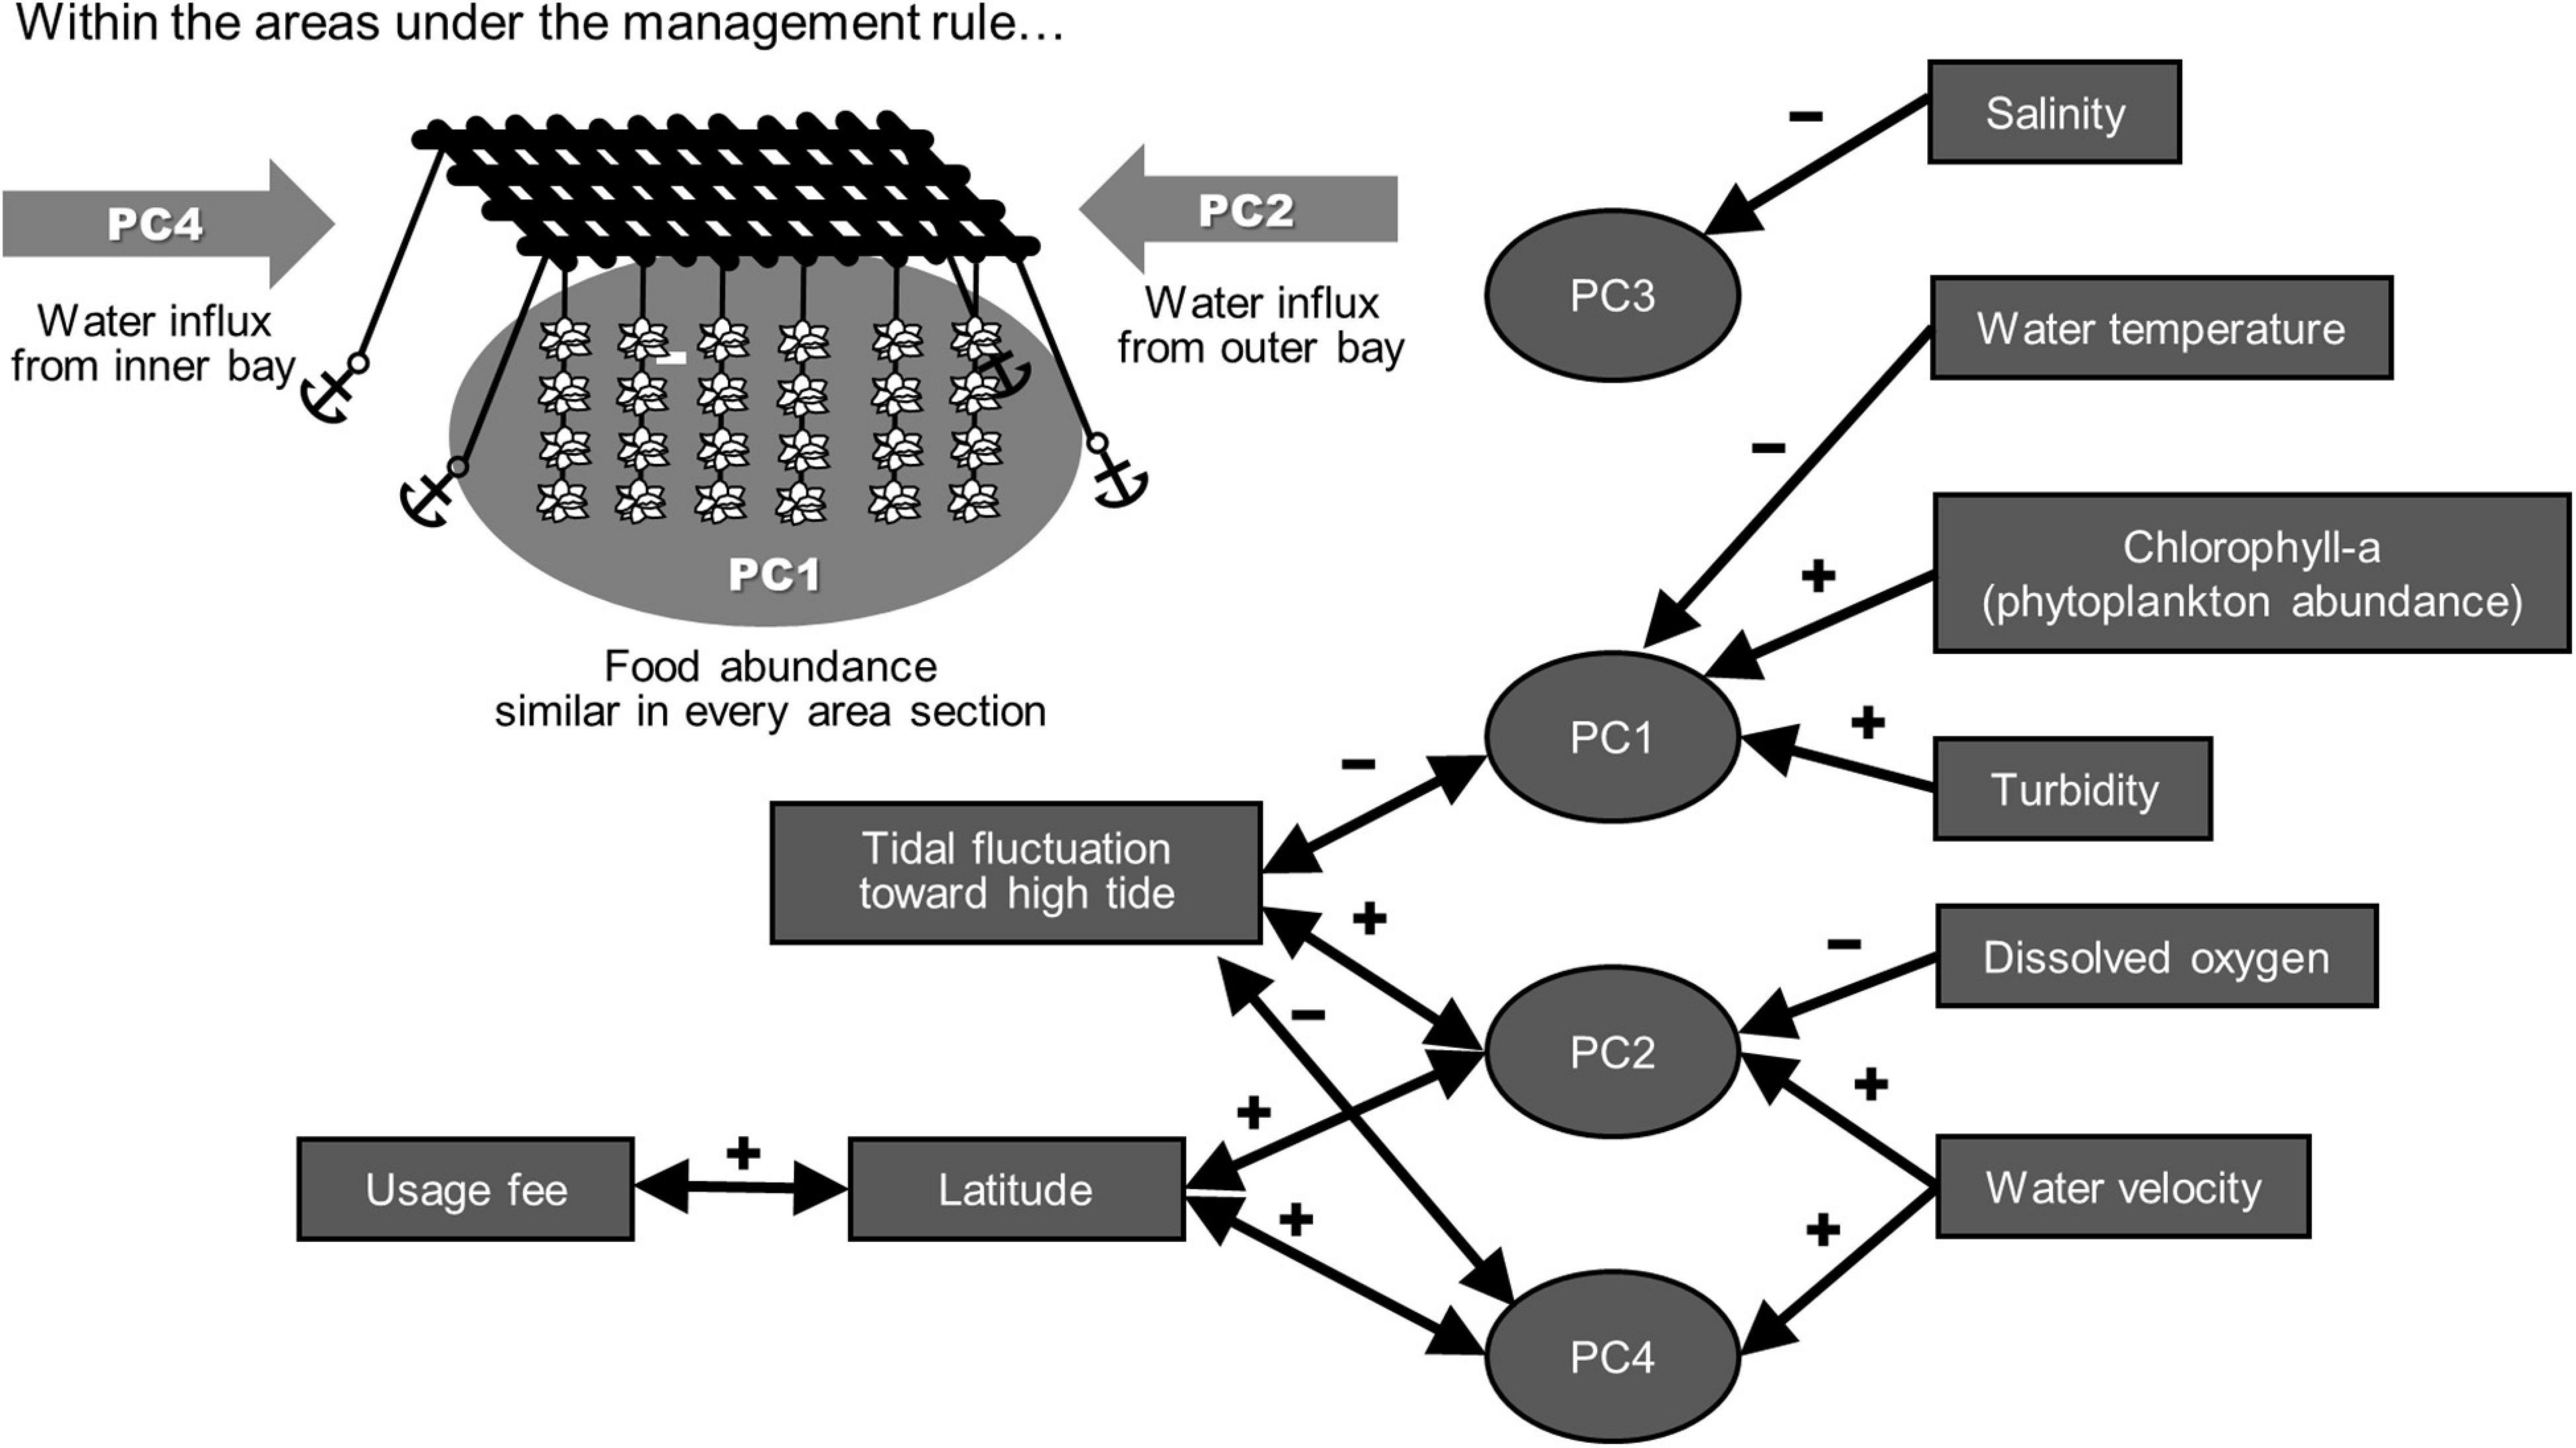
Figure 2. Expected model representing the relationship between the economic values of the individual sections and the environmental characters. Arrows toward both sides indicate correlations obtained with multiple regression analysis using the optimized least squares method. Arrows toward individual principal components (PCs) indicate high correlation between the respective environmental factors and the PC scores. The detailed analytical results are summarized in Tables 1, 2.
Thus, our findings showed that the economic evaluations of the detailed sectioned marine areas based on local knowledge of the fisher community were scientifically adequate in terms of the productivity of oyster farming. Although the actual production capacity was not clear for each individual area section because of the lack of data, the empirical economic evaluation in the community was supported by the environmental conditions for production. The gradient in the reliable financial charge representing the ecological quality of the study site indicated that the use of a location expected to be better for production requires a higher cost. This correspondence was assumed to be one of the reasons that different financial charges were accepted in the management rules at the study site. This case study has thus indicated that the experiential understanding of the ecosystem for fisheries use by the local fisher community can be a reliable information source for the management of oyster farming. A reason why reliability is achieved is the biological characteristics of the oysters as sessile organisms that do not move. This likely enabled the monitoring of biomass and health conditions more easily and accurately than other farming targets. Although some studies have insisted on the utility of local knowledge as ecological information with different levels of reliability (Silvano et al., 2006; Lozano-Montes et al., 2008; Berkström et al., 2019), the number of studies that have examined the validity of local knowledge remains small in the fisheries research field. Future studies should examine when and to what extent local fisher knowledge would be an efficient tool for fisheries management and ecosystem conservation in the future.
Data Availability Statement
The original contributions presented in the study are included in the article/Supplementary Material, further inquiries can be directed to the corresponding authors.
Author Contributions
JS and TM designed the research plan. TN and TM conducted the interview survey. JS, RK, TN, KY, and TM performed the field survey. JS analyzed the data and wrote the manuscript. JS, RK, and TM reviewed and edited the manuscript. All authors contributed to the article and approved the submitted version.
Funding
This study was financially supported by the Meiwa Food Tourism Council with no project number.
Conflict of Interest
The authors declare that the research was conducted in the absence of any commercial or financial relationships that could be construed as a potential conflict of interest.
Publisher’s Note
All claims expressed in this article are solely those of the authors and do not necessarily represent those of their affiliated organizations, or those of the publisher, the editors and the reviewers. Any product that may be evaluated in this article, or claim that may be made by its manufacturer, is not guaranteed or endorsed by the publisher.
Acknowledgments
We would like to thank Isao Kimura and Daisuke Asao for their assistance and advice during the preparation of the research activities. We would also like to thank the members of the Meiwa Tourism and Trading Company for their kind assistance with this research. We are also grateful to the students who helped with the field survey, Shinnosuke Oya, Takahisa Shoji, and Hiroshi Takeuchi from the Tokyo University of Marine Science and Technology and Shiho Kamiyama from Kitasato University.
Supplementary Material
The Supplementary Material for this article can be found online at: https://www.frontiersin.org/articles/10.3389/fmars.2021.790763/full#supplementary-material
References
Anadón, J. D., Gimenez, A., Ballestar, R., and Pérez, I. (2009). Evaluation of local ecological knowledge as a method for collecting extensive data on animal abundance. Conserv. Biol. 23, 617–625. doi: 10.1111/j.1523-1739.2008.01145.x
Berkström, C., Papadopoulos, M., Jiddawi, N. S., and Nordlund, L. M. (2019). Fishers’ Local Ecological Knowledge (LEK) on Connectivity and Seascape Management. Front. Mar. Sci. 6:130. doi: 10.3389/fmars.2019.00130
Botta, R., Asche, F., Borsum, J. S., and Camp, E. V. (2020). A review of global oyster aquaculture production and consumption. Mar. Policy 117:103952. doi: 10.1016/j.marpol.2020.103952
Comeau, L. A., Sonier, R., Lanteigne, L., and Landry, T. (2010). A novel approach to measuring chlorophyll uptake by cultivated oysters. Aquac. Eng. 43, 71–77. doi: 10.1016/j.aquaeng.2010.06.002
Díaz, S., Demissew, S., Carabias, J., Joly, C., Lonsdale, M., Ash, N., et al. (2015). The IPBES Conceptual Framework - connecting nature and people. Curr. Opin. Environ. Sustain. 14, 1–16. doi: 10.1016/j.cosust.2014.11.002
Eigaard, O. R., Marchal, P., Gislason, H., and Rijnsdorp, A. D. (2014). Technological Development and Fisheries Management. Rev. Fish. Sci. Aquac. 22, 156–174. doi: 10.1080/23308249.2014.899557
Food and Agriculture Organization [FAO] (2021). FishStatJ: software for fishery statistical time series. Version 4.01.6. Rome: FAO Fish.
Guerra, A. S., Madigan, D. J., Love, M. S., and McCauley, D. J. (2017). The worth of giants: the consumptive and non-consumptive use value of the giant sea bass (Stereolepis gigas). Aquat. Conserv. 28, 296–304. doi: 10.1002/aqc.2837
Inui, M. (2013). The encyclopedia of the oyster farming in Japan (in Japanese). Fish. Promot. 544, 1–119.
Lacour, L., Ardyna, M., Stec, K. F., Claustre, H., Prieur, L., Poteau, A., et al. (2017). Unexpected winter phytoplankton blooms in the North Atlantic subpolar gyre. Nat. Geosci. 10, 836–839. doi: 10.1038/NGEO3035
Lozano-Montes, H. M., Pitcher, T. J., and Haggan, N. (2008). Shifting environmental and cognitive baselines in the upper Gulf of California. Front. Ecol. Environ. 6:75–80. doi: 10.1890/070056
Morales-Reyes, Z., Martín-López, B., Moleón, M., Mateo-Tomás, P., Olea, P. P., Arrondo, E., et al. (2019). Shepherds’ local knowledge and scientific data on the scavenging ecosystem service: insights for conservation. Ambio 48, 48–60. doi: 10.1007/s13280-018-1055-6
Norberg, J. (2004). Biodiversity and ecosystem functioning: a complex adaptive systems approach. Limnol. Oceanogr. 49, 1269–1277.
Oluniyi Solomon, O., and Olawale Ahmed, O. (2016). Ecological Consequences of Oysters Culture: a Review. Int. J. Fish. Aquat. Stud. 4, 1–6.
Pagiola, S., von Ritter, K., and Bishop, J. (2004). How Much is an Ecosystem Worth? Assessing the Economic Value of Conservation. Washington: The World Bank.
R Core Team (2020). R: A language and environment for statistical computing. Vienna: R Found Statistical Computing. https://www.r-project.org/
Silvano, R. A. M., MacCord, P. F. L., Lima, R. V., and Begossi, A. (2006). When does this fish spawn? Fishermen’s local knowledge of migration and reproduction of Brazilian coastal fishes. Environ. Biol. Fishes. 76, 371–386. doi: 10.1007/s10641-006-9043-2
Keywords: aquaculture, community-based management, fisheries, local knowledge, socioecological approach
Citation: Shinji J, Kamiyama R, Nakamura T, Yamanaka K and Matsui T (2022) Validity of the Fisher Community Knowledge-Based Economic Valuation of the Local Ecosystem for Oyster Farming: A Case Study in Japan. Front. Mar. Sci. 8:790763. doi: 10.3389/fmars.2021.790763
Received: 07 October 2021; Accepted: 17 December 2021;
Published: 07 January 2022.
Edited by:
Yngvar Olsen, Norwegian University of Science and Technology, NorwayReviewed by:
Shau Hwai (Aileen) Tan, Universiti Sains Malaysia (USM), MalaysiaSatoshi Yamazaki, University of Tasmania, Australia
Copyright © 2022 Shinji, Kamiyama, Nakamura, Yamanaka and Matsui. This is an open-access article distributed under the terms of the Creative Commons Attribution License (CC BY). The use, distribution or reproduction in other forums is permitted, provided the original author(s) and the copyright owner(s) are credited and that the original publication in this journal is cited, in accordance with accepted academic practice. No use, distribution or reproduction is permitted which does not comply with these terms.
*Correspondence: Junpei Shinji, ai1zaGluamlAZy5lY2MudS10b2t5by5hYy5qcA==; Takahiro Matsui, dC1tYXRzdWlAbS5rYWl5b2RhaS5hYy5qcA==