
94% of researchers rate our articles as excellent or good
Learn more about the work of our research integrity team to safeguard the quality of each article we publish.
Find out more
ORIGINAL RESEARCH article
Front. Mar. Sci., 17 January 2022
Sec. Marine Ecosystem Ecology
Volume 8 - 2021 | https://doi.org/10.3389/fmars.2021.789818
This article is part of the Research TopicScience Supporting Management of Eutrophication: Lessons Learned from a Barrier Island LagoonView all 18 articles
 Lori J. Morris1*
 Lauren M. Hall2
 Charles A. Jacoby1
 Robert H. Chamberlain1
 M. Dennis Hanisak3
 Janice D. Miller1
 Robert W. Virnstein1,4
Seagrass is a major structural habitat in the Indian River Lagoon. Maps documented locations and areal extents of beds periodically since the 1940s, and surveys of fixed transects yielded changes in percent cover and depths at the end of the canopy since 1994. Areal extent increased by ∼7,000 ha from 1994 to 2009, mean percent cover within beds decreased from ∼40 to 20%, and mean percent cover standardized to maximum transect length remained near 20%. Thus, conditions supported a consistent biomass because cover decreased as areal extent increased. Between 2011 and 2019, ∼19,000 ha or ∼58% of seagrasses were lost, with offshore ends of canopies moving shoreward and shallower, and standardized mean percent cover decreased to ∼4%. These changes coincided with blooms of phytoplankton, and ≤ 27% of incident subsurface irradiance at 0.9 m was stressful. Decreases in mean percent cover per month of stress became larger when initial mean cover per transect was < 20%, which suggested that the ratio of aboveground to belowground tissues in the expanded and sparser beds led to respiratory demand that was not met by photosynthesis. Despite intermittent improvements in light penetration, widespread recovery of seagrasses has not occurred potentially due to detrimental feedbacks. For example, loss of seagrass exposed sediments to waves, and the resulting disturbance may have hampered recruitment of new shoots. The same decreases also made 58–88% of the carbon, nitrogen, and phosphorus in seagrass tissue available to other primary producers. These nutrients did not enhance growth of epiphytes, whose biomass decreased by ∼42%, but they apparently fueled blooms of phytoplankton, with mean chlorophyll-a concentrations increasing by > 900%. Such intense blooms increased shading and loss of seagrasses. Fortunately, data showed that patches of seagrasses at depths of 0.5–0.9 m persisted for 22–24 years, which suggested that this depth zone could hold the key to recovery. Nevertheless, optimistic estimates predict recovery could take 12–17 years. Such a long-term, widespread loss of a key structural habitat may generate multiple adverse effects in the system, and mitigating such effects may entail planting seagrasses to accelerate recovery.
Seagrasses have been termed “coastal canaries” because they integrate and respond visibly and relatively rapidly to a variety of anthropogenic stressors (Orth et al., 2006). Signs of stress include loss of species richness (Hemminga and Duarte, 2000; Morris et al., 2021) and loss of areal extent (Orth et al., 2010; Lefcheck et al., 2017; Morris et al., 2018). Such changes represent a loss of refuge and food for fauna, including commercially and recreationally important species, manatees, and sea turtles (Lewis, 1984; Unsworth et al., 2018). In addition, a variety of other ecosystem services are lost, including a reduction in storage of carbon that can represent up to half of the amount stored in the world’s oceans (Fourqurean et al., 2012; Duarte et al., 2013; Marbà et al., 2015; Duffy et al., 2019; Aoki et al., 2021).
Multiple anthropogenic stressors affect seagrasses by reducing water clarity, particularly at the deep edge of a bed or the light-limited depth of colonization (Dennison, 1987; Duarte, 1995; Kenworthy and Fonseca, 1996; Hemminga and Duarte, 2000; Steward et al., 2005; Beck et al., 2018). Reduced light also causes changes in the physiology and morphology of seagrass, such as decreased leaf length, leaf width, leaves per shoot, and shoot growth (Lee et al., 2007; Bertelli and Unsworth, 2018). Seagrasses can cope with reduced light for short periods, but once poor clarity becomes chronic or recurrent, detrimental effects on survival, resilience, and recovery emerge (Duarte, 1995; Burdick and Short, 1999; Hauxwell et al., 2003; Collier et al., 2009; Nelson, 2017; Wong et al., 2021).
Reduced availability of light is not the only stressor affecting seagrass, with salinity and temperature being two primary factors not related to physical disturbance, increased sedimentation, or excessive loads of nutrients and subsequent eutrophication (Dennison et al., 1993; Duarte, 2002; Fourqurean et al., 2003; Greve and Binzer, 2004; Lee et al., 2007). In some cases, temperature or salinity may exert an influence independent of other factors (Quammen and Onuf, 1993; Irlandi et al., 2002; Collier and Waycott, 2014; Lefcheck et al., 2017), but in many cases, these stressors interact with each other and reduce light availability (Livingston et al., 1998; Collier et al., 2011, 2016; York et al., 2013; Kendrick et al., 2019).
In this paper, we examine how the distribution and abundance of seagrasses in the Indian River Lagoon (IRL) responded to spatiotemporal patterns in salinity, temperature, and the availability of light. Seagrasses represent a key structural habitat in the IRL that has been stressed more severely since 2011, primarily due to shading by intense and extensive blooms of phytoplankton (Morris et al., 2021; Phlips et al., 2021). The goals are to understand conditions that led to losses of seagrasses and to identify where they persisted. The resulting understanding is translated into effects on nutrient cycling, recommendations for management, and questions for further investigation.
The IRL is a shallow (mean depth < 2 m), bar-built lagoon that stretches over 250 km along the east coast of Florida from Ponce de Leon Inlet in the north to Jupiter Inlet in the south (Figure 1). The system’s biological diversity can be explained primarily by the fact that it spans the boundary between the temperate Carolinian Province and the subtropical Caribbean Province (Gilmore, 1995). In addition, diversity is affected by variation in hydrodynamic characteristics caused by the length of the system and the locations of five inlets and one navigational lock. Ponce de Leon Inlet is at the extreme northern end of Mosquito Lagoon; the lock at Port Canaveral intermittently connects the ocean to the Banana River Lagoon; the next connection is 140 km to the south at Sebastian Inlet; and Fort Pierce, St. Lucie, and Jupiter inlets are all found in the remaining portion of the lagoon. The three southern inlets increase oceanic exchange in that region (Smith, 1993). In contrast, the lack of inlets in the northern portion of the system leads to residence times that can exceed 1 year and weak tidal forcing, with tidal amplitudes being less than 10 cm. In fact, seasonal winds and oceanic forcing driven by changes in the Gulf Stream cause larger variations by raising water levels 5–30 cm throughout the IRL (Smith, 1993, 2001; Woodward-Clyde Consultants, 1994).
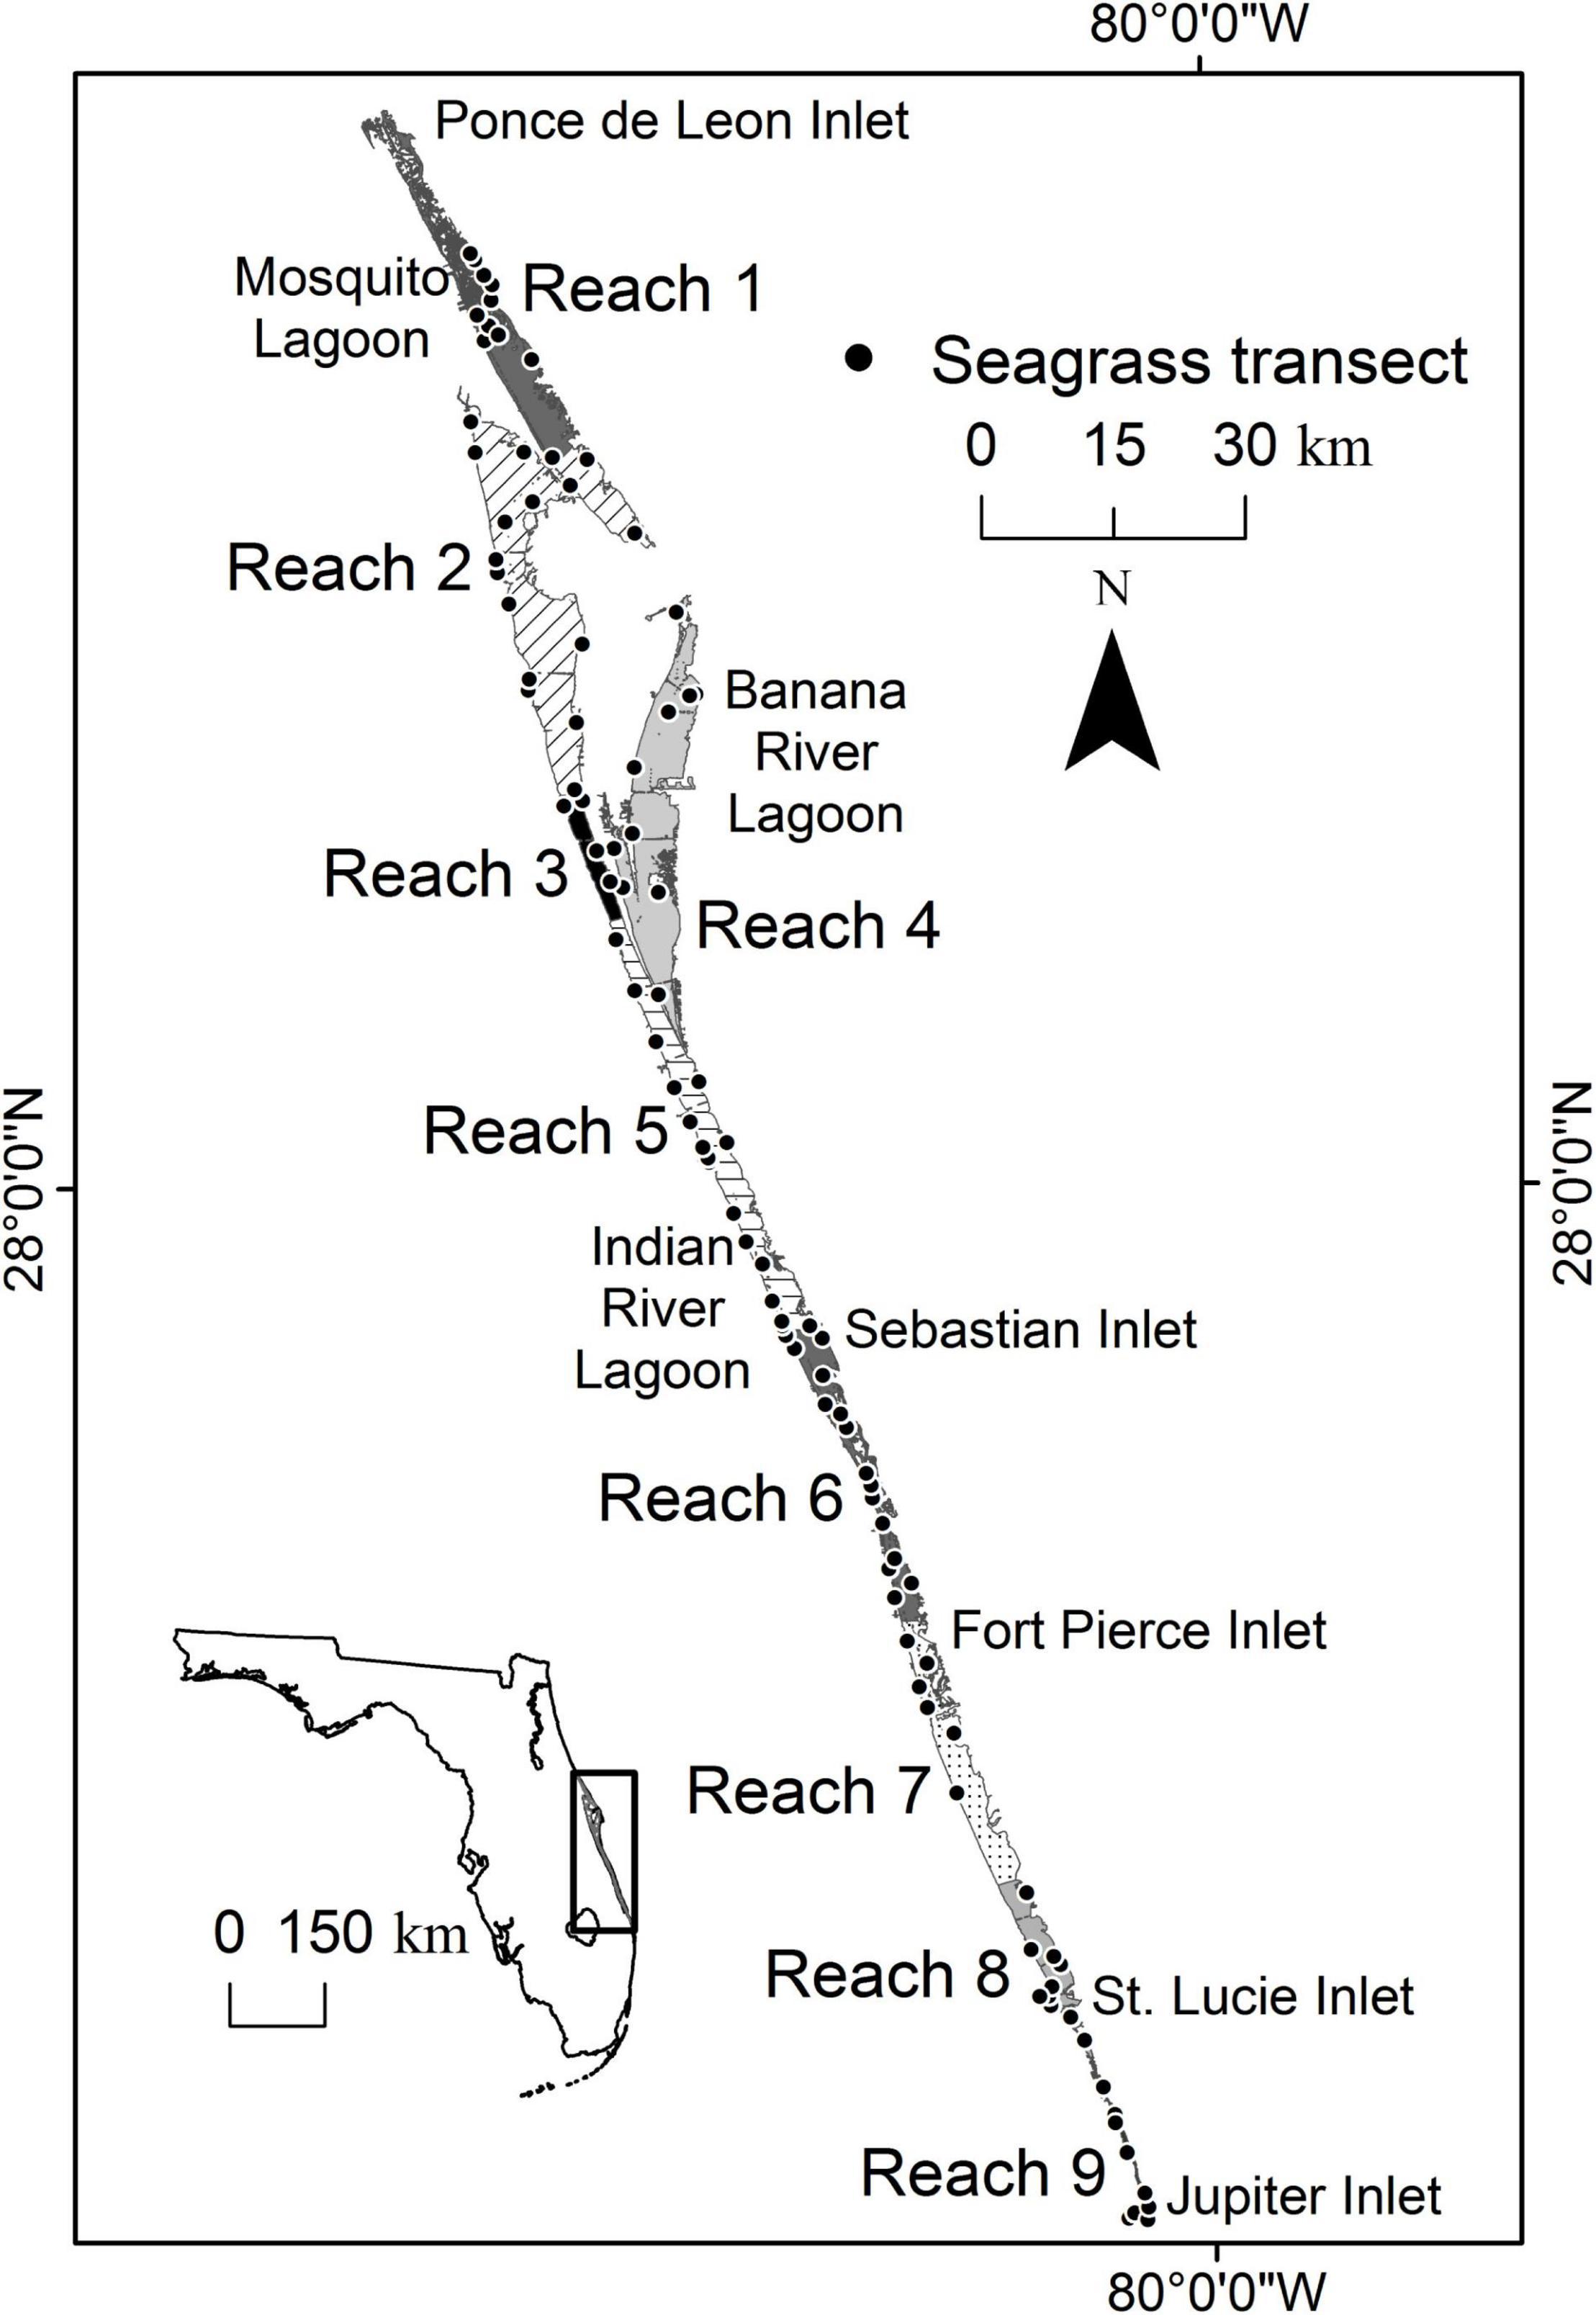
Figure 1. Map showing the location of the Indian River Lagoon, five inlets, nine reaches, and fixed transects where seagrass was surveyed.
For this paper, the IRL is subdivided into smaller areas labeled reaches (Figure 1). The nine reaches are delineated by evaluating similarities in time series of water quality parameters (Lasi et al., this volume). Reaches 1–4 are microtidal (<10 cm), with expansive, shallow shelves suitable for seagrass (Smith, 1987). In addition, these northern reaches are adjacent to some of the most pristine areas within the IRL system, including Merritt Island National Wildlife Refuge, Canaveral National Seashore, and multiple areas designated as Outstanding Florida Waters. Throughout the system, the bathymetry and relatively stable and favorable water quality have supported persistent coverage of seagrass.
Seagrass is sampled at two scales: large-scale, lagoon-wide mapping from aerial imagery and finer-scale, fixed transects. Thirteen maps spanning the whole lagoon document conditions in 1943, 1992, 1994, 1996, 1999, and every 2 years from 2003 to 2019. Surveys of fixed transects are used to detect small-scale changes within the lagoon’s seagrass beds, and they began in 1994.
Mapping is based on visual interpretation of aerial images, primarily at a 1:24,000 scale but in some cases at a 1:10,000 scale. Features on the aerial images are identified with the aid of stereoscopic analysis, photo-interpretation keys, and ground truthing. Features are classified according to slightly modified Florida Land Use, Cover and Forms Classification System codes (Florida Department of Transportation, 1999). The resulting polygons are connected to create a layer showing the areal extent of seagrass. The accuracy of classifications has been evaluated from 1999 onward, and it averages 80% or higher.
Starting in 1994, 73–97 fixed transects placed throughout the lagoon’s seagrass beds have been surveyed at least twice a year, during summer and winter, to approximate times of maximum and minimum abundance within years (Virnstein and Morris, 1996). Each transect is delineated by a graduated line extending perpendicular to the shore out to the deep end of the seagrass canopy (EOC). For consistency with mapping, the EOC is designated according to the distribution of larger species that form the canopy (i.e., Halodule wrightii, Syringodium filiforme, Thalassia testudinum, and Ruppia maritima) because the three Halophila species found in the lagoon are small, ephemeral, and difficult to map accurately from aerial images. The EOC is defined as the point beyond which percent cover in 1-m2 quadrats drops to zero or remains < 1% for 30 m. At predesignated points along transects, a suite of standardized, non-destructive measurements are made within 1-m2 quadrats divided by strings into 100 cells, each 10 cm by 10 cm. Pertinent measurements are: (1) visual estimates of percent cover of all seagrass, (2) transect lengths or distance from shore to the EOC, (3) depths where quadrats are sampled, and (4) depth at the EOC (Morris et al., 2001).
Light is mandatory for growth and survival of seagrasses, and light availability is affected strongly by depth. Depths in the IRL are influenced by seasonal changes and by tides when in proximity to the inlets. For this study, depths measured in the field are adjusted to depths below mean water level (MWL) using depth soundings taken throughout the IRL at 15.2-m intervals along east-west tracks that were spaced approximately 150–300 m apart (Coastal Planning and Engineering, 1997). The resulting bathymetry is based on over 230,000 depths that are referenced to North American Vertical Datum of 1988 and adjusted to depth below MWL.
The depths below MWL yield isobaths that are used to adjust depths measured in the field. Based on a linear interpolation between measured depths, the depth at the intersection of the transect and the 0.75-m isobath is calculated for each transect in each survey. The appropriate difference between the predicted depth and 0.75 m is used to correct all relevant field measurements. The resulting depths below MWL are rounded to the nearest 0.1 m.
The distributions of seagrasses are influenced by water temperature, salinity, and attenuation of photosynthetically active radiation (PAR, wavelengths of 400–700 nm). To assess these influences, relevant data are extracted from monthly sampling at fixed stations near the transects.
Water temperatures and salinities are measured in the field with multiparameter instruments equipped with the relevant probes. The instruments are calibrated and verified using standards and procedures that agree with state guidelines.
Since 1996, the coefficient of attenuation for PAR (Kd) is determined by applying the Lambert-Beer equation to simultaneous readings recorded by three spherical quantum sensors. Two of the sensors are held at 0.2 and 0.5 m below the water’s surface, and the third is held 0.3 m from the bottom in water ≤ 1.8 m deep or at 1.5 m from the surface in deeper water (Morris et al., 2002). For the purpose of this paper, the Lambert-Beer equation is rearranged to yield the percent of subsurface irradiance reaching the depth of interest.
Halodule wrightii is the most common and abundant seagrass species in the IRL (Morris et al., 2021), so the stores of carbon (C), nitrogen (N), and phosphorus (P) in its aboveground and belowground tissues are evaluated. The evaluation is based on triplicate samples collected quarterly in 2014 and 2015 at mid-bed (0.5–1.0 m deep) near three transects in the northern Indian River Lagoon (reaches 2–3) and three in the Banana River Lagoon (reach 4). Processing samples involves removing epiphytes and debris, rinsing briefly to remove excess salt, partitioning aboveground and belowground tissues, and drying at 80°C (Hanisak, 2016).
Dried samples ground to fine powder with a mortar and pestle are stored in capped glass vials at room temperature. Subsamples in small vials are held at 80°C overnight to ensure they are dry before being shipped to the University of Maryland’s Nutrient Analytical Services Laboratory for determination of C, N, and P contents. Analytical procedures, quality control/quality assurance measures, and other details can be found at: https://www.umces.edu/nutrient-analytical-services-laboratory.
Areal extents, distance to the EOC, depth at the EOC, percent cover, data on water quality, and elemental contents of H. wrightii are analyzed to identify spatiotemporal changes in the quantity and quality of seagrass beds, the location and characteristics of persistent patches of seagrass, drivers of changes in seagrass, and consequences for the cycling of carbon, nitrogen, and phosphorus. In some analyses, early years are excluded and reaches 7, 8, and 9 are combined or excluded because certain data are lacking.
Areal extents in hectares in each of seven reaches (reaches 7, 8, and 9 are combined) for the 11 years with maps are used in a permutation analysis of variance (PERMANOVA; Anderson et al., 2008). The analysis is based on Bray-Curtis resemblance measures calculated with range standardized data. The model treats reach as a fixed factor and years of mapping as repeated measures nested within reaches. Furthermore, a hierarchical cluster analysis based on Bray-Curtis resemblance measures and single linkage clustering is used to identify years with similar areal extents across all reaches.
In an effort to evaluate the extent of seagrass in years without maps, Pearson correlation coefficients are calculated for combinations of range standardized areal extents, distances to EOCs, and standardized depths at the EOCs. Strong, positive correlations provide increased confidence in using measures from transects to evaluate changes in seagrass extent between maps.
Persistence is defined as the number of consecutive maps in which a given polygon of seagrass is present. Persistence is determined for each reach across the 11 years with maps between 1996 and 2019. The polygons are intersected with bathymetry to identify the depths relative to MWL spanned by each polygon in each combination of reach and score for persistence (Figure 2). Depth zones with more persistent seagrass are determined from summary statistics. In addition, mean percent covers from 1996 to 2019 are calculated for 0.1-m depth increments for transects in reaches 1–6, with the resulting data analyzed with a hierarchical cluster analysis based on Pearson correlation similarity measures and group average clustering (Anderson et al., 2008).
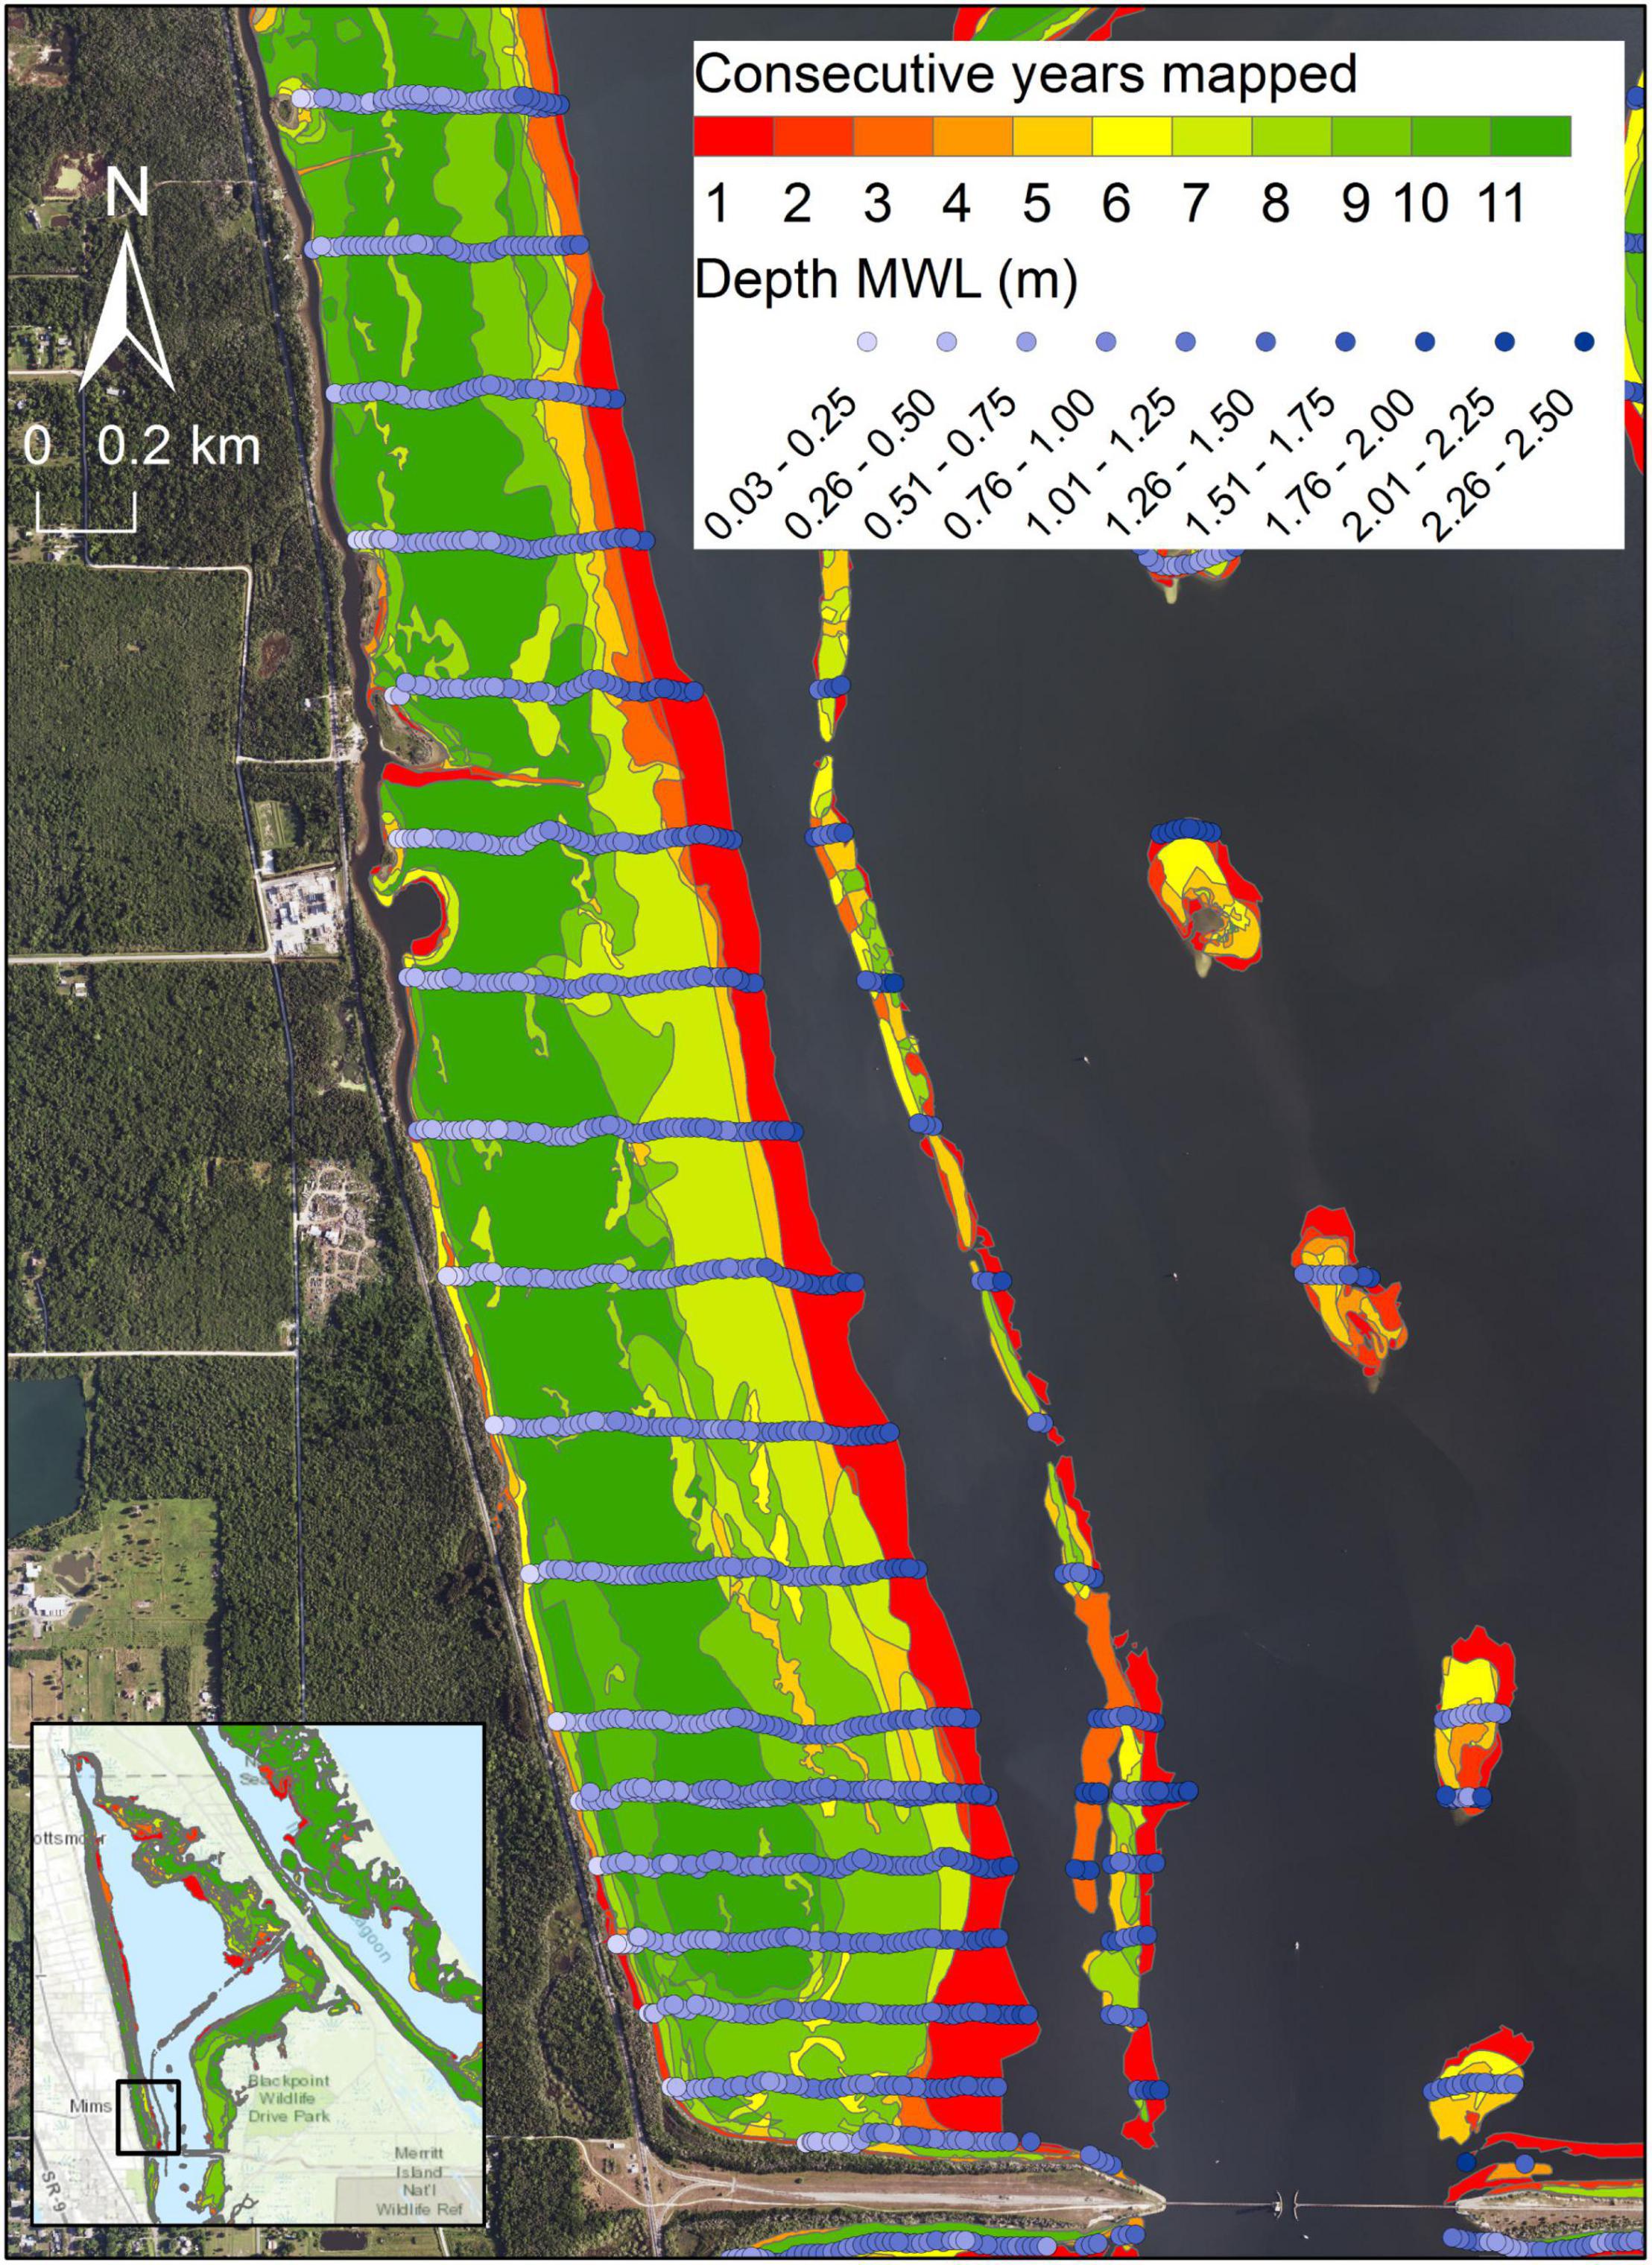
Figure 2. An example of generating depths for seagrass polygons in northern Indian River Lagoon for determining persistence across differing numbers of map years. Blue circles represent individual measurements of depth.
Percent cover values from summer surveys of transects in reaches 1–6 are evaluated in two ways. The mean percent cover recorded in quadrats placed within the beds is calculated for the whole system as a measure of the quality of seagrass within the beds. The same data are adjusted to account for changes in distances to the EOCs so that they accurately reflect the amount of seagrass in the system, i.e., a small area with dense seagrass is equivalent to a larger area with sparse seagrass. The adjustment for each transect involves adding values of zero beyond the recorded EOC out to the maximum distance recorded from 1996 to 2019. The resulting data are range standardized and used in a PERMANOVA based on Bray-Curtis resemblance measures. The model treats years and reaches as fixed factors, depth zones as a random factor nested in combinations of years and reaches, and transects as repeated measures nested within combinations of years and reaches.
Changes in the distribution and percent cover of seagrass are driven by changes in salinity, water temperature, and light availability. Environmental limits applied here represent mean values for H. wrightii, S. filiforme, and T. testudinum, i.e., stress as indicated by reduced mean percent cover is caused by salinities below 23 psu, water temperatures below 20°C, and percent of subsurface irradiance below 27% at the deep edge of the range of depths where seagrass persisted longest (Morris et al., 2021). These limits reflect changes in production or loss of leaves in response to salinity, temperature, and light availability, but they also reflect responses to interactions among these factors and the results of intraspecific and interspecific interactions. Using water quality data collected from 1997 to 2018, mean values for each parameter are calculated for each combination of reach and month within year. Heatmaps identify reaches and months where seagrasses experienced stress. In addition, mean percent cover values from surveys are calculated for each transect. The difference in cover between each pair of consecutive surveys is calculated. Those differences are culled to a set that exhibited decreases in cover following at least 1 month of subsurface irradiance below 27%, and the resulting data are converted to proportional changes in cover per month of low light before being ordered by increasing initial mean percent cover. A boundary analysis using squared Euclidean distances calculated for moving windows encompassing four, six, and eight differences identifies a threshold in standardized proportional differences and an associated initial mean percent cover (Ludwig and Tongway, 1995). The validity of the threshold is tested with a t-test that compares the proportional differences above the threshold to those below it without assuming equal variances. A significant t-test indicates that the initial mean percent cover associated with the threshold represents an ecological boundary in resilience to low light.
Changes in the areal extent or percent cover of seagrass affect the cycling of C, N, and P. Given relatively constant loads of these elements to the IRL, decreases in the amount of seagrass due to mortality or decreases in uptake due to reduced growth result in more C, N, and P being available to other primary producers, including phytoplankton and drift macroalgae. To elucidate such changes in availability for these key elements, the relevant percent cover values, as determined by statistically significant terms in the PERMANOVA described above, are converted to biomass (g dry weight m–2) using Equation 1 (Hanisak, 2001), and the resulting biomasses are converted to amounts of C, N, and P using the percentages of each element found in the aboveground portions of H. wrightii shoots. Prior to estimating the effects on cycling of C, N, and P, temporal variation in the content of aboveground and belowground tissues is investigated via a series of PERMANOVAs that treat years as a fixed factor and sampling events as a random factor nested in years.
Across all reaches, approximately 3,000 ha of seagrass were lost between 1943 and 1994 (Figure 3 and Supplementary Table 1). The timing of this loss cannot be determined rigorously due to a lack of data. However, Haddad and Harris (1985) noted approximately a 35% decline in seagrass in the 1950s that correlated with decreased water transparency, and dredge and fill projects removed seagrass to create new residential and recreational areas throughout the lagoon prior to the 1970s (Woodward-Clyde Consultants, 1994). Therefore, the expansion of seagrass from the 1990s to 2007–2009 represented a recovery. As the extent of seagrass beds expanded from 2003 to 2009, the mean percent cover within the beds decreased, whereas the mean percent cover standardized to maximum transect lengths remained relatively stable (Figure 3). These results indicated that a similar biomass of seagrass was distributed more sparsely as the beds expanded.
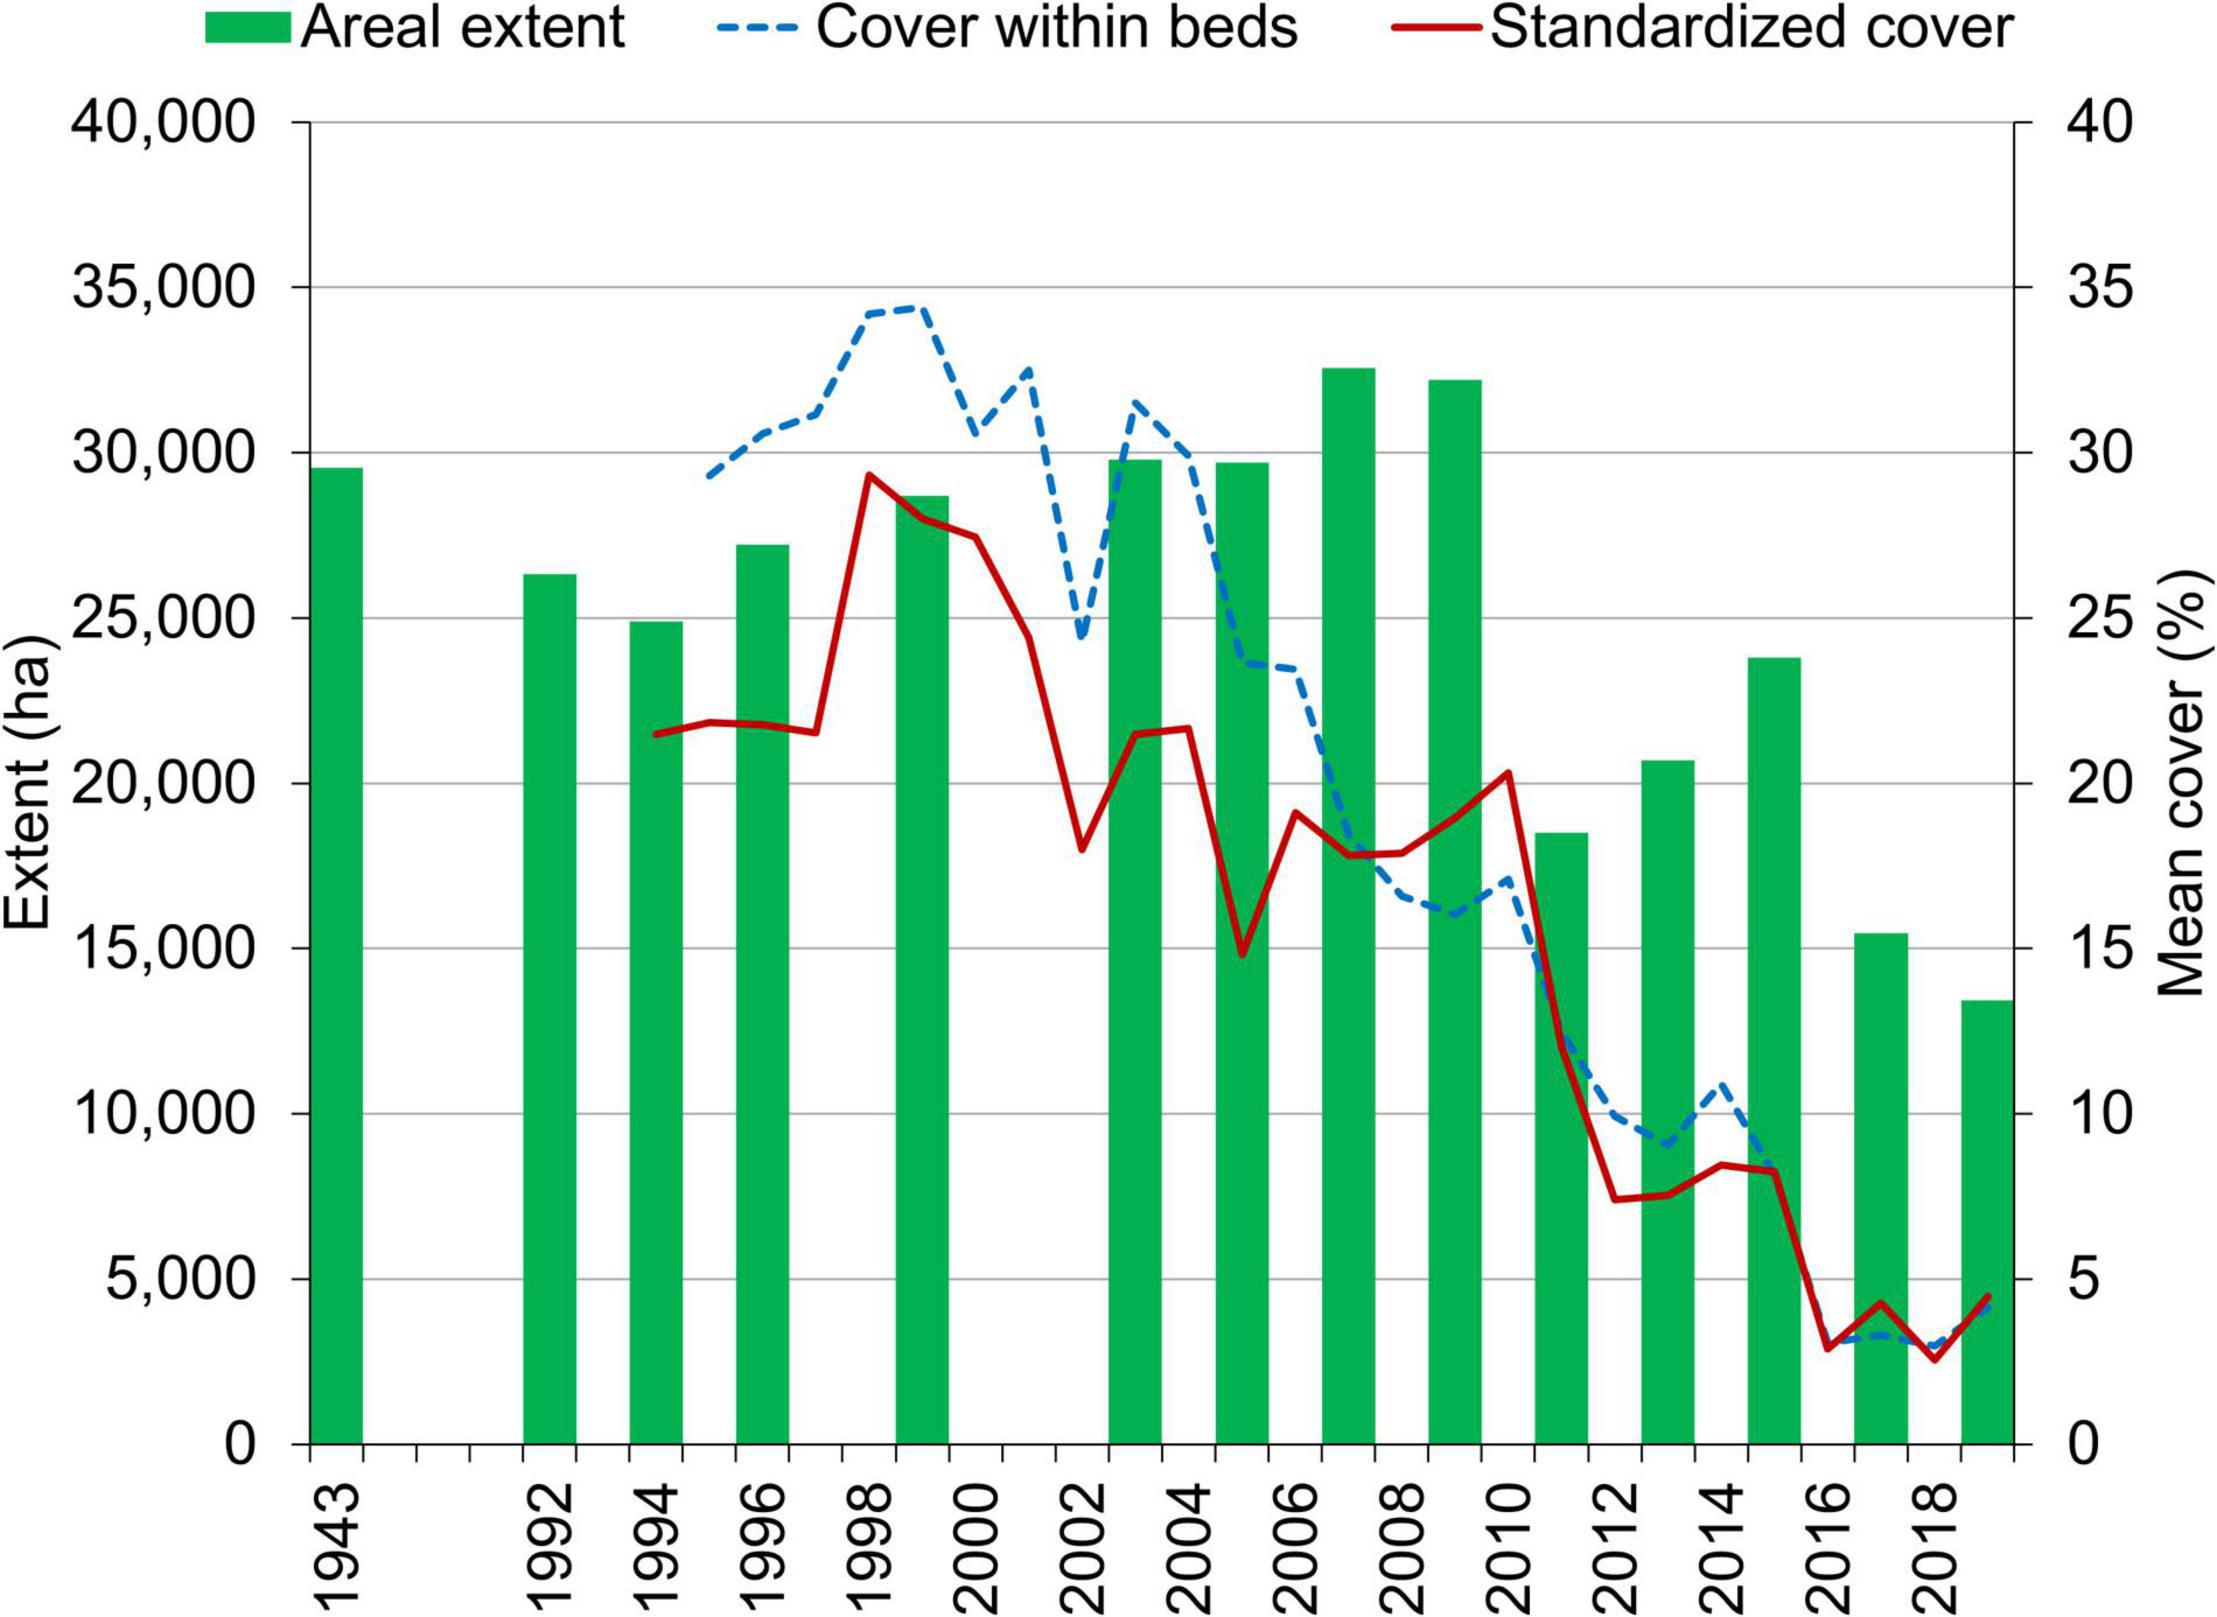
Figure 3. Areal extent of seagrass in maps derived from aerial imagery and percent cover derived from surveys of fixed transects.
A PERMANOVA indicated significant differences in the areal extent of seagrass among the years with maps after 1994 (Table 1). A hierarchical cluster analysis indicated three groups of years with similarities of 91% (Figure 4). The years from 1994 to 2009 formed one group; 2011, 2013, and 2015 formed a second group; and 2017 and 2019 formed a third group. These groups tracked the lagoon-wide increase in hectares of seagrass from 1994 to 2009, the initial decrease in areal extent in 2011, and the second decrease in extent in 2017 (Figure 3).

Table 1. PERMANOVA based on range standardized hectares in each of the reaches (reaches 7, 8, 9 were combined) for each of 12 maps (1994–2019).
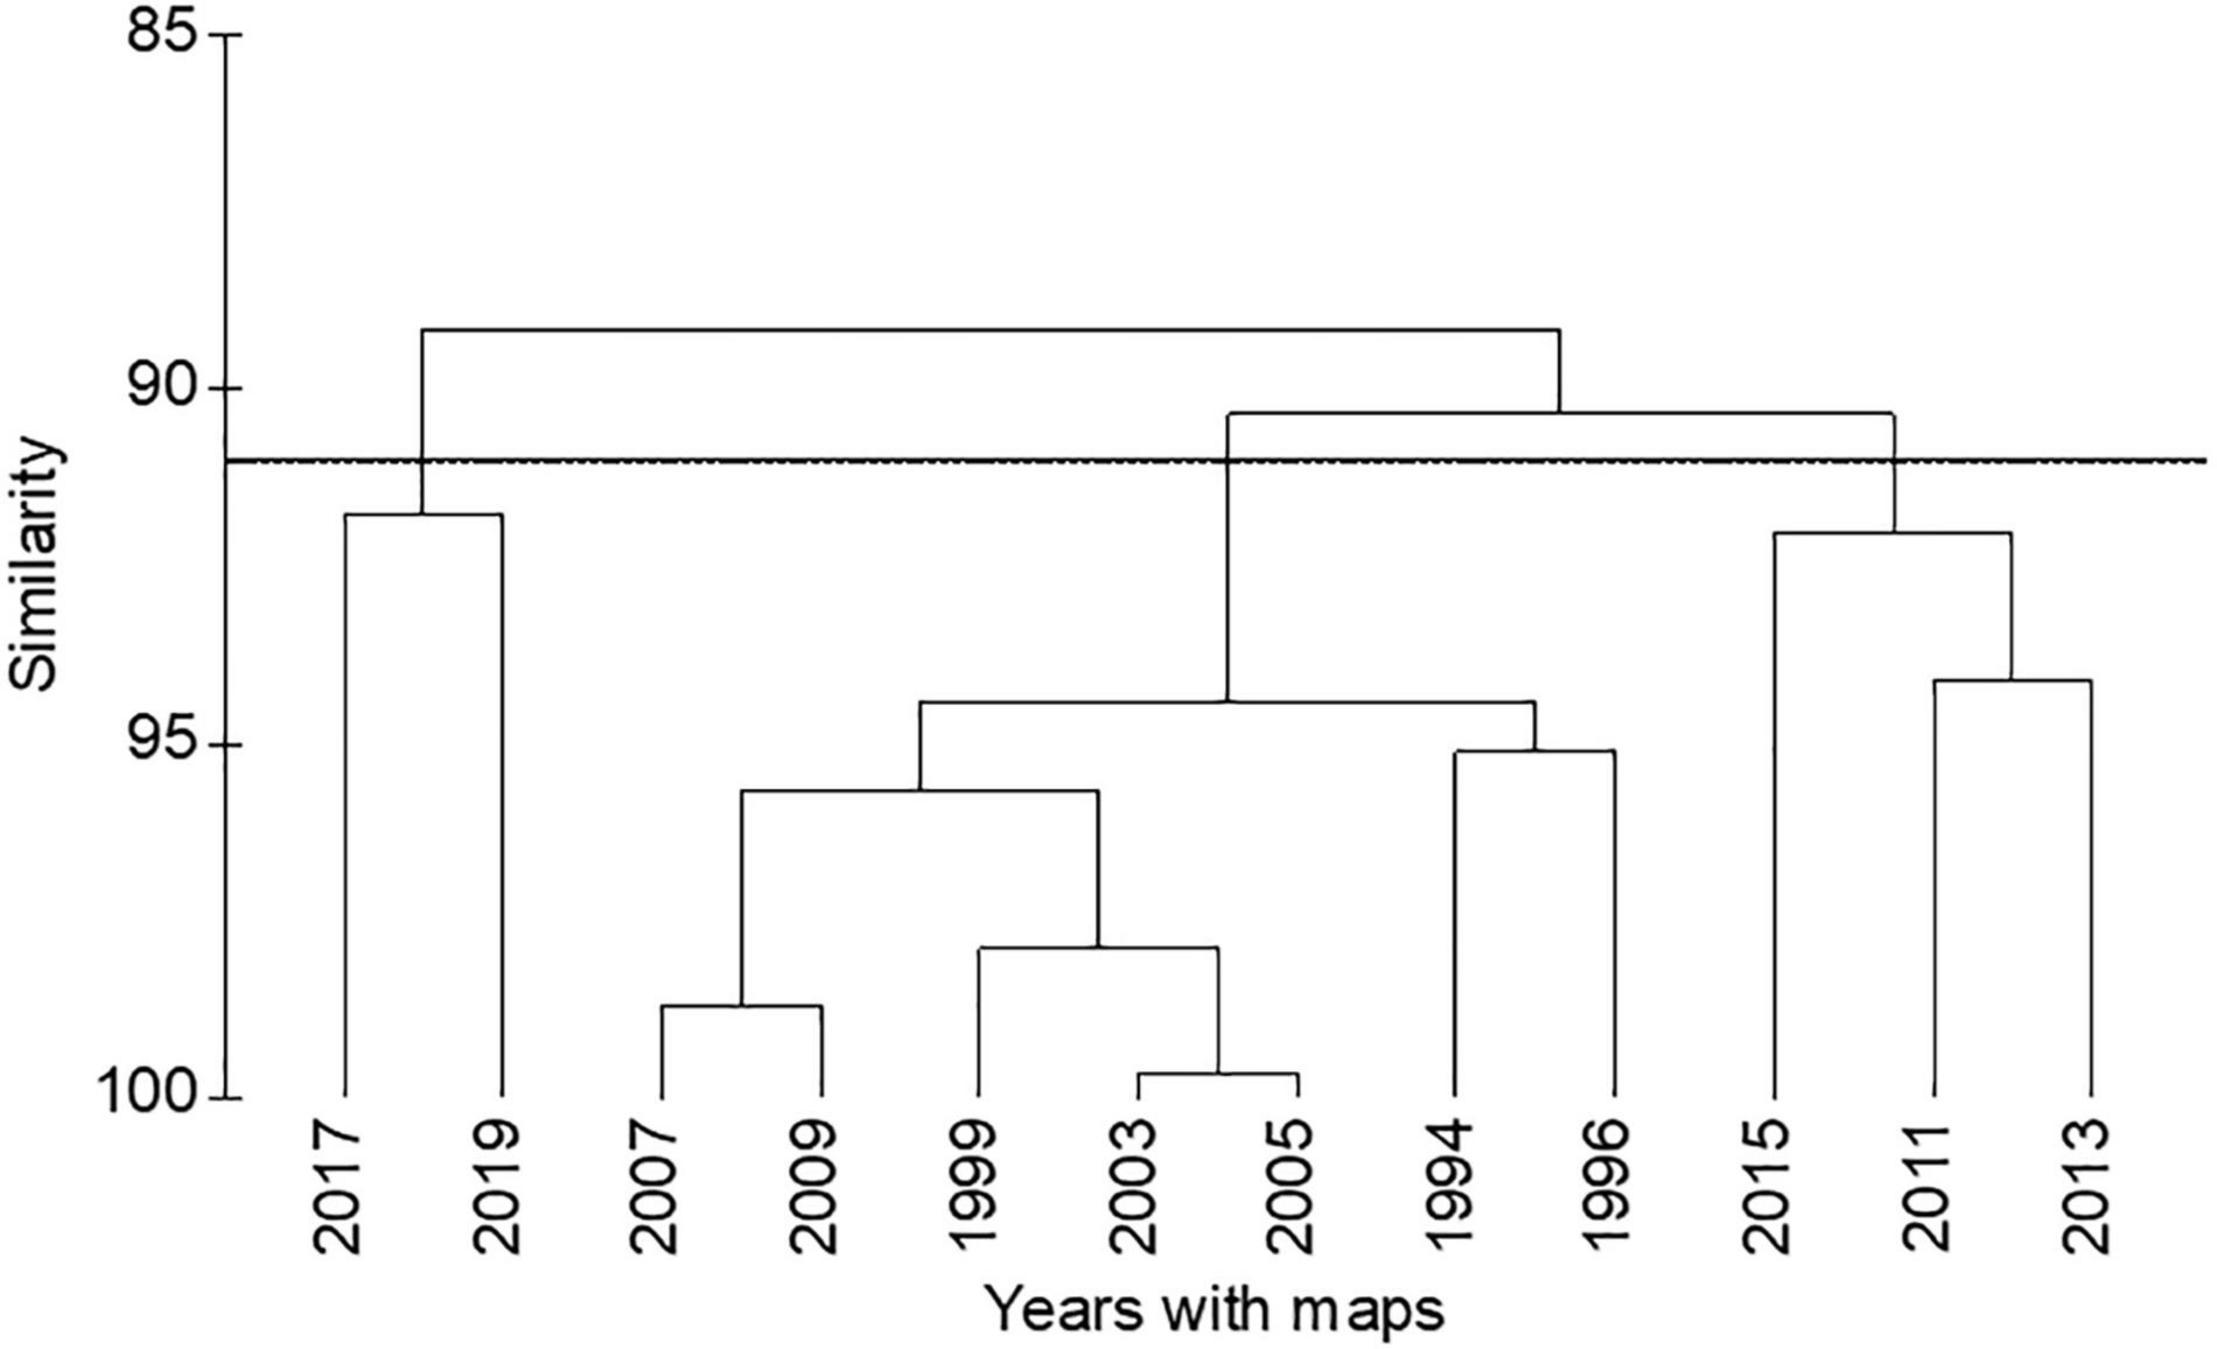
Figure 4. Hierarchical cluster analysis of areal extent of seagrass for years 1994–2019. Horizontal line marks a similarity of 91%.
In most reaches, correlations indicated useful relationships among distance to the EOC or transect length, depth below MWL at the EOC, and areal extent (r ≥ 0.70; Table 2). The lack of data on depths precluded two correlations in reaches 7–9, but those reaches, along with reach 1, had the weakest correlations.
Overall, distance to the EOC and depth at the EOC paralleled changes in areal extent. As an example, the consistent mean distances to the EOC suggested there was little change in areal extent in years between maps and relatively large decreases in areal extent in reaches 1–6 and 8 during 2010–2011 and 2016–2017 (Figure 5).
In combination with bathymetry, maps also provided a means of assessing persistence of seagrass at different depths. Box plots of the depths intersected by polygons that persisted across differing numbers of consecutive maps from 1996 to 2019 indicated that polygons detected in seven or more maps tended to span depths of 0.5–1.0 m (Figure 6).
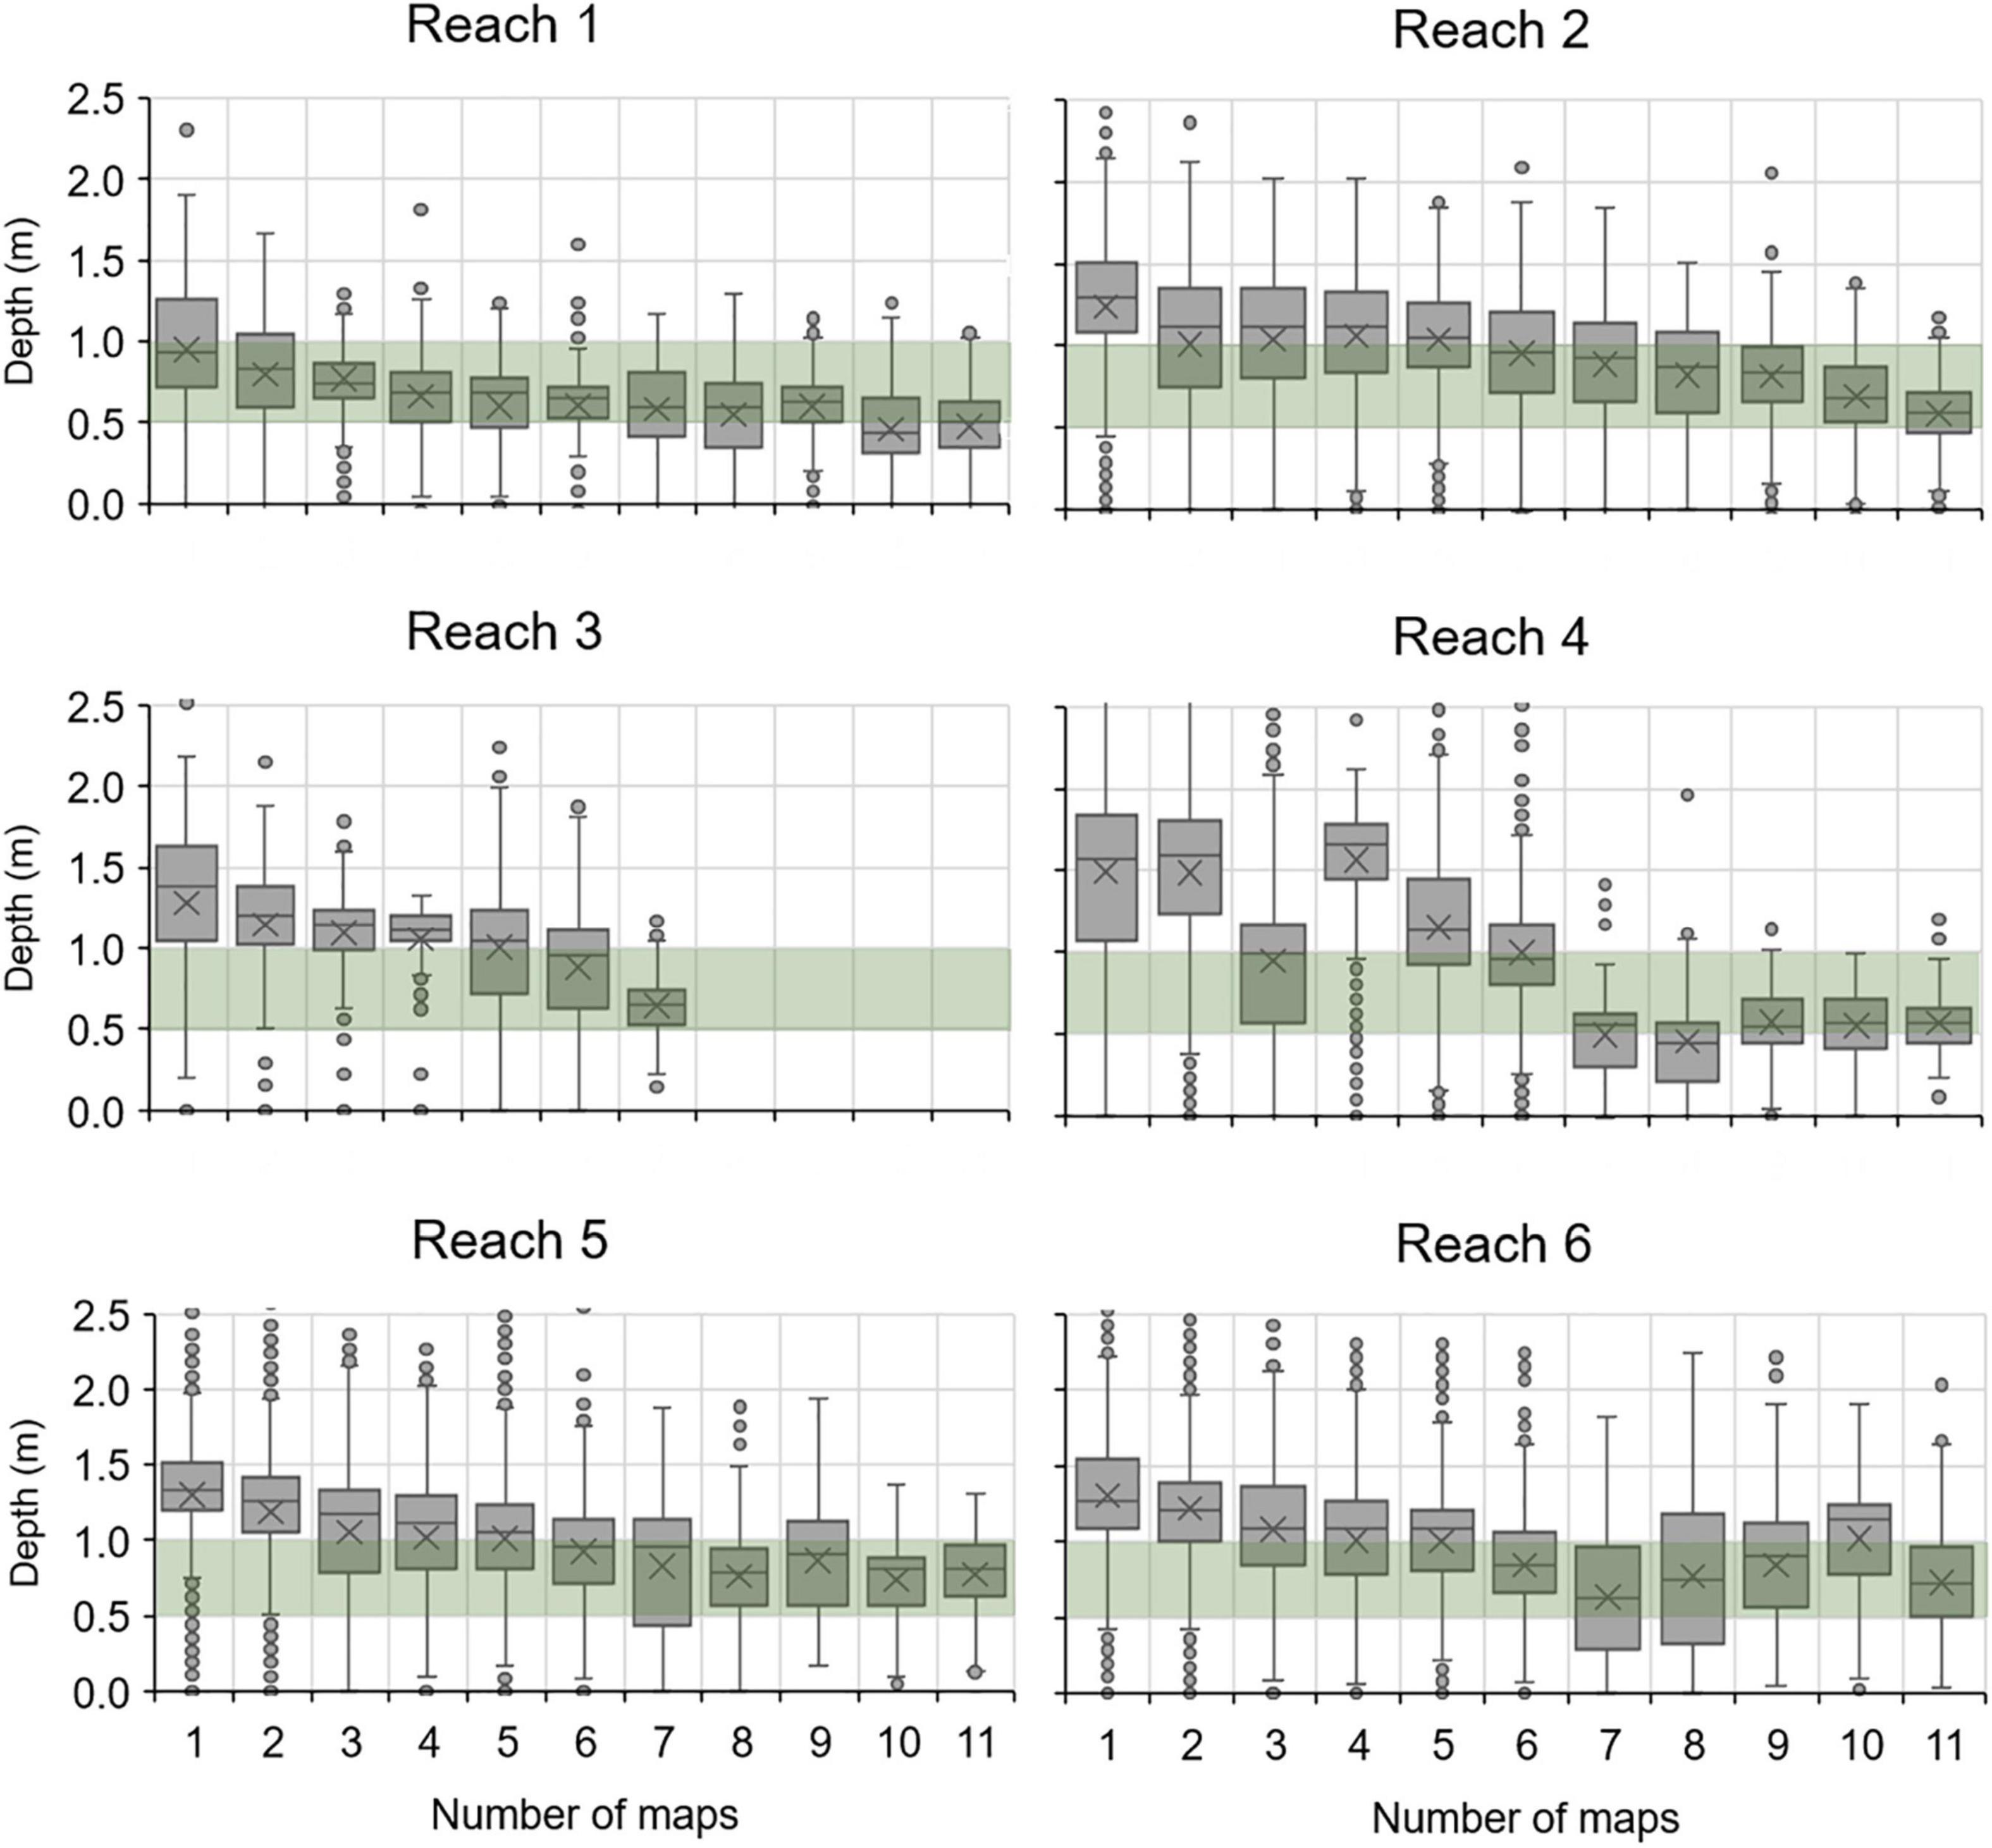
Figure 6. Box plots for depths within polygons of seagrass that persisted across differing numbers of maps. Green bar, 0.5–1.0 m depths below mean water level (MWL); X, mean depth; horizontal line, median depth; box, interquartile range; whiskers, 5th and 95th percentiles; points, values beyond the 5th and 95th percentiles.
Persistence varied among reaches (Figure 7). Reaches 1 and 2 had the highest percentage of hectares that persisted across 10–11 maps (66.7 and 37.8%, respectively). In reach 3, no hectares persisted for more than seven consecutive mapping years, which meant seagrasses did not persist beyond 2011. Reaches 4 and 5 had the fewest persistent hectares, with only 5% of them present for 10 or more years, and reaches 6 and 7–9 had a moderate number of persistent hectares, i.e., 15–25%.
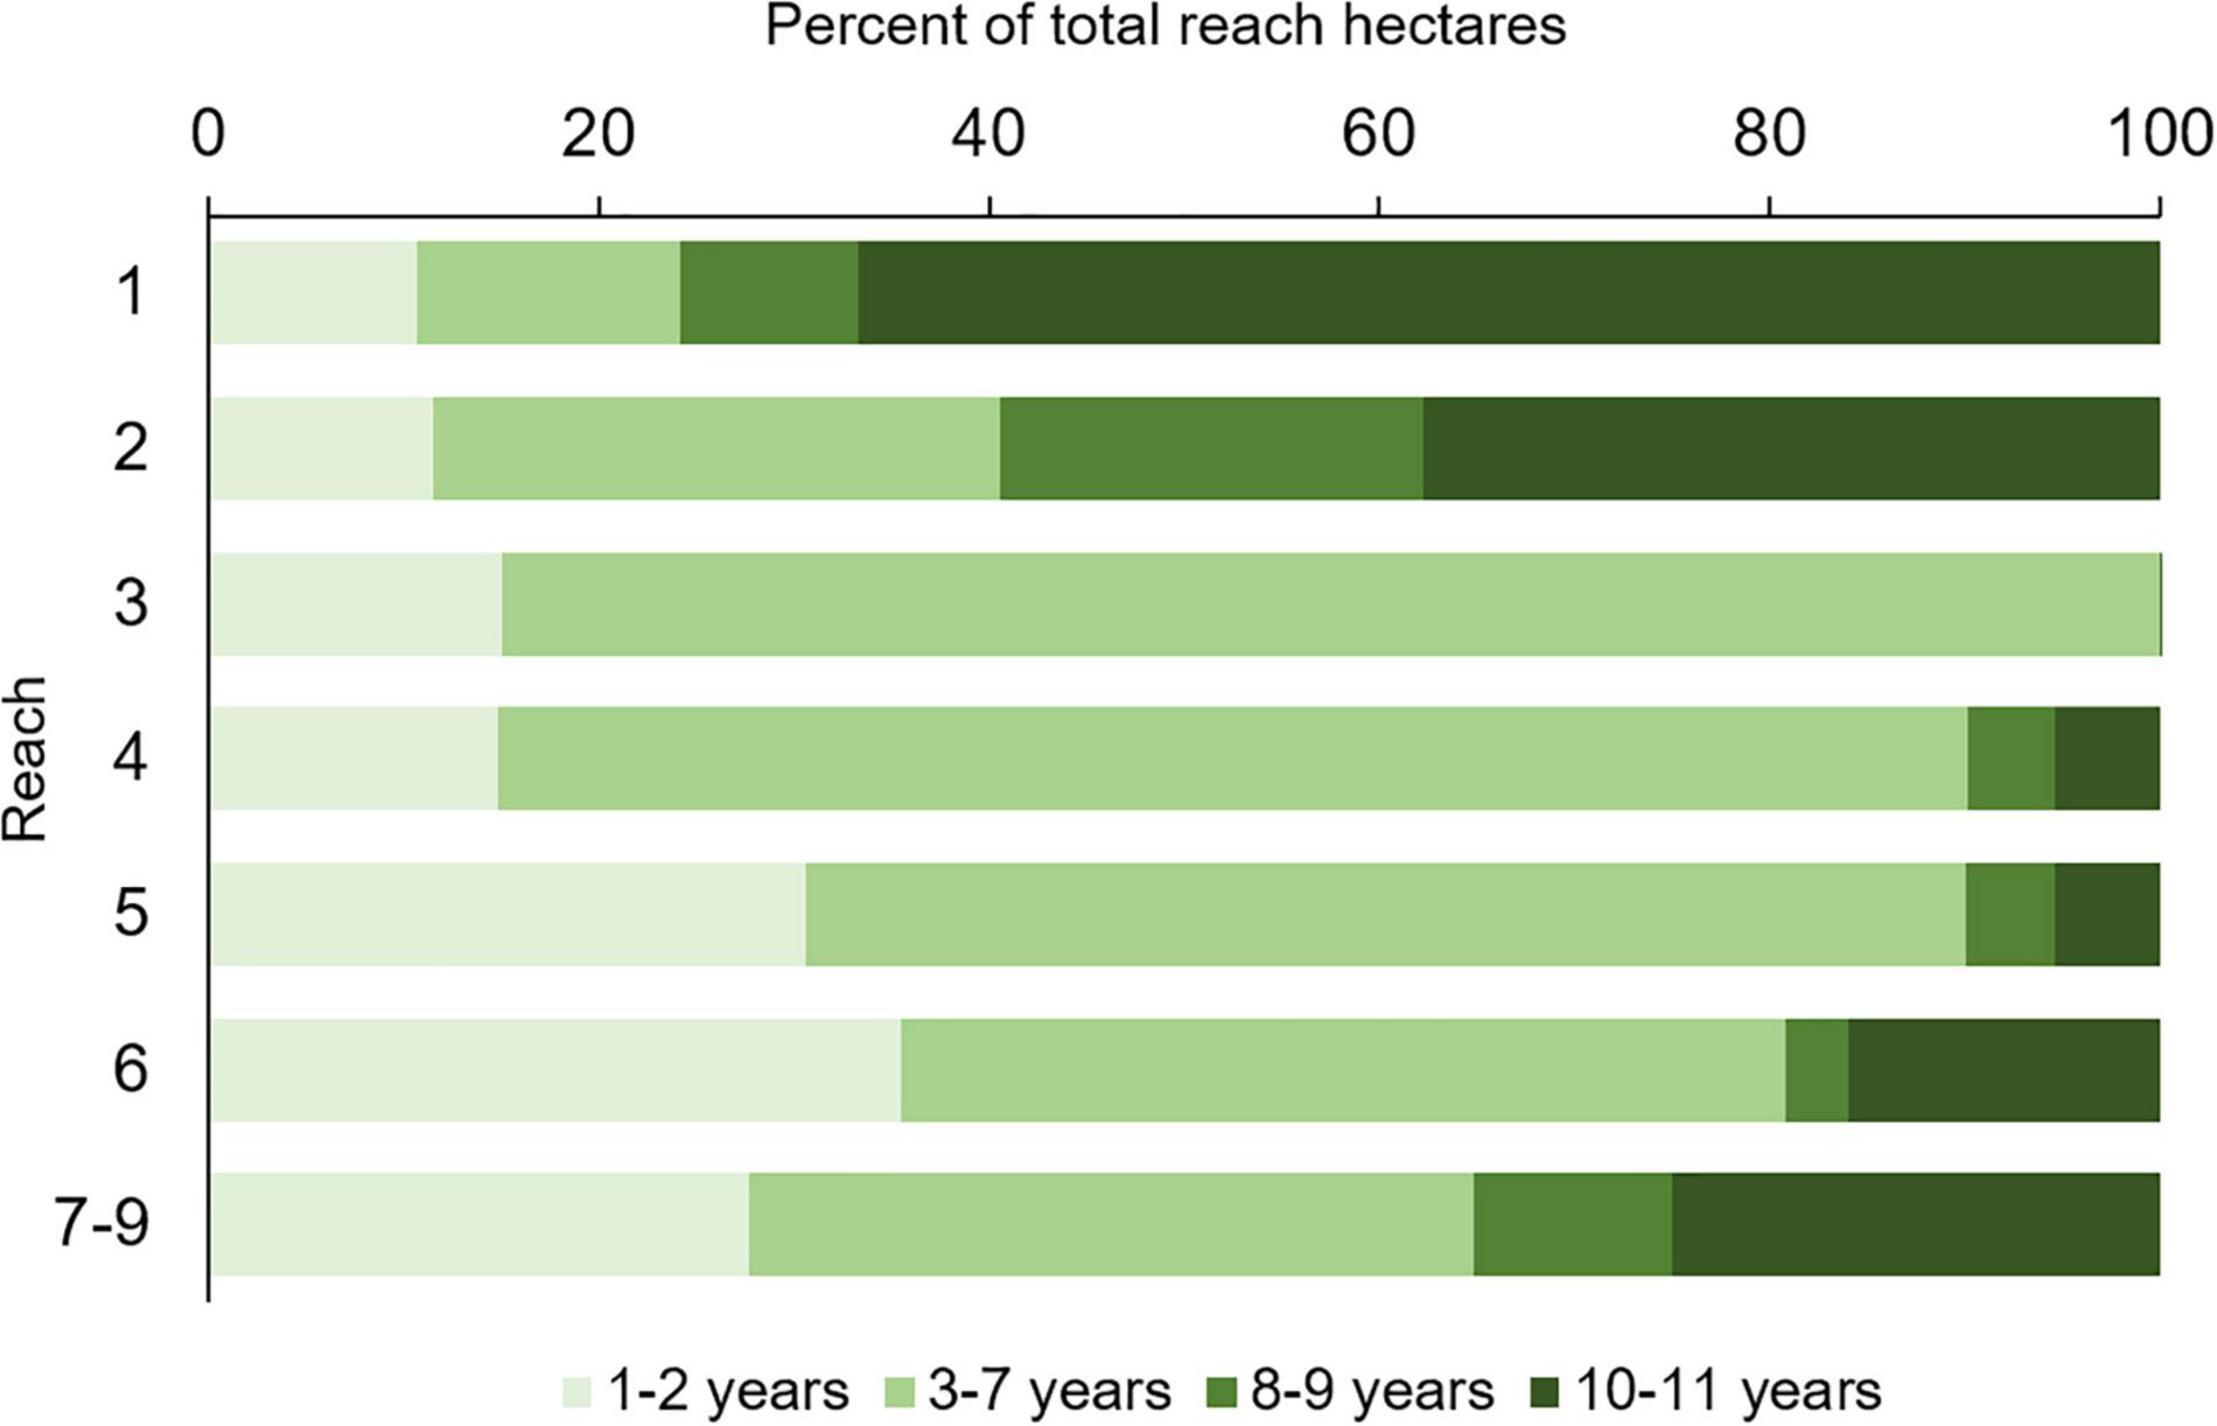
Figure 7. Percent of total hectares of seagrass within each reach that persisted for differing numbers of maps.
In addition to varying in extent and location, seagrass beds also varied in quality, which was documented as percent cover of seagrass within mapped footprints. Cover varied both temporally and spatially (Figure 8). Cover was more stable in the northern reach (reach 1) and in three southern reaches (reaches 7–9 combined) until 2016. In contrast, the central reaches, 2–6 were more variable and exhibited larger losses in mean percent cover after 2011. Interestingly, percent cover decreased following three hurricanes in 2004–2005, but it rebounded in most reaches.
A boundary analysis of proportional decreases in mean percent cover for transects standardized to the number of months with light below 27% of subsurface irradiance indicated that losses were greater when initial mean percent cover was below 20% (one-tailed t102 = −16.64; p < 0.001). On average, the rate of decrease in mean percent cover per month of exposure to low light was approximately 2 × faster when the initial mean percent cover was below 20%.
Given the variation in persistence across depths, a hierarchical cluster analysis was performed on mean percent covers in different depth zones below MWL. The analysis yielded three groups: shallow (0.1–0.4 m), mid (0.5–0.9 m), and deep (1.0–2.0+ m) at 43% similarity (Figure 9).
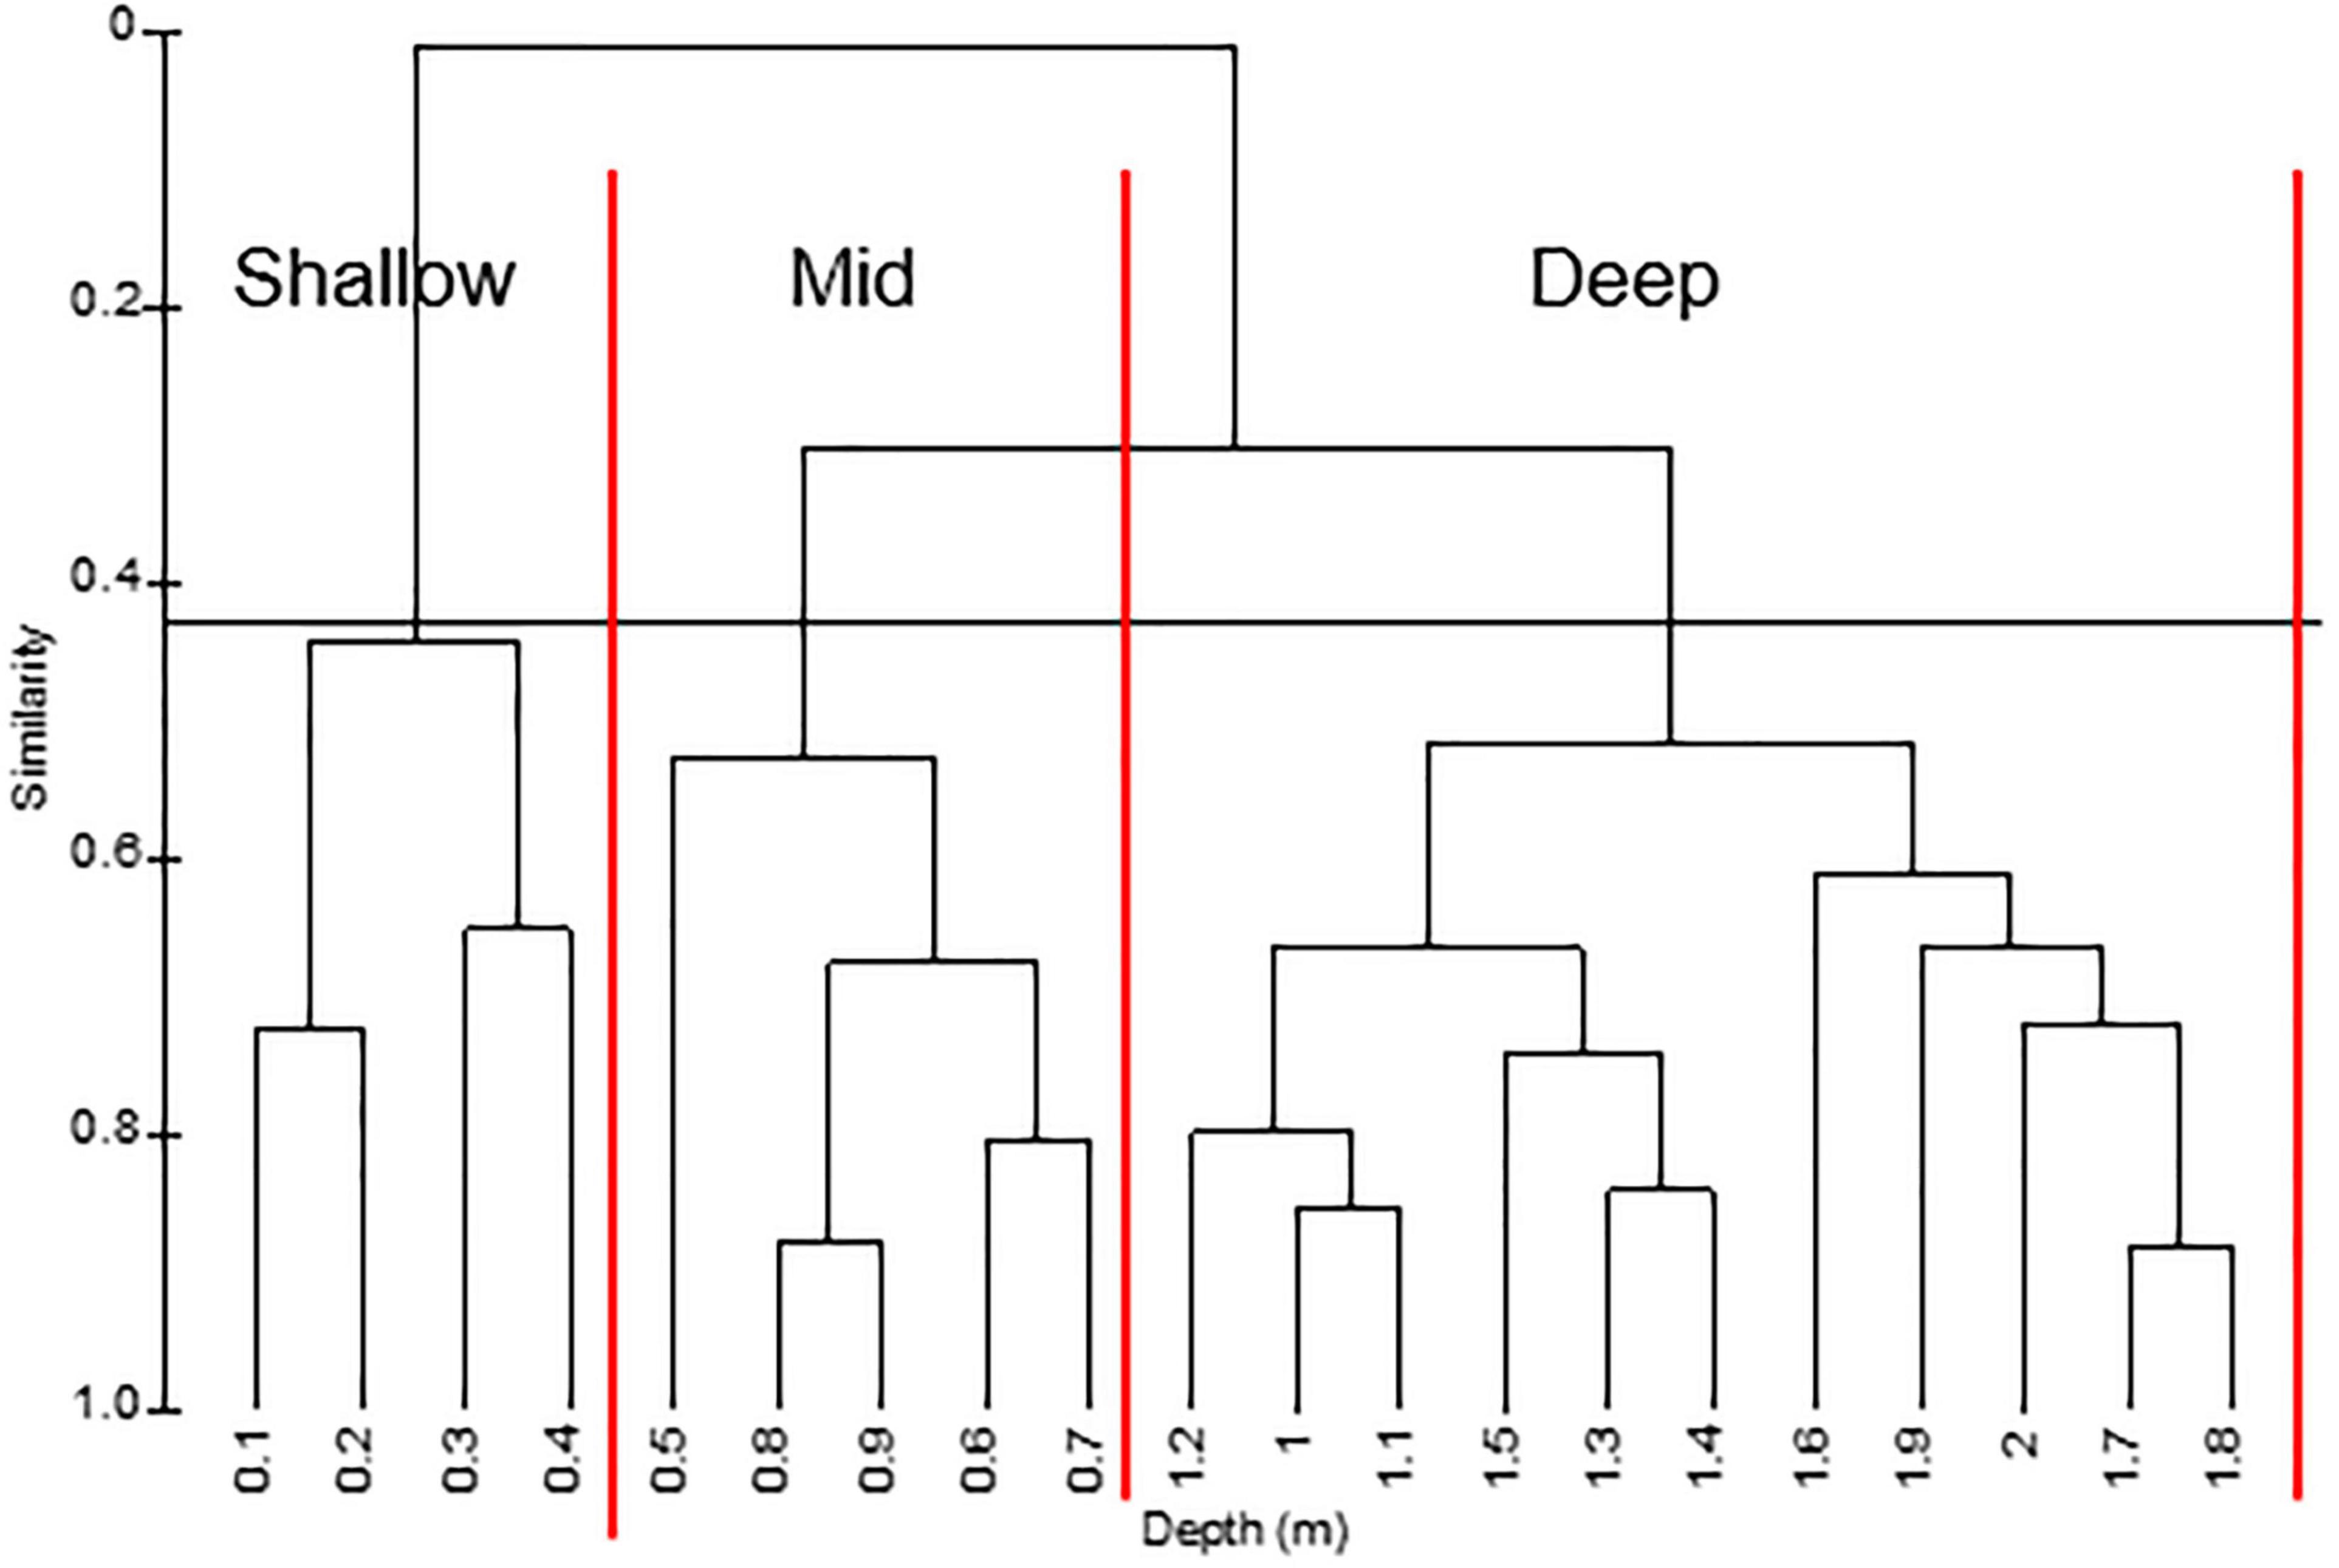
Figure 9. Hierarchical cluster of water depths based on mean percent cover at different depths along transects surveyed from 1996 to 2019. Horizontal line separates groups at a similarity of 0.43. Vertical lines separate depth zones.
Further evidence for significant variation in cover among the three depth zones came from a PERMANOVA that indicated mean percent cover during the summer varied significantly among depths in the combinations of year (1996–2019) and reach (reaches 1–6; Table 3). Prior to 2011, the mean percent cover at the mid depths (0.5–0.9 m) tended to be higher (Figure 10). During the period of record, all reaches exhibited declines in mean percent cover, with mean cover in reaches 3, 4, 5, and 6 declining in 2011 and mean cover in reaches 1 and 2 declining in 2016–2018 (Figure 10).
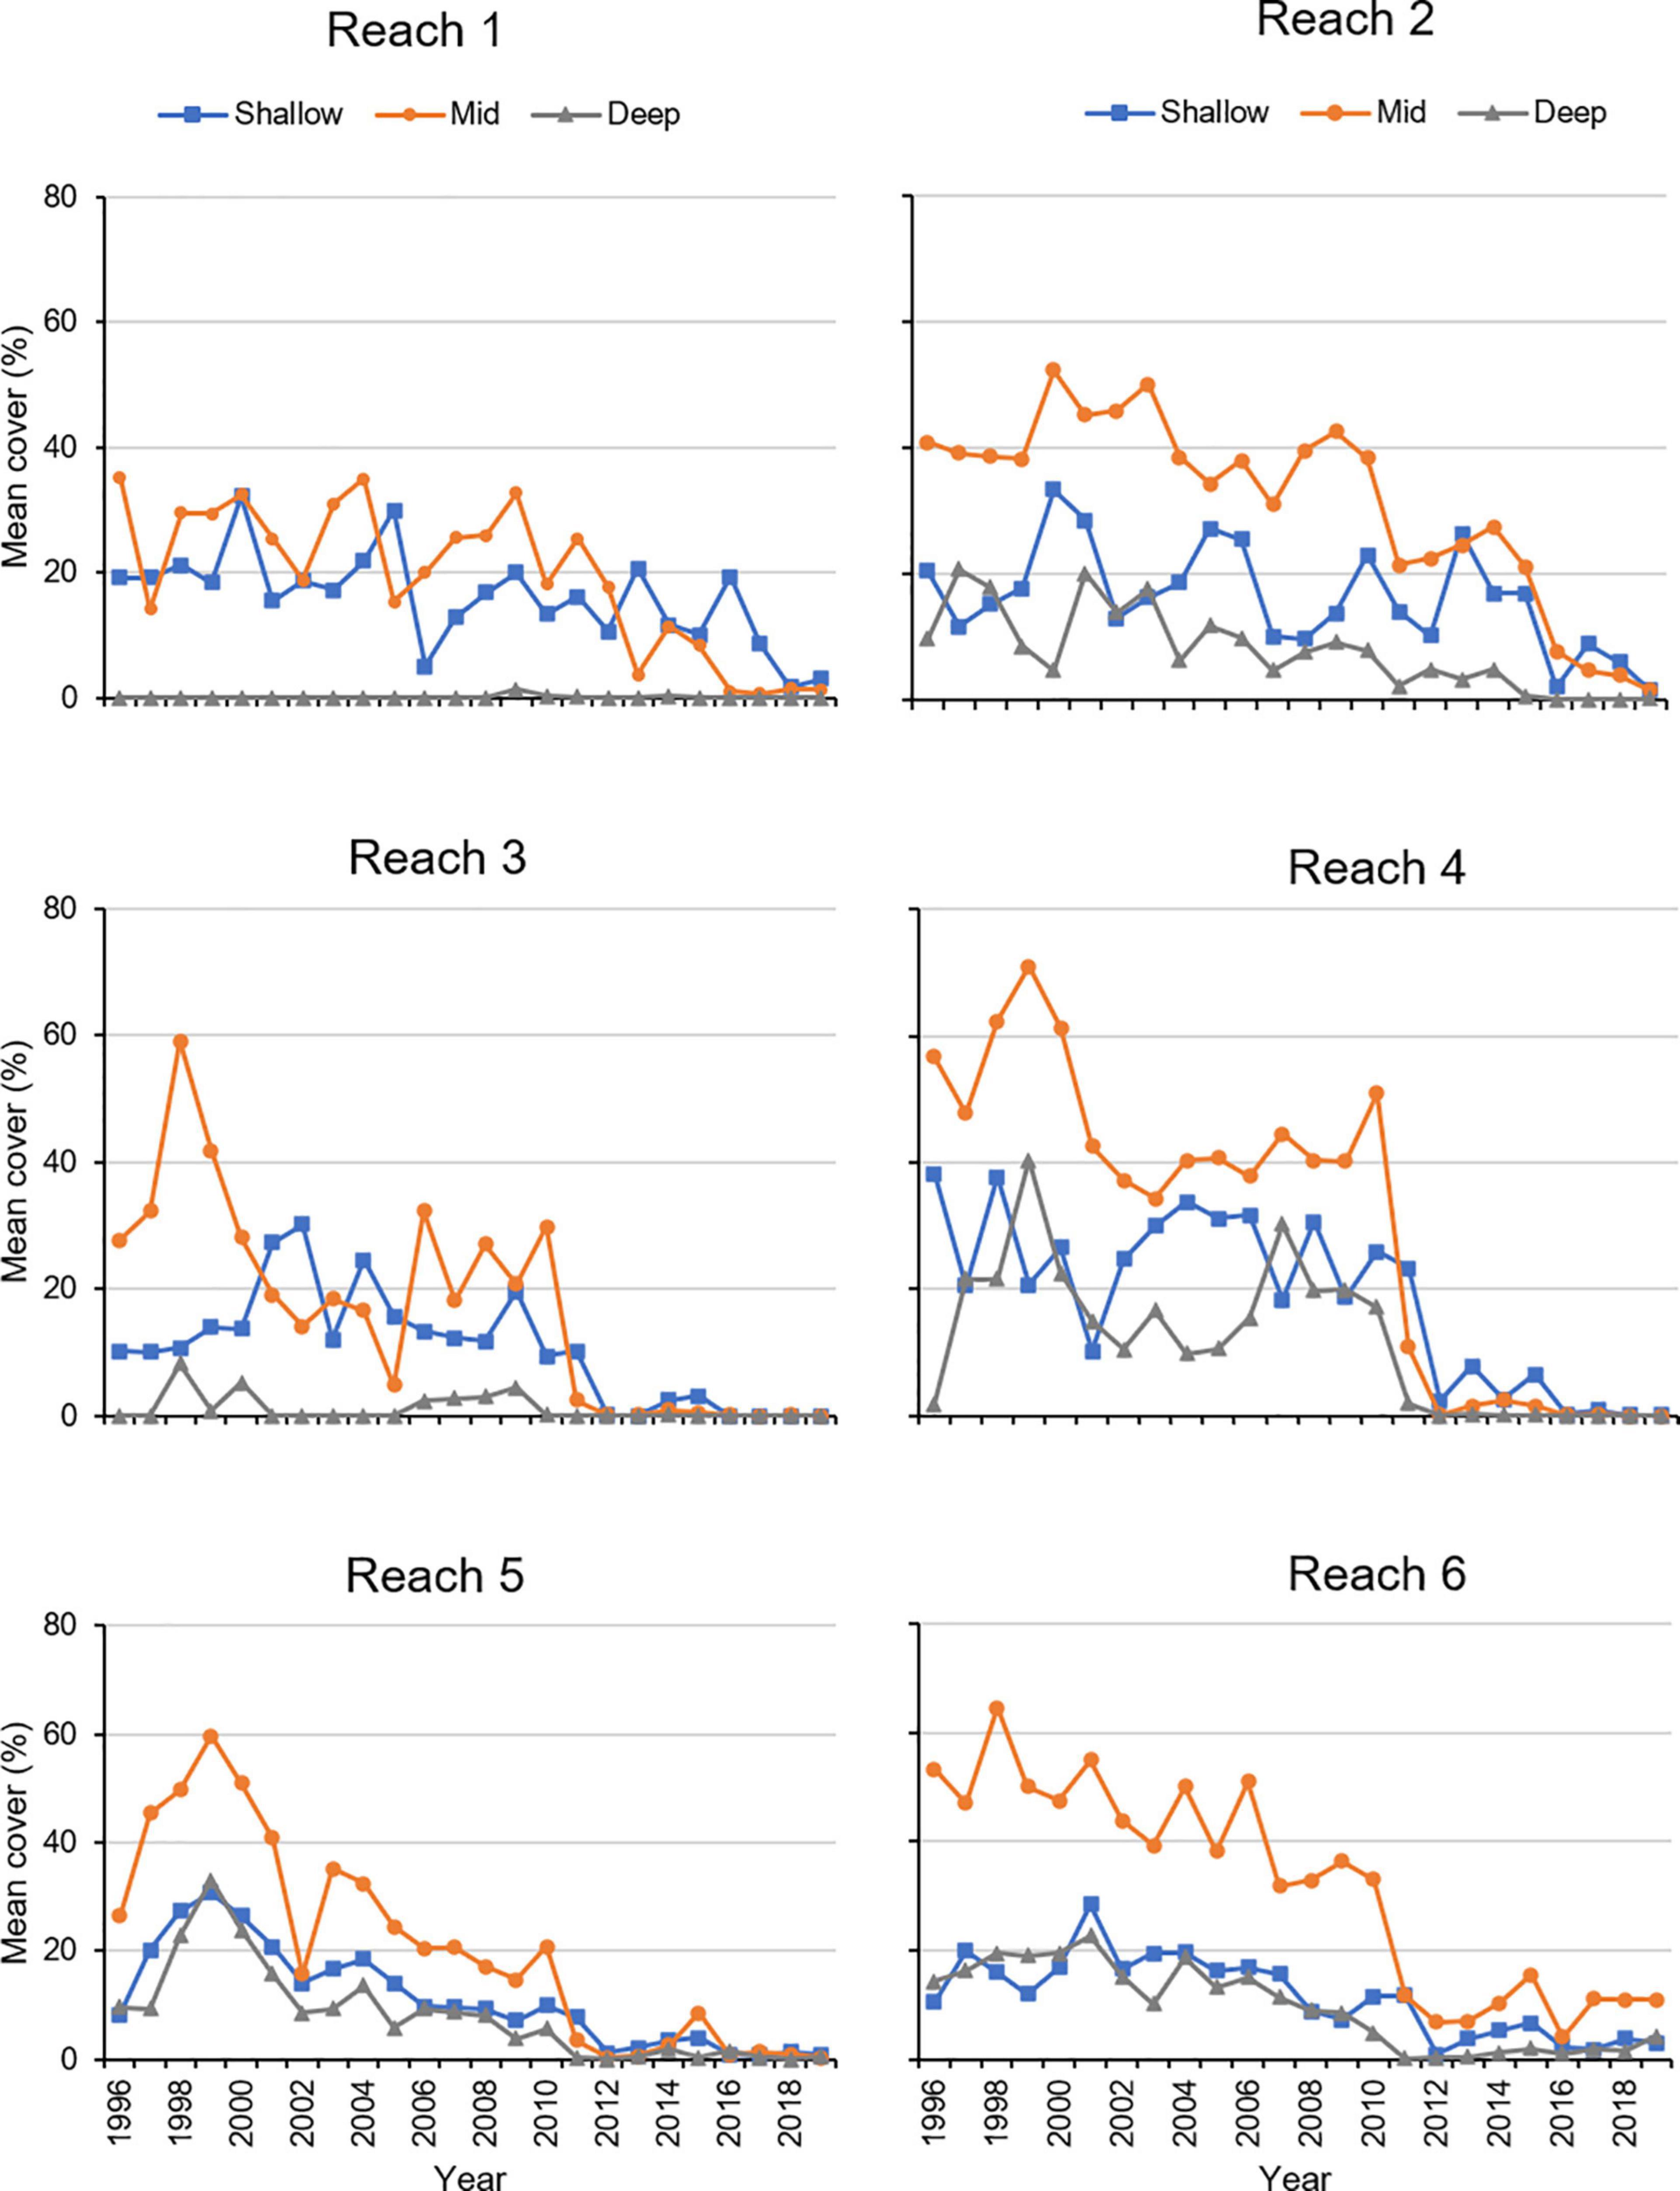
Figure 10. Mean percent cover of seagrass during summer in three depth zones. Shallow = 0.1–0.4 m, Mid = 0.5–0.9 m, Deep = 1.0–2.0+ m.
Based on the mean of the environmental limits established for H. wrightii, S. filiforme, and T. testudinum (Morris et al., 2021) and the persistence of seagrass at depths of 0.5–0.9 m, limits for stress were set at salinities below 23 psu, water temperatures below 20°C, and percent of subsurface irradiance reaching 0.9 m below 27%. Heatmaps indicated that longer periods of stressful salinities affected reaches 3–5 in 1997–2000, 2002–2003, 2004–2006, 2008–2009, and 2017–2018 (Figure 11). Temperatures were stressful during the winters of most years, with longer periods of stress in the winters of 1998, 2004, 2008, 2009, 2010, and 2011 (Figure 11). Stress from reduced light availability occurred repeatedly in reach 1, and more widespread stress occurred in 2010–2011, 2016, and 2018 (Figure 11).
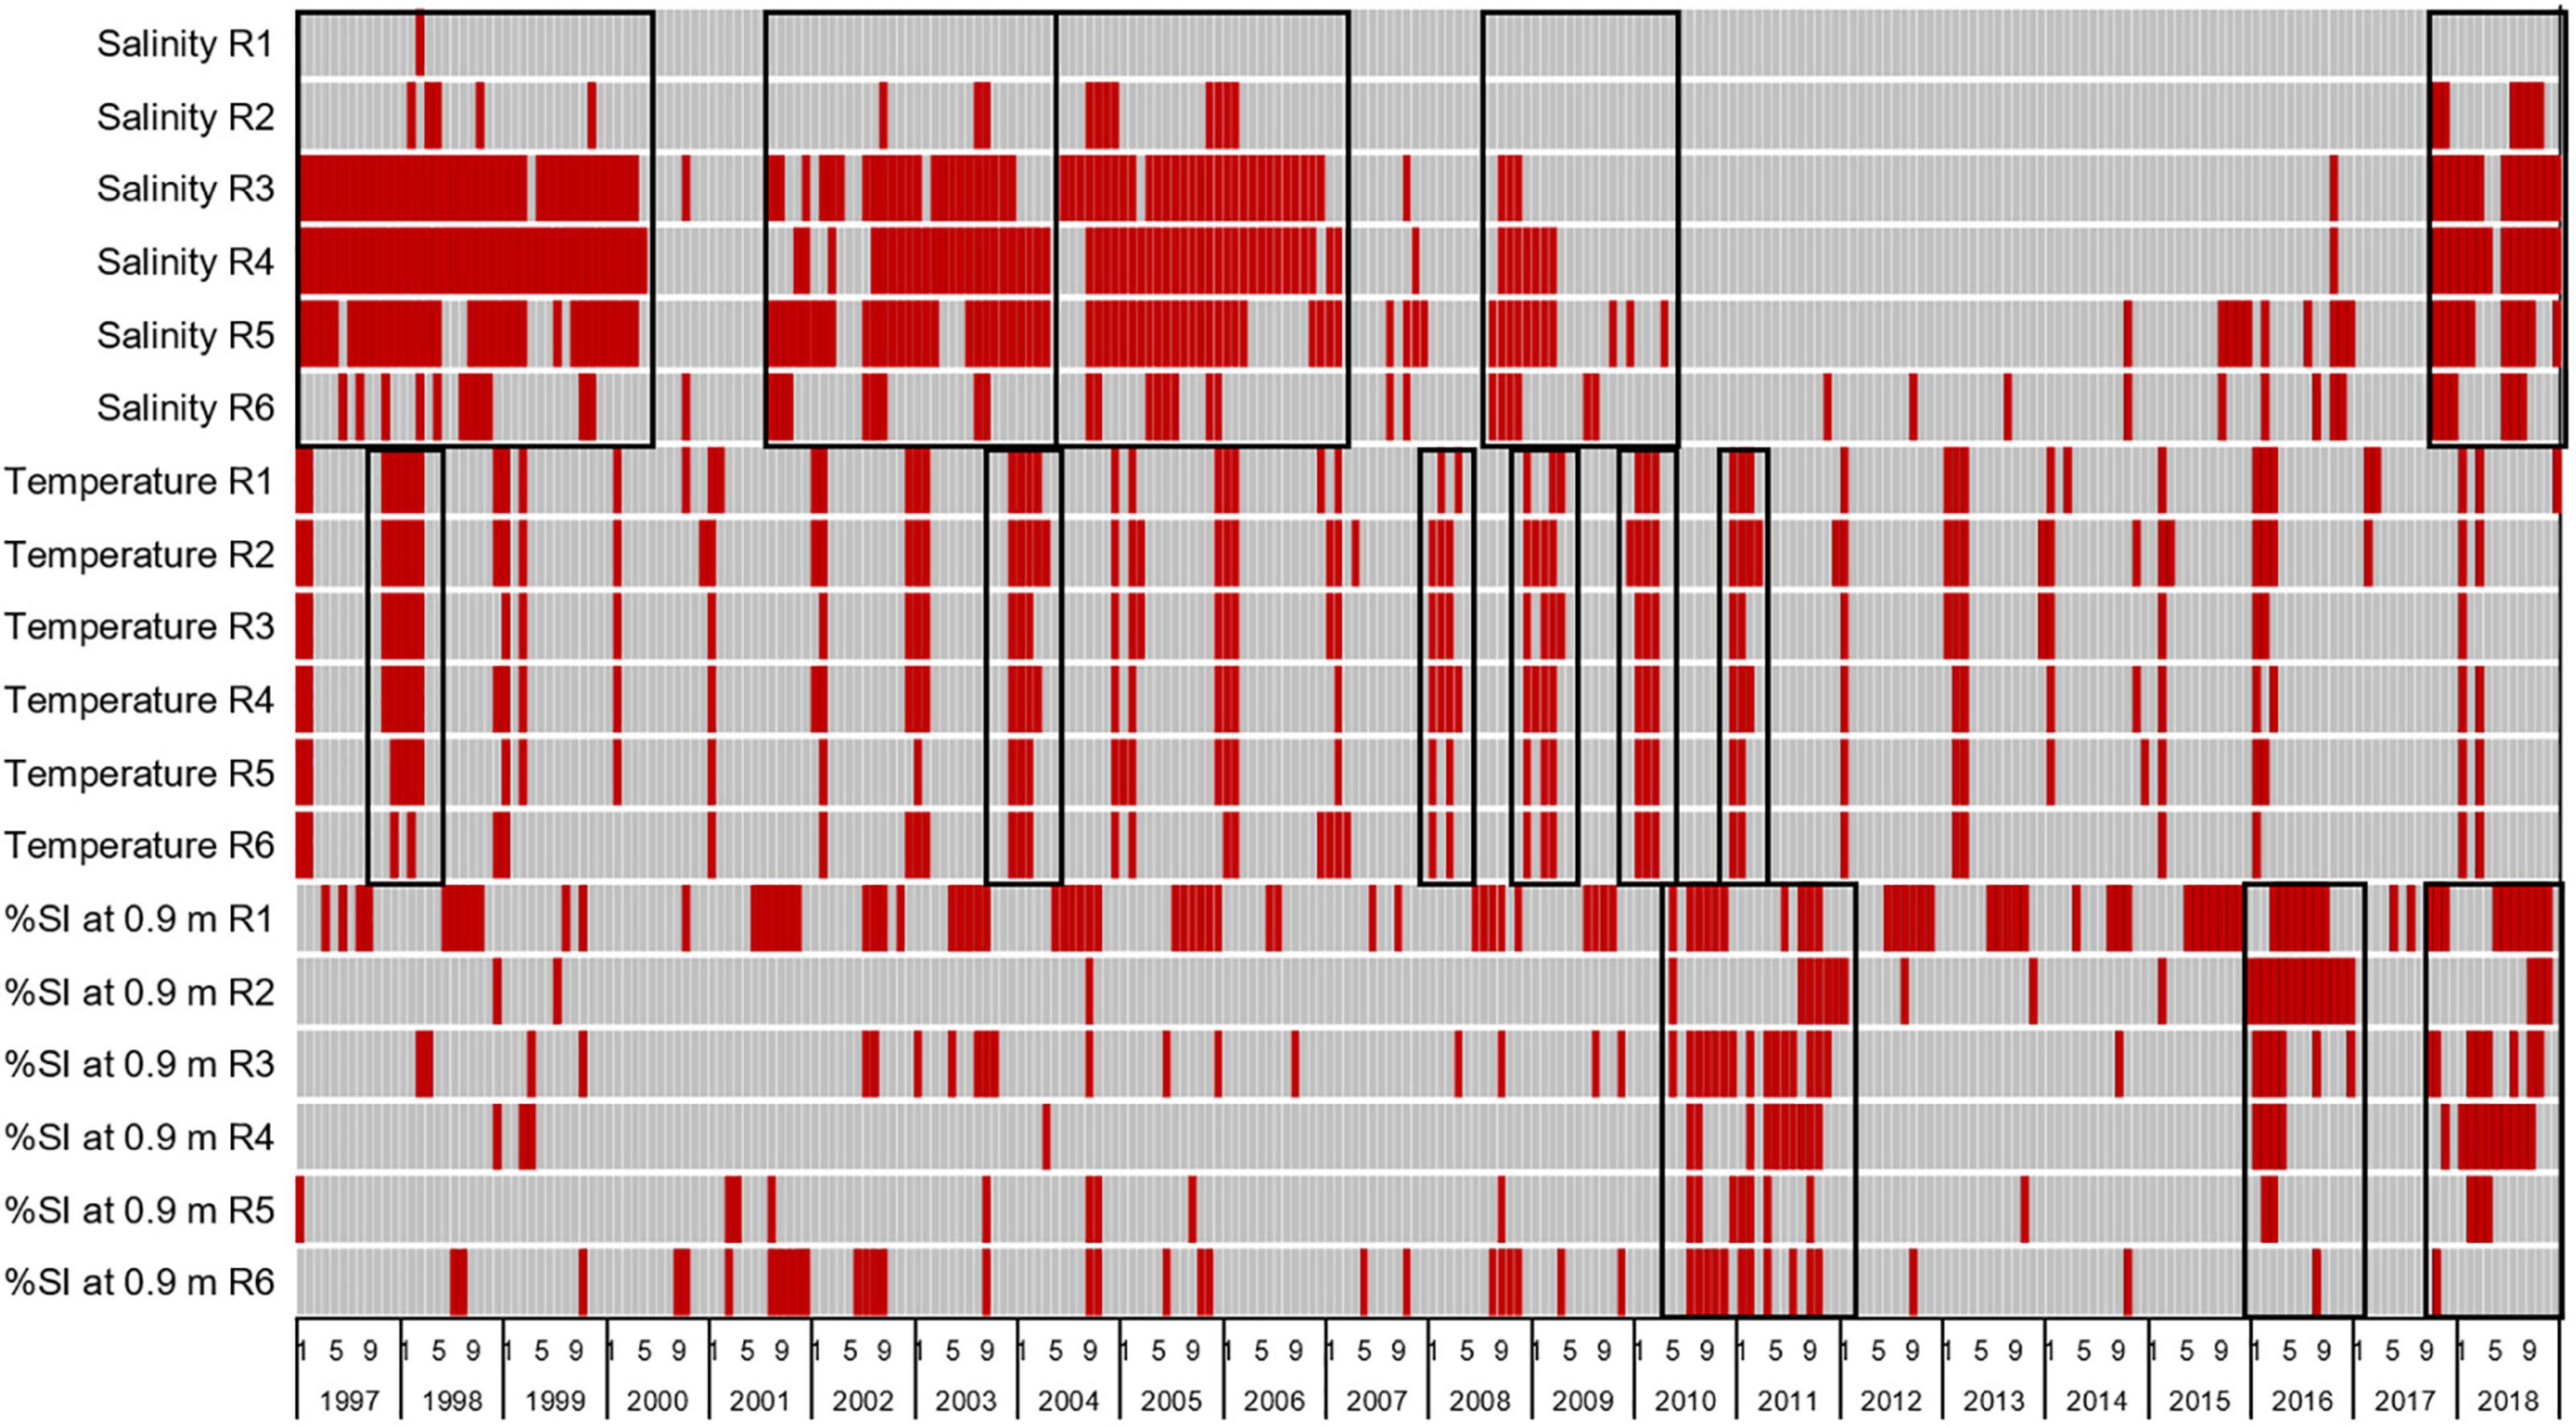
Figure 11. Heatmap with red bars indicating times when seagrass was stressed by salinities below 23 psu, water temperatures below 20°C, or less than 27% of subsurface irradiance (%SI) reaching 0.9 m for reaches 1–6. Black boxes highlight periods of widespread increased stress.
Stress was evaluated as a change in cover, and it did not equate to mortality. The periods of low salinity led to decreases in cover of 0.3–2.8%. The periods of low temperatures led to 1.3–6.8% decreases in cover. In contrast, the periods of low light availability led to decreases in cover of 3.8–12.9%, with the largest decrease related to the 2010–2011 event.
Climate and weather affected salinities and temperatures, and internal conditions affected the availability of light. Low salinities corresponded to two El Niño periods with relatively high rainfall, a period with multiple hurricanes, the time when Tropical Storm Fay hit the region, and the passage of Hurricane Irma. Air temperatures were at or below the 10th percentile (8°C) for more days leading into and during periods of temperature stress. Stress from reduced light availability coincided with 3–5 fold increases in phytoplankton biomass (Phlips et al., 2021).
Given the periods identified as stressful and the changes in areal extent and cover of seagrass, it appeared that decreased light penetration was the major influence on seagrass. Areal extent and mean percent cover decreased from 2009 to 2011 and from 2015 to 2017, which bracketed periods with widespread stress due to decreased light availability at 0.9 m. In contrast, areal extent and cover increased in 2013 and 2015, when all stressors were absent.
Changes in the amount of seagrass present in the IRL would have altered the cycling of C, N, and P. Analyses of tissues from H. wrightii indicated that there were statistically significant differences in aboveground %N and %P and belowground %C, %N, and %P among sampling events, with percentages increasing during the non-growing season and decreasing thereafter (Figure 12; PERMANOVAs; p < 0.001 for significant tests and p > 0.05 for the non-significant test). Mean %C in aboveground tissue did not vary significantly. For all stations, aboveground %N was always greater than belowground %N.
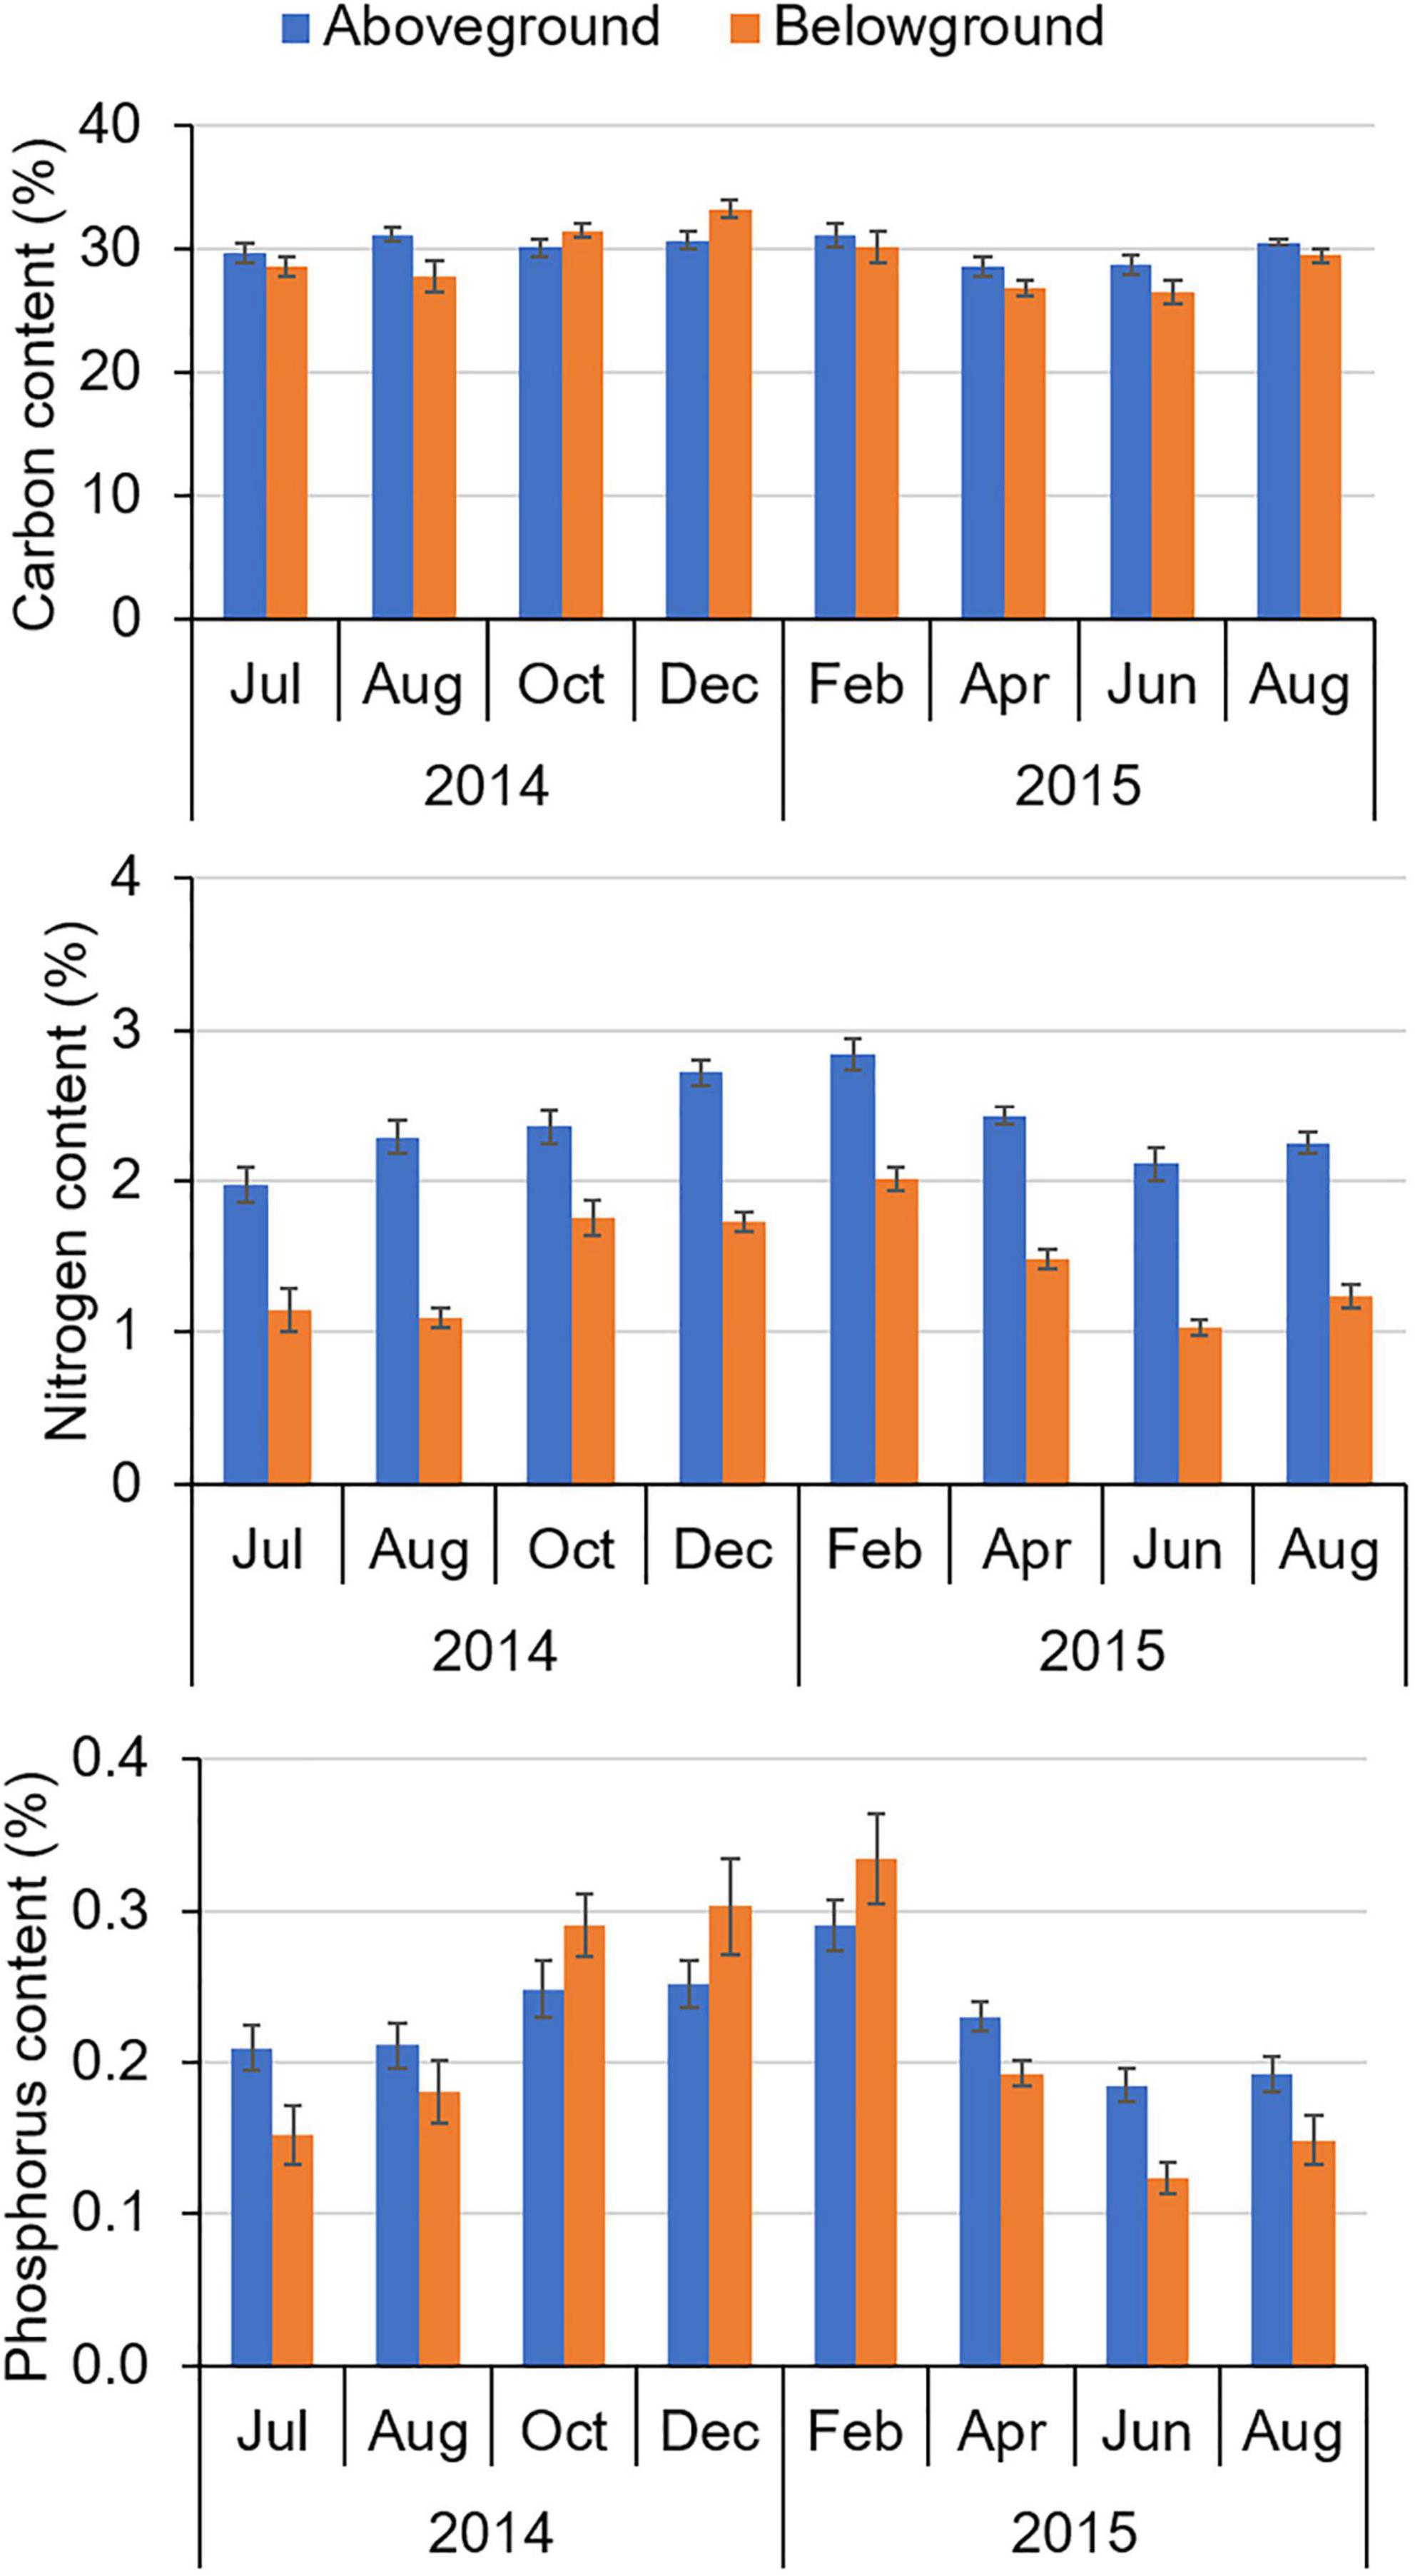
Figure 12. Mean percent carbon, percent nitrogen, and percent phosphorus in seagrass tissues ± standard error (SE) from Jul 2014 to Aug 2015.
Changes in C, N, and P stored in the aboveground tissues of H. wrightii were estimated by applying Equation 1 (Hanisak, 2001) to the mean percent cover for every transect in every sampling event to yield biomass, and converting those values to the mass of each element using Equations 2, 3, and 4, which were based on the overall mean percentage content of all aboveground tissues sampled. Non-destructive surveys of transects did not yield data on belowground biomass, so changes in storage of C, N, and P were underestimated if belowground tissues were lost.
The estimated elemental contents of the aboveground tissues of H. wrightii were extrapolated to the aerial extent of seagrass by multiplying the relevant value by the number of hectares in each reach, with values for years without maps based on the area from the previous year (Figure 13). The amount of material stored in seagrass beds declined in 2011 in reaches 2, 4, 5, and 6, and it declined later in the other reaches. By 2019, the amount of C, N, and P stored in seagrass had decreased by over 88% in reaches 1–5 and by over 58% in reaches 6, 7–9.
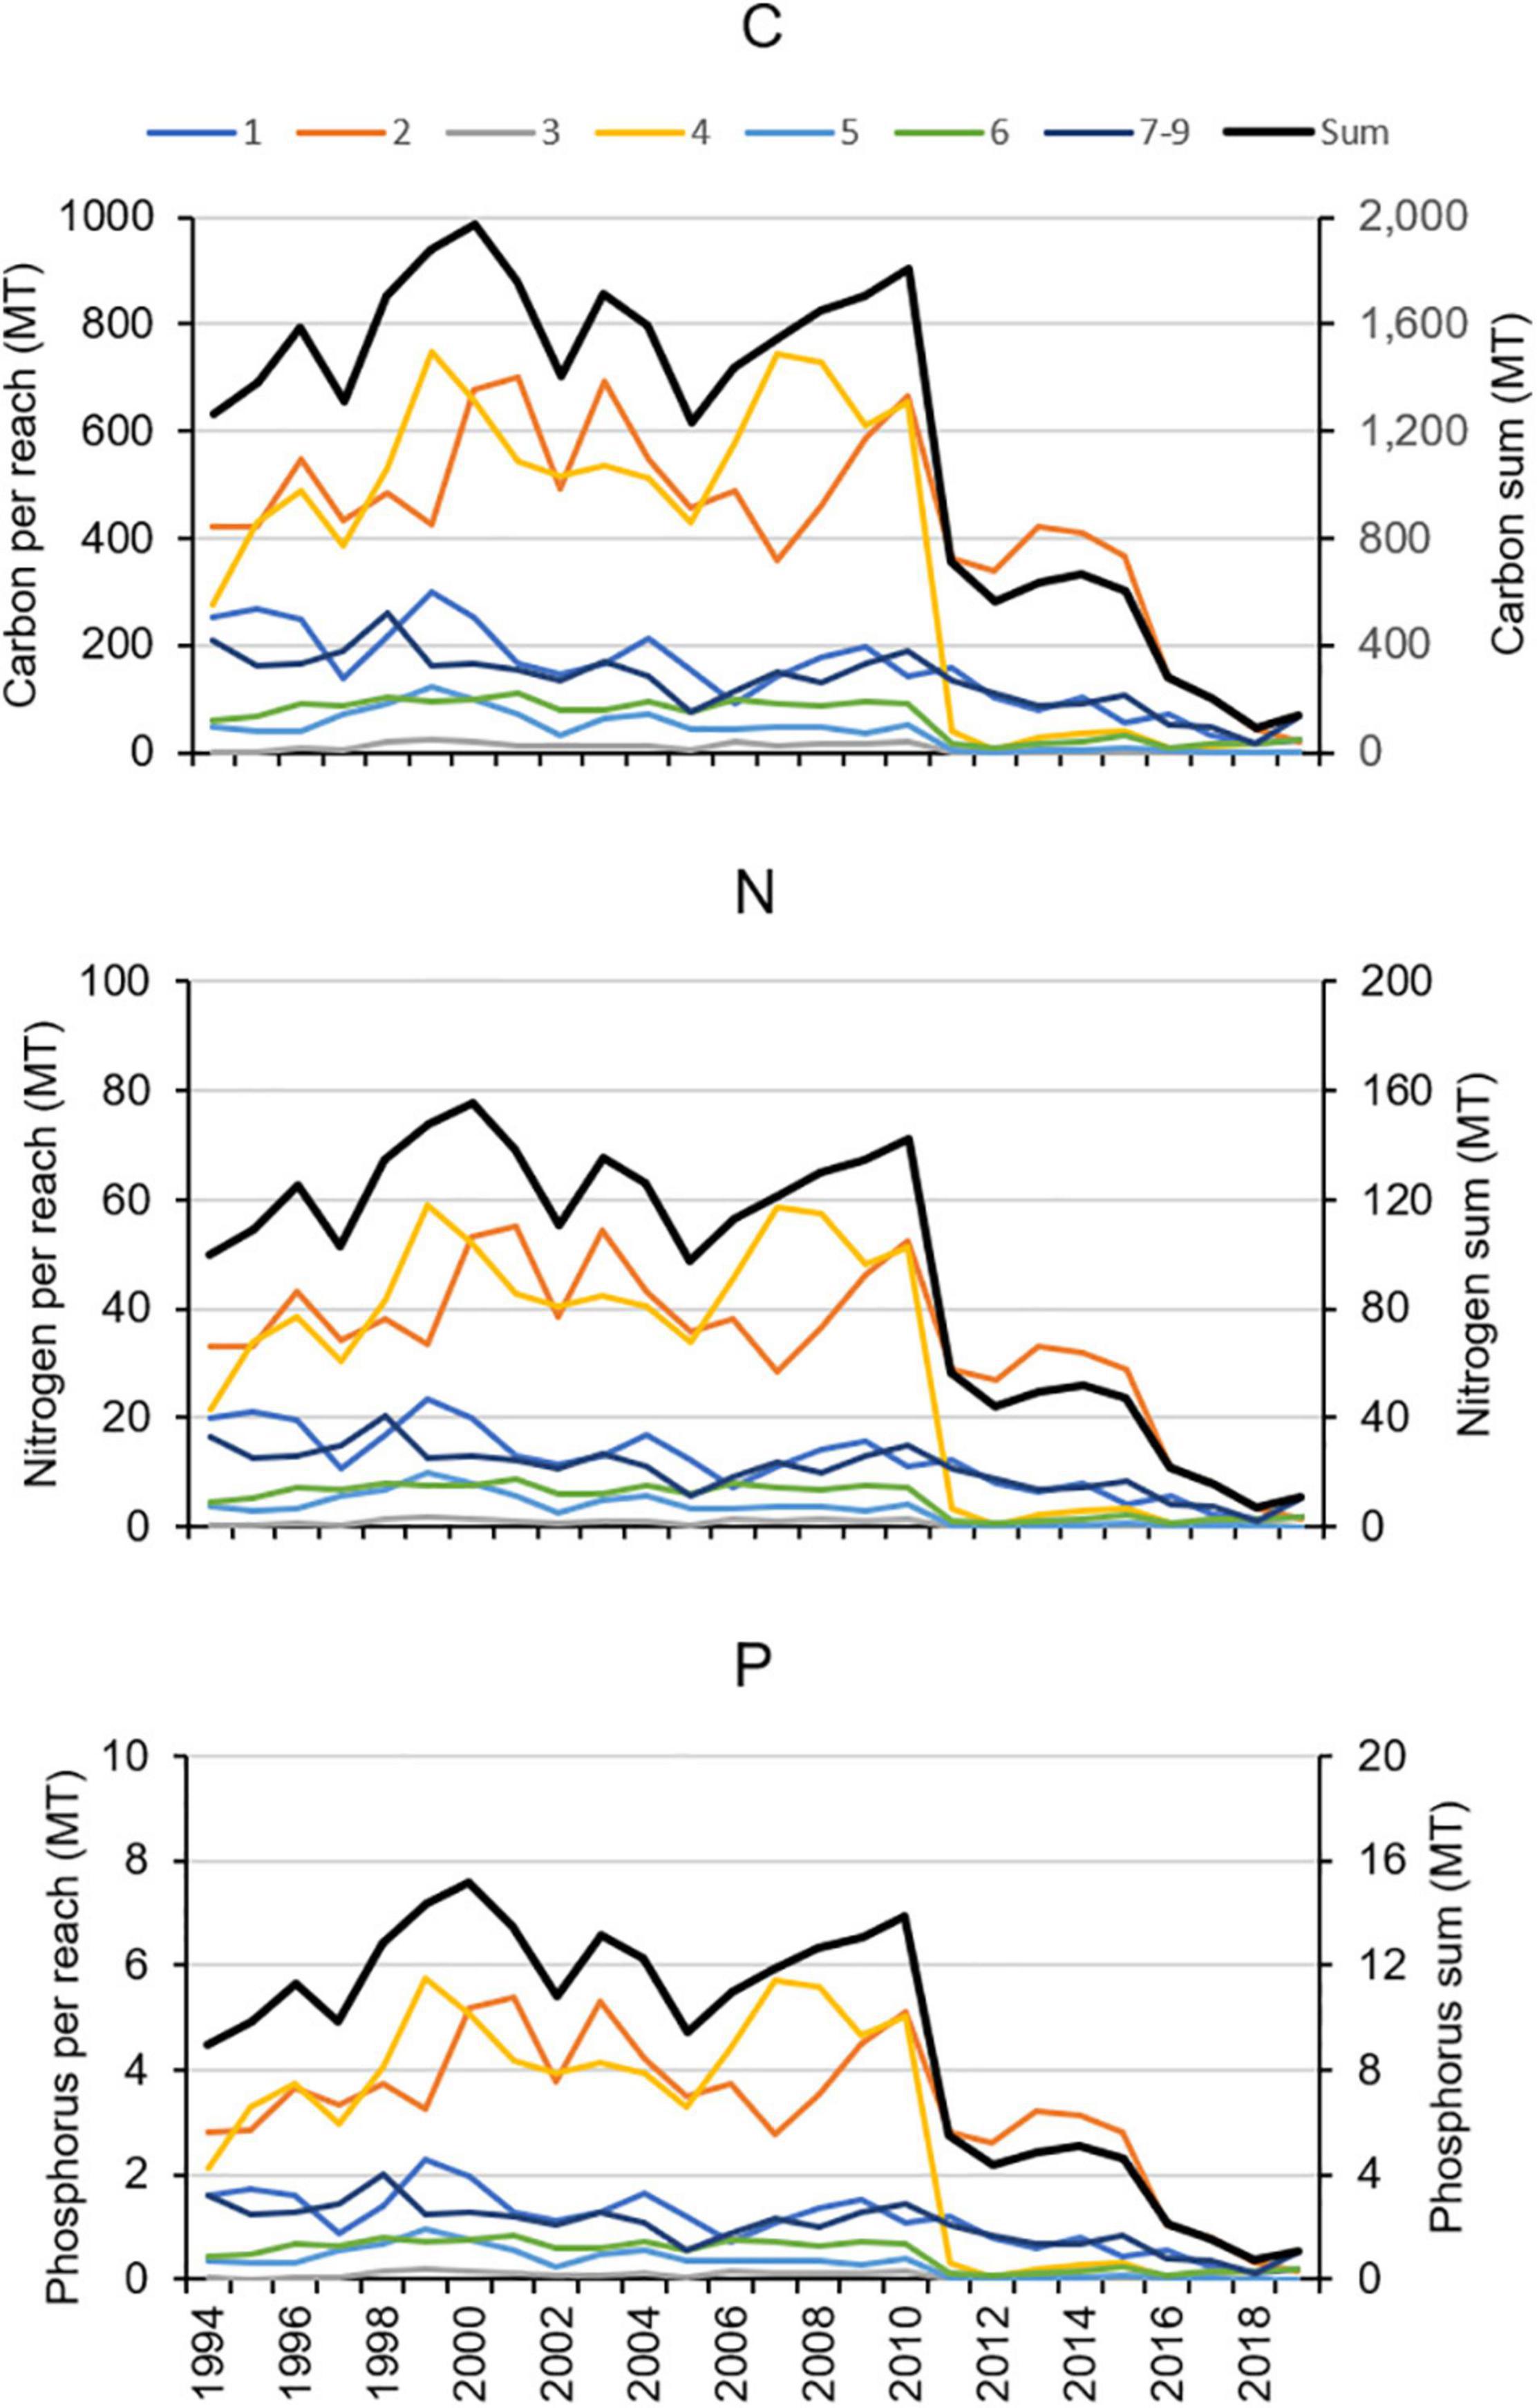
Figure 13. Changes in the amount of carbon (C), nitrogen (N), and phosphorus (P) stored in seagrass in each reach and in the whole lagoon.
Several spatiotemporal patterns in areal extent and percent cover of seagrasses in the IRL were elucidated with data from two independent lines of evidence, large-scale maps and fixed transects. The areal extent of seagrass in the system decreased by 43% from 2009 to 2011, with the most extensive losses in reaches 3 and 4, 80 and 87%, respectively. Following expansions of 12% in 2013 and a further 15% in 2015, the areal extent of seagrasses decreased in 2017 and 2019 to approximately 58% of the 32,000 hectares present in 2009. Decreases in areal extent manifested primarily as movements of EOCs into shallower water. In addition, percent cover of seagrass along transects varied in space and time. Mean percent cover within the beds decreased as areal extent increased to 2009, which meant the seagrass in the larger footprint was sparser. In contrast, mean percent cover standardized to maximum transect length remained relatively consistent until 2010–2011. Standardized mean percent cover in reaches 3–6 decreased in 2010–2011, with large decreases delayed to 2016–2018 in reaches 1, 2, and 7–9. Despite these losses, some patches of seagrass persisted for 22–24 years, with seagrasses found in 0.5–0.9 m of water being the most persistent. The changes were related primarily to reduced availability of light, with losses following 2–3 months of exposure to less than 27% of subsurface irradiance. Salinities and temperatures did reach levels that could cause stress, but their effects were tempered if enough light was available. Larger decreases in mean percent cover were recorded when cover dropped below 20%, which may have represented a boundary below which photosynthetic production by aboveground biomass did not support respiration by the total biomass. Overall, the reduced amount of seagrass could have led to broader detrimental effects, particularly increasing the availability of C, N, and P to other primary producers that could shade seagrasses. In fact, mean concentrations of chlorophyll-a, increased from ∼40 μg L–1 to over 360 μg L–1, and epiphyte biomass decreased by ∼42% from 2011 on. Thus, enhanced blooms of phytoplankton and consequent shading could have combined with increased turbidity once seagrasses no longer stabilized sediments to establish detrimental feedbacks. In combination, the extent and duration of the loss of seagrass had the potential to affect fish, manatees, and other components of the system.
Declines in the areal extent of seagrasses were not unique to the IRL and such losses have threatened the health of coastal systems and local economies across the world (Orth et al., 2010; Lefcheck et al., 2017; de los Santos et al., 2019). For example, a recent estimate of 900,000 ha of seagrasses worth over $20 billion a year in Florida is a reduction from the coverage in the 1950s (Yarbro and Carlson, 2013). In Chesapeake Bay, widespread losses of seagrass began after Hurricane Agnes in 1973, with ∼80% of the Zostera marina beds lost through the 1980s and some successful restoration since then (Orth et al., 2017). In addition, over 40 locations worldwide, mostly temperate and tropical systems, suffered large-scale declines in seagrasses (Hemminga and Duarte, 2000). Overall, decreases in areal extent of seagrasses probably have exceeded the last global estimate of ∼30% in 2009 (Waycott et al., 2009), and large losses have occurred in the tropical Atlantic bioregion (Dunic et al., 2021). Furthermore, some recent success in restoring seagrasses in southwest Florida and Chesapeake Bay (Lefcheck et al., 2018; Tomasko et al., 2018; Orth et al., 2020) may have been reversed given recent data.1 2 3 4 Overall, excess loads of nitrogen and phosphorus fueling blooms of phytoplankton that shade seagrasses appeared to be the issue in the IRL and many other places.
The availability of light appeared to be the dominant factor determining changes in the abundance of species that formed the canopy, i.e., H. wrightii, S. filiforme, T. testudinum, and R. maritima. For example, salinity was low enough to be stressful for 4–11 months in reaches 3–5 during 1997–1999, 2004-2005, and 2008 due to El Niño rains, hurricanes, and a tropical storm, but seagrasses did not display drastic and long-lasting changes in extent or percent cover. Temperatures were low enough to be stressful in 1–3 months each winter, but they were stressful for 4–5 months in multiple reaches in 1997–1998, 2003–2004, and 2007–2011. Extensive decreases in the abundance of seagrasses occurred only in the latter period, when light availability at 0.9 m also was stressful for 2–3 months in multiple reaches. Further evidence for the dominant influence of light comes from 2016 to 2018, when low light was recorded for 2–7 months and seagrasses exhibited a second decline in extent and percent cover. Past work in the IRL estimated that 33% of incident light was needed to support healthy seagrass at the deepest EOC, with a minimum of 20% of incident light required for maintenance (Steward et al., 2005). In addition, others have reported 24–37% of incident light as the requirements for H. wrightii and S. filiforme, the two dominant species in the IRL (Kenworthy and Fonseca, 1996; Hemminga and Duarte, 2000; Morris et al., 2021).
Changes in the areal extent of seagrass typically manifested as changes in the depths of the offshore edges of beds (Duarte, 1995; Fletcher and Fletcher, 1995). In the IRL, the initial loss of over 13,000 ha between 2009 and 2011 was reflected in decreased depths at the EOC ranging from 5 to 54%. By 2019, reaches 3 and 4 had the largest changes in depth at the EOC, with depths decreasing to zero from 1.2 to 1.6 m, respectively. The initial changes in 2011 were similar to reports for Chesapeake Bay in 1997, when the deep edges of seagrass beds became up to 50% shallower as areal extent reduced (Lefcheck et al., 2017). In addition, H. wrightii that grew in water > 1.3 m deep retreated to 0.6 m following a bloom of Aureoumbra lagunensis that caused a loss of > 14,000 ha of seagrass in upper Laguna Madre, TX (Dunton, 1994; Onuf, 1994).
In addition to losses in areal extents and shoreward progressions of EOCs, percent cover standardized to the largest areal extent decreased from 2010 on, with the system-wide average decreasing from ∼20 to ∼4%. Decreases in cover were moderated at depths of 0.5–0.9 m, and seagrasses in this zone persisted across 22–24 years. Similar findings came from Tampa Bay where ∼96% of the areal extent of three species of seagrass was found in 0.4–0.8 m of water, with the greatest proportion found between 0.5 and 0.6 m (Robbins and Bell, 2000). In Chesapeake Bay, Zostera marina was most abundant and distributed continuously from 0.3 to 0.7 m below mean low water (Moore and Jarvis, 2008). Furthermore, percent cover and mean patch size for Zostera noltii reached maxima at 1 m below mean water level in an intertidal system on the northern coast of France (van der Heide et al., 2010). In general, the individual and combined influences of light, temperature, salinity, physical disruption, emersion, and other factors determined where seagrasses persisted (Duarte, 1995, 2002; Kenworthy and Fonseca, 1996; Fourqurean et al., 2003; Steward et al., 2005; Fredley et al., 2019).
Another factor that affected persistence was the mean percent cover within the beds. As seagrasses expanded into deeper water from 2005 to 2010, the biomass of seagrass was redistributed from smaller patches with relatively high cover to larger patches with sparse cover. Typically, decreases in cover have been associated with stress from unsuitable environmental conditions (Lee et al., 2007; McMahon et al., 2013; Roca et al., 2016; Nelson, 2017), and changes in cover after 2010 were associated with blooms of phytoplankton and decreased availability of light. However, from 2006 to 2009, cover within the beds decreased while areal extent increased, which resembled “clonal foraging,” in which rhizomes extend and colonize open space (Marbà and Duarte, 1998; Ralph et al., 2007). The resulting shift in the ratio of aboveground to belowground tissue potentially made the beds vulnerable to an imbalance between respiration and photosynthesis that led to a loss of shoots when light became limiting (Fourqurean and Zieman, 1991; Ralph et al., 2007). Additional losses could have established negative feedbacks with increased resuspension of sediment leading to further reductions in light availability and subsequent loss of shoots (Newell and Koch, 2004; Moore and Short, 2006; de Boer, 2007; Carr et al., 2016). In fact, the prevention of such feedbacks by increasing cover or density have become key considerations when attempting to restore seagrasses (van Katwijk et al., 2016; Valdez et al., 2020; Carus et al., 2021), and consideration of biomass as a key metric of resistance to stress and recovery from stress has become the focus of multiple studies (Unsworth et al., 2015; Collier et al., 2020; Tuya et al., 2021).
The decreased areal extent and cover of seagrasses meant that less C, N, and P was stored in this pool. As an example of the magnitude of this change, average percent covers were combined with areal extents and the average elemental content of the aboveground tissues of H. wrightii to yield grams of C, N, and P for reaches 1–6 in 2009 and 2019. The differences in the amounts of C, N, and P stored in seagrasses were calculated, and those values were converted to potential changes in concentrations in the water column using the total volume of the six reaches. In combination, the decreases in percent cover and areal extent indicated that approximately 1,200 MT of C, 98 MT of N, and 10 MT of P were no longer stored in seagrasses. These quantities of C, N, and P represented approximately 13, 11, and 40% of the mean concentrations of dissolved organic C, dissolved N, and dissolved P measured in reaches 1–6 from 1997 to 2009. Thus, the change in the quantity of seagrasses translated into a change in the cycling of key elements that managers concerned with water quality should note.
In conclusion, the large-scale changes in the extent and cover of seagrass have led to multiple concerns about the recovery of this critical structural habitat. Key elements (C, N, P), not bound in the tissues of seagrasses were likely available to phytoplankton, which would have exacerbated blooms and the resultant shading. Less seagrass likely caused a decrease in fragments that could recruit to bare space (Hall et al., 2006) and an increase in disturbance of sediments resulting in turbidity that reduces the availability of light and movement of sediments that deters recruitment of seagrasses (Newell and Koch, 2004; Moore and Short, 2006; de Boer, 2007; Carr et al., 2016). Furthermore, the three most common canopy species in the IRL, H. wrightii, S. filiforme, and T. testudinum, were unlikely to produce an abundance of seeds (Virnstein, 1995), and the brief recovery of seagrasses in 2013–2015 may have represented the germination of whatever seeds were present when salinity, temperature, and light were less stressful. Based on the recovery of 1,000–1,500 hectares per growing season in this period, an optimistic estimate of recovery was 12–17 years. Other concerns revolve around how the widespread, long-term loss of seagrasses will affect the recruitment of fish and invertebrates that shelter in seagrass beds and the survival of species that eat seagrass or forage in seagrass beds. Overall, the magnitude and duration of the loss of seagrasses have raised questions about how to accelerate recovery by planting, what systemic effects will arise, and will ongoing reductions in loads of nitrogen and phosphorus re-establish conditions that support seagrasses.
The raw data supporting the conclusions of this article will be made available by the authors, without undue reservation.
LM, LH, RC, JM, and RV conducted the bulk of the fieldwork. MH generated data on elemental composition. CJ performed statistical analyses. LM and LH drafted the manuscript. All authors contributed to revisions of the draft manuscript and approved the submitted version, and contributed to designing components of the study.
Parts of this research were funded by contracts from the St. Johns River Water Management District.
The authors declare that the research was conducted in the absence of any commercial or financial relationships that could be construed as a potential conflict of interest.
All claims expressed in this article are solely those of the authors and do not necessarily represent those of their affiliated organizations, or those of the publisher, the editors and the reviewers. Any product that may be evaluated in this article, or claim that may be made by its manufacturer, is not guaranteed or endorsed by the publisher.
Portions of this work were performed under a Special Use Permit issued by the Merritt Island National Wildlife Refuge. We thank field crews from the St. Johns River Water Management District, South Florida Water Management District, NASA environmental consultants, Florida Department of Environmental Protection Fort Pierce office of the Indian River Aquatic Preserve, Loxahatchee River District, and Marine Discovery Center. We thank John Hart for assisting with the collection of seagrass for analyses of elemental compositions.
The Supplementary Material for this article can be found online at: https://www.frontiersin.org/articles/10.3389/fmars.2021.789818/full#supplementary-material
Supplementary Figure 1 | Illustration showing how beds of seagrass that persisted in 10-11 maps (dark green polygons) fell within the mid, 0.5–0.9 m, depth zone (yellow dots).
Anderson, M. J., Gorley, R. N., and Clarke, K. R. (2008). Permanova+ for Primer: Guide to Software and Statistical Methods. Plymouth: Primer-E.
Aoki, L. R., McGlathery, K. J., Wiberg, P. L., Oreska, M. P. J., Berger, A. C., Berger, P., et al. (2021). Seagrass recovery following marine heat wave influences sediment carbon stocks. Front. Mar. Sci. 7:576784. doi: 10.3389/fmars.2020.576784
Beck, M. W., Hagy, J. D. III, and Chengfeng, L. (2018). Quantifying seagrass light requirements using an algorithm to spatially resolve depth of colonization. Estuaries Coasts 41, 592–610. doi: 10.1007/s12237-017-0287-1
Bertelli, C. M., and Unsworth, R. K. F. (2018). Light stress responses by the eelgrass, Zostera marina (L). Front. Environ. Sci. 6:39. doi: 10.3389/fenvs.2018.00039
Burdick, D., and Short, F. T. (1999). The effects of boat docks on eelgrass beds in coastal waters of Massachusetts. Environ. Manage. 23, 231–240. doi: 10.1007/s002679900182
Carr, J., D’Odorico, P., McGlathery, K., and Wiberg, P. (2016). Spatially explicit feedback between seagrass meadow structure, sediment and light: habitat suitability for seagrass growth. Adv. Water Resour. 93, 315–325. doi: 10.1016/j.advwatres.2015.09.001
Carus, J., Arndt, C., Schröder, B., Thom, M., Villanueva, R., and Paul, M. (2021). Using artificial seagrass for promoting positive feedback mechanisms in seagrass restoration. Front. Mar. Sci. 8:546661. doi: 10.3389/fmars.2021.546661
Coastal Planning and Engineering (1997). Indian River Lagoon Bathymetric Survey. Boca Raton, FL: Coastal Planning & Engineering.
Collier, C. J., Adams, M. P., Langlois, L., Waycott, M., O’Brien, K. R., Maxwell, P. S., et al. (2016). Thresholds for morphological response to light reduction for four tropical seagrass species. Ecol. Indic. 67, 358–366. doi: 10.1016/j.ecolind.2016.02.050
Collier, C. J., Carter, A. B., Rasheed, M., McKenzie, L., Udy, J., Coles, R., et al. (2020). Great Barrier Reef seagrass ecosystem: a case study from Cleveland Bay. Environ. Sustain. Indic. 7, 1–15. doi: 10.1016/j.indic.2020.100042
Collier, C. J., Lavery, P. S., Ralph, P. J., and Masini, R. J. (2009). Shade-induced response and recovery of the seagrass Posidonia sinuosa. J. Exp. Mar. Biol. Ecol. 370, 89–103. doi: 10.1016/j.jembe.2008.12.003
Collier, C. J., and Waycott, M. (2014). Temperature extremes reduce seagrass growth and induce mortality. Mar. Pollut. Bull. 83, 483–490. doi: 10.1016/j.marpolbul.2014.03.050
Collier, C. J., Uthicke, S., and Waycott, M. (2011). Thermal tolerances of two seagrass species at contrasting light levels: implications for future distribution in the Great Barrier Reef. Limnol. Oceanogr. 56, 2200–2210. doi: 10.4319/lo.2011.56.6.2200
de Boer, W. F. (2007). Seagrass – sediment interactions, positive feedbacks and critical thresholds for occurrence: a review. Hydrobiologia. 591, 5–24. doi: 10.1007/s10750-007-0780-9
de los Santos, C. B., Krause-Jensen, D., Alcoverro, T., Marbà, N., Duarte, C. M., van Katwijk, M. M., et al. (2019). Recent trend reversal for declining European seagrass meadows. Nat. Commun. 10:3356. doi: 10.1038/s41467-019-11340-4
Dennison, W. (1987). Effects of light on seagrass photosynthesis, growth and depth distribution. Aquat. Bot. 27, 15–26. doi: 10.1016/0304-3770(87)90083-0
Dennison, W. C., Orth, R. J., Moore, K. A., Stevenson, J. C., Carter, V., Kollar, S., et al. (1993). Assessing water quality with submersed aquatic vegetation: habitat requirements as barometers of Chesapeake Bay health. Bioscience 43, 86–94. doi: 10.2307/1311969
Duarte, C. M. (1995). Submerged aquatic vegetation in relation to different nutrient regimes. Ophelia 41, 87–112. doi: 10.1080/00785236.1995.10422039
Duarte, C. M. (2002). The future of seagrass meadows. Environ. Conserv. 29, 192–206. doi: 10.1017/S0376892902000127
Duarte, C. M., Losada, I. J., Hendriks, I. E., Mazarrasa, I., and Marbà, N. (2013). The role of coastal plant communities for climate change mitigation and adaptation. Nat. Clim. Chang. 3, 961–968. doi: 10.1038/nclimate1970
Duffy, J. E., Benedetti-Cecchi, L., Trinanes, J., Muller-Karger, F. E., Ambo-Rappe, R., Boström, C., et al. (2019). Toward a coordinated global observing system for seagrasses and marine macroalgae. Front. Mar. Sci. 6:317. doi: 10.3389/fmars.2019.00317
Dunic, J. C., Brown, C. J., Connolly, R. M., Turschwell, M. P., and Côté, I. M. (2021). Long-term declines and recovery of meadow area across the world’s seagrass bioregions. Glob. Chang. Biol. 27, 4096–4109. doi: 10.1111/gcb.15684
Dunton, K. H. (1994). Seasonal growth and biomass of the subtropical seagrass Halodule wrightii in relation to continuous measurements of underwater irradiance. Mar. Bio. 120, 479–489. doi: 10.1007/BF00680223
Fletcher, S. W., and Fletcher, W. W. (1995). Factors affecting changes in seagrass distribution and diversity patterns in the Indian River Lagoon complex between 1940 and 1992. Bull. Mar. Sci. 57, 49–58.
Florida Department of Transportation (1999). Florida Land Use, Cover and Forms Classification System. Tallahassee, FL: Florida department of transportation surveying and mapping office geographic mapping section.
Fourqurean, J. W., Boyer, J. N., Durako, M. J., Hefty, L. N., and Peterson, B. J. (2003). Forecasting responses of seagrass distributions to changing water quality using monitoring data. Ecol. App. 13, 474–489.
Fourqurean, J. W., Duarte, C. M., Kennedy, H., Marbà, N., Holmer, M., Mateo, H. A., et al. (2012). Seagrass ecosystems as a globally significant carbon stock. Nat. Geosci. 5, 505–509. doi: 10.1038/NGEO1477
Fourqurean, J. W., and Zieman, J. C. (1991). “Photosynthesis, respiration, and whole plant carbon budgets of Thalassia testudinum. Halodule wrightii, and Syringodium filiforme,” in Results and Recommendations of a Workshop Convened to Examine the Capability of Water Quality Criteria, Standards, and Monitoring Programs to Protect Seagrasses from Deteriorating Water Transparency, eds W. J. Kenworthy and D. E. Haunert (West Palm Beach, FL: South Florida Water Management District), 107.
Fredley, J., Durako, M. J., and Hall, M. O. (2019). Multivariate analyses link macrophyte and water quality indicators to seagrass die-off in Florida Bay. Ecol. Indic. 101, 692–701. doi: 10.1016/j.ecolind.2019.01.074
Gilmore, R. G. (1995). Environmental and biogeographic factors influencing ichthyofaunal diversity: Indian River Lagoon. Bull. Mar. Sci. 57, 153–170.
Greve, T. M., and Binzer, T. (2004). “Which factors regulate seagrass growth and distribution?,” in European Seagrasses: An Introduction to Monitoring and Management, eds J. Borum, C. M. Duarte, D. Krause-Jensen, and T. M. Greve (Copenhagen: M & MS Project), 88.
Haddad, K. D., and Harris, B. A. (1985). “Assessment and trends of Florida’s marine fisheries habitat: an integration of aerial photography and thematic mapper imagery,” in Proceedings of Machine Processing of Remotely Sensed Data with Special Emphasis on Quantifying Global Process: Models, Sensor Systems, and Analytical Methods. eds Anonymous. Laboratory Applications in Remote Sensing, (West Lafayette, IND: Purdue University), 130–138.
Hall, L. M., Hanisak, M. D., and Virnstein, R. W. (2006). Fragments of seagrasses Halodule wrightii and Halophila johnsonii as potential recruits in Indian River Lagoon, Florida. Mar. Ecol. Prog. Ser. 310, 109–117. doi: 10.3354/meps310109
Hanisak, M. D. (2001). Photosynthetically Active Radiation, Water Quality, and Submerged Aquatic Vegetation in Indian River Lagoon. Final Report Contract #93W199. Palatka, FL: St. Johns River Water Management District.
Hanisak, M. D. (2016). Analysis of Submersed Aquatic Vegetation Tissue Nutrient Content and Response of Drift Macroalgae to Extreme Levels of Salinity, Temperature, and Light. Final Report Contract #27857. Palatka, FL: St. Johns River Water Management District, 1–108.
Hauxwell, J., Cebrián, J., and Valiela, I. (2003). Eelgrass Zostera marina loss in temperate estuaries: relationship to land-derived nitrogen loads and effects of light limitation imposed by algae. Mar. Ecol. Prog. Ser. 247, 59–73. doi: 10.3354/meps247059
Irlandi, E., Orlando, B., Macia, S., Biber, P., Jones, T., Kaufman, L., et al. (2002). The influence of freshwater runoff on biomass, morphometrics, and production of Thalassia testudinum. Aquat. Bot. 72, 67–78. doi: 10.1016/S0304-3770(01)00217-0
Kendrick, G. A., Nowicki, R. J., Olsen, Y. S., Strydon, S., Fraser, M. W., Sinclair, E. A., et al. (2019). A systemic review of how multiple stressors from an extreme event drove ecosystem-wide loss of resilience in an iconic seagrass community. Front. Mar. Sci. 6:455. doi: 10.3389/fmars.2019.00455
Kenworthy, W. J., and Fonseca, M. S. (1996). Light requirements of seagrasses Halodule wrightii and Syringodium filiforme derived from the relationship between diffuse light attenuation and maximum depth distribution. Estuaries 19, 740–750. doi: 10.2307/1352533
Lee, K. S., Park, S. R., and Kim, Y. K. (2007). Effects of irradiance, temperature, and nutrients on growth dynamics of seagrass: a review. J. Exp. Mar. Biol. Ecol. 350, 144–175. doi: 10.1016/j.jembe.2007.06.016
Lefcheck, J. S., Orth, R. J., Dennison, W. C., Wilcox, D. J., Murphy, R. R., Keisman, J., et al. (2018). Long-term nutrient reductions lead to the unprecedented recovery of a temperate coastal region. Proc. Natl. Acad. Sci. U.S.A. 115, 3658–3662.
Lefcheck, J. S., Wilcox, D. J., Murphy, R. R., Marion, S. R., and Orth, R. J. (2017). Multiple stressors threaten the imperiled coastal foundation species eelgrass (Zostera marina) in Chesapeake Bay, USA. Glob. Chang. Biol. 23, 3474–3483. doi: 10.1111/gcb.13623
Lewis, F. G. III (1984). Distribution of microbenthic crustaceans associated with Thalassia, Halodule, and bare sand substrata. Mar. Ecol. Prog. Ser. 19, 101–113. doi: 10.3354/meps019101
Livingston, R. J., McGlynn, S. E., and Niu, X. (1998). Factors controlling seagrass growth in a gulf coastal system: water and sediment quality and light. Aquat. Bot. 60, 135–159. doi: 10.1016/S0304-3770(97)00079-X
Ludwig, J. A., and Tongway, D. J. (1995). Spatial organization of landscapes and its function in semi-arid woodlands, Australia. Landsc. Ecol. 10, 51–63. doi: 10.1007/BF00158553
Marbà, N., Arias-Ortiz, A., Masqué, P., Kendrick, G. A., Mazarrasa, I., Bastyan, G. R., et al. (2015). Impact of seagrass loss and subsequent revegetation on carbon sequestration and stocks. J. Ecol. 103, 296–302. doi: 10.1111/1365-2745.12370
Marbà, N., and Duarte, C. M. (1998). Rhizome elongation and seagrass clonal growth. Mar. Ecol. Prog. Ser. 174, 269–280. doi: 10.3354/meps174269
McMahon, K., Collier, C., and Lavery, P. S. (2013). Identifying robust bioindicators of light stress in seagrasses: a meta-analysis. Ecol. Indic. 30, 7–15. doi: 10.1016/j.ecolind.2013.01.030
Moore, K. A., and Jarvis, J. C. (2008). Environmental factors affecting recent summertime eelgrass diebacks in the lower Chesapeake Bay: implications for long-term persistence. J. Coast. Res. 55, 135–147. doi: 10.2112/SI55-014
Moore, K. A., and Short, F. T. (2006). “Zostera: biology, ecology, and management,” in Seagrasses: Biology, Ecology, and Conservation, eds A. W. D. Larkum, R. J. Orth, and C. M. Duarte (Dordrecht: Springer), 361–386.
Morris, L., Hall, L., Chamberlain, R., and Jacoby, C. (2018). “Summary report for the Northern Indian River Lagoon,” in Seagrass Integrated Mapping and Monitoring Report No. 3. Fish and Wildlife Research Institute Technical Report TR-17 version 3, eds L. Yarbro and P. R. Carlson (St. Petersburg, FL: Florida Fish and Wildlife Conservation Commission).
Morris, L. J., Hall, L. M., Miller, J. D., Lasi, M. A., Chamberlain, R. H., Virnstein, R. W., et al. (2021). Diversity and distribution of seagrasses as related to salinity, temperature, and availability of light in the Indian River Lagoon. Florida. Fla. Sci. 84, 119–137.
Morris, L. J., Hall, L. M., and Virnstein, R. W. (2001). Field Guide for Fixed Seagrass Transect Monitoring in the Indian River Lagoon. Palatka, FL: St. Johns River Water Management District.
Morris, L. J., Virnstein, R. W., and Miller, J. D. (2002). “Using preliminary light requirements of seagrass to gauge restoration success in the Indian River Lagoon, Florida,” in Seagrass Management: It’s Not Just Nutrients!, ed. H. S. Greening (St. Petersburg, FL: Tampa Bay Estuary Program), 246.
Nelson, W. G. (2017). Patterns of shading tolerance determined from experimental light reduction studies of seagrass. Aquat. Bot. 141, 39–46. doi: 10.1016/j.aquabot.2017.05.002
Newell, R. I. E., and Koch, E. W. (2004). Modeling seagrass density and distribution in response to changes in turbidity stemming from bivalve filtration and seagrass sediment stabilization. Estuaries 27, 793–806. doi: 10.1007/BF02912041
Onuf, C. P. (1994). Seagrasses, dredging, and light in Laguna Madre, Texas. Estuar. Coast. Shelf Sci. 39, 75–91. doi: 10.1006/ecss.1994.1050
Orth, R. J., Carruthers, T. J., Dennison, W. C., Duarte, C. M., Fourqurean, J. W., and Heck, K. L. (2006). A global crisis for seagrass ecosystems. BioScience 56, 987–996.
Orth, R. J., Lefcheck, J. S., McGlathery, K. S., Aoki, L., Luckenbach, M. W., Moore, K. A., et al. (2020). Restoration of seagrass habitat leads to rapid recovery of coastal ecosystem services. Sci. Adv. 6:eabc6434. doi: 10.1126/sciadv.abc6434
Orth, R. J., Lefcheck, J. S., and Wilcox, D. J. (2017). Boat propeller scarring of seagrass beds in lower Chesapeake Bay, USA: patterns, causes, recovery, and management. Estuaries Coasts 40, 1666–1676. doi: 10.1007/s12237-017-0239-9
Orth, R. J., Williams, M. R., Marion, S. R., Wilcox, D. J., Carruthers, T. J. B., Moore, K. A., et al. (2010). Long-term trends in submerged aquatic vegetation (SAV) in Chesapeake Bay, USA, related to water quality. Estuaries Coasts 33, 1144–1163. doi: 10.1007/s12237-010-9311-4
Phlips, E. J., Badylak, S., Nelson, N. G., Hall, L. M., Jacoby, C. A., Lasi, M. A., et al. (2021). Cyclical patterns and a regime shift in the character of phytoplankton blooms in a restricted subtropical lagoon, Indian River Lagoon, Florida USA. Front. Mar. Sci. 8:730934. doi: 10.3389/fmars.2021.730934
Quammen, M. L., and Onuf, C. P. (1993). Laguna Madre: seagrass changes continue decades after salinity reduction. Estuaries 16, 302–310. doi: 10.2307/1352503
Ralph, P. J., Durako, M. J., Enríquez, S., Collier, C. J., and Doblin, M. A. (2007). Impact of light limitation on seagrasses. J. Exp. Mar. Biol. Ecol. 350, 176–193. doi: 10.1016/j.jembe.2007.06.017
Robbins, B. D., and Bell, S. S. (2000). Dynamics of a subtidal seagrass landscape: seasonal and annual change in relation to water depth. Ecology 81, 1193–1205.
Roca, G., Alcoverro, T., Krause-Jensen, D., Balsby, T. J. S., van Katwijk, M. M., Marbà, N., et al. (2016). Response of seagrass indicators to shifts in environmental stressors: a global review and management synthesis. Ecol. Indic. 63, 310–323. doi: 10.1016/j.ecolind.2015.12.007
Smith, N. P. (1987). An introduction to the tides of Florida’s Indian River Lagoon. Fla. Sci. 50, 49–61.
Smith, N. P. (1993). Tidal and nontidal flushing of Florida’s Indian River Lagoon. Estuaries 16, 739–746. doi: 10.2307/1352432
Smith, N. P. (2001). Seasonal-scale transport patterns in a multi-inlet coastal lagoon. Estuar. Coast. Shelf Sci. 52, 15–28. doi: 10.1006/ecss.2000.0717
Steward, J. S., Virnstein, R. W., Morris, L. J., and Lowe, E. F. (2005). Setting seagrass depth, coverage, and light targets for the Indian River Lagoon system Florida. Estuaries 28, 923–935. doi: 10.1007/BF02696020
Tomasko, D., Alderson, M., Burnes, R., Hecker, J., Leverone, J., Raulerson, G., et al. (2018). Widespread recovery of seagrass coverage in southwest Florida (USA): temporal and spatial trends and management actions responsible for success. Mar. Poll. Bull. 135, 1128–1137. doi: 10.1016/j.marpolbul.2018.08.049
Tuya, F., Fernández-Torquemada, Y., del Pilar-Ruso, Y., Espino, F., Manent, P., Curbelo, L., et al. (2021). Partitioning resilience of a marine foundation species into resistance and recovery trajectories. Oecologia 196, 515–527. doi: 10.1007/s00442-021-04945-4
Unsworth, R. K. F., Nordland, L. M., and Cullen-Unsworth, L. C. (2018). Seagrass meadows support global fisheries production. Conserv. Lett. 12:e12566. doi: 10.1111/conl.12566
Unsworth, R. K. F., Collier, C. J., Waycott, M., McKenzie, L. J., and Cullen-Unsworth, L. C. (2015). A framework for the resilience of seagrass ecosystems. Mar. Poll. Bull. 100, 34–46. doi: 10.1016/j.marpolbul.2015.08.016
Valdez, S. R., Zhang, Y. S., van der Heide, T., Vanderklift, M. A., Tarquinio, F., Orth, R. J., et al. (2020). Positive ecological interactions and the success of seagrass restoration. Front. Mar. Sci. 7:91. doi: 10.3389/fmars.2020.00091
van der Heide, T., Bouma, T. J., van Nes, E. H., van de Koppel, J., Scheffer, M., Roelofs, J. G. M., et al. (2010). Spatial self-organized patterning in seagrass along a depth gradient of an intertidal ecosystem. Ecology 91, 362–369. doi: 10.1890/08-1567.1
van Katwijk, M. M., Thorhaug, A., Marbà, N., Orth, R. J., Duarte, C. M., Kendrick, G. A., et al. (2016). Global analysis of seagrass restoration: the importance of large-scale planting. J. Appl. Ecol. 53, 567–578. doi: 10.1111/1365-2664.12562
Virnstein, R. W. (1995). Seagrass landscape diversity in the Indian River Lagoon, Florida: the importance of geographic scale and pattern. Bull. Mar. Sci. 57, 67–74.
Virnstein, R. W., and Morris, L. J. (1996). Seagrass Preservation and Restoration: a Diagnostic Plan for the Indian River Lagoon. Technical Memorandum No. 14. Palatka, FL: St Johns River Water Management District.
Waycott, M., Duarte, C. M., Carruthers, T. J. B., Orth, R. J., Dennison, W. C., Olyarnik, S., et al. (2009). Accelerating loss of seagrass across the globe threatens coastal ecosystems. Proc. Natl. Acad. Sci. U.S.A. 106, 12377–12381. doi: 10.1073/pnas.0905620106
Wong, M. C., Vercaemer, B. M., and Griffiths, G. (2021). Response and recovery of eelgrass (Zostera marina) to chronic and episodic light disturbances. Estuaries Coasts 44, 312–324. doi: 10.1007/s12237-020-00803-3
Woodward-Clyde Consultants (1994). Physical Features of the Indian River Lagoon. Final Technical Report. Tallahassee, FL: Indian River Lagoon National Estuary Program.
Yarbro, L. A., and Carlson, P. R. (eds). (2013). Seagrass Integrated Mapping and Monitoring Program: Mapping and Monitoring Report No. 1. Fish and Wildlife Research Institute Technical Report TR-17. St. Petersburg, FL: Fish and Wildlife Research Institute, iv+126.
York, P. H., Gruber, R. K., Hill, R., Ralph, P. J., Booth, D. J., and Macreadie, P. I. (2013). Physiological and morphological responses of the temperate seagrass Zostera muelleri to multiple stressors: investigating the interactive effects of light and temperature. PLoS One 8:76377. doi: 10.1371/journal.pone.0076377
Keywords: seagrass loss, seagrass persistence, mapping, fixed transects, light, temperature, salinity
Citation: Morris LJ, Hall LM, Jacoby CA, Chamberlain RH, Hanisak MD, Miller JD and Virnstein RW (2022) Seagrass in a Changing Estuary, the Indian River Lagoon, Florida, United States. Front. Mar. Sci. 8:789818. doi: 10.3389/fmars.2021.789818
Received: 05 October 2021; Accepted: 28 December 2021;
Published: 17 January 2022.
Edited by:
Duane E. De Freese, Independent Researcher, Sebastian, FL, United StatesReviewed by:
Andrew Martin Lohrer, National Institute of Water and Atmospheric Research (NIWA), New ZealandCopyright © 2022 Morris, Hall, Jacoby, Chamberlain, Hanisak, Miller and Virnstein. This is an open-access article distributed under the terms of the Creative Commons Attribution License (CC BY). The use, distribution or reproduction in other forums is permitted, provided the original author(s) and the copyright owner(s) are credited and that the original publication in this journal is cited, in accordance with accepted academic practice. No use, distribution or reproduction is permitted which does not comply with these terms.
*Correspondence: Lori J. Morris, bG1vcnJpc0BzanJ3bWQuY29t
Disclaimer: All claims expressed in this article are solely those of the authors and do not necessarily represent those of their affiliated organizations, or those of the publisher, the editors and the reviewers. Any product that may be evaluated in this article or claim that may be made by its manufacturer is not guaranteed or endorsed by the publisher.
Research integrity at Frontiers

Learn more about the work of our research integrity team to safeguard the quality of each article we publish.