 Gary Molano
 Jose Diesel1†
 Filipe Alberto
 Sergey V. Nuzhdin
94% of researchers rate our articles as excellent or good
Learn more about the work of our research integrity team to safeguard the quality of each article we publish.
Find out more
ORIGINAL RESEARCH article
Front. Mar. Sci., 18 January 2022
Sec. Marine Evolutionary Biology, Biogeography and Species Diversity
Volume 8 - 2021 | https://doi.org/10.3389/fmars.2021.774076
Macrocystis pyrifera (giant kelp), a haplodiplontic brown macroalga that alternates between a macroscopic diploid (sporophyte) and a microscopic haploid (gametophyte) phase, provides an ideal system to investigate how ploidy background affects the evolutionary history of a gene. In M. pyrifera, the same genome is subjected to different selective pressures and environments as it alternates between haploid and diploid life stages. We assembled M. pyrifera gene models using available expression data and validated 8,292 genes models using the model alga Ectocarpus siliculosus. Differential expression analysis identified gene models expressed in either or both the haploid and diploid life stages while functional annotation identified processes enriched in each stage. Genes expressed preferentially or exclusively in the gametophyte stage were found to have higher nucleotide diversity (π = 2.3 × 10⁻³ and 2.8 × 10⁻³, respectively) than those for sporophytes (π = 1.1 × 10⁻³ and 1 × 10⁻³, respectively). While gametophyte-biased genes show faster sequence evolution, the sequence evolution exhibits less signatures of adaptations when compared to sporophyte-biased genes. Our findings contrast the standing masking hypothesis, which predicts higher standing genetic variation at the sporophyte stage, and support the strength of expression theory, which posits that genes expressed more strongly are expected to evolve slower. We argue that the sporophyte stage undergoes more stringent selection compared with the gametophyte stage, which carries a heavy genetic load associated with broadcast spawning. Furthermore, using whole-genome sequencing, we confirm the strong population structure in wild M. pyrifera populations previously established using microsatellite markers, and estimate population genetic parameters, such as pairwise genetic diversity and Tajima’s D, important for conservation and domestication of M. pyrifera.
The early evolutionary theory of “masking” posits that ploidy will affect the rates of selection on genes (Crow and Kimura, 1965). As most functionally important mutations are deleterious but recessive, and the chance of having two deleterious alleles in the same position is low, heterozygous diploids can “mask” deleterious alleles with wild type alleles (Crow and Simmons, 1983). Masking increases the genetic diversity of the diploid species, as deleterious alleles persist far longer than in haploid species and carry the potential to be beneficial in varying environmental conditions (Raper and Flexer, 1970). Haploids are unmasked in comparison to diploids: with only a single copy of each allele, haploids are more exposed to selection, meaning that beneficial mutations reach fixation and deleterious alleles are purged faster (Kondrashov and Crow, 1991; Otto and Gerstein, 2008). In haplodiplontic organisms, in which development and vegetative growth occur in both haploid and diploid stages, genes expressed in different life stages should undergo different evolutionary pressures (Bell, 1994; Jenkins and Kirkpatrick, 1995). Masking theory predicts that diploid-specific genes should contain more genetic variation than haploid genes, as diploid-specific genes are not exposed to selection pressure in the haploid stage and will accumulate mutations, while recessive mutations will be quickly purged from haploid-specific genes (Szövényi et al., 2013).
However, masking may not be the primary determinant in gene evolutionary rates. A previous study examined stage-specific selection in land plants and found that masking alone could not explain the stage specific differences in gene evolutionary rates (Szövényi et al., 2013). Two alternative theories for selection on genes in different life stages are (1) gene breadth of expression and (2) overall gene expression strength. Genes expressed across multiple tissue types tend to evolve more slowly than tissue-specific genes (Park and Choi, 2010). Gene expression levels are also the predominant factor determining gene evolution in yeast (Drummond et al., 2006). Extending the gene breadth of expression theory to haplodiplontic organisms suggests that genes that are expressed in both haploid and diploid life stages are expected to evolve more slowly in comparison with genes limited to either the diploid or haploid stage (Szövényi et al., 2013). Extending the strength of expression theory to haplodiplontic organisms suggests that genes in the life stage with higher expression levels will evolve more slowly.
The multiple ploidy stages found in haplodiplonts provide a system to test the influence of masking and strength/breadth of expression on gene evolutionary rates in the haploid or diploid life stages. Haplodiplonts can either be heteromorphic, in which the haploid and diploid stages differ in morphology, or isomorphic, in which the haploid and diploid stages show no morphological difference between stages (Hughes and Otto, 1999). Some species of alga are heteromorphic haplodiplonts, and have one life stage that is larger, favorable for growth and vulnerable to predation, and another life stage that is smaller and resistant to environmental stresses (Klinger, 1993). In heteromorphic haplodiplonts, each life stage can have different environmental conditions, niches, and stresses. Therefore, it is possible to test the factors behind the different gene evolutionary rates in each life stage (Hughes and Otto, 1999). In a diploid dominant sporophyte, gene breadth of expression predicts that genes expressed in both the haploid and diploid stages will evolve more slowly than genes expressed strictly in the haploid or diploid stage. Again, in a diploid dominant sporophyte, gene strength of expression predicts that genes expressed in the diploid life stage will have higher total expression and will evolve more slowly than genes expressed in the haploid life stage. This is incompatible with the masking theory prediction, which posits the haploid stage will evolve more slowly, as mutations will be quickly purged from the genome. Previous studies in diploid dominant land plants revealed that gene breadth of expression was the most important underlying factor for gene evolutionary rates, and that haploid-specific genes did not evolve faster than diploid-specific or ubiquitous genes (Szövényi et al., 2013).
While gene evolutionary rate dynamics have been compared between diploid and haploid life stages in angiosperms, other haplodiplontic organisms with different evolutionary histories, such as many macroalgae, may undergo different selective pressures and interplay between masking, gene breadth of expression, and gene expression strength (Yoon et al., 2004). For example, in angiosperms the haploid stage only exists while protected and supplied by diploid maternal tissues; thus, purifying selection on haploid-specific genes might be substantially reduced. By contrast, many species of brown macroalgae (Ochrophyta) possess free-living haploid and diploid stages that independently evolved multicellularity and occupy a very different niche space than land plants, including a more dynamic marine environment. Therefore, it is worth investigating whether the gene expression breadth theory for gene evolutionary rate is consistent in land plants and brown macroalgae (Cock et al., 2010).
Giant kelp (Macrocystis pyrifera) has a haplodiplontic life cycle, in which large, diploid adult sporophytes (Figure 1A) produce microscopic haploid zoospores that settle on a substrate and develop into haploid male or female gametophytes (Figure 1B). Male gametophytes release sperm, which fuse with female gametophyte eggs, producing the next generation of diploid sporophytes (North, 1987; Figure 1C). The biphasic life cycle of giant kelp provides a platform for investigating how genes in the same organism can evolve differently depending on the ploidy background they are being expressed, especially since the haploid and diploid stages are multicellular and are exposed to natural selection (Bell, 2008). Previous work on differential expression in giant kelp concluded that gametophyte-biased genes had a significantly higher non-synonymous to synonymous substitution rate (Lipinska et al., 2019). We plan on building on this previous study by conducting analyses with population variation data, and thus can measure if the faster sequence evolution in gametophyte-biased genes is adaptive (Lipinska et al., 2019). To investigate the gene evolutionary history between different life stages in giant kelp, we built a set of gene models to generate a transcriptome reference and coupled gene evolution with patterns of intraspecific standing variation. We also distinguished genes differentially expressed between stages and used polymorphism data to assess genetic diversity, sequence evolution rates, and measure adaptive evolution.
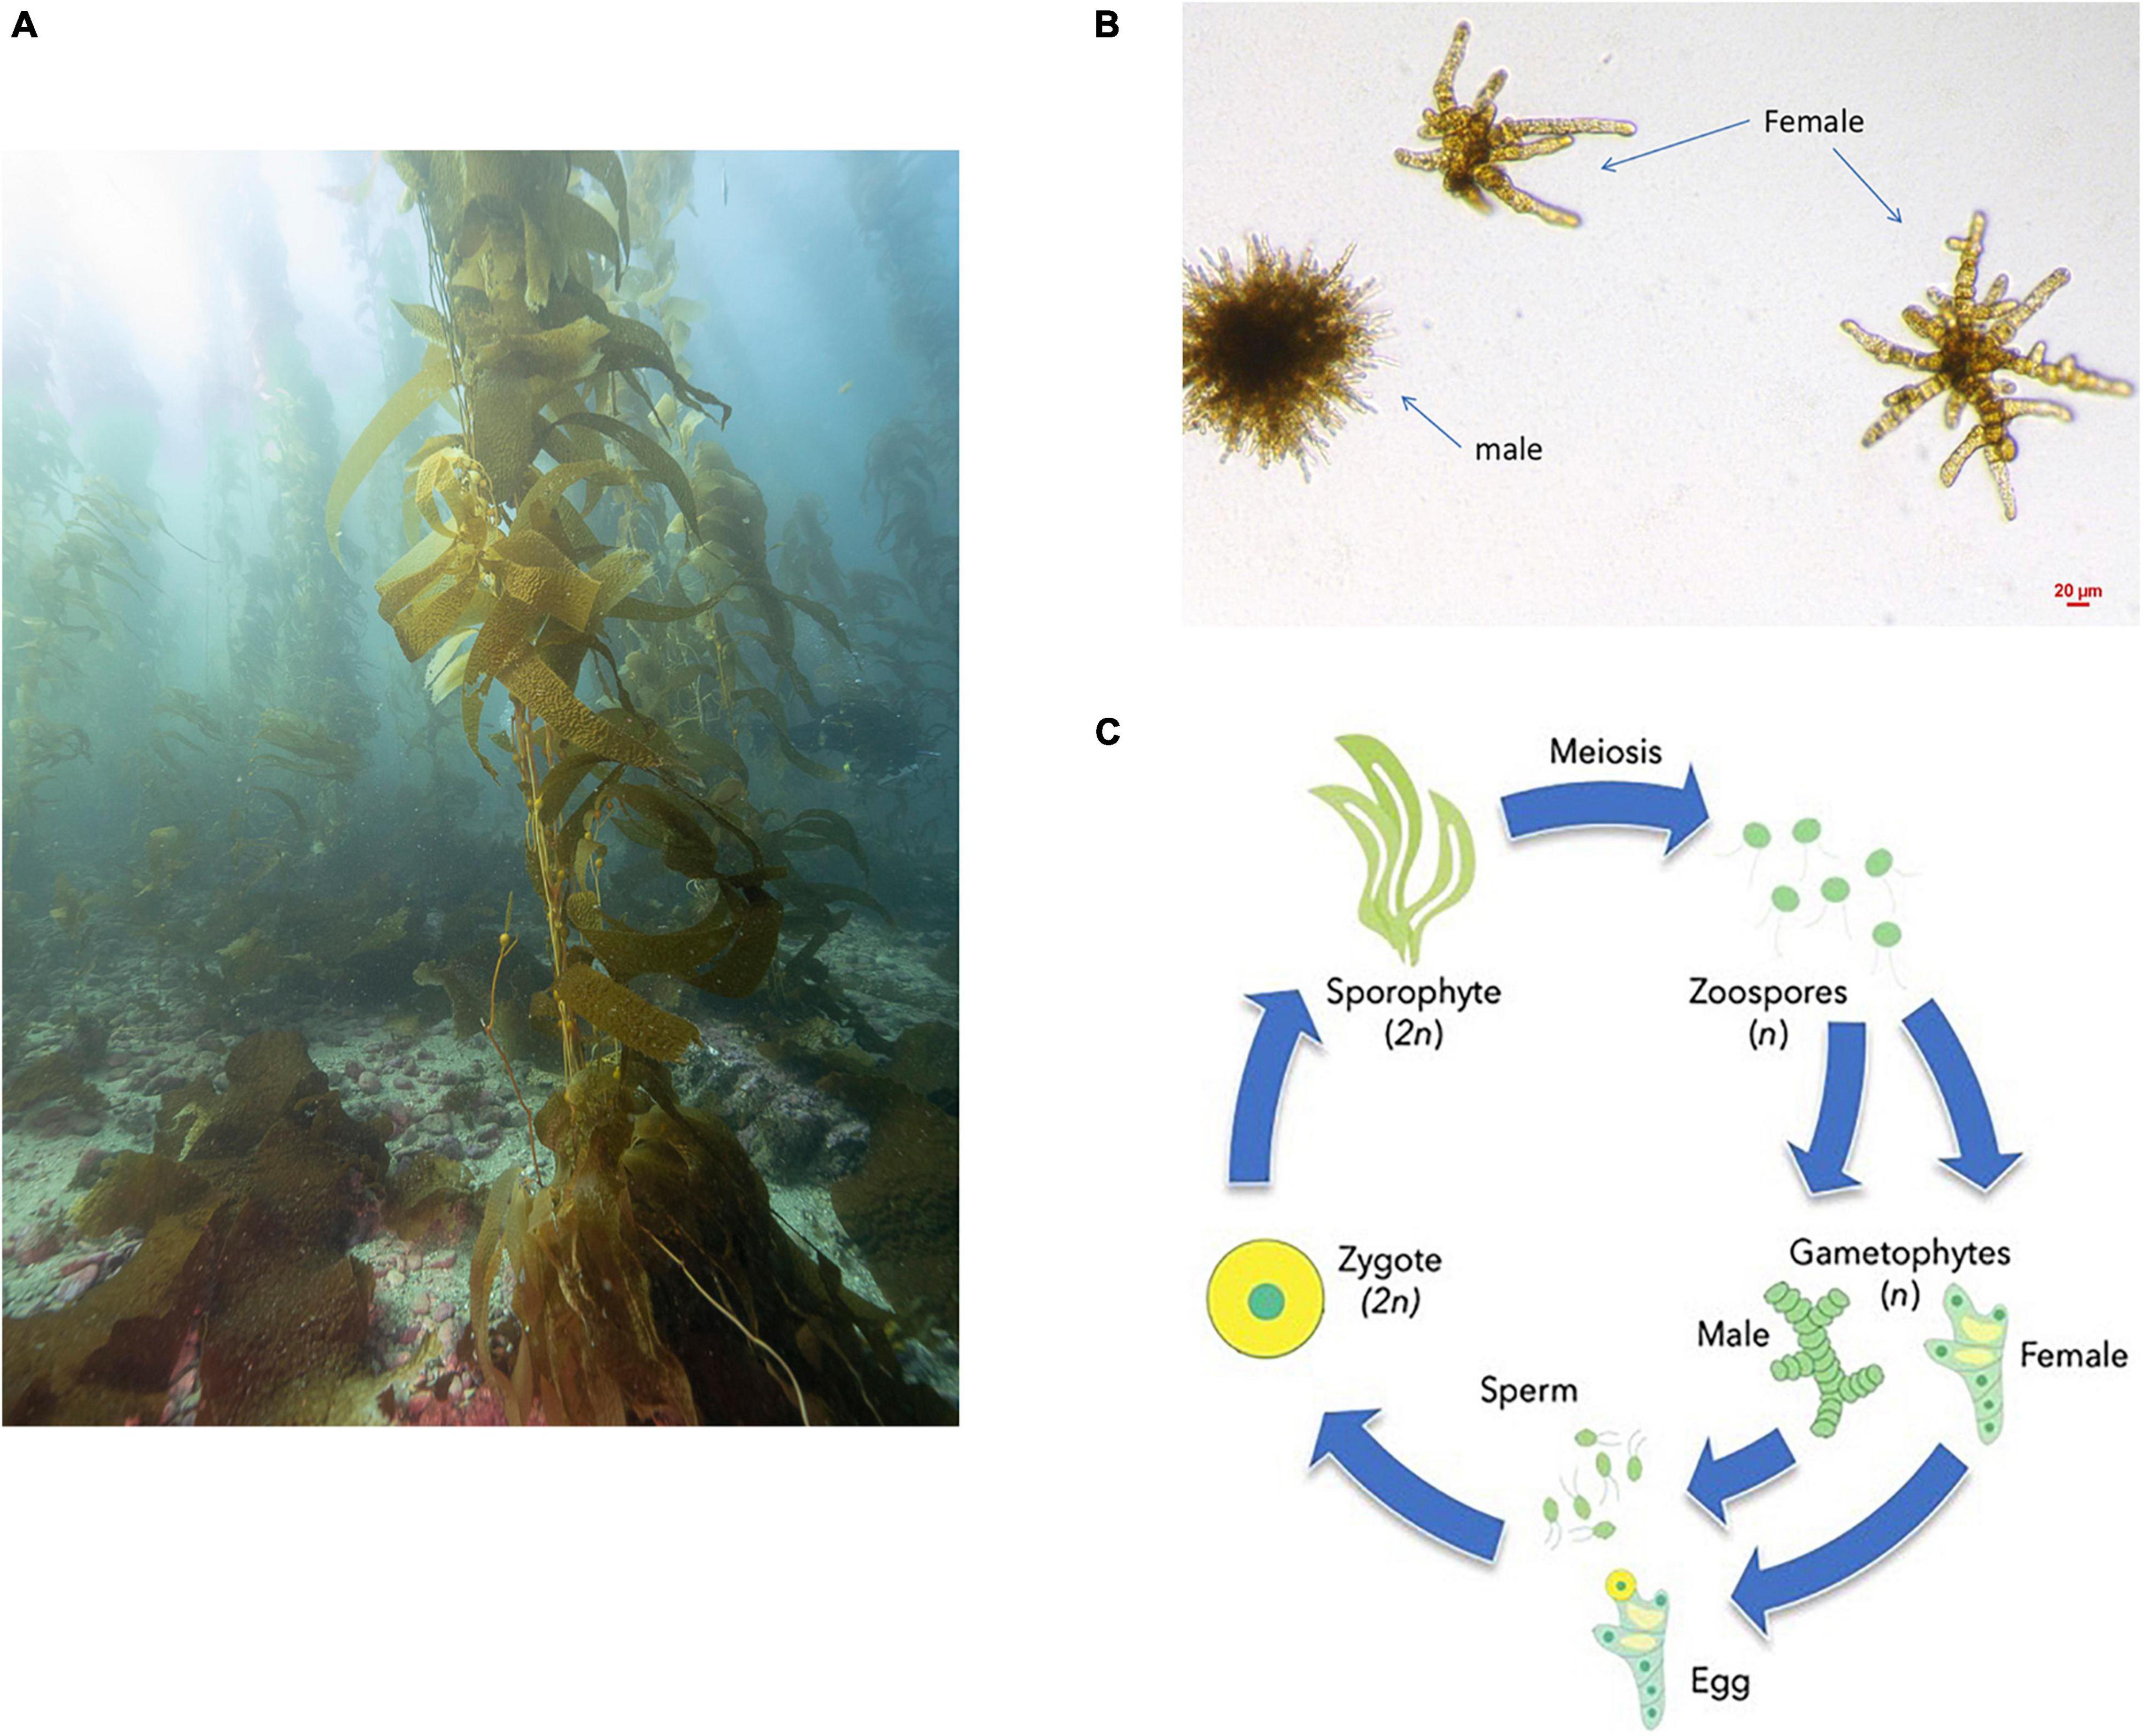
Figure 1. (A) Adult giant kelp diploid sporophyte (Picture courtesy of Maurice Roper). (B) Microscopic giant kelp haploid gametophytes. (C) Giant kelp reproductive cycle: during sexual reproduction, adult sporophytes (2N) produce zoospores (N) through meiosis, which after settling differentiate into sexed gametophytes. Sexual reproduction of gametophytes happens when sperm from a male gametophyte encounters a female gametophyte egg. Fusion will result in an early stage sporophyte completing the cycle. (C) Courtesy of Kelly DeWeese.
Intricacies of the giant kelp biology and ecology have been extensively studied since the advent of SCUBA in the 1950s (Schiel and Foster, 2015). More recent work has begun to unravel the level of genetic variation present in wild populations. Early work on this topic identified putative wild populations of kelp between geographically separated populations in California by comparing growth rates in low nitrogen environments (Kopczak et al., 1991). Other studies used internal described spacer regions of non-coding rDNA, as well as cytochrome c oxidase 1, to resolve kelp phylogeny and collapse multiple potential kelp species in both the Northern and Southern hemispheres into M. pyrifera (Coyer et al., 2001; Zuccarello and Macaya, 2010). These studies concluded that giant kelp originated in the Northern hemisphere and spread southward into the Southern hemisphere (Zuccarello and Macaya, 2010). Microsatellite marker analysis along the coasts of North and South America revealed a center of genetic diversity near the Southern California Bight, with populations becoming increasingly homogenous moving away from that location (Johansson et al., 2015). As microsatellites have a higher mutation rate when compared with coding genes, demographic patterns may change when using whole-genome polymorphism data (Li et al., 2002).
A deeper understanding of giant kelp population genetics would greatly assist domestication efforts in the near future, especially considering the lack of breeding macroalgae research when compared to other food sectors (Buschmann et al., 2017). The global seaweed aquaculture industry is expanding, with a market share surpassing $13 billion dollars in 2018 and applications ranging from food to cosmetics, fertilizers, pharmaceuticals, and more (Chopin and Tacon, 2021; Naylor et al., 2021).
There are many species of seaweed of economic significance, including but not limited to red macroalgae such as Eucheuma, Gracilaria, Kappaphycus, and Porphyra (nori), as well as the brown macroalgae Saccharina japonica (kombu), Undaria pinnatifida (wakame), and Saccharina latissima (Grebe et al., 2019; Hu et al., 2021).
However, as the seaweed aquaculture industry continues to expand, new species of interest for aquaculture domestication have been identified. The globally distributed giant kelp is an incredibly fast-growing brown macroalgae that provides the foundation for species-rich ecosystems (Graham et al., 2007). Due to its fast growth rate and high polysaccharide content, including mannitol and alginate, giant kelp is a great candidate as feedstocks for biofuels (Camus et al., 2016). Giant kelp can also be used as an animal feed supplement and has extractable bio-active compounds that can be used in a wide variety of applications, such as fertilizer supplement to cosmetics to antioxidant activity (Arioli et al., 2015; Makkar et al., 2016; Tanna and Mishra, 2018; Hameury et al., 2019). Seaweed domestication has been hampered by limited starting gene pools and clonal propagation techniques. Therefore, increasing the level of genetic information available for domestication is paramount for improving seed stocks and limiting inbreeding depression (Loureiro et al., 2015). Thus, exploring the population genetic parameters and genetic relatedness between giant kelp populations in North America will assist in domestication efforts.
To investigate gene evolution rates in giant kelp in the absence of a publicly available reference genome, we first assembled contigs for giant kelp based on published cDNA data (Salavarría et al., 2018; Lipinska et al., 2019). We then collapsed the initial assembly based on a minimum length and percent identity thresholds to remove redundancies and isoforms and used filtering couple with a reciprocal blast to the published and annotated Ectocarpus siliculosus genome to validate our gene models (see section “Materials and Methods”). The orders Laminariales (giant kelp) and Ectocarpales (Ectocarpus siliculosus) diverged about 98 million years ago (Silberfeld et al., 2010). Reciprocal blasts are a conservative method to reveal orthologs, as only gene models that are top matches in both blast directions are kept for analysis. Genes will be left out of this analysis if they are not present in either species or strongly evolved between M. pyrifera and E. siliculosus. M. pyrifera is diploid dominant, with the macroscopic sporophyte stage having more cell types than the microscopic gametophyte stage. E. siliculosus has less differentiation between the gametophyte and sporophyte stages, and is physically smaller than M. pyrifera (Lipinska et al., 2019). Additionally, M. pyrifera contains 28,931 genes (3,157 gametophyte-biased genes, 22,186 unbiased genes, 3,588 sporophyte-biased genes), while E. siliculosus contains 17,426 genes (4,105 gametophyte-biased genes, 11,224 unbiased genes, 2,097 sporophyte-biased genes) (Lipinska et al., 2019). We expected to find more haploid and ubiquitously expressed genes in this data set due differences between the two species in morphologies and overall gene count, especially in regard to the sporophyte stage. We also further filtered our gene model data based on coverage and removed contaminants after blasting to Uniprot (UniProt Consortium, 2021). Our final gene model data set consisted of 8,292 gene models (Supplementary File 2).
We then assessed each level of pruning of the assembled contigs and gene models for transcriptome completeness with BUSCO, which reports the presence of single-copy orthologs to evaluate genome completeness (Seppey et al., 2019). This step limited redundant gene models in the analysis, while simultaneously capturing as many genes identified by BUSCO as possible and benchmarking them against the published E. siliculosus genome (Supplementary Figure 1). We found that the 8,292 gene model data set contained almost all of the BUSCO single copy orthologs in the eukaryote_odb10 database that were also found in the E. siliculosus genome (155 genes to 177 genes, respectively). We also confirmed that there were no BUSCO gene duplicates in the 8,292 gene models. Furthermore, we classified genes with biased and specific expressions in each life stage using differential expression analysis We found that 6,656 genes were “ubiquitously” expressed, i.e., not differentially expressed between sporophyte and gametophyte with a log2 fold change with 0.05 false discovery rate. Most of the remaining genes showed a higher expression toward the haploid gametophyte life stage, with 734 genes exhibiting biased expression and 227 genes being completely gametophyte-specific. As for the diploid sporophyte stage, 574 genes were biased while 101 were specific. We predicted the increased number of ubiquitous, haploid-biased and haploid-specific genes, relative to sporophyte biased and sporophyte-specific genes, based on differences in the morphologies and gene counts between the two species. We then compared the average expression of genes that we classified as either gametophyte, ubiquitous, or sporophyte; we found that sporophyte genes had a higher level of expression compared with gametophyte genes. Ubiquitous gene expression was intermediate compared to the sporophyte and gametophyte average expression levels (Figure 2A). We then checked how the level of ubiquitous gene expression differed between the gametophyte and sporophyte stages, and observed small differences between overall ubiquitous gene expression in either the gametophyte or sporophyte stage (Figure 2B).
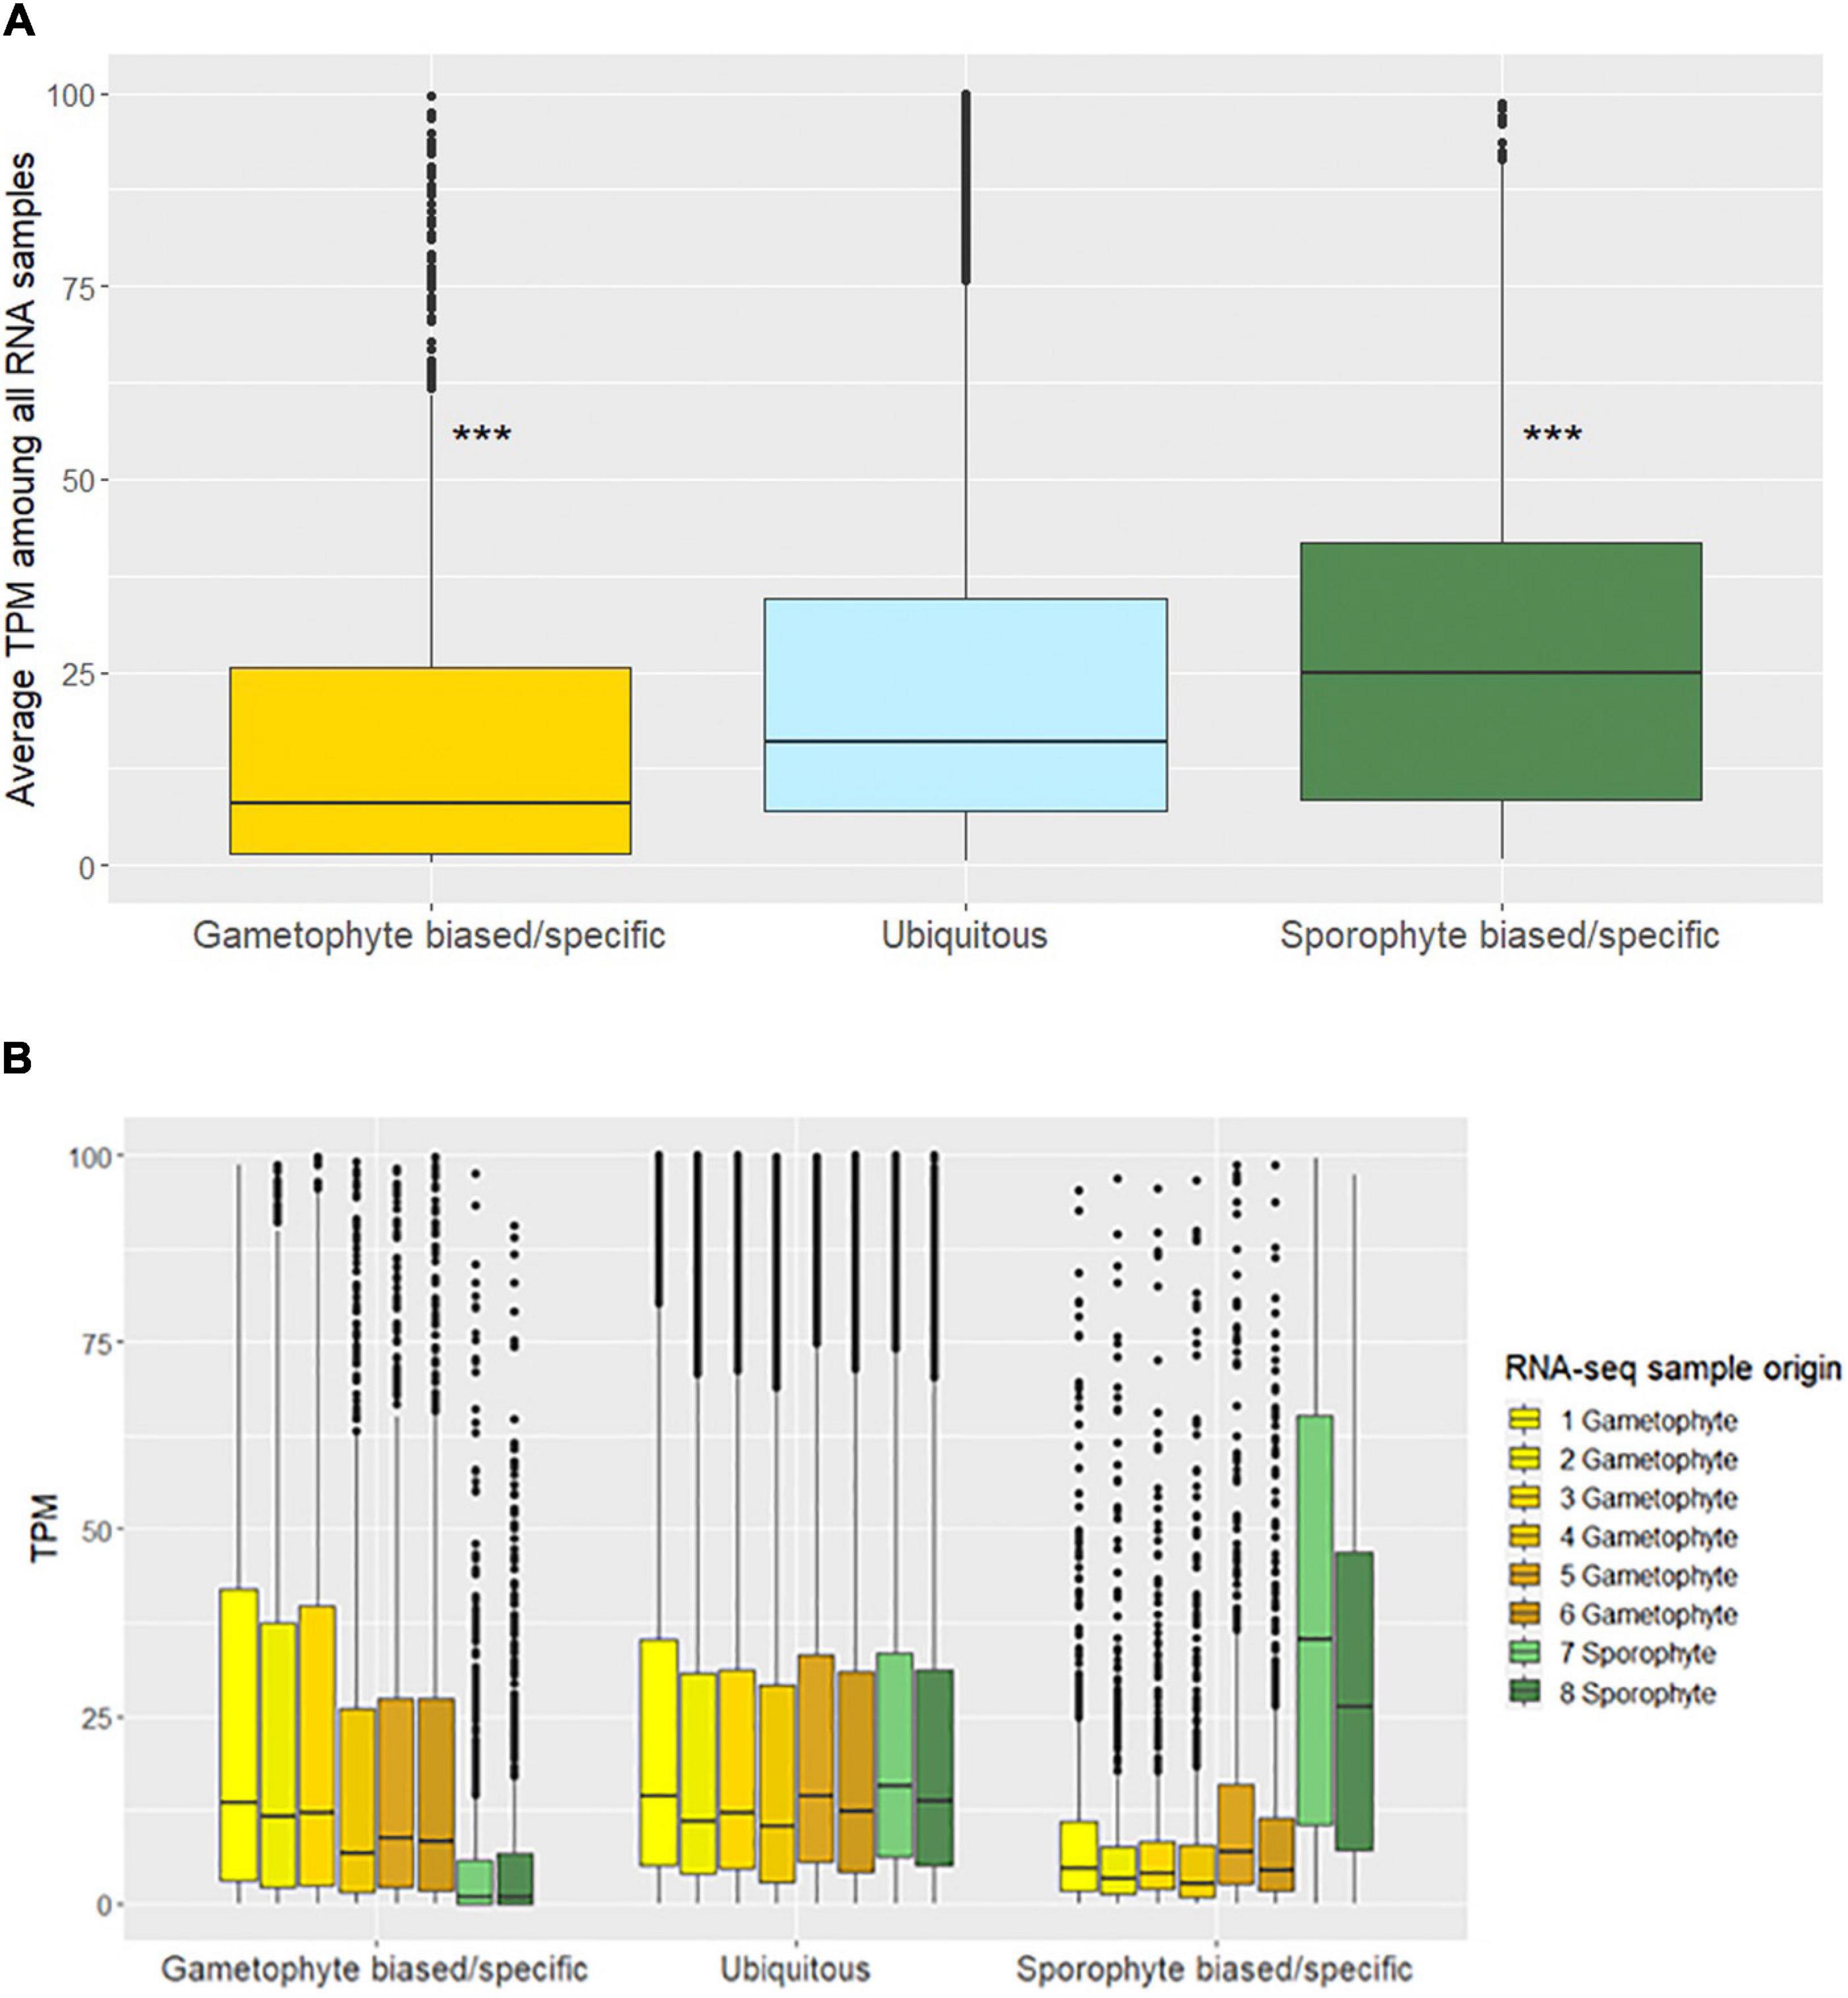
Figure 2. (A) Average transcripts per million (TPM) for each life stage among all RNA samples. (pairwise Wilcoxon test; ***p-value < 0.001). (B) TPM for each RNA-seq sample separated into each life stage.
To compare the degree of polymorphism in genes with biased, specific, and ubiquitous expression, we performed whole genome sequencing on 48 individual sporophytes sampled from three Southern California populations of M. pyrifera (Figure 3A). We identified single nucleotide polymorphisms (SNPs) after aligning reads to our M. pyrifera gene model data set. Using 247,656 filtered and bi-allelic SNPs, we calculated nucleotide diversity (π) across each gene model. On average, nucleotide diversity had a value of π = 1.74 × 10⁻³ between all the gene models in this analysis. We also observed a higher π in gametophyte-biased and gametophyte-specific genes, with gametophyte-specific genes containing almost three times the diversity of sporophyte-specific genes, 2.8 × 10⁻³ and 1.02 × 10⁻³, respectively (Table 1). We then calculated Tajima’s D for each gene to as an indicator of random (neutrally) or non-random (selection) gene evolution. We found that Tajima’s D was negative for all gene groups, showing an excess of low-frequency polymorphisms when compared to the expected variation under the neutral theory (Tajima, 1989). A negative Tajima’s D is indicative of a recent population expansion after a bottleneck and is also consistent with selection sweeps (Table 1).
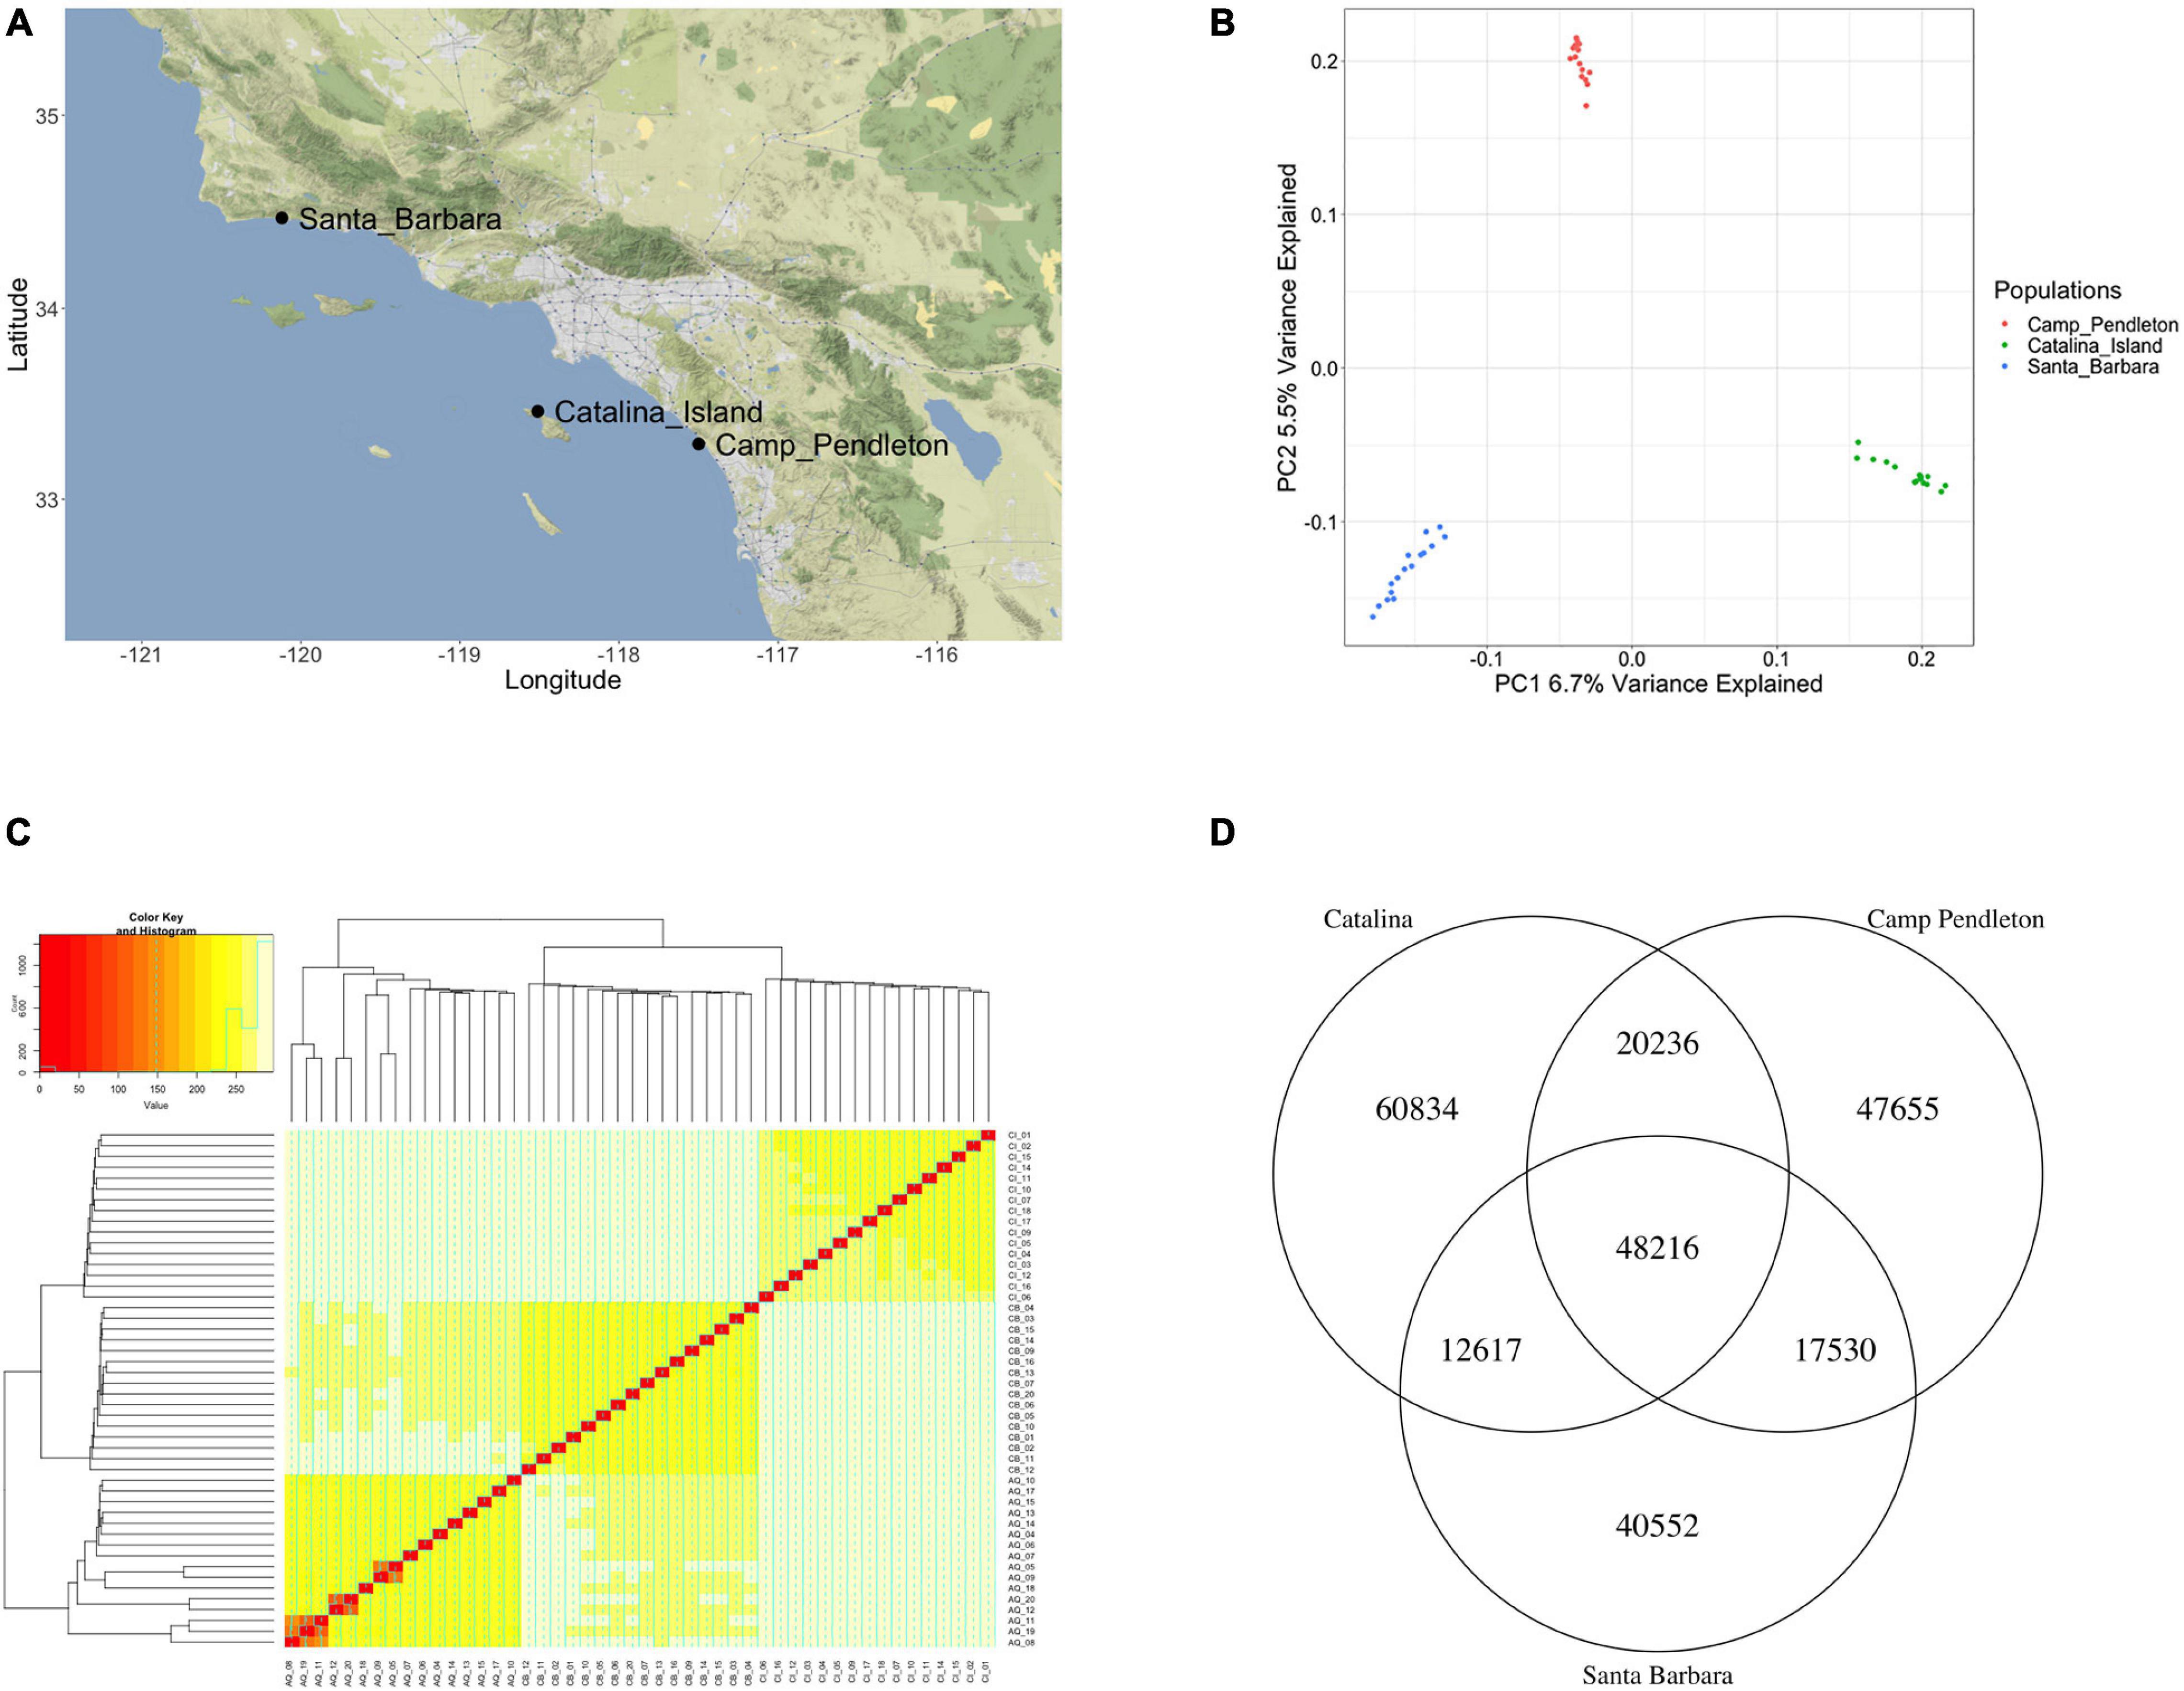
Figure 3. Analysis of population structure between the three analyzed populations: (A) Sampling locations of wild kelp populations in Southern California. (B) Principal component analysis showing strong signs of population structure. (C) Nei’s genetic distance between 48 individuals mapped onto the gene models again showing clear population structure (AQ prefix is the Santa Barbara Population, CB prefix is the Camp Pendleton population). (D) Venn diagram of single nucleotide polymorphism (SNPs) presented in each population showing that most SNPs are population specific.
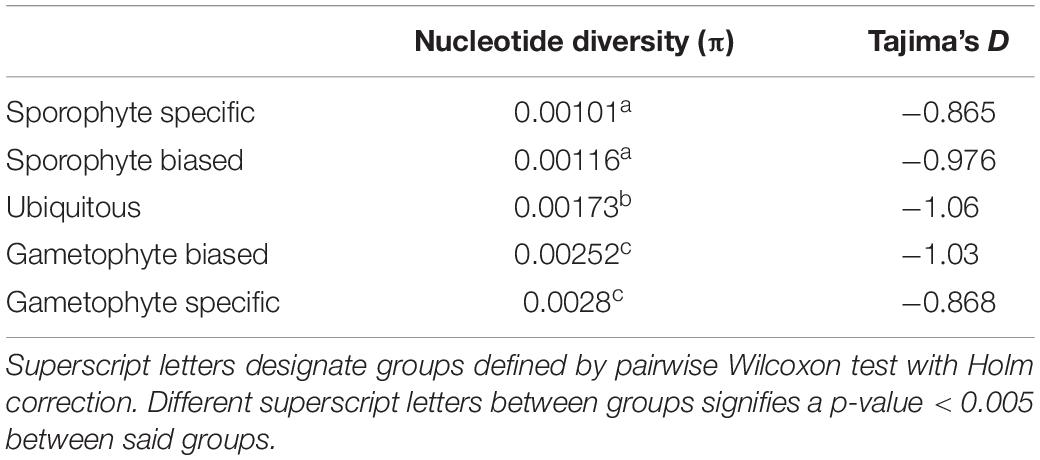
Table 1. Polymorphism measurements for each category of expression given in nucleotide diversity (π) and Tajima’s D.
Prior studies revealed population subdivision in Southern California giant kelp populations based on microsatellite data, including distinct subpopulations at our sampling sites from Catalina Island, Santa Barbara, and Camp Pendleton (Johansson et al., 2015). We found a substantial population structure between our sampling populations after we performed a principal component analysis on the polymorphism data, with PC1 (6.7% variance explained) and PC2 (5.4% variance explained (Zheng et al., 2012; Wickham and Grolemund, 2016; Figure 3B). We further estimated population structure after calculating and visualizing Nei’s genetic distance for each individual (Nei, 1973; Jombart, 2008; Figure 3C). Previous brown macroalgae population genetics studies used molecular markers such as microsatellites to assay genetic variation within a species and found a majority of the genetic variation within populations instead of between populations (Breton et al., 2018; Mooney et al., 2018; Goecke et al., 2020). We compared the variation between the Santa Barbara, Catalina Island, and Camp Pendleton populations using bi-allelic SNPs across the gene models. We found that a majority of bi-allelic SNPs were population-specific (24.6% of SNPs are unique to Catalina Island, 19.2% of SNPs are unique to Camp Pendleton, 16.4% of SNPS are unique to Santa Barbara, and 19.5% of the SNPs are shared by all three populations) (Figure 3D). We calculated the fixation indexes, HT for all of the populations together (HT = 0.122), and Hs for each subpopulation (Hs_Santa_Barbara = 0.103, Hs_Camp Pendleton = 0.106, and Hs_Catalina = 0.110) (Supplementary File 3). There was slightly more genetic variation between populations than within populations, with the Catalina population slightly more diverse than the coastal populations. These findings matched the strong population structure we had previously noted.
Our findings of higher nucleotide diversity in gametophyte expressed genes contradicts our initial hypothesis that masking would lead to lower genetic diversity in gametophyte expressed genes (as deleterious mutations in haploid expressed genes should be purged quickly from the genome). Next, we investigated if the excess polymorphisms in the gametophyte stage were neutral or adaptive and compared them with ubiquitous and sporophyte-specific genes. To investigate the rate of sequence evolution between giant kelp life stages, we first looked at the non-synonymous to synonymous substitution rate of coding regions, using E. siliculosus as an outgroup. Ubiquitous genes exhibited a slower evolutionary rate in coding regions (lower dN/dS) (Figure 4A), which was expected due to the conserved nature of the genes tested. Using a pairwise Wilcox test, corrected with the Holm procedure, we found significant differences between the dN/dS of ubiquitous genes and gametophyte-specific and gametophyte-biased genes (p < 2e-16), as well as between gametophyte-specific and gametophyte-biased genes (p = 1.3e-06). We also found significant differences between the dN/dS of ubiquitous genes and sporophyte-biased genes (p = 0.03), and no significant differences between ubiquitous genes and sporophyte specific genes (p = 0.94). Finally, we found significant differences between gametophyte and sporophyte genes, both biased and specific (Supplementary Table 1). We did not see any significant differences between sporophyte-specific and sporophyte-biased genes. Overall, for genes with stage specific expression, the haploid gametophyte sequences had a higher sequence evolution rate, while diploid sporophyte-specific genes showed rates more similar to ubiquitously expressed genes (Supplementary Table 2).
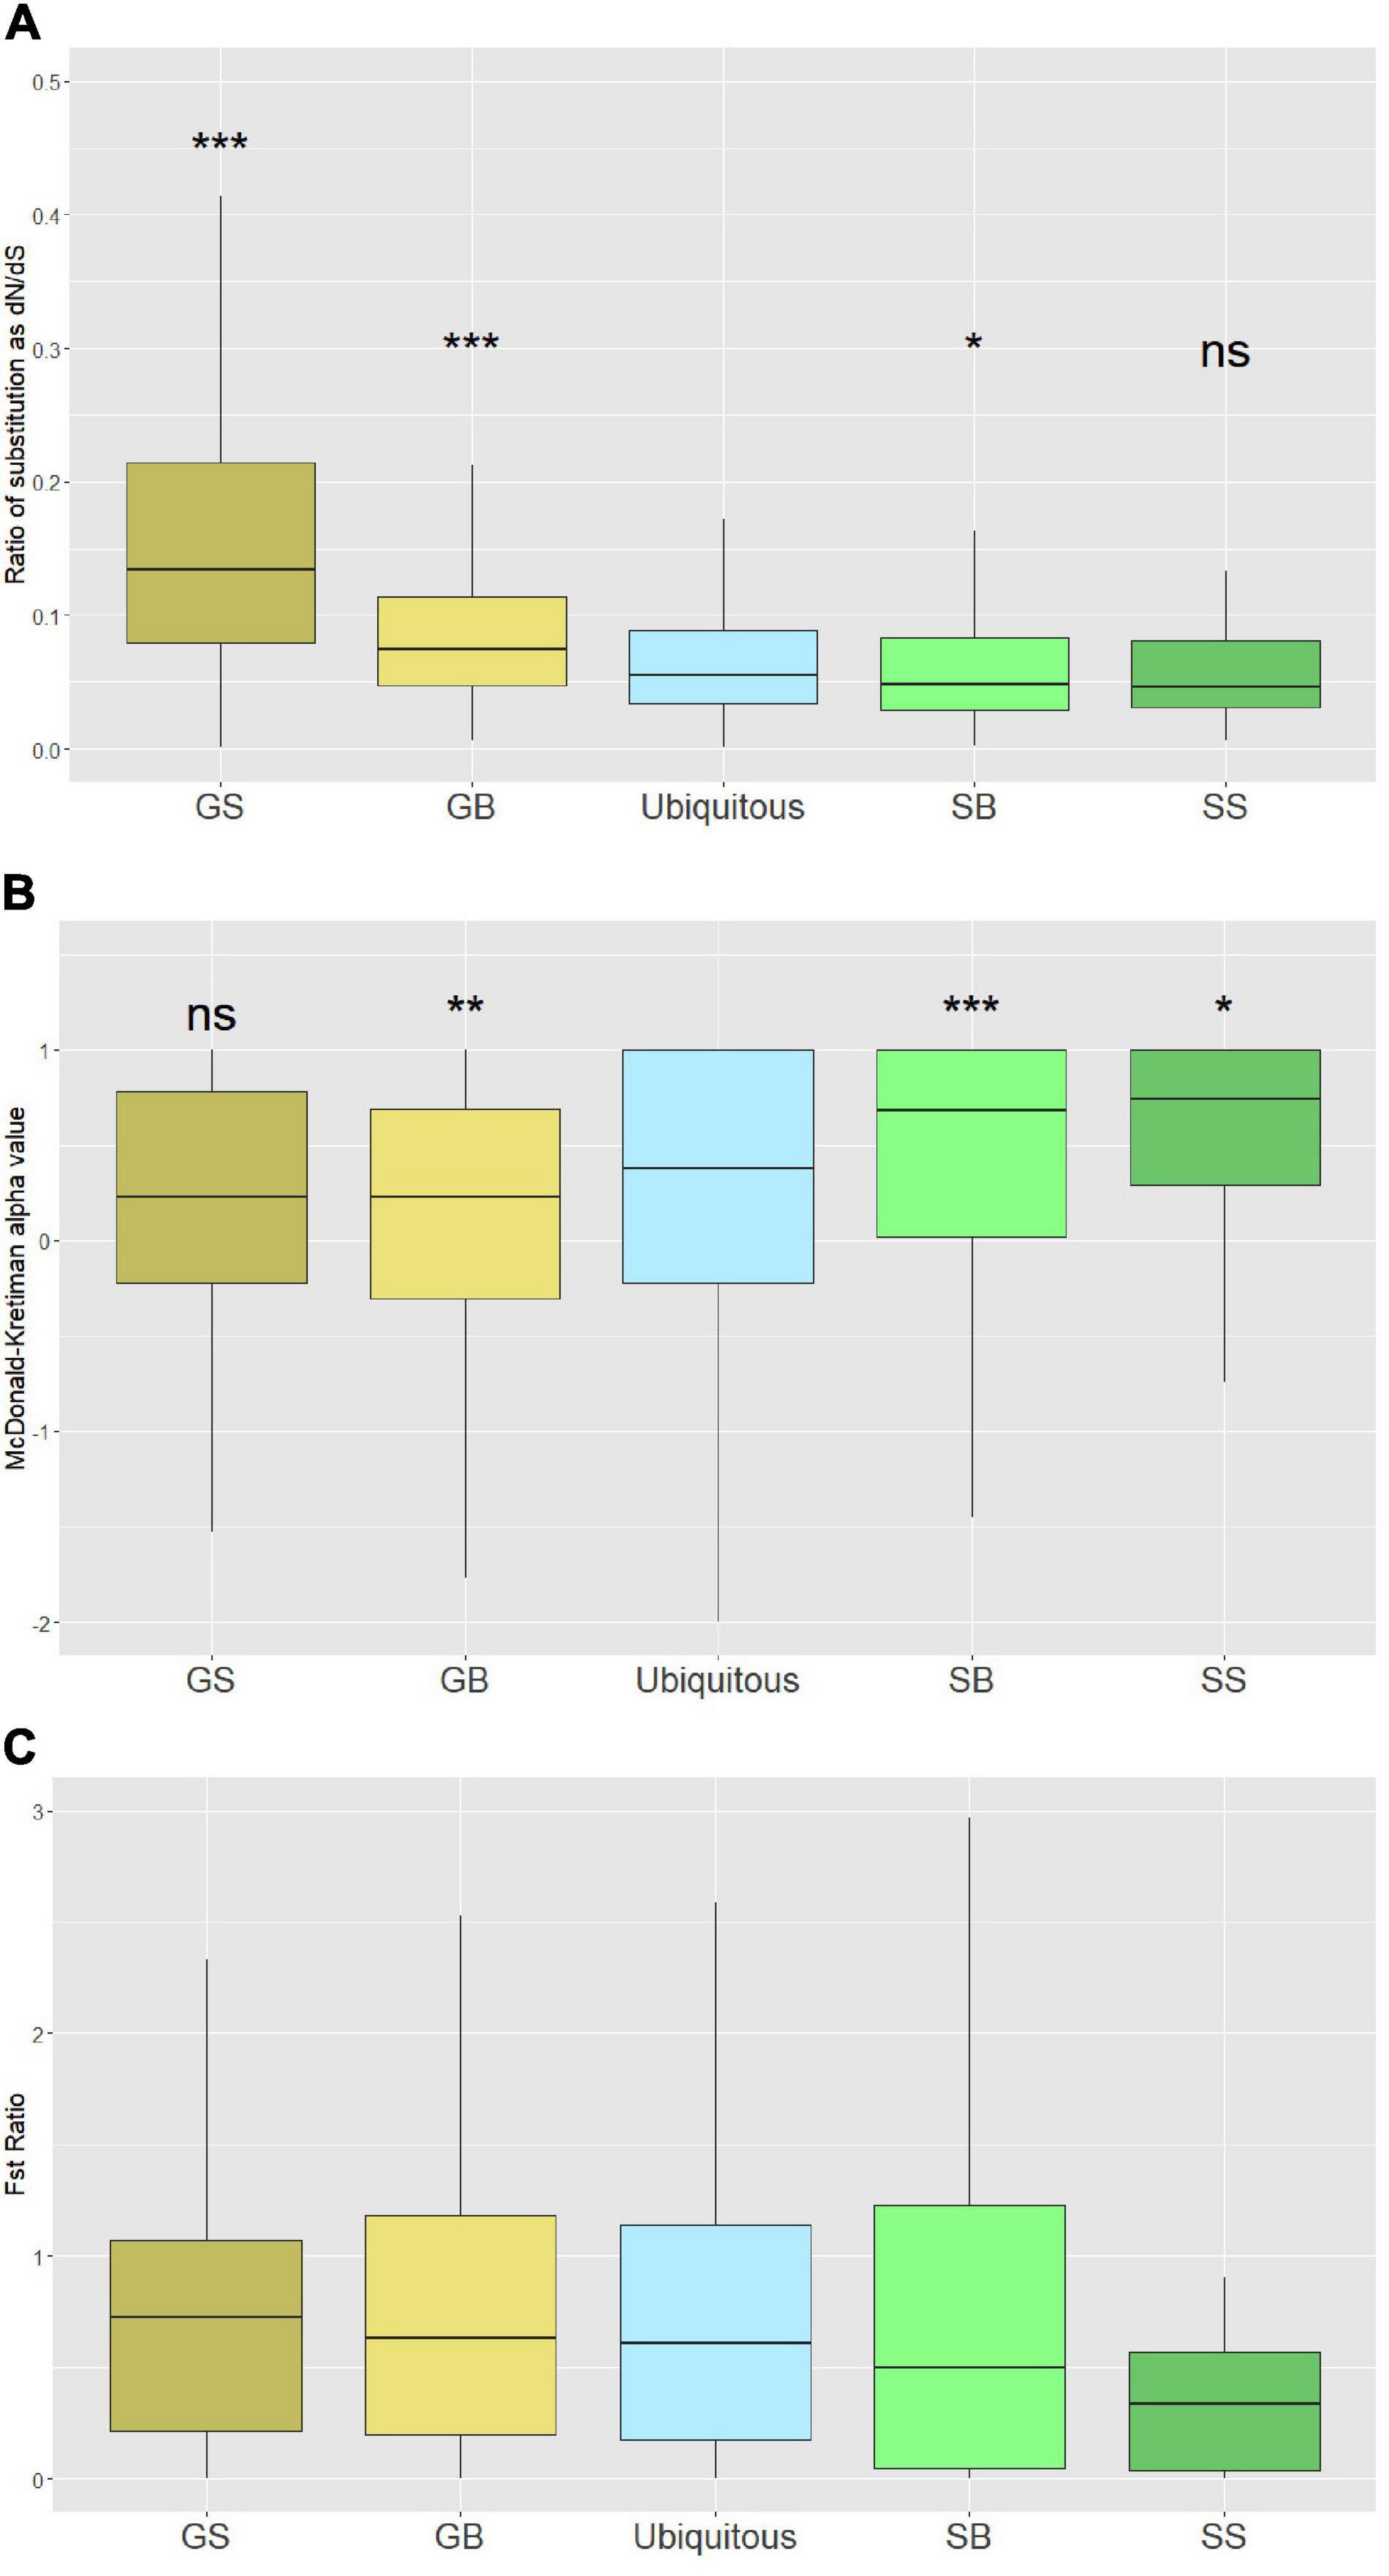
Figure 4. Measurements of sequence evolution and positive selection: (A) Rate of sequence evolution measured by dN/dS between Macrocystis pyrifera and Ectocarpus siliculosus coding regions for each category of gene expression. (B) Proportion of substitutions that were the result of positive selection measured as alpha in a McDonald–Kreitman test. Negative alpha values can be the result of slightly deleterious mutations segregating. (C) Ratio of 1st and 2nd FST to 3rd FST indicating purifying selection on sporophyte-specific genes. GB, gametophyte-biased; GS, gametophyte specific; SB, sporophyte-based; SS, sporophyte specific. (pairwise Wilcoxon test; ***p-value < 0.001; **p-value < 0.01; *p-value < 0.05).
After calculating the sequence evolution rate in M. pyrifera gene models across different life stages, we used the McDonald-Kreitman test (MKT) to investigate if the substitutions and segregating variants were nearly neutral or adaptive. To implement MKT, we used M. pyrifera population polymorphism data and substitution data between M. pyrifera and E. siliculosus to estimate alpha, the proportion of substitutions, driven by positive selection for each gene model (McDonald and Kreitman, 1991). A higher alpha value signifies more adaptive evolution. When compared with ubiquitously expressed genes, sporophyte-specific genes and sporophyte-biased genes had significantly higher alpha (p = 0.014 and p = 7.2e-5, respectively). Gametophyte-specific genes, despite a higher rate of sequence evolution (higher dN/dS), showed the lowest alpha values (Figure 4B). Alpha values for ubiquitous genes was significantly different from gametophyte-biased genes (p = 0.014), but not from gametophyte-specific genes (p = 0.78). The low alpha values for gametophyte genes suggest that a large proportion of mutations affecting the gametophyte stage have experienced nearly neutral evolution compared to the sporophyte stage.
The negative Tajima’s D values across the different life stages of M. pyrifera points to either population expansion or strong selection due to the higher number of rare alleles in the population against the neutral theory expectation. To help determine the genetic patterns responsible for the negative Tajima’s D values, we calculated the fixation index (FST) for the first two nucleotides (non-degenerate) of each codon separately from the third (degenerate) from coding sequences of our gene models. Our expectation was that genes experiencing purifying selection would have a lower FST for the first two nucleotides of a codon compared with the third nucleotide. We calculated the ratio of FST of degenerate to non-degenerate nucleotides. We found that while gametophyte and ubiquitous genes tend to have a similar ratio of degenerate to non-degenerate nucleotides, sporophyte-specific genes tend to have a comparatively lower ratio (Figure 4C). The higher ratio of degenerate to non-degenerate nucleotides for standing variation points to less adaptive evolution among divergent giant kelp populations in gametophyte genes.
To identity trends in gene ontology between the different life stages in M. pyrifera, we annotated the gene model data set and tested for enrichment of GO slims for biased and specific genes when compared to the whole set of genes (Supplementary Master Table). We then visualized the five most enriched terms of each category (Figure 5).
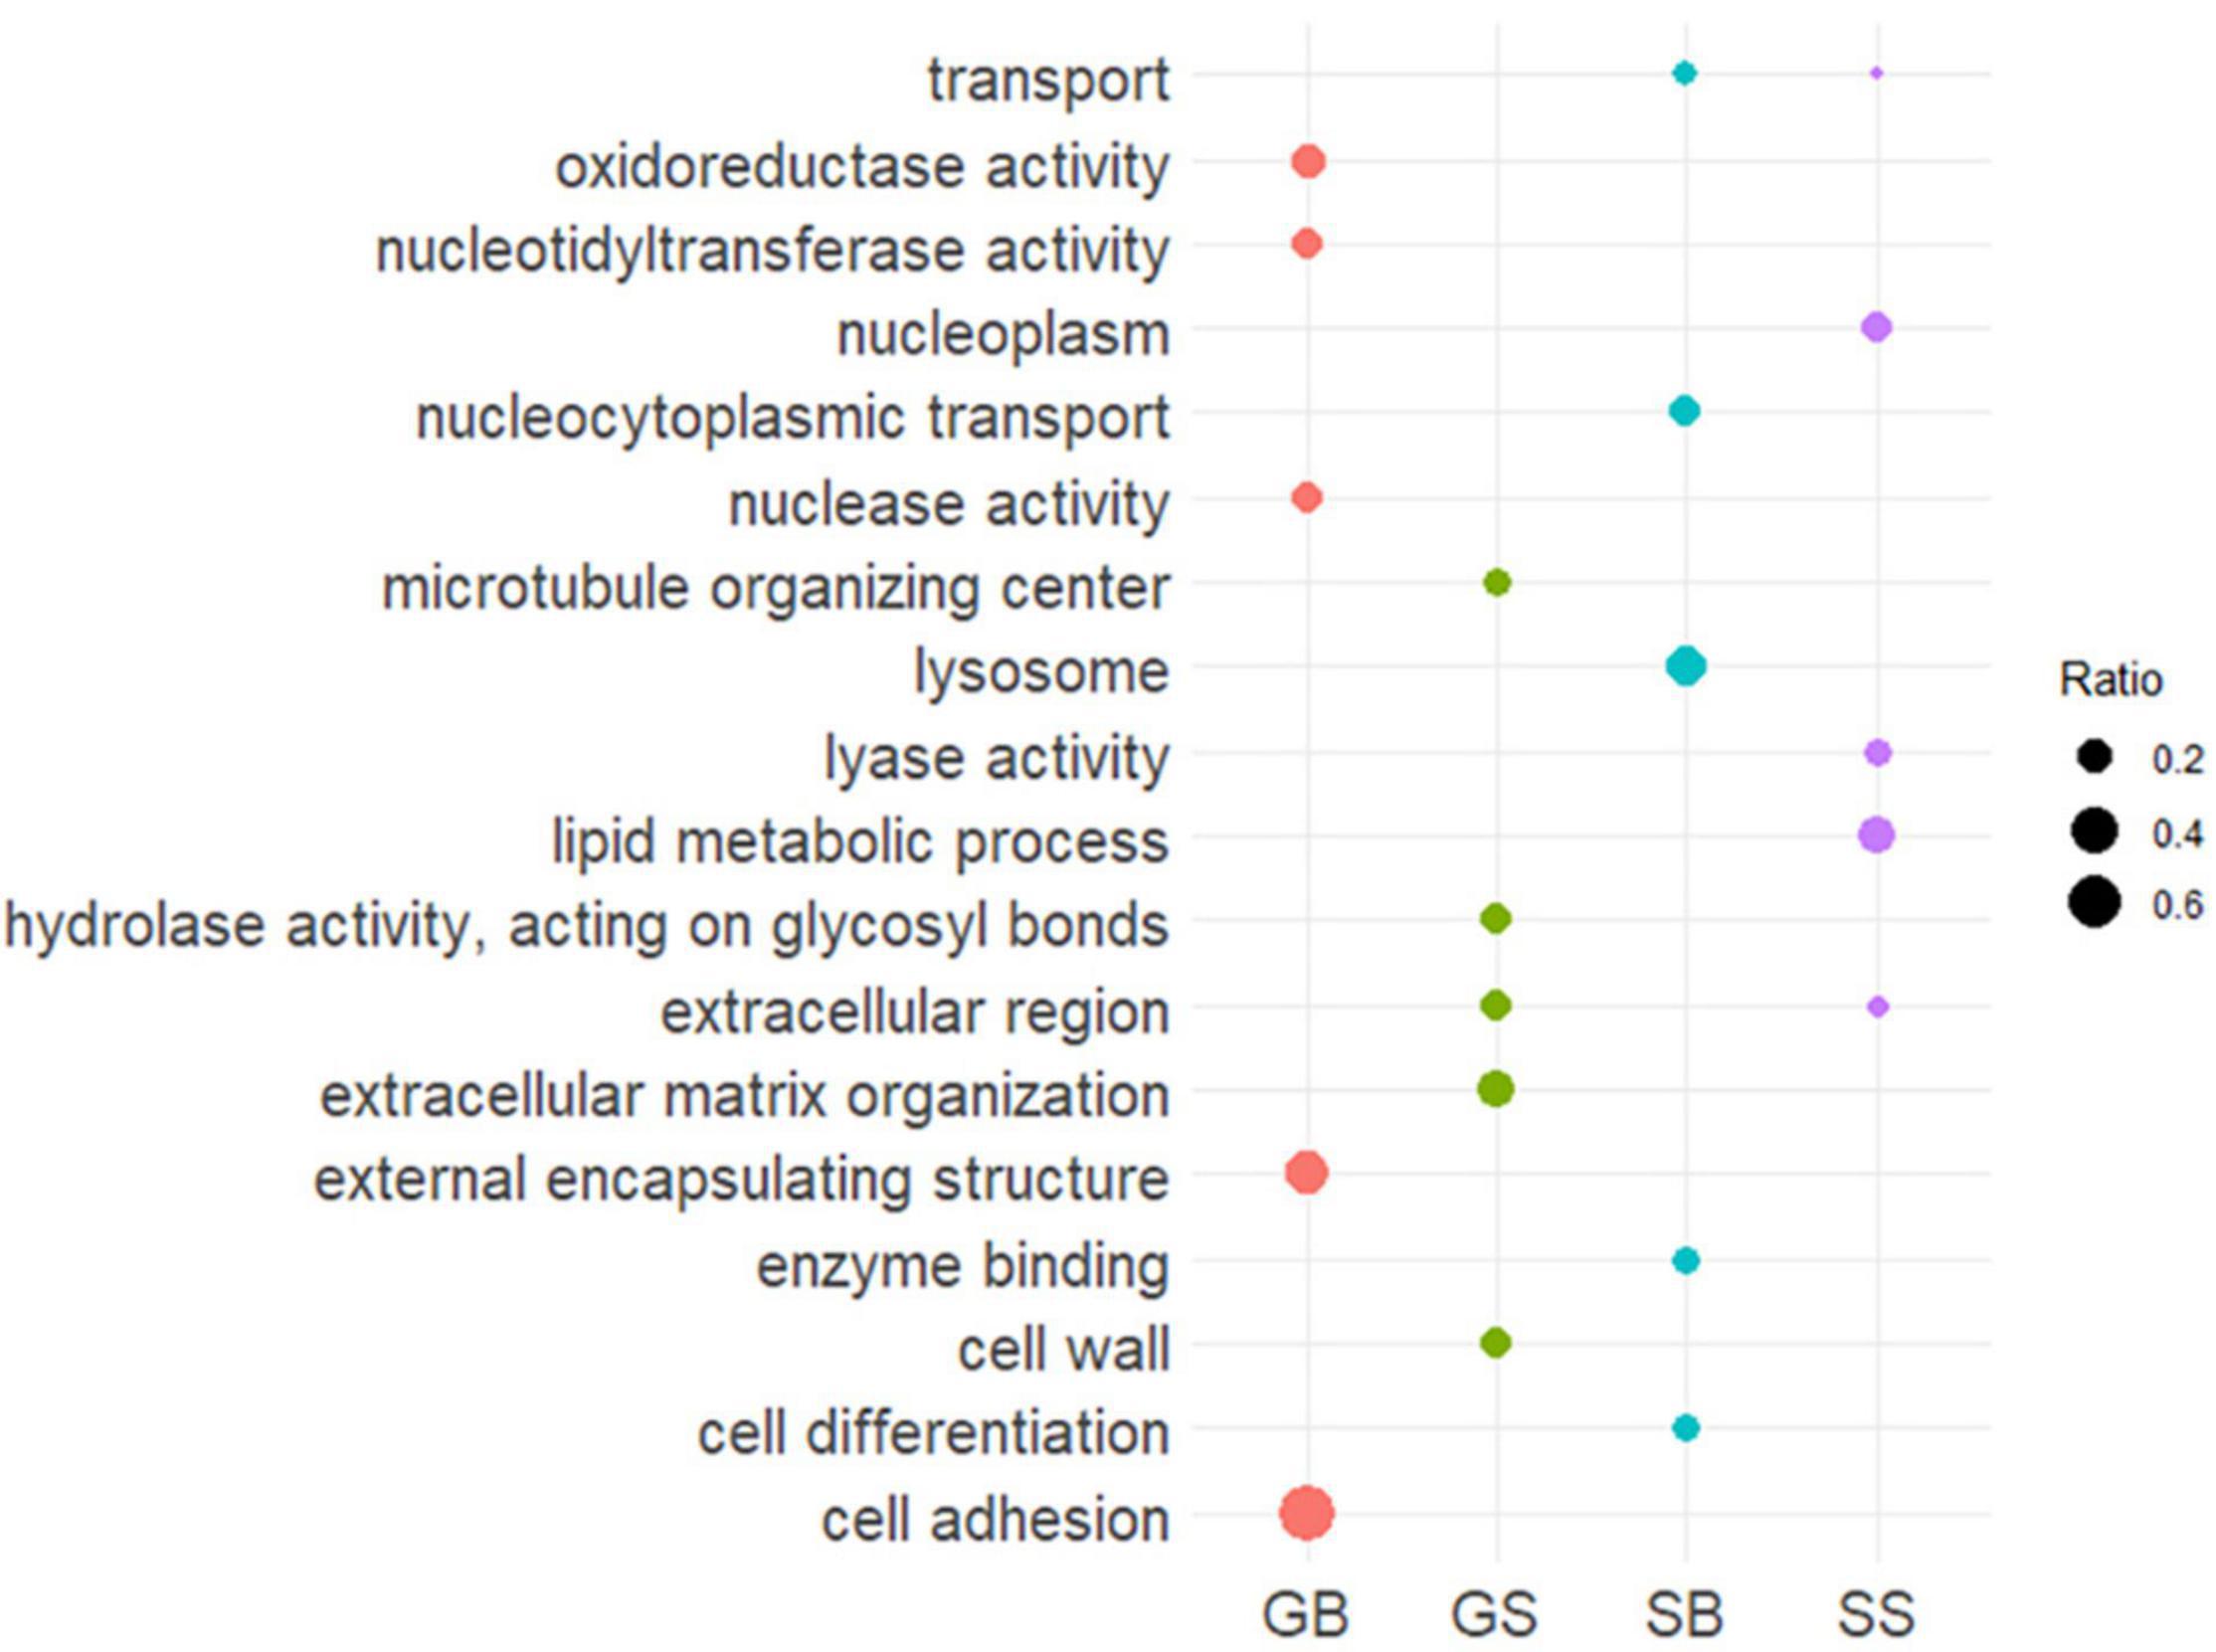
Figure 5. Screen for biological process enrichment: first five most enriched processes for both biased and specific genes (GOseq p < 0.05 with Wallenius correction for multiple testing). Size of the circle correspond to the ratio of terms associated with a GO slim in that category of gene expression relative to all terms in that Slim.
Almost 70% of GO terms associated with cell adhesion were found to be gametophyte-biased. The enrichment for cell adhesion genes in the gametophyte stage of giant kelp hints at the complex and essential process of anchoring to substrates in the ocean. There was also an enrichment of terms related to external encapsulating structures, with gametophyte biased genes containing more than 30% of the GO terms. The study of this subset of genes can provide insights into the strategies used by microscopic gametophytes to survive in a harsh oceanic environment. For sporophyte genes, we found transport to be enriched, in both biased and specific categories, and cell differentiation terms to be enriched in the sporophyte biased category. Both of these comprise a set of genes potentially used to achieve giant kelp’s sporophyte large size and complexity compared with its gametophyte stage.
Our study combined whole-genome sequencing of three giant kelp populations with previously established brown macroalgal genetic resources to understand selection on different life stages of giant kelp (Salavarría et al., 2018; Lipinska et al., 2019). Our findings concur with previous studies of life stage-specific selection in giant kelp in which haploid expressed genes had faster sequence evolution when compared with ubiquitously expressed genes or sporophyte specific genes (Lipinska et al., 2019). We established that the higher levels of variation in the gametophyte stage were under weaker selection constrains as compared to sporophyte stage. Our findings directly refute the masking hypothesis expectation that the higher sequence evolution (dN/dS) in the haploid gametophyte stage would lead to less nucleotide diversity in the haploid stage. Our findings suggest that gene strength of expression in M. pyrifera was a major factor for sequence evolution, as genes expressed in the sporophyte stage had higher levels of average expression and showed more adaptive evolution than genes expressed ubiquitously or in the gametophyte stage. Other haplodiplontic organisms have shown a similar pattern of gene evolutionary rates across different life stages (Szövényi et al., 2013).
The surplus of rare alleles found in M. pyrifera may signify population expansion or selection sweeps. The decreased genetic diversity and higher proportion of mutations under adaptive selection (alpha values) of sporophyte and ubiquitous genes suggest recent selection sweeps, while the increased genetic diversity and lower alpha values in the gametophyte stage suggest relaxed selection. While some of these observations might appear discordant, a closer examination of the life history of giant kelp provides some possible explanations. Patterns of high levels of genetic diversity and genetic load are common in marine broadcast spawners characterized by high juvenile mortality (Alberto et al., 2010; Johansson et al., 2015; Plough, 2016). Giant kelp is a fecund macroalgae that releases billions of haploid spores into the water column before they settle onto the ocean floor (Dayton, 1985; Reed et al., 1996). However, the successful recruitment of giant kelp depends on spore settlement density (settled spores must be less than 1 mm apart for successful fertilization) and abiotic factors, such as light, substrate, nutrients, and water motion (Dayton, 1985; Reed, 1990). Additionally, giant kelp spores have a relatively short dispersal distance that increases with water speed, and is dependent on location within a kelp bed; spores on the edges of kelp beds are dispersed much further and have a lower recruitment rate than spores found in the interior of kelp beds (Graham, 2003). Gaylord et al. (2004) estimated 50% of spores dispersed within 100 meters with little current (2 cm s–1) while 50% of spores dispersed more than 1 km with fast currents (10–50 cm s–1). The maximum lifespan for gametophytes in the ocean is predicted to be 1–7 months, while the average lifespan for a sporophyte is 4 years (North, 1978; Carney, 2011; Carney et al., 2013). Previous work identified environmental stochasticity as the main driver for extinctions and recolonizations in Southern California (Reed et al., 2006; Castorani et al., 2015). Definitive answers on how selection and demographic forces shape macroalgal genetic variation await experimental data on mutation rates and effective population sizes for kelp populations.
While genes across all life stages had negative Tajima’s D values in M. pyrifera, we reason that genetic diversity and adaptive mutation differences between life stages occur because natural selection is operating differently and separately on the gametophyte stage and the sporophyte stage. r/k selection is an ecological theory that puts attention to either optimizing reproduction rate or exploitation of carrying capacity (MacArthur and Wilson, 1967; Pianka, 1970). In general, K selection occurs when a stable ecosystem leads to more investment in the quality over quantity of progeny, while r selection occurs in an unstable ecosystem with investments in quantity of progeny over quality (Cassill, 2019). r refers to the maximum population growth rate [r-max] and favors productivity, and is characterized by random elimination, while K refers to the carrying capacity and favors efficiency) (Pianka, 1970). We would like to examine the lifespan, genetic diversity, and adaptive mutation rates between the distinct free-floating haploid gametophyte and anchored diploid sporophyte life stages in giant kelp through the framework of r/k selection. In giant kelp, the gametophyte stage favors high fecundity and rapid development (“r-selection”), while the sporophyte stage has slower development, lower fecundity, and more investment into competitive ability (“K-selection”). Gametophytes show other signatures of “r-selection,” such as rapid development, small body size, short lifespan, high mortality, and single reproduction. Sporophytes show signatures of “K-selection,” such as slower development, larger body size, multiple reproductions, longer lifespan, and lower mortality. However, r/K selection theory simplifies the reproduction dynamics taking place within a giant kelp forest, as alternative strategies, such as selfing and parthogenesis, may affect the genetic diversity and adaptive mutation rates for the gametophyte and sporophyte life stage (Camus et al., 2021). Further complications arise due to varying levels of oogonia present in female gametophytes, which can be fertilized by more than one male gametophyte (but can produce a single sporophyte) (Buschmann et al., 2020). Therefore, additional studies addressing the rates of the various reproductive strategies and potential plastic response to environmental conditions in a giant kelp forests are needed to further explore the r/K theory in giant kelp.
After performing Tajima’s D and MKT tests for each life stage and population, we found both purifying and positive selection acting on sporophyte-specific genes. We also found that minor alleles at gametophyte stage were nearly neutral and not adaptive. We reason that giant kelp is undergoing greater selection pressure during its sporophyte stage, where it spends a much greater fraction of its lifetime. We hypothesize that spores, released in large numbers, might potentially have a sizable number of new mutations, but once the spores have settled and reproduced, the resulting sporophytes undergo heavy selection. Genes that are expressed ubiquitously show intermediate values for π and MKT, as well as for average total expression, which suggests that these ubiquitously expressed genes are being exposed to both the relaxed selection of the gametophyte stage and the increased selection of the sporophyte stage.
This study has set the stage for future work with giant kelp that will greatly benefit both conservation and domestication efforts by establishing important population genetic parameters such pairwise genetic diversity, Tajima’s D, and dN/dS using gene models. We confirmed that genetic variation of giant kelp in Southern California is characterized by strong regional population structure. Our current analysis is conservative as it focuses on orthologs between two brown macroalgal species. Our gene models of giant kelp are biased in terms of quantity per life stage as E. siliculosus is a simpler, isomorphic brown macroalgae compared with the larger, more complex diploid dominant giant kelp. These analyses can be improved in the future when using a reference genome for giant kelp, instead of a set of highly conserved gene models. These analyses would be further improved by increasing the individual sample size and number of populations included for both RNA-seq and whole genome sequencing projects. These analyses can also be extended to other organisms with biphasic life cycles, or those with multiple life stages that experience differing amounts of selection on each life stage.
We collected kelp blades from 50 distinct individuals from three distinct locations in Southern California (17 from Catalina Island, 16 from Santa Barbara, and 17 from Camp Pendleton) in the summer of 2018 (Supplementary Table 3). To limit epiphyte contamination in DNA extraction, we treated the blades axenically as described by the Singh method (Singh et al., 2011) before drying the tissue in silica beads. Due to high levels of contamination by polysaccharides and polyphenols, we had to perform a combination of DNA extraction methods. We first placed 10 mg of dried tissue in a Qiagen Powerbead Tubes with metal 2.38 mm beads and homogenized them using a Qiagen TissueLyser for 60 s at 30 Hz. From the powdered tissue, we extracted DNA using the Macherey-Nagel Nucleospin Plant II kit along with the CTAB lysis buffer. Slight modifications were made to the protocol based on other successful DNA sequencing projects involving brown macroalgae (Guzinski et al., 2018). We further cleaned the extracted DNA using the Qiagen DNeasy Power Clean Pro Cleanup Kit.
To ensure the quality of the extracted and cleaned DNA, we checked for contaminants using the 260/230 nm and 260/280 nm wavelength ratios from a Nano-drop spectrophotometer. We then checked the concentration of the samples using a Qubit fluorometer. To check for fragment size and contamination, we ran the DNA on a 1% agarose gel, looking specifically for samples with a distinct band and no smearing. We then confirmed that the DNA could be amplified successfully with PCR, using primers for the giant kelp genes IF2A and 18S to ensure that there was no PCR inhibition (Konotchick et al., 2013).
Once we had DNA of sufficient quality, we prepared libraries using the KAPA HyperPlus Kit and standard protocols, except we increased the fragmentase reaction time to 1 h. Libraries were then size selected for an insert size ∼300 bp using Kapa Pure Beads. We again quantified our libraries with Qubit and checked fragment size with a bioanalyzer. Once the libraries passed initial quality tests, they were sent to Novagene in Davis, California and sequenced on an Illumina Hiseq 2500 platform with 150 paired end reads. To remove adapter sequences and trim low-quality trails of the raw sequencing data, we used Trimgalore (Krueger, 2015). We removed individuals with poor sequencing coverage, leaving 48 individuals in the final data set.
We assembled transcripts with TRINITY using publicly available RNA sequences from both sporophyte and gametophyte samples (Grabherr et al., 2011; Salavarría et al., 2018; Lipinska et al., 2019). We merged six gametophyte and two sporophyte samples during assembly to generate a transcriptome for giant kelp. We removed adapters and trimmed sequences with Phred score lower than 25 and length less than 50 nucleotides with Trimgalore (Krueger, 2015). We then checked the sequences with FastQC (Andrews, 2010). We removed contaminants using Deconseq (Schmieder and Edwards, 2011) and collapsed the final transcriptome using CAP3 (Huang and Madan, 1999). We removed redundancies by clustering transcripts over 500 nucleotides long that blasted with 99% similarity, and selected the longest transcript in each cluster to keep for analysis using a custom python script (Camacho et al., 2009; Supplementary File 4). We performed a best reciprocal BLAST against the genome of E. siliculosus, considered to be the model brown macroalgae, to select high confidence gene models as suggested in previous studies, resulting in 9,934 gene models (Tatusov et al., 1997; Bork et al., 1998; Moreno-Hagelsieb and Latimer, 2008; Cock et al., 2010; Supplementary File 5). To further remove contaminants from our gene models, we used Diamond to blast our gene models against the Uniprot database and used BlobTools to visualize our results (Buchfink et al., 2015; Challis et al., 2020; UniProt Consortium, 2021; Supplementary Figure 2). We kept gene models in our analysis if they classified to as Phaeophycea or non-hit, and filtered the resulting gene models based on GC content keeping only the ones between 0.35 and 0.65. Furthermore, we aligned our population reads to the resulting gene models and removed instances where average coverage would be lower than 2 and higher than 30. After all filtering and quality checking applied, we kept 8,292 gene models to be used in our analysis (Supplementary Figure 3).
We then annotated these gene models using Trinotate using standard settings (Bryant et al., 2017). We used GOSlimViewer to summarize our data by binning the gene ontology results from Trinotate into a generic GO Slim set then used GOseq to test for gene ontology enrichment of both biased and specific gene categories using ubiquitous genes as base (McCarthy et al., 2006; Young et al., 2010). We considered enriched terms with p-values smaller than 0.05, then we calculated the proportion of terms associated with that gene category.
We analyzed the initial transcriptome contig assembly, the collapsed contigs, and the reciprocally blasted gene models, and the reference E. siliculosus genome for genome completeness using BUSCO v4.06 and the eukaryote_odb10 database with default parameters (Seppey et al., 2019). The transcriptome assemblies and gene models were analyzed using the –transcriptome option, while the E. siliculosus genome was analyzed using the—genome option.
We used RSEM to estimate the expression levels of each gene model. RSEM implements Bowtie2 to align RNA-seq data, and so we aligned the same publicly available RNA data used for gene model assembly to our 8,292 gene models (Langmead, 2010; Li and Dewey, 2011; BR93 Supplementary File 6). After alignment, RSEM generates a transcript abundance quantifier table. We then imported the transcript counts table directly into DEseq2 in order to calculate differential expression based on life stage (Love et al., 2014). We set the log2 fold change threshold as one and false discovery rate at 0.05 for DEseq2. In order to quantify our differential expression, we normalized counts using transcripts per million (TPM), which allows for direct comparison of reads mapped to a gene model between samples. Gene models were considered specific to a particular life stage when they had a twofold change or higher difference in expression and specific when the average TPM was below the fifth percentile on the opposite life stage.
We aligned Illumina WGS sequences from 48 individuals from three wild populations to the collapsed, reciprocal blasted gene model data set using Hisat2 version 2.1.0 using standard parameters (Kim et al., 2019). Two individuals were removed from the analysis due to low coverage. Using samtools v1.9 (Li et al., 2009), we converted the alignment to a binary file, sorted and removed PCR duplicates. Using GATK4 best practices pipeline pipeline (Van der Auwera et al., 2013), we called variants such as single nucleotide polymorphisms (SNPs) and insertion/deletions, producing a variant call file (VCF). We then combined the individual VCFs and hard filtered the file to keep bi-allelic SNPs with singletons removed using VCFtools v0.1.16 with the following parameters: SNPs sequenced in 95% of individuals, and sites had to have a minimum mean read depth of 5 reads and a maximum read depth of 30 reads (Danecek et al., 2011).
We then used VCFtools to calculate the pairwise genetic diversity for each gene model using the—window-pi function. We set the window for the pairwise genetic diversity calculation to be the length of the gene model to ensure that the diversity for each gene model was calculated separately.
In order to identify population specific SNPs, we split the filtered VCF file by population and filtered it as described above. We also set the minor allele frequency threshold to 1 to ensure that all sites kept represented an actual SNP specific to that population, and increased the minor allele frequency to 0.05, to remove singletons from this analysis. We then extracted the SNP IDs from each population specific VCF file, and plotted the resulting Venn diagram using the R package VennDiagram (Chen and Boutros, 2011).
We calculated Hs for each population and Ht for all populations using the R packages adgenet and vcfR. The filtered VCF file was loaded into R using vcfR (Knaus and Grünwald, 2017). The vcf file was then converted into a genlight object, and the population information for each sample was added to the genlight object using adegenet (Jombart, 2008). We then calculated the Nei’s genetic distance using the command genetic_diff (method = “nei”) in vcfR for each SNP in the VCF file, and tabulated values for each subpopulation and the total population.
To look for genetic structure and measure population differentiation we calculated the fixation index using VCFtools. We differentiated between identified SNPs in coding regions and separated them into two VCF files—one containing SNPs for both first and second bases of codons and another containing only the third—using a custom script. This information was used to calculate the ratio between degenerate to non-degenerate SNPs (Supplementary File 7). Negative FST values were treated as zero.
To quantify the ratio of substitution rates at non-synonymous and synonymous sites, we aligned the protein sequences from our genes models to their best Ectocarpus siliculosus blast pair using Clustal (Madeira et al., 2019). We used Pal2nal to generate corresponding codon alignments between those and dN/dS was calculated using codeml from PAML (Suyama et al., 2006; Yang, 2007). We filtered out SNPs when the dN or dS value was above two. We used VCFtools to calculate Tajima’s D separately for each entire gene model.
With Ectocarpus siliculosus as the outgroup, we implemented the MKT test and calculated derived allele frequency and divergence using our polymorphism data. Those measurements were done per each gene model, then processed through the iMKT R package (Murga-Moreno et al., 2019) to produce the respective alpha values for each gene—alpha being the proportion of substitution derived by positive selection.
The datasets presented in this study can be found in online repositories. The names of the repository/repositories and accession number(s) can be found below: https://www.ncbi.nlm.nih.gov/bioproject/PRJNA661280.
GM co-wrote the manuscript, performed analyses, extracted DNA, and prepared libraries. JD co-wrote the manuscript, performed analyses, and assembled the transcriptome. GJM processed samples for axenic treatment, optimized the DNA extraction, and edited the manuscript. FA conceptualized the experiment, acquired funding for the experiment, and edited the manuscript. SN conceptualized the experiment, supervised the experiment, acquired funding for the experiment, and edited the manuscript. All authors contributed to the article and approved the submitted version.
This work was supported by the Macroalgae Research Inspiring Novel Energy Resources at the Advanced Research Projects Agency—Energy at the Department of Energy (DE-FOA-0001726-1513) and the Zumberge Foundation.
The authors declare that the research was conducted in the absence of any commercial or financial relationships that could be construed as a potential conflict of interest.
All claims expressed in this article are solely those of the authors and do not necessarily represent those of their affiliated organizations, or those of the publisher, the editors and the reviewers. Any product that may be evaluated in this article, or claim that may be made by its manufacturer, is not guaranteed or endorsed by the publisher.
We would like to give special thank to Dan Reed, Bob Miller, and Christie Yorke for sample collection, advice on giant kelp ecology, and for helpful comments. We would like to thank Peter Chang for advice on data analysis, Chuck Kopczak and Peter Raimondi for advice on giant kelp ecology, Diane Kim and Nate Churches for help with sample collection. We would also like to thank Kelly DeWeese, Melisa Osborne, and Anupam Singh for comments on the manuscript, and Cara Hull for initial contributions to the differential expression analysis. Additionally, we would like to thank Maurice Roper for providing photos of giant kelp.
The Supplementary Material for this article can be found online at: https://www.frontiersin.org/articles/10.3389/fmars.2021.774076/full#supplementary-material
Alberto, F., Raimondi, P. T., Reed, D. C., Coelho, N. C., Leblois, R., Whitmer, A., et al. (2010). Habitat continuity and geographic distance predict population genetic differentiation in giant kelp. Ecology 91, 49–56. doi: 10.1890/09-0050.1
Andrews, S. (2010). FastQC: A Quality Control Tool for High throughput Sequence Data. Available online at: http://www.bioinformatics.babraham.ac.uk/projects/fastqc (acessed January 12, 2019).
Arioli, T., Mattner, S. W., and Winberg, P. C. (2015). Applications of seaweed extracts in Australian agriculture: past, present and future. J. Appl. Phycol. 27, 2007–2015. doi: 10.1007/s10811-015-0574-9
Bell, G. (1994). The comparative biology of the alternation of generations. Lect. Math. Life Sci. 25, 1–26.
Bork, P., Dandekar, T., Diaz-Lazcoz, Y., Eisenhaber, F., Huynen, M., and Yuan, Y. (1998). Predicting function: from genes to genomes and back. J. Mol. Biol. 283, 707–725. doi: 10.1006/jmbi.1998.2144
Breton, T. S., Nettleton, J. C., O’Connell, B., and Bertocci, M. (2018). Fine-scale population genetic structure of sugar kelp, Saccharina latissima (Laminariales, Phaeophyceae), in eastern Maine, USA. Phycologia 57, 32–40. doi: 10.2216/17-72.1
Bryant, D. M., Johnson, K., DiTommaso, T., Tickle, T., Couger, M. B., Payzin-Dogru, D., et al. (2017). A tissue-mapped axolotl De Novo transcriptome enables identification of limb regeneration factors. Cell Rep. 18, 762–776. doi: 10.1016/j.celrep.2016.12.063
Buchfink, B., Xie, C., and Huson, D. H. (2015). Fast and sensitive protein alignment using DIAMOND. Nat. Methods 12, 59–60. doi: 10.1038/nmeth.3176
Buschmann, A. H., Camus, C., Infante, J., Neori, A., Israel, Á, Hernández-González, M. C., et al. (2017). Seaweed production: overview of the global state of exploitation, farming, and emerging research activity. J. Phycol. 52, 391–406. doi: 10.1080/09670262.2017.1365175
Buschmann, A. H., Villegas, K., Pereda, S. V., Camus, C., Kappes, J. L., Altamirano, R., et al. (2020). Enhancing yield on Macrocystis pyrifera (Ochrophyta): the effect of gametophytic developmental strategy. Algal Res. 52:102124. doi: 10.1016/j.algal.2020.102124
Camacho, C., Coulouris, G., Avagyan, V., Ma, N., Papadopoulos, J., Bealer, K., et al. (2009). BLAST+: architecture and applications. BMC Bioinformatics 10:421. doi: 10.1186/1471-2105-10-421
Camus, C., Ballerino, P., Delgado, R., Olivera-Nappa, Á, Leyton, C., and Buschmann, A. H. (2016). Scaling up bioethanol production from the farmed brown macroalga Macrocystis pyrifera in Chile. Biofuels Bioprod. Bioref. 10, 673–685. doi: 10.1002/bbb.1708
Camus, C., Solas, M., Martiìnez, C., Vargas, J., Garces, C., Gil-Kodaka, P., et al. (2021). Mates matter: gametophyte kinship recognition and inbreeding in the giant kelp, Macrocystis pyrifera (Laminariales, Phaeophyceae). J. Phycol. 57, 711–725. doi: 10.1111/jpy.13146
Carney, L. T. (2011). A multispecies laboratory assessment of rapid sporophyte recruitment from delated kelp gametophytes. J. Phycol. 47, 244–251. doi: 10.1111/j.1529-8817.2011.00957.x
Carney, L. T., Bohonak, A. J., Edwards, M. S., and Alberto, F. (2013). Genetic and experimental evidence for a mixed age and mixed origin bank of microscopic stages in a southern California kelp forest. Ecology 94, 1955–1965. doi: 10.1890/13-0250.1
Cassill, D. L. (2019). Extending r/K selection with a maternal risk-management model that classifies animal species into divergent natural selection categories. Sci. Rep. 9:6111. doi: 10.1038/s41598-019-42562-7
Castorani, M. C., Reed, D. C., Alberto, F., Bell, T. W., Simons, R. D., Cavanaugh, K. C., et al. (2015). Connectivity structures local population dynamics: a long-term empirical test in a large metapopulation system. Ecology 96, 3141–3152. doi: 10.1890/15-0283.1
Challis, R., Richards, E., Rajan, J., Cochrane, G., and Blaxter, M. (2020). BlobToolKit – Interactive quality assessment of genome assemblies. G3 10, 1361–1374. doi: 10.1534/g3.119.400908
Chen, H., and Boutros, P. C. (2011). VennDiagram: a package for the generation of highly-customizable Venn and Euler diagrams in R. BMC Bioinformatics 12:35. doi: 10.1186/1471-2105-12-35
Chopin, T., and Tacon, A. G. T. (2021). Importance of seaweeds and extractive species in global aquaculture production. Rev. Fish. Sci. Aquacult. 29, 139–148. doi: 10.1080/23308249.2020.1810626
Cock, J. M., Sterck, L., Rouzé, P., Scornet, D., Allen, A. E., Amoutzias, G., et al. (2010). The Ectocarpus genome and the independent evolution of multicellularity in brown algae. Nature 465, 617–621. doi: 10.1038/nature09016
Coyer, J. A., Smith, G. J., and Andersen, R. A. (2001). Evolution of Macrocystis spp. (Phaeophyceae) as determined by ITS1 and ITS2 sequences. J. Phycol. 37, 574–585. doi: 10.1046/j.1529-8817.2001.037001574.x
Crow, J. F., and Kimura, M. (1965). Evolution in sexual and asexual populations. Am. Nat. 99, 439–450. doi: 10.1086/282389
Crow, J. F., and Simmons, M. J. (1983). “The mutation load in Drosophila,” in The Genetics and Biology of Drosophila, eds M. Ashburner, H. L. Carson, and J. N. Thompson (London: Academic Press), 1–35. doi: 10.1007/978-3-319-23534-9_1
Danecek, P., Auton, A., Abecasis, G., Albers, C. A., Banks, E., DePristo, M. A., et al. (2011). The variant call format and VCFtools. Bioinformatics 27, 2156–2158. doi: 10.1093/bioinformatics/btr330
Dayton, P. K. (1985). Ecology of kelp communities. Annu. Rev. Ecol. Syst. 16, 215–245. doi: 10.1146/annurev.es.16.110185.001243
Drummond, D. A., Raval, A., and Wilke, C. O. (2006). A single determinant dominates the rate of yeast protein evolution. Mol. Biol. Evol. 23, 327–337. doi: 10.1093/molbev/msj038
Gaylord, B., Reed, D. C., Washburn, L., and Raimondi, P. T. (2004). Physical–biological coupling in spore dispersal of kelp forest macroalgae. J. Mar. Syst. 49, 19–39. doi: 10.1016/j.jmarsys.2003.05.003
Goecke, F., Klemetsdal, G., and Ergon, Å (2020). Cultivar development of kelps for commercial cultivation- past lessons and future prospects. Front. Mar. Sci. 8:110. doi: 10.3389/fmars.2020.00110
Grabherr, M. G., Haas, B. J., Yassour, M., Levin, J. Z., Thompson, D. A., Amit, I., et al. (2011). Full-length transcriptome assembly from RNA-Seq data without a reference genome. Nat. Biotechnol. 29, 644–652. doi: 10.1038/nbt.1883
Graham, M. H. (2003). Coupling propagule output to supply at the edge and interior of a giant kelp forest. Ecology 84, 1250–1264. doi: 10.1890/0012-9658(2003)084[1250:cpotsa]2.0.co;2
Graham, M. H., Vásquez, J., and Buschmann, A. H. (2007). Global ecology of the giant kelp Macrocystis: from ecotypes to ecosystems. Oceanogr. Mar. Biol. Annu. Rev. 45, 39–88. doi: 10.1201/9781420050943.ch2
Grebe, G. S., Byron, C. J., Gelais, A. S., Kotowicz, D. M., and Olson, T. K. (2019). An ecosystem approach to kelp aquaculture in the Americas and Europe. Aquacult. Rep. 15:100215. doi: 10.1016/j.aqrep.2019.100215
Guzinski, J., Ballenghien, M., Daguin-Thiébaut, C., Lévêque, L., and Viard, F. (2018). Population genomics of the introduced and cultivated Pacific kelp Undaria pinnatifida: marinas-not farms-drive regional connectivity and establishment in natural rocky reefs. Evol. Appl. 11, 1582–1597. doi: 10.1111/eva.12647
Hameury, S., Borderie, L., Monneuse, J. M., Skorski, G., and Pradines, D. (2019). Prediction of skin anti-aging clinical benefits of an association of ingredients from marine and maritime origins: ex vivo evaluation using a label-free quantitative proteomic and customized data processing approach. J. Cosmet. Dermatol. 18, 355–370. doi: 10.1111/jocd.12528
Hu, Z.-M., Shan, T.-F., Zhang, J., Zhang, Q.-S., Critchley, A. T., Choi, H.-G., et al. (2021). Kelp aquaculture in China: a retrospective and future prospects. Rev. Aquacult. 13, 1324–1351. doi: 10.1111/raq.12524
Huang, X., and Madan, A. (1999). CAP3: a DNA sequence assembly program. Genome Res. 9, 868–877. doi: 10.1101/gr.9.9.868
Hughes, J. S., and Otto, S. P. (1999). Ecology and the evolution of biphasic life cycles. Am. Nat. 154, 306–320. doi: 10.2307/2463653
Jenkins, C. D., and Kirkpatrick, M. (1995). Deleterious mutations and the evolution of genetic life cycles. Evolution 49, 512–520. doi: 10.2307/2410275
Johansson, M. L., Alberto, F., Reed, D. C., Raimondi, P. T., Coelho, N. C., Young, M. A., et al. (2015). Seascape drivers of Macrocystis pyrifera population genetic structure in the northeast Pacific. Mol. Ecol. 24, 4866–4885. doi: 10.1111/mec.13371
Jombart, T. (2008). adegenet: a R package for the multivariate analysis of genetic markers. Bioinformatics 24, 1403–1405. doi: 10.1093/bioinformatics/btn129
Kim, D., Paggi, J. M., Park, C., Bennett, C., and Salzberg, S. L. (2019). Graph-based genome alignment and genotyping with HISAT2 and HISAT-genotype. Nat. Biotechnol. 37, 907–915. doi: 10.1038/s41587-019-0201-4
Klinger, T. (1993). The persistence of haplodiploidy in algae. Trends Ecol. Evol. 8, 256–258. doi: 10.1016/0169-5347(93)90202-Z
Knaus, B. J., and Grünwald, N. J. (2017). Vcfr: a package to manipulate and visualize variant call format data in R. Mol. Ecol. Resour. 17, 44–53. doi: 10.1111/1755-0998.12549
Kondrashov, A. S., and Crow, J. F. (1991). Haploidy or diploidy: which is better? Nature 351, 314–315. doi: 10.1038/351314a0
Konotchick, T., Dupont, C. L., Valas, R. E., Badger, J. H., and Allen, A. E. (2013). Transcriptomic analysis of metabolic function in the giant kelp, Macrocystis pyrifera, across depth and season. New Phytol. 198, 398–407. doi: 10.1111/nph.12160
Kopczak, C. D., Zimmerman, R. C., and Kremer, J. N. (1991). Variation in nitrogen physiology and growth among geographically isolated populations of the giant kelp, Macrocystis pyrifera (Phaeophyta). J. Phycol. 27, 149–158. doi: 10.1111/j.0022-3646.1991.00149.x
Krueger, F. (2015). Trim Galore. A wrapper Tool Around Cutadapt and FastQC to Consistently Apply Quality and Adapter Trimming to FastQ Files. Available online at: https://www.bioinformatics.babraham.ac.uk/projects/trim_galore/ (acessed January 11, 2019).
Langmead, B. (2010). Aligning short sequencing reads with Bowtie. Curr. Protoc. Bioinformatics Chapter 11:Unit11.7.
Li, B., and Dewey, C. N. (2011). RSEM: accurate transcript quantification from RNA-Seq data with or without a reference genome. BMC Bioinformatics 12:323. doi: 10.1186/1471-2105-12-323
Li, H., Handsaker, B., Wysoker, A., Fennell, T., Ruan, J., Homer, N., et al. (2009). The Sequence Alignment/Map format and SAMtools. Bioinformatics 25, 2078–2079. doi: 10.1093/bioinformatics/btp352
Li, Y. C., Korol, A. B., Fahima, T., Beiles, A., and Nevo, E. (2002). Microsatellites: genomic distribution, putative functions and mutational mechanisms: a review. Mol. Ecol. 11, 2453–2465. doi: 10.1046/j.1365-294x.2002.01643.x
Lipinska, A. P., Serrano-Serrano, M. L., Cormier, A., Peters, A. F., Kogame, K., Cock, J. M., et al. (2019). Rapid turnover of life-cycle-related genes in the brown algae. Genome Biol. 20:35.
Loureiro, R., Gachon, C. M., and Rebours, C. (2015). Seaweed cultivation: potential and challenges of crop domestication at an unprecedented pace. New Phytol. 206, 489–492. doi: 10.1111/nph.13278
Love, M. I., Huber, W., and Anders, S. (2014). Moderated estimation of fold change and dispersion for RNA-seq data with DESeq2. Genome Biol. 15:550. doi: 10.1186/s13059-014-0550-8
MacArthur, R., and Wilson, E. O. (1967). The Theory of Island Biogeography, 2001 reprint Edn. Princeton, NJ: Princeton University Press.
Madeira, F., Park, Y. M., Lee, J., Buso, N., Gur, T., Madhusoodanan, N., et al. (2019). The EMBL-EBI search and sequence analysis tools APIs in 2019. Nucleic Acids Res. 47, W636–W641. doi: 10.1093/nar/gkz268
Makkar, H. P. S., Tran, G., Heuze, V., Giger-Reverdin, S., Lessire, M., Lebas, F., et al. (2016). Seaweeds for livestock diets: a review. Anim. Feed Sci. Technol. 212, 1–17. doi: 10.1016/j.anifeedsci.2015.09.018
McCarthy, F. M., Wang, N., Magee, G. B., Nanduri, B., Lawrence, M. L., Camon, E. B., et al. (2006). AgBase: a functional genomics resource for agriculture. BMC Genomics 7:229. doi: 10.1186/1471-2164-7-229
McDonald, J. H., and Kreitman, M. (1991). Adaptive protein evolution at the Adh locus in Drosophila. Nature 351, 652–654. doi: 10.1038/351652a0
Mooney, K. M., Beatty, G. E., Elsäßer, B., Follis, E. S., Kregting, L., O’Connor, N. E., et al. (2018). Hierarchical structuring of genetic variation at differing geographic scales in the cultivated sugar kelp Saccharina latissima. Mar. Environ. Res. 142, 108–115. doi: 10.1016/j.marenvres.2018.09.029
Moreno-Hagelsieb, G., and Latimer, K. (2008). Choosing BLAST options for better detection of orthologs as reciprocal best hits. Bioinformatics 24, 319–324. doi: 10.1093/bioinformatics/btm585
Murga-Moreno, J., Coronado-Zamora, M., Hervas, S., Casillas, S., and Barbadilla, A. (2019). iMKT: the integrative McDonald and Kreitman test. Nucleic Acids Res. 47, W283–W288. doi: 10.1093/nar/gkz372
Naylor, R. L., Hardy, R. W., Buschmann, A. H., Bush, S. R., Cao, L., Klinger, D. H., et al. (2021). A 20-year retrospective review of global aquaculture. Nature 591, 551–563. doi: 10.1038/s41586-021-03308-6
Nei, M. (1973). Analysis of gene diversity in subdivided populations. Proc. Natl. Acad. Sci. U.S.A. 70, 3321–3323. doi: 10.1073/pnas.70.12.3321
North, W. J. (1978). Evaluation, management, and cultivation of Macrocystis kelp forests. Paper Presented at the Symposium on Chilean Algae, November 1978, Santiago.
North, W. J. (1987). “Biology of the Macrocystis resource in North America,” in Case Studies of Seven Commercial Seaweed Resources, eds M. S. Doty, J. F. Caddy, and B. Santelices (San Francisco, CA: FAO).
Otto, S. P., and Gerstein, A. C. (2008). The evolution of haploidy and diploidy. Curr. Biol. 18, R1121–R1124.
Park, S. G., and Choi, S. S. (2010). Expression breadth and expression abundance behave differently in correlations with evolutionary rates. BMC Evol. Biol. 10:241. doi: 10.1186/1471-2148-10-241
Plough, L. V. (2016). Genetic load in marine animals: a review. Curr. Zool. 62, 567–579. doi: 10.1093/cz/zow096
Raper, J. R., and Flexer, A. S. (1970). The road to diploidy with emphasis on a detour. Symp. Soc. Gen. Microbiol. 20, 401–432.
Reed, D. C. (1990). The effects of variable settlement and early competition on patterns of kelp recruitment. Ecology 71, 776–787.
Reed, D. C., Ebeling, A. W., and Anderson, T. W. (1996). Differential reproductive responses to fluctuating resources in two seaweeds with different reproductive strategies. Ecology 77, 300–316. doi: 10.2307/2265679
Reed, D. C., Kinlan, B. P., Raimondi, P. T., Washburn, L., Gaylord, B., and Drake, P. T. (2006). “A Metapopulation perspective on patch dynamics of Southern California,” in Marine Metapopulations, eds J. P. Kritzer and P. F. Sale (San Diego, CA: Academic Press), 353–386. doi: 10.1016/b978-012088781-1/50013-3
Salavarría, E., Paul, S., Gil-Kodaka, P., and Villena, G. K. (2018). First global transcriptome analysis of brown algae Macrocystis integrifolia (Phaeophyceae) under marine intertidal conditions. 3 Biotech 8:185. doi: 10.1007/s13205-018-1204-4
Schiel, D. R., and Foster, M. S. (2015). The Biology and Ecology of Giant Kelp Forests. Berkeley, CA: University of California Press.
Schmieder, R., and Edwards, R. (2011). Fast identification and removal of sequence contamination from genomic and metagenomic datasets. PLoS One 6:e17288. doi: 10.1371/journal.pone.0017288
Seppey, M., Manni, M., and Zdobnov, E. M. (2019). “BUSCO: assessing genome assembly and annotation completeness,” in Gene Prediction. Methods in Molecular Biology, Vol. 1962, ed. M. Kollmar (New York, NY: Humana).
Silberfeld, T., Leigh, J. W., Verbruggen, H., Cruaud, C., de Reviers, B., and Rousseau, F. (2010). A multi-locus time-calibrated phylogeny of the brown algae (Heterokonta, Ochrophyta, Phaeophyceae): investigating the evolutionary nature of the “brown algal crown radiation”. Mol. Phylogenet. Evol. 56, 659–674. doi: 10.1016/j.ympev.2010.04.020
Singh, R. P., Bijo, A. J., Baghel, R. S., Reddy, C. R., and Jha, B. (2011). Role of bacterial isolates in enhancing the bud induction in the industrially important red alga Gracilaria dura. FEMS Microbiol. Ecol. 76, 381–392. doi: 10.1111/j.1574-6941.2011.01057.x
Suyama, M., Torrents, D., and Bork, P. (2006). PAL2NAL: robust conversion of protein sequence alignments into the corresponding codon alignments. Nucleic Acids Res. 34, W609–W612. doi: 10.1093/nar/gkl315
Szövényi, P., Ricca, M., Hock, Z., Shaw, J. A., Shimizu, K. K., and Wagner, A. (2013). Selection is no more efficient in haploid than in diploid life stages of an angiosperm and a moss. Mol. Biol. Evol. 30, 1929–1939. doi: 10.1093/molbev/mst095
Tajima, F. (1989). Statistical method for testing the neutral mutation hypothesis by DNA polymorphism. Genetics 123, 585–595. doi: 10.1093/genetics/123.3.585
Tanna, B., and Mishra, A. (2018). Metabolites unravel nutraceutical potential of edible seaweeds: an emerging source of functional food. Compr. Reviews in Food Sci. Food Saf. 17, 1613–1624. doi: 10.1111/1541-4337.12396
Tatusov, R. L., Koonin, E. V., and Lipman, D. J. (1997). A genomic perspective on protein families. Science 278, 631–637. doi: 10.1126/science.278.5338.631
UniProt Consortium (2021). UniProt: the universal protein knowledgebase in 2021. Nucleic Acids Res. 49, D480–D489. doi: 10.1093/nar/gkaa1100
Van der Auwera, G. A., Carneiro, M. O., Hartl, C., Poplin, R., Del Angel, G., Levy-Moonshine, A., et al. (2013). From FastQ data to high confidence variant calls: the genome analysis toolkit best practices pipeline. Curr. Protoc. Bioinformatics 43, 11.10.1–11.10.33. doi: 10.1002/0471250953.bi1110s43
Wickham, H., and Grolemund, G. (2016). R for Data Science: Import, Tidy, Transform, Visualize, and Model Data. Sebastopol, CA: O’Reilly Media, Inc.
Yang, Z. (2007). PAML 4: phylogenetic analysis by maximum likelihood. Mol. Biol. Evol. 24, 1586–1591. doi: 10.1093/molbev/msm088
Yoon, H. S., Hackett, J. D., Ciniglia, C., Pinto, G., and Bhattacharya, D. (2004). A molecular timeline for the origin of photosynthetic eukaryotes. Mol. Biol. Evol. 21, 809–818. doi: 10.1093/molbev/msh075
Young, M. D., Wakefield, M. J., Smyth, G. K., and Oshlack, A. (2010). Gene ontology analysis for RNA-seq: accounting for selection bias. Genome Biol. 11:R14.
Zheng, X., Levine, D., Shen, J., Gogarten, S. M., Laurie, C., and Weir, B. S. (2012). A high-performance computing toolset for relatedness and principal component analysis of SNP data. Bioinformatics 28, 3326–3328. doi: 10.1093/bioinformatics/bts606
Keywords: brown algae, giant kelp, purifying selection, genomics, sustainable ocean
Citation: Molano G, Diesel J, Montecinos GJ, Alberto F and Nuzhdin SV (2022) Sporophyte Stage Genes Exhibit Stronger Selection Than Gametophyte Stage Genes in Haplodiplontic Giant Kelp. Front. Mar. Sci. 8:774076. doi: 10.3389/fmars.2021.774076
Received: 10 September 2021; Accepted: 04 November 2021;
Published: 18 January 2022.
Edited by:
Gustavo Fonseca, Federal University of São Paulo, BrazilReviewed by:
Zi-Min Hu, Yantai University, ChinaCopyright © 2022 Molano, Diesel, Montecinos, Alberto and Nuzhdin. This is an open-access article distributed under the terms of the Creative Commons Attribution License (CC BY). The use, distribution or reproduction in other forums is permitted, provided the original author(s) and the copyright owner(s) are credited and that the original publication in this journal is cited, in accordance with accepted academic practice. No use, distribution or reproduction is permitted which does not comply with these terms.
*Correspondence: Sergey V. Nuzhdin, c251emhkaW5AdXNjLmVkdQ==
†These authors share first authorship
Disclaimer: All claims expressed in this article are solely those of the authors and do not necessarily represent those of their affiliated organizations, or those of the publisher, the editors and the reviewers. Any product that may be evaluated in this article or claim that may be made by its manufacturer is not guaranteed or endorsed by the publisher.
Research integrity at Frontiers
Learn more about the work of our research integrity team to safeguard the quality of each article we publish.