- 1College of Ocean Science and Engineering, Shandong University of Science and Technology, Qingdao, China
- 2State Key Laboratory of Tropical Oceanography, South China Sea Institute of Oceanology, Chinese Academy of Sciences, Guangzhou, China
- 3Southern Marine Science and Engineering Guangdong Laboratory (Guangzhou), Guangzhou, China
- 4Guangxi Key Laboratory of Marine Disaster in the Beibu Gulf, Bubei Gulf University, Qinzhou, China
- 5Key Laboratory of Physical Oceanography, Qingdao Collaborative Innovation Center of Marine Science and Technology, Ocean University of China, Qingdao, China
- 6Qingdao National Laboratory for Marine Science and Technology, Qingdao, China
Modulations of internal tides (ITs) including the baroclinic tidal energy budget, the incoherency, and the nonlinear interactions among different tidal components by turbulent mixing in the South China Sea (SCS) are investigated through numerical simulations. The baroclinic tidal energy budget can hardly be affected by the structure of mixing. Meanwhile, change in the mixing intensity in a reasonable range also cannot obviously modulate the baroclinic tidal energy budget in the SCS. Compared to the baroclinic energy budget, the distributions of conversion and dissipation are more sensitive to the change of mixing. Turbulent mixing also modulates the incoherency of ITs by changing the horizontal density in the ocean. The horizontal variation of density adds incoherence to ITs largely by affecting the internal tidal amplitudes. Furthermore, nonlinear interactions among different components of ITs are generally modulated by the mixing intensity, whereas the variation of the mixing structure can hardly influence the nonlinear interactions. Therefore, the diapycnal diffusivity can set to be horizontally and vertically homogeneous in most of the internal tidal simulations, except for those in which the incoherency of ITs needs to be simulated. However, excessive strong mixing will destroy the stratification. Thus, the optimum range for IT simulations in the SCS is from O (10–5) to O (10–3) m2s–1.
Introduction
Internal tides (ITs) are internal waves generated as surface tides flow over rough topography such as seamounts and ridges (Nash et al., 2006; Xu et al., 2014; Cao et al., 2017). ITs play important roles in enhancing mixing (Egbert and Ray, 2000; Niwa and Hibiya, 2001; Tian et al., 2010; Zhao, 2014; Peng et al., 2021). Turbulent mixing provides energy for the upwelling of deep-water circulation, which is an essential process of global overturning circulation (Toggweiler and Samuels, 1995; Webb and Suginohara, 2001). However, the averaged diapycnal diffusivity, which is necessary to maintain the global meridional overturning circulation, is one order of magnitude larger than those observed in the open ocean (Munk, 1966). In other words, turbulent mixing in regional seas will be much stronger than that in the open ocean.
ITs represent intermediate steps, which transfer energy from surface tides to turbulence mixing (Foreman et al., 2004; Carter et al., 2006; Liu, 2010; Polzin et al., 2014). Breaking of ITs contributes apparently to regional turbulent mixing. The diapycnal diffusivities in regions with strong ITs can be more than three orders of magnitude greater (Lueck and Osborn, 1985; Rudnick et al., 2003; Carter et al., 2005). Haren et al. (2015) found that at the steepest slope, turbulence was 100 times more energetic than at the shallowest slope. Munk (1998) found that ITs provide approximately half of the energy necessary for the global overturning circulation. Carter et al. (2005) also attributed the enhancement of turbulence to the presence of ITs and nonlinear internal waves. Using observations and numerical simulations, Rudnick et al. (2003) investigated tides-to-turbulence cascade along the Hawaiian Ridge and suggested that tide-induced mixing is evidently stronger than that in the open ocean and isolated ridges are essential sites for enhanced mixing. Johnston et al. (2011) found that averaged turbulence mixing is 50% stronger along the internal tidal beams than outside the beams near the Monterey Bay and peak values in the beam can be an order of magnitude larger. Based on the observations, Zhao et al. (2012) examined the bottom intensification of turbulence in the Monterey Submarine Canyon and suggested that the temporal varying of mixing is modulated by ITs. Legg (2003) investigated the high-mode structure of ITs and the enhancement of mixing near the continental slope and pointed out that shear may lead to local mixing. MacKinnon and Gregg (2005) also attributed the elevation of turbulent mixing to the increment of shear, which is caused by the reinforcement of stratification. Strong near-surface stratification can apparently influence mixing by isolating the deeper water from mechanical penetration of atmospheric energy (Jinadasa et al., 2016).
The South China Sea (SCS), connected by the Luzon Strait (LS) to the West Pacific, is abundant in internal waves such as ITs, nonlinear internal waves, and near-inertial waves, which results in the enhancement of turbulent mixing. Liu and Lozovatsky (2012) investigated the turbulent kinetic energy dissipation rate in the upper pycnocline of the northern SCS. They found that internal waves originated in the LS are associated with the predominant mixing that appears in regions north of 20°N. Wang et al. (2017) investigated the influence of ITs on the circulation and mass transformation in the SCS. They suggested that tidal mixing would strengthen the horizontal density gradient and the basin-scale cyclonic circulation, promoting overturning circulation in the SCS. Yang et al. (2016) observed spatial distribution of turbulent mixing in the SCS, based on the Gregg–Henyey–Polzin parameterization. They revealed that turbulent mixing generally increases with depth. In the horizontal direction, mixing is elevated in the south and east regions of the SCS.
Furthermore, temporal and spatial variations of mixing cause corresponding changes in stratification. Delorme et al. (2021) found that enhanced mixing results in the weakening of the abyssal stratification. Ivey (2004) found that during the period of strong mixing, the stratification is weakened or even absent. Drake et al. (2020) suggested that mixing, which generates flows in a bottom boundary layer, can effectively affect the global ocean stratification. Garrett (2003) also found that mixing affects ocean stratification and ocean circulation. Variations of stratification can effectively modulate ITs. Foreman and Thomson (1997) found that seasonal changes in stratification not only influence the intensity of ITs, enhancing bottom currents, but also eventually affect surface tides. Dushaw (2002) pointed out that variation of stratification can cause changes in phase speed of mode-1 ITs. Guo et al. (2012) found that the increased stratification in autumn is beneficial to propagating internal tidal energy and to preserving higher-mode ITs. They also suggested that changes of stratification play important roles in the dissipation of ITs. Nakamura et al. (2014) found that the phase relationship with seasonal variation in stratification affects the strength of tidal mixing. They also suggested that the strength of tide-induced mixing depends on the temporal variations of vertical diffusivity. In other words, diffusivity is envisioned as a key character, influencing the ITs through stratification. However, the modulation of ITs by turbulent mixing is rarely investigated, especially in the SCS, and the clear picture to a large extent remains unknown. Moreover, the diapycnal diffusivity is usually set to be spatial uniform when we simulate ITs. The spatial structure of mixing can effectively influence ITs is not clear. Therefore, investigations need to be carried to better understand the modulation of ITs by turbulent mixing. In this study, simulations of ITs based on the Massachusetts Institute of Technology General Circulation Model (MITgcm) are performed to explore modulations of ITs in the SCS by mixing. This study is organized as follows. Methods of model configuration and the baroclinic tidal energy budget analysis are introduced in section “Materials and Methods”. Modulation of ITs by mixing is presented in section “Results”. Summary and discussion are shown in section “Summary and Discussion.”
Materials and Methods
Baroclinic Tide Model Configuration Method
The ocean model used in this study is the MITgcm, which has been widely used for simulating ITs around the LS and in the SCS (Buijsman et al., 2012; Wang et al., 2016). The simulation area includes the LS and part of the SCS (12°–24°N, 104°–125°E), which is shown in Figure 1A and has a horizontal resolution of 1/24° × 1/24°. The model topography is from the General Bathymetric Chart of the Oceans (GEBCO) bathymetry data with a high resolution of 30 arcs. The initial temperature and salinity profiles are derived from the monthly mean climatology of the Generalized Digital Environmental Model, version 3 (GDEMv3). The initial fields are set to be horizontally homogeneous by using temperature and salinity at sites 20.50°N and 120.25°E in January. In the vertical direction, there are 60 uneven vertical layers, varying from 0 at the top to 5,700 m at the bottom (Figure 1B). The model is forced by barotropic tidal currents at the open boundaries. Principal constituents of diurnal and semidiurnal ITs, including K1, O1, M2, and S2, are taken into consideration. The amplitudes and phases of these constituents are extracted from the regional solution for the China Sea of the Oregon State University inverse barotropic tidal model (OTIS). A 0.5° width sponge layer is applied.
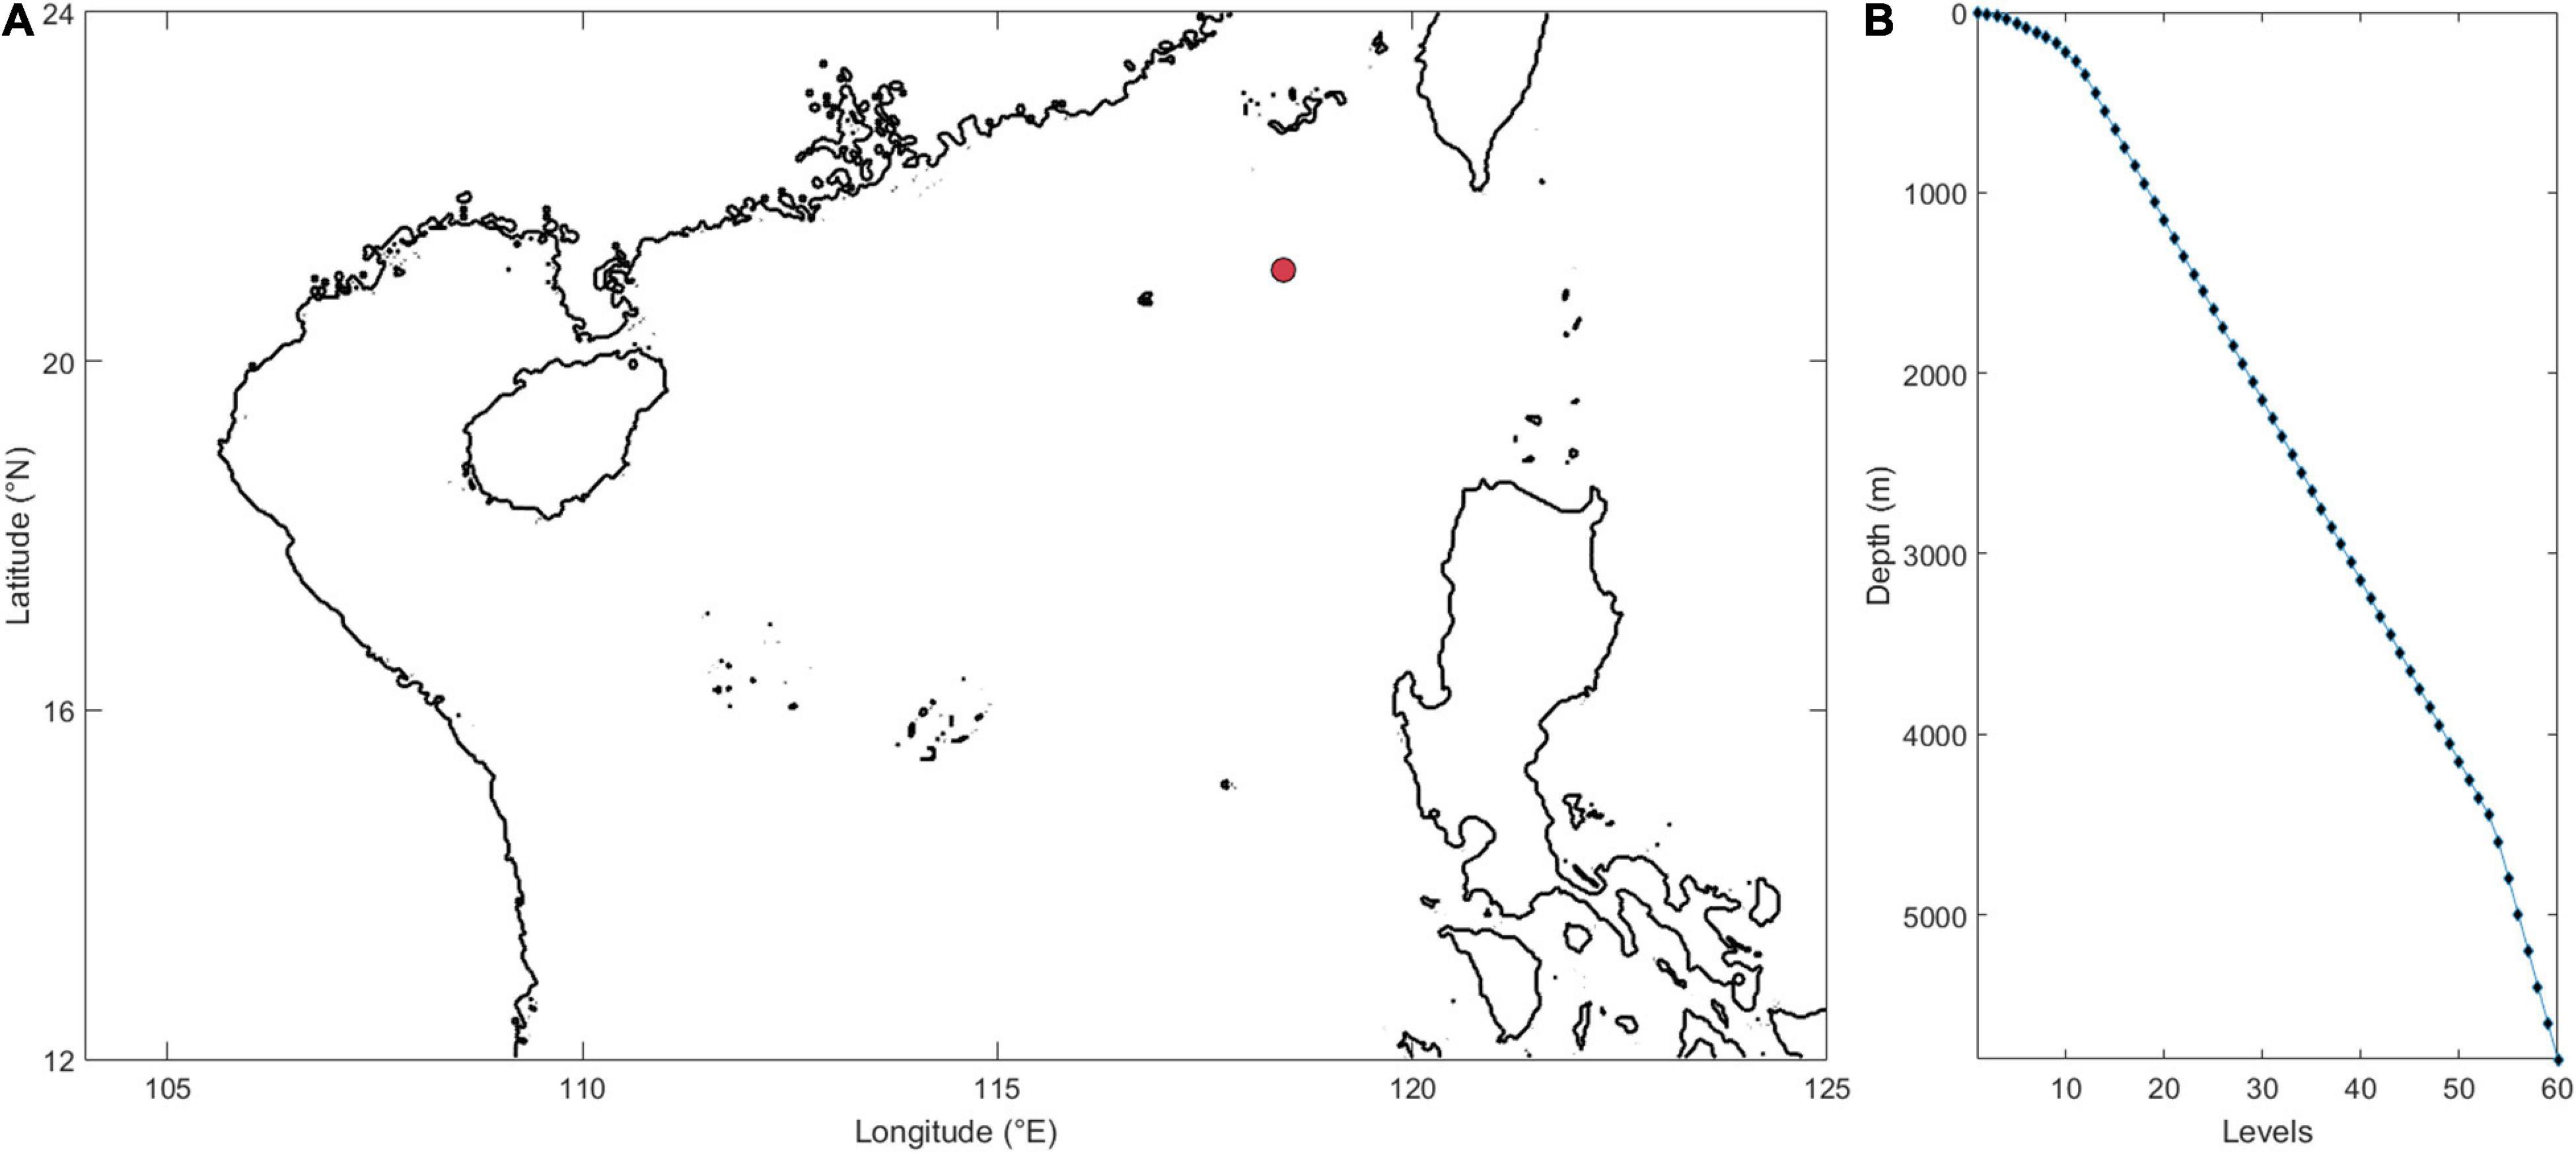
Figure 1. (A) The simulation domain (the red dot indicates the mooring position) and (B) depth of vertical levels.
The mixing parameterization is set as follows. The horizontal eddy viscosity and vertical eddy viscosity are 100 m2s–1 and 10–4 m2s–1, respectively. Configurations of the diapycnal diffusivity are estimated according to observations of Yang et al. (2016) and the Gregg–Henyey–Polzin parameterization is employed. Experiments are carried out to investigate modulations of generation, dissipation, and coherency of ITs and nonlinear interaction among different components of ITs. In the first group of experiments (IE1), IE1-1 is conducted with a horizontally and vertically homogeneous value of the diapycnal diffusivity of 1.7 × 10⁻³ m2s–1, which is the mean value of the observed diapycnal diffusivity in the SCS according to Yang et al. (2016). IE1-2 is conducted with a three-dimensional spatial structure of the diapycnal diffusivity. The distribution of the diapycnal diffusivity along a section of 20°N is shown in Figure 2A. Because the observation is relatively sparse, the three-dimensional structure of the diapycnal diffusivity can not be accurately obtained by interpolation. The spatial structure, thus, can be estimated from the horizontal distribution and is calculated as:
where, Khz is the horizontal structure of the diapycnal diffusivity, K0 = 1.0 × 10⁻⁵ m2s–1 is the background diffusivity, and F is the vertical structure function, which is calculated according to Wang et al. (2016).
Here, D = H +ξ is the total water depth, ξ is the time-mean sea level, H is the water depth, and β is the vertical decay scale. We vertically average observed data to calculate the horizontal structure. However, the area at the east ridge of the LS is not covered by observation, so the horizontal structure of the diapycnal diffusivity cannot be given directly. Considering that the LS is the generation site of ITs, which will effectively influence ITs in the SCS, the diapycnal diffusivity of area (14°–22°N, 121°–125°E), in which observation is absent, is estimated by filling into values of area (14°–22°N, 117°–121°E), assuming that the distribution of topography and the distribution of the diapycnal diffusivity between east and west ridges are symmetrical. Therefore, horizontal distribution of the diapycnal diffusivity in the LS is obtained (Figure 2B). Then, the three-dimensional structure of the diapycnal diffusivity can be calculated according to Equation 1.

Figure 2. (A) Cross-section distribution of the diapycnal diffusivity along 20°N in IE1-2 and (B) horizontal distribution of the diapycnal diffusivity.
In addition, moored current observation in the northern SCS is used for testifying the accuracy of the baroclinic tide simulations. The water depth in the mooring site is 2,480 m. As a part of the SCS Internal Wave Experiment, the subsurface mooring (21.05°N, 118.45°E) was deployed to observe the layers near the surface (from 80 to 355 m) (Figure 1A). The velocity data were interpolated onto uniform levels with 5 m intervals and hourly averaged data from August 2010 to January 2011 were used for checking the accuracy of IT simulation.
Baroclinic Tidal Energy Budget Analysis Method
The internal tidal energy is approximately calculated according to Wang et al. (2016).
Where, C is the depth-integrated conversion of barotropic to baroclinic energy, FD is the divergence of depth-integrated baroclinic energy flux, and DIS is the dissipation of baroclinic energy. C and FD are given as:
where, g is the acceleration of gravity, ρ′ is the density perturbation, wbt is the vertical velocity of barotropic tides, and u’ and p’ are the horizontal baroclinic velocity (u and v for the eastward and northward direction, respectively) and pressure perturbation, respectively. ρ′ and wbt can be calculated as:
where, ρ is the instantaneous density, is the density averaged in a tidal period, and σ is defined as σ=(z−ξ)/D. u′ and p′ are given as:
where, is the velocity averaged in a tidal period.
Results
Modulation on the Baroclinic Tidal Energy Budget
Figure 3 shows a comparison between simulated and observed amplitudes of eastward velocities of M2, S2, K1, and O1 in IE1-1 (result of IE1-2 is similar and not shown). Table 1 displays the differences (vertical mean absolute errors of amplitudes) between observations and simulated results. Errors of semidiurnal ITs are smaller than those of diurnal counterparts. Vertical mean absolute errors of both the M2 and S2 are 0.6 cm/s. For diurnal constituents, larger differences in K1 mostly appear beneath 200 m. The simulated O1 is largely stronger than observation and makes the difference larger than other components.
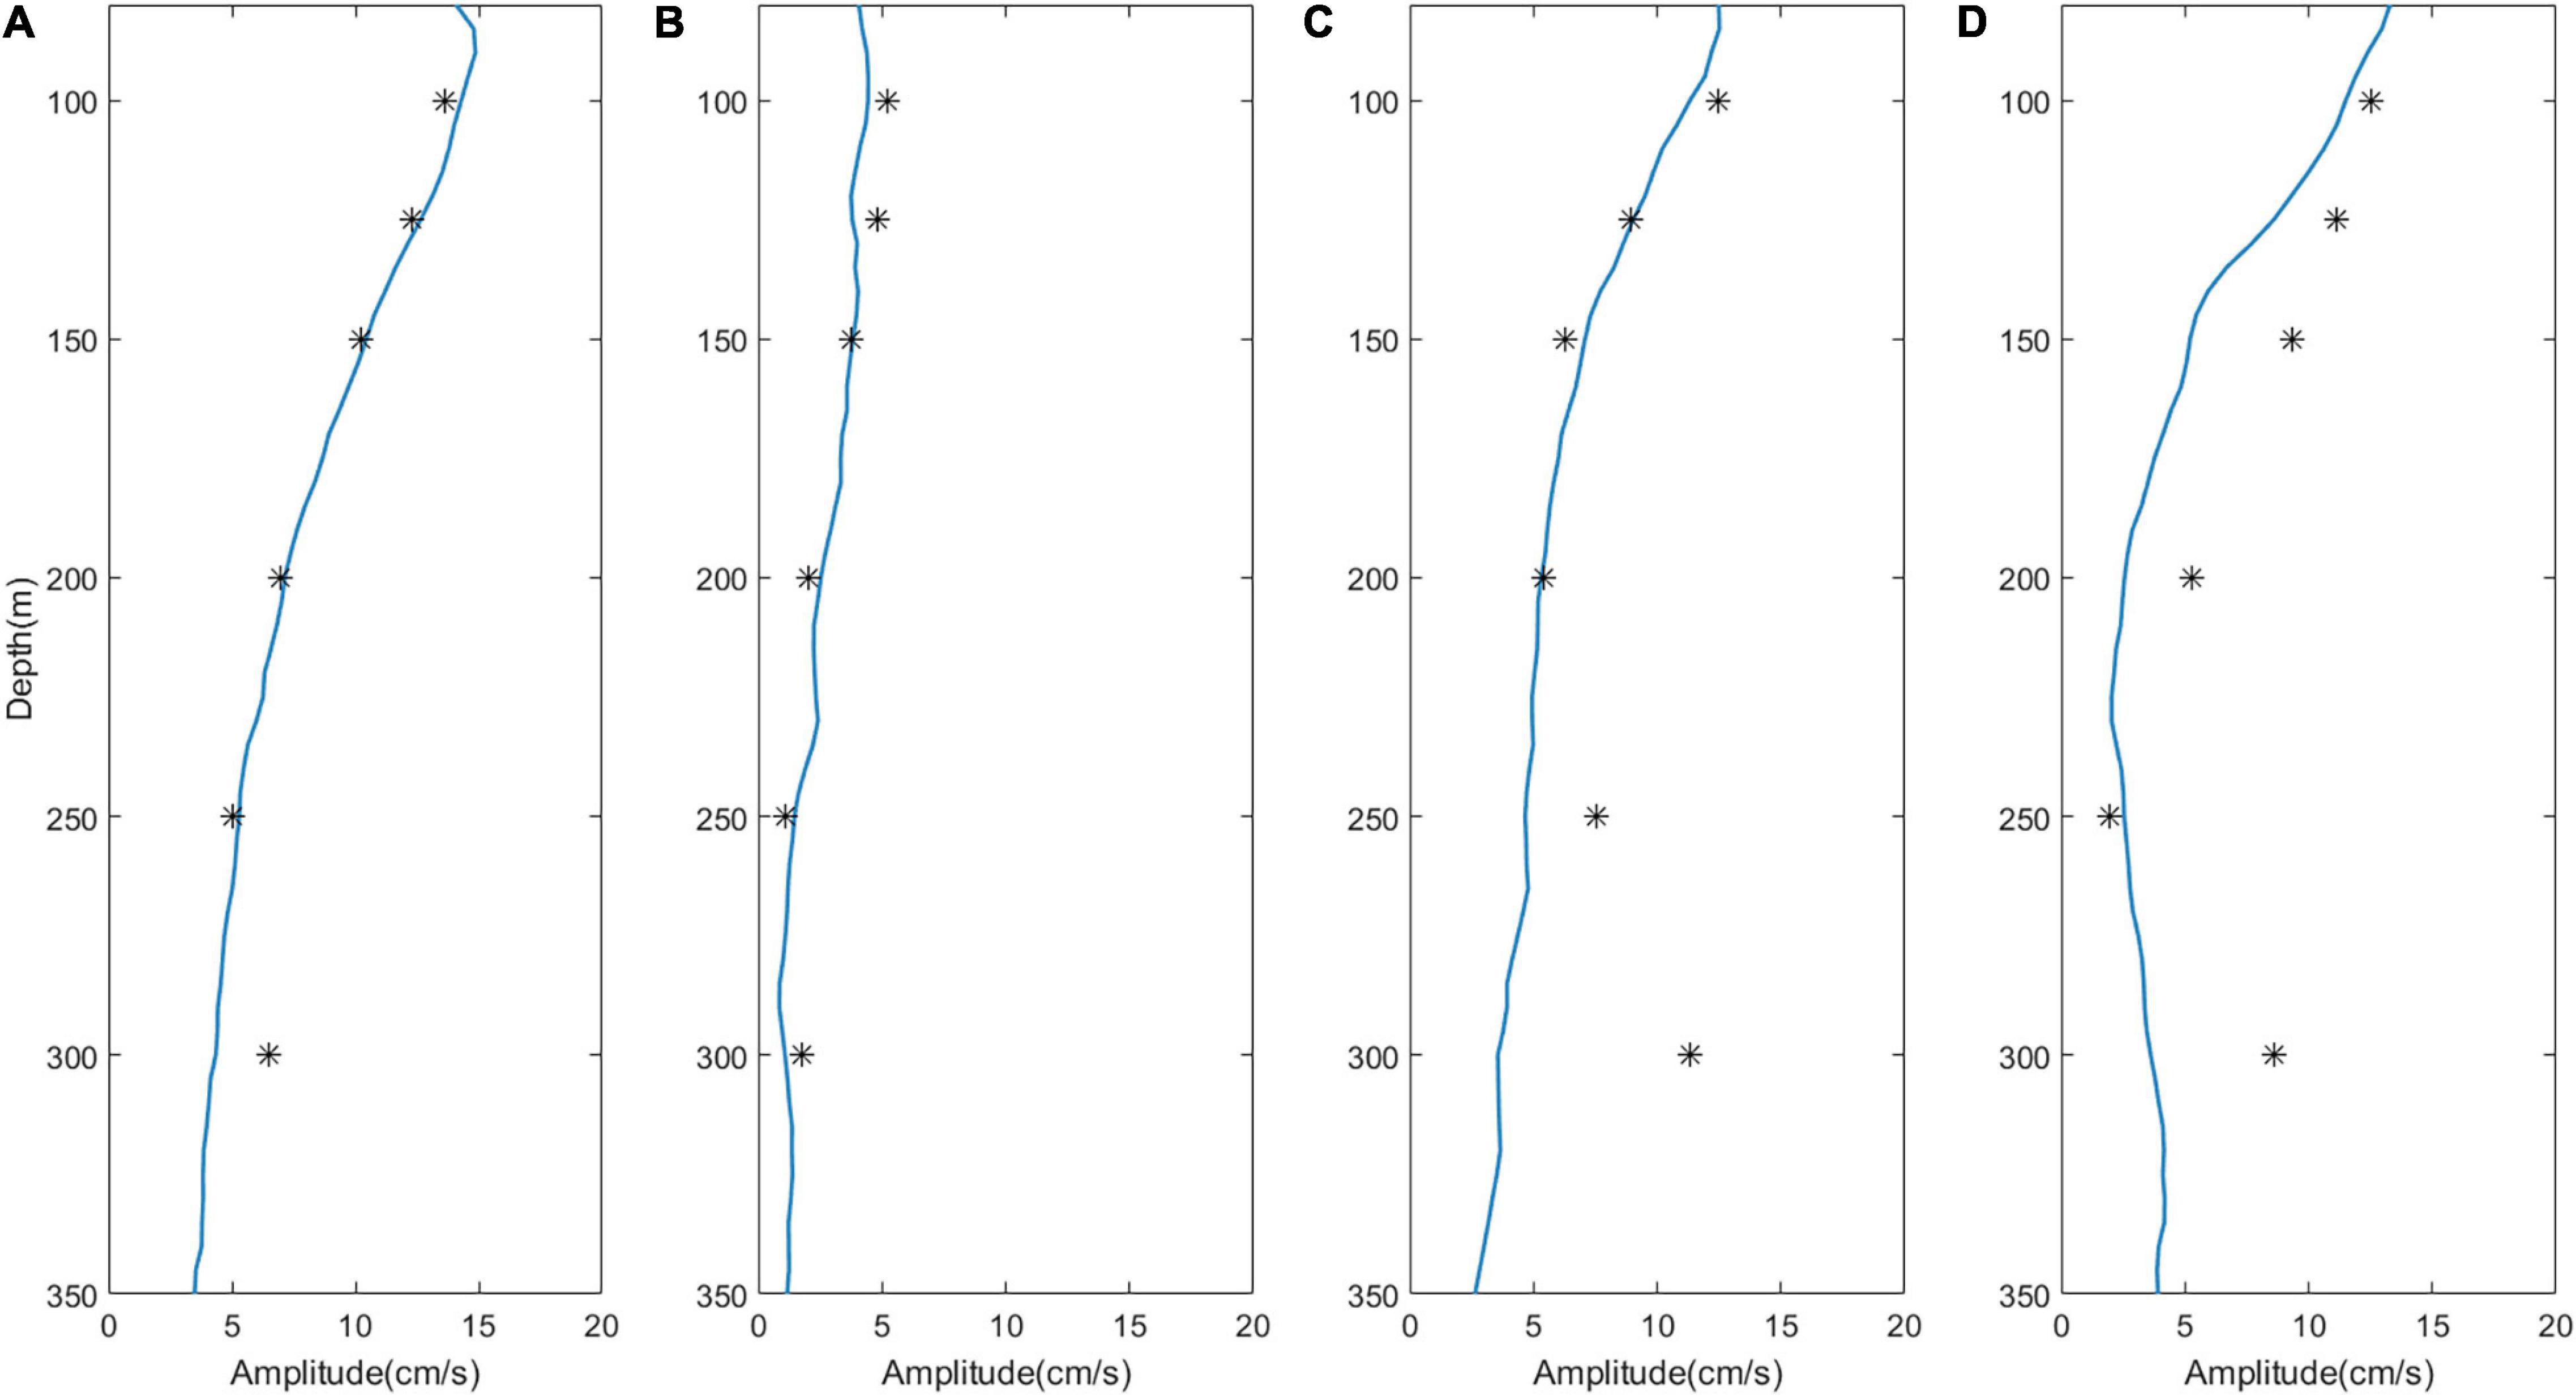
Figure 3. Amplitudes of eastward baroclinic tidal currents of observation (blue line) and simulation (black asterisk) at frequency of (A) M2, (B) S2,(C) K1, and (D) O1.

Table 1. Differences (vertical mean absolute errors) in M2, S2, K1, and O1 eastward tidal current amplitudes between observations and simulated results.
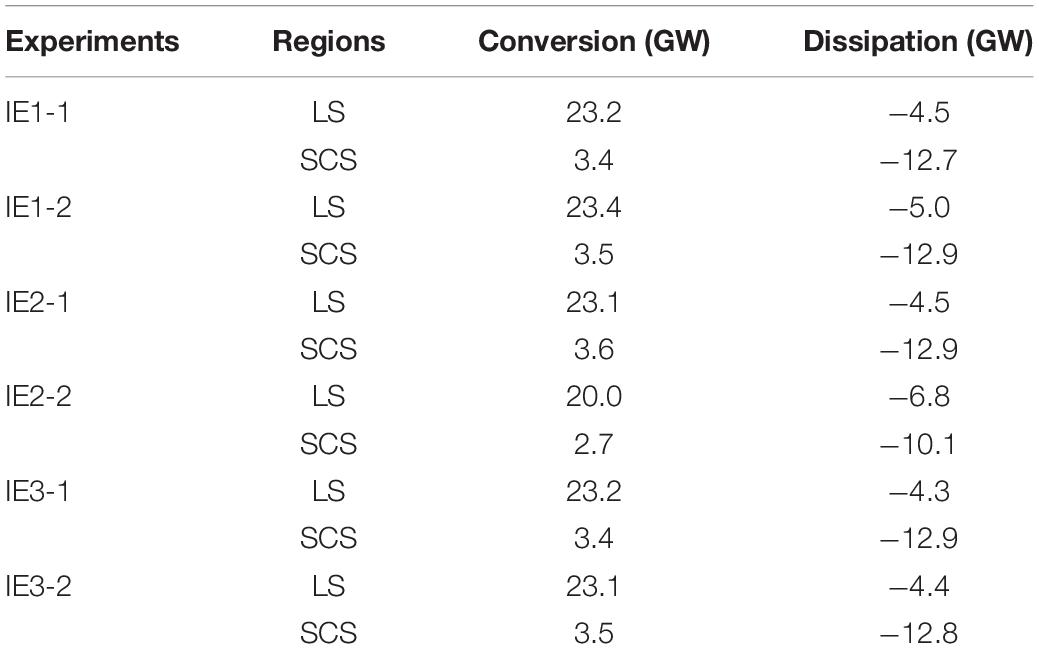
The conversion and dissipation of the baroclinic tidal energy budget in all the experiments are shown in Table 2. ITs are largely generated in the LS, but more energy is dissipated in the SCS. Differences of conversion between IE1-1 and IE1-2 are small in both the LS and the SCS. When structures of turbulent mixing alters from spatial uniform to spatial varying, baroclinic energy budgets of IE1-1 and IE1-2 are close. This suggests that the spatial structure of the diapycnal diffusivity can hardly modulate the baroclinic tidal energy budget in both the LS and the SCS.
Group of idealized experiments 2 (IE2) is further conducted to investigate the influence of mixing intensity on ITs. IE2-1 and IE2-2 are conducted with the diapycnal diffusivity of 9.3 × 10⁻⁶ m2s–1 and 1.0 × 10⁻¹ m2s–1, which are the minimum and maximum of the observed diapycnal diffusivity, respectively, in the SCS according to Yang et al. (2016). Differences in the baroclinic tidal energy budget between IE2-1 and IE1-1 are still extraordinarily small even the intensity of turbulent mixing in IE2-1 becomes about two orders of magnitudes smaller. However, apparent differences emerge, when the intensity of the diapycnal diffusivity increases by about two orders of magnitudes and reaches the observed maximum. In both the LS and the SCS, barotropic-to-baroclinic conversions are decreased evidently. Meanwhile, modulations of energy dissipation also are evident. But, the dissipation shows opposite varying character between the LS and the SCS. The dissipation will be reinforced in the LS, but weakened in the SCS when mixing enhances. ITs in the SCS are largely generated in the LS. The decrease in conversion and the increase in dissipation in the LS reduce the energy, which propagated into the SCS and eventually degrade the dissipation rate in the SCS. In addition, the dissipation in the LS is more sensitive to the change of mixing. In the LS, dissipation in IE2-2 is 51% stronger than that in IE1-1. But, dissipation in the SCS is only 20% weaker.
Group of idealized experiments 3 (IE3) is carried out to testifying whether the spatial variation of mixing in vertical and horizontal directions both can hardly influence the total energy budget or they have the opposite effect, which cancels each other out. IE3-1 is conducted with a vertical varying structure of mixing. Vertical structure of the diapycnal diffusivity can be obtained by averaging the observation horizontally and values under 5,000 m depth are set to be the same as that at 5,000 m because of the lack of observation under this depth. IE3-2 is conducted with a horizontal varying structure of mixing (Figure 2B). Results show that both the conversion and dissipation are close to each other. Differences between IE3 and IE1-1 are generally smaller than those between IE1-1 and IE1-2, which indicate that the spatial variation of mixing in both the vertical and horizontal directions can hardly influence the baroclinic tidal energy budget.
Figure 4 shows simulated distributions of conversion rate during the period of spring tide in all the experiments. The black contours represent strong-conversion regions in which the conversion rate is equal to or larger than 0.5 Wm–2. Patterns of conversion in IE1-2 are similar to that in IE1-1, which suggest that distribution of conversion can hardly be modulated when mixing alters from spatially uniform form to three-dimensional varying structure. Moreover, patterns of conversion between IE1-1 and IE3-1 are also very close. However, the distinction of distribution in the SCS between IE1-1 and IE3-2 is relatively evident. When mixing alters from spatially uniform to simple horizontal varying structure, regions of positive conversion enlarge, but areas of strong conversion (indicates by the black lines) reduce in the SCS. This indicated that compared with three-dimensional changes of mixing structure, the simple variation in the horizontal direction has more effect on the distribution of conversion rate, especially in the SCS. The distinction of distribution is more evident when mixing intensity changes. Although the baroclinic tidal energy budget is close between IE1-1 and IE2-1, distributions show more obvious distinctions. Regions of positive conversion also enlarge and areas of strong conversion reduce when mixing intensity weakens. However, when the mixing intensity strengthens, large parts of regions with positive conversion turn into negative conversion in the SCS, which eventually reduces the total energy converted from barotropic tides to ITs.
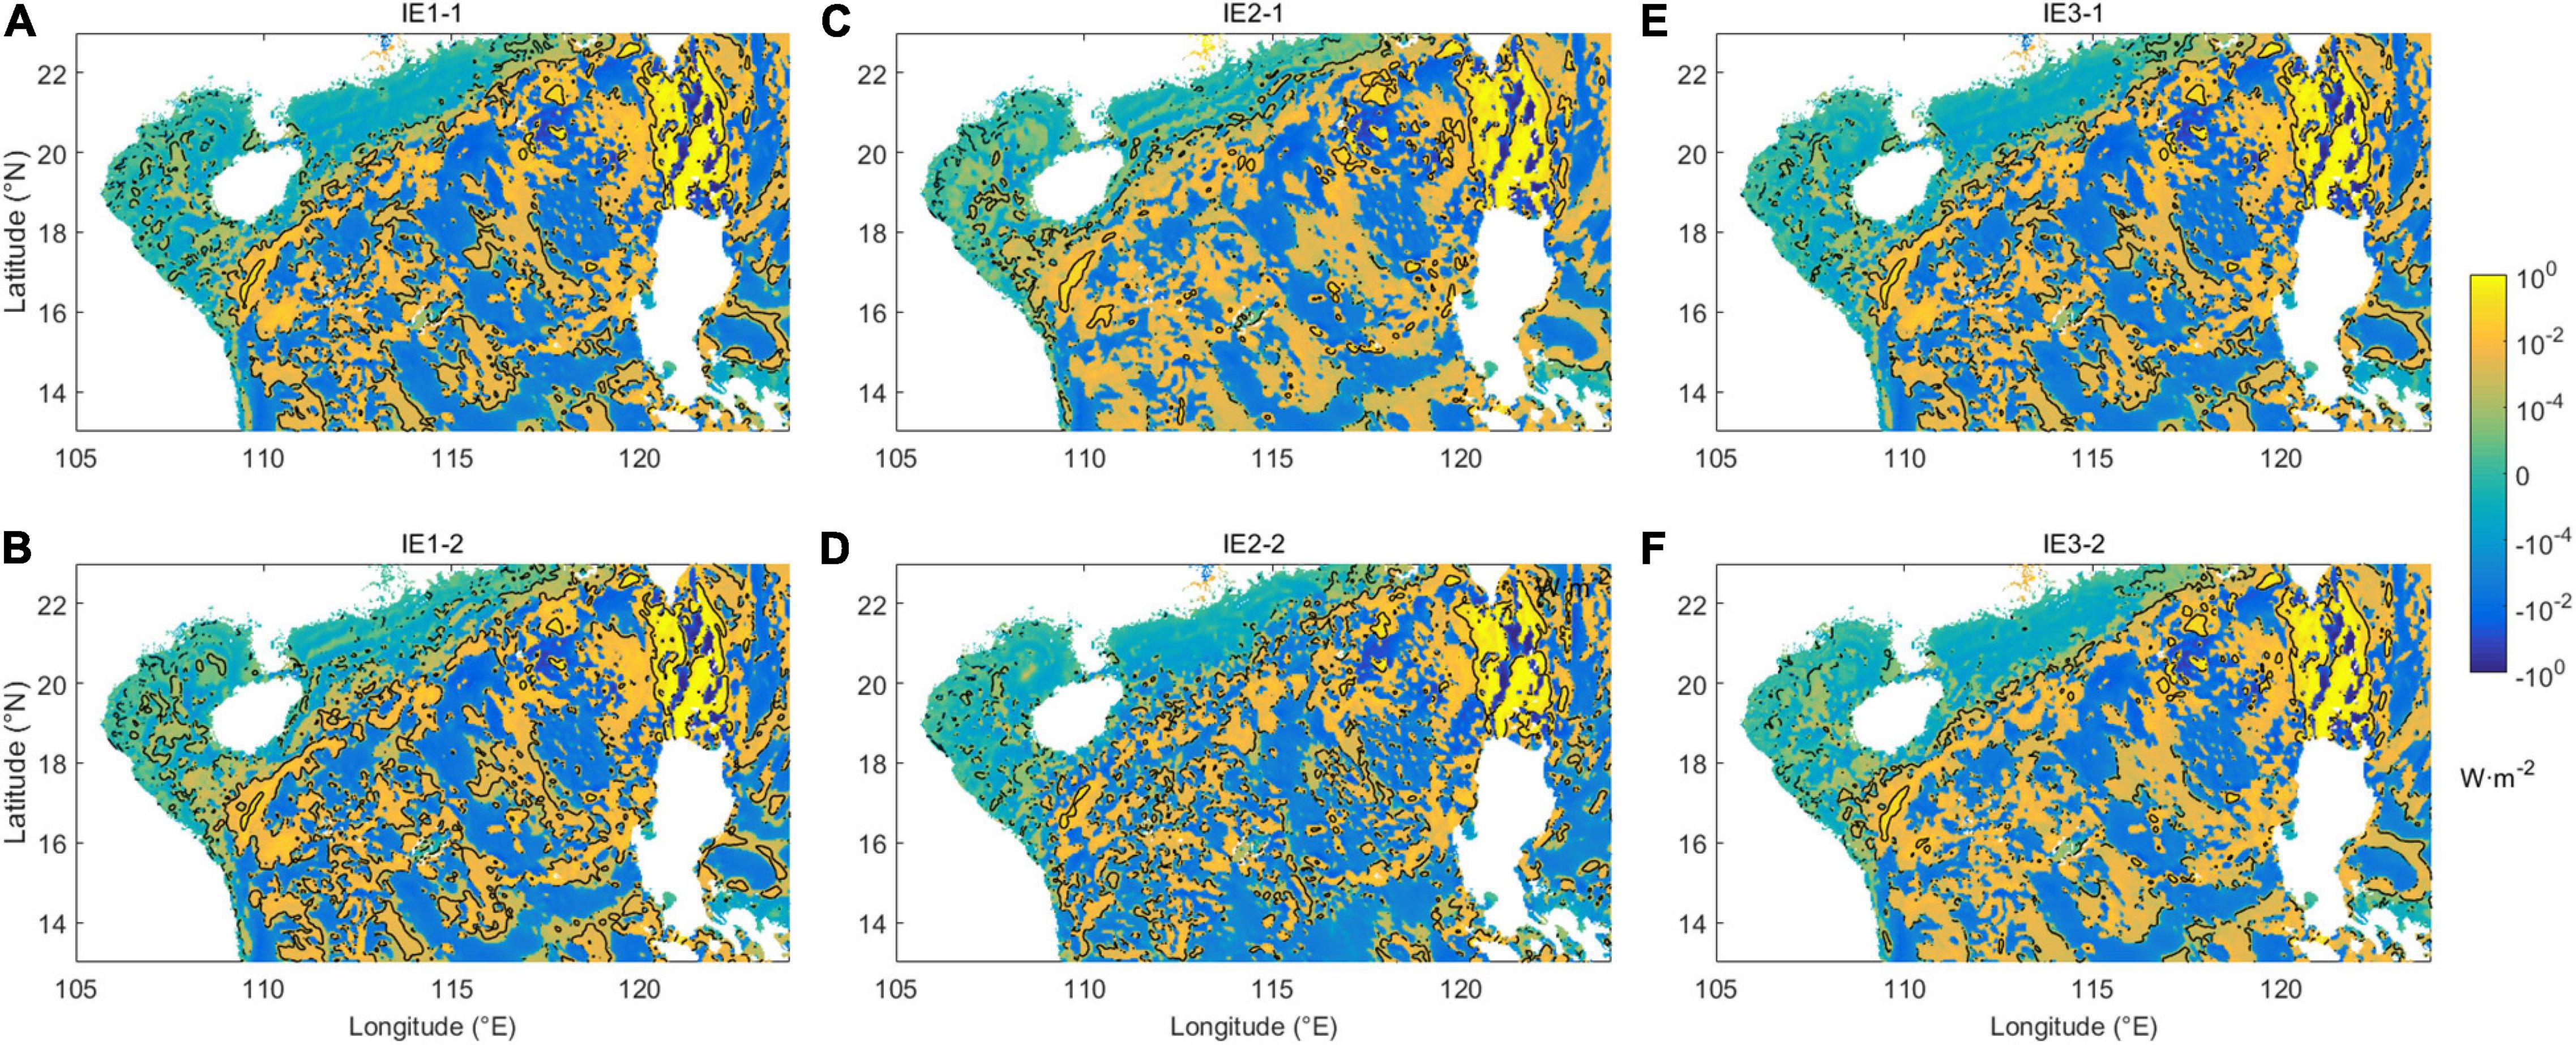
Figure 4. Depth-integrated barotropic-to-baroclinic conversion rate (black lines indicate conversion of 0.5 Wm–2) for (A,B) IE1, (C,D) IE2, and (E,F) IE3.
Figure 5 shows simulated distributions of dissipation rate during the period of spring tide in all the experiments. Gray contours indicate the strong-dissipation regions in which the dissipation rate is equal to or larger than 0.5 Wm–2. The distinction of dissipation distribution is largely concentrated near the LS. In IE1-2, the area of dissipation narrows, but the strength of dissipation increases in the LS. Differences of dissipation distribution also exist in IE3-1 and IE3-2, but not as evident as that in IE1-2. In addition, changes in the intensity of mixing (IE2) also cause corresponding variations in the distribution of dissipation. We also noticed that modulation of dissipation distribution is more apparent than that of conversion distribution.
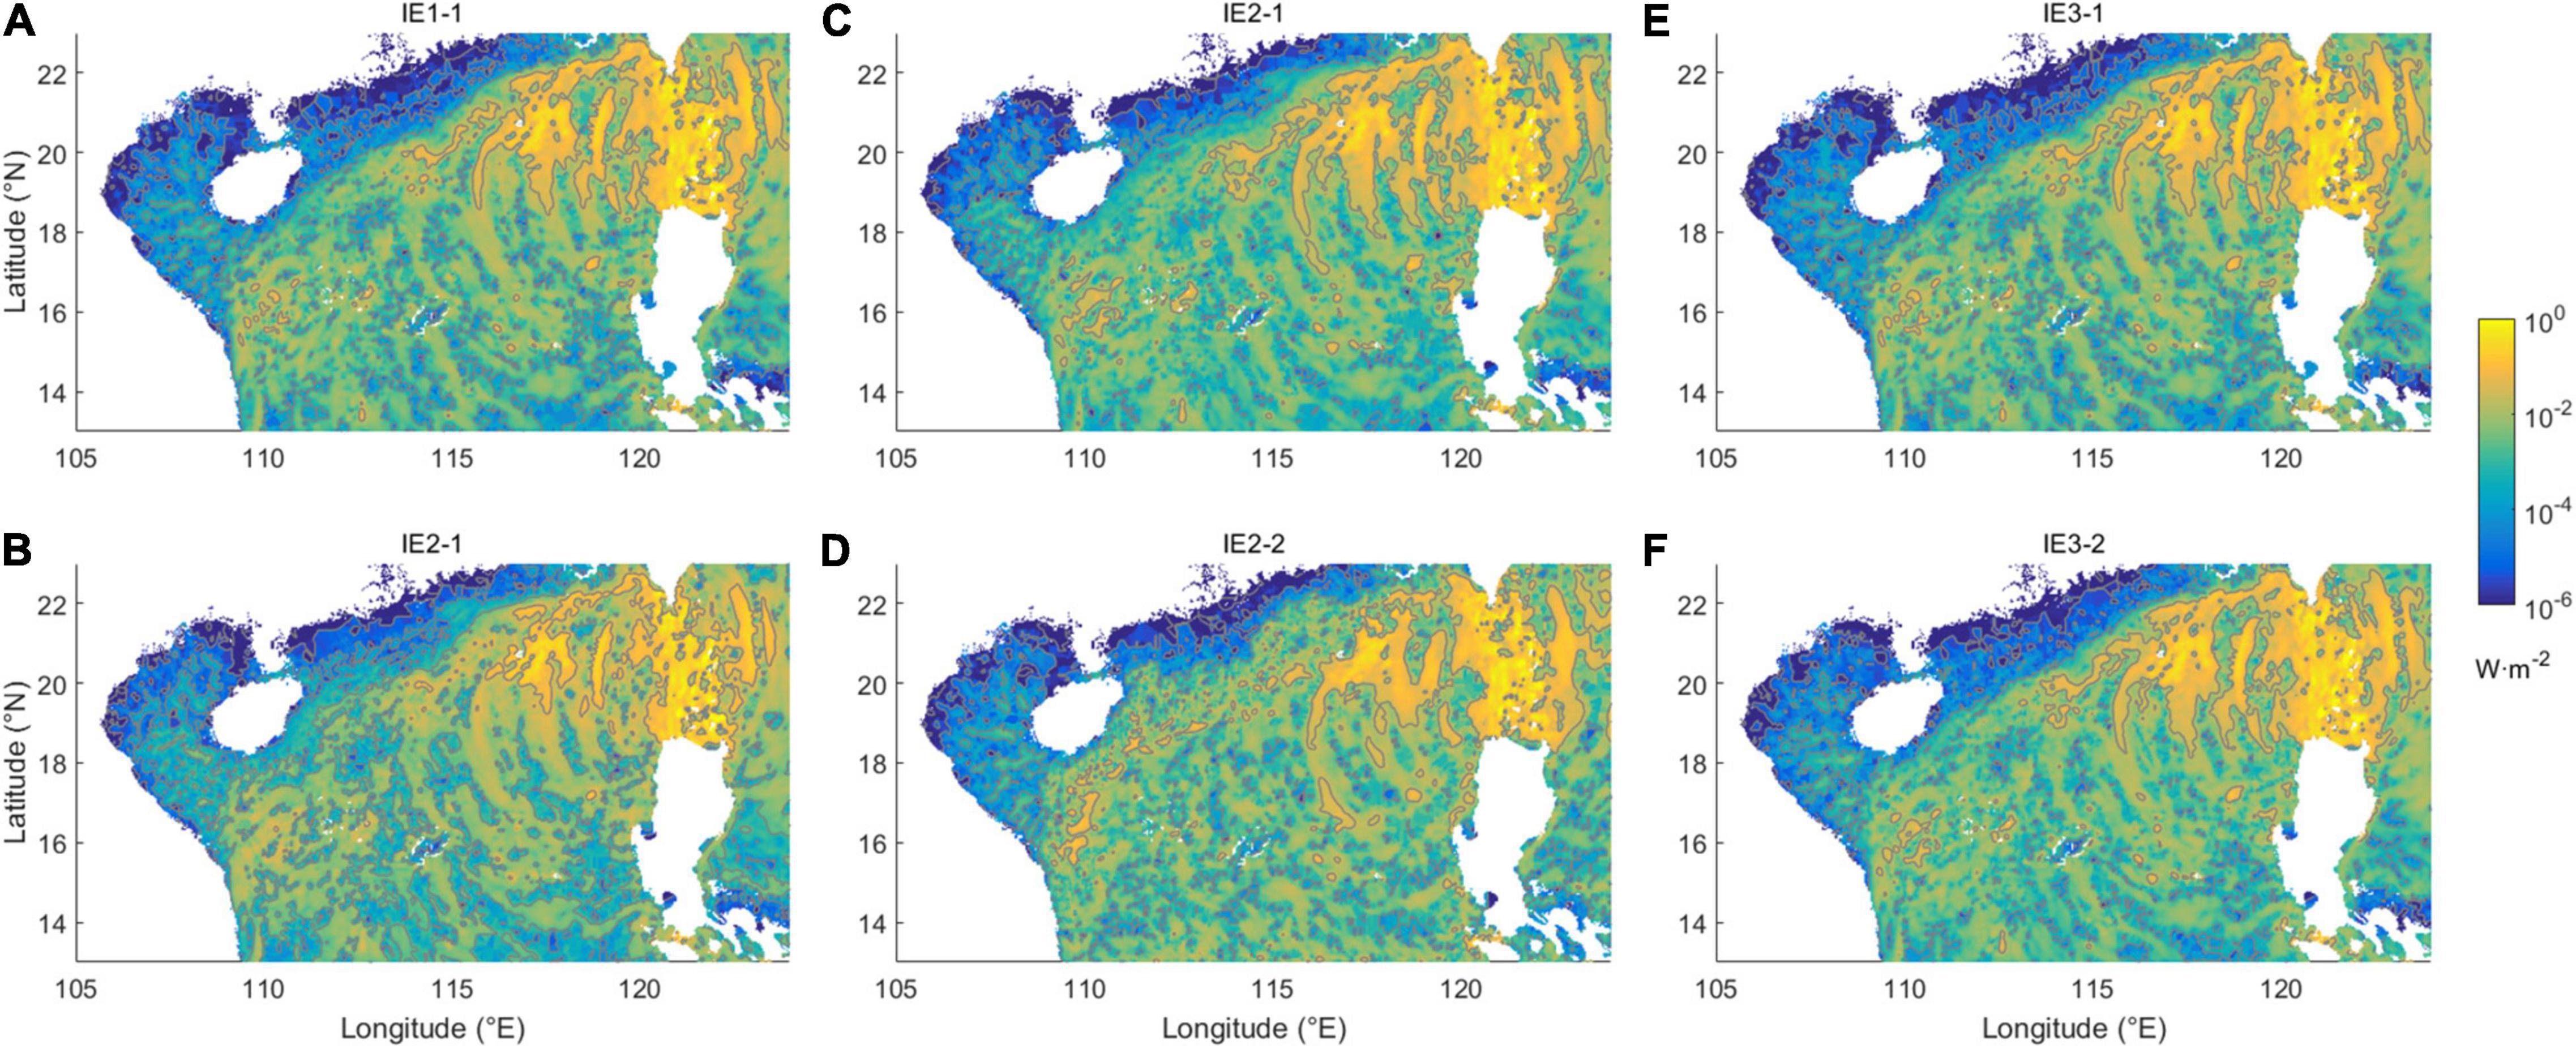
Figure 5. Depth-integrated dissipation rate (gray lines indicate dissipation of 0.5 Wm–2) for (A,B) IE1, (C,D) IE2, and (E,F) IE3.
It is interesting that except for IE2-2, the baroclinic tidal energy budget is close among each experiment. In IE2-2, the baroclinic tidal energy budget changes apparently. Previous studies found that variations of turbulent mixing can obviously affect stratification (Garrett, 2003; Drake et al., 2020; Delorme et al., 2021). Reinforcement of mixing can weaken the stratification or even destroy the structure of the pycnocline (Ivey, 2004). Changes of stratification may module the generation and dissipation of ITs. Figure 6A illustrates buoyancy frequency in the central of the LS (20.0°N, 121.0°E). Intensity of turbulent mixing greatly influences stratification. Stratification is weakened when mixing strengthened. When mixing raises to the magnitude of the observed maximum diffusivity, stratification will be destroyed or even absent, especially in the upper layer (above 400 m). Structure of the diapycnal diffusivity also plays an important role in influencing the vertical stratification. The three-dimensional distribution of the diapycnal diffusivity can significantly intensify stratification in the upper layer. Figures 6B–G display the vertically averaged density perturbation and vertical barotropic velocity in the center of the LS (20.0°N, 121.0°E). Variations of stratification can result in the alteration of density perturbation, but only to a small extent for experiments, except IE2-2. The amplitude of density perturbation is influenced and the phase difference between density perturbation and vertical barotropic velocity is either enlarged or engendered slightly. However, in IE2-2, the amplitude of density perturbation is obviously weakened and nearly loses the temporally varying trend, which can be attributed to the absence of stratification. Therefore, the conversion in IE2-2 is impaired evidently. When turbulent mixing keeps increasing and becomes strong enough to destroy stratification, the variation trend of density perturbation will be destructed and eventually, the generation of ITs will be affected significantly. In other words, the variation of stratification only can influence the conversion of ITs to a small extent until the stratification is destroyed by excessive strong mixing.
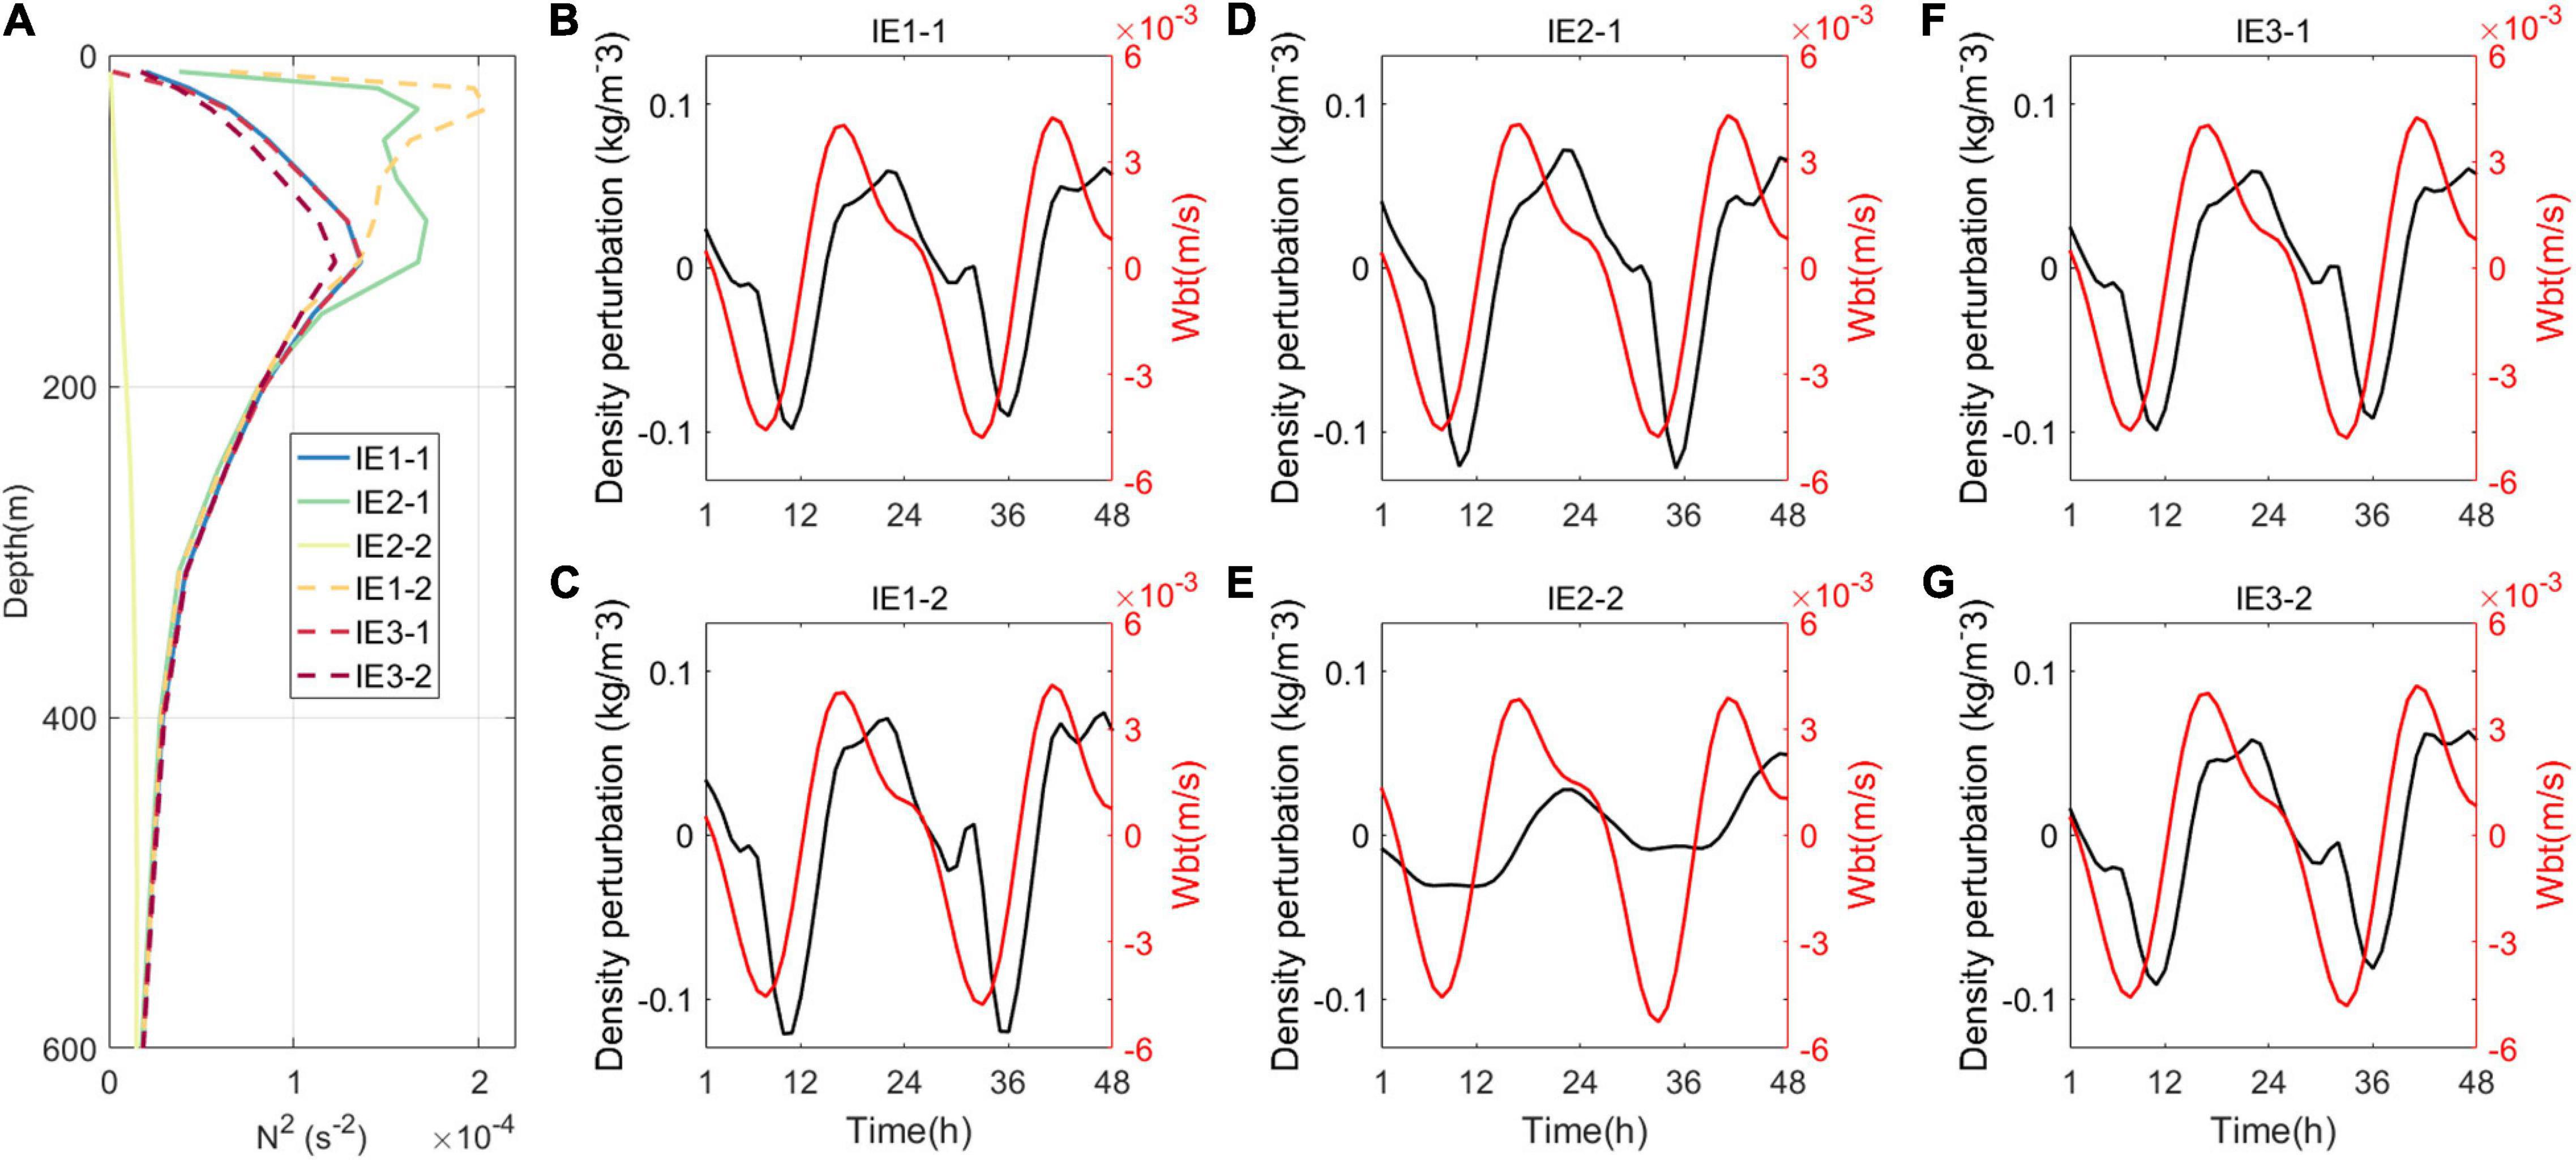
Figure 6. Distributions of (A) buoyancy frequency in the center of the Luzon Strait (LS) (20.0°N, 121.0°E) for two groups of experiments and vertically averaged density perturbation and vertical barotropic velocity at the same site for (B,C) IE1, (D,E) IE2, and (F,G) IE3.
Modulation on Incoherency of ITs
Turbulent mixing modulates the distribution of conversion and dissipation of ITs, which may influence local velocities. The baroclinic currents were calculated by removing the barotropic currents, which are represented by depth-averaged currents from the simulated currents. A fourth-order Butterworth filter was introduced to time series of baroclinic currents in diurnal (0.8–1.2 cpd) and semidiurnal (1.73–2.13 cpd) bands. Then, currents of diurnal and semidiurnal ITs can be obtained. Simulated results of the last 15 days are considered for analysis. To avoid errors from the band pass filter, results at the two ends (48 h for each end) are not included for investigation and only results in the 11 middle days are used. Figure 7 shows the eastward internal tidal currents in the northern SCS (20.0°N, 115.0°E) in diurnal and semidiurnal frequency bands. In the northern SCS, diurnal ITs are stronger than their semidiurnal counterparts. Distinctions in velocities exist among different experiments. For diurnal ITs, intensities and phases of velocity will change when different schemes of turbulent mixing are applied, especially for currents in the upper layer. Variations in phases of semidiurnal currents are also obvious and differences of semidiurnal velocities are evident in depths between 200 and 400 m. The variation of the current phase will make ITs in the SCS not totally phase locked with surface-tidal forcing at the LS, which may increase the incoherence.
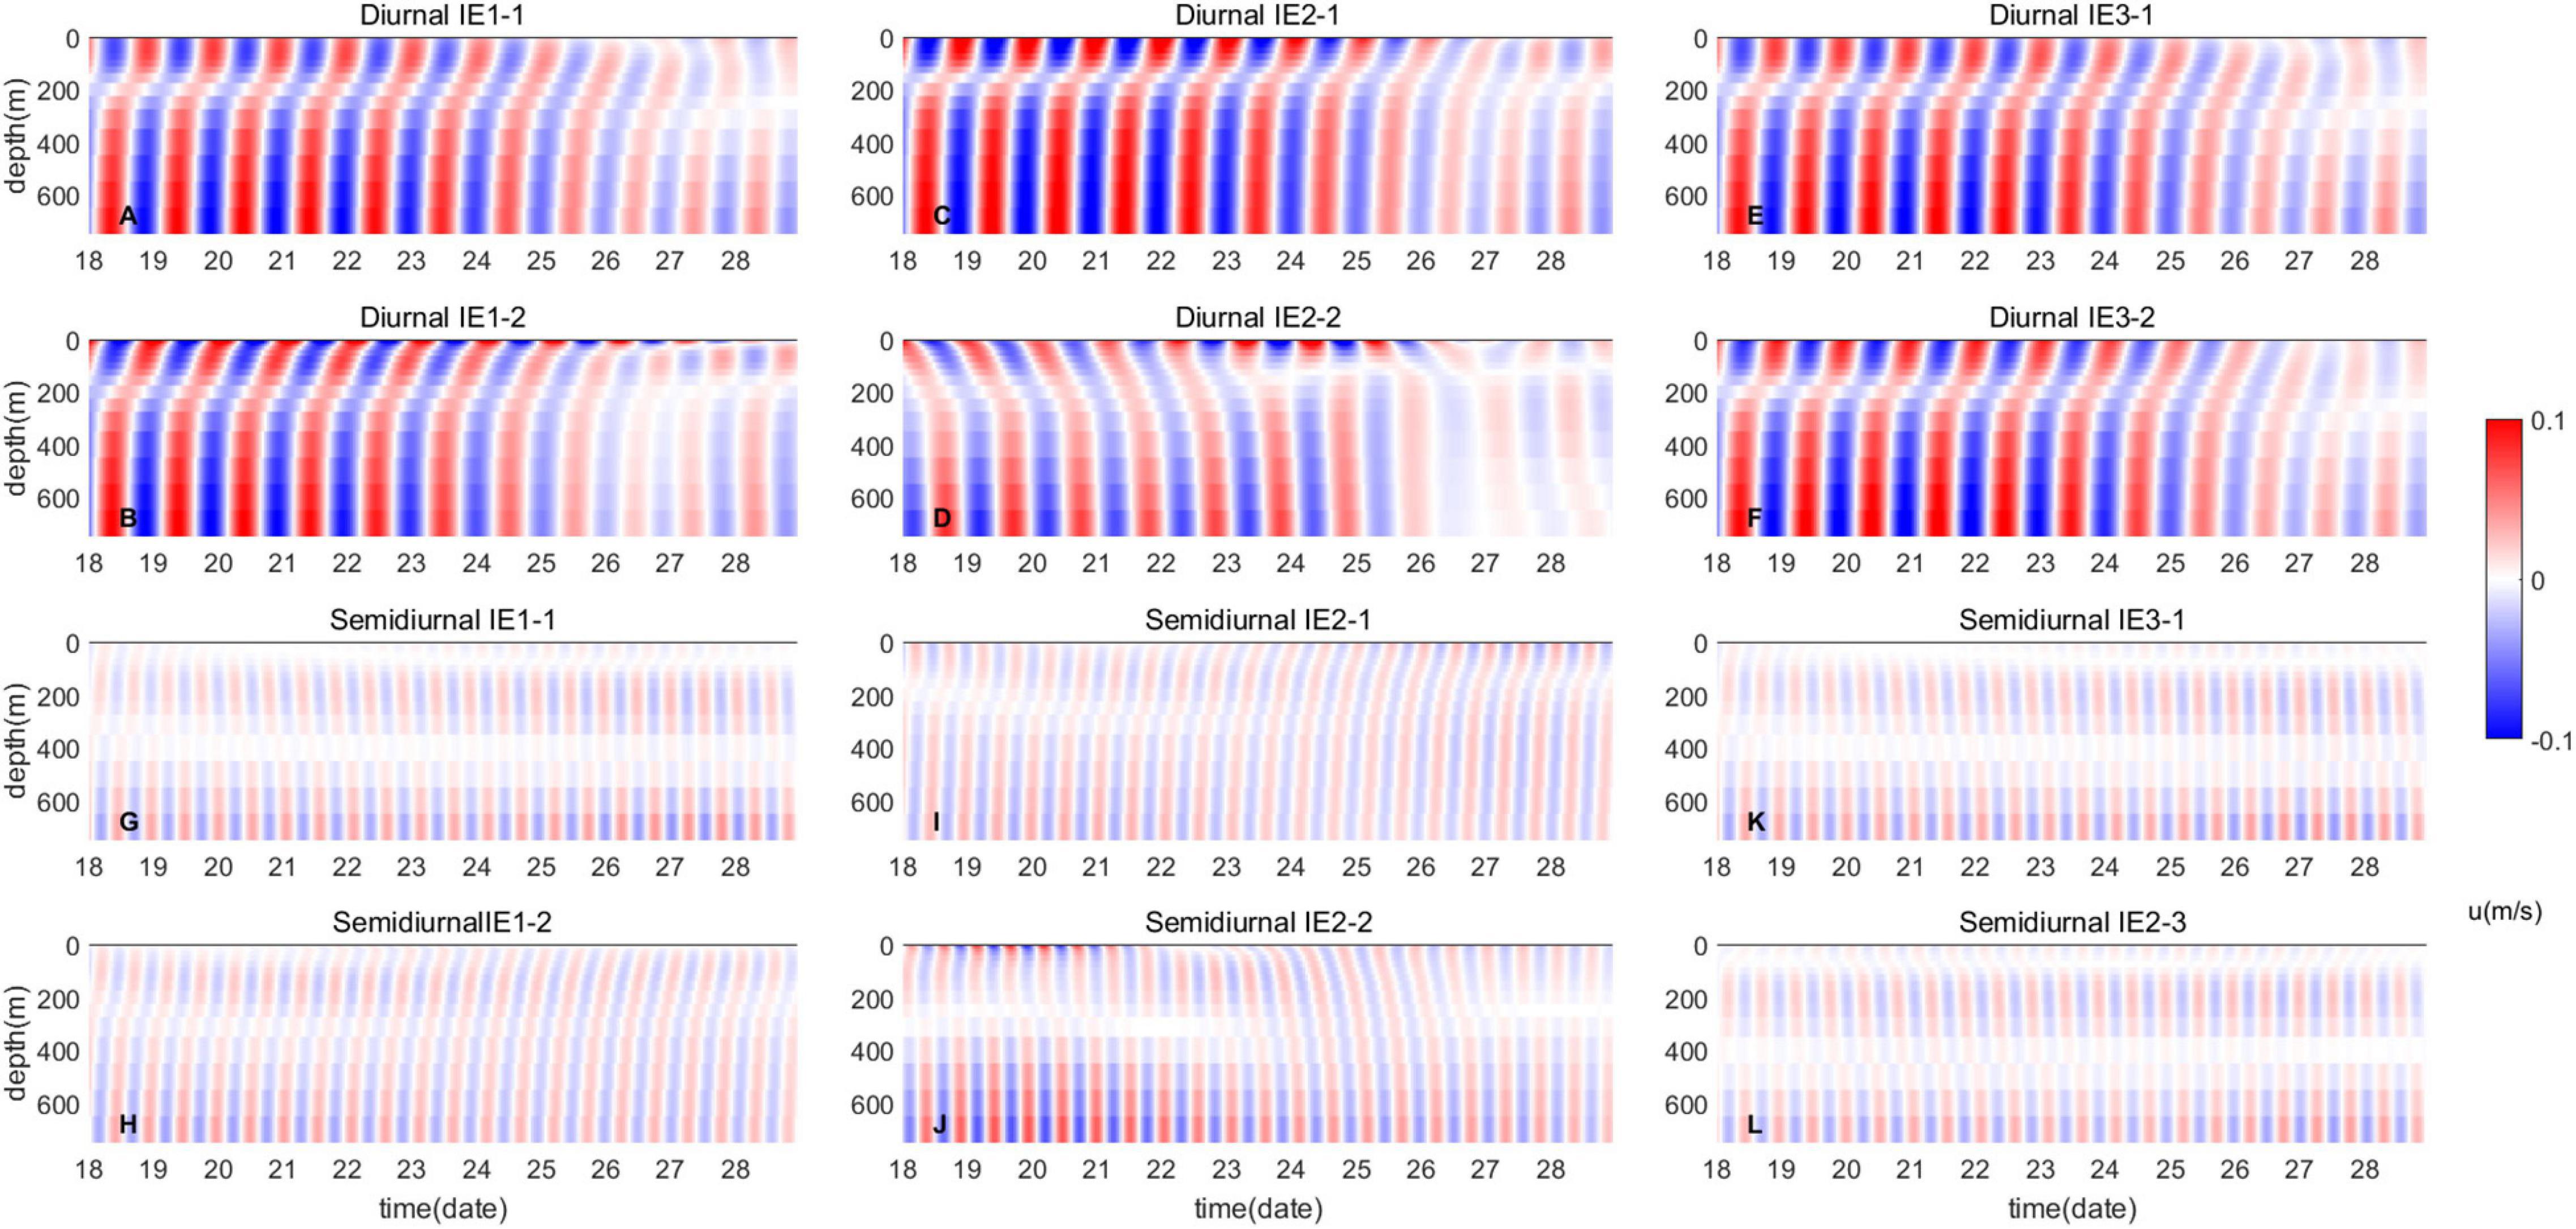
Figure 7. Distributions of eastward baroclinic current velocities in (A–F) diurnal and (G–L) semidiurnal frequency bands.
Incoherency of ITs in the west of SCS (sites C and N in Figure 8) is calculated. Based on the least square method, harmonic analysis was applied to baroclinic currents to extract coherent ITs. Incoherent ITs were obtained by subtracting the coherent ITs from the band pass filtered baroclinic tidal currents. Vertically and temporally averaged incoherency of diurnal and semidiurnal ITs at sites C and N are shown in Table 3. In these sites, the incoherence varies among different experiments, indicating turbulent mixing can modulate the incoherency of ITs. Except IE2-2, incoherency is larger when the three-dimensional structure of the diapycnal diffusivity is employed for both the diurnal and semidiurnal ITs in the northern site (site C). The incoherency in IE1-2 can be as large as two times of those in other experiments. Meanwhile, for the southern site (site N), incoherency of ITs has no evident difference among idealized experiments, also except IE2-2. To investigate the difference in incoherency between sites C and N, density anomaly in each experiment is calculated according to:
where, ρh is the mean density in each layer. Distributions of density anomaly at the end of simulation duration at 100 m depth are shown in Figure 8. The horizontal variations of density can lead to the incoherence of ITs (Li et al., 2020). Differences of density anomaly emerge when turbulent mixing changes, which further influence the incoherence of ITs. χ2 test method is applied to investigate the differences in density anomaly between site C and site N. The χ2 test results indicate that density anomaly has a significant difference (p < 0.01) at these two sites in IE1-2, IE2-1, and IE3-2. Meanwhile, in other experiments, differences of density anomaly are insignificant. Differences in incoherency between site C and site N are also more obvious in experiments with significant χ2 test results, which indicate differences of density anomaly that lead to the corresponding variations in incoherency. We noticed that difference in incoherency of diurnal ITs between site C and site N in IE2-2 is large, but results of χ2 test indicate that the difference is insignificance and the incoherency in IE2-2 is much larger than that in other experiments. In addition to the influence of horizontal variation of density, the evident incoherence of ITs in IE2-2 can also possibly be attributed to the absence of vertical stratification. The excessive strong mixing in IE2-2 destroys the stratification (Figure 6A), whereas damage of stratification could possibly influence the propagation of ITs, which may change the amplitude and phase of ITs and eventually add incoherence to ITs.
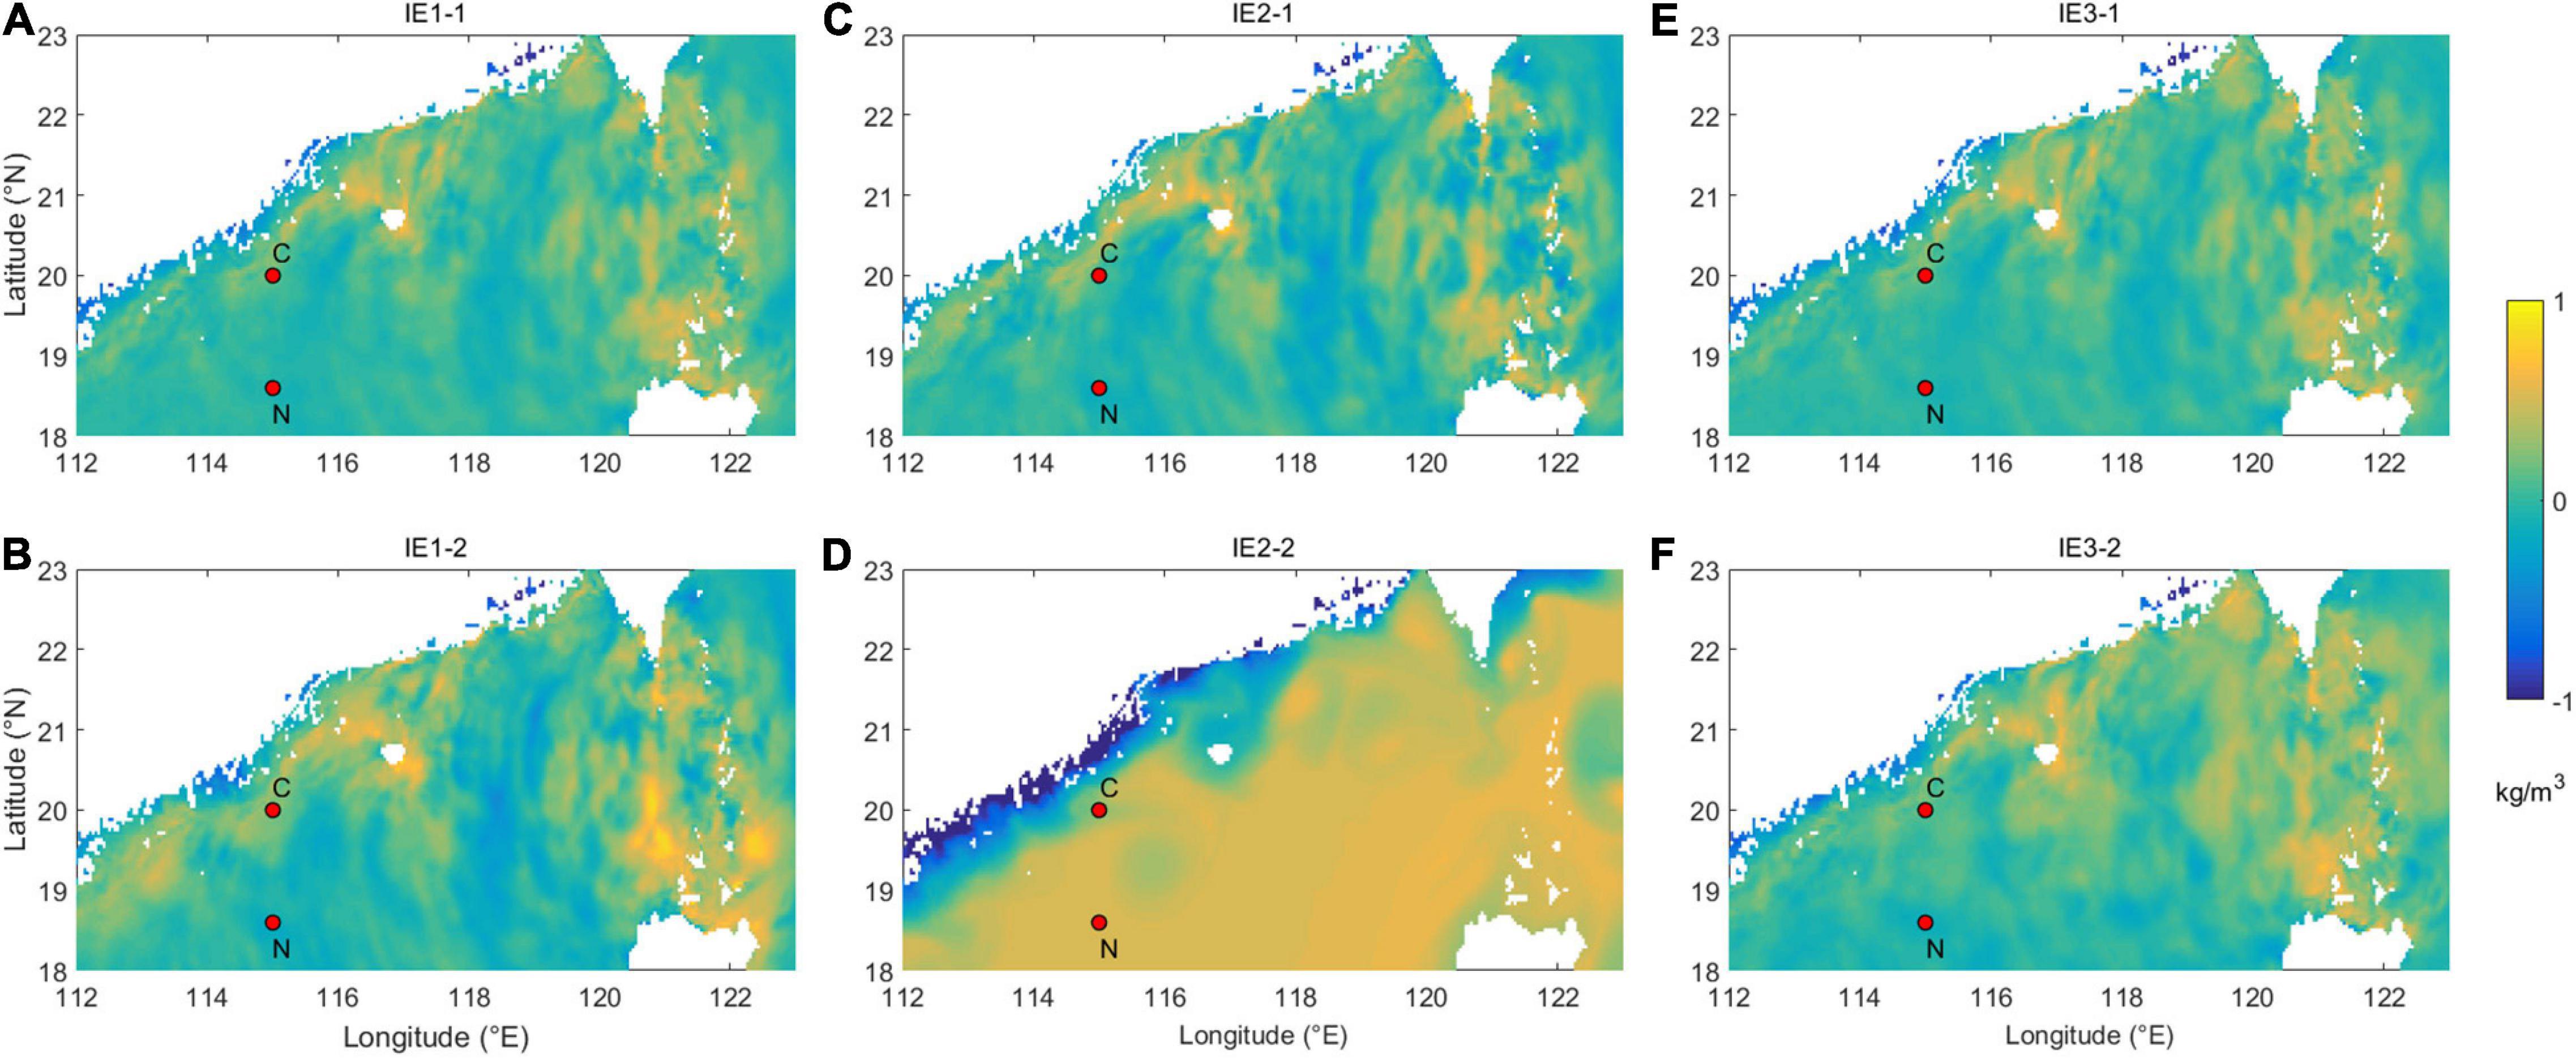
Figure 8. Distributions of density anomaly at the end of simulation duration at 100 m depth for (A,B) IE1, (C,D) IE2, and (E,F) IE3.

Table 3. Vertical and temporal averaged incoherency of diurnal and semidiurnal internal tides (ITs) at sites C and N in all the experiments.
Incoherency of ITs can be influenced by background currents and mesoscale eddies. Moreover, background currents and mesoscale eddies are thought as essential factors, which modulate the incoherent feature of ITs. The mesoscale eddies can increase the intensity of background currents and induce horizontal variations of density, which would eventually add incoherence to ITs (Li et al., 2020). But, the relationship between incoherency of ITs and turbulent mixing has rarely been discussed. Our findings suggest that turbulent mixing can also increase incoherence of ITs (site C in IE2-1) by changing horizontal density in the ocean. Figure 9 shows eastward velocities of diurnal ITs, coherent signals, and incoherent signals at the depth of 100 m at site C. Figure 10 demonstrates the results of semidiurnal ITs. The variation in horizontal density modulates incoherency of both the diurnal and semidiurnal ITs largely by changing the internal tidal amplitudes. In addition, phases of ITs are also slightly affected.
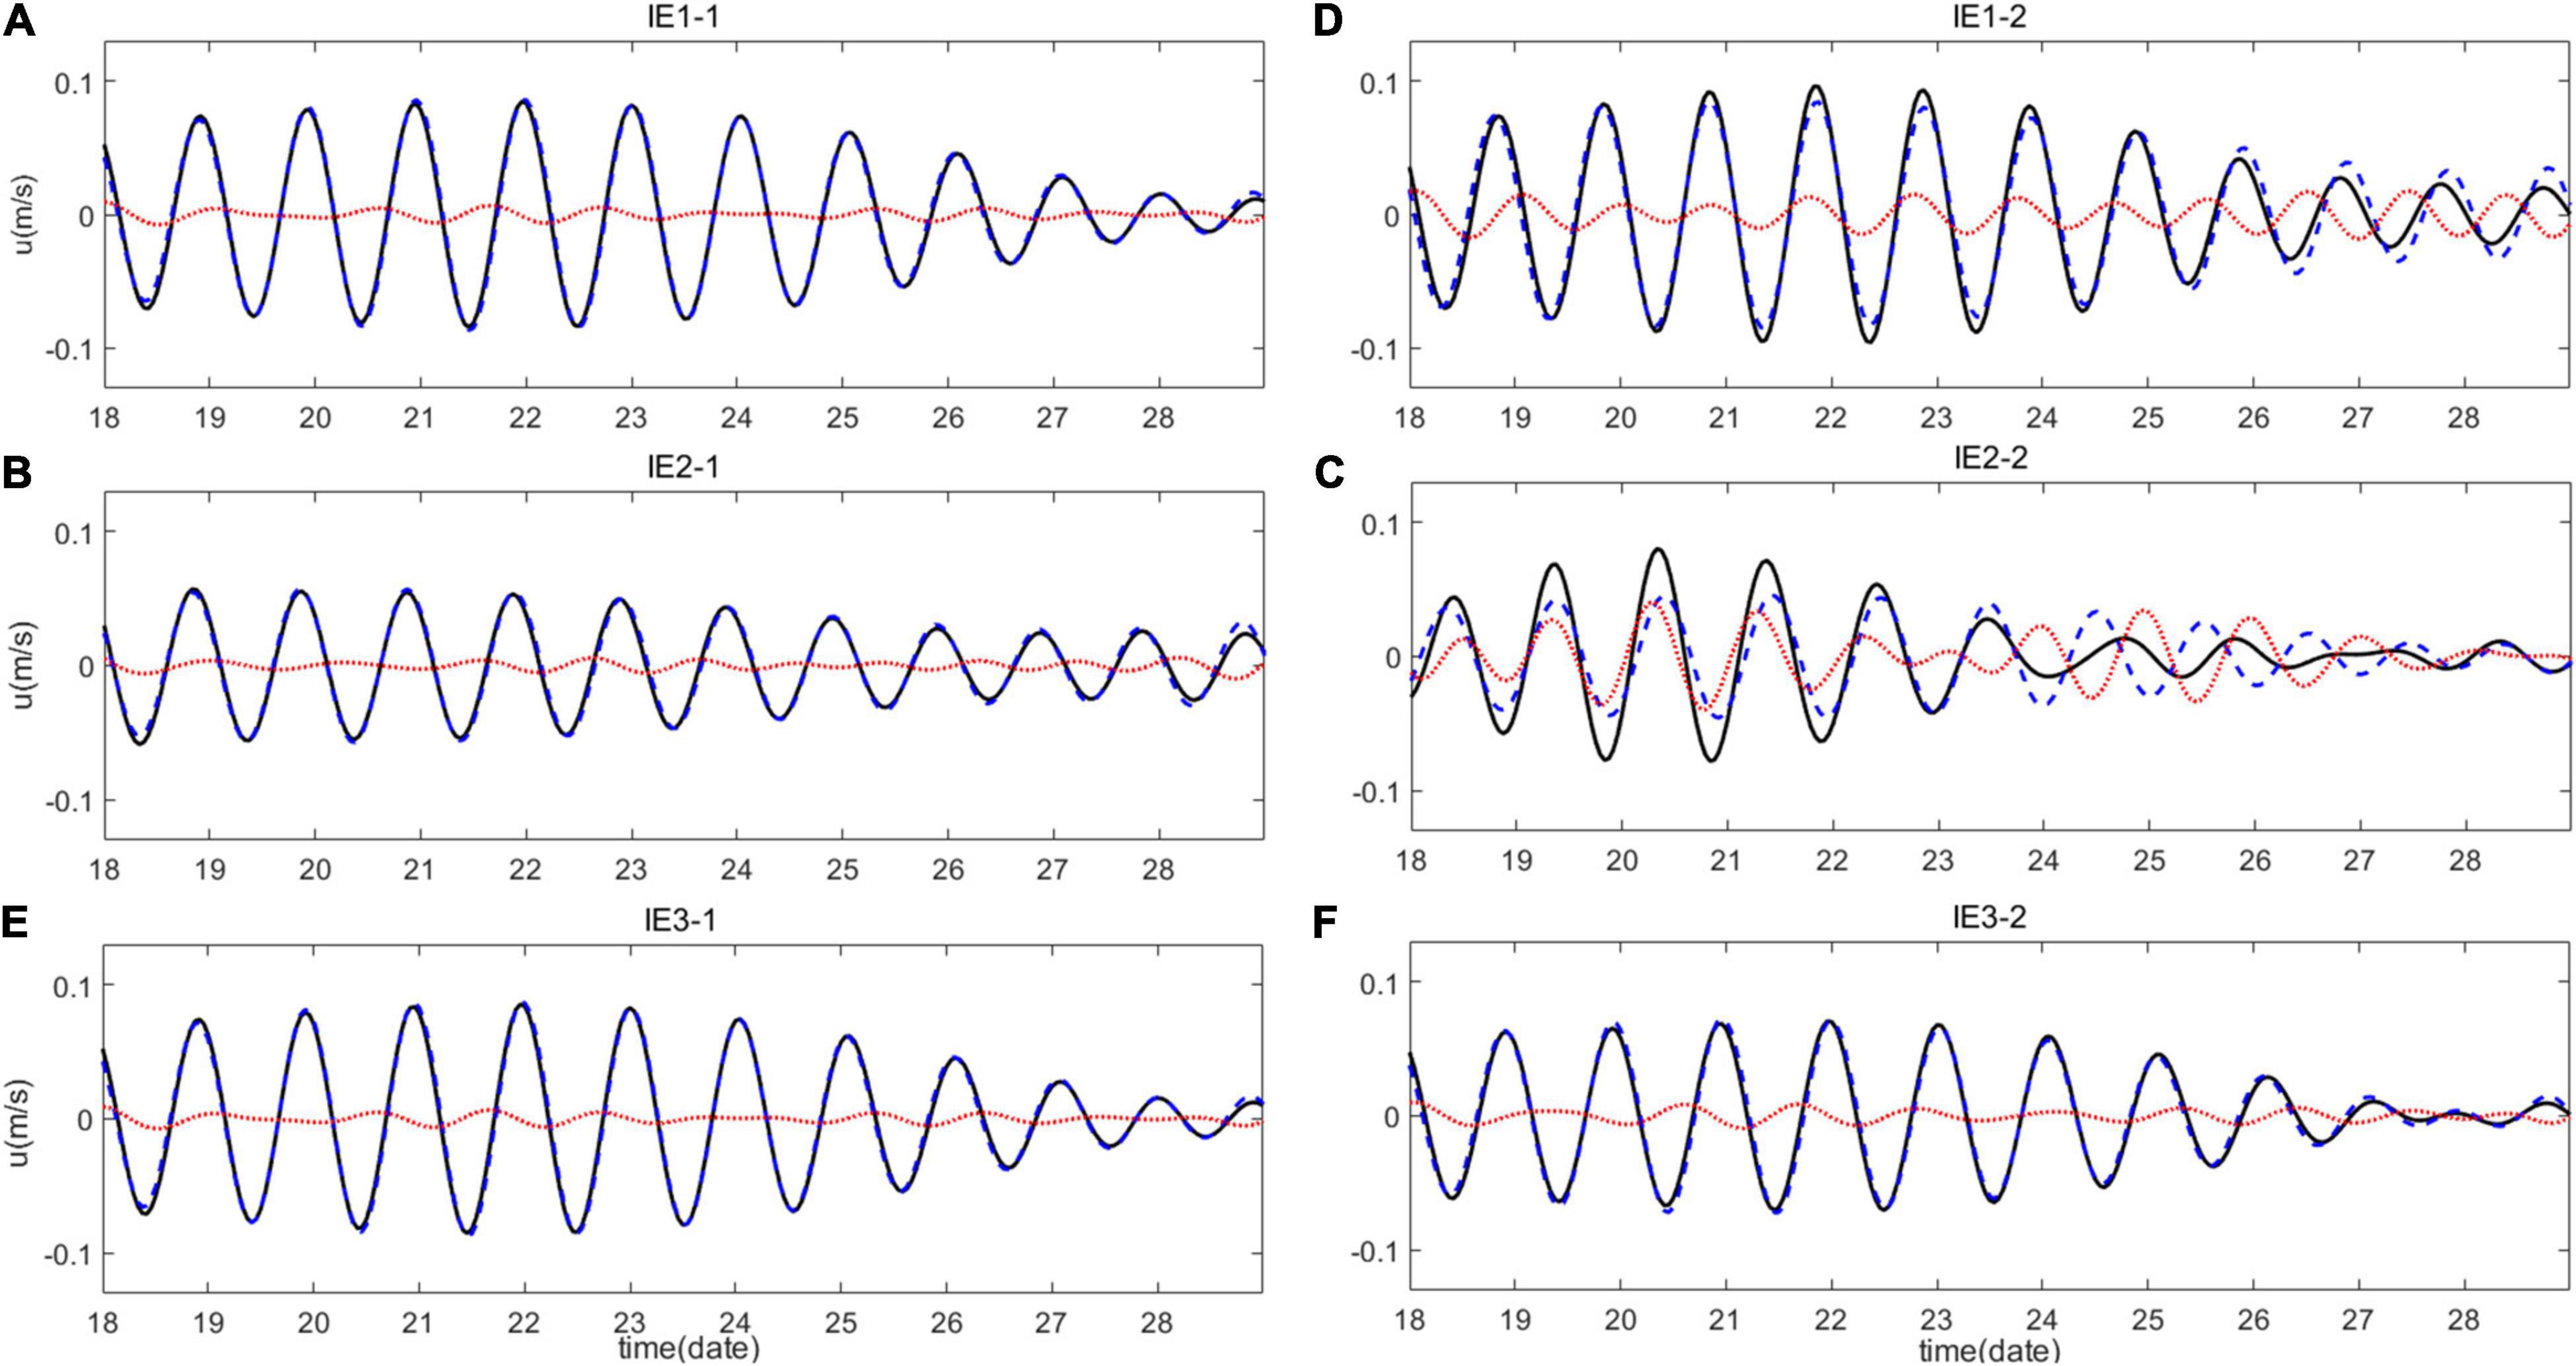
Figure 9. Eastward velocities of diurnal baroclinic tides (black solid line), coherent signals (blue dashed line), and incoherent signals (red dot line) at the depth of 100 m for experiments in (A,B) IE1, (C,D) IE2, and (E,F) IE3 at site C.
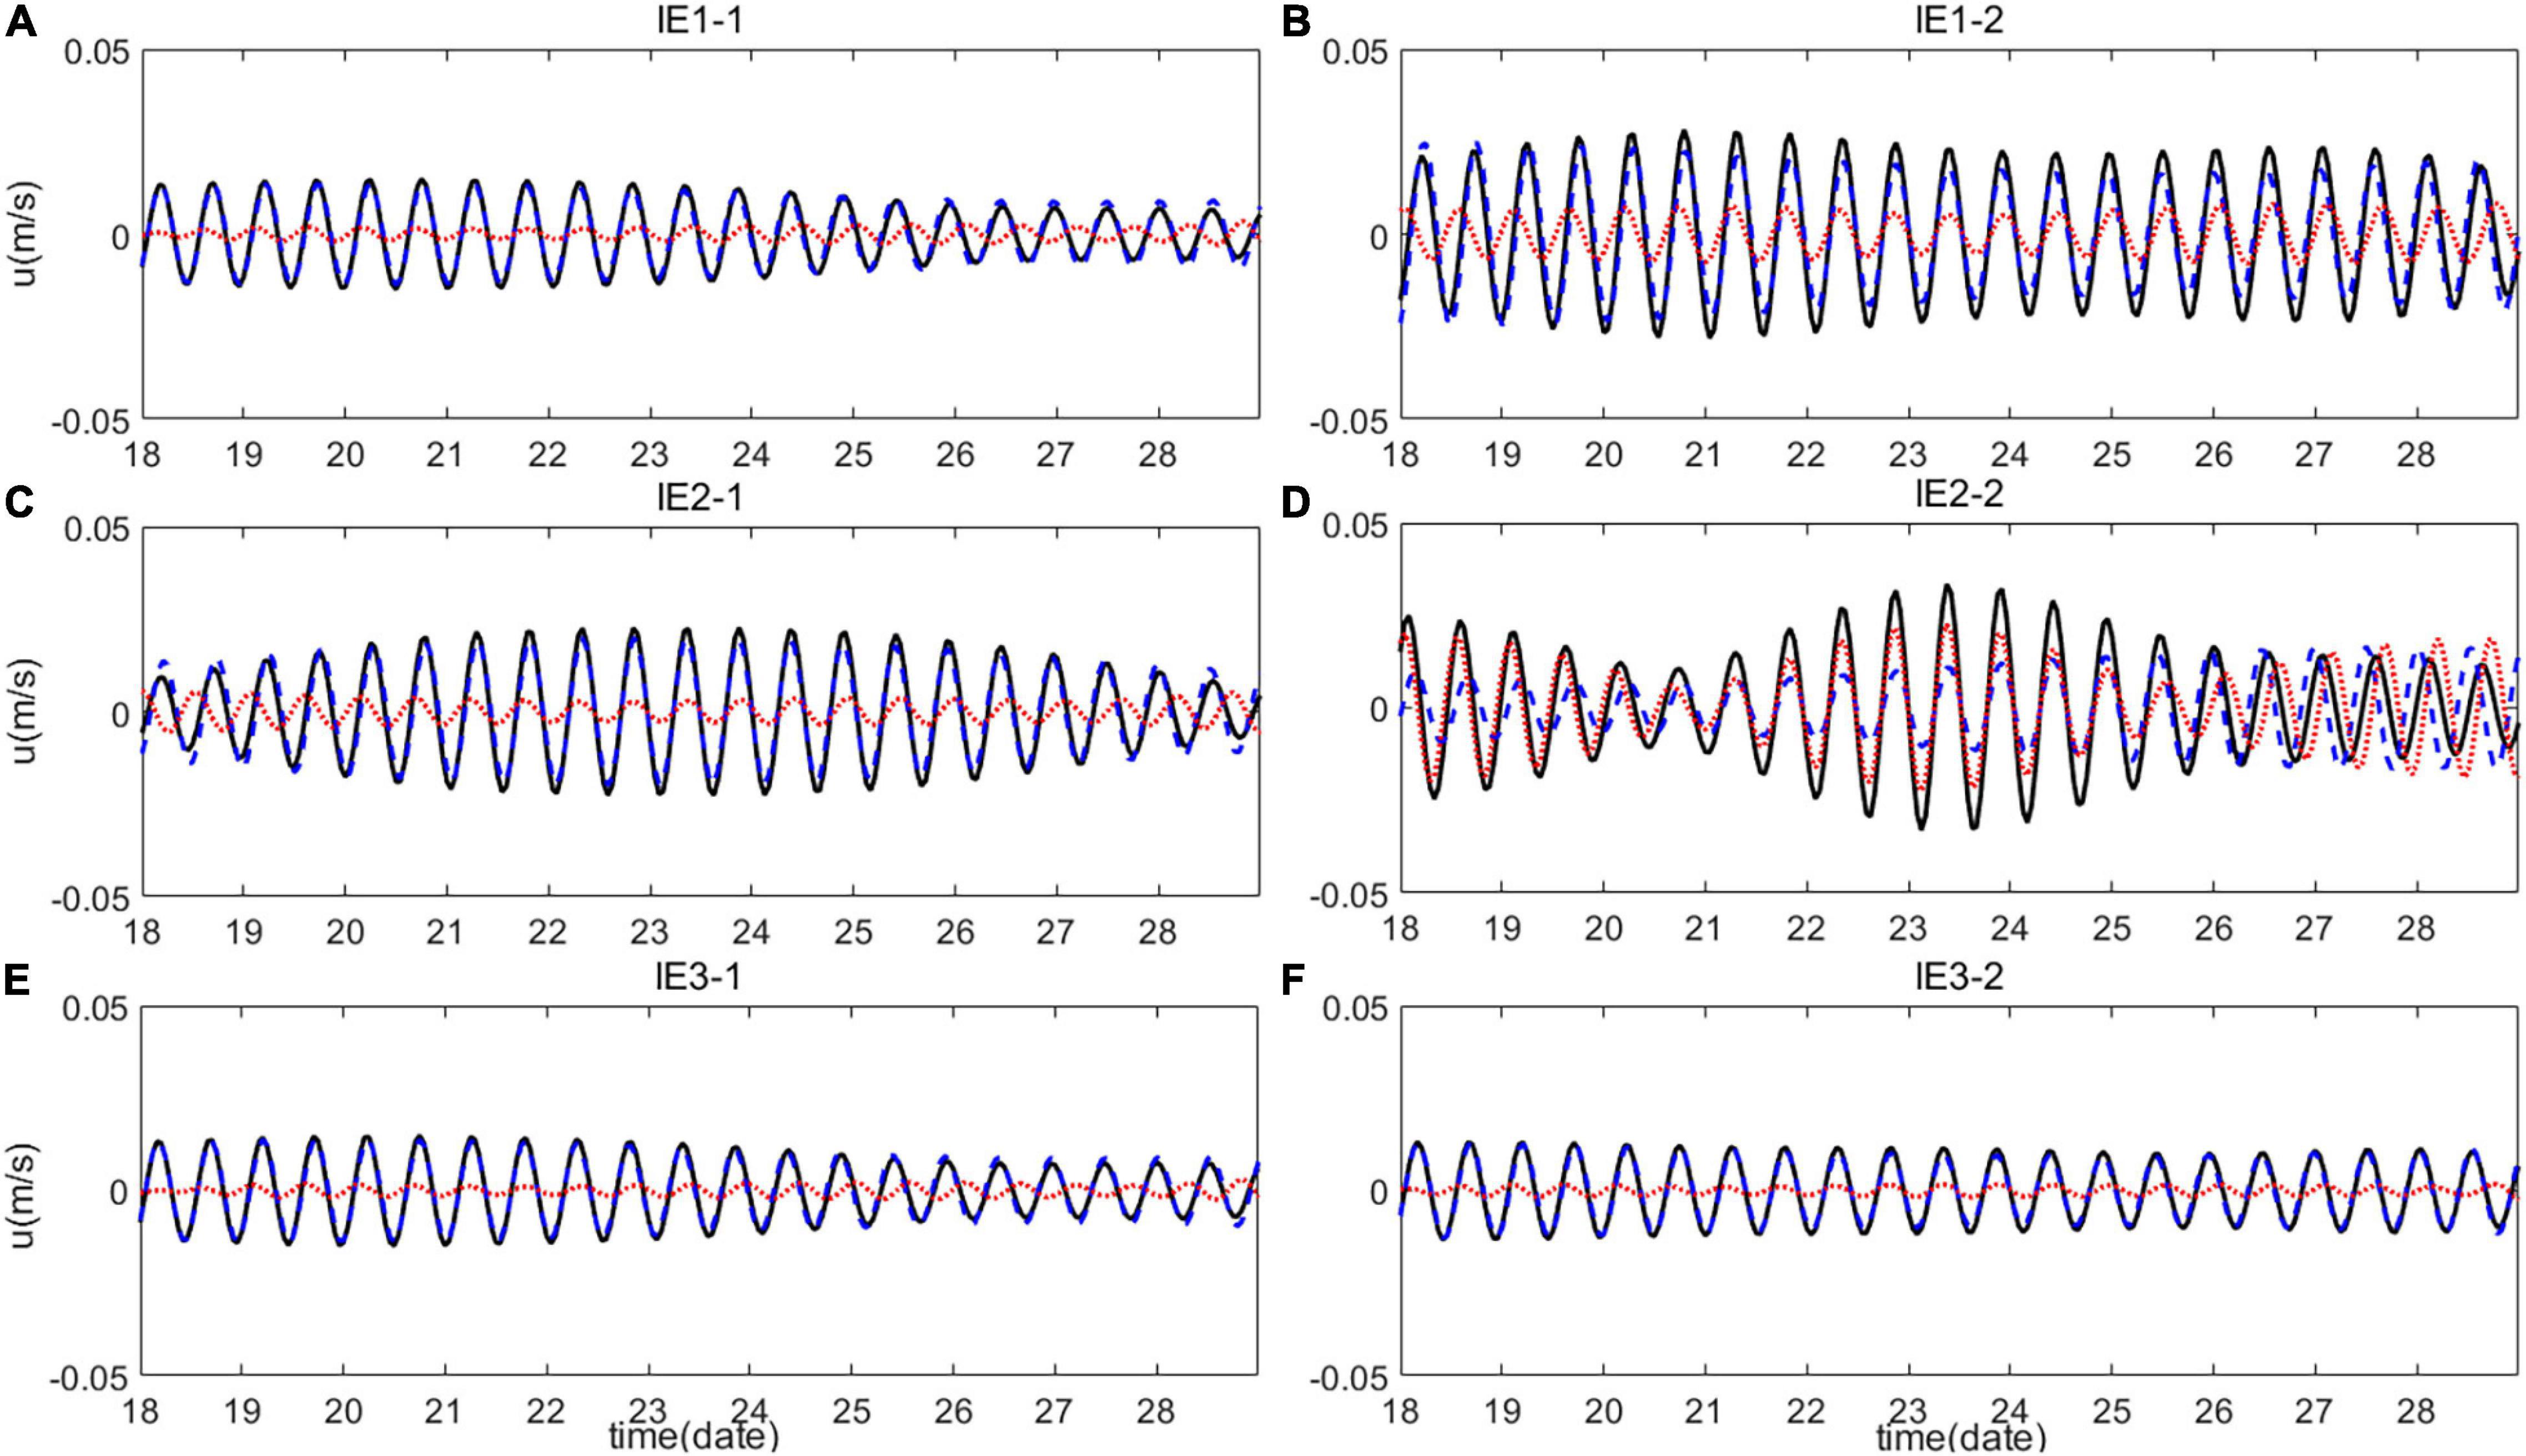
Figure 10. Eastward velocities of semidiurnal baroclinic tides (black solid line), coherent signals (blue dashed line), and incoherent signals (red dot line) at the depth of 100 m for experiments in (A,B) IE1, (C,D) IE2, and (E,F) IE3 at site C.
Modulation of Nonlinear Interactions Among Different Tidal Components
Previous studies found that both the terdiurnal and quarterdiurnal constituents can be generated from nonlinear interactions of ITs in the SCS (Xie et al., 2010). Xie et al. (2010) found that the intensity of M2 plays important role in those nonlinear interactions. Currents of higher harmonic components of ITs are extracted by applying band pass filter (with cutoff frequency band between 2.8 and 4.2 cpd, which contains principle overtides of MK3, MO3, and M4) to time series of simulated baroclinic currents. The kinetic energy (KE) of overtides for per unit volume is calculated according to:
where, ρ0 = 1,025 g⋅cm–3 is the mean density of the sea water and ut and vt are filtered eastward and northward components of overtides. Temporally averaged KE at sites A to E (Figure 11A) is shown in Figures 11B–F. At all these sites, differences in KE among experiments in which the diapycnal diffusivity is set to be homogeneous are larger than those of experiments in which varying spatial structure is applied. This suggests that the variation in intensity of turbulent mixing has more effect on the interaction of ITs. KE in IE2-2 is nearly the smallest among those sites and KE in IE2-1 is larger at most depths, indicating that the elevation of turbulent mixing works against the nonlinear interactions among ITs and the reduction of mixing intensity is in favor of the nonlinear interactions.
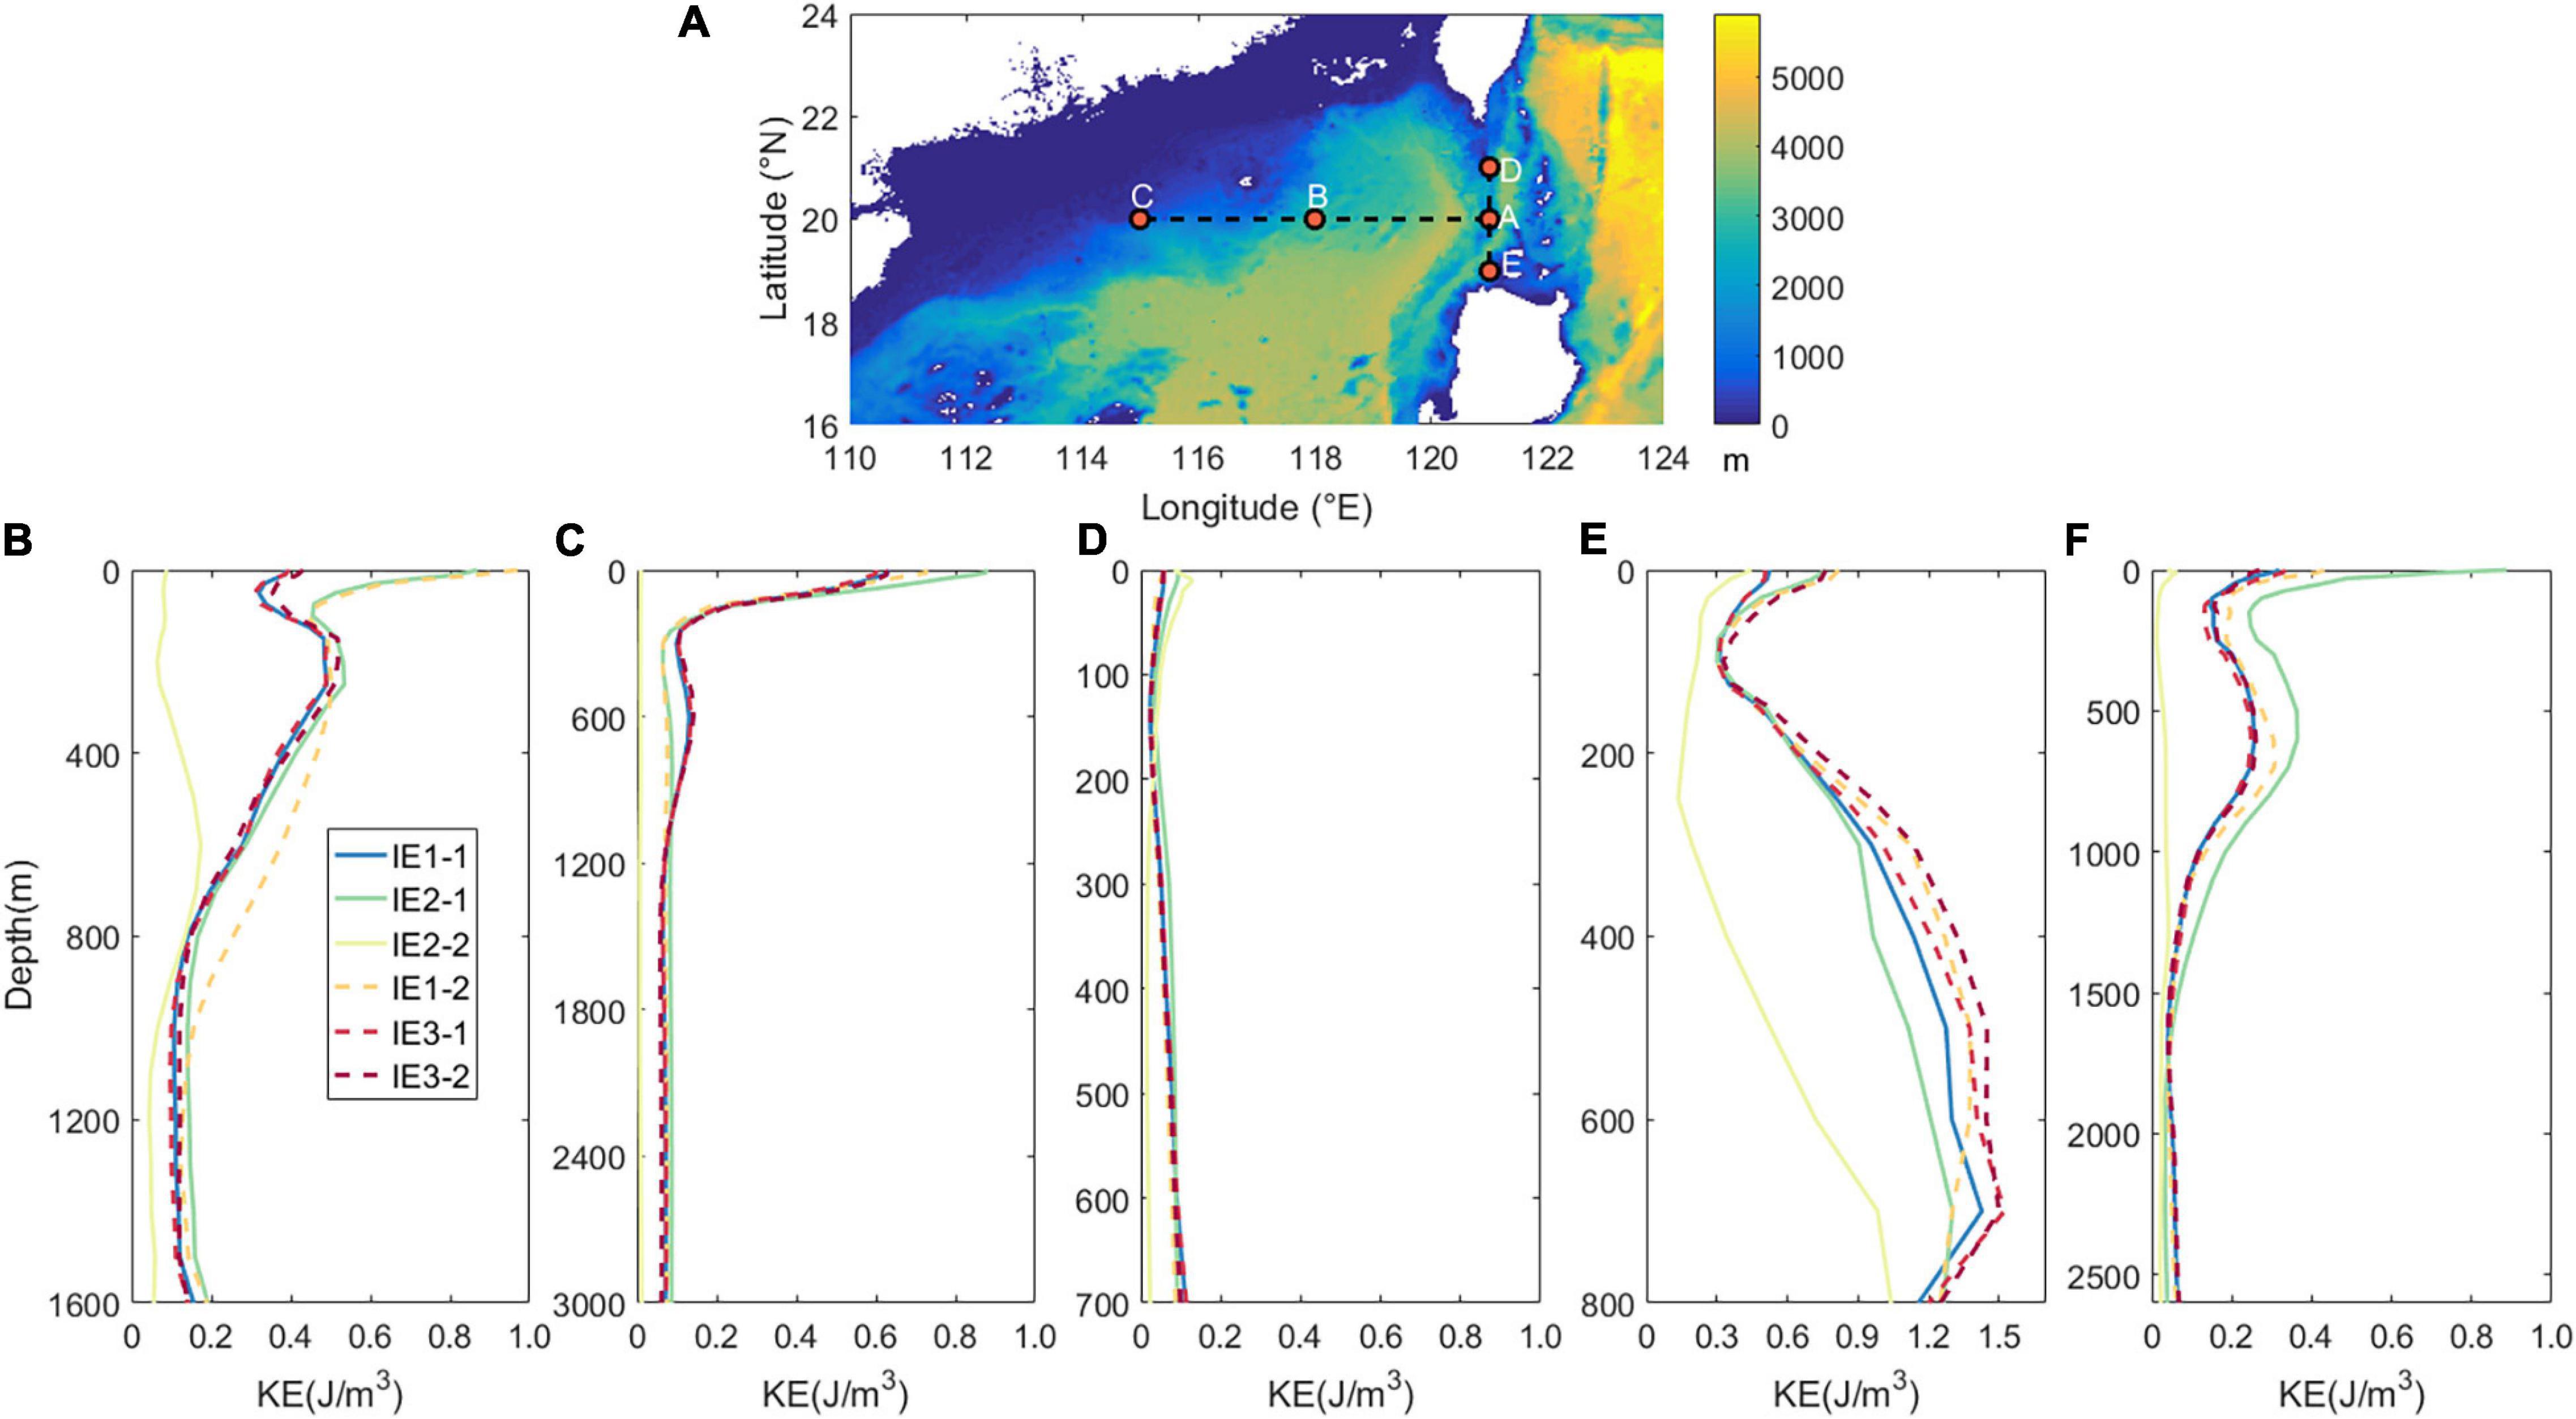
Figure 11. (A) Topography in the northern South China Sea (SCS), positions of sites A to E, and temporally averaged baroclinic kinetic energy (KE) of overtides at (B–F) sites A to E.
It is interesting to note that overtides in the LS are stronger than those in the SCS. During the propagation from sites A to C, energy of overtide decreases at most depths. This suggests that strength of overtide decays during propagation. Based on observations, Xu et al. (2013, 2014) also found that quarterdiurnal ITs on the continental slope in the northwestern SCS are weaker than those in the deep basin on the west of the LS. Empirical orthogonal function (EOF) analysis is applied to baroclinic currents of overtides in IE1-1. The leading EOF modes (explaining more than 70% of total variance) are shown in Figure 12. At site A, in the eastward direction, the first and the second EOF modes can explain 63 and 19% of the total variance, respectively, and the first and the second EOF modes correspond to the first and the third baroclinic modes, respectively. In the northward direction, mode I, which corresponds to the first baroclinic mode, contributes more than 70% of the total variance. At sites D and E, which are also located near the LS, more than 70% of the total variance of currents in the eastward direction need to be explained by two EOF modes, which correspond to the second and the first baroclinic modes, respectively. Modes in the northward direction are more complicated. At site D, the top two EOF modes correspond to the first and the second baroclinic modes, respectively. But, the first and the second EOF modes in site E are equal to the third and the second baroclinic modes, respectively. Meanwhile, at the sites in the SCS (B and C), the first EOF mode, which is equivalent to the first baroclinic mode, can contribute more than 70% of the total variance. Generally, sites near the LS have higher modes than those in the SCS. The overtides are generated at the LS and have higher vertical modes, which are more likely to dissipate during propagation. Therefore, the intensity of overtides may decrease significantly during the propagation from the LS to the SCS.
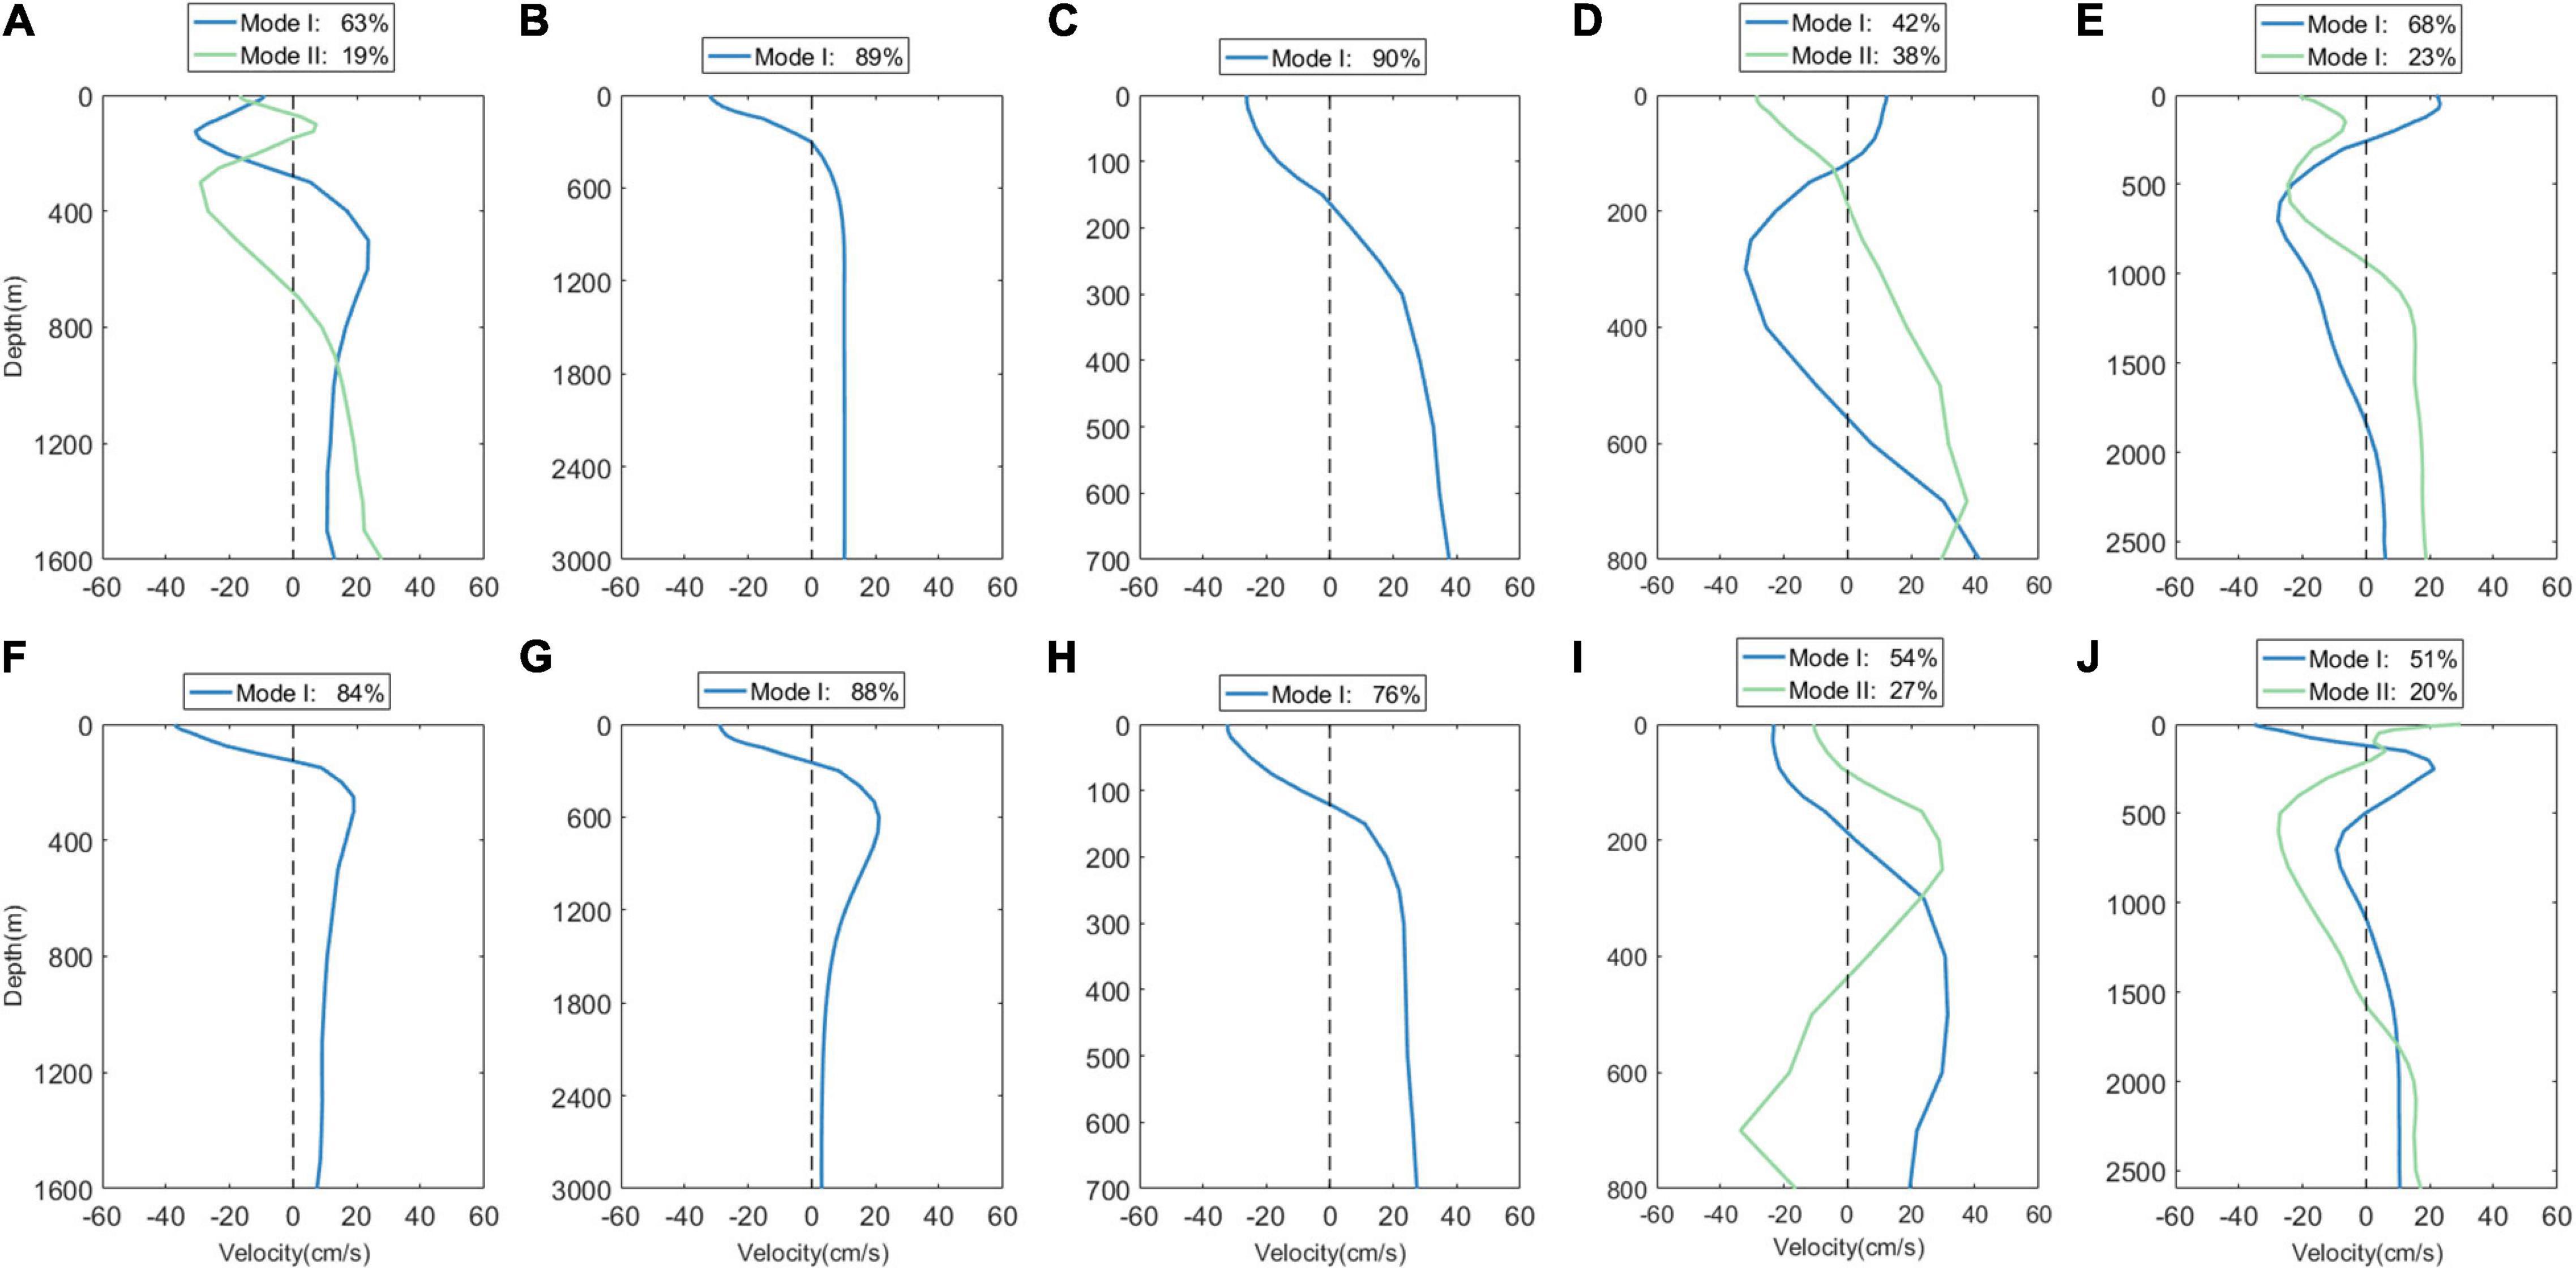
Figure 12. Empirical orthogonal function (EOF) modes of eastward velocity of overtides at (A–E) sites A to E and corresponding results of (F–J) the northward velocity.
Summary and Discussion
In this study, modulations of ITs on the baroclinic tidal energy budget, the incoherency, and the nonlinear interactions among different tidal components by turbulent mixing are investigated through numerical simulations. The spatial structure of turbulent mixing can hardly influence the baroclinic tidal energy budget. In addition, change in the mixing intensity in a reasonable range also cannot obviously affect the total baroclinic energy converted or dissipated in the LS and the SCS. However, excessively strong mixing will destroy the vertical stratification, the variation trend of density perturbation will be destructed, and eventually, the generation of ITs will be affected significantly. Meanwhile, the dissipation rate will also change apparently, when turbulent mixing keeps increasing and becomes strong enough to destroy stratification. Comparing to the baroclinic tidal energy budget, the influence on distributions of conversion and dissipation is more evident when turbulent mixing changes. Distinction of conversion distribution is largely concentrated near the SCS, while alteration of dissipation distribution is more apparent in the LS. Moreover, modulation on the distribution of dissipation is more apparent than that of conversion.
The relationship between incoherency of ITs and turbulent mixing is also explored. The findings suggest that in addition to background currents and mesoscale eddies, turbulent mixing can also increase incoherence of ITs. Variations of turbulent mixing change horizontal density in the ocean. The horizontal variations of density add incoherence to ITs largely by changing the internal tidal amplitudes. Moreover, variation of mixing intensity modulates the nonlinear interactions among different components of ITs. Elevation of mixing intensity works against the nonlinear interactions and the reduction of mixing intensity is in favor of the nonlinear interactions. However, the structure of turbulent mixing can hardly influence the interaction among ITs. We also find that overtides decrease evidently during the propagation from the LS to the SCS. For the overtides, they are generated at the LS and have higher vertical modes, which are more likely to dissipate during propagation.
It is notable that the baroclinic tidal energy budget can hardly be affected by mixing structure and the spatial structure of turbulent mixing also has little effect on the nonlinear interaction among ITs. The nonlinear interactions are modulated by the mixing intensity. Therefore, the influence of mixing structure can be neglectable in most of the internal tidal simulations. and the diapycnal diffusivity can set to be horizontally and vertically homogeneous. Vertical stratification will be destroyed when turbulent mixing is excessively strong. The damage of stratification greatly influences the conversion and dissipation of ITs. Therefore, excessive strong mixing needs to be avoided. Considering that the observed minimum and mean value of the diapycnal diffusivity in the SCS are 9.3 × 10⁻⁶ m2s–1 and 1.7 × 10⁻³ m2s–1, which are close to O (10–5) m2s–1 and O (10–3) m2s–1, respectively, the optimum range of the diapycnal diffusivity in the SCS is more appropriate to be from O (10–5) to O (10–3) m2s–1 for IT simulations. However, the spatial structure of turbulent mixing can modulate the incoherency of ITs. Consequently, the spatial structure of the diapycnal diffusivity should be considered when the incoherency of ITs needs to be simulated.
Data Availability Statement
The raw data supporting the conclusions of this article will be made available by the authors, without undue reservation.
Author Contributions
LD and XL designed the research. BL and SP performed the research. BL wrote the manuscript. XM and YY analyzed the data. All authors contributed to the article and approved the submitted version.
Funding
This study was funded by the National Natural Science Foundation of China (Grant Nos. 42006024, 42076011, and U1806214). The Major Projects of the National Natural Science Foundation of China (Grant Nos. 41931182 and U20A20105), Guangdong Key Project (2019BT02H594), Key Special Project for Introduced Talents Team of Southern Marine Science and Engineering Guangdong Laboratory (Guangzhou, Grant No. GML2019ZD0303), Guangxi Key Research Program (Grant No. AB18294047), and the MNR Program on Global Change and Air-Sea Interactions (Grant No. GASI-04-WLHY-03).
Conflict of Interest
The authors declare that the research was conducted in the absence of any commercial or financial relationships that could be construed as a potential conflict of interest.
Publisher’s Note
All claims expressed in this article are solely those of the authors and do not necessarily represent those of their affiliated organizations, or those of the publisher, the editors and the reviewers. Any product that may be evaluated in this article, or claim that may be made by its manufacturer, is not guaranteed or endorsed by the publisher.
Acknowledgments
The authors sincerely thank Qingxuan Yang and the Physical Oceanography Laboratory for providing the observed diapycnal diffusivity and mooring current observations in the SCS. The authors also sincerely thank Haibo Chen, Anzhou Cao, and Xiaowei Wang for the advice for this study.
References
Buijsman, M. C., Legg, S., and Klymak, J. (2012). Double-ridge internal tide interference and its effect on dissipation in Luzon Strait. J. Phys. Oceanogr. 42, 1337–1356. doi: 10.1175/JPO-D-11-0210.1
Cao, A., Guo, Z., Lv, X., Song, J., and Zhang, J. (2017). Coherent and incoherent features, seasonal behaviors and spatial variations of internal tides in the northern South China Sea. J. Mar. Syst. 172, 75–83. doi: 10.1016/j.jmarsys.2017.03.005
Carter, G. S., Gregg, M. C., and Lien, R. C. (2005). Internal waves, solitary-likewaves, and mixing on the Monterey Bay shelf. Cont. Shelf Res. 25, 1499–1520. doi: 10.1016/j.csr.2005.04.011
Carter, G. S., Gregg, M. C., and Merrifield, M. A. (2006). Flow and mixing around a small seamount on Kaena Ridge, Hawaii. J. Phys. Oceanogr. 36, 1036–1052. doi: 10.1175/JPO2924.1
Delorme, B. L., Thomas, L. N., Marchesiello, P., Gula, J., and Molemaker, M. J. (2021). Enhanced abyssal mixing in the equatorial pacific associated with non-traditional effects. J. Phys. Oceanogr. 51, 1895–1914. doi: 10.1175/JPO-D-20-0238.1
Drake, H. F., Ferrari, R., and Callies, J. (2020). Abyssal circulation driven by near-boundary mixing: water mass transformations and interior stratification. J. Phys. Oceanogr. 50, 2203–2226. doi: 10.1175/JPO-D-19-0313.1
Dushaw, B. D. (2002). Mapping low-mode internal tides near Hawaii using TOPEX/POSEIDON altimeter data. Geophys. Res. Lett. 29:91. doi: 10.1029/2001GL013944
Egbert, G. D., and Ray, R. D. (2000). Significant dissipation of tidal energy in the deep ocean inferred from satellite altimeter data. Nature 405, 775–778. doi: 10.1038/35015531
Foreman, M. G. G., Sutherland, G., and Cummins, P. F. (2004). M2 tidal dissipation around Vancouver Island: an inverse approach. Cont. Shelf Res. 24, 2167–2185. doi: 10.1016/j.csr.2004.07.008
Foreman, M. G. G., and Thomson, R. E. (1997). Three-dimensional model simulations of tides and buoyancy currents along the West Coast of Vancouver Island. J. Phys. Oceanogr. 27, 1300–1325. doi: 10.1175/1520-04851997027<1300:TDMSOT<2.0.CO;2
Garrett, C. (2003). Ocean science. Enhanced: internal tides and ocean mixing. Science 301, 1858–1859. doi: 10.1126/science.1090002
Guo, P., Fang, W., Liu, C., and Qiu, F. (2012). Seasonal characteristics of internal tides on the continental shelf in the northern South China Sea. J. Geophys. Res. 117:C04023. doi: 10.1029/2011JC007215
Haren, H. V., Cimatoribus, A., and Gostiaux, L. (2015). Where large deep-ocean waves break. Geophys. Res. Lett. 42, 2351–2357. doi: 10.1002/2015GL063329
Ivey, G. N. (2004). Stratification and mixing in sea straits. Deep Sea Res. II Top. Stud. Oceanogr. 51, 441–453. doi: 10.1016/j.dsr2.2003.07.020
Jinadasa, S. U. P., Lozovatsky, I., Planella-Morato, J., Nash, J. D., MacKinnon, J. A., Lucas, A. J., et al. (2016). Ocean turbulence and mixing around Sri Lanka and in adjacent waters of the Northern Bay of Bengal. Oceanography 29, 170–179. doi: 10.5670/oceanog.2016.49
Johnston, T. M. S., Rudnick, D. L., Carter, G. S., Todd, R. E., and Cole, S. T. (2011). Internal tidal beams and mixing near Monterey Bay. J. Geophys. Res. 116:C03017. doi: 10.1029/2010JC006592
Legg, S. (2003). Internal tides generated on a corrugated continental slope. Part I: cross-slopebarotropic forcing. J. Phys. Oceanogr. 34, 156–173.
Li, B., Wei, Z., Wang, X., Fu, Y., Fu, Q., Li, J., et al. (2020). Variability of coherent and incoherent features of internal tides in the north South China Sea. Sci. Rep. 10:12904. doi: 10.1038/s41598-020-68359-7
Liu, Z. (2010). Instability of baroclinic tidal flow in a stratified fjord. J. Phys. Oceanogr. 40, 139–154. doi: 10.1175/2009JPO4154.1
Liu, Z., and Lozovatsky, I. (2012). Upper pycnocline turbulence in the northern South China Sea. Chin. Sci. Bull. 57, 2302–2306. doi: 10.1007/s11434-012-5137-8
Lueck, R. G., and Osborn, T. R. (1985). Turbulence measurements in a submarine canyon. Cont. Shelf Res. 4, 681–698. doi: 10.1016/0278-4343(85)90036-6
MacKinnon, J. A., and Gregg, M. C. (2005). Spring mixing: turbulence and internal waves during restratification on the New England Shelf. J. Phys. Oceanogr. 35, 2425–2443. doi: 10.1175/JPO2821.1
Munk, W. (1998). Abyssal recipes II: energetics of tidal and wind mixing. Deep Sea Res. Part I Oceanogr. Res. Pap. 45, 1977–2010. doi: 10.1016/S0967-0637(98)00070-3
Munk, W. H. (1966). Abyssal recipes. Deep Sea Res. Oceanogr. Abstr. 13, 707–730. doi: 10.1016/0011-7471(66)90602-4
Nakamura, T., Takeuchi, Y., Uchimoto, K., Mitsudera, H., and Wakatsuchi, M. (2014). Effects of temporal variation in tide-induced vertical mixing in the Kuril Straits on the thermohaline circulation originating in the Okhotsk Sea. Prog. Oceanogr. 126, 135–145. doi: 10.1016/j.pocean.2014.05.007
Nash, J. D., Kunze, E., Lee, C. M., and Sanford, T. (2006). Structure of the baroclinic tide generated at Kaena Ridge, Hawaii. J. Phys. Oceanogr. 36, 1123–1135. doi: 10.1175/JPO2883.1
Niwa, Y., and Hibiya, T. (2001). Numerical study of the spatial distribution of the M2 internal tide in the Pacific Ocean. J. Geophys. Res. 106, 22441–22449. doi: 10.1029/2000JC000770
Peng, S., Liao, J., Wang, X., Liu, Z., Liu, Y., Zhu, Y., et al. (2021). Energetics-based estimation of the diapycnal mixing induced by internal tides in the Andaman Sea. J. Geophys. Res. Oceans 126:e2020JC016521. doi: 10.1029/2020JC016521
Polzin, K. L., Naveira Garabato, A. C., Huussen, T. N., Sloyan, B. M., and Waterman, S. (2014). Finescale parameterizations of turbulent dissipation. J. Geophys. Res. Oceans 119, 1383–1419. doi: 10.1002/2013JC008979
Rudnick, D. L., Boyd, T. J., Brainard, R. E., Carter, G. S., Egbert, G. D., Gregg, M. C., et al. (2003). From tides to mixing along the Hawaiian Ridge. Science 301, 355–357. doi: 10.1126/science.1085837
Tian, J., Yang, Q., and Zhao, W. (2010). Enhanced diapycnal mixing in the South China Sea. J. Phys. Oceanogr. 39:3191. doi: 10.1175/2009JPO3899.1
Toggweiler, J. R., and Samuels, B. (1995). Effect of drake passage on the global thermohaline circulation. Deep Sea Res. Part I Oceanogr. Res. Pap. 42, 477–500. doi: 10.1016/0967-0637(95)00012-U
Wang, X., Liu, Z., and Peng, S. (2017). Impact of tidal mixing on water mass transformation and circulation in the South China Sea. J. Phys. Oceanogr. 47, 419–432. doi: 10.1175/JPO-D-16-0171.1
Wang, X., Peng, S., Liu, Z., Huang, R. X., Qian, Y. K., and Li, Y. (2016). Tidal mixing in the South China Sea: an estimate based on the internal tide energetics. J. Phys. Oceanogr. 46, 107–124. doi: 10.1175/JPO-D-15-0082.1
Webb, D. J., and Suginohara, N. (2001). Vertical mixing in the ocean. Nature 409:37. doi: 10.1038/35051171
Xie, X., Shang, X., and Chen, G. (2010). Nonlinear interactions among internal tidal waves in the northeastern South China Sea. Chin. J. Oceanol. Limnol. 28, 996–1001. doi: 10.1007/s00343-010-9064-8
Xu, Z., Yin, B., Hou, Y., and Liu, A. K. (2014). Seasonal variability and north–south asymmetry of internal tides in the deep basin west of the Luzon Strait. J. Mar. Syst. 134, 101–112. doi: 10.1016/j.jmarsys.2014.03.002
Xu, Z., Yin, B., Hou, Y., and Xu, Y. (2013). Variability of internal tides and near-inertial waves on the continental slope of the northwestern South China Sea. J. Geophys. Res. Oceans 118, 197–211. doi: 10.1029/2012JC008212
Yang, Q., Zhao, W., Liang, X., and Tian, J. (2016). Three-dimensional distribution of turbulent mixing in the South China Sea. J. Phys. Oceanogr. 46, 769–788. doi: 10.1175/JPO-D-14-0220.1
Zhao, Z. (2014). Internal tide radiation from the Luzon Strait. J. Geophys. Res. Oceans 119, 5434–5448. doi: 10.1002/2014JC010014
Keywords: internal tides, turbulent mixing, incoherency of internal tides, non-linear interactions, the South China Sea
Citation: Li B, Du L, Peng S, Yuan Y, Meng X and Lv X (2021) Modulation of Internal Tides by Turbulent Mixing in the South China Sea. Front. Mar. Sci. 8:772979. doi: 10.3389/fmars.2021.772979
Received: 09 September 2021; Accepted: 20 October 2021;
Published: 19 November 2021.
Edited by:
Ming Li, University of Maryland Center for Environmental Science (UMCES), United StatesReviewed by:
Ru Chen, Tianjin University, ChinaAdam Thomas Devlin, Jiangxi Normal University, China
Copyright © 2021 Li, Du, Peng, Yuan, Meng and Lv. This is an open-access article distributed under the terms of the Creative Commons Attribution License (CC BY). The use, distribution or reproduction in other forums is permitted, provided the original author(s) and the copyright owner(s) are credited and that the original publication in this journal is cited, in accordance with accepted academic practice. No use, distribution or reproduction is permitted which does not comply with these terms.
*Correspondence: Libin Du, ZHVsaWJpbmhpdEAxNjMuY29t; Xianqing Lv, eHFpbmdsdkBvdWMuZWR1LmNu
 Bingtian Li
 Libin Du1*
 Shiqiu Peng
 Xianqing Lv