Abstract
A fishery-independent survey can provide detailed information for fishery assessment and management. However, the sampling design for the survey on ichthyoplankton in the estuary area is still poorly understood. In this study, we developed six stratified schemes with various sample sizes, attempting to find cost-efficient sampling designs for monitoring Coilia mystus ichthyoplankton in the Yangtze Estuary. The generalized additive model (GAM) with the Tweedie distribution was used to quantify the “true” distribution of C. mystus eggs and larvae, based on the data from the fishery-independent survey in 2019–2020. The performances of different sampling designs were evaluated by relative estimation error (REE), relative bias (RB), and coefficient of variation (CV). The results indicated that appropriate stratifications with intra-stratum homogeneity and inter-stratum heterogeneity could improve precision. The stratified schemes should be divided not only between the North Branch and South Branch but between river and sea. No less than two stratifications in the South Branch could also get better performance. The sample sizes of 45–55 were considered as the cost-efficient range. Compared to other monitoring programs, monitoring ichthyoplankton in the estuary area required a more complex stratification and a higher resolution sampling. The design ideology and optimization methodology in our study would provide references to sampling designs for ichthyoplankton in the estuary area.
Introduction
A Fishery-independent survey is critical to fishery assessment and management because it can provide reliable information about spatial and temporal scales on stock abundance and distribution (Liu et al., 2009). Surveys on ichthyoplankton have been conducted worldwide, attempting to clarify their spawning habitat and monitor the dynamics of stock resources and even ecosystem structure (McClatchie et al., 2014; Doray et al., 2017). The long-term intensive surveys were enumerated but not limited to the California Cooperative Oceanic Fisheries Investigations (CalCOFI; Bjorkstedt et al., 2011) and the Pélagiques Gascogne surveys (PELGAS; Doray et al., 2000). In such areas, transect line designs for sampling ichthyoplankton were widely accepted (McClatchie, 2014; Doray et al., 2017). Nonetheless, sampling designs in the estuary area should also be highly concerned because they can be potential spawning and nursery habitats for many fish species.
The Yangtze Estuary is one of the largest estuaries in the world, located on the west coast of the Pacific Ocean (Lin et al., 2018). The estuary area and its adjacent water had the major fisheries in China, but the resources have been rapidly reducing in the past 50 years (Xian et al., 2005; Ni and Chen, 2006). For instance, the tapertail anchovy Coilia mystus is a typical semi-anadromous species in the Yangtze Estuary (He et al., 2008). Annually, adult C. mystus migrates to brackish water to spawn in the Yangtze Estuary in late April (with spawning peaks from May to July) and descends to the sea in early September (Zhao and Zhang, 1985). It was estimated that the total catch of C. mystus in the Yangtze Estuary peaked at over 3,000t in 1995, but it has decreased to less than 100t since 2010 (Ni et al., 2020). The anthropological activities such as hydraulic engineering and overfishing may have disturbed its spawning or nursery habitats, resulting in a negative impact on stock recruitment (Yang et al., 2006). Fortunately, a series of resource protection measures have been taken by the Chinese government in 2019, e.g., a fishing ban (Cheng, 2021), but the status of C. mystus early resource is still unknown. Ichthyoplankton abundance has been proven to be a useful relative index or proxy of adult spawning stock biomass (Hsieh et al., 2005; Koslow and Davison, 2016). Thus, a targeted fishery-independent survey for C. mystus ichthyoplankton in the Yangtze Estuary is highly required to monitor its recruitment process and provide references for management.
The fishery management can be greatly influenced by the quantity of data from the fishery-independent survey, which is the ability to reflect the true resource distribution. Generally, the large-quantity data are obtained from high-intensity sampling, which needs to be financed and is time-consuming, especially when it targets multiple species over a broad spatiotemporal scale (Edwards et al., 2010; Blabolil et al., 2017). Thus, it is necessary to design a cost-efficient fishery-independent survey for getting adequate data with limited financial support (Puerta et al., 2018). Many pioneers have strived to optimize sampling designs with respect to sampling techniques, sampling effort, and spatial configuration (Jardim and Ribeiro, 2007; Blabolil et al., 2017). Surprisingly, there are few studies focused on sampling designs for ichthyoplankton. The surveys for ichthyoplankton were regarded as a solution to the perceived cost of fish surveys because they were more aggregated in distributions and easier to be collected (Koslow and Wright, 2016). Thus, sampling designs for ichthyoplankton should also be highly concerned.
With respect to the different objectives of fishery management, various sampling designs should be adopted to gain maximal efficiency (Bijleveld et al., 2012). Due to the complexity and variability of the seafloor in the Yangtze Estuary, there are places where sampling is not possible, and fixed-station sampling designs cannot be applied. The stratified random sampling (SRS) divides a population into different strata and samplings randomly in each stratum. It is commonly used in the fishery-independent survey to provide insights into resource status (Wang et al., 2018). The estimated precision of SRS can be improved by optimizing stratified schemes and sample sizes (Xu et al., 2015a,b). But for the fishery-independent surveys with limited funding, the optimization process should find a balance between budget and survey precision. In recent years, computer simulation has been used as an effective tool to optimize sampling designs and improve their performances. The performance is mostly defined by estimators that are unbiased, consistent, and efficient (Cochran, 1977). As the response to the uncertainty of samplings, the estimates influence the accuracy of assessment and the effect of subsequent management. Therefore, estimators that evaluate comprehensive performance should be selected to improve the assessment of fisheries.
In terms of environmental heterogeneity in the Yangtze Estuary, and the patchy distribution of C. mystus ichthyoplankton, the sampling design may require higher resolution sampling and more complex stratification. In this study, we developed six stratified schemes with various sample sizes for sampling C. mystus ichthyoplankton in the Yangtze Estuary, trying to (1) compare the performances of six sampling designs for capturing the dynamics of C. mystus eggs and larvae; (2) find the cost-efficient sampling designs with suitable sample sizes; and (3) develop a framework of designing and optimizing fishery-independent survey for monitoring ichthyoplankton in the estuary area. The design ideology and optimization methodology in our study would provide references to future sampling designs for ichthyoplankton in the estuary area.
Materials and Methods
To clarify how to make sampling designs for monitoring ichthyoplankton in the estuary area, we conducted a case study of C. mystus ichthyoplankton in the Yangtze Estuary. Six sampling designs with various sample sizes were developed to find the cost-efficient designs for monitoring the dynamic of C. mystus ichthyoplankton. The performances of the designs were evaluated by relative estimation error (REE), relative bias (RB), and coefficient of variation (CV), based on the “true” distribution obtained from the generalized additive model (GAM) with the Tweedie distribution.
Study Area and the Current Sampling Design
The Yangtze Estuary is one of the most important estuaries in China and is a spawning and nursery habitat for many commercial fish species (Wan et al., 2010). It is characterized by a unique topography and the complex hydrology (Zhuang, 2013; Liu et al., 2020). Under the interaction of runoff and tide, sediments in the water settle and then form alluvial shoals and islands in the Yangtze Estuary. These lands such as Chongming island, Changxing island, and Jiuduan sandbank divide the mainstream into four passages (Figure 1A; Yan et al., 2001). Besides, the environmental heterogeneity extends over the whole estuarine region, especially between the North Branch and South Branch. For example, higher salinity and dissolved oxygen are found in the North Branch than in the South Branch (Luo and Shen, 1994; Meng, 2010).
FIGURE 1
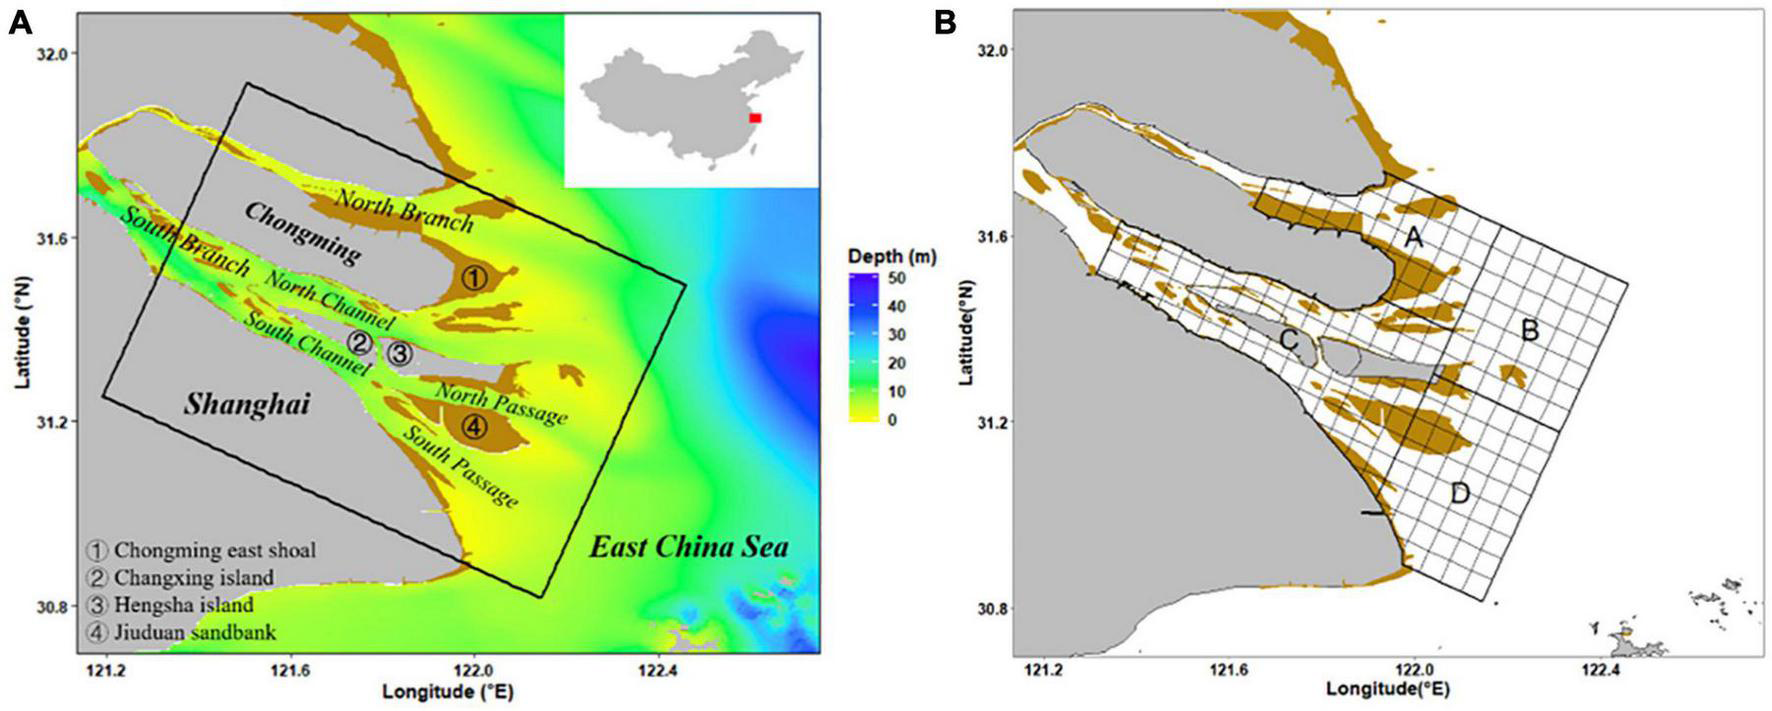
Study area (A) and potential sampling stations (B).
To clarify the distribution status of C. mystus ichthyoplankton, the study focused on a specific area in the Yangtze Estuary (Figure 1A). We conducted four fishery-independent surveys in our study area, which were in May and August of 2019 and 2020. The survey followed the SRS design, which consisted of randomly sampling 55 stations from 182 grid cells per survey. The grid was generated over our study area based on the central axis of Chongming Island, according to the sampling design of the CalCOFI (McClatchie, 2014). Grid cells had a resolution of 3′ × 3′, and grid cells where water area occupies less than half of the grid area were not counted. We clustered the grid cells into four strata (Stratum A, B, C, and D; Figure 1B), according to their regions (corresponding to the area in the North Branch, off the North Branch, in the South Branch, and off the South Branch, respectively). Based on our original purpose of the survey, which was to identify the spawning habitat of C. mystus, more stations were allocated to Stratum C. The stations of Stratum A, B, C, and D were 12, 10, 25, and 8, respectively.
Eggs and larvae were collected using plankton nets with 280-cm net length, 80-cm mouth diameter, and 505-μm mesh size, and a General Oceanics 2030R flowmeter at the center of the net mouth. The net was dragged horizontally along the sea surface for 10 min, with a constant speed of 2–3 knots. Environmental factors, such as temperature, salinity, and depth, were also recorded by the conductivity-temperature-depth system (CTD) of SBE-19plusV2 at each station. Samples were preserved in 5% buffered formalin in seawater immediately. Once in the laboratory, C. mystus eggs and larvae were visually identified based on existing literature and counted using a OLYMPUS SZX7 binocular microscope. According to the references, both C. mystus eggs and larvae are buoyant (Zhao and Zhang, 1985; Zhang et al., 2020). Eggs are transparent with a diameter of 0.83–1.03 mm and contain multiple oil globules of different sizes. Larvae can be identified by counting the number of the sarcomere and fin ray at different body lengths, but other morphological figures also contributed to their identification (Zhao and Zhang, 1985; Wan and Jiang, 2000). The five-stage eggs (Stage I–V; Thompson and Riley, 1981) and three-stage larvae (prelarva, postlarva, and juvenile; Zhao and Zhang, 1985) were found in our samples.
The “True” Values
To compare and evaluate the performance of various sampling designs, the “true” distribution of C. mystus eggs and larvae over our study area was needed. The GAM has been widely used to fit the nonlinear relationship between species abundance and environmental factors. Combined with the Tweedie distribution, the GAM model can deal well with fishery resource data with zero inflation (Wang et al., 2017). Therefore, we developed a Tweedie-GAM to quantify the relationship between C. mystus egg density, larval density, and environmental factors and predicted their “true” distribution in the study area. The general GAM was expressed as follows (Hastie and Tibshirani, 1986):
where g(ρ) is the log-link function, β0 denotes the constant intercept term, xi denotes the explanatory variable, fi (xi) is a smooth function that can be used to describe the relationship between g(ρ) and xi, and ε is the error term according to normal distribution. The description of the probability function of the Tweedie distribution is given by Eq. 4 in the study by Shono (2008). The Tweedie distribution can express as the compound Poisson distribution if 1 < p < 2, which was appropriate for data with plenty of zero values (Shono, 2008).
We developed optimal models for C. mystus eggs and larvae with data from four surveys to improve the accuracy of optimal models. The quantity of C. mystus eggs and larvae was standardized to egg density and larval density, which were calculated by ρ=A/V, where ρ is egg density (ρe) or larval density (ρl), A denotes the number of eggs and larvae, and V is the flow volume measured with the flowmeter. Both egg density and larval density were log-transformed. The selected environmental variables were sea surface temperature (SST), sea bottom temperature (SBT), sea surface salinity (SSS), sea bottom salinity (SBS), charted depth (Dep), and a two-dimensional (2D) variable: longitude and latitude (Lon, Lat). Year and month were treated as categorical variables. The effect of shoals was represented by Dep in models.
The optimal models for eggs and larvae were selected by the lowest Akaike Information Criterion (AIC; Akaike, 1974). We interpolated spatial correlated environmental factors in the uninvestigated area by using the inverse distance weighting method (Chen, 2017). Finally, the “true” distribution of C. mystus eggs and larvae was predicted by the optimal models and the interpolated environmental variables. We calculated the mean of predicted egg and larval density as the “true” values in each month.
Optimization Process
A total of 182 potential sampling stations were treated as population, which was the same as the current sampling design. The stations were divided into different strata based on six sampling designs (Table 1 and Figure 2). We made different stratified schemes by coordinate (Designs 2, 3, and 5) and region (Designs 4 and 6). The simple random sampling (Design 1) was treated as a design control. We compared the performance of six sampling designs with various sampling sizes, trying to find cost-efficient sampling designs to monitor the dynamics of C. mystus eggs and larvae.
TABLE 1
| Designs | Stratum | Weights | Stations | Stratified rules |
| 1 | A | 1 | 55 | No stratified (Figure 2A). |
| 2 | A | 0.36 | 20 | Stratified with 3 latitude strata, and partly considered the branching character (Figure 2B). |
| B | 0.43 | 24 | ||
| C | 0.21 | 11 | ||
| 3 | A | 0.11 | 6 | Stratified with 3 longitude strata, and partly considered the area in and off the estuary (Figure 2C). |
| B | 0.33 | 18 | ||
| C | 0.56 | 31 | ||
| 4 | A | 0.18 | 10 | Stratified with 4 regions strata, divided the area in and off the North Branch and South Branch. (The current sampling design; A: in the North Branch, B: off the North Branch, C: in the South Branch, D: off the South Branch; Figure 2D). |
| B | 0.24 | 13 | ||
| C | 0.32 | 18 | ||
| D | 0.26 | 14 | ||
| 5 | A | 0.16 | 9 | Stratified with 6 coordinates strata, and combined Design 2 with Design 3 (Figure 2E). |
| B | 0.20 | 11 | ||
| C | 0.11 | 6 | ||
| D | 0.13 | 7 | ||
| E | 0.20 | 11 | ||
| F | 0.20 | 11 | ||
| 6 | A | 0.16 | 9 | Stratified with 6 regions strata, and separated the Chongming east shoal and the turbidity maximum zone. (A: in the North Branch, B: off the North Branch, C: Chongming east shoal, D: in the South Branch, E: turbidity maximum zone, F: off the South Branch; Figure 2F). |
| B | 0.18 | 10 | ||
| C | 0.09 | 5 | ||
| D | 0.17 | 9 | ||
| E | 0.25 | 14 | ||
| F | 0.15 | 8 |
List of the sampling designs.
FIGURE 2
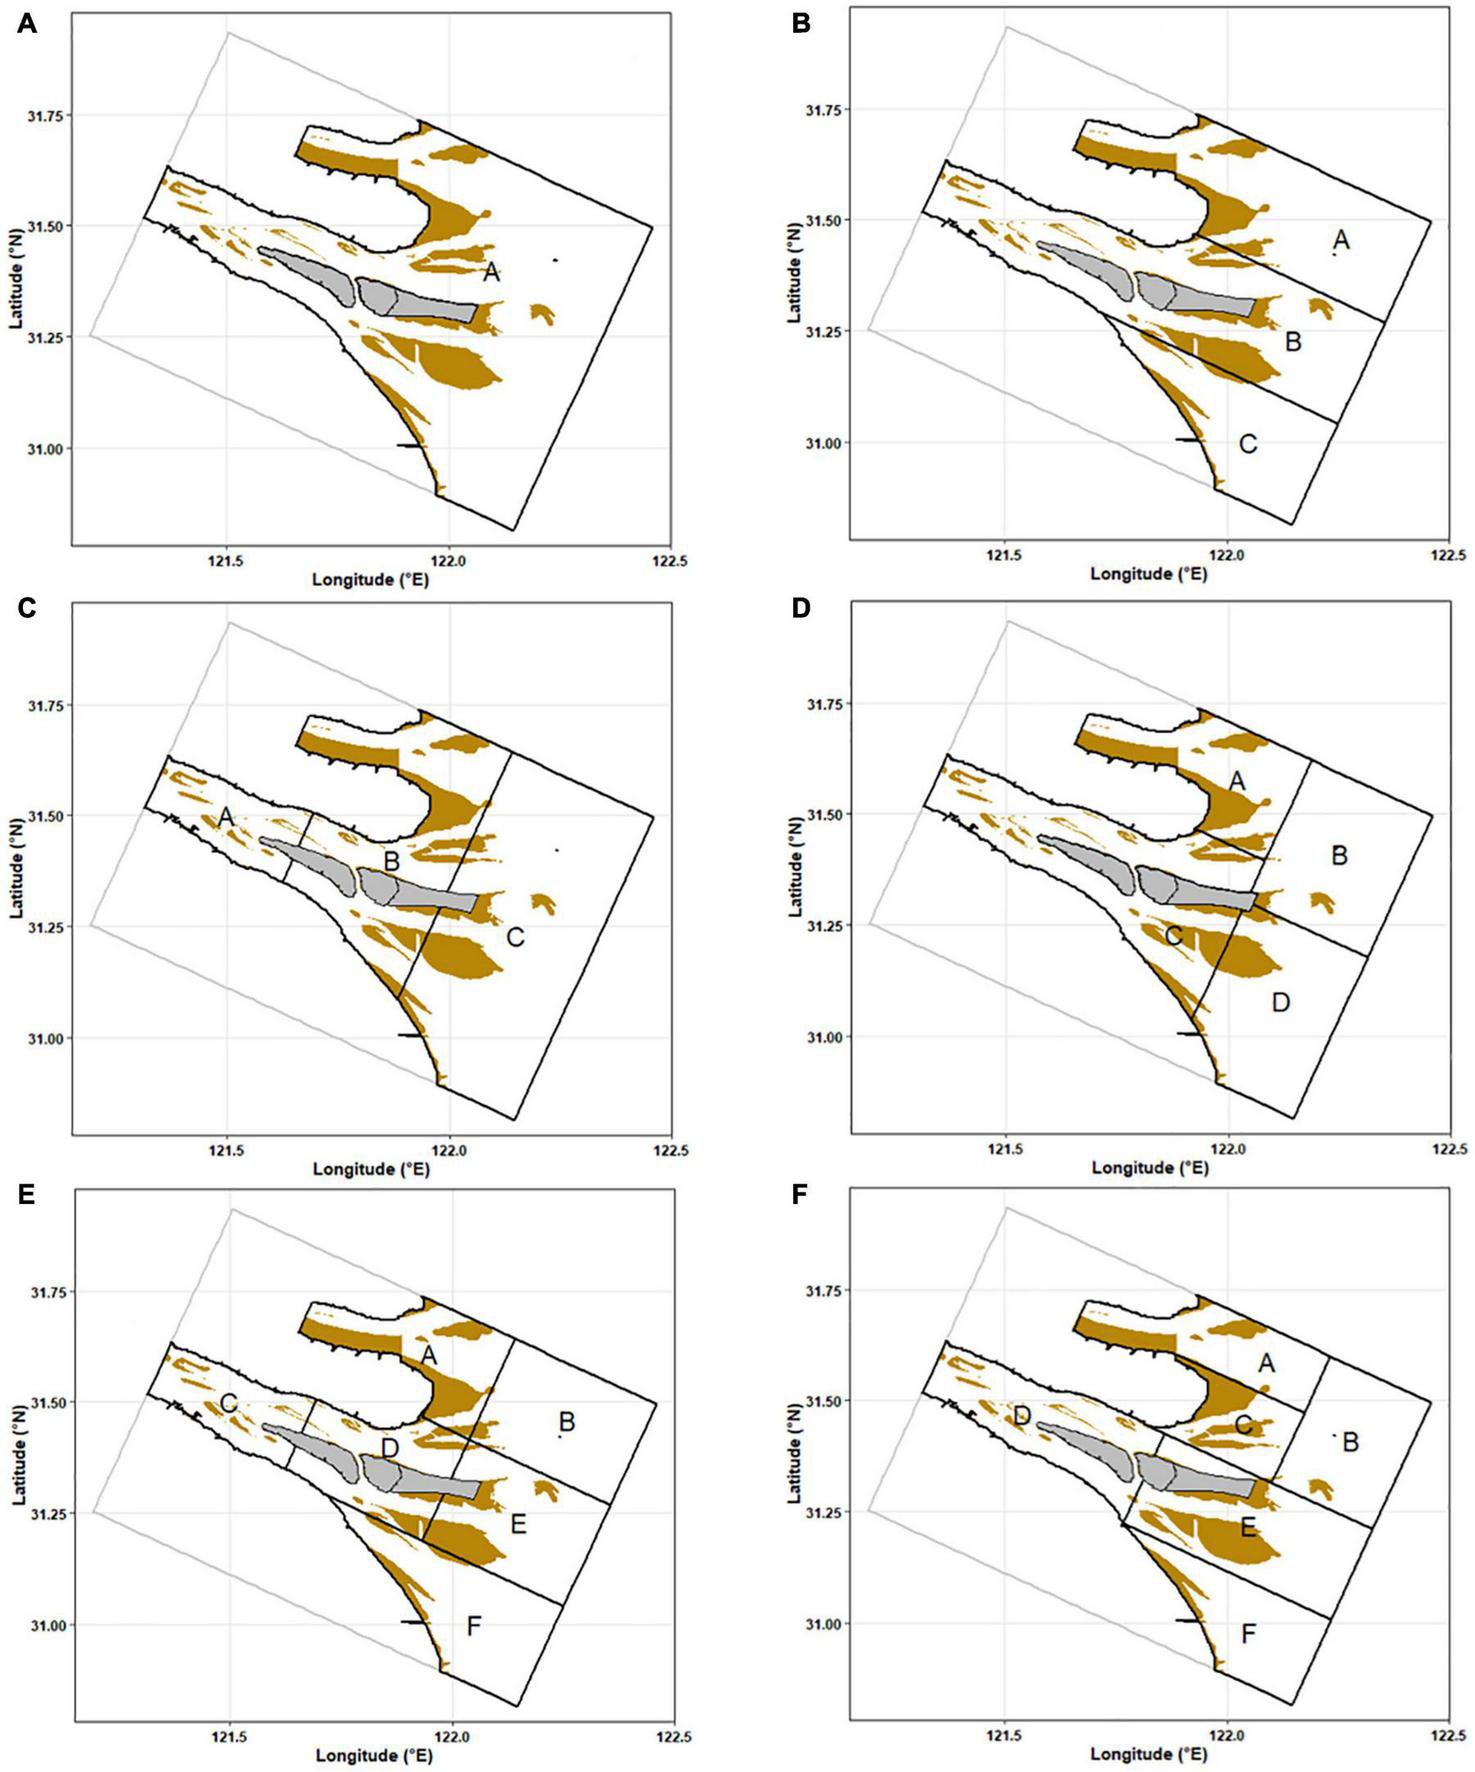
Strata for different sampling designs. The brown areas represent shoals. The gray areas represent islands. (A) Design 1, (B) Design 2, (C) Design 3, (D) Design 4, (E) Design 5, and (F) Design 6.
The performances of sampling designs were evaluated by REE, RB, and CV. REE (Eq. 2) evaluated the accuracy and precision of estimated values in sampling (Chen, 1996). RB (Eq. 3) reflected the bias between estimated values and the “true” values (Jiao et al., 2004). CV (Eq. 4) measured the relative variability of estimated values (Cochran, 1977). They were expressed as follows:
where Ye is the estimated value calculated by the ith sampling data, Yt is the “true” values, R is the sampling times (R=1000, here), σ was an SD of the sampling data, and Ῡ was the mean of sampling data. The performance of the sampling designs with lower REE, absolute RB, and CV was better.
We evaluated the performance of different sampling designs with various sample sizes, which were set as 25, 40, 55, 70, 85, and 100. The designs with good performances were tested in further optimization of sample size from 15 to 100 with an interval of 5. The sample sizes were proportionally allocated to each stratum by weights. It is difficult to ensure that sample sizes in each stratum were an integer, and therefore, the non-integer calculation was rounded to the nearest integer. All the processes of analysis were carried out with R software (version 3.6.0).
Results
The “True” Populations
We used a preliminary variance inflation factor (VIF) analysis to check multicollinearity among variables. The environmental factors whose VIF exceeded 10 were removed from models. Based on the results of the VIF analysis and backward stepwise, GAMs with the lowest AIC values for C. mystus eggs and larvae were expressed as Eqs 5 and 6, respectively. Depth, SSS, SBS, and 2D longitude and latitude were selected for both the two optimal GAMs. The two models with significant variables explained 67.8 and 67.4% of the variance for egg and larval density, respectively. The quantile-quantile (Q–Q) plots of residuals were used to check the performance of the optimal GAMs (Figure 3). For both egg and larval models, their points were close to the straight red lines. Therefore, the optimal GAMs performed well for most of the data.
FIGURE 3
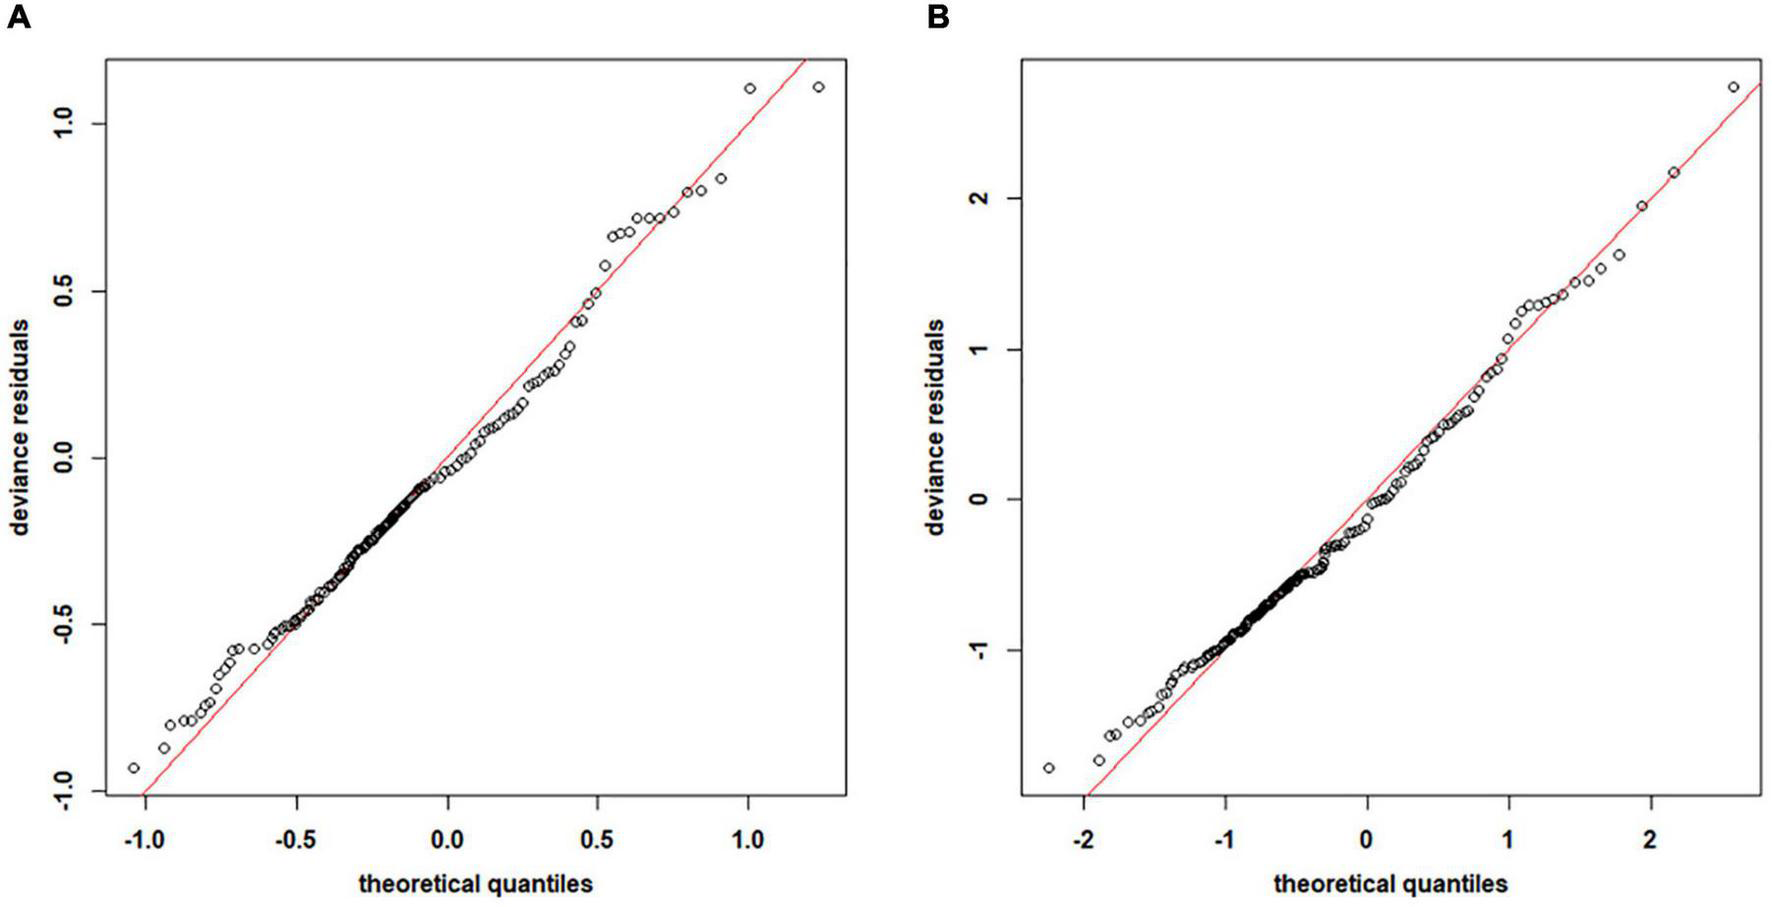
The quantile-quantile (Q–Q) plots of the deviance residuals in optimal generalized additive models (GAMs) for Coilia mystus(A) eggs and (B) larvae. The red lines represent standard values.
The distributions of C. mystus egg and larval density were predicted by the optimal GAMs on the interpolated environmental factors (Figure 4). The results showed that eggs and larvae occurred in both May and August. Their potential spawning ground was distributed inside the Yangtze Estuary and filled in the whole South Branch. Higher egg density occurred in May rather than in August, and in 2019 rather than in 2020. The prediction indicated that C. mystus has more than one potential nursery ground in the Yangtze Estuary. One of which was inside the North Branch, closing to the Chongming east tidal flat. The other is located in the south of the study area, outside of the South Passage. There was another assemblage, only located in the north of the North Passage in May 2020. It was also considered as the potential nursery ground for C. mystus. Similarly, larval densities were higher in May than in August but lower in 2019 than 2020. In each sampling month, the density of larvae far exceeded that of eggs.
FIGURE 4
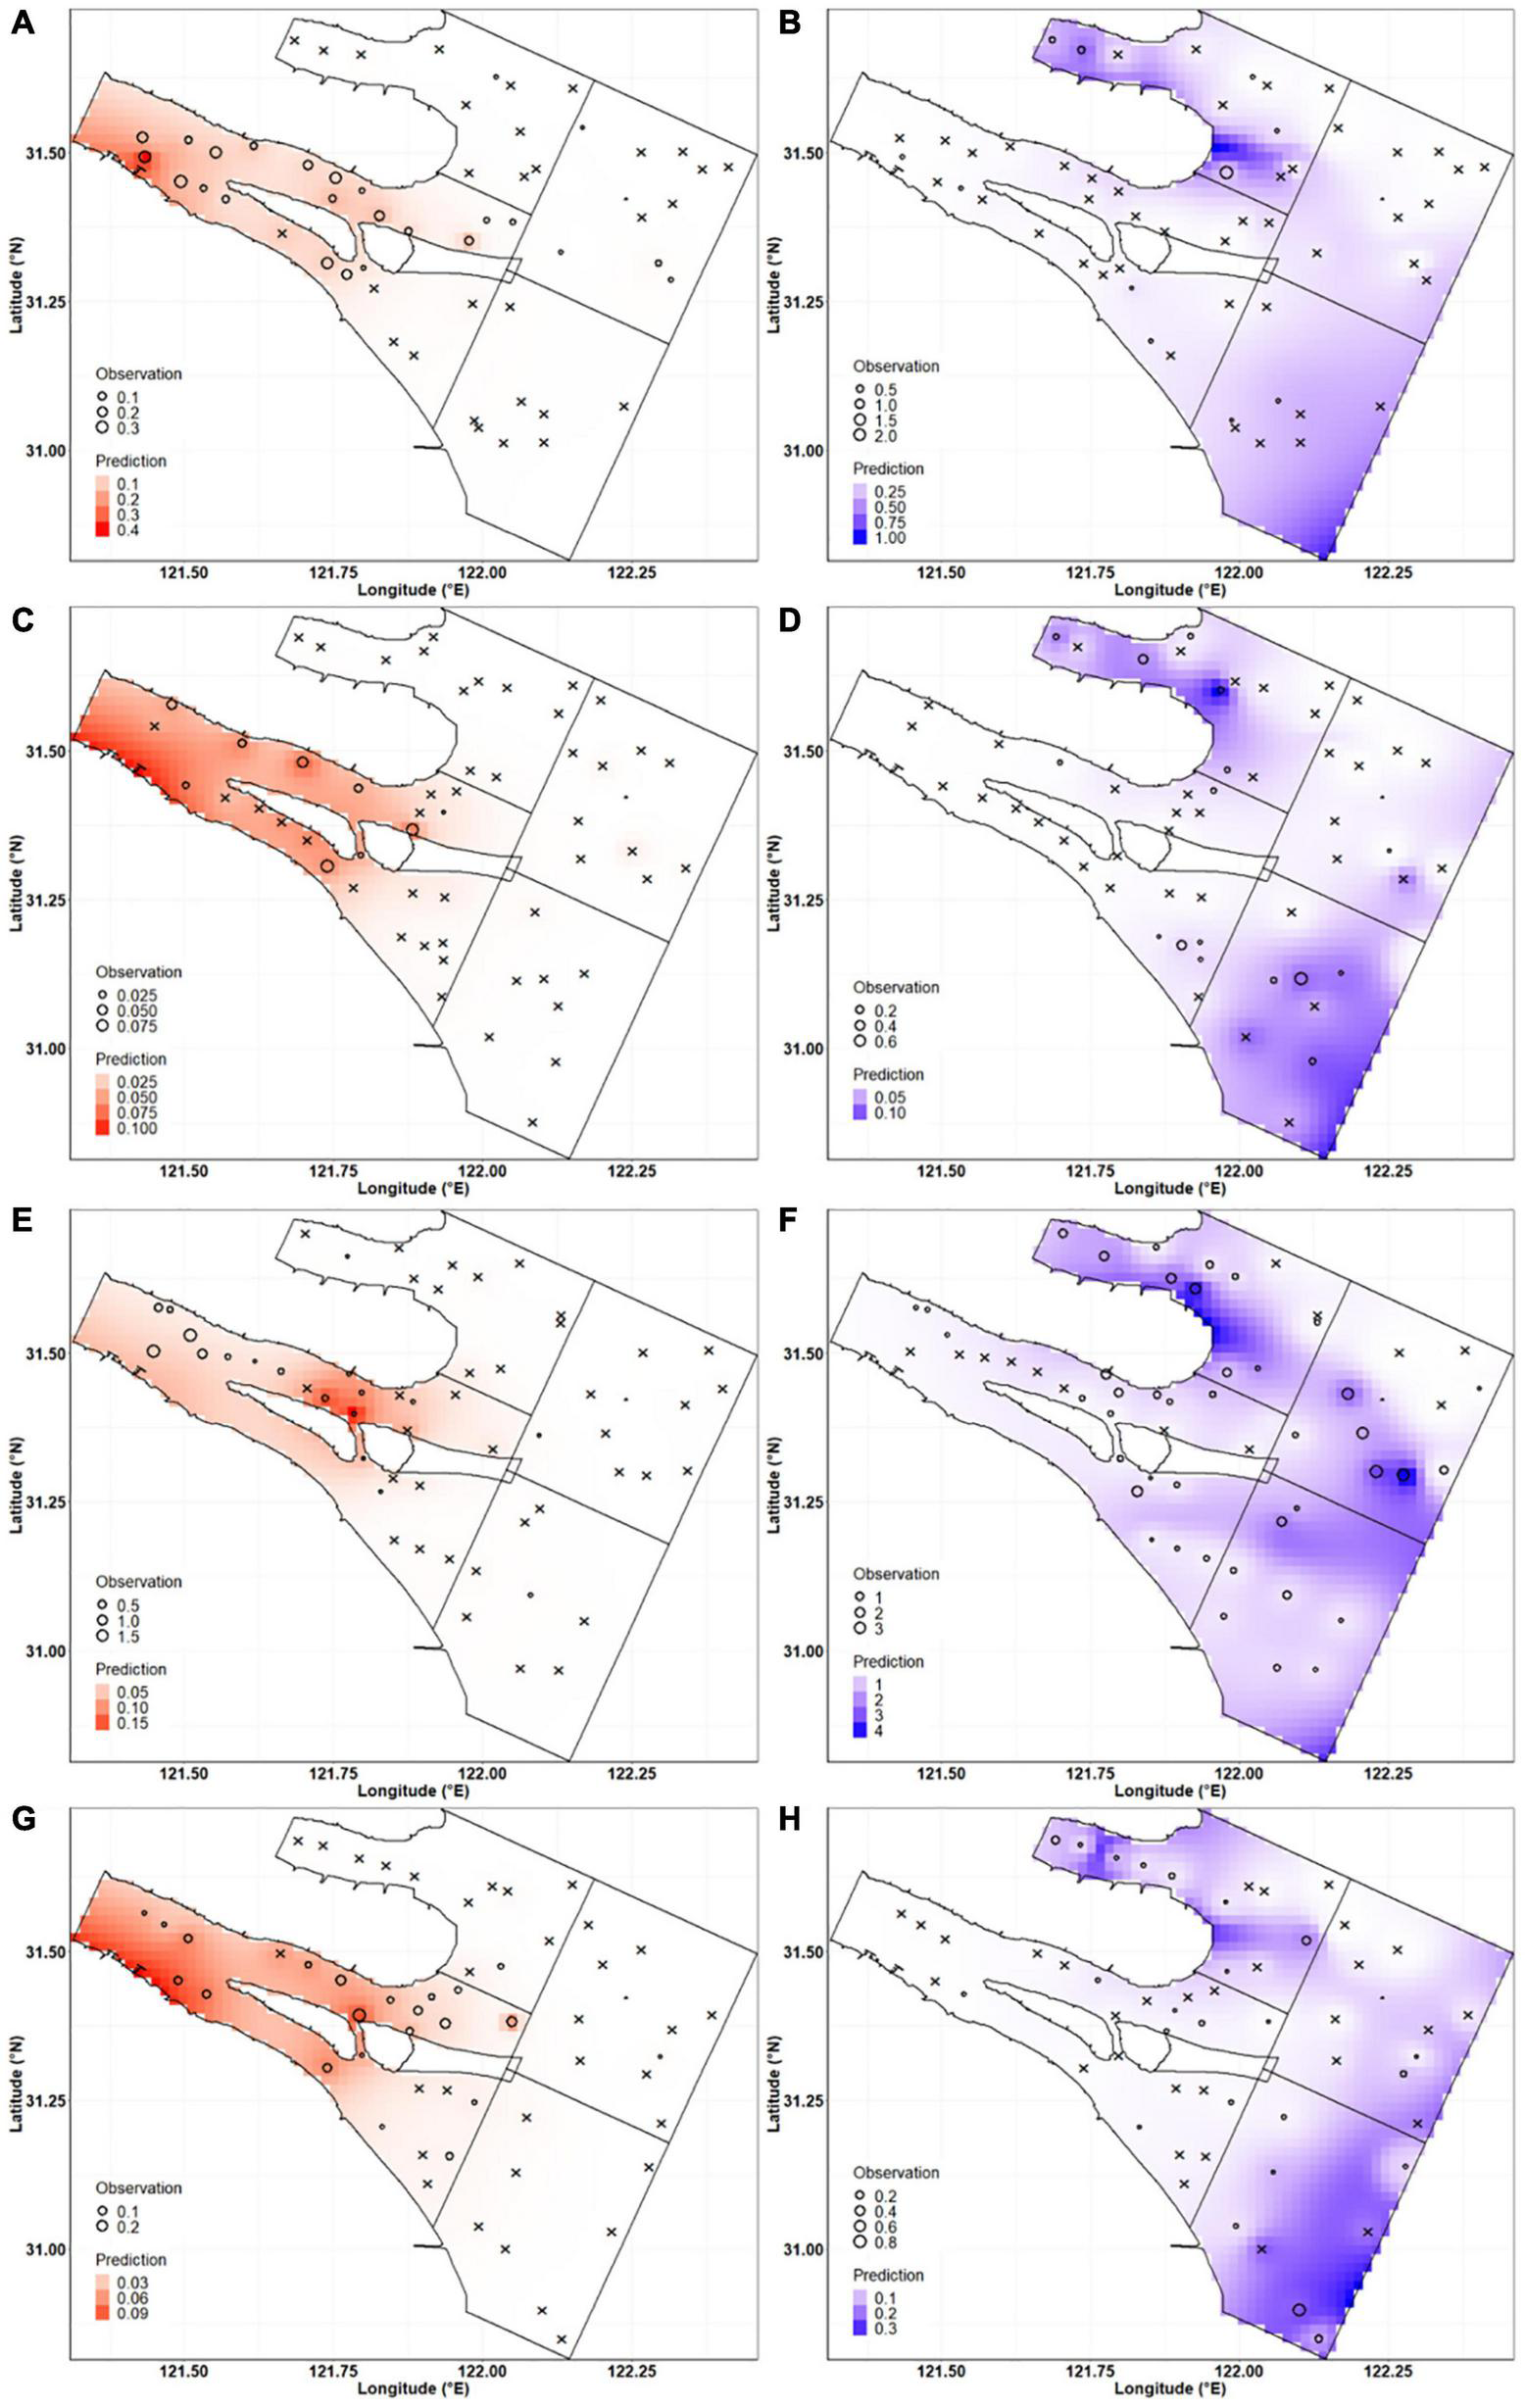
Predicted and observed distributions of C. mystus egg and larval density. Red gradients represent predicted egg distribution in (A) May 2019, (C) August 2019, (E) May 2020, and (G) August 2020. Blue gradients represent predicted larval distribution in (B) May 2019, (D) August 2019, (F) May 2020, and (H) August 2020. Circle sizes represent the observed density of C. mystus ichthyoplankton. Cross represents no C. mystus eggs and larvae.
Optimization Process
The results indicated that different designs had various performances in sampling C. mystus eggs and larvae (Figures 5, 6). For eggs, the REE and CV values of different designs fluctuated between 8.78 and 26.12% and 8.48 and 26.20%, respectively. Design 1 had the highest REE and CV values, while those of Designs 3, 5, and 6 were lower over time. Therefore, Designs 3, 5, and 6 were considered to have better precision than other sampling designs. The RB values of different designs varied from -4.07 to 4.86%. The RB values of Design 1 were distributed evenly on both sides of zero, suggesting that simple random sampling could provide unbiased measures for the population. Designs 4 and 6 were continuing overestimated and underestimated, respectively. During each survey, the absolute RB values of all sampling designs were less than 5%, which meant that they had a steady low deviation (Figure 5).
FIGURE 5
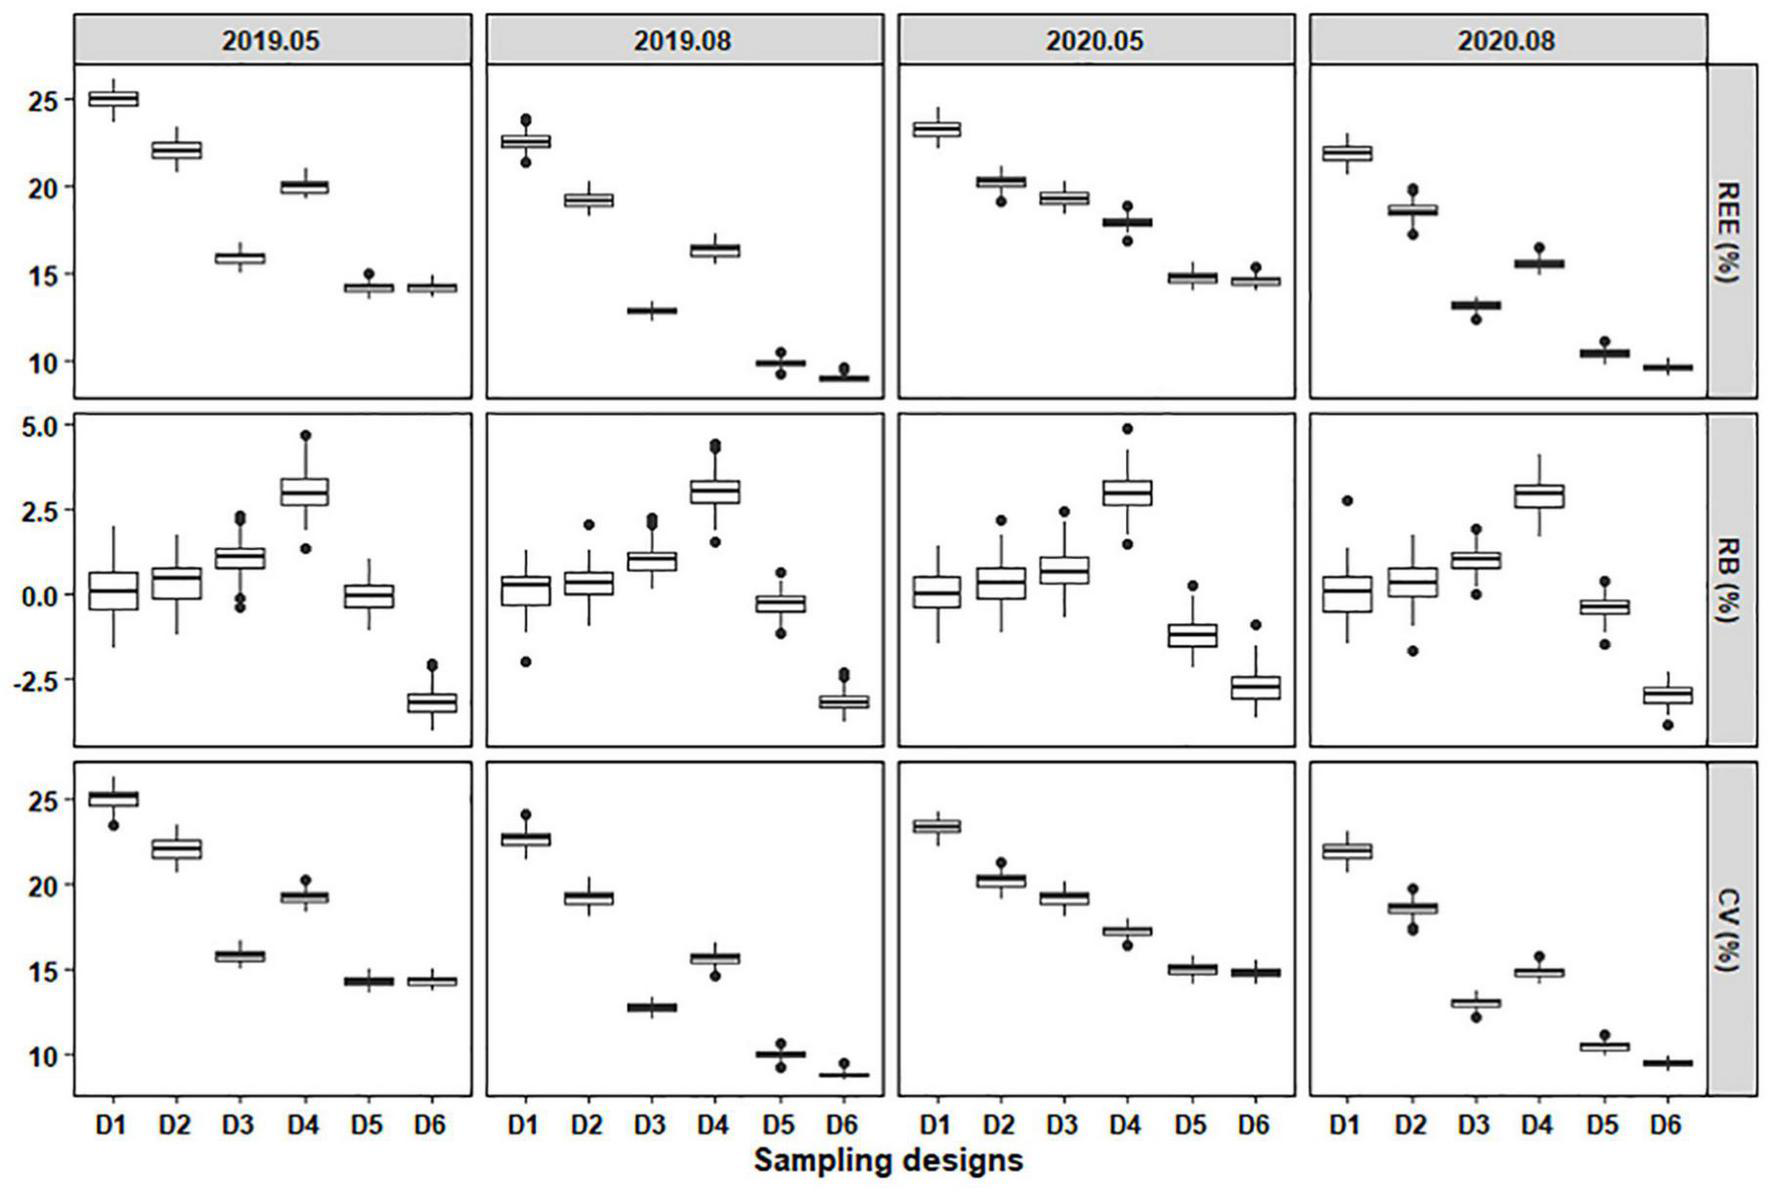
The relative estimation error (REE), relative bias (RB), and coefficient of variation (CV) of stratified schemes for sampling C. mystus eggs with a sample size of 55. D1 to D6 represent Design 1 to Design 6, respectively.
FIGURE 6
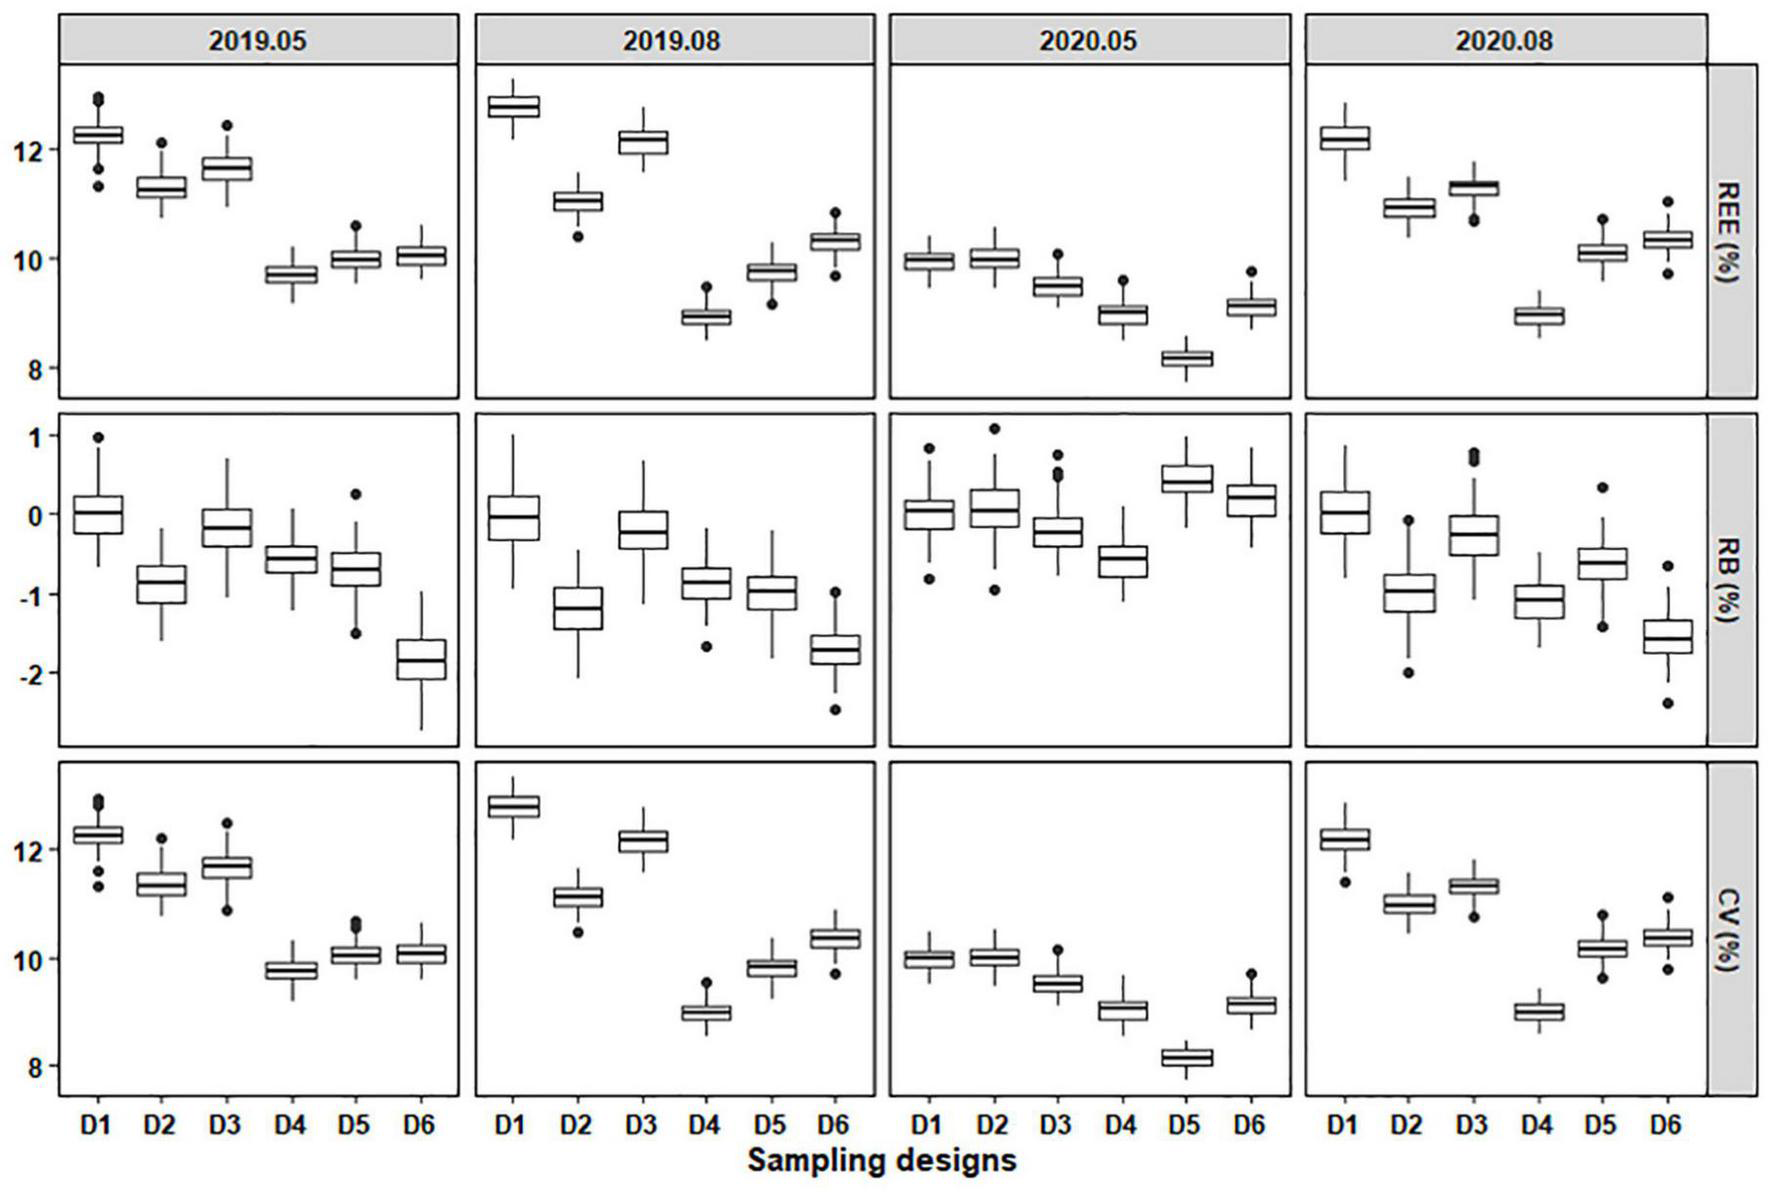
The REE, RB, and CV of stratified schemes for sampling C. mystus larvae with a sample size of 55. D1 to D6 represent Design 1 to Design 6, respectively.
The results showed that REE, absolute RB, and CV of C. mystus larvae were obviously lower than those of eggs (Figures 5, 6). For larvae, the REE values of different designs ranged from 7.72 to 13.28%, and the CV values were ranged from 7.70 to 13.35%. Design 1 with the highest REE and CV values still had the lowest accuracy among sampling designs. Conversely, Designs 4, 5, and 6 with lower REE and CV had higher precision over time. The RB values of the six designs varied from -2.75 to 1.08%. Compared with the unbiased estimate of Design 1, other designs overestimated or underestimated the “true” values. Nevertheless, the designs for larvae had a lower deviation than those for eggs (Figure 6).
With the increase of sample size, the REE, absolute RB, and CV of different sampling designs generally decreased, both for C. mystus eggs and larvae. The changing rates of mean REE and CV tended to be stable, and absolute mean RB fluctuated in a certain range (Figures 7, 8). Obvious differences in performance were shown among the six designs when sampling C. mystus. Whenever sampling C. mystus eggs, Design 3 was more accurate compared to Design 2. Designs 5 and 6 performed better than others at any sample sizes in all months. They both required a sample size that exceeded 40 to get lower REE, absolute RB, and CV (Figure 7). The performance of the six designs was close to each other when sampling larvae. For each sample size, Designs 4, 5, and 6 have always been the better designs compared to others (Figure 8). Although low deviation was acceptable, they still needed more sizes to ensure high precision and low dispersion. In terms of performance for sampling eggs and larvae, Designs 5 and 6 were considered as the better designs at all sample sizes.
FIGURE 7
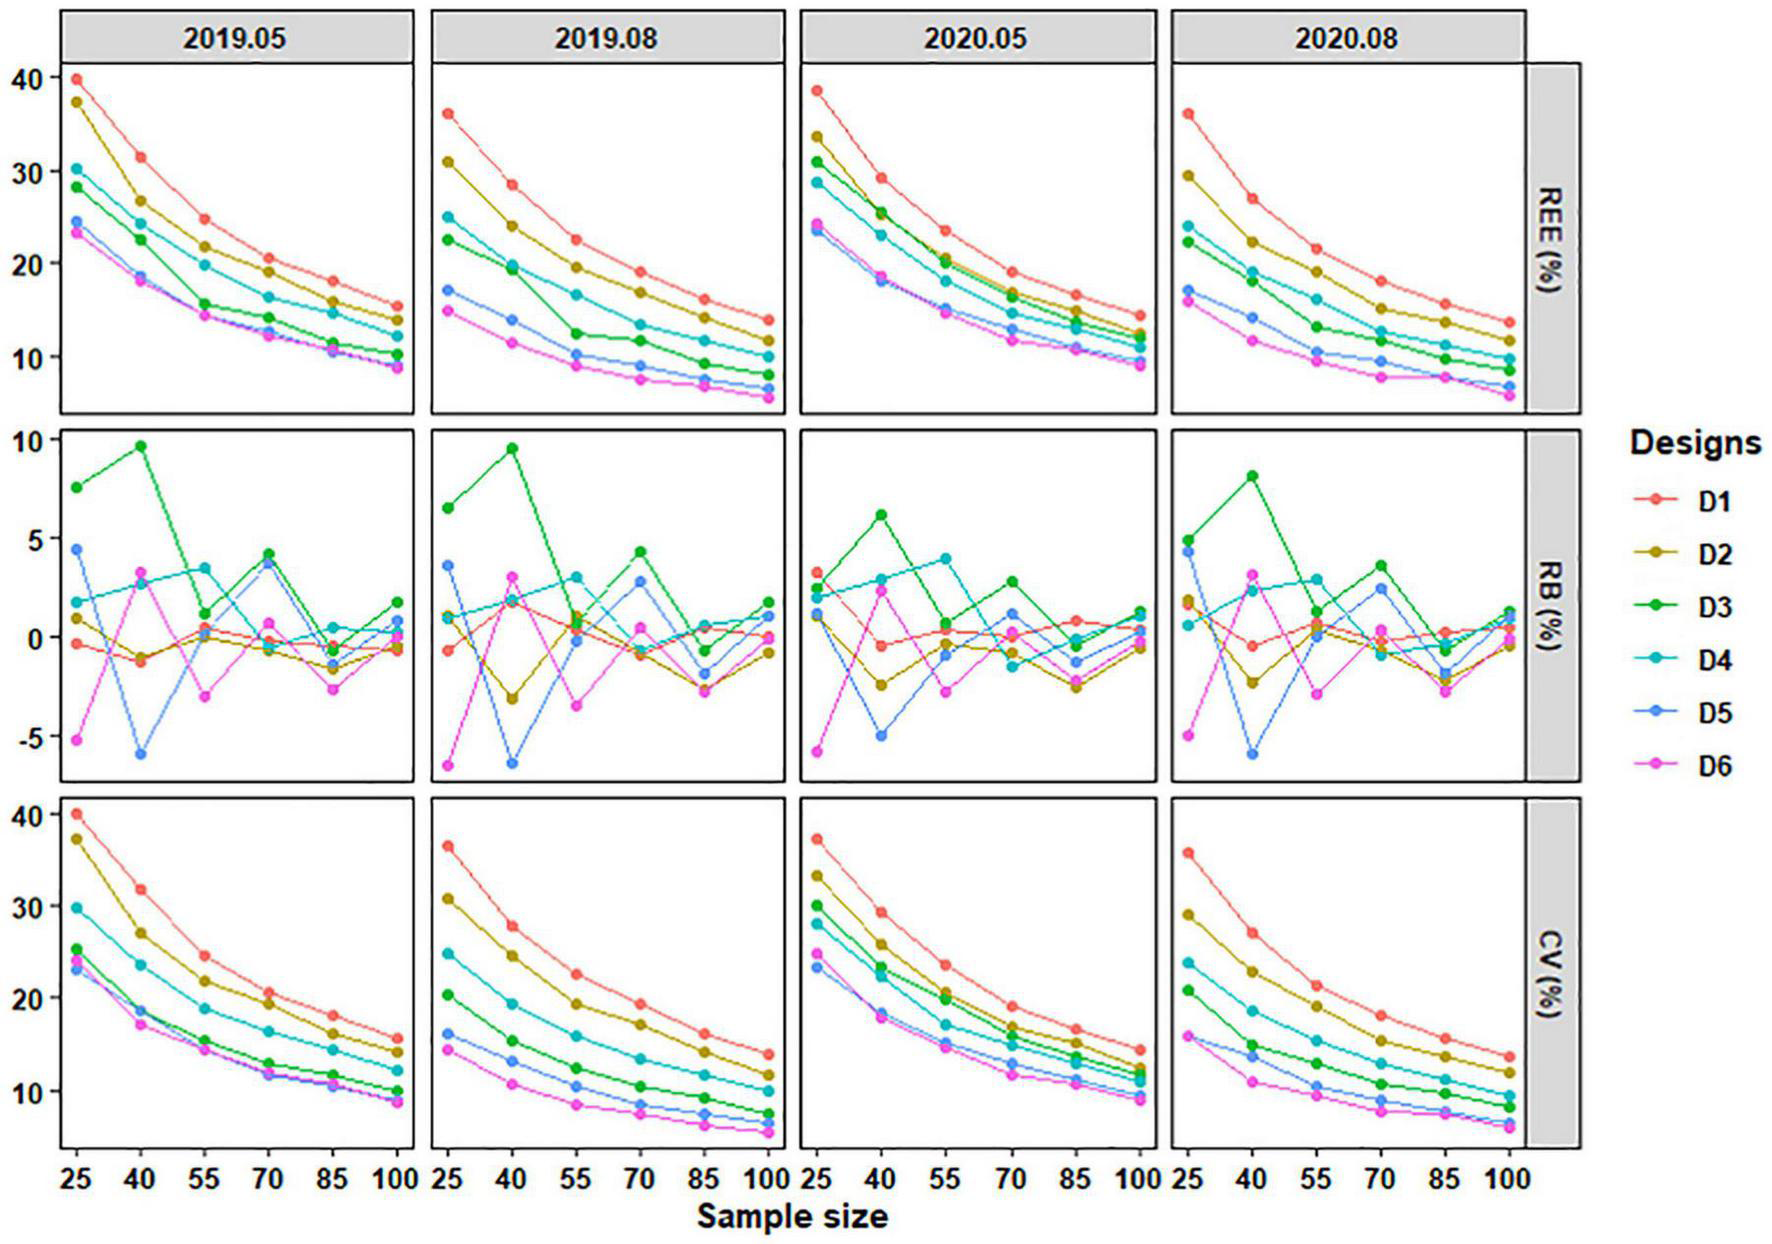
The REE, RB, and CV of stratified schemes for sampling C. mystus eggs at different sample sizes. D1 to D6 represent Design 1 to Design 6, respectively.
FIGURE 8
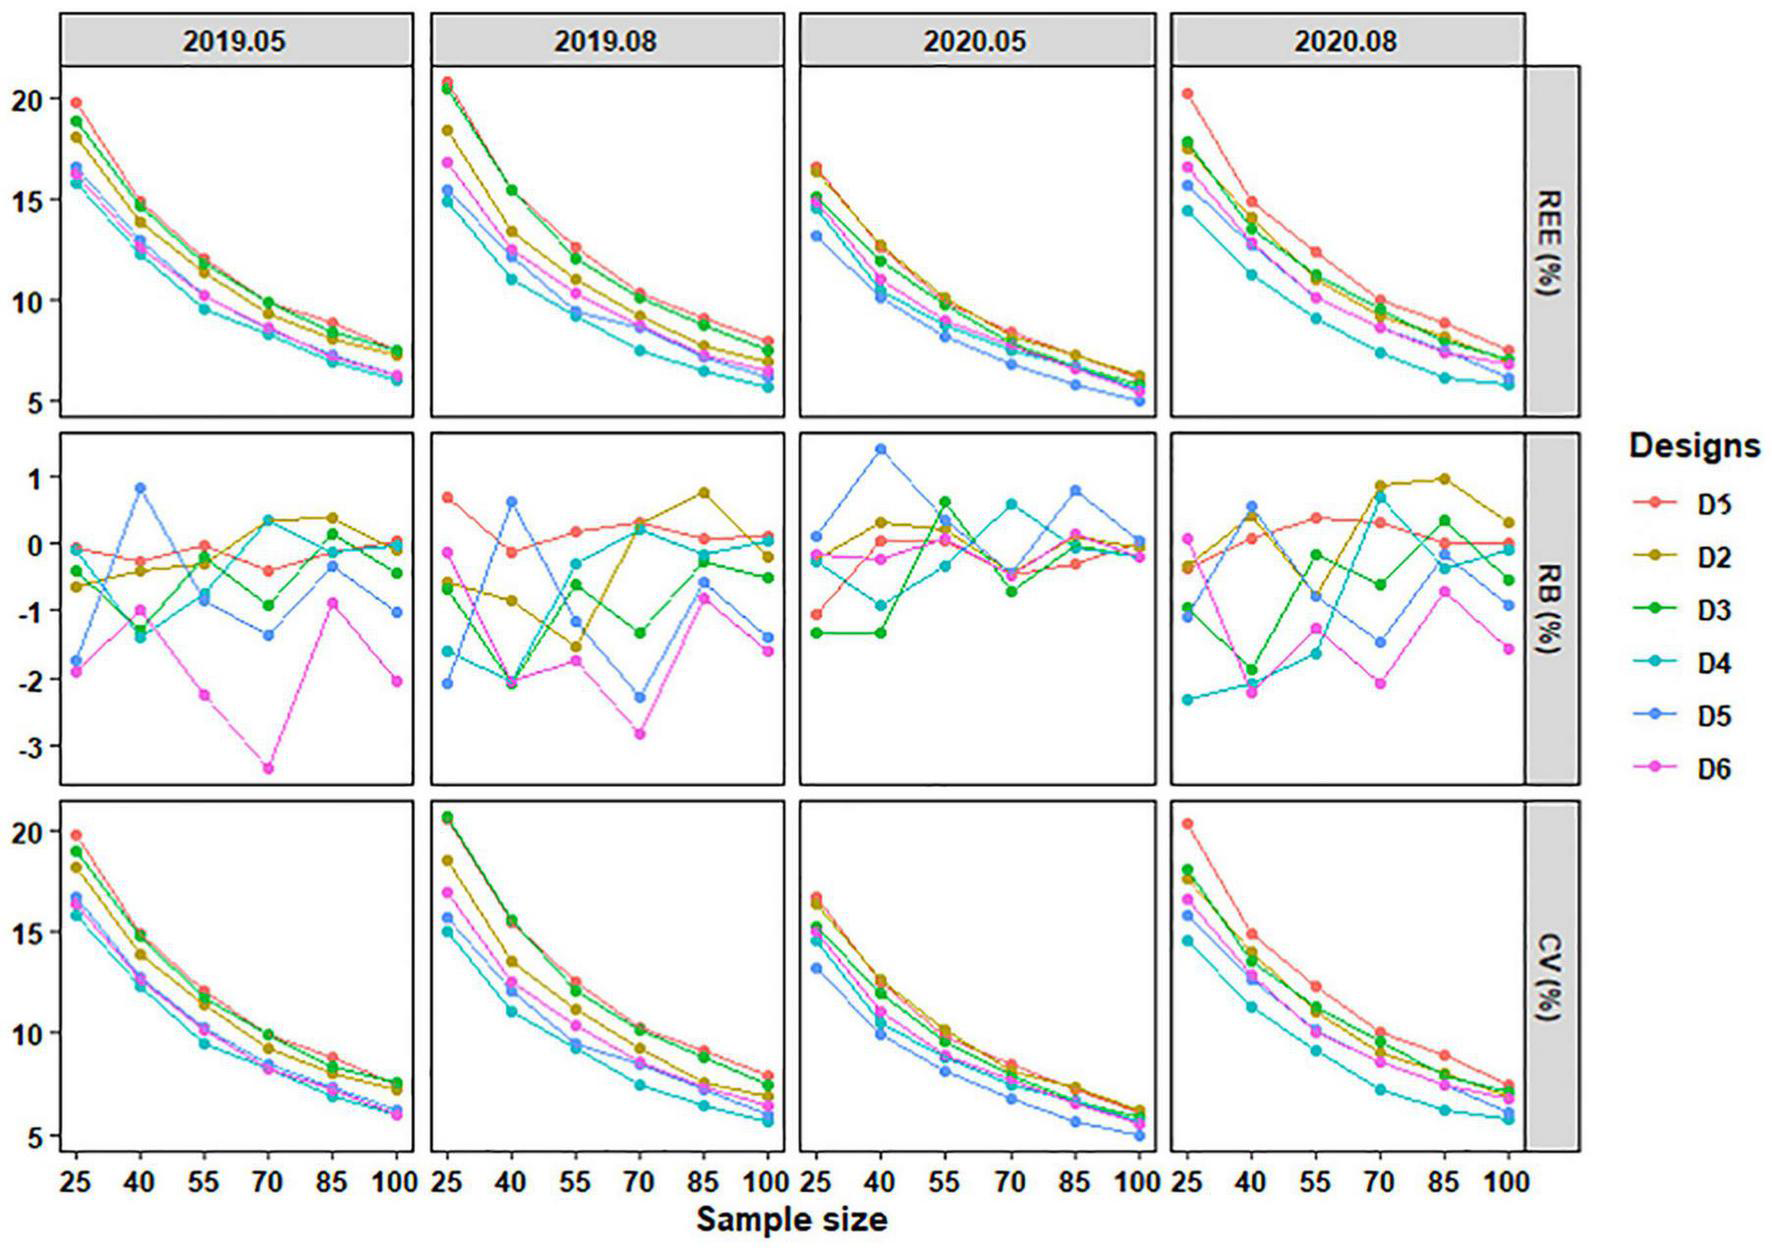
The REE, RB, and CV of stratified schemes for sampling C. mystus larvae at different sample sizes. D1 to D6 represent Design 1 to Design 6, respectively.
The regression curves showed that mean of REE, absolute RB, and CV reduced with sample size increased (Figure 9). We found that mean of REE and CV had a similar trend. There were still differences between them with less sample size for eggs instead of larvae. The differences tended to mitigate with sample size increased. Both for Designs 5 and 6, the changing rates of regression curves were getting closer to 0 at the size of 45–55. It indicated that the three estimators reduced slightly with more sample sizes. Designs 5 and 6 with a sample size of 45–55 should be more efficient to monitor the dynamics of C. mystus eggs and larvae.
FIGURE 9
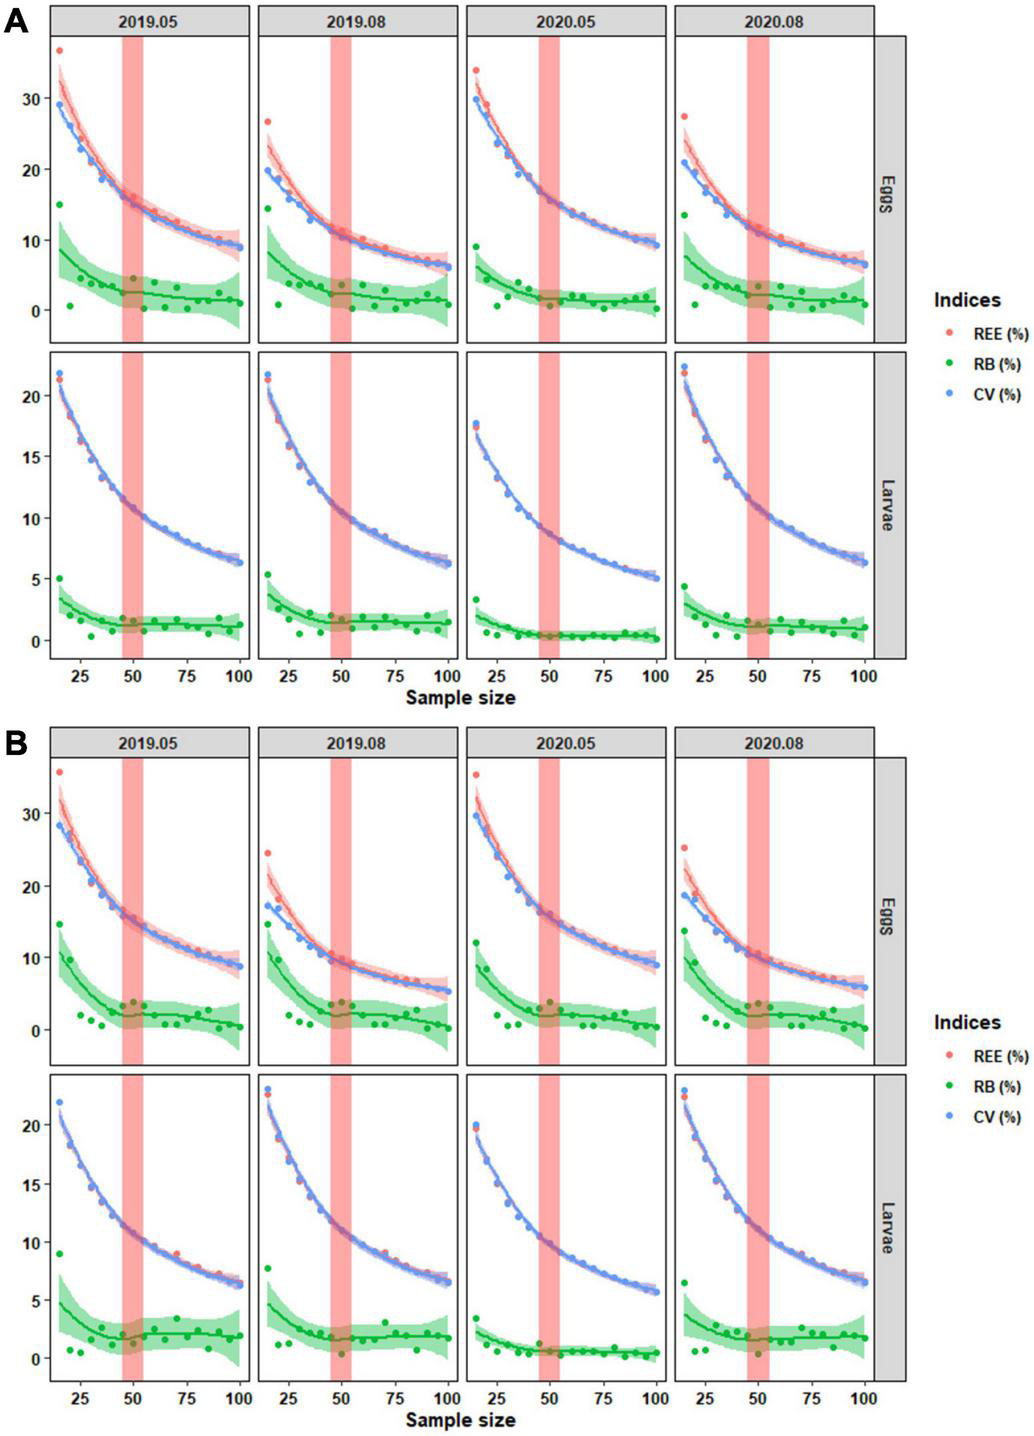
The locally weighted regression for mean of REE, absolute RB, and CV on C. mystus eggs and larvae at different sample sizes. (A) Design 5 and (B) Design 6. The shadows around the lines represent 95% CIs. The red bars cover the changing rates of regression curves closing to zero.
Discussion
In this study, we compared and evaluated the performances of different stratified schemes with various sample sizes, attempting to find cost-efficient sampling designs for monitoring the dynamics of C. mystus ichthyoplankton. The performances were evaluated by REE, RB, and CV, which expressed their precision, deviation, and dispersion, respectively. It is well understood that simple random sampling could provide an unbiased mean of the population (Li et al., 2015; Ma et al., 2020). However, a better sampling should pay more attention to not only bias mitigation but also precision improvement (Cochran, 1977). Because the REE with SRS was lower than that with simple random sampling, we concluded that appropriate stratification could be applied to improve sampling precision. This coincided with previous studies, which indicated that SRS often improved precision and accuracy (Xu et al., 2015a; Wang et al., 2018).
It was expected that stratification should make intra-stratum homogeneity and inter-stratum heterogeneity (Manly et al., 2002; Miller et al., 2007). An appropriate stratification enhanced the ability of SRS to estimate the mean of the population (Ma et al., 2020). When sampling C. mystus eggs, more accuracy was found in Design 3 than in Design 2. It was because strata in Design 3 could reflect the gradient variation of egg density, which improved the stratified effect. However, the inappropriate division would translate into minimal improvement, even worse than simple random sampling (Wang et al., 2018). For example, there was hardly any difference in REE and CV between Designs 1 and 3 for sampling larvae in May and August 2019. Similarly, Design 2 performed no better than Design 1 for sampling larvae in May 2020. They divided different sizes of larval density into one stratum, resulting in the reduction of density disparity among strata.
We highlighted Designs 5 and 6 not only for their performance compatibility between C. mystus eggs and larvae but also for their robustness over time. The three indices used to quantify the performance of sampling designs were calculated by the “true” population, which were predicted from the fishery-independent survey data collected by Design 4. It was supposed that the used sampling design for our survey (i.e., Design 4) would perform best among different designs. However, it showed a bad performance in capturing the population of C. mystus eggs. Since the distribution pattern exhibited obvious spatial differences between C. mystus eggs and larvae, the monitoring program required a balanced consideration on both. Despite Designs 5 and 6 had slightly lower precision and higher dispersion for larvae, they were the preferred options concerning both eggs and larvae. Besides, the differences of C. mystus larvae have been found in May 2020, which included the increases in resources and changes in distribution. Designs 5 and 6 showed strong robustness to those changes, even exceeded Design 4, and Design 5 was especially the best. This was consistent with the studies by Cao et al. (2014) and Xu et al. (2015b), who suggested that appropriate stratified random design was robust to different distributions.
Compared to SRS in other coastal water, more stratifications are needed in the Yangtze Estuary to ensure the accuracy of sampling, even though we only focused on C. mystus eggs and larvae (Xu et al., 2015a; Wang et al., 2018; Wang et al., 2020). The differences might be due to the patchy distribution of ichthyoplankton or the environmental heterogeneity in the estuary area. The predicted results illustrated that C. mystus eggs and larvae had a patchy distribution. Specifically, eggs assembled in the South Branch, and larvae spread to the North Branch and adjacent sea. According to the performances of stratified schemes, we suggested that the study area should be stratified by not only the North Branch and South Branch but also river and sea (e.g., Design 4). No less than two stratifications were required in the South Branch (e.g., Designs 3 and 5), and further division in the North Branch and adjacent sea would also improve the precision (e.g., Designs 5 and 6).
Monitoring early resources might need a higher resolution survey to capture the patchy distribution of ichthyoplankton in the Yangtze Estuary. An increasing sample size contributed to improving the precision in different sampling designs (Wang et al., 2020). Besides, different designs had various accuracy enhancement effects under the same sample sizes. The changing rate of mean REE, absolute RB, and CV tended to be stable, which made sense to find an efficient sample size to monitor the dynamic of C. mystus ichthyoplankton. For a given certain precision, Designs 5 and 6 required fewer sample sizes than others. Their monitoring effects became efficient at the range of 45–55, which was considered as the optimal range of sample size. The resolution of our study (approximately 92–113 stations per 104 km2) was higher than that of the study by Xu et al. (2015b; approximately 9–11 stations per 104 km2), although there were differences between sampling nets.
Compared with the sampling design for adult fish, the sampling design for ichthyoplankton seemed more complicated, especially in the estuary area with complex habitats. According to the ecology of fish early life stage, most species during the egg stage were passively adrift, and their patchy distribution can be caused by diffusion and retention. Meanwhile, some species were supposed to have the potential ability to swim to their favorite places during the larval stage. Therefore, there might be some differences in the spatial distribution patterns between egg and larva stages. In this study, the optimal design scheme (e.g., Designs 5 and 6) were with more complex strata designs and were also different between egg and larva stages. However, most of the existing surveys on fish early life stage were sampled eggs and larvae simultaneously, even focused on multiple species. Their sampling designs could be very complex and should consider more potential factors. That is one of the biggest challenges, especially for the ichthyoplankton sampling, in the field of station optimization design.
The performance of SRS is usually affected by stratified scheme, sample size, and sample allocation (Gavaris and Smith, 1987; Lunsford et al., 2001). Generally, a stratified scheme should be identified by appropriate variables that are associated with the distribution of target species to improve precision by reducing sampling variation (Wilde and Fisher, 1996). In our study, strata that were divided quantitatively by environmental variables (e.g., salinity and depth) were unrealistic, because they changed rapidly (Zhao et al., 2015; Wei et al., 2021) and distributed discretely (Figure 1 and Supplementary Figure 1) in the Yangtze Estuary. The strata in our study were mainly defined by coordinate and region, which could directly and indirectly associate with various environmental variables. For instance, salinity differed among strata in Design 5 (Supplementary Figure 1), and Stratum C was shallower (Figure 1) and Stratum E was more turbid (Yu et al., 2021) in Design 6. In addition, dissolved oxygen was verified as another important factor in determining the distribution of C. mystus ichthyoplankton (Ding, 2011; Hu et al., 2021), but it was removed from the models due to the poor data caused by instrument failure. This might affect the “true” distribution, leading to some impacts on our results. Thus, dissolved oxygen should be considered in the future study. We also evaluated the effect of sample size on sampling precision. There were exceeding 50% of potential stations considered to optimize sample size. It was sufficient because all curves have shown a stable changing rate. The stations would be given priority to the strata with high weight, most of which covered the larval density barycenter. Thus, the mean of sampling data of larvae was closer to the “true” values than that of eggs, leading to the differences between REE and CV for sampling eggs with less sample size. Fortunately, the influence tended to mitigate with sample size increased. In this study, we did not evaluate the effect of sample allocation on stratified schemes, and it deserved to be considered in the future.
Conclusion
We developed six stratified schemes for monitoring C. mystus ichthyoplankton in the Yangtze Estuary to evaluate their performances under various sample sizes. The results indicated that stratified schemes should be divided not only between the North Branch and South Branch but also between the river and sea. Also, there need more stratifications in the South Branch to improve estimated precision. Sample size at the range of 45–55 was considered as the cost-efficient design. We suggested that the complex stratification and high-resolution stations should be used for capturing the dynamic of ichthyoplankton in the estuary area. The performance of the sampling design could be greatly influenced by the distribution pattern of target species, but the design ideology and optimization methodology in our study would provide references to future sampling designs for ichthyoplankton in the estuary area.
Publisher’s Note
All claims expressed in this article are solely those of the authors and do not necessarily represent those of their affiliated organizations, or those of the publisher, the editors and the reviewers. Any product that may be evaluated in this article, or claim that may be made by its manufacturer, is not guaranteed or endorsed by the publisher.
Statements
Data availability statement
The original contributions presented in the study are included in the article/Supplementary Material, further inquiries can be directed to the corresponding author.
Ethics statement
The animal study was reviewed and approved by Shanghai Ocean University.
Author contributions
XL and ZL designed the study. XL and PS collected the data. XL, DW, and PS analyzed and interpreted the data. XL wrote the first draft. RW, ZL, and FZ improved the draft. All authors contributed to the final manuscript.
Funding
This study was supported by the Tracking Evaluation on Recovery Effect of Fishing Ban in Key Water Areas of the Yangtze River Basin (Grant No. D-8021-20-0073), the Estimation of Spawning Population Biomass of Coilia mystus in the Yangtze Estuary Based on Daily Egg Production Method (Grant No. A2-2006-21-200309), and the Scientific Research Foundation for the Imported Talent by RW (Grant No. A1-2006-21-7009).
Acknowledgments
We thank our colleagues for their contributions to data collection and laboratory experiments. We also thank reviewers for their comments to improve our manuscript.
Conflict of interest
The authors declare that the research was conducted in the absence of any commercial or financial relationships that could be construed as a potential conflict of interest.
Supplementary material
The Supplementary Material for this article can be found online at: https://www.frontiersin.org/articles/10.3389/fmars.2021.767273/full#supplementary-material
References
1
AkaikeH. (1974). A new look at the statistical model identification.IEEE Trans. Automat. Contr.19716–723.
2
BijleveldA. I.GilsJ. A. V.MeerJ. V. D.DekingaA.KraanC.VeerH. W. V. D. (2012). Designing a benthic monitoring programme with multiple conflicting objectives.Methods Ecol. Evol.3526–536. 10.1111/j.2041-210X.2012.00192.x
3
BjorkstedtE. P.GoerickeR.McClatchieS.WeberE.WatsonW.LoN. (2011). State of the California current 2010–2011: regional variable responses to a strong (but fleeting?) La Niña.Calif. Coop. Ocean. Fish. Investig. Rep.5236–68.
4
BlabolilP.BoukalD. S.RicardD.KubečkaJ.ŘíhaM.VašekM. (2017). Optimal gillnet sampling design for the estimation of fish community indicators in heterogeneous freshwater ecosystems.Ecol. Indic.77368–376. 10.1016/j.ecolind.2017.02.036
5
CaoJ.ChenY.ChangJ.ChenX. (2014). An evaluation of an inshore bottom trawl survey design for American lobster (Homarus americanus) using computer simulations.J. Northwest Atl. Fish. Sci.4627–39. 10.2960/J.v46.m696
6
ChenY. (1996). A Monte Carlo study on impacts of the size of subsample catch on estimation of fish stock parameters.Fish. Res.26207–223. 10.1016/0165-7836(95)00447-5
7
ChenY. (2017). Spatio-Temporal Variation of Fishery Resources in the Yellow Sea and Yangtze River Estuary.Ph.D. thesis.Beijing: University of Chinses Academy of Sciences.
8
ChengX. (2021). Study on the construction of long-term mechanism of “Ten-year Fishing Ban” in major water areas of the Yangtze River basin.J. Anhui Acad. Gov.6104–112.
9
CochranW. G. (1977). Sampling Techniques, 3rd Edn. New York, NY: Wiley.
10
DingY. (2011). The Temporal and Spatial Variation of the Fish Recruitment Resource in Yangtze River Estuary.Ph.D. thesis.Beijing: University of Chinses Academy of Sciences.
11
DorayM.DuhamelE.HuretM.PetitgasP.MasséJ. (2000). PELGAS.10.18142/18
12
DorayM.PetitgasP.RomagnanJ. B.HuretM.DuhamelE.DupuyC. (2017). The PELGAS survey: Ship-based integrated monitoring of the Bay of Biscay pelagic ecosystem.Prog. Oceanogr.16615–29. 10.1016/j.pocean.2017.09.015
13
EdwardsM.BeaugrandG.HaysG. C.KoslowA.RichardsonA. J. (2010). Multi-decadal oceanic ecological datasets and their application in marine policy and management.Trends Ecol. Evol.25602–610. 10.1016/j.tree.2010.07.007
14
GavarisS.SmithS. J. (1987). Effect of allocation and stratification strategies on precision of survey abundance estimates for Atlantic cod (Gadus morhua) on the Eastern Scotian Shelf.J. Northwest Atl. Fish. Sci.7137–144.
15
HastieT. J.TibshiraniR. J. (1986). Generalized additive models.Stat. Sci.1297–310. 10.1214/ss/1177013604
16
HeW.LiZ.LiuJ.LiY.MurphyB. R.XieS. (2008). Validation of a method of estimating age, modelling growth, and describing the age composition of Coilia mystus from the Yangtze Estuary, China.ICES J. Mar. Sci.651655–1661. 10.1093/icesjms/fsn143
17
HsiehC. H.ReissC.WatsonW.AllenA. J.HunterJ. R.LeaR. N. (2005). A comparison of long-term trends and variability in populations of larvae of exploited and unexploited fishes in the Southern California region: a community approach.Prog. Oceanogr.67160–185. 10.1016/j.pocean.2005.05.002
18
HuL.SongC.GengZ.ZhaoF.JiangJ.LiuR.et al (2021). Temporal and spatial distribution of Coiliamystus larvae and juveniles in the Yangtze Estuary during the main breeding season.J. Fish. Sci. China281152–1161.
19
JardimE.RibeiroP. J. (2007). Geostatistical assessment of sampling designs for Portuguese bottom trawl surveys.Fish. Res.85239–247. 10.1016/j.fishres.2007.02.014
20
JiaoY.ChenY.SchneiderD.WroblewskiJ. (2004). A simulation study of impacts of error structure on modeling stock-recruitment data using generalized linear models.Can. J. Fish. Aquat. Sci.61122–133. 10.1139/f03-149
21
KoslowJ. A.DavisonP. C. (2016). Productivity and biomass of fishes in the California current large marine ecosystem: comparison of fishery-dependent and -independent time series.Environ. Dev.1723–32. 10.1016/j.envdev.2015.08.005
22
KoslowJ. A.WrightM. (2016). Ichthyoplankton sampling design to monitor marine fish populations and communities.Mar. Policy6855–64. 10.1016/j.marpol.2016.02.011
23
LiB.CaoJ.ChangJ.WilsonC.ChenY. (2015). Evaluation of effectiveness of fixed-station sampling for monitoring American Lobster settlement.N. Am. J. Fish. Manag.35942–957. 10.1080/02755947.2015.1074961
24
LinN.ChenY.JinY.YuanX.LingJ.JiangY. (2018). Distribution of the early life stages of small yellow croaker in the Yangtze River estuary and adjacent waters.Fish. Sci.84357–363. 10.1007/s12562-018-1177-6
25
LiuQ.ChenJ.LiuH.ZhangD. (2020). Study of surface sediment characteristics in the south and north passages of the Yangtze estuary in 2019 flood and dry seasons.Ocean Eng.38100–108.
26
LiuY.ChenY.ChengJ. (2009). A comparative study of optimization methods and conventional methods for sampling design in fishery-independent surveys.ICES J. Mar. Sci.661873–1882. 10.1093/icesjms/fsp157
27
LunsfordC.HaldorsonL.FujiokaJ. T.QuinnT. J. (2001). Distribution patterns and survey design considerations of Pacific Ocean perch (Sebastes alutus) in the Gulf of Alaska.Spat. Process. Manag. Mar. Popul.17281–302.
28
LuoB.ShenH. (1994). The Three Gorges Project and Estuarine Ecological Environment.Beijing: China Science Publishing & Media Ltd.
29
MaJ.TianS.GaoC.KindongR.ZhaoJ. (2020). Evaluation of sampling designs for different fishery groups in the Yangtze River estuary, China.Reg. Stud. Mar. Sci.381–8.
30
ManlyB. F. J.AkroydJ. A. M.WalsheK. A. R. (2002). Two-phase stratified random surveys on multiple populations at multiple locations.N. Z. J. Mar. Freshw. Res.36581–591. 10.1080/00288330.2002.9517114
31
McClatchieS. (2014). Regional Fisheries Oceanography of the California Current System: The CalCOFI Program.London: Springer.
32
McClatchieS.Duffy-AndersonJ.FieldJ. C.GoerickeR.GriffithD.HaniskoD. S. (2014). Long time series in US fisheries oceanography.Oceanography2748–67. 10.5670/oceanog.2014.86
33
MengF. (2010). Material Transport and Study of Dynamic Mechanism in the Yangtze River Estuary.Ph.D. thesis.Shenyang: Shenyang Ligong University.
34
MillerT. J.SkalskiJ. R.IanelliJ. N. (2007). Optimizing a stratified sampling design when faced with multiple objectives.ICES J. Mar. Sci.6497–109. 10.1093/icesjms/fsl013
35
NiJ.GuoH.TangW.ZhangY.ZhangX. (2020). On interannual variations of Coilia mystus catches in the Yangtze River Estuary.Mar. Fish.42192–204.
36
NiY.ChenY. (2006). Fishery resources, ecological environment, production status and fishery position and adjustment in the Yangtze Estuary.Fish. Sci. Technol. Inform.33121–127.
37
PuertaP.JohnsonB.CiannelliL.HelserT.LauthR. (2018). Subsampling populations with spatially structured traits: a field comparison of stratified and random strategies.Can. J. Fish. Aquat. Sci.76511–522. 10.1139/cjfas-2017-0248
38
ShonoH. (2008). Application of the Tweedie distribution to zero catch data in CPUE analysis.Fish. Res.93154–162. 10.1016/j.fishres.2008.03.006
39
ThompsonB. M.RileyJ. D. (1981). Egg and larval development studies in the North Sea cod (Gadus morhua L.).Rapp. P.-V. Reun. Cons. Int. Explor. Mer178553–559.
40
WanR.JiangY. (2000). The species and biological characteristics of the eggs and larvae of osteichthyes in the Bohai Sea and Yellow Sea.J. Shanghai Fish. Univ.9290–297.
41
WanR.ZhouF.ShanX.SunS. (2010). Impacts of variability of habitat factors on species composition of ichthyoplankton and distribution of fish spawning ground in the Changjiang River estuary and its adjacent waters.Acta Ecol. Sin.30155–165. 10.1016/j.chnaes.2010.04.006
42
WangH.DaiX.GuanW.FanY. (2017). Relationship between the environmental factors and the CPUE (catch per unit effort) of Pseudocarcharias kamoharai in tropical Atlantic Ocean based on the GAM-Tweedie model.Chin. J. Appl. Ecol.282024–2032.
43
WangJ.XuB.ZhangC.XueY.ChenY.RenY. (2018). Evaluation of alternative stratifications for a stratified random fishery-independent survey.Fish. Res.207150–159. 10.1016/j.fishres.2018.06.019
44
WangJ.ZhangC.XueY.XuB.RenY.ChenY. (2020). Comparison of different sampling designs for macrozoobenthos survey in a tidal flat.Reg. Stud. Mar. Sci.351–15. 10.1016/j.rsma.2020.101113
45
WeiW.LuoB.DingL. (2021). Three decadal morphodynamic response of Hengsha island tidal flat wetland to adjacent engineering in Yangtze Estuary.J. Jilin Univ. (Earth Sci. Ed.)511193–1203.
46
WildeG. R.FisherW. L. (1996). Reservoir fisheries sampling and experimental design.Am. Fish. Soc. Symp.16397–409.
47
XianW.KangB.LiuR. (2005). Jellyfish blooms in the Yangtze Estuary.Science30741–41. 10.1126/science.307.5706.41c
48
XuB.RenY.ChenY.XueY.ZhangC.WanR. (2015a). Optimization of stratification scheme for a fishery-independent survey with multiple objectives.Acta Oceanol. Sin.34154–169. 10.1007/s13131-015-0739-z
49
XuB.ZhangC.XueY.RenY.ChenY. (2015b). Optimization of sampling effort for a fishery-independent survey with multiple goals.Environ. Monit. Assess.1871–16. 10.1007/s10661-015-4483-9
50
YanY.GaoJ.ZhuY.ZhengJ. (2001). Preliminary study on relationship between deepwater channel regulation and riverbed evolution.J. Hohai Univ.297–12.
51
YangJ.AraiT.LiuH.MiyazakiN.TsukamotoK. (2006). Reconstructing habitat use of Coilia mystus and Coilia ectenes of the Yangtze River estuary, and of Coilia ectenes of Taihu Lake, based on otolith strontium and calcium.J. Fish Biol.691120–1135. 10.1111/j.1095-8649.2006.01186.x
52
YuS.HeQ.ChenY.DengZ. (2021). Response of suspended sediment particle size to sediment reduction in the Yangtze Estuary turbidity maximum zone.J. Sediment Res.4660–67.
53
ZhangZ.MammolaS.XianW.ZhangH. (2020). Modelling the potential impacts of climate change on the distribution of ichthyoplankton in the Yangtze Estuary, China.Divers. Distrib.26126–137. 10.1111/ddi.13002
54
ZhaoC.ZhangR. (1985). Fish Eggs and Larvae in Offshore Waters of China.Shanghai: Shanghai Scientific and Technical Publishers.
55
ZhaoK.WuB.YouQ.RenJ.WangQ. (2015). Spatio-temporal distribution of zooplankton and its relation with environmental factors in Jiuduansha inshore waters of Yangtze estuary.J. Saf. Environ.15374–379.
56
ZhuangP. (2013). The Diverse Habitats and Aquatic Animals of the Yangtze Estuary.Beijing: China Science Publishing & Media Ltd.
Summary
Keywords
sampling design, stratified scheme, sample size, ichthyoplankton, Coilia mystus, the Yangtze Estuary
Citation
Long X, Wan R, Li Z, Wang D, Song P and Zhang F (2022) Sampling Designs for Monitoring Ichthyoplankton in the Estuary Area: A Case Study on Coilia mystus in the Yangtze Estuary. Front. Mar. Sci. 8:767273. doi: 10.3389/fmars.2021.767273
Received
30 August 2021
Accepted
13 December 2021
Published
10 January 2022
Volume
8 - 2021
Edited by
Yuan Li, Third Institute of Oceanography, Ministry of Natural Resources, China
Reviewed by
Morane Clavel-Henry, University College Dublin, Ireland; Frank Hernandez, University of Southern Mississippi, United States
Updates
Copyright
© 2022 Long, Wan, Li, Wang, Song and Zhang.
This is an open-access article distributed under the terms of the Creative Commons Attribution License (CC BY). The use, distribution or reproduction in other forums is permitted, provided the original author(s) and the copyright owner(s) are credited and that the original publication in this journal is cited, in accordance with accepted academic practice. No use, distribution or reproduction is permitted which does not comply with these terms.
*Correspondence: Zengguang Li, zgli@shou.edu.cn
This article was submitted to Marine Fisheries, Aquaculture and Living Resources, a section of the journal Frontiers in Marine Science
Disclaimer
All claims expressed in this article are solely those of the authors and do not necessarily represent those of their affiliated organizations, or those of the publisher, the editors and the reviewers. Any product that may be evaluated in this article or claim that may be made by its manufacturer is not guaranteed or endorsed by the publisher.