 Savannah L. Goode
 Ashley A. Rowden
 David A. Bowden
 Malcolm R. Clark
 Fabrice Stephenson
- 1School of Biological Sciences, Victoria University of Wellington, Wellington, New Zealand
- 2National Institute of Water and Atmospheric Research, Wellington, New Zealand
- 3National Institute of Water and Atmospheric Research, Hamilton, New Zealand
Seamounts are common features of the deep seafloor that are often associated with aggregations of mega-epibenthic fauna, including deep-sea corals and sponges. Globally, many seamounts also host abundant fish stocks, supporting commercial bottom trawl fisheries that impact non-target benthic species through damage and/or removal of these non-target species. However, the effects of bottom trawling on seamount benthic communities, as well as their recovery potential, will vary over the total seamount area because of differences in within seamount habitat and community structure. It is therefore important to understand fine-scale community dynamics, community patch characteristics, and the environmental drivers contributing to these patterns to improve habitat mapping efforts on seamounts and to determine the potential for benthic communities on seamounts to recover from fishing disturbances. Here we analysed the structure and distribution of mega-epibenthic communities on two New Zealand seamounts with different physical environments to determine which environmental variables best correlated with variation in community structure within each seamount. We used the identified environmental variables to predict the distribution of communities beyond the sampled areas, then described the spatial patterns and patch characteristics of the predicted community distributions. We found the environmental variables that best explained variations in community structure differed between the seamounts and at different spatial scales. These differences were reflected in the distribution models: communities on one seamount were predicted to form bands with depth, while on the other seamount communities varied mostly with broadscale aspect and the presence of small pinnacles. The number and size of community patches, inter-patch distances, and patch connectedness were found to differ both within and between seamounts. These types of analyses and results can be used to inform the spatial management of seamount ecosystems.
Introduction
Seamounts, here defined as undersea hills or mountains with elevations >100 m (Pitcher et al., 2007), are significant marine habitats estimated to comprise up to 20 percent of the global seafloor (Yesson et al., 2011). These features can host distinct communities with high benthic abundance, biomass, and species richness compared to surrounding habitats, although this is not a universal pattern (Rowden et al., 2010). Within a seamount, mega-epibenthic communities are often heterogeneously distributed and exhibit high species variation among sites, generally termed ‘beta diversity’, over varying horizontal and vertical distances (McClain et al., 2010; Henry et al., 2014; Schlacher et al., 2014; De la Torriente et al., 2018; Victorero et al., 2018; Morgan et al., 2019). High beta diversity on seamounts over large depth ranges (1000 s metres) is predicted to be correlated with depth-related environmental gradients (e.g., temperature, oxygen, aragonite saturation state, water mass characteristics) and changes in seafloor terrain, causing vertical zonation of some species through the provision of different ecological niches (McClain and Lundsten, 2015; Du Preez et al., 2016; De la Torriente et al., 2018; Victorero et al., 2018). Over smaller depth ranges (10 – 100 s metres), fine-scale variation in habitat may affect local species recruitment, contributing to species turnover with changes in depth (Long and Baco, 2014; Morgan et al., 2019), whereas differences in hydrodynamic conditions between the sides on large seamounts may contribute to horizontal species turnover (Morgan et al., 2019). Substrate composition may also vary within a single seamount, ranging from fine muddy sediments to steep rocky outcrops (e.g., Auster et al., 2005; Wienberg et al., 2013), and thereby contribute to fine-scale structural variation of benthic communities on seamounts (Boschen et al., 2015; Du Preez et al., 2016; Victorero et al., 2018; Morgan et al., 2019).
Due to the generally high degree of habitat and community heterogeneity, seamounts can be viewed as mosaics of patches in which individual patches can differ in their biological (i.e., faunal composition and abundance), environmental, and patch characteristics (e.g., size, shape, and spatial distribution of patches) (Levins, 1969; Hanski and Gilpin, 1991). Therefore, the (1) magnitude and extent of impacts caused by human disturbances such as bottom trawling to benthic communities on a seamount (e.g., Clark and Rowden, 2009), and (2) their potential for recovery, may differ between patches depending on the community structure and physical characteristics of the patches that they occupy. The former is because different taxa are likely to exhibit variable responses to trawling impacts (Clark et al., 2010b, 2016; Goode et al., 2020), and the latter because patch characteristics can influence the recolonisation potential of disturbed species populations (Sousa, 1984; Smith and Brumsickle, 1989; Kim and DeWreede, 1996; Gallucci et al., 2008; Angelini and Silliman, 2012), which may change over time after a disturbance (Teixidó et al., 2007). It is therefore important to understand the local-scale community and patch dynamics on seamounts to better assess their potential for recovery from fishing impacts. Identifying the main environmental drivers of local-scale variability can in turn be used to make predictive models of the spatial distributions of identified communities within an individual seamount. Although the management of fishing impacts on seamounts is typically perceived as requiring a large-scale approach (e.g., Clark and Dunn, 2012), mapping the spatial distribution of communities on individual seamounts can help determine their patch characteristics and inform the management of fishing on seamounts at small spatial scales (i.e., within seamounts; Rowden et al., 2017; Morgan and Baco, 2021). However, community distribution models and maps at the within-seamount scale are scarce; although recently seafloor terrain and substrate variables have been used to predict spatial distributions of benthic communities on seamounts (Du Preez et al., 2016; Serrano et al., 2017). The continued development of these techniques can improve our understanding of community assembly on seamounts and inform predictions of potential changes to seamount benthic communities over time and space with either natural or human-induced disturbances.
Here, we focused our study on two New Zealand seamounts to explore the extent to which the same or similar habitat and environmental variables explain within-seamount community structure among features of differing size, depth, topography, and geographic location in the New Zealand region. Specifically, our objectives were to: (1) identify and describe the structure and distribution of mega-epibenthic communities on the study seamounts; (2) determine which environmental and habitat variables best correlate with variation in community structure and distribution within both seamounts; (3) predict the distribution of the identified communities beyond the sampled areas using spatial predictions developed from these correlations; and (4) describe the patterns of the predicted spatial distributions of each community, in particular the community patch characteristics.
Methods
Study Sites
The ‘Graveyard’ and ‘Andes’ seamount complexes were surveyed in 2015 as part of a broader study examining the impacts of fishing on seamount benthic communities and their recovery potential (Clark and Rowden, 2009; Clark et al., 2010a, 2019; Williams et al., 2010; Figure 1). Both seamount complexes are located on Chatham Rise, a submarine continental ridge extending approximately 1,000 km east from South Island, New Zealand. Situated below the Subtropical Front, Chatham Rise is a highly productive region (Murphy et al., 2001; Sutton, 2001) with high benthic biodiversity and biomass (Nodder et al., 2012). Commercial deep-water trawl fisheries for orange roughy (Hoplostethus atlanticus), oreo (Allocytus niger and Pseudocyttus maculatus), and alfonsino (Beryx splendens) target Chatham Rise seamounts (Clark and O’Driscoll, 2003; O’Driscoll and Clark, 2005; Clark et al., 2010b).
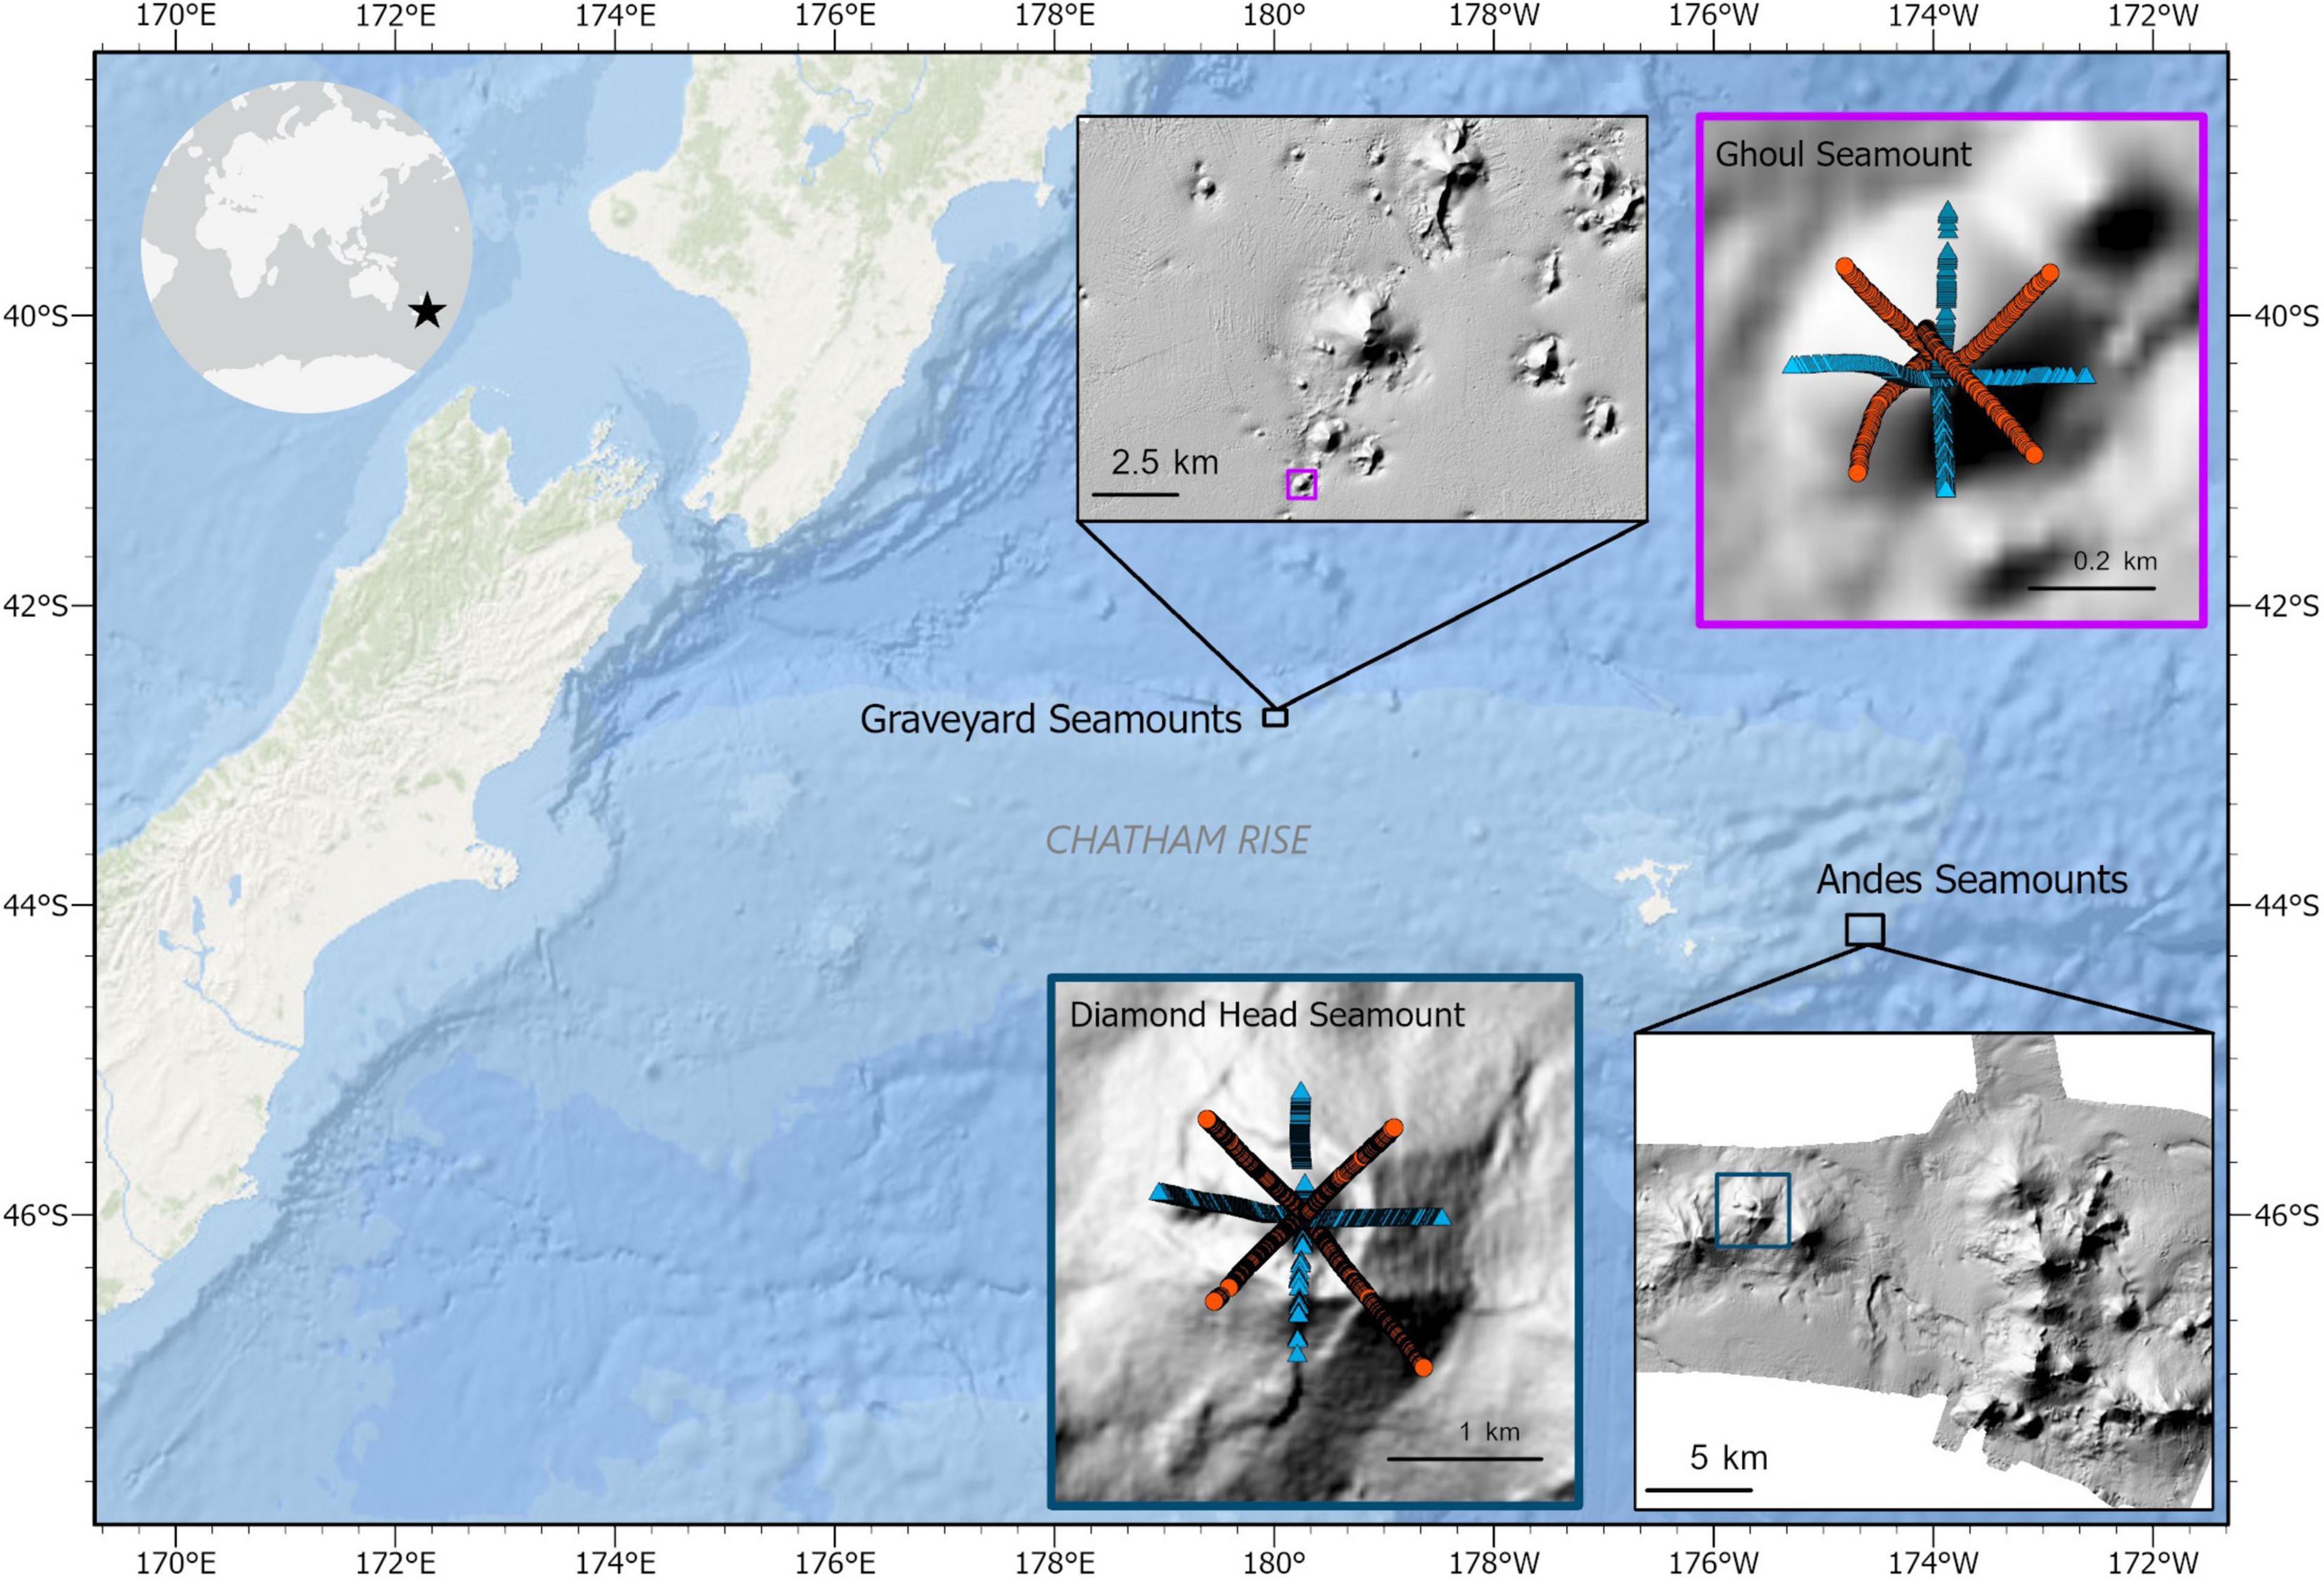
Figure 1. Locations of the Graveyard (part of) and Andes seamount complexes on Chatham Rise off New Zealand. Map insets of Ghoul and Diamond Head show the locations of images which were included in the analyses of the two seamounts, as well as the annotation method which was used; orange circles represent images that were annotated only for substrate composition data, while blue triangles represent images annotated for both taxon abundance and substrate composition. Only images with visible seafloor areas between 1 and 5 m2 and located within the seamount basal perimeters are included in this figure (see section “Methods” and Supplementary Figure 1 for details).
Each seamount complex examined here comprises features with varying fishing histories (i.e., untrawled, previously trawled, and actively trawled). The Graveyard Seamounts complex includes 28 seamounts ∼100-400 m in elevation, spanning depths from 750 to 1,600 m (Figure 1). The Andes Seamounts are a cluster of 12 seamounts ranging in depth from 500 to 1,300 m (Figure 1). One seamount with no known bottom trawling history was selected from each seamount complex to investigate variation in mega-epibenthic community structure within untrawled seamount habitats. These two seamounts were chosen to represent different physical, environmental, and biological characteristics on Chatham Rise. Ghoul (Graveyard complex) is a small seamount, or ‘knoll’, covering an area of 0.16 km2 with a total height of ∼100 m and roughly conical shape (Figure 1). From summit to base, it ranges from 930 to 1030 m depth. Bottom currents near Ghoul flow at maximum speeds of 10-20 cm–s (Nodder and Northcote, 2001), forming a moat around the base of the seamount (Clark and Rowden, 2010). Diamond Head (Andes complex) is a group of 3 rugose, domed peaks, though here data was only analysed from the central peak, which covers an area of 3.13 km2 and has an elevation of 300 m spanning water depths of ∼600-900 m (Figure 1). Both Ghoul and Diamond Head, along with many other New Zealand seamounts, were formed by widespread Cenozoic intraplate volcanism (Gamble et al., 1986; Hoernle et al., 2006; Timm et al., 2010; Mortimer and Scott, 2020). Surface productivity near both seamounts is high, with estimated mean chlorophyll a around 0.5 and 0.4 mg Chl-a m–3 at Ghoul and Diamond Head, respectively (Chiswell et al., 2013).
Image Survey and Analysis
The study seamounts were sampled with the National Institute of Water and Atmospheric Research (NIWA) Deep Towed Imaging System (DTIS, Hill, 2009; Bowden and Jones, 2016) from the R/V Tangaroa. DTIS is a towed camera frame equipped for the 2015 voyage with a Canon EOS 400D used to capture downward-facing high definition still images automatically triggered every 15 s at 10-megapixel resolution. Simultaneous high definition (HD 1080i) video was recorded. Video and still images were scaled using paired 0.2 m spaced parallel lasers projected into the imaged area of each camera. For the present analysis, still images were used in preference to video because the still images are more appropriate for development of fine-scale quantitative data on benthic community structure as they have higher image resolution and their seabed areas can be calculated more accurately than from video.
Photographic transects were conducted from the peak of each seamount down to its base along the cardinal and intercardinal directions (N, NE, E, SE, S, SW, W, and NW), at a target speed of 0.2-0.5 m/s and target altitude of 2-3 m. The position of DTIS was monitored by an acoustic ultra-short baseline (USBL) transponder system (Kongsberg HiPAP) and recorded using OFOP (Ocean Floor Observation Protocol) software. DTIS position data was synced to the absolute time each image was taken to obtain precise positions for each seabed image. A Seabird CTD was attached to the DTIS frame to obtain temperature, salinity, and pressure data along each transect. Four DTIS transects (N, E, S, W) from the total eight were selected from Ghoul and Diamond Head seamounts for the present community analysis, while the remaining transects were only analysed to collect additional substrate composition data (Figure 1; see section “Random Forest Model Input Data”). For subsequent analyses, image samples were binned into “sectors” (i.e., the summit and north, east, south, and west sides) for a portion of the community analyses (see section “Community Structure Analysis”). The summit sector was defined by a circle with a radius equal to 0.3 × seamount elevation (Clark et al., 2019) and each side was defined based on the direction of the image sample transects.
All selected images (494 on Ghoul, 999 on Diamond Head) were reviewed and analysed using the online image analysis tool BIIGLE 2.0 (Langenkämper et al., 2017). Images of insufficient quality (e.g., obscured by sediment disturbance) were removed from further analysis, reducing the total number of suitable images to 1,233 (380 on Ghoul, 853 on Diamond Head). All visible epi-benthic megafauna (animals living on or above the seafloor with sizes ≥ 2 cm) were identified to the finest possible taxonomic resolution and counted. Taxonomic guides were referenced (e.g., Tracey et al., 2011, 2014; Opresko et al., 2014) and representative images of observed taxa were sent to taxonomists to ensure correct and consistent identifications of individuals from analysed imagery (see section “Acknowledgements” for taxonomists referenced). Taxon names were designated based on the best practice recommendations for image-based identifications provided by Horton et al. (2021).
In order to quantify substrate composition, 15 dots were randomly overlaid on each image and the substratum at each point classified as one of 13 substrate types (bedrock, pebble, cobble, boulder, rocky outcrop, mud, sand, soft overlay, coral rubble, dead intact stony coral matrix, live intact stony coral matrix, urchin spines, shell hash) based on classifications by Wentworth (1922) and classifications used by previous studies (Clark and Rowden, 2009; Clark et al., 2019). Live coral matrix was re-categorised as bedrock (the substrate to which the live corals are attached) for subsequent analyses, to prevent the issue of including reef-forming coral species in both the substrate and abundance data. This treatment reduced the number of substrate types to 12. Image areas were calculated by reference to the paired lasers and if these could not be detected fauna of known consistent size were used as the scale reference. If neither of these methods was possible, a moving average of image area was calculated and plotted against time along the video transect to extract approximate areas for images of unknown size. That is, based on known areas of other images along each transect where DTIS was at a similar height above the seafloor.
The spatial extent of each seamount (basal perimeter) was delineated to ensure only images from the seamounts were included in subsequent analyses. First, a grid of 25 m cells (the same grid size used to generate bathymetric data from previously collected multibeam echosounder data; see section “Environmental Analysis”) was overlaid on the seamount bathymetry in the Geographic Information System (GIS) ArcGIS Pro 2.6.1. Then a polygon describing the extent of the seamount (along the outer extent of each grid cell) was defined by the point at which concave slope values increase to >20°, which is a typical slope for small seamounts (Grosse et al., 2012; Sánchez-Guillamón et al., 2018). These polygons were then visually compared in GIS with substrate and bathymetry data to help ensure non-seamount communities (e.g., communities of mud sediment on relatively low slope seabed) were not included (Supplementary Figure 1). This process resulted in a total number of 996 images within the seamount basal perimeters.
The influence of image area on the numbers of individuals and taxa observed was examined to evaluate the potential bias due to the influence of image area on the number and sizes of organisms reliably identified from imagery. Images included in the analyses were thus limited to those with visible seabed areas between 1 and 5 m2, a range in which there was no apparent relationship between number of individuals/taxa and sample area (Supplementary Figure 2). This image treatment step reduced the total number of images included for analysis to 818 (262 images on Ghoul, 556 images on Diamond Head). Raw counts of individual taxa from each image were standardized as individuals per 5 m2.
Substrate and faunal abundance data from individual images were allocated to 25 m grid cell ‘samples’ based on the multibeam bathymetry data (see section “Environmental Analysis”), to ensure the biological data matched the finest resolution of the environmental data. This data treatment step yielded 181 total samples (44 on Ghoul, 137 on Diamond Head). Mean standardised taxon abundances and substrate composition were then calculated for each sample. Individual counts and taxon richness were highly variable among samples, with no apparent influence of the number of image replicates per sample on the number of individuals/taxa. However, variability in the number of individuals and taxa was particularly high among samples with one image replicate, therefore, these samples were removed from the analysis, reducing the total sample number to 159 (40 on Ghoul, 119 on Diamond Head).
Environmental Analysis
Detailed bathymetry data were obtained over the study areas in 2002 and 2009 using a Kongsberg EM300 multibeam echosounder (Clark and Rowden, 2009). Backscatter data collected during these surveys unfortunately did not encompass the entirety of the Ghoul study area and could therefore not be used to obtain continuous substrate proxy data for this study. Bathymetry data were gridded at a cell size of 25 m and exported as ESRI gridded formats for use in GIS (ArcGIS Pro 2.6.1). These data were then used to generate seafloor terrain variables: mean, standard deviation, and range of depth; aspect, converted to northness and eastness values (Walbridge et al., 2018); seafloor ruggedness, calculated as the vector ruggedness measure (Sappington et al., 2007; Walbridge et al., 2018); mean, plan, and profile curvature; and mean and standard deviation of slope (Table 1). All seafloor terrain variables except mean depth were gridded at the native 25 m spatial scale and four focal mean sizes (3 × 3, 5 × 5, 7 × 7, and 15 × 15 cells) to allow examination of the influence of spatial scale on community structure.
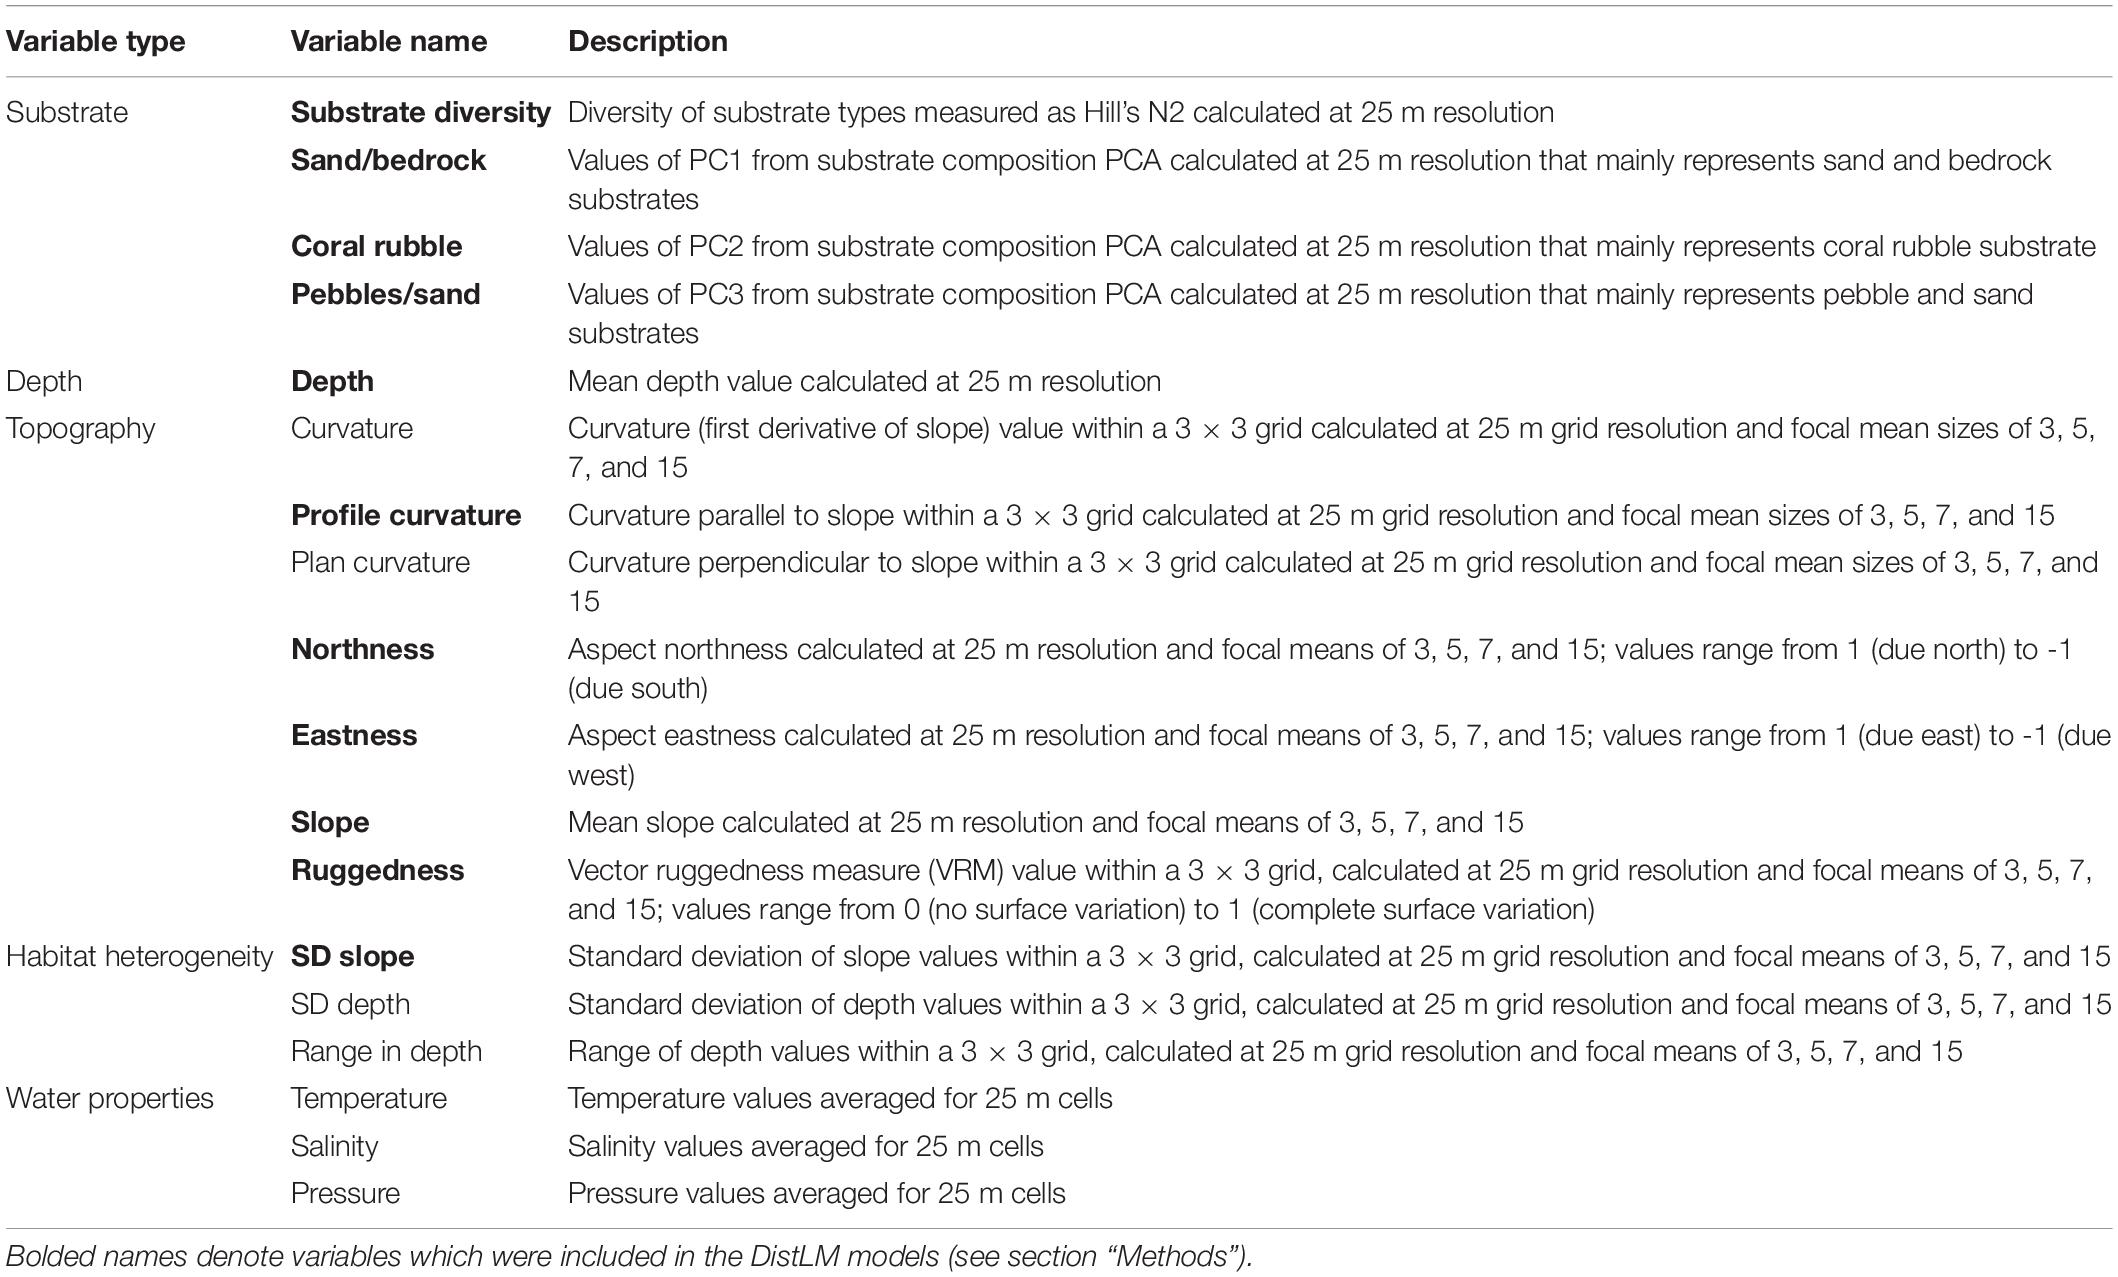
Table 1. Descriptions of all environmental variables originally included for analysis prior to the removal of co-correlates.
Temperature, salinity, and pressure values obtained from along-transect CTD measurements were averaged for each 25 m grid cell. Substrate diversity of each sample was calculated using Hill’s N2 metric (Hill, 1973). Percent compositions of each substrate type were averaged per sample. A principal component analysis (PCA) was performed on substrate composition values to reduce the total number of environmental variables for subsequent regression analyses (Ellingsen et al., 2007). The first three principal component (PC) axes accounted for 85.1% of the cumulative variation between samples. The coordinates of each sample on the first three PC axes, termed the PC scores, were thus used to describe sample substrate composition instead of the image-derived composition values. PC 1 (41.2% variation) broadly represented sand and bedrock composition (coefficients: 0.755 and -0.619). PC 2 (33.6% variation) was mostly represented by coral rubble (coefficient: 0.850). PC3 (10.3% variation) accounted for pebble and sand composition (coefficients: 0.648 and -0.474) (Supplementary Figure 3). PC 1, 2, and 3 are hereafter referred to as “sand/bedrock,” “coral rubble,” and “pebble/sand” substrates.
Community Structure Analysis
Taxon abundance and environmental data were separated by seamount and analysed with multivariate statistical routines in the software package PRIMER v7 (Clarke and Gorley, 2015) with PERMANOVA + (Anderson et al., 2008). Image analyses identified 101 taxa from Diamond Head and 78 from Ghoul (Supplementary Table 1). Faunal count data were square-root transformed to down-weight the effect of highly abundant taxa and ensure rarer taxa still influenced patterns in community structure. Despite this transformation, the abundances of Stylasteridae spp. (spiny morphotypes) on Diamond Head remained substantially higher than all other taxa in nearly all samples. Therefore, a more severe fourth-root transformation was applied to this taxon for the Diamond Head dataset.
Bray-Curtis resemblance matrices were generated from each transformed dataset to quantify dissimilarity among samples within seamounts. Group-average hierarchical clustering (CLUSTER) with similarity profile (SIMPROF) tests were performed on the resemblance matrices to identify samples with similar community structure within each seamount. A p-value of 0.01 was used for the SIMPROF test to help ensure that clear evidence of heterogeneity in faunal abundance and composition was identified between groups before separating groups with few samples (Clarke et al., 2008). Non-metric multidimensional scaling (nMDS) plots were generated to visualize relationships within and between SIMPROF groups, hereafter referred to as “communities.” Similarity percentage (SIMPER) analysis was performed using a cumulative cut-off of 70% to identify taxa which distinguished between communities and contributed to overall within-community similarity. Locations of the identified communities were overlaid on digital terrain models of each seamount using GIS to examine spatial patterns in community structure.
Beta diversity analyses were conducted to further examine spatial variation of mega-epibenthic taxa within each seamount. The R package “betapart” was used to calculate the Jaccard dissimilarity indices turnover (βJTU), nestedness (βJNE), and total beta diversity (βJAC) from taxon presence-absence (see Baselga and Orme, 2012 for calculations). Beta diversity was measured at three spatial scales: (1) whole seamount; (2) among seamount sectors (i.e., the summit and north, east, south, and west sides); and (3) within each sector.
The potential influence of habitat and other environmental parameters on community structural variation within each seamount was analysed using distance-based linear models (DistLM routine in PERMANOVA+). DistLM analyses relationships between predictor variables and a dissimilarity matrix using a regression or multiple regression model (McArdle and Anderson, 2001; Anderson et al., 2008) and thus can be used to identify environmental variables that correlate most strongly with community structure (Anderson et al., 2008). When two variables were highly correlated (Pearson’s r > 0.85), the variable which was correlated with a greater number of additional variables was removed. Depth, however, was retained despite its high correlation with temperature, salinity, and pressure because it was directly measured over each seamount’s extent, while the others were derived from modelled relationships and may not be as accurate. All focal-mean scales were also retained for the selected variables. This selection yielded a total of 39 environmental variables (see bolded variables in Table 1).
Distance-based linear models were run with step-wise selection and the Adjusted R2 criterion (Anderson et al., 2008), with separate analyses for each seamount and for each focal mean scale (i.e., 1 × 1, 3 × 3, 5 × 5, 7 × 7, and 15 × 15 cells), resulting in 5 models for each seamount. Environmental data derived from imagery, including substrate diversity and substrate composition PCs 1, 2, and 3, were included as starting conditions in all models. Distance-based redundancy analysis (dbRDA) plots were produced to visualize environmental variables which contributed most to variation between communities for the best DistLM models.
Community Distribution Modelling
Model Selection and Tuning
Random forest (RF) modelling (Breiman, 2001) was used to predict the spatial distributions of the communities identified by cluster analysis by fitting an ensemble of classification tree models describing the relationship between the communities’ spatial distributions and a set of environmental variables. RF was selected because of its flexibility, built-in variable importance and error estimation (Cutler et al., 2011), and previous use by similar modelling studies to predict species and community distributions on seamounts (Anderson et al., 2016b; Du Preez et al., 2016; Rowden et al., 2017).
Random forest models were constructed for each seamount separately using the “randomForest” R package (Liaw and Wiener, 2002) and tuned using the “caret” R package (Kuhn, 2008) function “train” to select optimal values of mtry (i.e., the number of predictor variables used in each tree node) and ntree (i.e., the number of trees to produce). For both RF seamount models, 5,000 classification trees were produced with an optimal mtry value of 2. Due to the relatively large number of community classes and the sensitivity of RF models to class imbalances (Cutler et al., 2011), community classes that represented < 5% of total samples from each seamount were excluded. The best models were selected based on the lowest overall out-of-bag (OOB) classification error rate. OOB samples are those which were not included in the data subset. The OOB error rate is thus calculated as the proportion of trees in the RF which incorrectly predict the community class of an OOB sample.
Random Forest Model Input Data
Environmental variables selected in the best DistLM models were used as explanatory variables in the RF models. Because substrate composition and diversity derived from individual images were included in the DistLM models (see section “Environmental Correlation With Community Structure”) but were not available as continuous grids of values, rasters of predicted substrate composition PC values and substrate diversity were generated for use in the RF models. First, substrate composition was quantified from four additional image transects on each seamount to generate mean composition values for each 25 m cell along these additional transects (see section “Image Survey and Analysis”). These data were combined with the previously collected substrate composition data to generate adequate spatial coverage for interpolation of substrate types. Mean substrate composition was interpolated across each seamount’s extent using the inverse distance weighted (IDW) function in the ArcGIS Pro “Spatial Analyst” toolbox (e.g., Compton et al., 2012) using the default power value (2) but fixed search radii of 125 and 250 m for Ghoul and Diamond Head, respectively, due to their size differences (Supplementary Figures 4, 5). Percent substrate composition data were then used to calculate substrate diversity as Hill’s N2 metric for each 25 m cell. The “predict.PCA” function in R was used to predict the values of PCs 1 (sand/bedrock), 2 (coral rubble), and 3 (pebble/sand) for each 25 m cell sample based on the PC values of the samples included in the aforementioned community analysis. The final set of explanatory variables used in the RF distribution models consisted of: depth, eastness, northness, slope, standard deviation of slope, profile curvature, ruggedness, substrate diversity, sand/bedrock, coral rubble, and pebble/sand (Supplementary Figures 6, 7). Sample community designations from the SIMPROF based cluster analysis were used as the response variable.
Model Performance and Output
The performance of the RF models was assessed based on area under the receiver operating characteristic curve (AUC) analysis using the “pROC” R package (Robin et al., 2011). The function “multiclass.roc” was used to implement the multiple class extension of the AUC measure (Hand and Till, 2001). This extension was used because the simple AUC measure can only be estimated for two-class scenarios (e.g., species presence-absence) or, for multiple classes, requires the transformation of responses and model predictions to a two-class form. The multiple class extension of AUC is interpreted in the same way as the simple AUC measure, with values greater than 0.5 indicating better than random performance and 0.7 to 1.0 indicating adequate to perfect model performance (Pearce and Ferrier, 2000). Spatial predictions and spatially explicit model uncertainty were estimated for each seamount extent by bootstrapping, in which subsets of input data were sampled randomly with replacement 100 times, and the normalised number of votes (i.e., proportion of trees which voted for each community at every node) were estimated at each model iteration. The normalised votes were averaged over the models’ extents and 95% confidence intervals were calculated to quantify spatial variation in model uncertainties. The seamount community distributions predicted by the RF models, with their corresponding uncertainty estimates, were mapped onto seafloor bathymetry data at a 25 × 25 m resolution. Confusion matrices were produced to examine the OOB error rate for each community class. These matrices are standard outputs of RF models and enable the user to determine which classes are frequently misclassified as another. The importance of each variable to the RF classifications was examined based on the mean decrease in accuracy when predictor variables were removed from the model (Breiman, 2001) using the “importance” function of the “randomForest” R package (Liaw and Wiener, 2002). It is important to note that a variable’s mean decrease in accuracy is relative to the model OOB error rates and sample size; thus, the mean decrease in accuracy measure is used here only to rank variables by their importance to model performance.
Predicted Community Patch and Environmental Characteristics
The RF predictions were used to determine the spatial distributions and patch characteristics of each of the modelled communities (i.e., communities that represented <5% of total samples from each seamount) and their associated environmental characteristics. The R package “landscapemetrics” was used to compute five patch metrics: number of patches; patch area; minimum distance between patches; contiguity index; and patch density (Hesselbarth et al., 2019; see package documentation for full descriptions of each metric). Individual patches were defined using the 8-cell rule whereby all 8 cells in a grid surrounding a central cell are considered contiguous with the central cell. The minimum Euclidean distance in metres between patches of the same community class, i.e., the Euclidean Nearest Neighbor (ENN) distance, was calculated to explore the spatial connectivity of the modelled communities. The contiguity index describes the spatial connectedness of cells in patches of the same community class. Contiguity index values range from 0 to 1, where 0 indicates a one-cell patch and increases as patch connectedness increases. Patch density describes the fragmentation of a community class standardized by the total landscape area (in this case the total seamount area), increasing from 0 to 1,000,000 as the landscape becomes patchier. The “Zonal Statistics” toolbox in ArcGIS Pro was used to describe the environmental characteristics of each community’s predicted spatial distribution, including the depth range, slope range, mean standard deviation of slope, ruggedness, and substrate diversity, and predicted compositions of the major substrate types bedrock, coral rubble, and sand, based on the environmental predictor rasters used for the RF models (see Supplementary Figures 4-7). The substrate composition values were used rather than the PC values to describe community patch characteristics because mean substrate composition is more easily interpreted and related to the predicted distribution of each community.
Results
Seamount Benthic Community Structure
Hierarchical clustering with SIMPROF analysis identified 6 communities on Ghoul and 16 communities on Diamond Head. Of these, community v from Ghoul and community k from Diamond Head each comprised single samples. The nMDS plots showed that Ghoul communities generally formed relatively dispersed but distinct clusters (Figure 2A). In contrast, Diamond Head communities were more tightly clustered, but with an apparent separation between the more dispersed clusters for communities p and o and the remaining 14 communities (Figure 2B).
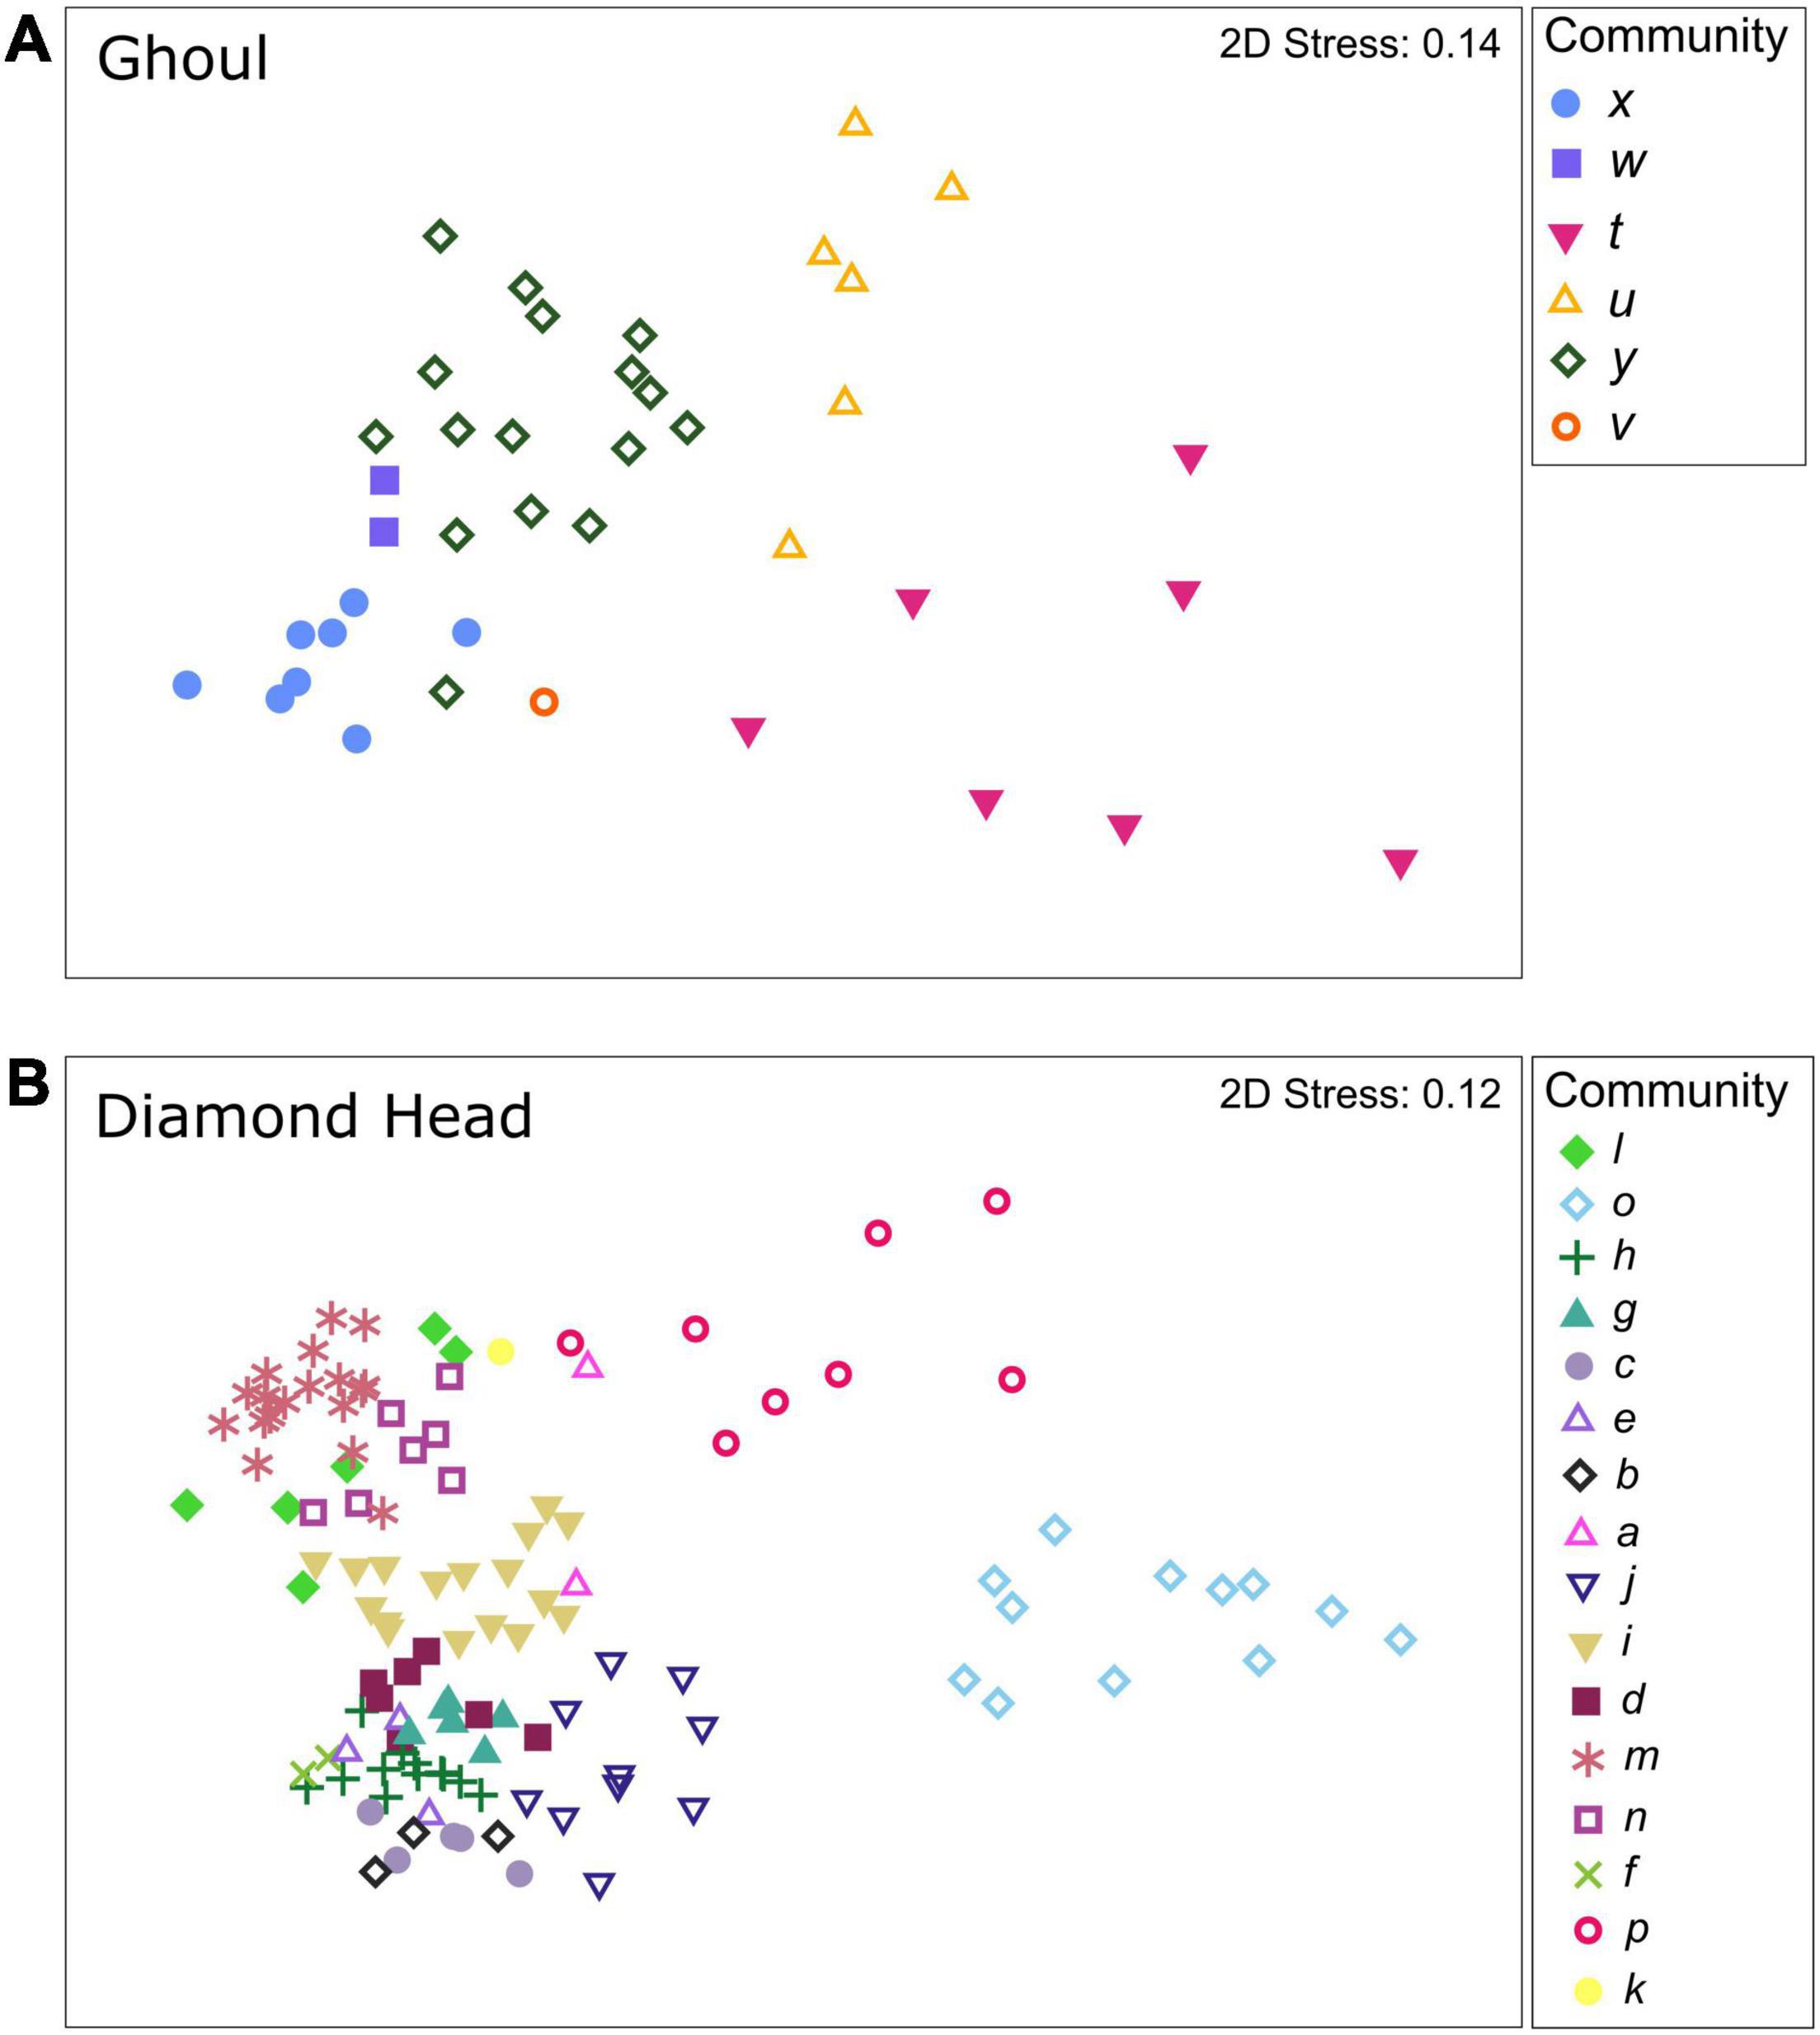
Figure 2. Non-metric multidimensional scaling (nMDS) plots showing variation in sample dissimilarities between and within mega-epibenthic communities identified on the seamounts (A) Ghoul and (B) Diamond Head. Stress values below 0.2 indicate adequate 2D representation.
Similarity percentage showed that within-community similarity ranged from 43-71% on Ghoul and 43-75% on Diamond Head. Three to nine taxa contributed to 70% of the within-community similarities on Ghoul, while one to nine taxa contributed to 70% on Diamond Head (Table 2). Representative images of each community were selected to help visualise the SIMPROF/SIMPER results and distinguish communities (Figure 3). The seamount benthic communities were assigned categories according to the most important characterising taxa identified by SIMPER analysis to further distinguish communities within the two seamounts. These community categories include: stony coral reef communities; octocoral communities; mixed communities characterised by demosponges, hexactinellids, stylasterids, and comatulid crinoids, and communities dominated by pagurids (hermit crabs) (see colour coding in Figure 3).
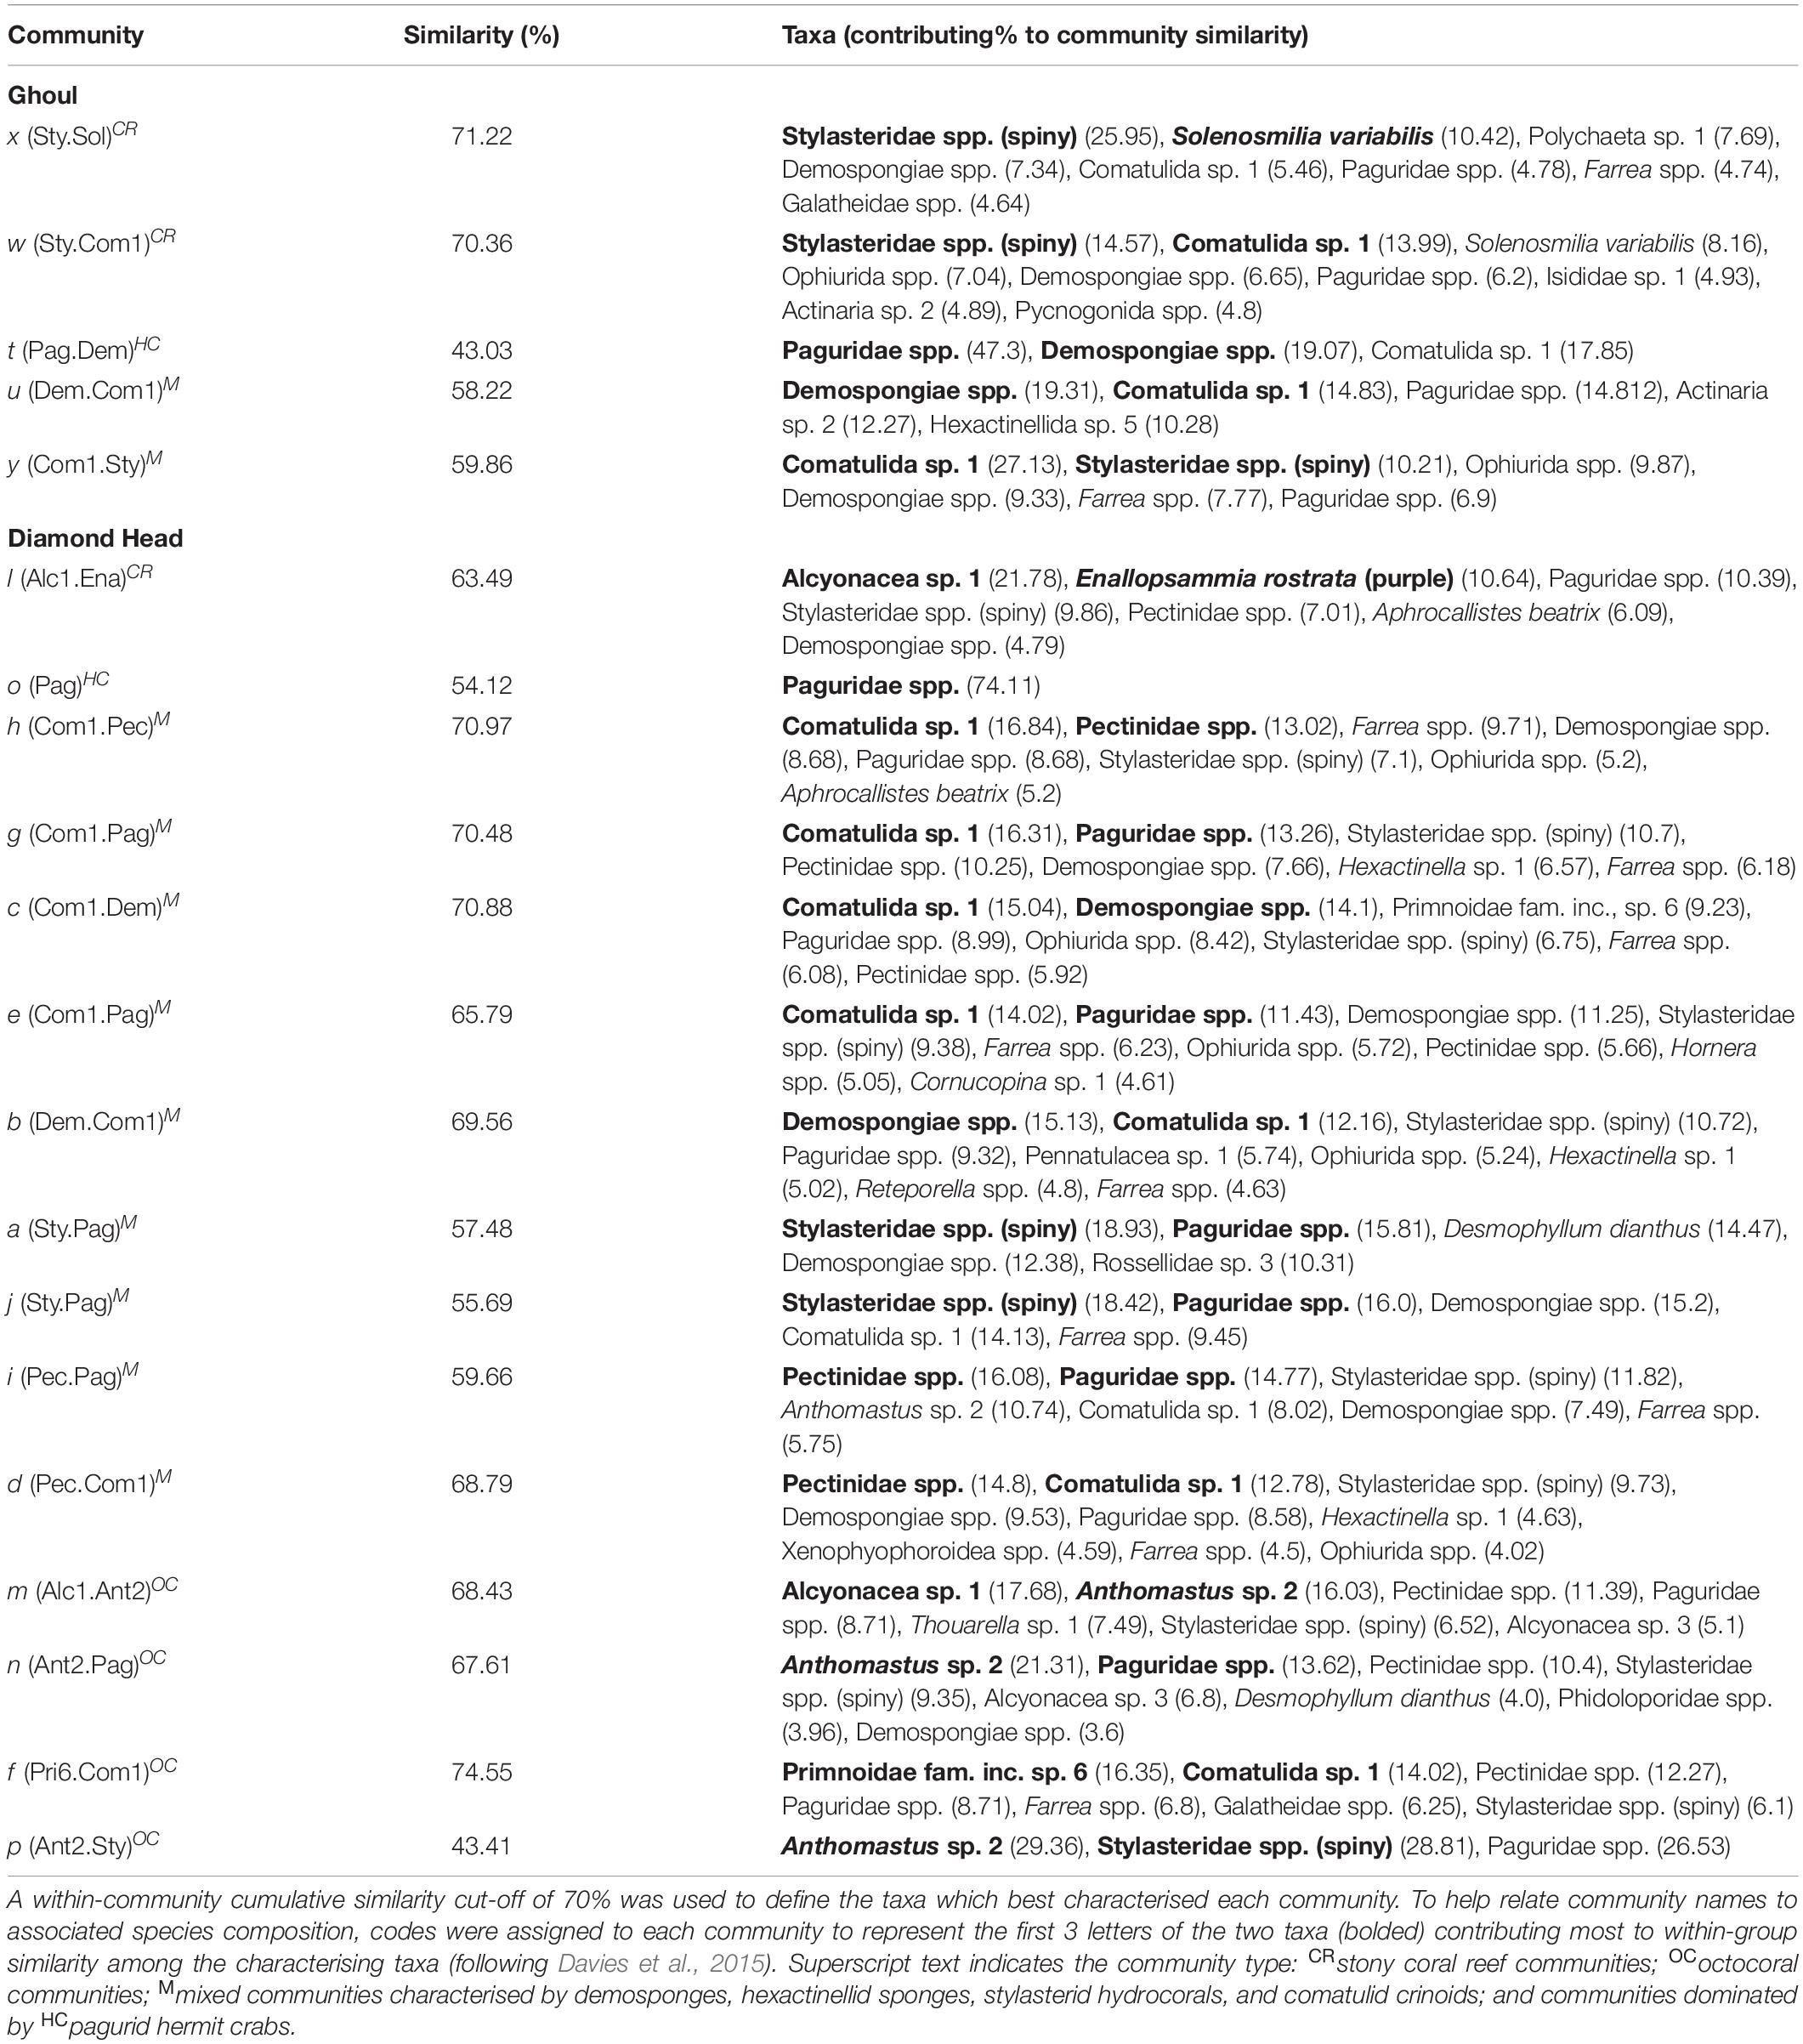
Table 2. Similarity percentage results.
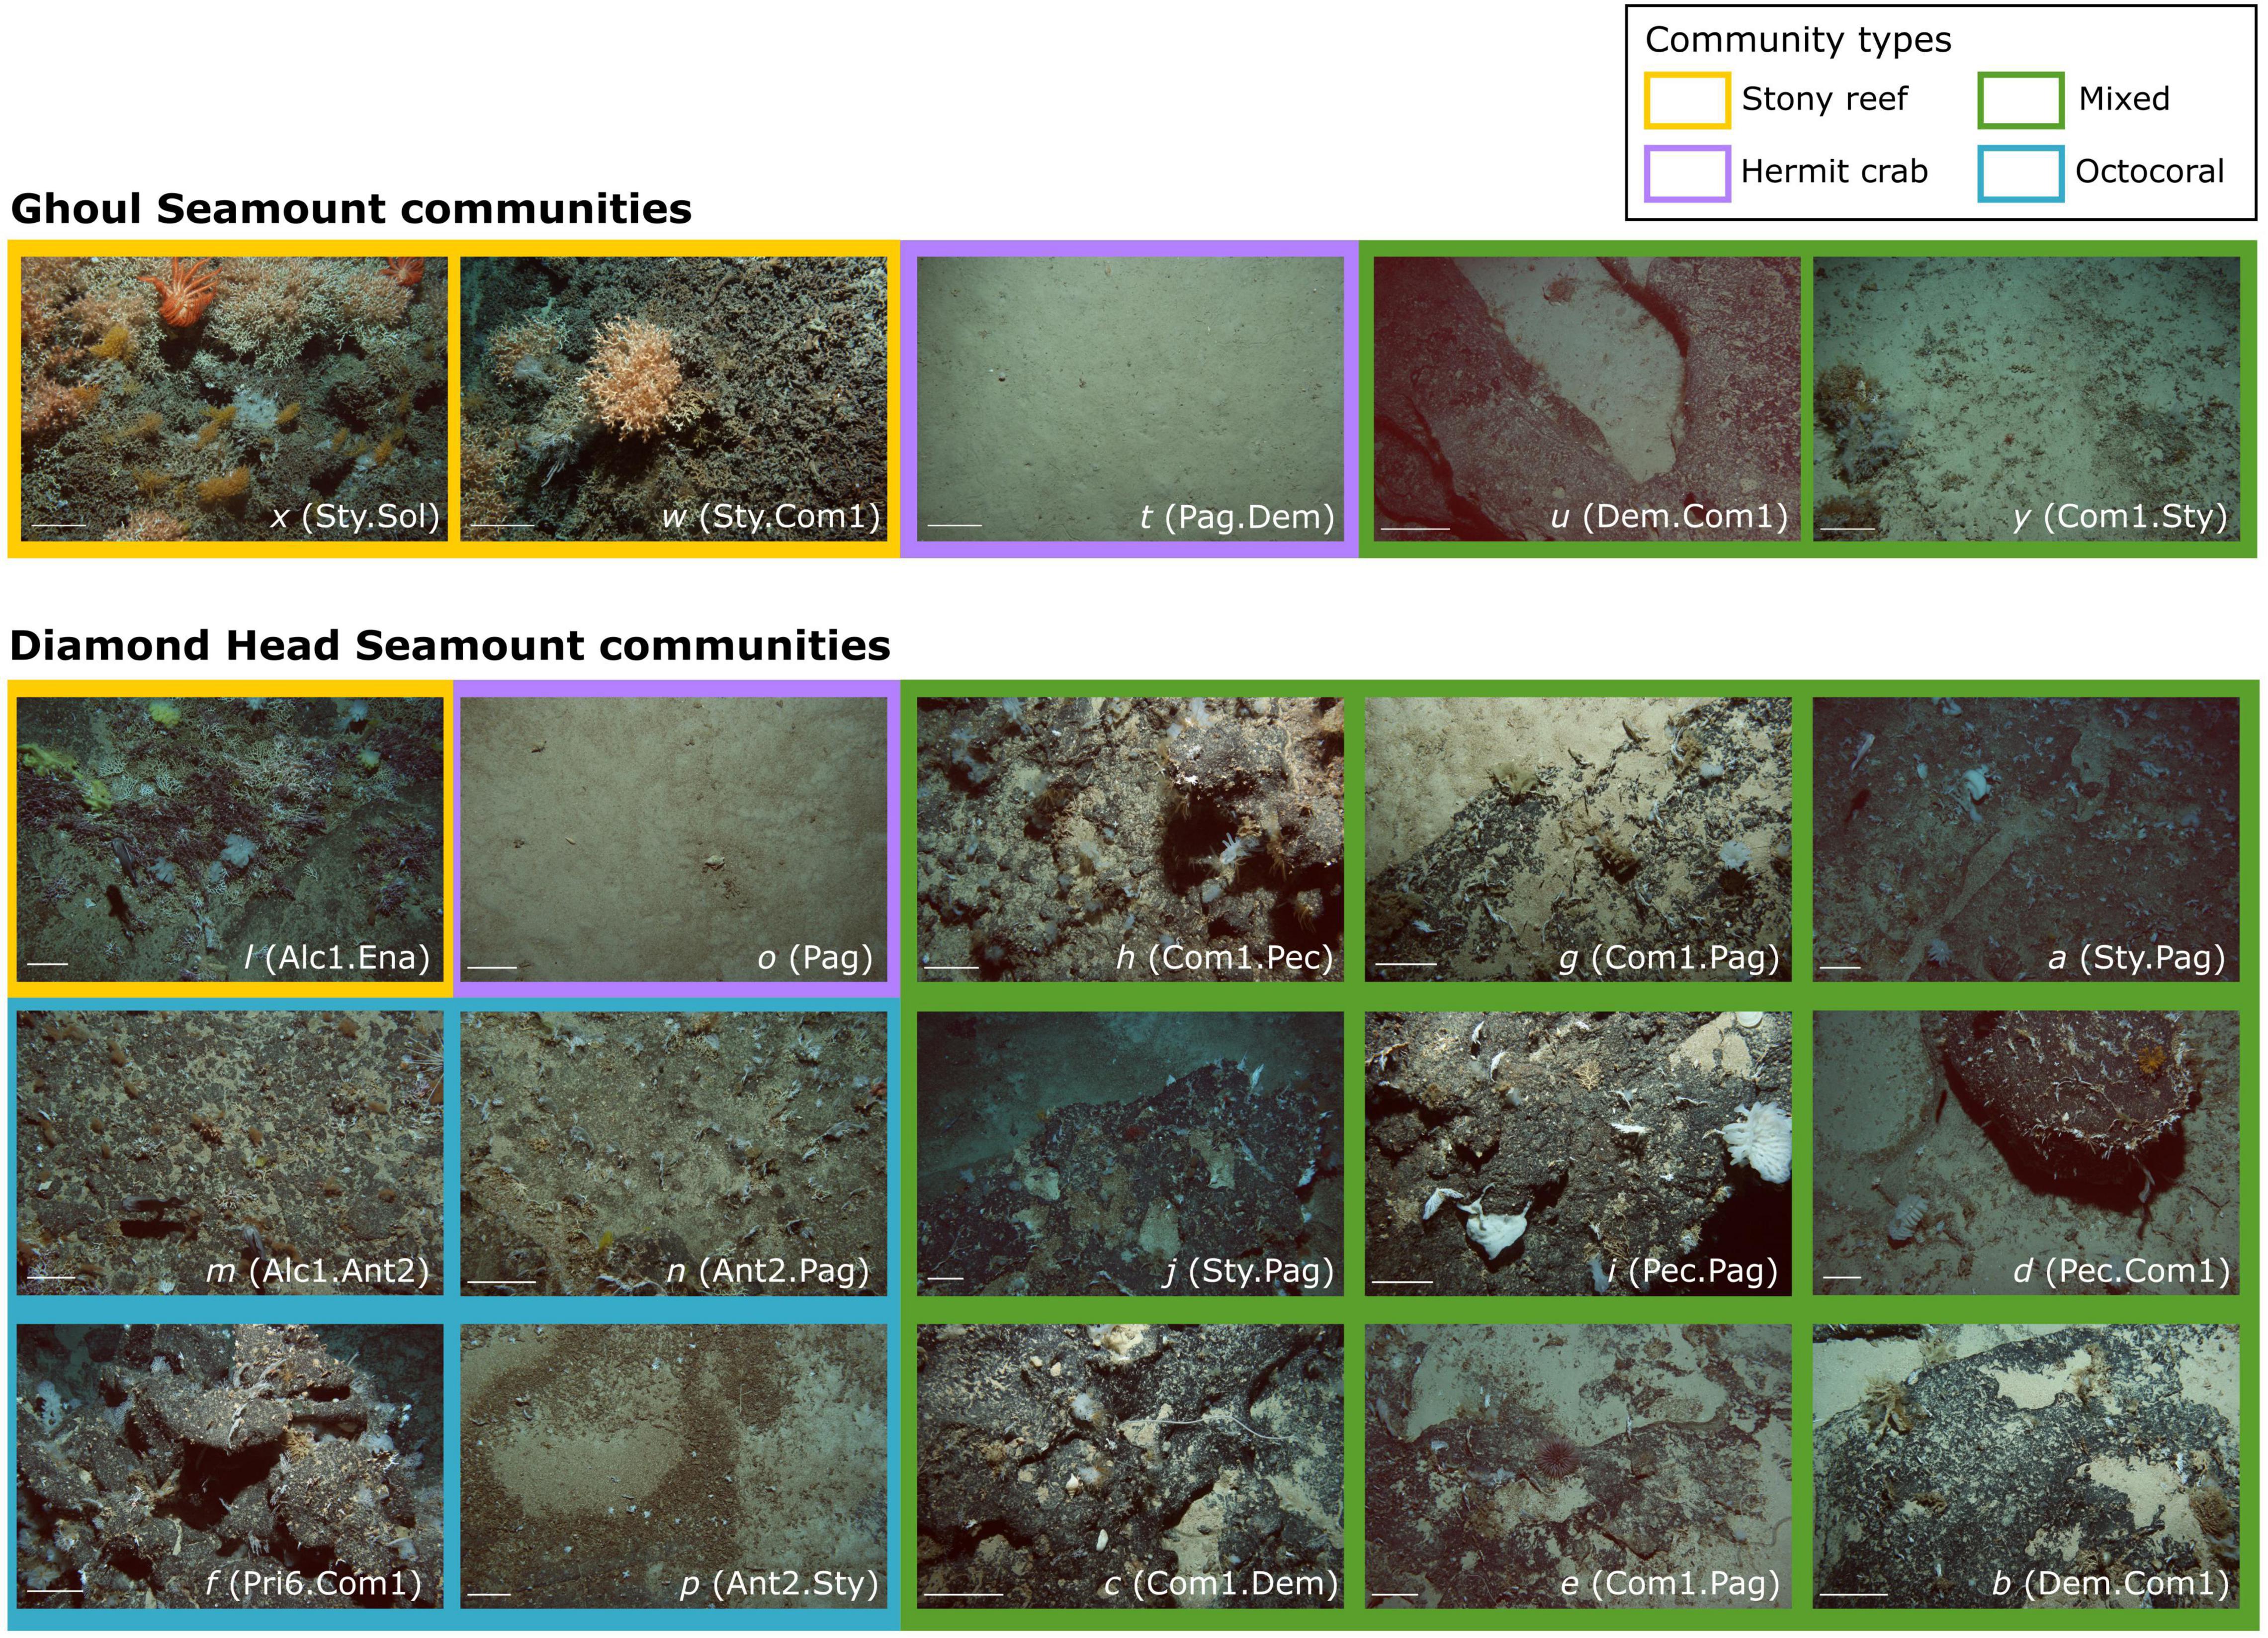
Figure 3. Representative images of mega-epibenthic communities on Ghoul and Diamond Head, excluding communities with fewer than 2 samples. Three-letter community codes were assigned to represent the first 3 letters of the two taxa contributing most to within-group similarity among the characterising taxa. The communities can be broadly categorized as: stony coral reef communities (yellow), octocoral communities (blue), mixed communities characterised by demosponges, hexactinellid sponges, stylasterid hydrocorals, and comatulid crinoids (green), and communities dominated by hermit crabs (Paguridae spp., purple). See Table 2 and Results for descriptions of each community. Scale bars in the bottom left corners are 20 cm.
The Ghoul stony reef community x (Styl.Sol) was mostly characterised by stylasterid hydrocorals, the reef-building coral Solensomilia variabilis, and reef-associated taxa including Polychaeta sp. 1, demosponges, and the crinoid Comatulida Sp. 1. Stylasterid hydrocorals, Comatulida sp. 1, Solenosmilia variabilis, and ophiuroids contributed most to the within-group similarity of the other stony reef community w (Sty.Com1). The pagurid community t (Pag.Dem) had the lowest within-group similarity and was characterised by only three taxa: pagurid hermit crabs, demosponges, and the crinoid characterized. 1. The mixed community u (Dem.Com1) was mostly characterised by demosponges, Comatulida sp. 1, pagurids, and Actinaria sp. 2, whereas the other mixed community y (Com.Sty) was characterised by Comatulida sp.1, stylasterid hydrocorals, Ophiurida spp., and demosponges.
Pagurid hermit crabs and spiny stylasterid hydrocorals were identified as characterising taxa in 13 of 15 Diamond Head communities included in the SIMPER analysis. The mixed communities on Diamond Head differed in their most important characteristic taxa. Comatulida Sp. 1 contributed most to within-group similarity of communities h (Com1.Pec), g (Com1.Pag), c (Com1.Dem), and e (Com1.Pag), whereas Pectinidae spp. Scallops contributed most to community i (Pec.Pag) and d (Pec.Com1) similarities. Demosponges contributed most to community b (Dem.Com) similarity. Farrea spp. Were among the characterising taxa of the mixed communities i (Pec.Pag), d (Pec.Com1), j (Sty.Pag), h (Com1.Pec), g (Com1.Pag), c (Com1.Dem), e (Com1.Pag), and b (Dem.Com1). The octocoral communities p (Ant2.Sty), n (Ant2.Pag), and m (Alc1.Ant) were characterised by the soft coral Anthomastus sp. 2. In contrast, primnoid octocorals were characteristic of community f (Pri6.Com1) and also contributed to within-group similarity of the mixed community c (Com1.Dem). The stony reef community l (Alc1.Ena) was characterised most by Alcyonacea sp. 1 and the reef-building coral Enallopsammia rostrata.
Spatial distribution patterns of the benthic communities varied between the seamounts (Figure 4). Communities on Ghoul were distributed by depth and aspect (side) of the seamount: community × (Sty.Sol) occurred on the summit; community y (Com1.Sty) on the upper to mid-flanks on all four sides; community u (Dem.Com1) mostly on the lower flanks on the north and west sides; community t (Pag.Dem) on the lower flanks of the south/east sides, and communities w (Sty.Com1) and v only occurred on the upper flank of the north side. The benthic communities on Diamond Head were also distributed by depth and broad-scale aspect, but depth-related patterns among communities were less distinct than on Ghoul. The summit of Diamond Head was mostly occupied by communities p (Ant2.Sty), m (Alc1.Ant2), n (Ant2.Pag), and l (Alc1.Ena). Community distribution on the flanks was more variable. Community o (Pag.) mostly occurred on the upper flanks along a concave rim on the north, south, and west sides. The distributions of several communities were limited to one seamount side: community d (Pec.Com1) on the lower flanks of the east side; community h (Com1.Pec), f (Pri6.Com1), and c (Com1.Dem) on a small pinnacle on the west side; community b (Dem.Com1) and g (Com1.Pag) on the lower flanks of the north side. Community i (Pec.Pag) was distributed on the east, south, and west sides at varying depths along the seamount. Community k comprised a single sample which occurred on a pinnacle on the south side.
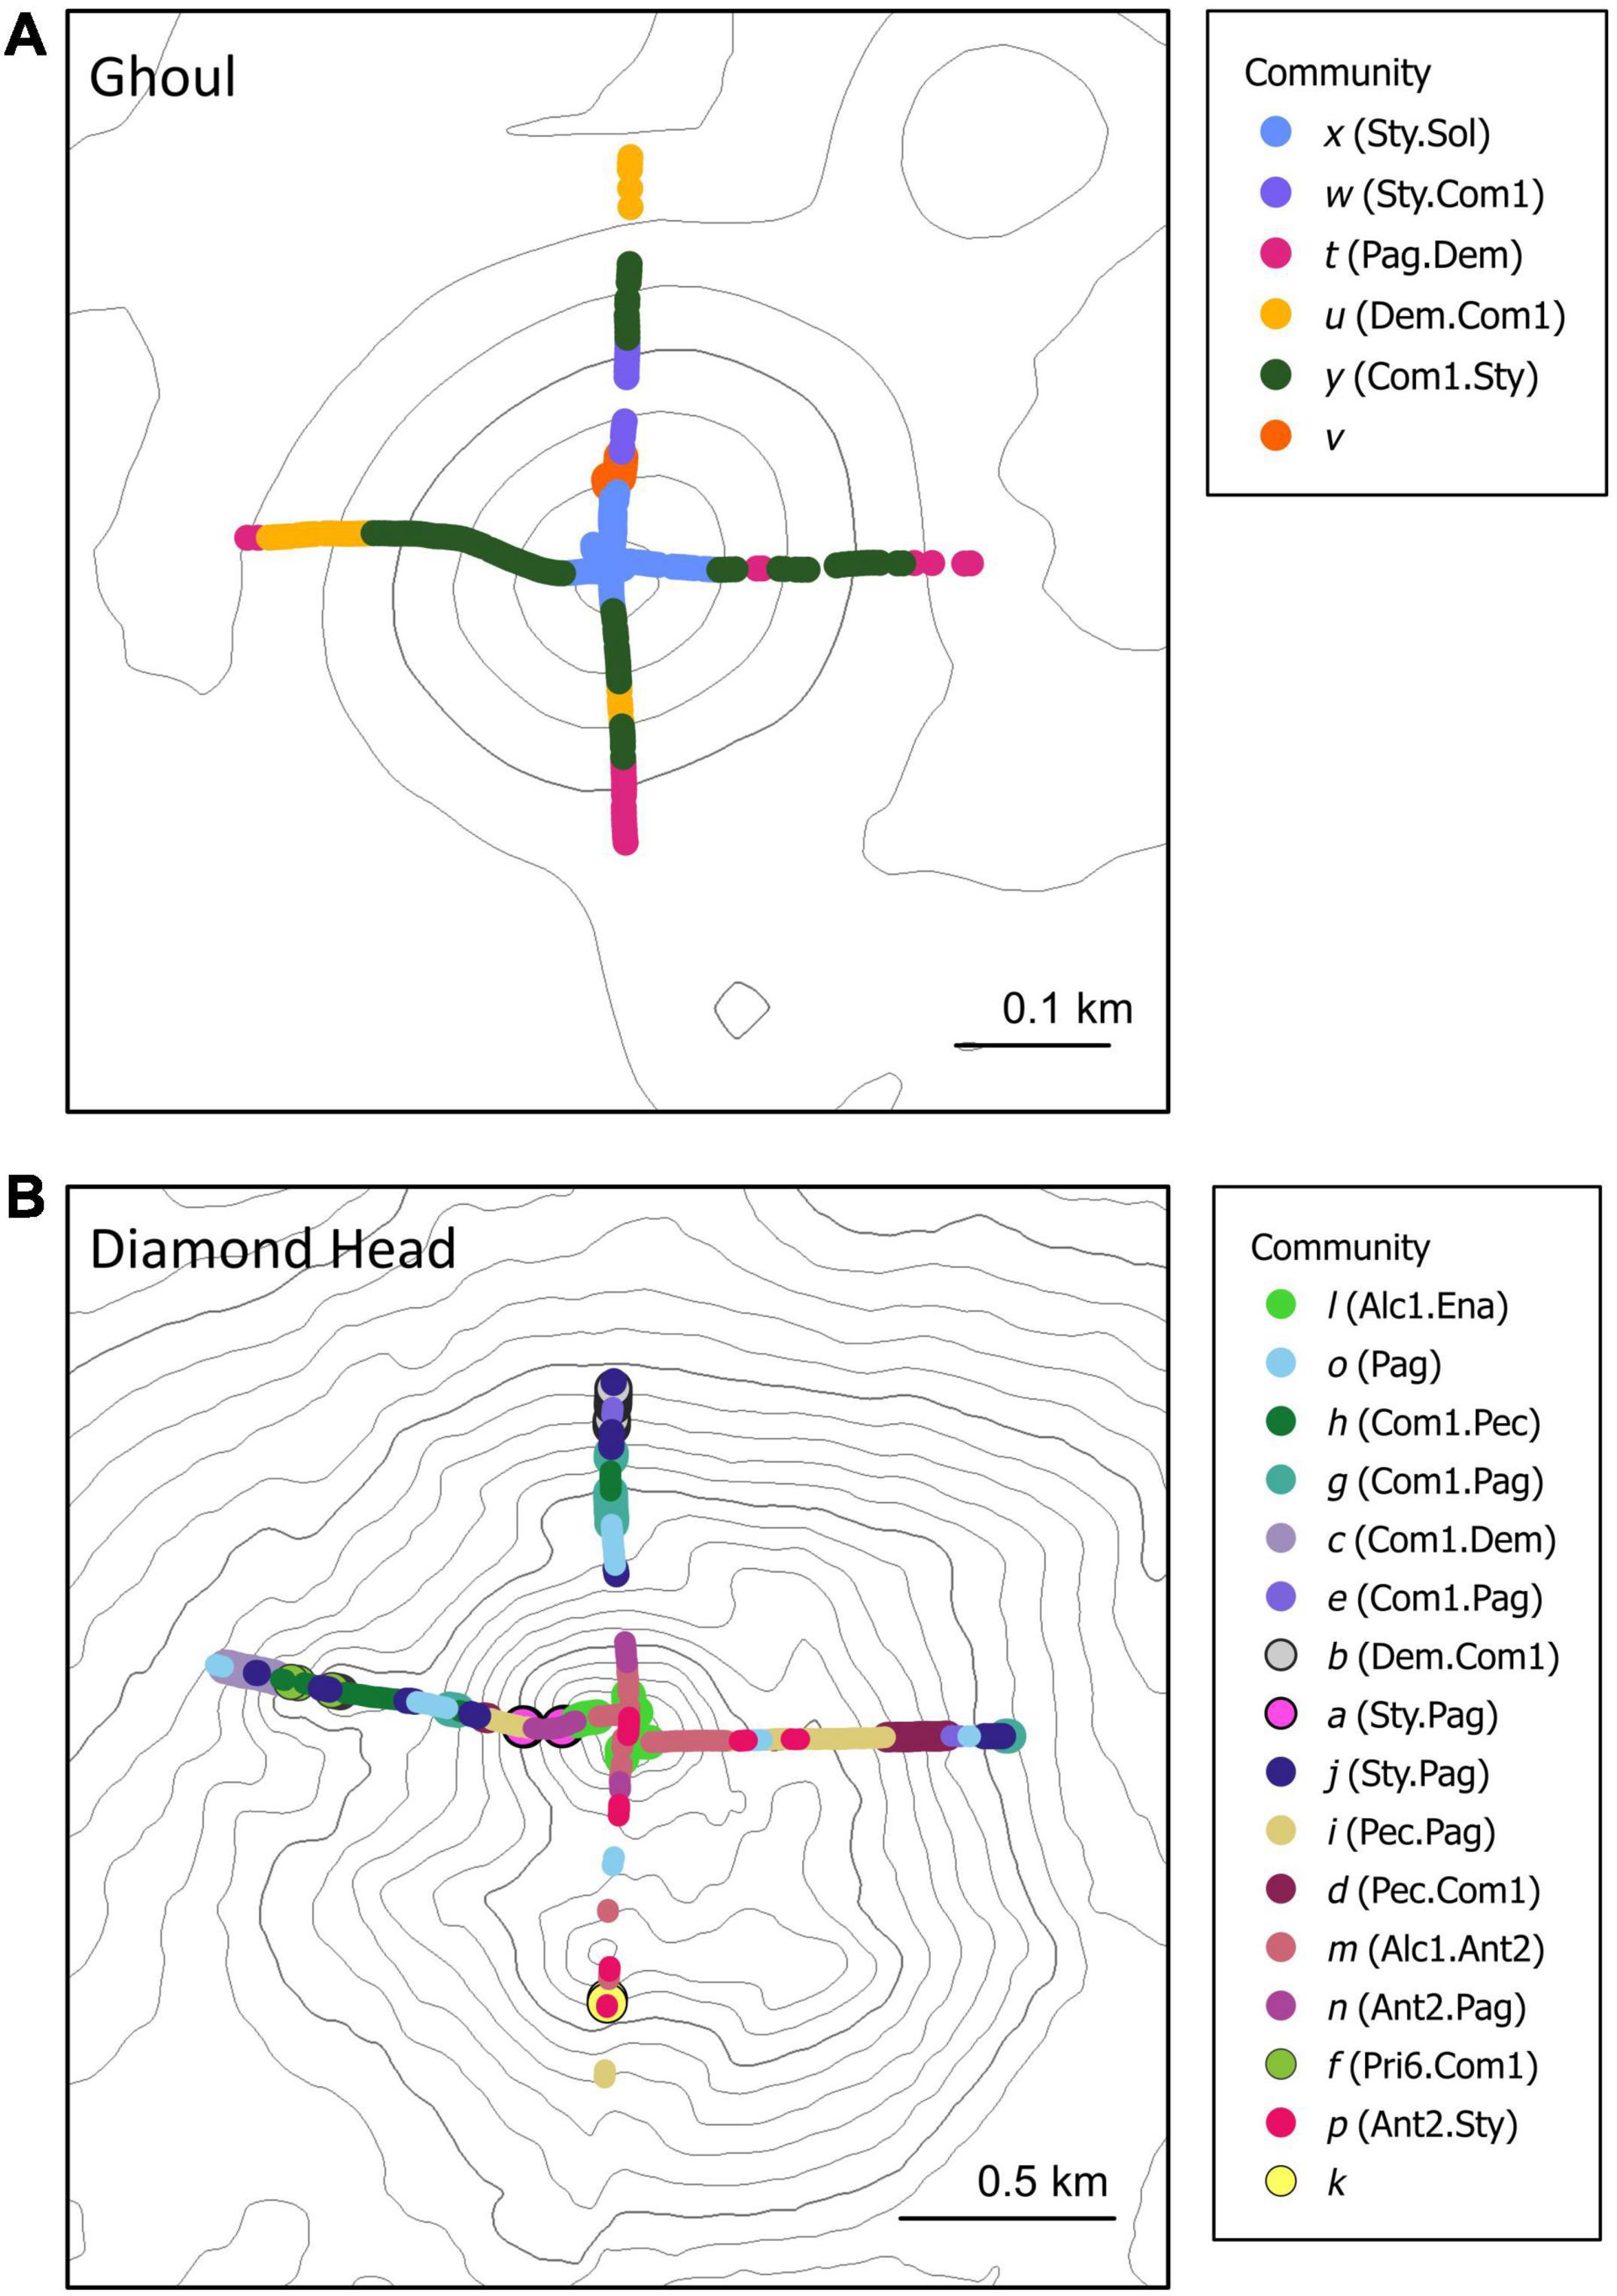
Figure 4. Spatial distribution of benthic communities identified by cluster and SIMPROF analysis on (A) Ghoul and (B) Diamond Head. Each point represents an individual image. Contour lines represent 20 m depth intervals.
Total beta diversity was higher among samples (βJAC > 0.9) than among sectors (βJAC ∼ 0.6) for both seamounts (Table 3 and Supplementary Figures 8, 9). Within sectors, beta diversity was highest for the east flank of Ghoul (βJAC = 0.868) and the west flank of Diamond Head (βJAC = 0.95), and lowest for the summits of both seamounts (Ghoul βJAC = 0.675, Diamond Head βJAC = 0.812). In all comparisons, beta diversity was primarily attributed to species turnover (βJTU 0.5-0.97), rather than nestedness (βJNE 0.01-0.17).
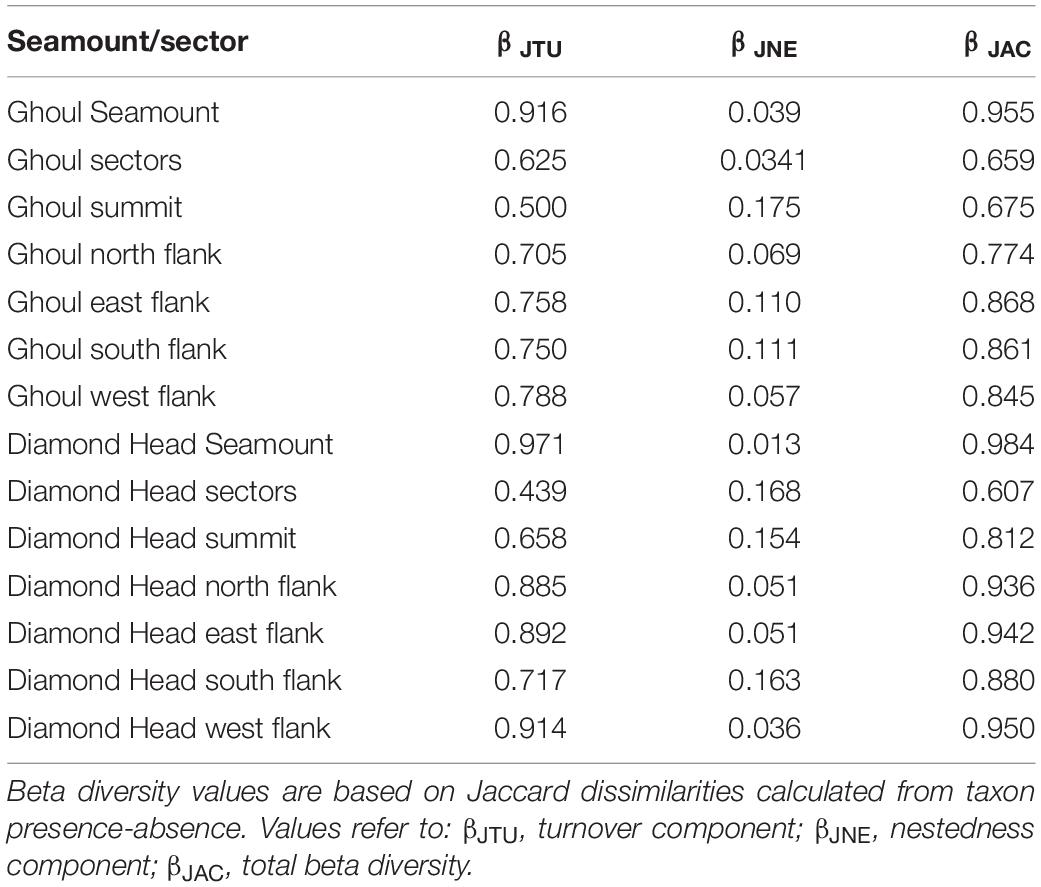
Table 3. Calculated multiple site beta diversity values for: (1) each seamount, (2) across sectors (i.e., summit and north, east, south, and west flanks) within each seamount, and (3) separately for each sector.
Environmental Correlation With Community Structure
The best DistLM model (highest adjusted R2 value) for Ghoul included all 11 environmental variables at the 25 m spatial scale and explained 51.2% of the sample variation (Table 4). Seven variables included in the best model were significantly correlated with community structure (p-Value ≤ 0.05): depth; sand/bedrock; standard deviation of slope; pebble/sand; profile curvature; coral rubble, and slope (Table 5). The best model for Diamond Head included all 11 environmental variables at the 15 × 15 scale, which explained 45% of the total sample variation (Table 4). Nine variables were significant: depth; sand/bedrock; eastness; substrate diversity; pebble/sand; coral rubble; slope, and profile curvature (Table 5). Depth explained the largest proportion of variation on both seamounts (Ghoul: 21%, Diamond Head: 18.3%), followed by sand/bedrock substrate composition.
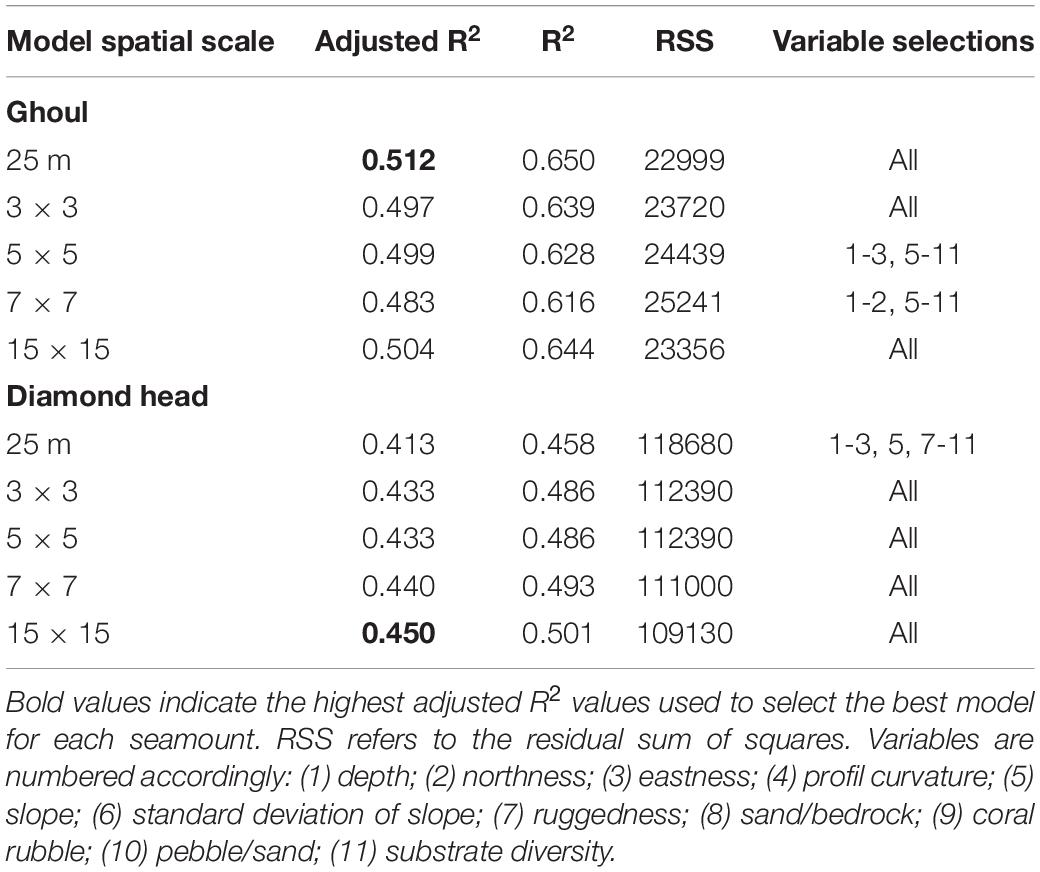
Table 4. DistLM results for the compared models.
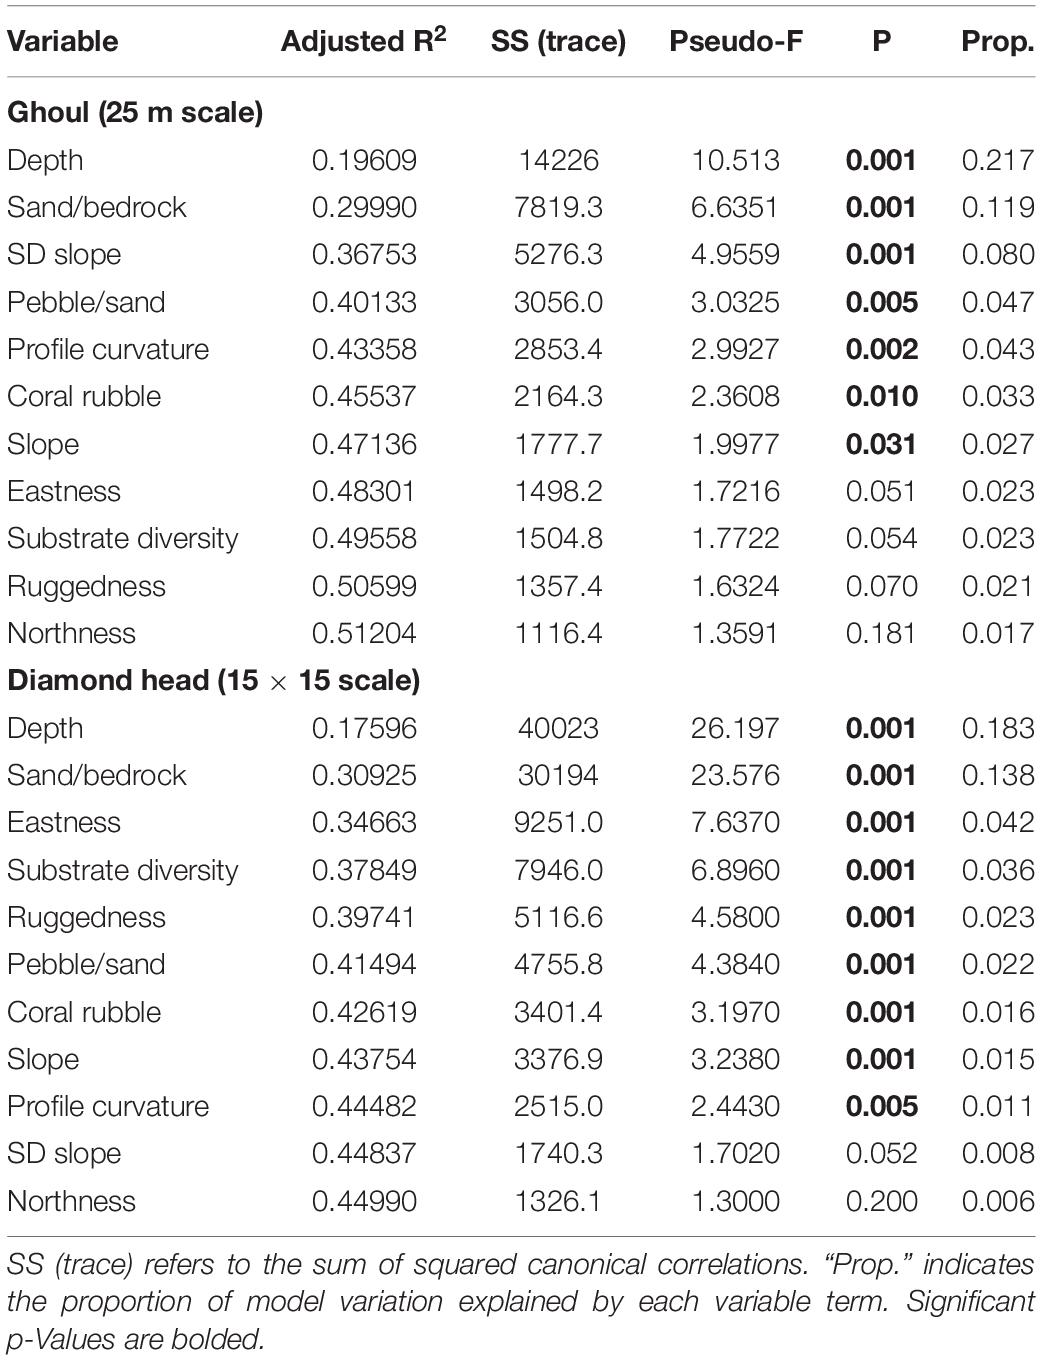
Table 5. Sequential test results of the best DistLM models for each seamount.
The first two axes of the dbRDA plots (dbRDA1 and dbRDA2) explained 42.6 and 40.4% of total community variation on Ghoul and Diamond Head, respectively (Figure 5). For Ghoul, dbRDA1 was largely correlated with coral rubble substrate, while dbRDA2 was correlated mostly with depth, standard deviation of slope, and substrate diversity (Figure 5A and Supplementary Table 2). Sand/bedrock and pebble/sand substrates mostly distinguished community t (Pag.Dem) from the other five communities. Higher substrate diversity distinguished community u (Dem.Com1) from communities t (Pag.Dem), v, x (Sty.Sol), and w (Sty.Com1). Community x (Sty.Sol) was mostly separated from the other communities by increased ruggedness. For Diamond Head, dbRDA1 was mostly correlated with sand/bedrock substrate composition, while dbRDA2 was correlated largely with depth and standard deviation of slope (Figure 5B and Supplementary Table 2). Sand/bedrock substrate distinguished communities o (Pag) and p (Ant2.Sty) from the other communities, while higher values of substrate diversity distinguished community d (Pec.Com1). Communities m (Alc1.Ant2), n (Ant2.Pag), and l (Alc1.Ena) were mostly distinguished by lesser depths.
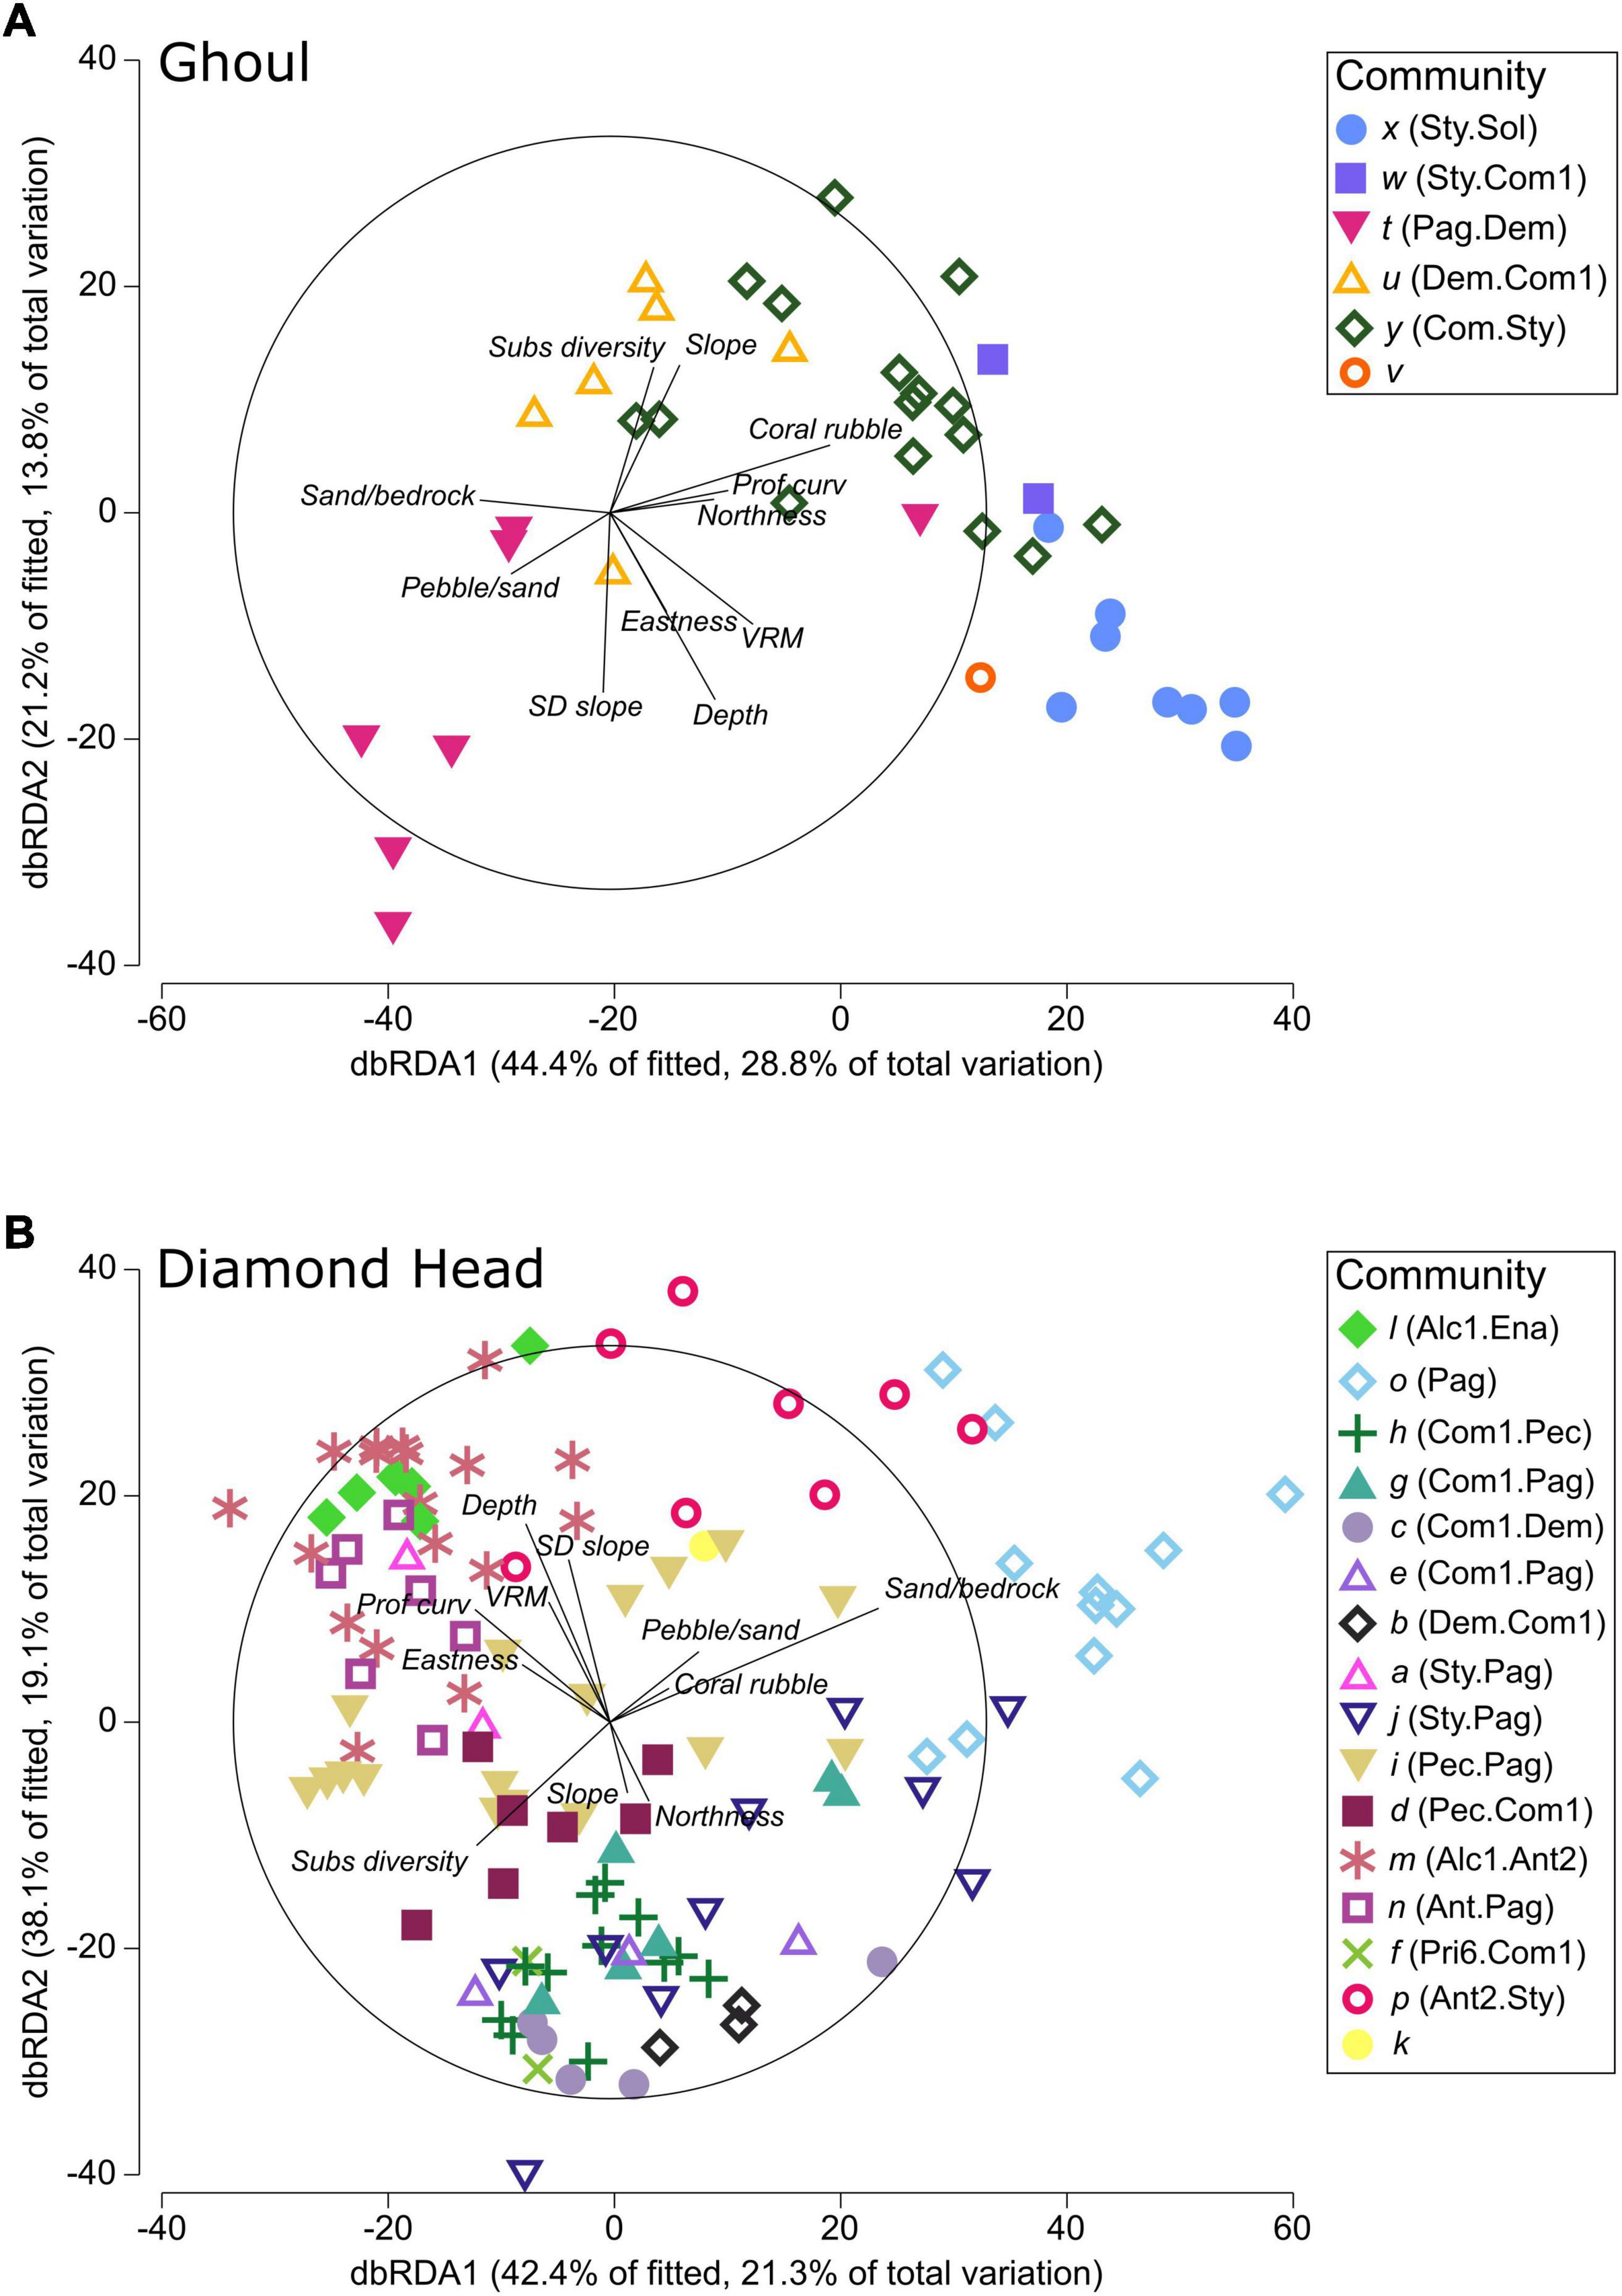
Figure 5. Distance-based redundancy (dbRDA) plots of the best models selected using distance-based linear modelling (DistLM) to fit the community data to the environmental data for (A) Ghoul and (B) Diamond Head. The magnitude of each vector indicates the proportional contribution of each variable to the total variation between samples. Variable abbreviations are as follows: SD slope, standard deviation of slope; subs diversity, substrate diversity calculated as Hill’s N2; Prof curv, profile curvature; VRM, ruggedness.
Community Distribution Models
Model Performance
Performance of both seamount RF distribution models was very good, as assessed by multiple class AUC analysis, with AUC values of 0.85 and 0.9 for the Ghoul and Diamond Head models, respectively. The overall OOB error rate was ∼30% for the Ghoul model and ∼39% for the Diamond Head model. However, OOB error rates varied greatly across community classes for both models, ranging from 19-43 and 17-88% misclassification (Supplementary Tables 3, 4), with most misclassifications occurring between communities with similar community structure. The highest error rate for the Ghoul model was for community t (∼43%). Communities x and u had error rates of 38 and 33%, and each was only misclassified as community y. The lowest OOB error rate was 19% for community y. For the Diamond Head model, the highest OOB error rates were communities p (88%), j (80%), l (67%), and n (57%). Communities h, i, m, and d had the lowest error rates, ranging from 17-30%.
The five most influential explanatory variables in the Ghoul model in order of importance, according to the mean decrease in accuracy (proportional change in error rate when the variable is removed from the model), were: coral rubble substrate (mean decrease in accuracy: 0.076), depth (0.043), slope (0.038), standard deviation of slope (0.033), and sand/bedrock (0.031). The most important explanatory variables in the Diamond Head model were depth (0.103), ruggedness (0.046), eastness (0.043), sand/bedrock substrate (0.039), and slope (0.039). Mean decrease in accuracy of the remaining model predictor variables are shown in Supplementary Table 5.
Model Spatial Predictions
The predicted distributions of communities varied in terms of their spatial distribution patterns, patch characteristics, and the environmental characteristics of the patches they were predicted to occupy (see Supplementary Table 6 for full summary). Overall, the number of patches per community ranged from 1 to 20, although most communities were predicted to occupy < 10 patches. Patches varied in size from 0.06 to 76 ha, with mean patches sizes varying from 0.2 to 16.6 ha (Figures 6A,C and Supplementary Table 6).
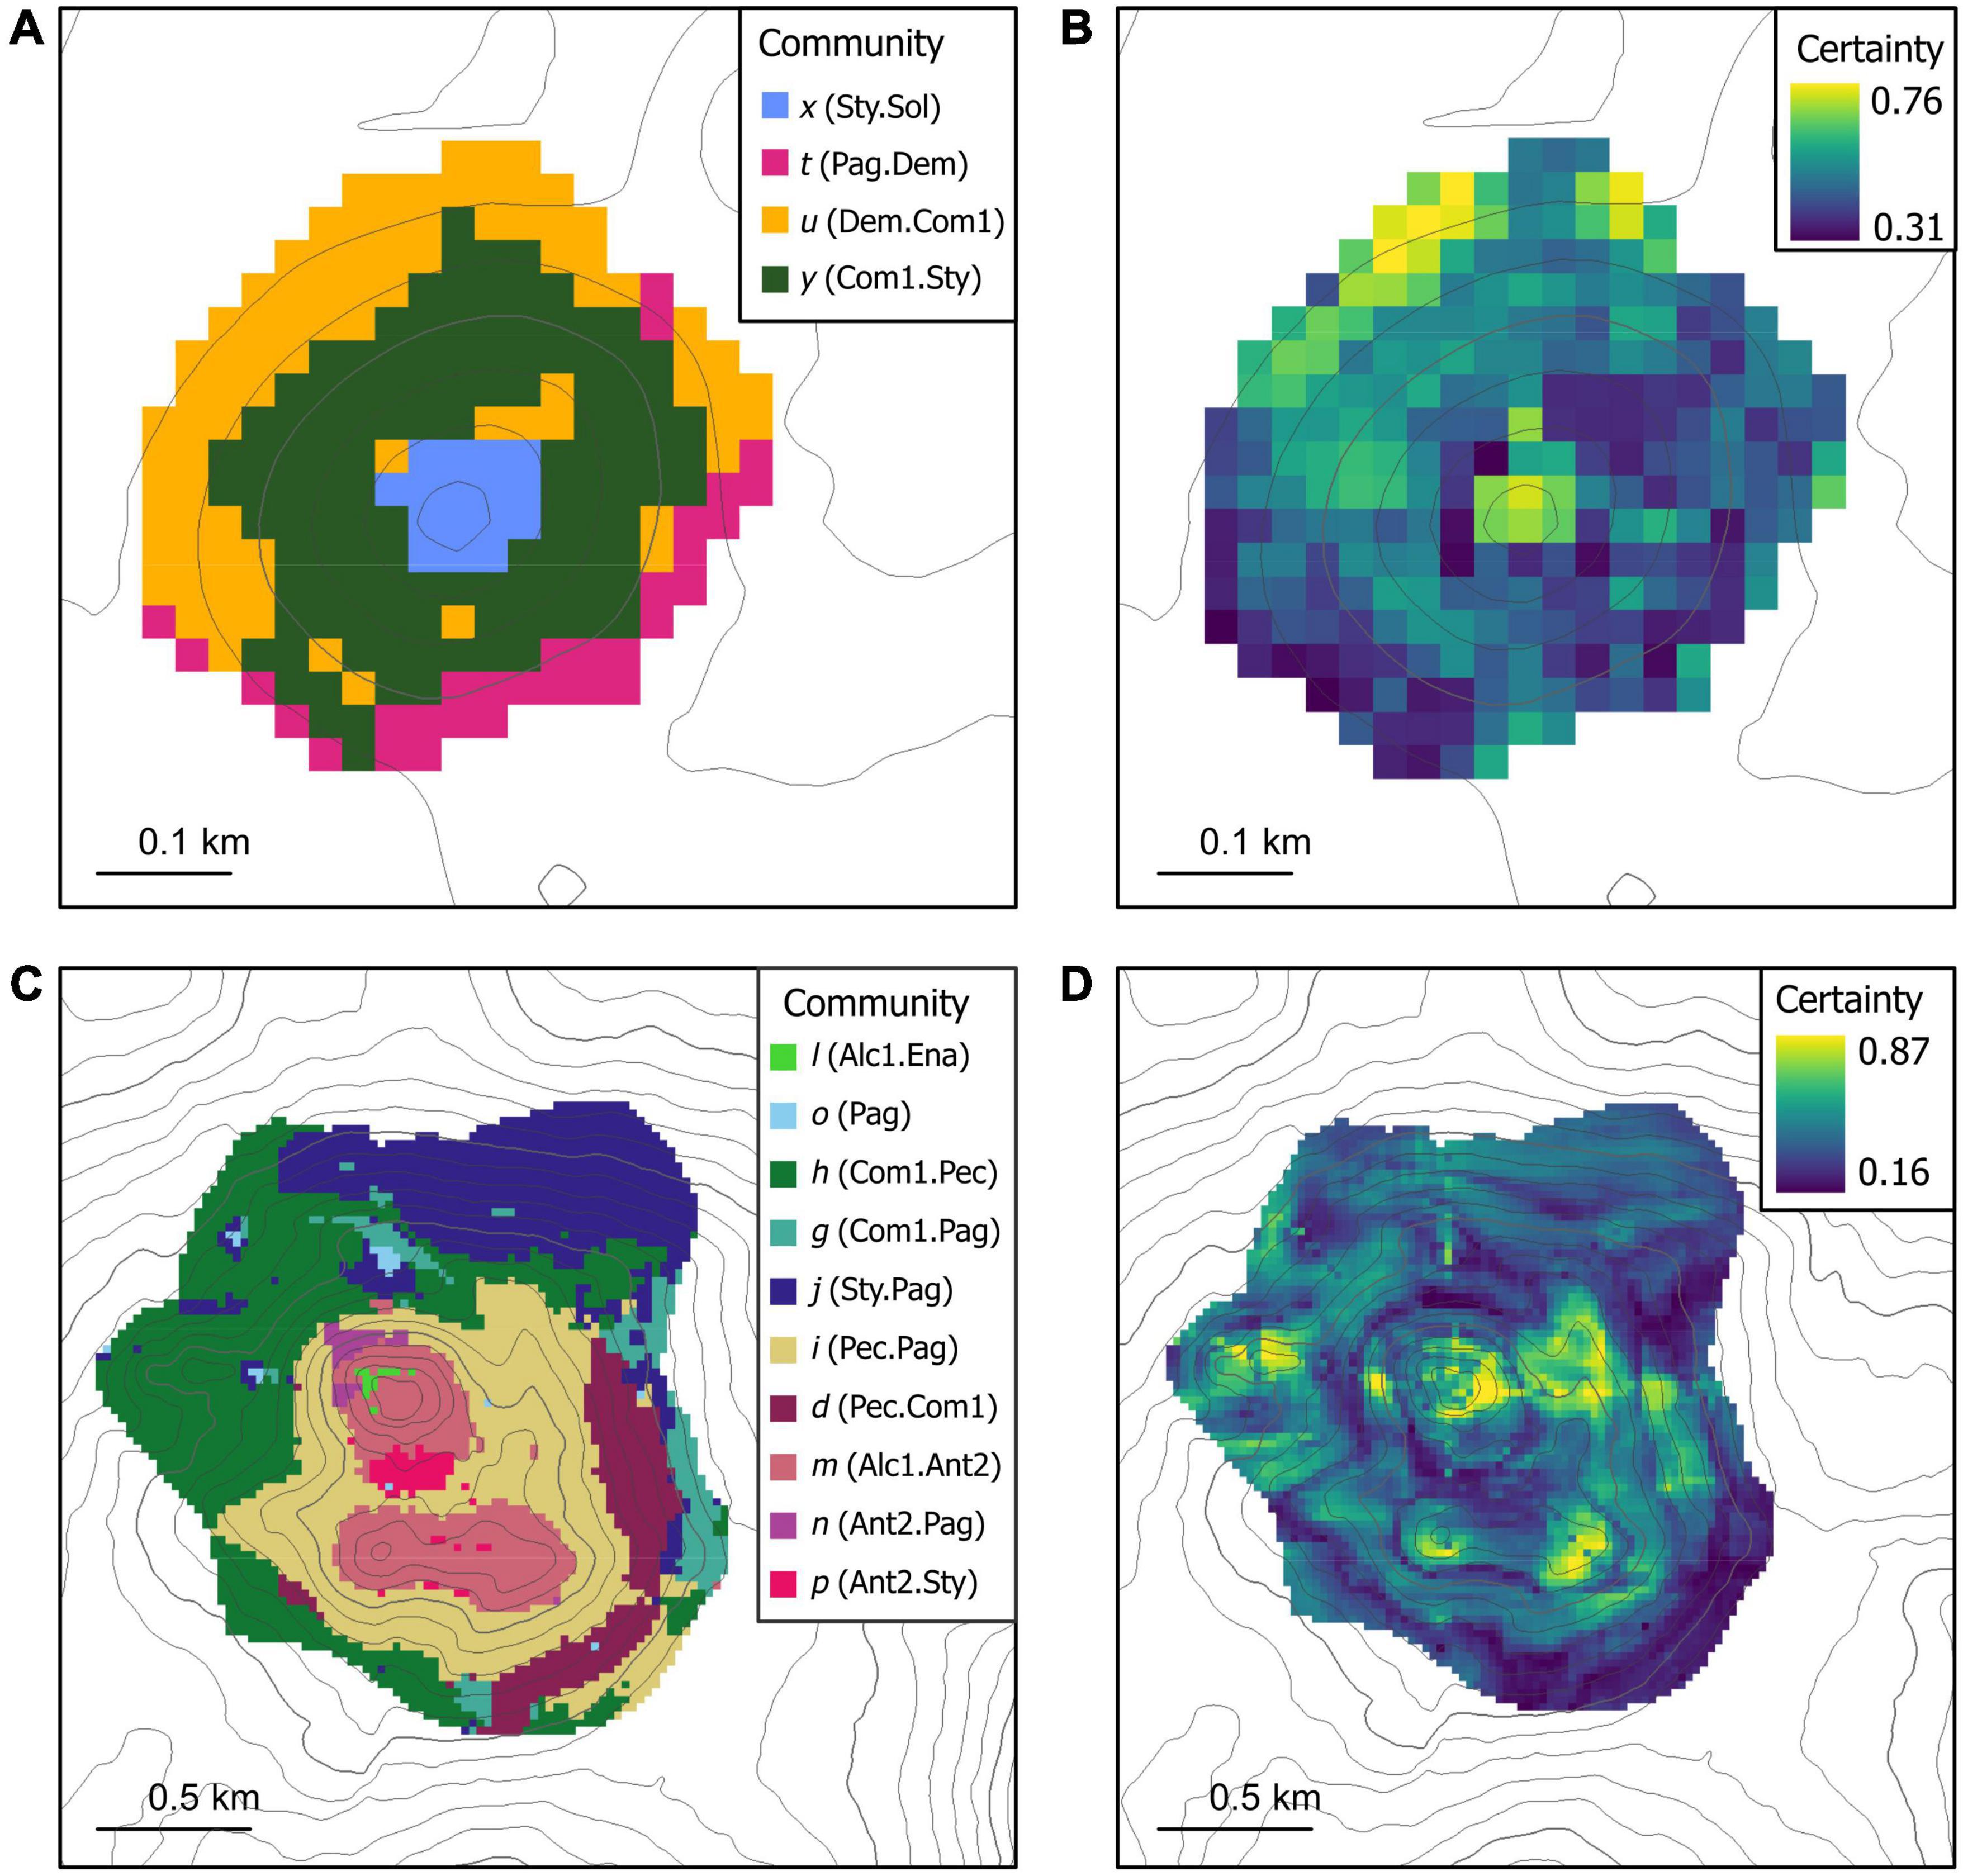
Figure 6. Random forest model predictions of community distributions (left-hand panels) and model certainty calculated from bootstrapped model iterations, visualized as mean proportion of votes where a higher proportion of votes indicates higher model certainty (right-hand panels) for panels (A,B) Ghoul and (C,D) Diamond Head. Contour lines represent 20 m depth intervals. For community codes and types, see Figure 3 and Table 2.
On Ghoul, the predicted distributions of the four modelled communities generally formed patches with depth and aspect. The stony coral reef community x (Sty.Sol) and the mixed community y (Com1.Sty) each formed single patches, with community x (Sty.Sol) predicted to occupy a 1.0 ha area on the summit from 930 to 950 m depth, and community y (Com1.Sty) a 7.6 ha band along the upper-mid seamount flanks from 950 to 1,040 m. The mixed community u (Dem.Com1) was predicted to form one 4.13 ha patch along the west and north lower flanks, with six smaller patches (0.06-0.56 ha) distributed on the upper north, lower west, and lower south flanks. The predicted distribution of the hermit crab community t (Pag.Dem) formed three contiguous patches along the lower south flanks (0.13-1.5 ha) and a small patch on the northeast lower flank (0.13 ha). Inter-patch distance for communities u (Dem.Com1) and t (Pag.Dem) was approximately 70 m. Patch connectedness (estimated using the contiguity index) was the highest for communities y (Com1.Sty) and x (Sty.Sol), which each formed single contiguous patches, and lowest for community u (Dem.Com1).
Predicted distribution of the coral reef community x (Sty.Sol) spanned a broad range of slope values (7-33°), while the remaining mixed and hermit crab Ghoul communities (u, y, and t) were mostly associated with steeper sloped areas (15-36°). Community x (Sty.Sol) was also predicted to occur in more rugose areas (mean VRM: 0.08) than the mixed and hermit crab communities. Communities y (Com1.Sty) and x (Sty.Sol) were only predicted to occur in upwardly concave areas, indicated by positive minimum and maximum profile curvature values. In contrast, communities u (Dem.Com1) and t (Pag.Dem) were predicted to occur across a broad range of profile curvature values (−0.59 to 0.98). The mixed communities were predicted to occur in areas of higher mean substrate diversity than the hermit crab or coral reef communities. There was a clear distinction between the hermit crab community from the mixed and coral reef communities in terms of substrate composition: the hermit crab community was associated with areas of high sand composition (37% compared to 13-22%), while the others were generally predicted to occur in areas dominated by coral rubble (37-55%) and bedrock (15-21%) substrates.
On Diamond Head, predicted distributions of the 10 modelled communities exhibited a broader range of spatial patterns and patch characteristics than on Ghoul. The octocoral communities m (Alc1.Ant2), p (Ant2.Sty), and n (Ant2.Pag) were each predicted to form several patches along the summit and upper flanks. Community m (Alc1.Ant2) had the largest predicted area (34.2 ha) and maximum patch size (20.7 ha) of the octocoral communities, while community p (Ant2.Sty) formed smaller patches with a maximum size of 3.3 ha. Community n (Ant2.Pag) formed the smallest patches (0.06-1.9 ha) of this group. The coral reef community l (Alc1.Ena) was also predicted to occupy the summit, forming 3 small patches with a mean size of 0.3 ha. The mixed communities j (Sty.Pag), h (Com1.Pec), g (Com1.Pag), i (Pec.Pag), and d (Pec.Com1) were predicted to generally form one to several large patches (maximum patch sizes 6.3-76.3 ha) of varying shapes on the flanks. The hermit crab community o (Pag.) was predicted along the northwest flank, forming 8 small patches (0.06-0.6 ha). Mean inter-patch distances varied between communities, from 52 to 497 m. Patch connectedness was the highest for the mixed community i (Pec.Pag) (contiguity index: 0.55) and lowest for the coral reef community l (Alc1.Ena) (contiguity index: 0.13). Patch density did not vary substantially between communities (1.0-6.4) but was highest for community j (Sty.Pag), which was predicted to form widely distributed patches of varying sizes.
The Diamond Head communities j (Sty.Pag), n (Ant2.Pag), and d (Pec.Com1) were only predicted in relatively steep areas, while the remaining communities were associated with a broad range of slope values. The predicted distribution of octocoral and coral reef communities corresponded with areas of high standard deviation of slope. There was no clear relationship between community distribution and ruggedness, as mean ruggedness was overall very low (6.6 × 10⁻⁶ – 0.002) for all the predicted communities. The predicted distributions of the octocoral and coral reef communities n (Ant2.Pag) and l (Alc1.Ena) corresponded with upwardly concave areas (Profile curvature: 0.11-0.24), while the remaining communities were predicted to occur in both convex and concave areas of the seamount (Profile curvature: -0.16-0.24). Most communities were associated with similar substrate diversity, which varied from 3.3 to 3.9; however, communities o (Pag) and n (Ant2.Pag) had lower predicted substrate diversity (2.5 and 2.7), and community j (Sty.Pag) had higher predicted substrate diversity (4.03). Communities j (Sty.Pag), h (Com1.Pec), i (Pec.Pag), n (Ant2.Pag), d (Pec.Com1), and l (Alc1.Ena) were predicted to occur in areas with > 30% bedrock. A subset of these communities (h, i, d, and l) was also associated with coral rubble substrate. Communities o (Pag) and p (Ant2.Sty) were predicted to occupy sandy substrates. The predicted distribution of community g (Com1.Pag) corresponded with areas of evenly mixed bedrock, coral rubble, and sand substrate types.
On Ghoul, model prediction certainty (Figure 6B) was highest on the summit and northwest flanks and base, and lowest on the southwest base and east flanks. Model certainty was highest for predicted spatial distributions of communities x (Sty.Sol), u (Dem.Com1) and the northwest sector of community y (Com1.Sty). On Diamond Head, model certainty was highest around the summit, in an area of the east flank, and around pinnacle features on the south and west seamount sectors (Figure 6D). These areas best matched the predicted distributions of communities l (Alc1.Ena), n (Ant2.Pag), m (Alc1.Ant2), i (Pec.Pag), and d (Pec.Com1). Model certainty was lowest on the lower southeast flanks and base, overlapping with portions of the predicted distributions of communities d (Pec.Com1), l (Alc1.Ena), h (Com1.Pec), and g (Com1.Pag). The variation among iterated model predictions was very low for both seamount models, demonstrated by low 95% confidence intervals (Supplementary Figure 10).
Discussion
Structural Patterns of Benthic Communities Within Individual Seamounts
Our analysis identified six communities on Ghoul Seamount and sixteen on Diamond Head Seamount. Although both study features are considered small seamounts (elevations ≤ 1000 m), the difference in the number of mega-epibenthic communities identified on the two seamounts is likely due to differences in the size and morphology of these features; Diamond Head being larger and having greater seafloor topographic variation than Ghoul Seamount. The number of benthic communities identified on both seamounts is comparable to similar studies of large seamounts (elevation ≥ 1,000 m) in the Pacific Ocean, which have identified between 8 and 14 mega-epibenthic communities on a single seamount (Boschen et al., 2015; Du Preez et al., 2016; Morgan et al., 2019). The range in the number of such communities so far identified on seamounts is likely due to a combination of factors, including differences in the size and physical characteristics of the seamounts, as well as the sampling density, taxonomic resolution of the data and clustering method used to identify communities. Most of the benthic communities identified in this study were characterised by a high abundance of one to several taxa: predominately hydrocorals, comatulid crinoids, galatheid squat lobsters, alcyonacea corals, and sponges. Similarly, analyses of benthic communities from other seamounts showed that a small number (∼1 to 5) of species predominated and characterised distinct communities (Henry et al., 2014; Boschen et al., 2015; Serrano et al., 2017; De la Torriente et al., 2018; Morgan et al., 2019).
Although the taxon compositions within the four main community types (coral reef, octocoral, mixed, and hermit crab) differed between the two seamounts examined, similar spatial distribution patterns were observed. Coral reef communities were primarily distributed on the summits. Octocoral communities were only identified from Diamond Head but were also primarily distributed on the summit. In contrast, the mixed communities (e.g., communities characterised by demosponges, comatulid crinoids, and stylasterids on Ghoul and comatulid crinoids, pectinid scallops, pagurids, demosponges, and stylasterids on Diamond Head) were distributed along the seamount flanks. On both seamounts, the hermit crab communities mostly occurred at the seamount base and/or deeper flanks. These differences in spatial distribution between community types are likely to be partially attributable to habitat variation with position on the seamount. For example, the summit is likely to be characterised by accelerated currents which provide increased trophic input for large suspension-feeding corals (Clark and Bowden, 2015; Serrano et al., 2017; Lapointe et al., 2020), whereas rocky outcrops and boulders on the steeper seamount flanks may provide filter-feeders in mixed communities (e.g., stylasterid hydrocorals, comatulid crinoids, pectinid scallops, alcyonacean corals, bryozoans, demosponges, glass sponges) with patches of suitable substrate for attachment and access to above seabed currents (Beaman et al., 2005; Du Preez et al., 2016; Lacharité and Metaxas, 2017). Areas near the seamount base typically have a greater proportion of unconsolidated sediments, which provide suitable habitat and food for mobile scavengers (e.g., hermit crabs) and infauna (Beaman et al., 2005; Du Preez et al., 2016; Serrano et al., 2017).
Like the studies of Victorero et al. (2018), Morgan et al. (2019), we found that beta diversity within both seamounts was mostly attributed to faunal turnover, rather than nestedness. The turnover component of beta diversity on Ghoul and Diamond Head was always greater within seamount side sectors than between sectors, indicating that faunal turnover occurred mostly over changes in depth, rather than over horizontal gradients at similar depths. In contrast, Morgan et al. (2019) reported high faunal turnover between sides on Mokumanamana Seamount. This difference is likely attributable to the small sizes of Ghoul and Diamond Head (elevations 100-300 m) relative to Mokumanamana (elevation > 700 m), meaning there is little variation in niche-defining parameters between seamount sides (e.g., food availability, substrate suitability, current speed) while on Mokumanamana oceanographic conditions can differ greatly among seamount sides.
Potential Drivers of Within-Seamount Community Structural Variation
Our distance-based regression analysis revealed that depth had the greatest explanatory power for the community structure observed on both study seamounts. Variation in megabenthic community structure has been related to depth on other seamounts (Lundsten et al., 2009; Boschen et al., 2015; McClain and Lundsten, 2015; Du Preez et al., 2016; De la Torriente et al., 2018; Victorero et al., 2018; Auscavitch et al., 2020a, b). Many of these other seamount studies were conducted along comparatively large depth gradients, which would be expected to exhibit strong corresponding environmental gradients and consequently vertical zonation of benthic communities. The narrow depth ranges of the seamounts examined here (Ghoul: 930-1,030 m, Diamond Head: 600-900 m) mean that variables such as temperature did not vary much (5.2-6.1 and 6.6-8.0°C for the Ghoul and Diamond Head samples, respectively). It is thus surprising that depth was more strongly correlated with community structure here than other variables which were included in the analysis. However, bottom temperature variations of 1-2°C have been shown to influence distributions of deep-sea coral and sponge species (Dijkstra et al., 2021). High levels of benthic community variation have also been observed on a Hawaiian seamount over comparatively narrow depth ranges of 320-530 m (Long and Baco, 2014). Depth is likely a proxy for one or more other variables which could influence fine-scale species distributions, such as seabed current strength and organic matter flux, measures of which it was not possible to include as variables in the analysis. Substrate type along a gradient from sand to bedrock substrate (PC 1) had the second-highest explanatory power for community structure on both study seamounts, supporting other studies which have observed that benthic communities show variation as substrate changes across a range of spatial scales within a seamount, with particularly noticeable differences in faunal composition between consolidated hard substrate (e.g., boulders) and unconsolidated soft substrate (e.g., sandy mud) (McClain et al., 2010; Sautya et al., 2011; Henry et al., 2014; Boschen et al., 2015; Clark and Bowden, 2015; Du Preez et al., 2016; Serrano et al., 2017; Victorero et al., 2018; Morgan et al., 2019; Lapointe et al., 2020).
Slope characteristics [standard deviation of slope, slope (both correlated with depth range), and profile curvature (correlated with plan curvature)] were more influential environmental predictors of communities on Ghoul than those on Diamond Head, which were correlated more with eastness, substrate diversity, and ruggedness (correlated with curvature). This pattern is reflected in the observed distribution of the seamount communities, with Diamond Head communities varying more with broadscale aspect (i.e., seamount side) than those on Ghoul Seamount. Small pinnacles are present on the west and south sides of Diamond Head, but not on the north or east sides, which may contribute to fine-scale spatial variation in seabed current speed and/or direction, and consequently community variation with aspect on this feature through the unequal partitioning of food (Genin et al., 1986; Dower et al., 1992; Mohn et al., 2014; Morris et al., 2016).
The best DistLM regression models accounted for 51 and 45% percent of the total variation among the Ghoul and Diamond Head samples, respectively. Similar seamount studies have also found that modelling only explained up to half of the observed benthic community variation, even with the inclusion of additional explanatory variables, such as magnetivity, backscatter, oxygen, surface productivity, and current strength (Henry et al., 2014; Long and Baco, 2014; Boschen et al., 2015; Clark and Bowden, 2015; De la Torriente et al., 2018; Morgan et al., 2019). These findings suggest that seamount community assembly processes are complex and difficult to model using environmental variables alone, or that these variables were not obtained at the most suitable spatial scale for examining ecological processes at the within-seamount scale. Furthermore, because taxa respond to environmental parameters differently (e.g., Dijkstra et al., 2021), it can be difficult to link environmental and habitat variation to community-level dissimilarities. Community structure is also influenced by biological factors which are difficult to sample and include in analyses, such as predation or competition, and/or exhibit a degree of stochasticity that are not easily accounted for in linear regression analyses. Even with these limitations, the results of our analysis indicate that environmental predictors of within-seamount benthic community structure are somewhat similar between the two seamounts. That is, depth, substrate composition, profile curvature, and slope were significantly correlated with community structure on both features. Finally, although our analysis suggested that the spatial scales of important community structuring variables may vary among seamounts (based on our finding that the best regression model for Ghoul included the 25 m environmental data, while the best regression model for Diamond Head included the 15 × 15 focal mean data), the adjusted R2 values did not vary greatly between the 25 m and 15 × 15 focal mean regression models for Diamond Head, indicating that the selected spatial scale does not have a major influence on model performance for this seamount.
Making Community Distribution Models and Assessing Their Performance
We used the environmental variables identified by the distance-based regression analysis as being best correlated with observed community structure as predicator variables in our RF community distribution models. The five most influential explanatory variables included in the Ghoul model in order of importance were: coral rubble, depth, slope, standard deviation of slope, and sand/bedrock; and for Diamond Head: depth, ruggedness, eastness, sand/bedrock, and slope. Depth and substrate composition explain community variation within both seamounts, while aspect and ruggedness more greatly influence Diamond Head community structure.
Similar predictive seamount community distribution studies include those by Du Preez et al. (2016) on Cobb Seamount and Serrano et al. (2017) on Galicia Bank. Cobb Seamount is a guyot in the Cobb-Eickelberg Seamount chain which spans an area of 824 km2 and depths 20-3,000 m in the northeast Pacific Ocean. Galicia Bank is a non-volcanic, isolated seamount located ∼220 km northwest of Spain in the northeast Atlantic with an area of 1,844 km2 and depth range of 600-2,000 m. Du Preez et al. (2016) identified depth and rugosity as the most important predictors of mega-epibenthic community structure on Cobb Seamount. Serrano et al. (2017) found that depth and substrate type were included in the best models for every mega-epibenthic community on Galicia Bank. Despite differences between Cobb Seamount, Galicia Bank, Ghoul, and Diamond Head in terms of overall size, isolation from surrounding features, and depth range, there is a general consistency in selecting depth, substrate, and some measure of seafloor terrain (i.e., rugosity, slope, curvature) as variables that make the best community distribution models on seamounts at fine spatial scales.
Performance of the predictive distribution models for Ghoul and Diamond Head was very good (multi-class AUC 0.85 and 0.9, respectively), and comparable to models made by Serrano et al. (2017) and Du Preez et al. (2016). The overall OOB error rates obtained here were higher than those of Du Preez et al. (2016) for Cobb Seamount (30 and 39% OOB error compared to 21%). Bathymetric variation on Ghoul and Diamond Head is substantially less than on Cobb Seamount, resulting in some explanatory variables having smaller ranges, which may make accurately distinguishing between communities based on these variables alone more difficult. The inclusion of hydrodynamic and/or productivity variables could potentially improve the performance of the community distribution models (Rengstorf et al., 2012, 2014; Pearman et al., 2020) by helping to describe fine-scale environmental variation but these data are difficult to obtain for deep, offshore areas at the spatial scales examined here. Additionally, the exclusion of the minority communities (<5% samples) may have contributed to some of the high OOB error rates we observed.
Predicted Community Distributions and Patch Characteristics
The predicted distributions of the identified mega-epibenthic communities on Ghoul generally formed bands which partially or fully encircled the seamount, similar to community distribution patterns predicted on Cobb Seamount, a large shallow seamount in the northeast Pacific (Du Preez et al., 2016). However, it is important to emphasise that the summit depth of Cobb Seamount is much shallower than that of Ghoul (∼20 m compared to 930 m), suggesting that the similarity in patch characteristics between these two features may be due to a general pattern of vertical zonation due to high species turnover on seamounts (Rowden et al., 2010), rather than similarities in topography or depth of Ghoul and Cobb. On Diamond Head, community distributions patterns were predicted to vary more, forming patches of varying shape, size, and distribution, which more closely resembled patterns predicted by Serrano et al. (2017) for the large deep northeast Atlantic seamount known as the Galicia Bank. Differences are likely due to differences in habitat requirements and feeding modes by the representative taxa of each community. Octocoral and stony coral reef communities are each characterised by suspension feeders and were predicted to occur in small patches on the summits of both seamounts, where currents are likely to be accelerated and thus provide these taxa with suitable food. This pattern is similar to predicted spatial distributions of S. variabilis on the Louisville Seamount Chain, whereby higher probabilities of S. variabilis presence occurred along the summit-slope breaks (Rowden et al., 2017). On both Ghoul and Diamond Head, the hermit crab communities comprised multiple small patches distributed on the deeper flanks. These areas are characterised by low relief and a high proportion of soft sediment, and thus may provide suitable habitat for a community dominated by scavenging fauna. Mixed communities were predicted to occur across broader depth ranges than the other community types, indicating that the dominant taxa of these communities, including Pectinidae spp., Stylasteridae spp., and Comatulid sp. 1, may have broader realized niches than the dominant taxa of the other community types.
The range of patch characteristics observed on Ghoul and Diamond Head can vary greatly by size, inter-patch distances, density, and contiguity. Predicted community patch areas ranged from 0.06 to 76 ha (0.0006 to 0.76 km2), though it is unclear how the patch areas reported here compare to other studies because previous seamount community distribution models have not described patch characteristics. Du Preez et al. (2016) did report the total surface area of each predicted community’s distribution on Cobb Seamount, which ranged from 1.6 to 70 km2. On Cobb Seamount and Galicia Bank, the number of patches per community varied from 1 to > 10. The “pinnacle” and “crinoid” communities were predicted to form single contiguous patches near the summit on Cobb Seamount, similar to the predicted distributions of stylasterids-Solenosmilia-comatulid communities identified on Ghoul. The other Cobb Seamount communities appeared to exhibit varying patch characteristics, from large, mostly contiguous patches with limited distribution (e.g., the “Sand” and “Bare” communities) to highly irregular patch sizes distributed across the seamount extent (e.g., the “Soft Coral” and “Anemone” communities). On Galicia Bank, none of the predicted communities appeared to comprise a single contiguous patch but comprised smaller widely dispersed patches, similar to the patterns predicted on Diamond Head Seamount for stylasterid-pagurid-comatulid crinoid communities.
On both seamounts examined here, inter-patch distances were quite small, reaching a maximum of several hundred metres, indicating that patches of the same community class are potentially highly connected, and that environmental patch characteristics (e.g., substrate type, depth, and slope) may have a greater influence on patch colonization than inter-patch distance. However, the degree of connectivity may vary between communities, as patch contiguity ranged from 0.13 to 0.55 on Diamond Head and 0.21 to 0.77 on Ghoul. Contiguity was often higher for communities which covered a larger portion of the total seamount area, although this relationship was not consistent. Patch density was overall very low, mostly ranging from ∼1 to 6, but substantially higher for pagurid-demosponge-comatulid communities t (25.2) and u (44.1) on Ghoul, supporting the prediction that these communities are generally well-connected. There was no obvious relationship between the metrics inter-patch distance, contiguity index, or patch density with community composition, highlighting the need to further explore this relationship in marine environments, as this is a common practice in terrestrial studies (Wedding et al., 2011).
Management Applications
Our analysis showed that many of the communities identified on Ghoul and Diamond Head were characterised by at least one vulnerable marine ecosystem (VME) indicator taxon, such as stony corals, hydrocorals, anemones, sponges, and gorgonian corals (Parker et al., 2009). Although Diamond Head is protected from bottom trawling impacts as part of a Seamount Closure Area (SCA; Brodie and Clark, 2003), stony coral reef communities predominated by Solenosmilia variabilis on Ghoul may be particularly vulnerable to fishing disturbances. The S. variabilis reef community was predicted to form one patch on the summit, which is often targeted as the landing place of trawl gear before being towed downslope (Clark and O’Driscoll, 2003). This community was also predicted to cover a small area relative to the potential cumulative area swept by trawl gear in a single tow. Assuming a trawl width (i.e., door spread) of 100 m (Clark and Koslow, 2007) and tow length of 2 km (Clark and O’Driscoll, 2003), 0.2 km2 seafloor area can be impacted in a single tow, or 20 times the total predicted area of the S. variabilis reef, 0.01 km2. A fishery closure protecting the upper 20 m of the Ghoul summit could therefore effectively conserve the reef community. However, enforcement of fishing regulations in protected areas of this size could prove difficult and would require that trawlers have precise systems for determining the location of the trawl net on the seafloor. A more conservative whole-seamount fishery closure may therefore be warranted. The inclusion of Ghoul, whether partial or whole seamount, in a SCA could provide a refuge area for benthic fauna on other seamounts in the Graveyard Complex that are subject to bottom trawling, potentially aiding recovery in those areas.
Knowledge of a community’s patch characteristics (i.e., the predicted patch number, area, and connectivity of a given community type) may provide further important information to designate potential areas for protection from fishing or other human impacts within a seamount. For example, if a seamount benthic community considered for protection (e.g., one characterised by VME indicator taxa) is predicted to occur in multiple patches of varying area sizes, an effective protected area can be designed to balance the number and total area of protected patches to reach a particular conservation objective (e.g., number of individuals, biomass, area cover, percent total population). If the minimum distance needed to maintain population connectivity is known, this metric can also be used to ensure that a potential protected area will keep individuals of the same species inhabiting different patches connected via migration and/or spawning. This approach may be particularly applicable to seamounts in which the community of interest is limited to a particular depth range or area of the seamount, making a within-seamount spatial closure effective for conservation. Multiple within-seamount closures across seamounts in a chain or group may also be an effective conservation option for maintaining connectivity if the community of interest is known to occur in patches on several features in close proximity, or to provide potential areas for recolonisation and recovery from earlier fishing impacts.
Conclusion
The outputs of the predictive benthic community distribution models presented here for seamounts contribute to the growing number of studies which have successfully utilised seafloor terrain variables to predict and map the small-scale occurrence of deep-sea species and communities (e.g., Dolan et al., 2008; García-Alegre et al., 2014; Rengstorf et al., 2014; Ramiro-Sánchez et al., 2019). Our results, along with those reported by Du Preez et al. (2016), Serrano et al. (2017), demonstrate that seafloor terrain and substrate parameters can be effectively used to predict mega-epibenthic community distributions at local scales on seamounts. However, more local-scale seamount studies are required to further examine to what extent the same or similar environmental predictors can be applied to different seamounts, as the development of a general suite of environmental predictors could be useful for seamount spatial management in areas that are difficult to extensively survey. Indeed, our seamount distribution models can be applied to comparable features in the Graveyard and Andes complexes and validated against existing imagery-obtained community data to test each model’s predictive power and identify any model limitations (planned for a future study). Although our analysis indicated that the performance of both distribution models was very good, it is likely that our models suffer similar limitations as other deep-sea distribution models, such as missing ecologically important explanatory variables, unquantified uncertainty in interpolated environmental layers (e.g., substrate PC layers), and modelling at too coarse a taxonomic resolution (Bowden et al., 2021). Additionally, the model uncertainty maps enable the identification of high-uncertainty areas within each seamount where caution should be taken in interpreting the model predictions or where more data may be required. Each of these models should therefore be validated with independent data and revised before being applied to other seamounts or used in any marine management context to ensure the predictions are reliable (Anderson et al., 2016a; Bowden et al., 2021). Such continued development of robust, reliable predictive distribution models for individual seamounts can then be used to aid the design of protected areas within seamounts, as described above. Finally, the present study differs from previous similar studies in that we examined the patch characteristics of the modelled benthic communities within each seamount. We recommend that more marine benthic studies describe community patch characteristics because these can improve our understanding of within-seamount community dynamics, including the recolonisation and recovery potential of habitat patches previously subject to fishing disturbance.
Data Availability Statement
The original contributions presented in the study are included in the article/Supplementary Material, further inquiries can be directed to the corresponding author/s.
Author Contributions
SG performed the data analyses and wrote the first manuscript draft. MC, AR, and DB obtained funding for the study, collected the data, and advised SG on the analysis of the image data. FS provided the base R code for the RF community distribution models and advised SG on model analysis. AR, DB, MC, and FS helped revise and prepare the manuscript for publication. All authors contributed to the article and approved the submitted version.
Funding
This research was funded by the Ministry for Primary Industries (projects BEN2014-02 and ZBD2020-07). SG was supported by Ph.D. scholarship funding from the Victoria University of Wellington, New Zealand.
Conflict of Interest
The authors declare that the research was conducted in the absence of any commercial or financial relationships that could be construed as a potential conflict of interest.
Publisher’s Note
All claims expressed in this article are solely those of the authors and do not necessarily represent those of their affiliated organizations, or those of the publisher, the editors and the reviewers. Any product that may be evaluated in this article, or claim that may be made by its manufacturer, is not guaranteed or endorsed by the publisher.
Acknowledgments
We thank the captain, crew, and scientific party of the R/V Tangaroa TAN1503 voyage for their collection of the imagery data used in our analyses, in particular Steve George, Alan Hart, Diana Macpherson, Sadie Mills, Rob Stewart, and Di Tracey (all NIWA). Thanks also to Arne Pallentin (NIWA) for collection and processing of the multibeam bathymetry data. We acknowledge several NIWA taxonomists for their assistance in identifying benthic species from imagery: Di Tracey (corals), Michelle Kelley (sponges), Dennis Gordon (bryozoans and hydrocorals), Sadie Mills (ophiuroids and asteroids), Caroline Chin (general taxa), and Rob Stewart (general and antipatharian corals). We thank the reviewers of this article for their insight and suggestions that helped us to greatly improve our manuscript.
Supplementary Material
The Supplementary Material for this article can be found online at: https://www.frontiersin.org/articles/10.3389/fmars.2021.765407/full#supplementary-material
References
Anderson, M., Gorley, R. N., and Clarke, K. R. (2008). PERMANOVA+ for PRIMER: Guide to Software and Statistical Methods. Plymouth: PRIMER-E.
Anderson, O. F., Guinotte, J. M., Rowden, A. A., Tracey, D. M., Mackay, K. A., and Clark, M. R. (2016b). Habitat suitability models for predicting the occurrence of vulnerable marine ecosystems in the seas around New Zealand. Deep Sea Res. Part I Oceanogr. Res. Pap. 115, 265–292. doi: 10.1016/j.dsr.2016.07.006
Anderson, O. F., Guinotte, J. M., Rowden, A. A., Clark, M. R., Mormede, S., Davies, A. J., et al. (2016a). Field validation of habitat suitability models for vulnerable marine ecosystems in the South Pacific Ocean: implications for the use of broad-scale models in fisheries management. Ocean Coast. Manag. 120, 110–126. doi: 10.1016/j.ocecoaman.2015.11.025
Angelini, C., and Silliman, B. R. (2012). Patch size-dependent community recovery after massive disturbance. Ecology 93, 101–110. doi: 10.1890/11-0557.1
Auscavitch, S. R., Deer, M. C., Keller, A. G., Rotjan, R. D., Shank, T. M., and Cordes, E. E. (2020a). Oceanographic drivers of deep-sea coral species distribution and community assembly on seamounts, islands, atolls, and reefs within the Phoenix Islands Protected Area. Front. Mar. Sci. 7:42. doi: 10.3389/fmars.2020.00042
Auscavitch, S. R., Lunden, J. J., Barkman, A., Quattrini, A. M., Demopoulos, A. W. J., and Cordes, E. E. (2020b). Distribution of deep-water scleractinian and stylasterid corals across abiotic environmental gradients on three seamounts in the Anegada Passage. PeerJ 8:e9523. doi: 10.7717/peerj.9523
Auster, P. J., Moore, J., Heinonen, K. B., and Watling, L. (2005). “A habitat classification scheme for seamount landscapes: assessing the functional role of deep-water corals as fish habitat,” in Cold-Water Corals and Ecosystems, eds A. Freiwald and J. M. Roberts (Berlin: Springer), 761–769. doi: 10.1007/3-540-27673-4_40
Baselga, A., and Orme, C. D. L. (2012). Betapart: an R package for the study of beta diversity. Methods Ecol. Evol. 3, 808–812. doi: 10.1111/j.2041-210X.2012.00224.x
Beaman, R. J., Daniell, J. J., and Harris, P. T. (2005). Geology-benthos relationships on a temperate rocky bank, eastern Bass Strait, Australia. Mar. Freshw. Res. 56, 943–958. doi: 10.1071/MF04306
Boschen, R., Rowden, A., Clark, M., Barton, S., Pallentin, A., and Gardner, J. (2015). Megabenthic assemblage structure on three New Zealand seamounts: implications for seafloor massive sulfide mining. Mar. Ecol. Prog. Ser. 523, 1–14. doi: 10.3354/meps11239
Bowden, D. A., and Jones, D. O. B. (2016). “Towed Cameras,” in Biological Sampling in The Deep Sea, eds M. R. Clark, A. A. Rowden, and M. Consalvey (Chichester: Wiley & Sons), 260–284. doi: 10.1002/9781118332535.ch12
Bowden, D. A., Anderson, O. F., Rowden, A. A., Stephenson, F., and Clark, M. R. (2021). Assessing habitat suitability models for the deep sea: is our ability to predict the distributions of seafloor fauna improving? Front. Mar. Sci. 8:6322389. doi: 10.33389/fmars.2021.6322389
Brodie, S., and Clark, M. (2003). “The New Zealand Seamount Management Strategy - steps towards conserving offshore marine habitat,” in Aquatic Protected Areas: What Works Best and How do We Know? Proceedings of the World Congress on Aquatic Protected Areas, eds J. P. Beumer, A. Grant, and D. Smith (Cairns, QLD: Australian Society of Fish Biology), 664–673.
Chiswell, S. M., Bradford-Grieve, J., Hadfield, M. G., and Kennan, S. C. (2013). Climatology of surface chlorophyll a, autumn-winter and spring blooms in the southwest Pacific Ocean. J. Geophys. Res. Oceans 118, 1003–1018. doi: 10.1002/jgrc.20088
Clark, M. R., Althaus, F., Schlacher, T. A., Williams, A., Bowden, D. A., and Rowden, A. A. (2016). The impacts of deep-sea fisheries on benthic communities: a review. ICES J. Mar. Sci. 73, i51–i69. doi: 10.1093/icesjms/fsv123
Clark, M. R., and Bowden, D. A. (2015). Seamount biodiversity: high variability both within and between seamounts in the Ross Sea region of Antarctica. Hydrobiologia 761, 161–180. doi: 10.1007/s10750-015-2327-9
Clark, M. R., and Dunn, M. R. (2012). Spatial management of deep-sea seamount fisheries: balancing exploitation and habitat conservation. Environ. Conserv. 39, 204–214. doi: 10.1017/S0376892912000021z
Clark, M. R., and Koslow, J. A. (2007). “Impacts of fisheries on seamounts,” in Seamounts: Ecology, Fisheries, and Conservation, eds T. J. Pitcher, T. Morato, P. J. B. Hart, M. R. Clark, N. Haggan, and R. R. Santos (Oxford: Blackwell Publishing), 413–441.
Clark, M. R., and O’Driscoll, R. (2003). Deepwater fisheries and aspects of their impact on seamount habitat in New Zealand. J. Northwest Atlantic Fish. Sci. 31, 441–458.
Clark, M. R., and Rowden, A. A. (2009). Effect of deepwater trawling on the macro-invertebrate assemblages of seamounts on the Chatham Rise, New Zealand. Deep Sea Res. Part I Oceanogr. Res. Pap. 56, 1540–1554. doi: 10.1016/j.dsr.2009.04.015
Clark, M. R., and Rowden, A. A. (2010). Spotlight 7: graveyard seamounts. Oceanography 23, 146–147. doi: 10.5670/oceanog.2010.79
Clark, M. R., Bowden, D. A., Rowden, A. A., and Stewart, R. (2019). Little evidence of benthic community resilience to bottom trawling on seamounts after 15 years. Front. Mar. Sci. 6:63. doi: 10.3389/fmars.2019.00063
Clark, M. R., Rowden, A. A., Schlacher, T., Williams, A., Consalvey, M., Stocks, K. I., et al. (2010b). The ecology of seamounts: structure, function, and human impacts. Annu. Rev. Mar. Sci. 2, 253–278. doi: 10.1146/annurev-marine-120308-081109
Clark, M. R., Bowden, D., Baird, S., and Stewart, R. (2010a). Effects of fishing on the benthic biodiversity of seamounts of the “Graveyard” complex, northern Chatham Rise. N. Z. Aquat. Environ. Biodivers. Rep. 46:40.
Clarke, K. R., Somer, P. J., and Gorley, R. N. (2008). Testing of null hypotheses in exploratory community analyses: similarity profiles and biota-environment linkage. J. Exp. Mar. Biol. Ecol. 366, 56–69. doi: 10.1016/j.jembe.2008.07.009
Compton, T. J., Morrison, M. A., Leathwick, J. R., and Carbines, G. D. (2012). Ontogenetic habitat associations of a demersal fish species, Pagrus auratus, identified using boosted regression trees. Mar. Ecol. Prog. Ser. 462, 219–230.
Cutler, A., Cutler, D. R., and Stevens, J. R. (2011). “Random forests,” in Machine Learning, eds C. Zhang and Y. Ma (Boston, MA: Springer US), 1–21. doi: 10.1007/978-1-4419-9326-7
Davies, J. S., Stewart, H. A., Narayanaswamy, B. E., Jacobs, C., Spicer, J., Golding, N., et al. (2015). Benthic assemblages of the Anton Dohrn seamount (NE Atlantic): defining deep-sea biotopes to support habitat mapping and management efforts with a focus on vulnerable marine ecosystems. PLoS One 10:e0124815. doi: 10.1371/journal.pone.0124815
De la Torriente, A., Serrano, A., Fernández-Salas, L. M., García, M., and Aguilar, R. (2018). Identifying epibenthic habitats on the Seco de los Olivos Seamount: species assemblages and environmental characteristics. Deep Sea Res. Part I Oceanogr. Res. Pap. 135, 9–22. doi: 10.1016/j.dsr.2018.03.015
Dijkstra, J. A., Mello, K., Sowers, D., Malik, M., Watling, L., and Mayer, L. A. (2021). Fine-scale mapping of deep-sea habitat-forming species densities reveals taxonomic specific environmental drivers. Glob. Ecol. Biogeogr. 30, 1286–1298. doi: 10.1111/geb.13285
Dolan, M. F. J., Grehan, A. J., Guinan, J. C., and Brown, C. (2008). Modelling the local distribution of cold-water corals in relation to bathymetric variables: adding spatial context to deep-sea video data. Deep Sea Res. Part I Oceanogr. Res. Pap. 55, 1564–1579. doi: 10.1016/j.dsr.2008.06.010
Dower, J., Freeland, H., and Juniper, K. (1992). A strong biological response to oceanic flow past Cobb Seamount. Deep Sea Res. Part I Oceanogr. Res. Pap. 39, 1139–1145. doi: 10.1016/0198-0149(92)90061-W
Du Preez, C., Curtis, J. M., and Clarke, M. E. (2016). The structure and distribution of benthic communities on a shallow seamount (Cobb Seamount, Northeast Pacific Ocean). PLoS One 11:e0165513. doi: 10.1371/journal.pone.0165513
Ellingsen, K. E., Hewitt, J. E., and Thrush, S. F. (2007). Rare species, habitat diversity and functional redundancy in marine benthos. J. Sea Res. 58, 291–301. doi: 10.1016/j.seares.2007.10.001
Gallucci, F., Moens, T., Vanreusel, A., and Fonseca, G. (2008). Active colonisation of disturbed sediments by deep-sea nematodes: evidence for the patch mosaic model. Mar. Ecol. Prog. Ser. 367, 173–183. doi: 10.3354/meps07537
Gamble, J. A., Morris, P. A., and Adams, C. J. (1986). “The geology, petrology and geochemistry of Cenozoic volcanic rocks from the Campbell Plateau and Chatham Rise,” in Late Cenozoic Volcanism in New Zealand, Vol. 23, ed. I. E. M. Smith (Wellington: Royal Society of New Zealand Bulletin), 344–365.
García-Alegre, A., Sánchez, F., Gómez-Ballesteros, M., Hinz, H., Serrano, A., and Parra, S. (2014). Modelling and mapping the local distribution of representative species on the Le Danois Bank, El Cachucho Marine Protected Area (Cantabrian Sea). Deep Sea Res. Part II Top. Stud. Oceanogr. 106, 151–164. doi: 10.1016/j.dsr2.2013.12.012
Genin, A., Dayton, P. K., Lonsdale, P. F., and Spiess, F. N. (1986). Corals on seamount peaks provide evidence of current acceleration over deep-sea topography. Nature 322, 59–61. doi: 10.1038/322059a0
Goode, S. L., Rowden, A. A., Bowden, D. A., and Clark, M. R. (2020). Resilience of seamount benthic communities to trawling disturbance. Mar. Environ. Res. 161:105086. doi: 10.1016/j.marenvres.2020.105086
Grosse, P., van Wyk de Vries, B., Euillades, P. A., Kervyn, M., and Petrinovic, I. A. (2012). Systematic morphometric characterisation of volcanic edifices using digital elevation models. Geomorphology 136, 114–131. doi: 10.1016/j.geomorph.2011.06.001
Hand, D. J., and Till, R. J. (2001). A simple generalisation of the area under the ROC curve for multiple class classification problems. Mach. Learn. 45, 171–186. doi: 10.1023/A:1010920819831
Hanski, I., and Gilpin, M. (1991). Metapopulation dynamics: brief history and conceptual domain. Biol. J. Linn. Soc. 42, 3–16. doi: 10.1111/j.1095-8312.1991.tb00548.x
Henry, L. A., Vad, J., Findlay, H. S., Murillo, J., Milligan, R., and Roberts, J. M. (2014). Environmental variability and biodiversity of megabenthos on the Hebrides Terrace Seamount (Northeast Atlantic). Sci. Rep. 4:5589.
Hesselbarth, M. H. K., Sciaini, M., With, K. A., Wiegand, K., and Nowosad, J. (2019). landscapemetrics: an open-source R tool to calculate landscape metrics. Ecography 42, 1648–1657. doi: 10.1111/ecog.04617
Hill, M. O. (1973). Diversity and evenness: a unifying notation and its consequences. Ecology 54, 427–432.
Hill, P. (2009). Designing a deep-towed camera vehicle using single conductor cable. Sea Technol. 50, 49–51.
Hoernle, K., White, J. D. L., van den Bogaard, P., Hauff, F., Coombs, D. S., Werner, R., et al. (2006). Cenozoic intraplate volcanism on New Zealand: upwelling induced by lithospheric removal. Earth Planet. Sci. Lett. 248, 350–367. doi: 10.1016/j.epsl.2006.06.001
Horton, T., Marsh, L., Bett, B. J., Gates, A. R., Jones, D. O. B., Benoist, N. M. A., et al. (2021). Recommendations for the standardisation of open taxonomic nomenclature for image-based identification. Front. Mar. Sci. 8:62072. doi: 10.3389/fmars.2021.62072
Kim, J. H., and DeWreede, R. E. (1996). Effects of size and season of disturbance on algal patch recovery in a rocky intertidal community. Mar. Ecol. Prog. Ser. 133, 217–228.
Kuhn, M. (2008). Building predictive models in R using the caret package. J. Stat. Softw. 28, 1–26. doi: 10.18637/jss.v028.i05
Lacharité, M., and Metaxas, A. (2017). Hard substrate in the deep ocean: how sediment features influence Epibenthic megafauna on the eastern Canadian margin. Deep Sea Res. Part I Oceanogr. Res. Pap. 126, 50–61. doi: 10.1016/j.dsr.2017.05.013
Langenkämper, D., Zurowietz, M., Schoening, T., and Nattkemper, T. W. (2017). BIIGLE 2.0 – browsing and annotating large marine image collections. Front. Mar. Sci. 4:83. doi: 10.3389/fmars.2017.00083
Lapointe, A. E., Watling, L., France, S. C., and Auster, P. J. (2020). Megabenthic assemblages in the lower bathyal (700–3000 m) on the New England and Corner Rise Seamounts, Northwest Atlantic. Deep Sea Res. Part I Oceanogr. Res. Pap. 165:103366. doi: 10.1016/j.dsr.2020.103366
Levins, R. (1969). Some demographic and genetic consequences of environmental heterogeneity for biological control. Bull. Entomol. Soc. Am. 3, 237–240.
Long, D. J., and Baco, A. R. (2014). Rapid change with depth in megabenthic structure-forming communities of the Makapu’u deep-sea coral bed. Deep Sea Res. Part II Top. Stud. Oceanogr. 99, 158–168. doi: 10.1016/j.dsr2.2013.05.032
Lundsten, L., Barry, J. P., Cailliet, G. M., Clague, D. A., DeVogelaere, A. P., and Geller, J. B. (2009). Benthic invertebrate communities on three seamounts off southern and central California, USA. Mar. Ecol. Prog. Ser. 374, 23–32. doi: 10.3354/meps07745
McArdle, B. H., and Anderson, M. J. (2001). Fitting multivariate models to community data: a comment on distance-based redundancy analysis. Ecology 82, 290–297.
McClain, C. R., and Lundsten, L. (2015). Assemblage structure is related to slope and depth on a deep offshore Pacific seamount chain. Mar. Ecol. 36, 210–220. doi: 10.1111/maec.12136
McClain, C. R., Lundsten, L., Barry, J., and DeVogelaere, A. (2010). Assemblage structure, but not diversity or density, change with depth on a northeast Pacific seamount. Mar. Ecol. 31, 14–25. doi: 10.1111/j.1439-0485.2010.00367.x
Mohn, C., Rengstorf, A., White, M., Duineveld, G., Mienis, F., Soetaert, K., et al. (2014). Linking benthic hydrodynamics and cold-water coral occurrences: a high-resolution model study at three cold-water coral provinces in the NE Atlantic. Prog. Oceanogr. 122, 92–104. doi: 10.1016/j.pocean.2013.12.003
Morgan, N. B., and Baco, A. R. (2021). Recent fishing footprint of the high-seas bottom trawl fisheries on the Northwestern Hawaiian Ridge and Emperor Seamount Chain: a finer-scale approach to a large-scale issue. Ecol. Indic. 121:107051. doi: 10.1016/j.ecolind.2020.107051
Morgan, N. B., Goode, S., Roark, E. B., and Baco, A. R. (2019). Fine scale assemblage structure of benthic invertebrate Megafauna on the north pacific seamount Mokumanamana. Front. Mar. Sci. 6:715. doi: 10.3389/fmars.2019.00715
Morris, K. J., Bett, B. J., Durden, J. M., Benoist, N. M. A., Huvenne, V. A. I., Jones, D. O. B., et al. (2016). Landscape-scale spatial heterogeneity in phytodetrital cover and megafauna biomass in the abyss links to modest topographic variation. Sci. Rep. 6:34080. doi: 10.1038/srep34080
Mortimer, N., and Scott, J. M. (2020). Volcanoes of Zealandia and the Southwest Pacific, New Zealand. J. Geol. Geophys. 63, 371–377. doi: 10.1080/00288306.2020.1713824
Murphy, R. J., Pinkerton, M. H., Richardson, K. M., Bradford-Grieve, J. M., and Boyd, P. W. (2001). Phytoplankton distributions around New Zealand derived from SeaWiFS remotely-sensed ocean colour data. N. Z. J. Mar. Freshw. Res. 35, 343–362. doi: 10.1080/00288330.2001.9517005
Nodder, S. D., and Northcote, L. C. (2001). Episodic particulate fluxes at southern temperature midlatitudes (42°–45°S) in the Subtropical Front region, east of New Zealand. Deep Sea Res. Part I 48, 833–864.
Nodder, S. D., Bowden, D. A., Pallentin, A., and Mackay, K. (2012). “Seafloor habitats and benthos of a continental ridge: Chatham rise, New Zealand,” in Seafloor Geomorphology as Benthic Habitat, eds P. T. Harris and E. K. Baker (Amsterdam: Elsevier), 763–776. doi: 10.1016/B978-0-12-385140-6.00056-6
O’Driscoll, R., and Clark, M. R. (2005). Quantifying the relative intensity of fishing on New Zealand seamounts. N. Z. J. Mar. Freshw. Res. 39, 839–850. doi: 10.1080/00288330.2005.9517356
Opresko, D., Tracey, D., and Mackay, E. (2014). Antipatharia (black corals) for the New Zealand Region. N. Z. Aquat. Environ. Biodivers. Rep. 136:20.
Parker, S. J., Penney, A. J., and Clark, M. R. (2009). Detection criteria for managing trawl impacts on vulnerable marine ecosystems in high seas fisheries of the South Pacific Ocean. Mar. Ecol. Prog. Ser. 397, 309–317. doi: 10.3354/meps08115
Pearce, J., and Ferrier, S. (2000). Evaluating the predictive performance of habitat models developed using logistic regression. Ecol. Modell. 133, 225–245. doi: 10.1016/S0304-3800(00)00322-7
Pearman, T. R. R., Robert, K., Callaway, A., Hall, R., Lo Iacono, C., and Huvenne, V. A. I. (2020). Improving the predictive capability of benthic species distribution models by incorporating oceanographic data – Towards holistic ecological modelling of a submarine canyon. Prog. Oceanogr. 184:102338. doi: 10.1016/j.pocean.2020.102338
Pitcher, T. J., Morato, T., Hart, P. J. B., Clark, M. R., Hagaan, N., and Santos, R. S. (2007). Seamounts: Ecology, Fisheries & Conservation. Oxford: Blackwell Publishing. doi: 10.1002/9780470691953
Ramiro-Sánchez, B., González-Irusta, J. M., Henry, L.-A., Cleland, J., Yeo, I., Xavier, J. R., et al. (2019). Characterization and mapping of a deep-sea sponge ground on the tropic seamount (Northeast Tropical Atlantic): implications for spatial management in the high seas. Front. Mar. Sci. 6:278. doi: 10.3389/fmars.2019.00278
Rengstorf, A. M., Grehan, A., Yesson, C., and Brown, C. (2012). Towards high-resolution habitat suitability modeling of vulnerable marine ecosystems in the deep-sea: resolving terrain attribute dependencies. Mar. Geodesy 35, 343–361. doi: 10.1080/01490419.2012.699020
Rengstorf, A. M., Mohn, C., Brown, C., Wisz, M. S., and Grehan, A. J. (2014). Predicting the distribution of deep-sea vulnerable marine ecosystems using high-resolution data: considerations and novel approaches. Deep Sea Res. Part I Oceanogr. Res. Pap. 93, 72–82. doi: 10.1016/j.dsr.2014.07.007
Robin, X., Turck, N., Hainard, A., Tiberti, N., Lisacek, F., Sanchez, J.-C., et al. (2011). pROC: an open-source package for R and S+ to analyze and compare ROC curves. BMC Bioinformatics 12:77. doi: 10.1186/1471-2105-12-77
Rowden, A. A., Anderson, O. F., Georgian, S. E., Bowden, D. A., Clark, M. R., Pallentin, A., et al. (2017). High-resolution habitat suitability models for the conservation and management of vulnerable marine ecosystems on the Louisville Seamount Chain, South Pacific Ocean. Front. Mar. Sci. 4:335. doi: 10.3389/fmars.2017.00335
Rowden, A. A., Dower, J. F., Schalcer, T. A., Consalvey, M., and Clark, M. R. (2010). Paradigms in seamount ecology: fact, fiction and future. Mar. Ecol. 31, 226–241. doi: 10.1111/j.1439-0485.2010.00400.x
Sánchez-Guillamón, O., Fernández-Salas, L. M., Vázquez, J. T., Palomino, D., Medialdea, T., López-González, N., et al. (2018). Shape and size complexity of deep seafloor mounds on the canary basin (West to Canary islands, Eastern Atlantic): a DEM-based geomorphometric analysis of domes and volcanoes. Geosciences (Switzerland) 8:37. doi: 10.3390/geosciences8020037
Sappington, J. M., Longshore, K. M., and Thompson, D. B. (2007). Quantifying landscape ruggedness for animal habitat analysis: a case study using bighorn sheep in the Mojave desert. J. Wildl. Manag. 71, 1419–1426. doi: 10.2193/2005-723
Sautya, S., Ingole, B., Ray, D., Stöhr, S., Samudrala, K., Raju, K. A. K., et al. (2011). Megafaunal community structure of Andaman seamounts including the Back-arc Basin - a quantitative exploration from the Indian Ocean. PLoS One 6:e16162. doi: 10.1371/journal.pone.0016162
Schlacher, T. A., Baco, A. R., Rowden, A. A., O’Hara, T. D., Clark, M. R., Kelley, C., et al. (2014). Seamount benthos in a cobalt-rich crust region of the central Pacific: conservation challenges for future seabed mining. Divers. Distrib. 20, 491–502. doi: 10.1111/ddi.12142
Serrano, A., González-Irusta, J. M., Punzón, A., García-Alegre, A., Lourido, A., Ríos, P., et al. (2017). Deep-sea benthic habitats modeling and mapping in a NE Atlantic seamount (Galicia Bank). Deep Sea Res. Part I Oceanogr. Res. Pap. 126, 115–127. doi: 10.1016/j.dsr.2017.06.003
Smith, C. R., and Brumsickle, S. J. (1989). The effects of patch size and substrate isolation on colonization modes and rates in an intertidal sediment. Limnol. Oceanogr. 34, 1263–1277.
Sousa, W. P. (1984). Intertidal mosaics: patch size, propagule availability, and spatially variable patterns of succession. Ecology 65, 1918–1935.
Sutton, P. (2001). Detailed structure of the subtropical front over Chatham Rise, east of New Zealand. J. Geophys. Res. Oceans 106, 31045–31056. doi: 10.1029/2000jc000562
Teixidó, N., Garrabou, J., Gutt, J., and Arntz, W. E. (2007). Iceberg disturbance and successional spatial patterns: the case of the shelf Antarctic benthic communities. Ecosystems 10, 142–157. doi: 10.1007/s10021-006-9012-9
Timm, C., Hoernle, K., Werner, R., Hauff, F., van den Bogaard, P., White, J., et al. (2010). Temporal and geochemical evolution of the Cenozoic intraplate volcanism of Zealandia. Earth Sci. Rev. 98, 38–64. doi: 10.1016/j.earscirev.2009.10.002
Tracey, D. M., Anderson, O. F., and Naylor, J. R. (2011). A Guide to Common Deepsea Invertebrates in New Zealand Waters. New Zealand Aquatic Environment and Biodiversity Report 86. Wellington: Ministry of Fisheries.
Tracey, D., Mackay, E., Gordon, D., Alderslade, P., Cairns, S., Opresko, D., et al. (2014). Coral Identification Guide - 2nd version. Department of Conservation Report. Wellington: Department of Conservation.
Victorero, L., Robert, K., Robinson, L. F., Taylor, M. L., and Huvenne, V. A. I. (2018). Species replacement dominates megabenthos beta diversity in a remote seamount setting. Sci. Rep. 8:4152. doi: 10.1038/s41598-018-22296-8
Walbridge, S., Slocum, N., Pobuda, M., and Wright, D. J. (2018). Unified geomorphological analysis workflows with benthic terrain modeler. Geosciences (Switzerland) 8:94. doi: 10.3390/geosciences8030094
Wedding, L. M., Lepczyk, C. A., Pittman, S. J., Friedlander, A. M., and Jorgensen, S. (2011). Quantifying seascape structure: extending terrestrial spatial pattern metrics to the marine realm. Mar. Ecol. Prog. Ser. 427, 219–232. doi: 10.3354/meps09119
Wentworth, C. K. (1922). A scale of grade and class terms for clastic sediments. J. Geol. 30, 377–392. doi: 10.1086/622910
Wienberg, C., Wintersteller, P., Beuck, L., and Hebbeln, D. (2013). Coral Patch seamount (NE Atlantic) – a sedimentologocial and megafaunal reconnaissaince based on video and hydroacoustic surveys. Biogeosciences 10, 3421–3443. doi: 10.5194/bg-10-3421-2013
Williams, A., Schlacher, T. A., Rowden, A. A., Althaus, F., Clark, M. R., Bowden, D. A., et al. (2010). Seamount megabenthic assemblages fail to recover from trawling impacts. Mar. Ecol. 31, 183–199. doi: 10.1111/j.1439-0485.2010.00385.x
Keywords: seamount, deep sea, benthic communities, distribution model, beta diversity, Chatham Rise, epifauna
Citation: Goode SL, Rowden AA, Bowden DA, Clark MR and Stephenson F (2021) Fine-Scale Mapping of Mega-Epibenthic Communities and Their Patch Characteristics on Two New Zealand Seamounts. Front. Mar. Sci. 8:765407. doi: 10.3389/fmars.2021.765407
Received: 27 August 2021; Accepted: 27 October 2021;
Published: 01 December 2021.
Edited by:
Clara F. Rodrigues, University of Aveiro, PortugalReviewed by:
Eva Giacomello, Universidade dos Açores - Instituto de Investigação em Ciências do Mar- OKEANOS, PortugalErin Easton, The University of Texas Rio Grande Valley, United States
Copyright © 2021 Goode, Rowden, Bowden, Clark and Stephenson. This is an open-access article distributed under the terms of the Creative Commons Attribution License (CC BY). The use, distribution or reproduction in other forums is permitted, provided the original author(s) and the copyright owner(s) are credited and that the original publication in this journal is cited, in accordance with accepted academic practice. No use, distribution or reproduction is permitted which does not comply with these terms.
*Correspondence: Savannah L. Goode, U2F2YW5uYWguR29vZGVAdnV3LmFjLm56; U2F2YW5uYWguR29vZGVAbml3YS5jby5ueg==