 Jaewoon Jeong
 Marit Stormoen
 Krishna K. Thakur
 Crawford W. Revie
- 1Department of Health Management, Atlantic Veterinary College, University of Prince Edward Island, Charlottetown, PE, Canada
- 2Faculty of Veterinary Medicine, Norwegian University of Life Science, Ås, Norway
- 3Department of Computer and Information Sciences, University of Strathclyde, Glasgow, United Kingdom
Accurate monitoring of sea lice levels on salmon farms is critical to the efficient management of louse infestation, as decisions around whether and when to apply treatment depend on an estimation of abundance. However, as with all sampling, the estimated abundance of salmon lice through sampling salmon cannot perfectly represent the abundance on a given farm. While suggestions to improve the accuracy of lice abundance estimates have previously been made, the significance of the accuracy of such estimation has been poorly understood. Understanding the extent of error or bias in sample estimates can facilitate an assessment as to how influential this “imperfect” information will likely be on management decisions, and support methods to mitigate negative outcomes associated with such imperfect estimates. Here, we built a model of a hypothetical Atlantic salmon farm using ordinary differential equations and simulated salmon lice (Lepeophtheirus salmonis) abundance over an entire production cycle, during which salmon were periodically sampled using Monte Carlo approaches that adopted a variety of sample sizes, treatment thresholds, and sampling intervals. The model could thus track two instances of salmon lice abundance: true abundance (based on the underlying model) and monitored abundance (based on the values that could be estimated under different simulated sampling protocols). Treatments, which depend on monitored abundance, could be characterized as early, timely, or late, as a result of over-estimation, appropriate estimation, and under-estimation, respectively. To achieve timely treatment, it is important to delay treatments until true abundance equals some treatment threshold and to execute treatment as soon as this threshold is reached. Adopting larger sample sizes increased the frequency of timely treatments, largely by reducing the incidence of early treatments due to less variance in the monitored abundance. Changes in sampling interval and treatment threshold also influenced the accuracy of abundance estimates and thus the frequency of timely treatments. This study has implications for the manner in which fish should be sampled on salmon farms to ensure accurate salmon lice abundance estimates and consequently the effective application treatment.
Introduction
Salmon lice infestation is a serious challenge that the commercial Atlantic salmon (Salmo salar L.) farming sector has faced for over three decades. Aquatic ectoparasites pose a risk to fish health and consequently farm productivity (Burka et al., 2012). Salmon lice infestation can cause retarded growth of fish and in severe cases mortality of stock. Salmon lice infestation on salmon farms can also transmit to wild salmon while they are migrating. While effective measures to prevent the infestation of salmon by sea lice are most desirable (Barrett et al., 2020), and our recent study (Jeong et al., 2021) provided further theoretical evidence in support of that argument, delousing measures to reduce the abundance of salmon lice remain important. Highly accurate salmon lice abundance estimates can better inform management decisions on the timing of delousing treatments.
Each salmon producing country has its own protocol to manage salmon lice; as such farmers are required to sample and count salmon lice on fish regularly and provide reports to the relevant authorities (Revie et al., 2009; Torrissen et al., 2013). These regularly occurring salmon sampling events play an important role in monitoring salmon lice infestation levels and patterns on salmon farms, and in decisions to apply costly interventions to suppress salmon lice abundance. Thus, reliable estimates of salmon lice infestation levels through appropriate salmon sampling are crucial, as treatment costs account for a sizeable portion of the profitability associated with salmon aquaculture (Costello, 2009), both due to costly interventions as well as biological loss as a result of reduced growth and on occasions mortality (Sviland Walde et al., 2021).
Sampling inevitably implies the possibility of error, because samples are only a subset of the population, and no subset can perfectly represent the characteristics of that population. To tackle this limitation, statistical formulae have been developed to calculate the necessary sample size that can generate the desired level of accurate prediction associated with infection (Dohoo et al., 2003). The formulae allow for the estimation of sampling error depending on sample size. However, not all statistical distributions of infection are well explained using these formulae. For example, when sampling fish to estimate the number of salmon lice per fish, it is seldom possible to calculate the appropriate sample size using such formulae. If salmon lice randomly choose their host fish, the statistical distribution of salmon lice counts per fish would be expected to follow the Poisson distribution. However, salmon lice tend to aggregate on some portion of fish, and therefore the statistical distribution of salmon lice counts per fish tends to be over-dispersed and commonly approximates a negative binomial distribution (Treasurer and Pope, 2000). Over-dispersion, which is an embedded concept within the negative binomial distribution, must be considered when designing sampling strategies appropriately. Analyses of empirical data have indicated that the level of the over-dispersion present in a given setting has a considerable effect on the appropriate sample size (Heuch et al., 2011; Jeong and Revie, 2020). Also, different patterns of salmon lice abundance among cages on salmon farms have been investigated and it has been demonstrated that sampling fewer fish from many cages will typically result in a marked improvement in the precision of salmon lice abundance estimates (Revie et al., 2007, 2005) when compared to taking a large number of fish from just a few cages.
Previous studies have mainly focused on understanding the principles involved in sampling strategies and subsequently on improving the accuracy of salmon lice abundance estimates. Nevertheless, considering that an essential goal of such estimation is to determine whether to apply a treatment to reduce the salmon lice infestation level, it is important to understand how the accuracy of salmon lice abundance estimates affects treatment decisions and as a result the overall management of salmon lice in salmon aquaculture.
Accurate estimation of salmon lice abundance through improved salmon sampling strategies is a key constituent of ensuring that interventions are applied when required. The timely application of treatments can contribute in a variety of ways. First, well-planned treatments prevent the level of salmon lice infestation from getting out of control, which precludes fish from suffering serious deterioration in health conditions. Second, the avoidance of unnecessary treatments will reduce the significant biological (Sviland Walde et al., 2021) and economical costs associated with salmon lice treatments (Abolofia et al., 2017). Third, judicious usage of parasiticide can delay the development of drug resistance in salmon lice populations (Aaen et al., 2015) and also reduce the environmental effect (Burridge et al., 2010). Last, efficient management of salmon lice on salmon aquaculture sites will help mitigate any effects on wild salmonids during migration in the vicinity of these sites (Krkošek et al., 2007). For these reasons, improved sampling strategies to gain more precise abundance estimates, and thus more effective treatment regimes, are a critical aspect of effective management of salmon lice on salmon farms.
In this study we simulated salmon lice (Lepeophtheirus salmonis) dynamics on a salmon farm during an entire production cycle, with a certain number of fish being sampled regularly, using Monte Carlo methods. During these simulations, we tracked the true abundance (as represented in the model) and the monitored abundance (as estimated by the various sampling regimes modeled across the simulations). These two measurements of abundance were compared to investigate the extent to which the timing of salmon lice treatments was being correctly determined. We then investigated how sampling-related factors, such as sample size, treatment threshold, and sampling interval, affected the accuracy of salmon lice abundance estimation and consequently “imperfect” treatment management. This study does not attempt to provide specific numerical estimates of sampling error, as these tend to be highly dependent on specific conditions that exist on each farm (Groner et al., 2016b). Rather, the overall trends found through our simulations can help suggest ways to improve the accuracy of the abundance estimation and the timeliness of treatment.
Materials and Methods
Model Formulation
We set up a hypothetical Atlantic salmon (Salmo salar L.) farm consisting of a single pen. To simulate temporally changing salmon lice (L. salmonis) abundance during a production cycle on a salmon farm, we used the model derived in Rittenhouse et al. (2016). Following this model, we utilized four life stages of salmon lice: nauplii (P); copepodids (I); chalimi and pre-adults (C); and adult females (A). The nauplius stage (P) includes all planktonic and floating non-infectious stages. The copepodids stage (I) is the infective stage, during which planktonic salmon lice must attach to their host fish, otherwise, they do not survive. The chalimi stage (C) includes the non-reproductive parasitic stages of chalimus and pre-adults. Lastly, the adult female stage (A) is a reproductive stage. Only female adults are included in the model formulation, on the assumption that salmon lice populations consist of roughly equal proportions of males and females (Rittenhouse et al., 2016). An ordinary differential equation (ODE) model was used to simulate the changes in the numbers of salmon lice in each compartment, due to death, reproduction, or development. Our model was simulated using the R platform and the package deSolve (Soetaert et al., 2010). The equations for the stage-structured dynamics of salmon lice were:
Development rates of nauplii (γP), chalimus and pre-adults (γC), mortality rates in each stage (μX), and egg viability (v) were calculated based on the parameters presented in Rittenhouse et al. (2016) (Table 1). The source codes can be accessed at https://github.com/jaewoonjeong/ImperfectSampling.
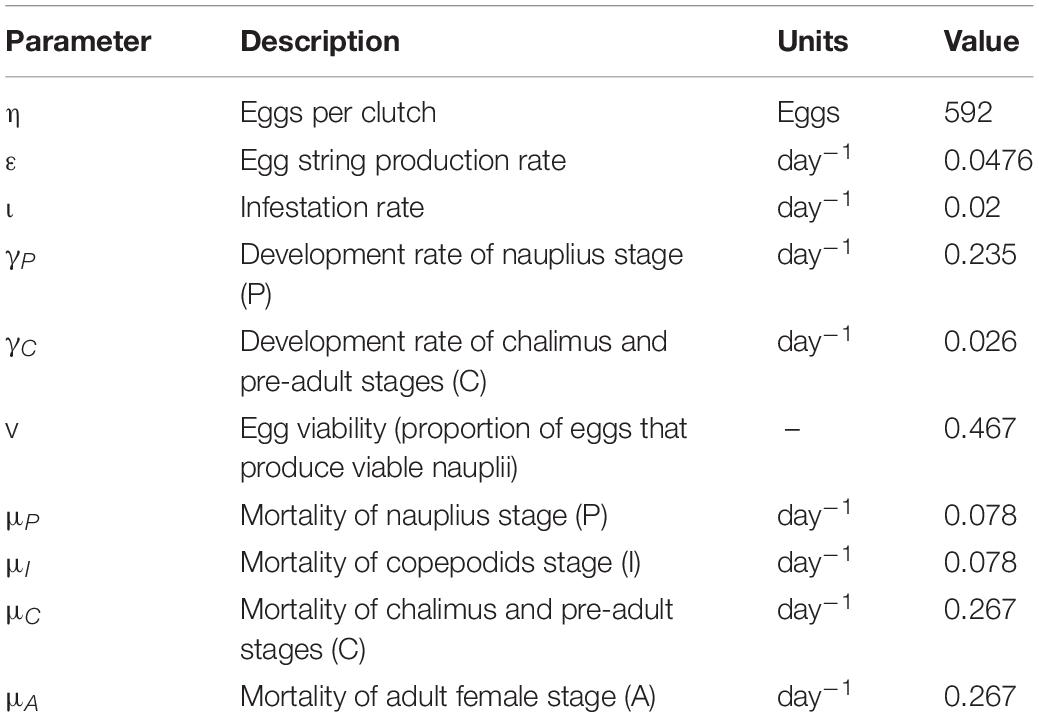
Table 1. Key parameters in the ordinary differential equation (ODE) model of sea lice dynamics.
We assumed that no salmon lice were present on the farm at the timing of stocking with smolts, due to fallowing between production cycles. A new cycle of infestation began with the migration of planktonic salmon lice from the external environment, and it was assumed that 0.005 nauplius per fish per day were introduced to the farm thereafter. Temperature affecting the development rates of salmon lice (Stien et al., 2005) and salinity affecting the survival proportion of salmon lice (Groner et al., 2016a) were maintained uniformly during the production cycle because the effects of seasonally changing temperature and salinity on salmon lice population dynamics were not of interest in this study. The constant values of temperature (8°C) and salinity (26.4 PSU) were chosen to be within the probable range of values that would be observed on salmon farms in Norway (Sandvik et al., 2020) or western Canada (Thakur et al., 2018). This hypothetical salmon farm was assumed to consist of only one pen in order not to consider the different salmon lice abundance patterns among pens that might affect the accuracy of salmon lice abundance estimation through fish sampling (Revie et al., 2005). This was to avoid over-complicating the interpretation of the effects that the various factors had on our outcomes of interest.
Sampling Procedure
As noted, our model tracked two types of abundances: the correct, but unknown outside of the model, abundance (hereafter “true abundance”) and the partially correct but known abundance (hereafter “monitored abundance”). The true abundance was based on the values simulated in the set of ODEs presented above, while the monitored abundance was determined according to the simulated sampling events. We assumed a certain number of salmon were sampled weekly throughout a production cycle of 550 days. In each sampling strategy of different sample sizes, treatment thresholds, and sampling intervals, 5,000 iterations of the simulation were performed by using the Monte-Carlo method to include stochasticity into our model. In our model, salmon lice abundance included only female adult lice, excluding other motile stages.
We assumed that the salmon lice count per salmon is based on the negative binomial distribution (Heuch et al., 2011). The negative binomial distribution can be applied to salmon lice abundance, such that NB (κ, A), is a function of A, the mean number of salmon lice per salmon (abundance), and κ, a parameter to represent the level of dispersion, explains the shape of the statistical distribution. At the time of each weekly sample, the true abundance was used as the A, and 2.19 was used as the dispersion parameter (κ) (Jeong and Revie, 2020). The negative binomial distribution was then used to simulate the salmon lice count for all fish in the pen, from which a certain number of fish were sampled. The mean salmon lice count per fish based on this sample was determined to be the monitored abundance.
Treatment was activated when monitored abundance based on salmon sampling, irrespective of true abundance, surpassed the treatment threshold. Treatment resulted in the reduction of true abundance. Treatment was modeled to exert its effect instantaneously, in a manner that might more closely resemble chemical bath treatments with parasiticides. Treatment efficacy was set at 95% (Robbins et al., 2010) of all stages.
Simulation Model Description
The monitored abundance based on salmon sampling might result in an under-estimate or over-estimate of the true abundance and thus result in incorrect treatment decisions. Early treatment is the result of an overestimation of the true abundance within a sampling interval (1 week), meaning the monitored abundance exceeds the true abundance, and the monitored abundance is higher than the treatment threshold, while the true abundance is not, and treatment occurs early. Early treatments are blue dots in Figure 1A. Timely treatments occur when the monitored abundance and true abundance both exceed the treatment threshold within the sampling interval (i.e., at the first sampling event after the excess) and treatment occurs timely, these are marked by green dots in Figure 1A. Late treatments occur when the monitored abundance is lower than the true abundance, and the true abundance is higher than the treatment threshold but the monitored is not. The sampling interval with the missed treatment is denoted with a X symbol in Figure 1A, while the sampling interval when the late treatment occurred is marked by red dots in Figure 1A. Both early and late treatments constitute “untimely” treatment events. The proportions of such timely or untimely treatments during a production cycle were used to assess the impact of sampling accuracy under varying conditions, such as changes in sample size or variation in the treatment threshold.
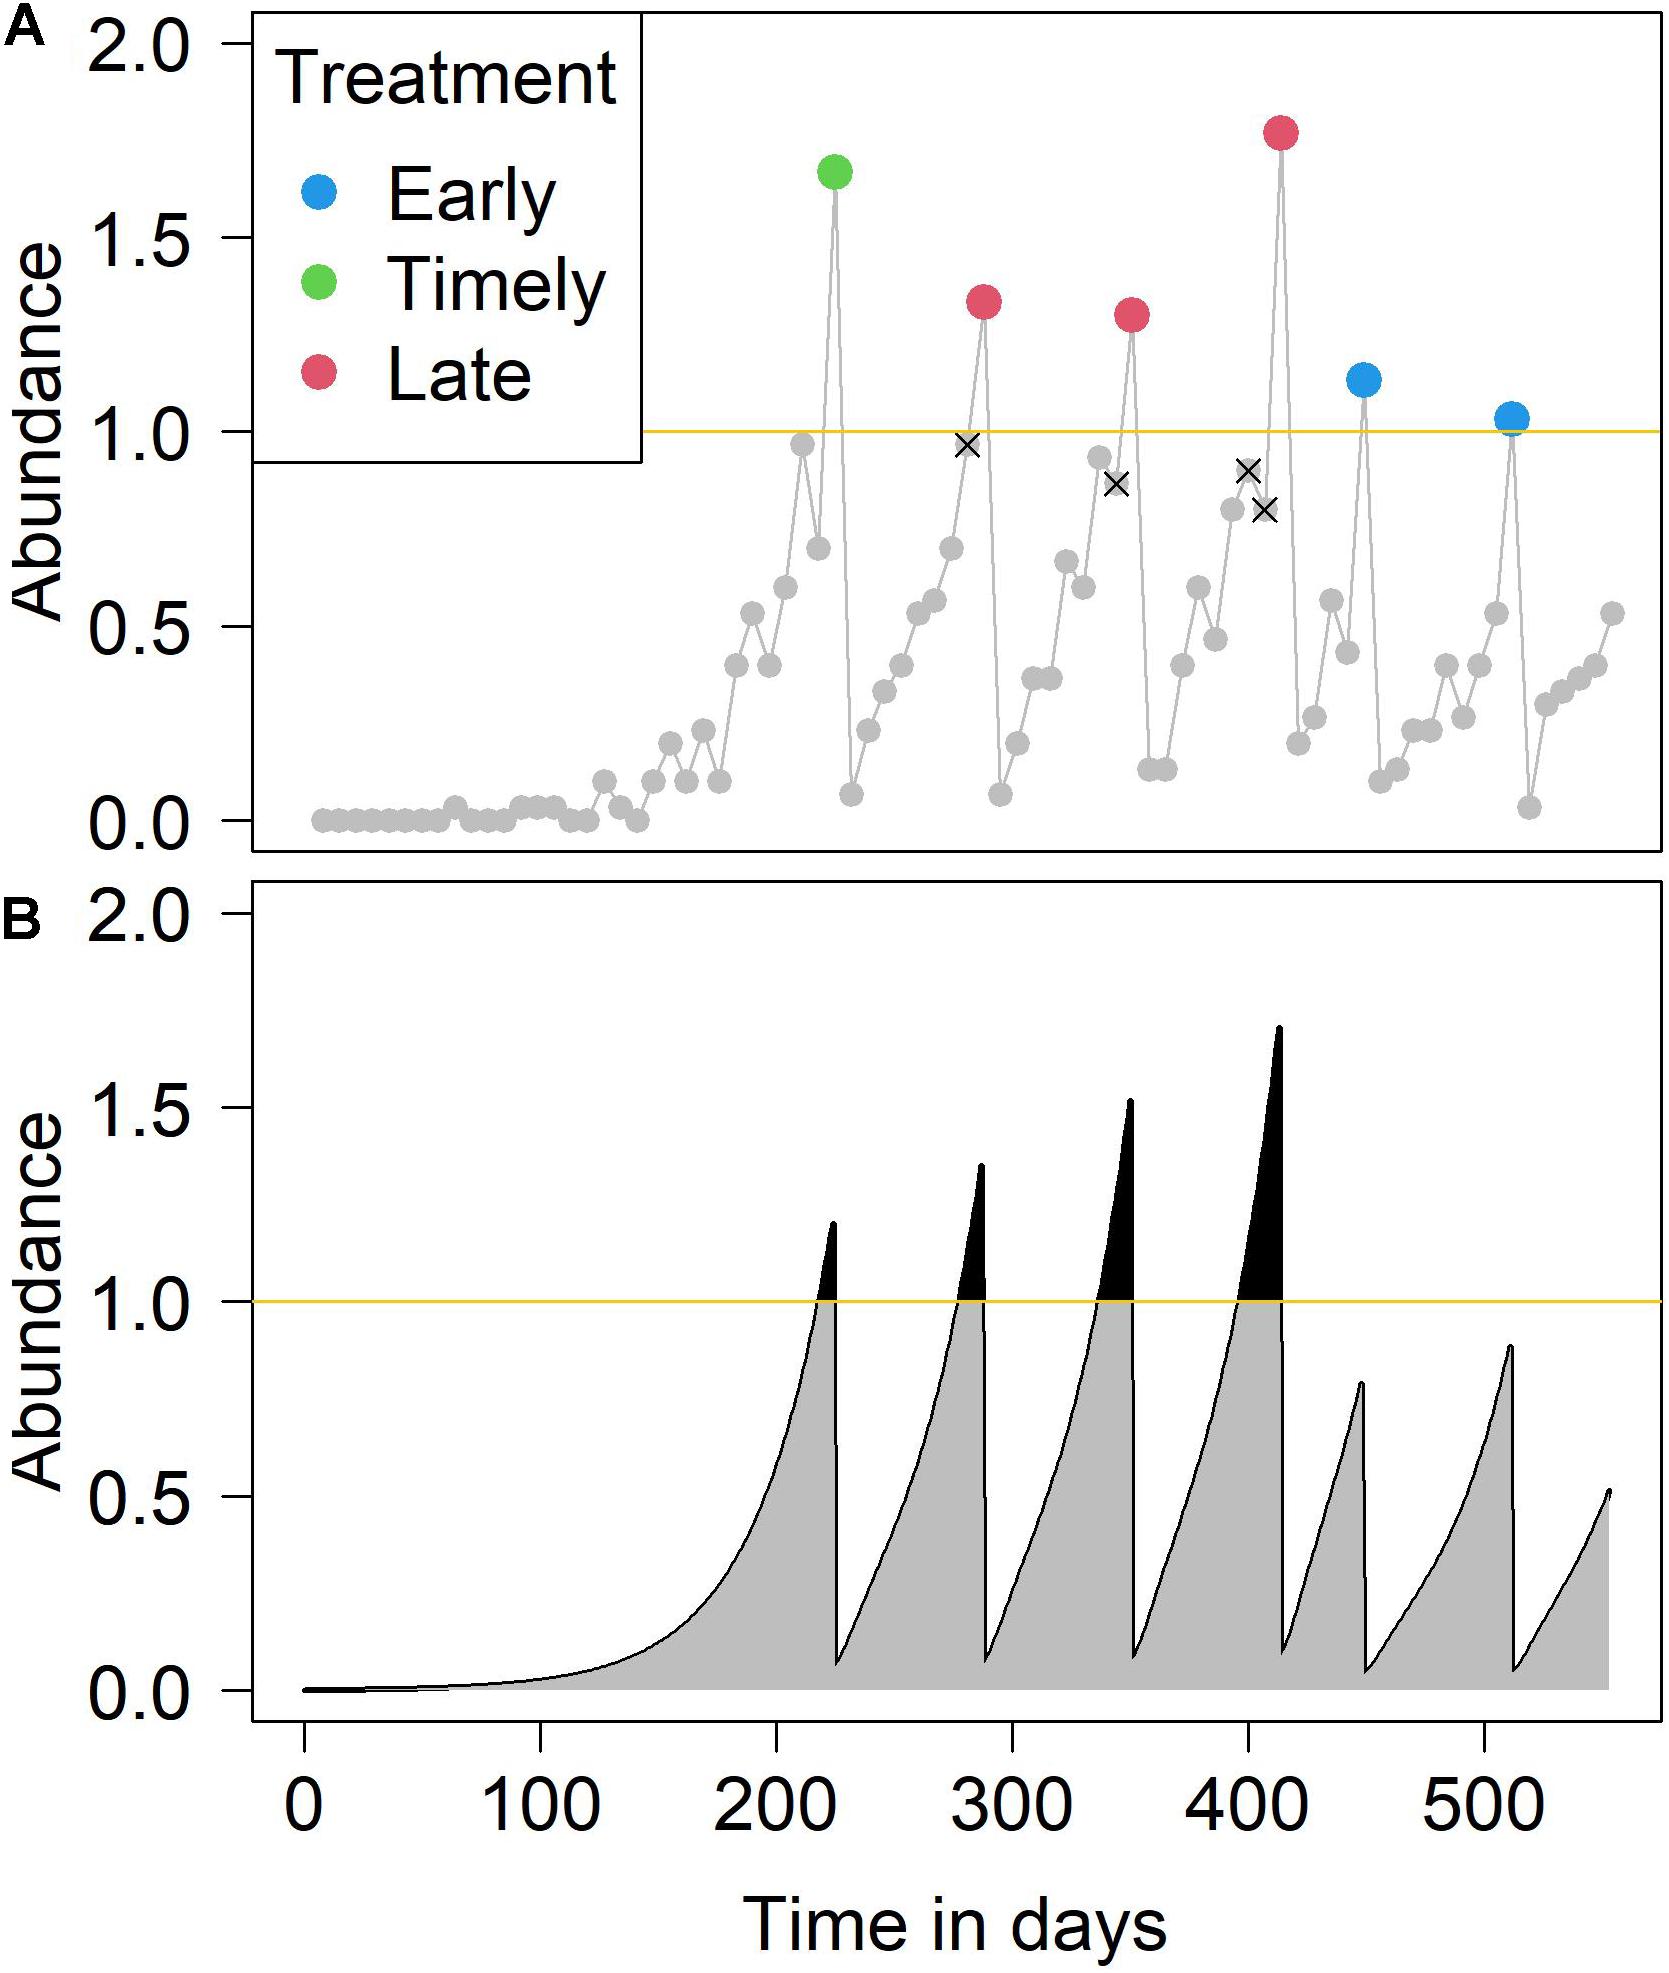
Figure 1. An example simulation of (A) the monitored sea lice abundance and (B) the true sea lice abundance over a production cycle. In panel (A), the points indicate weekly sampling events. Over-estimation of abundance results in an early treatment (blue points), while under-estimation of abundance results in late treatment (red points). Points annotated with an x represent a necessary but unexecuted treatment due to under-estimation. In panel (B), the gray areas plus the black areas represent IB (infestation burden), while the black areas represent IB over threshold. In this example simulation, the number of fish per sampling event was 30 and the treatment threshold was one (yellow line) adult female sea louse.
To assess the impact of incorrectly timed treatments on salmon lice control, we used the concept of “Infestation Burden” (IB). This was defined as the sum of weekly adult female salmon lice during a single production cycle (Robbins et al., 2010), a calculation equivalent to summing the area under the line of true abundance (gray and black areas in Figure 1B). We also used the concept of “IB over threshold” to sum the IB only during periods when the mean abundance was above the treatment threshold (black areas in Figure 1B). The impact of different sample sizes and treatment thresholds on the accuracy of abundance estimation was investigated. The relative impact of the two factors on salmon lice accuracy estimation and subsequent treatment interventions were also explored. In addition, we simulated a variety of sampling intervals. For a given total sample size over a production cycle, we investigated how best to distribute the sampling interval and sample size per event to obtain the most effective sampling accuracy. The investigation was conducted in terms of the median and variance of the absolute differences between treatment threshold and monitored abundance at the time of treatment. In other words, this method estimated how close the true abundance was to the treatment threshold, at the points at which treatments were applied over the production cycle.
Results
Proportions of Each Type of Treatment
As might be expected, the proportion of timely treatments increases as larger samples are taken and also as the treatment threshold becomes higher (Figure 2). However, this increasing proportion of timely treatments is largely due to a reduction in the proportion of early treatments, with increased sample size having minimal effect on the proportion of late treatments, due primarily to the over-estimation of abundance that occurs in the sampling process. Figure 3 indicates this systematic over-estimation, with smaller sample sizes and lower treatment thresholds causing the monitored abundance to progressively over-estimate the true abundance. As the variance of the monitored abundance values narrowed due to increased sample size, the proportion of early and late treatments became more similar, particularly at higher levels of treatment threshold. It was also clear that for the case of lower treatment threshold values, a massively larger sample size was required to generate an equivalent proportion of timely treatment (Figure 2). For example, a sample size of 10–20 fish at a treatment threshold of 3, generated a similar or higher proportion of timely treatments than could be achieved by using even the largest simulated sample size (N = 100) given a treatment threshold of 0.2 adult female salmon lice.
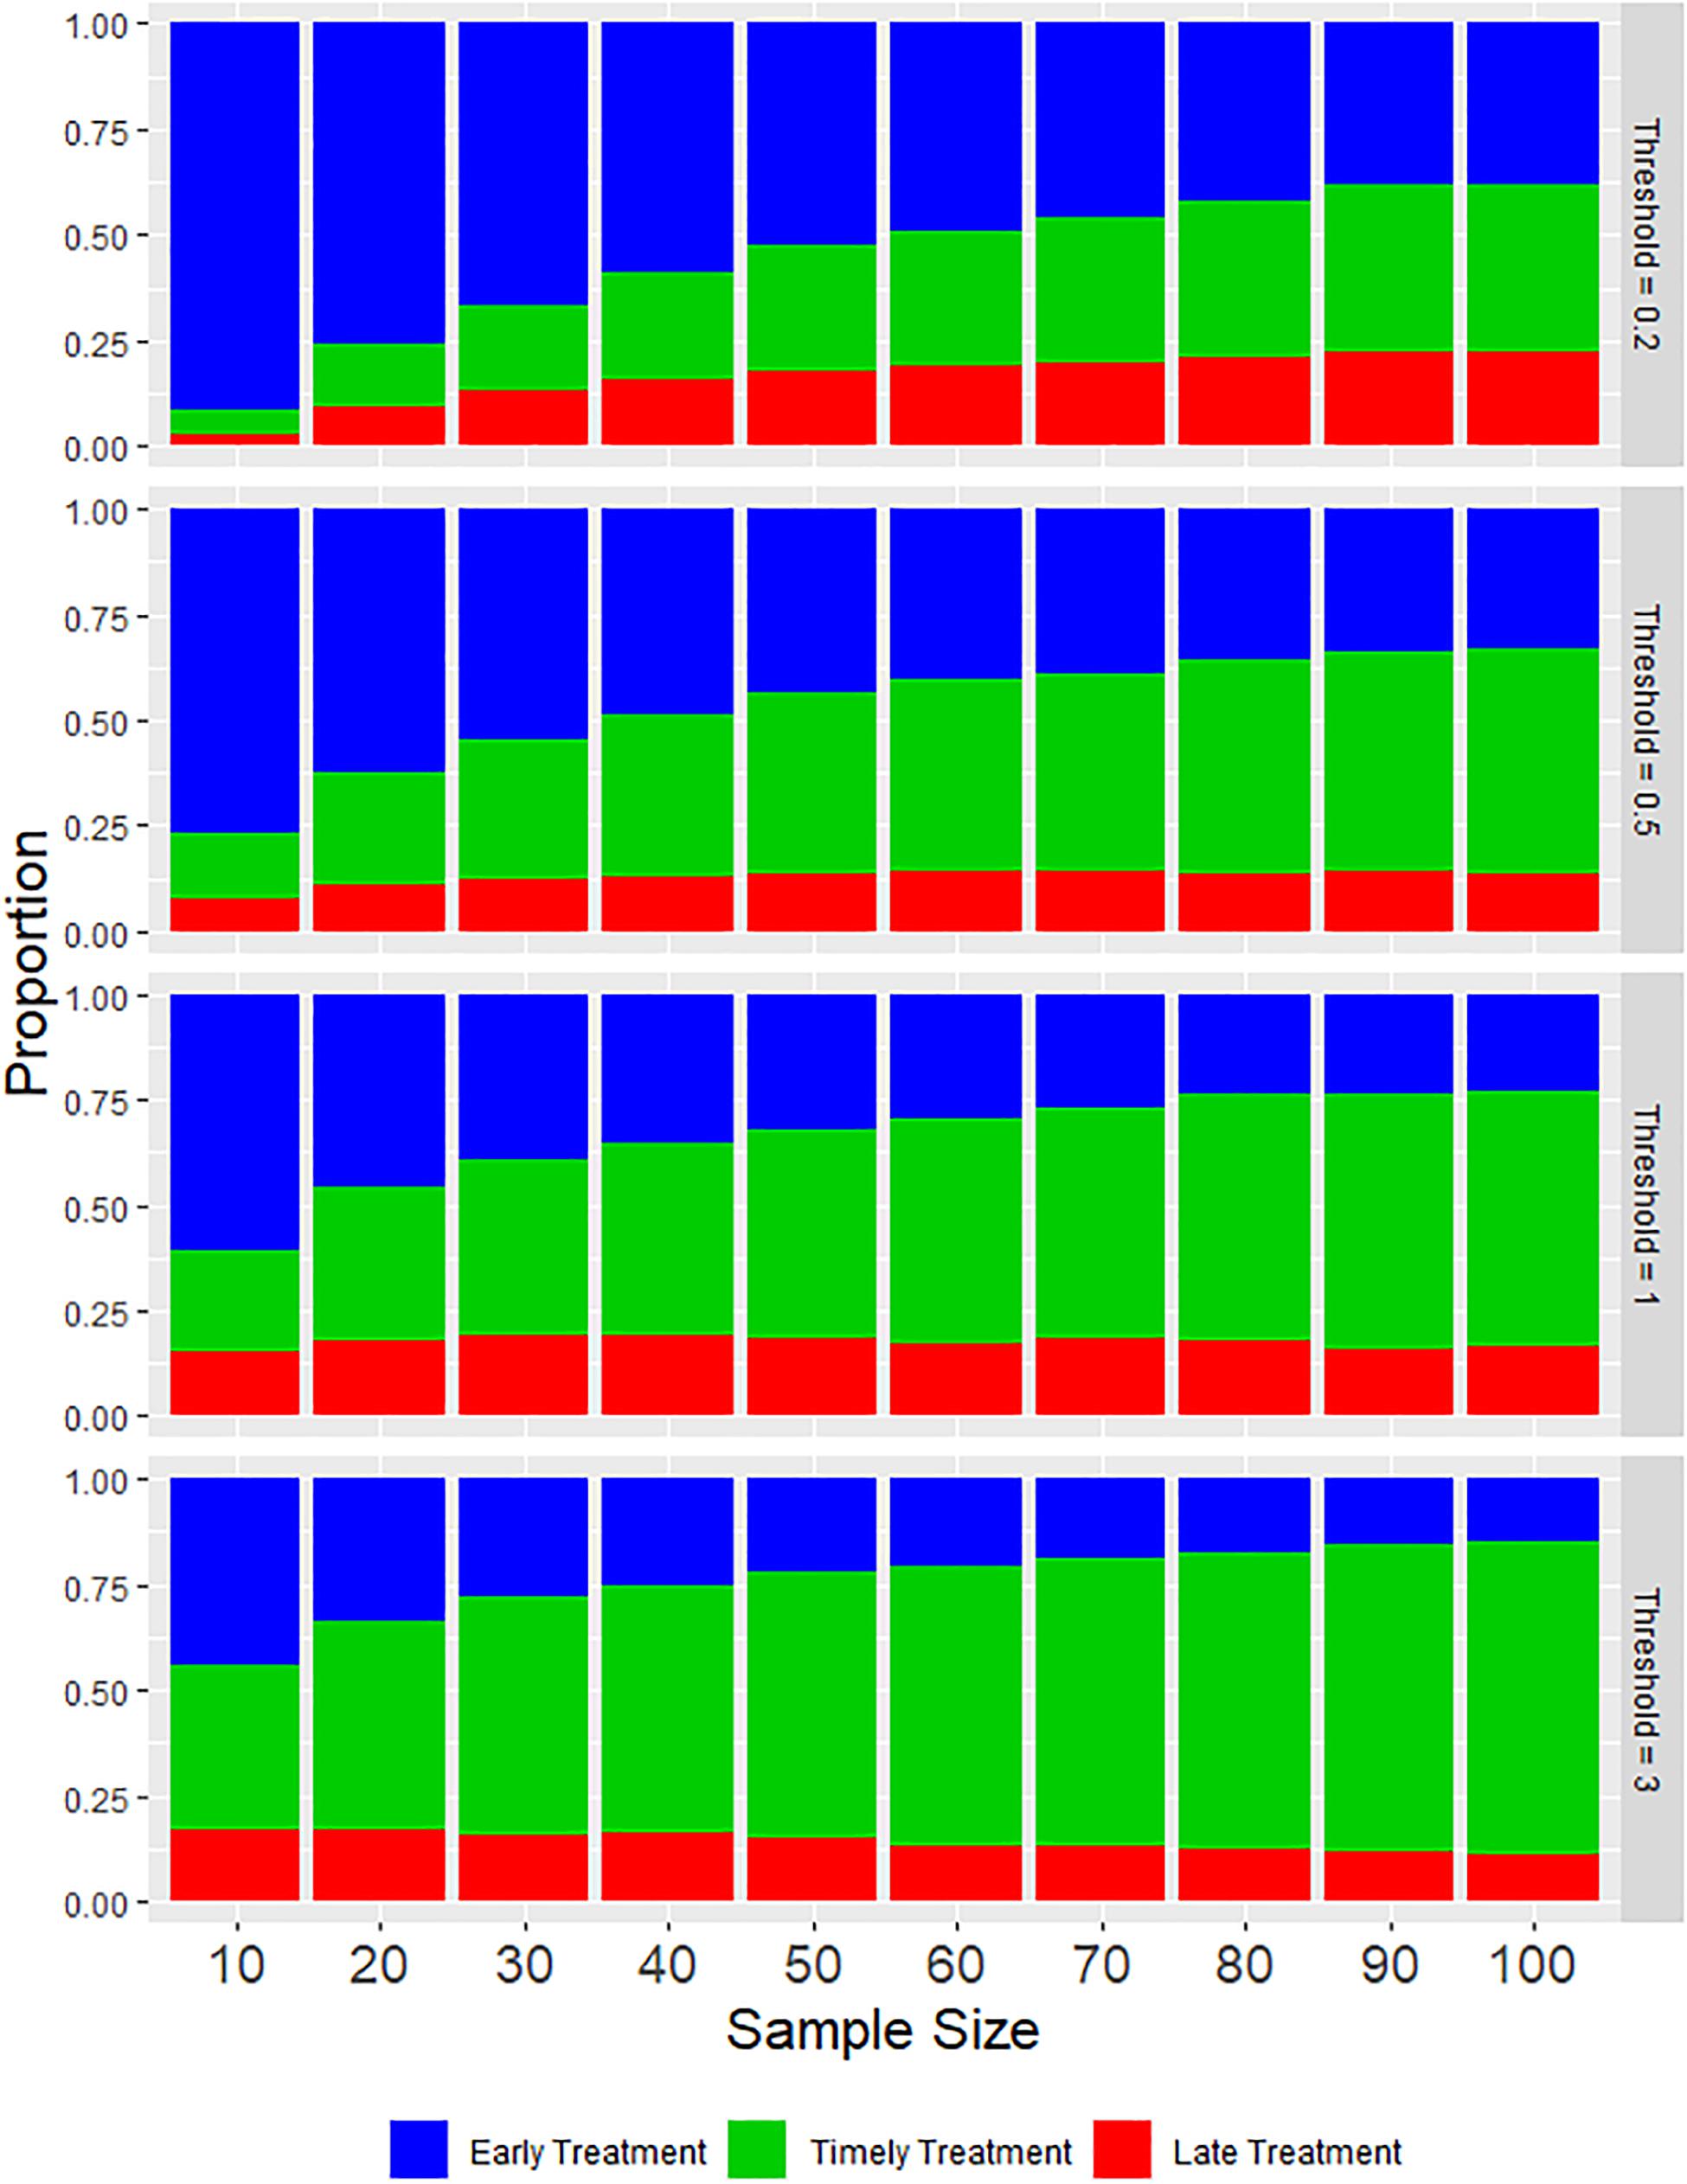
Figure 2. Stacked bar charts illustrating the average proportions of each type of treatment during a production cycle based on various values of sample size and treatment threshold.
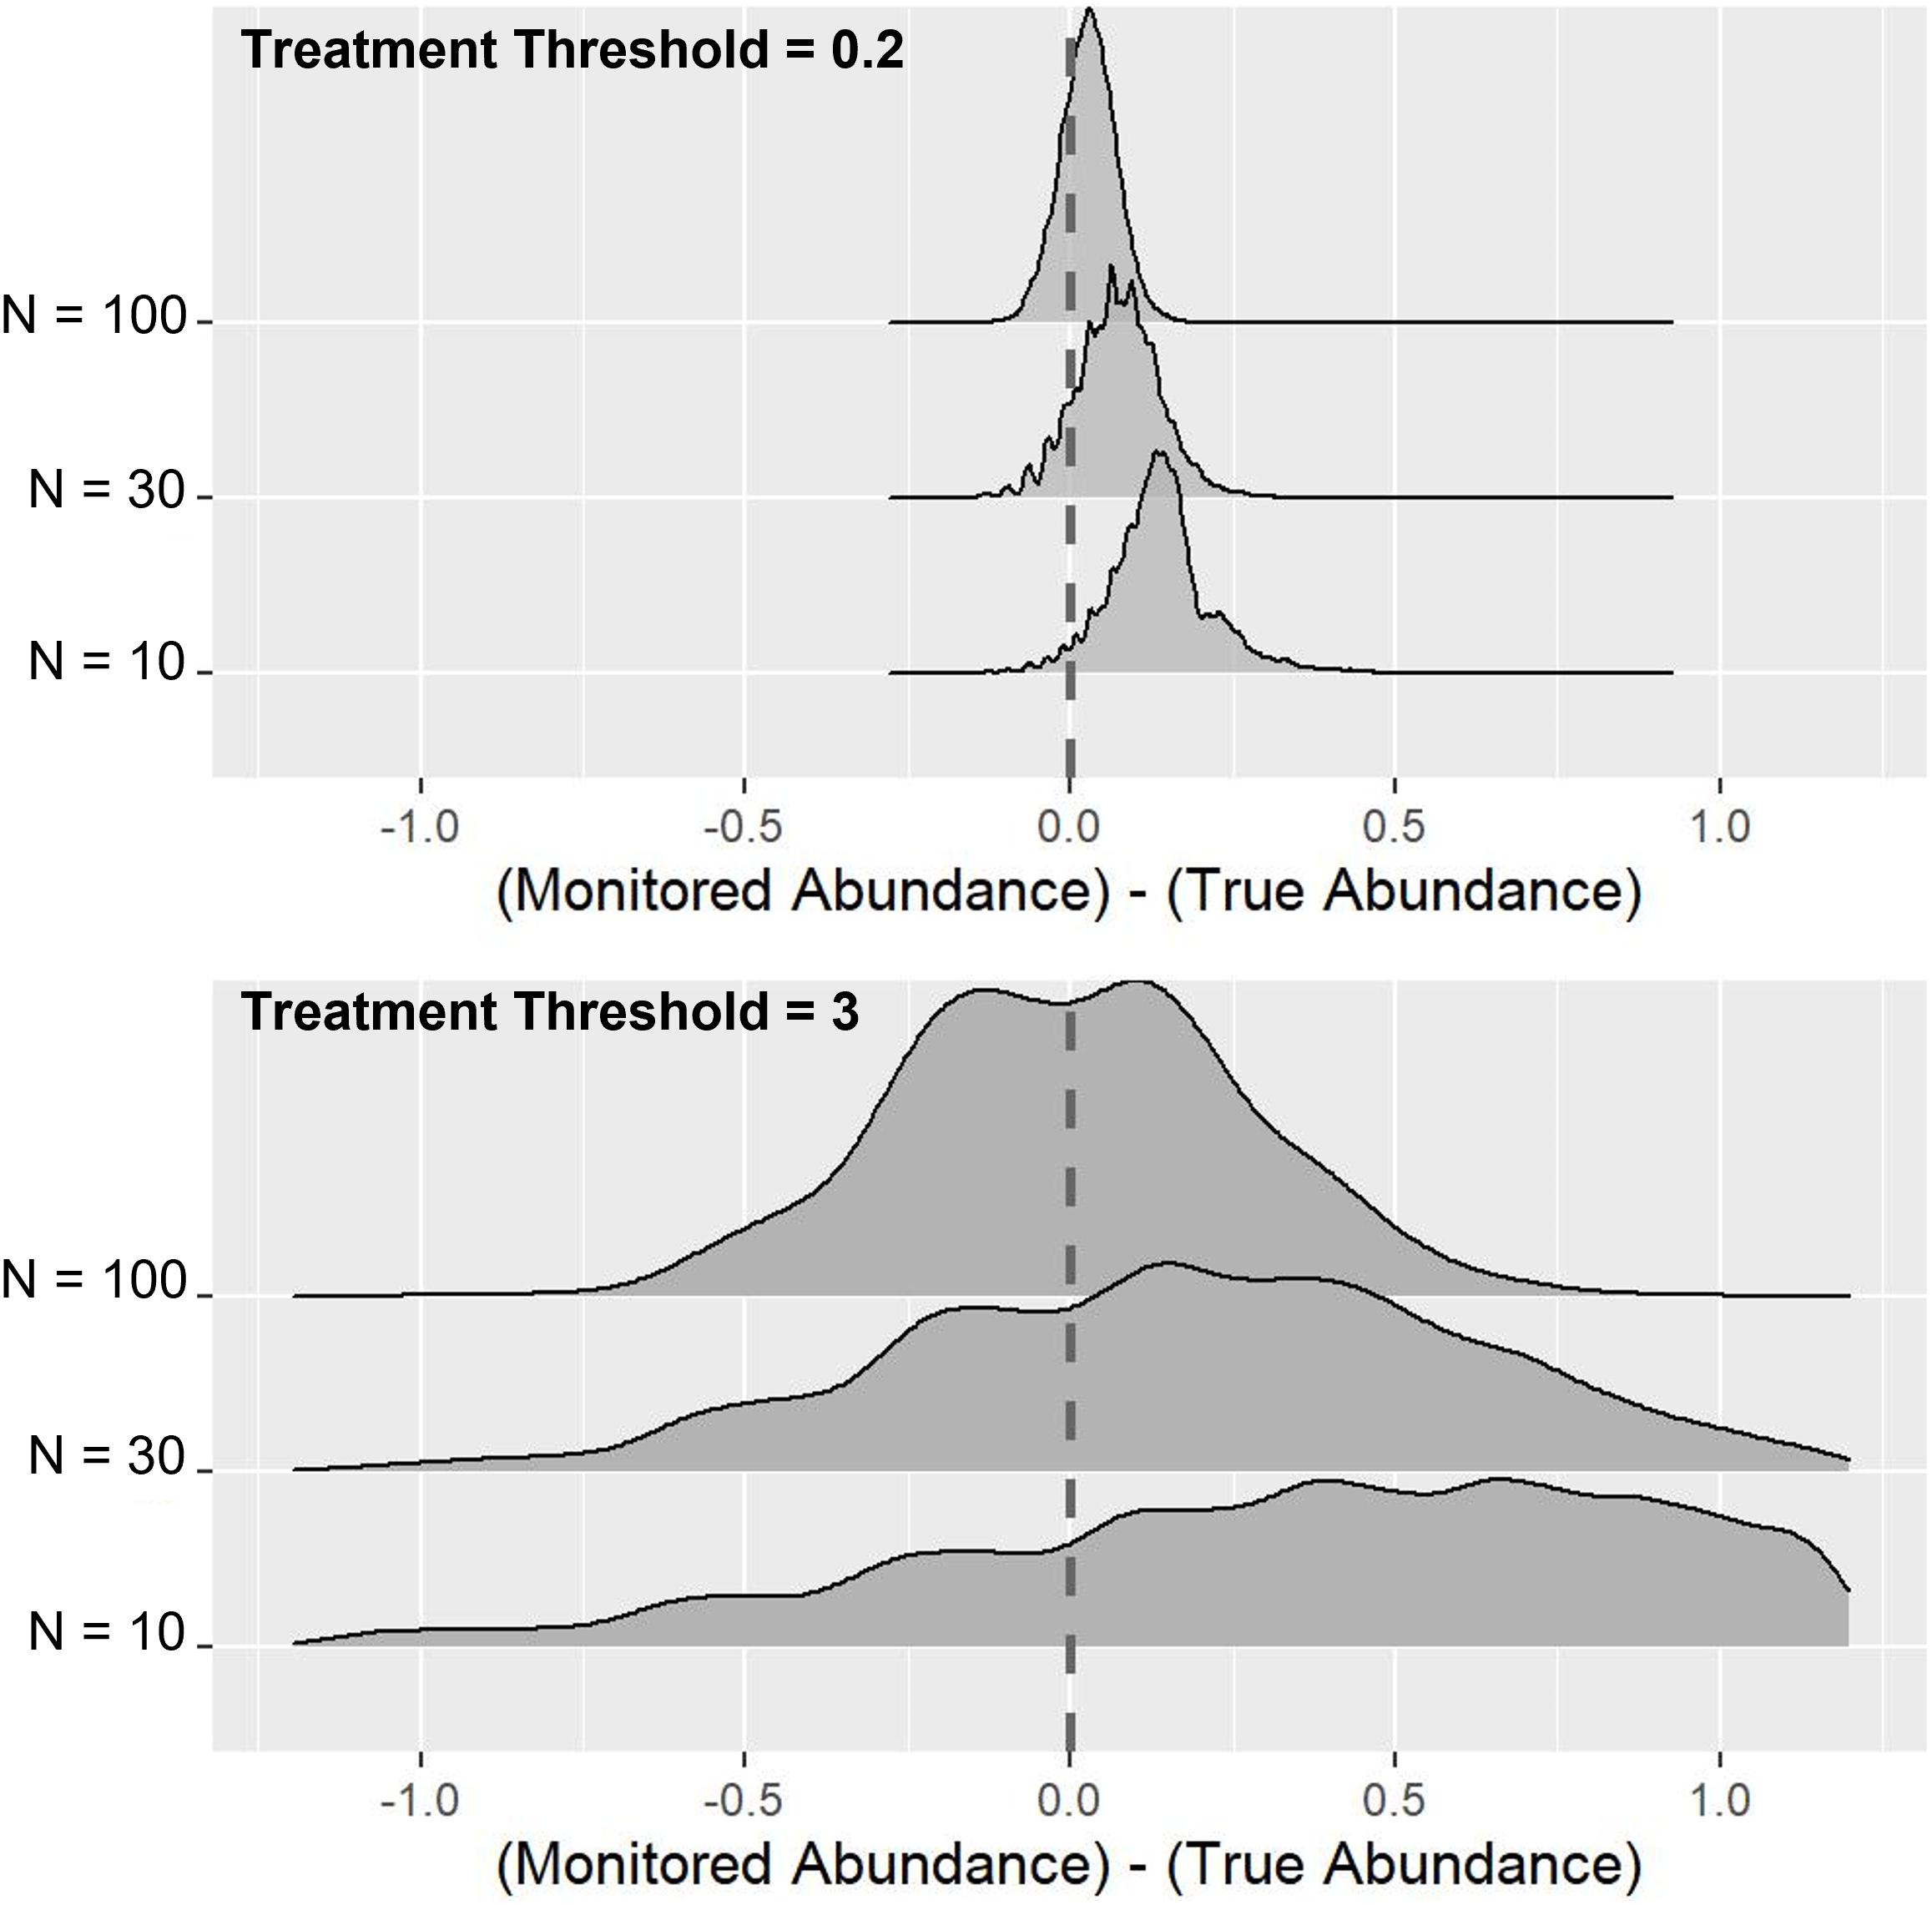
Figure 3. Effects of sample size and treatment threshold on the difference between true abundance and monitored abundance. N represents the sample size, and the vertical dashed lines indicate the point where monitored abundance and true abundance were equal.
Impact of Imperfect Estimation
The impact of sample size and estimated accuracy on the overall frequency of treatments within a production cycle appeared to be rather modest (Figure 4A). At the lower treatment thresholds of 0.2 and 0.5, initial increases in sample size (from say 10 up to 40) did result in a slight decrease in overall treatment frequency. As such the frequency of untimely treatments (Figure 2) was found to generate minimal variation in the total number of treatments over a full cycle.
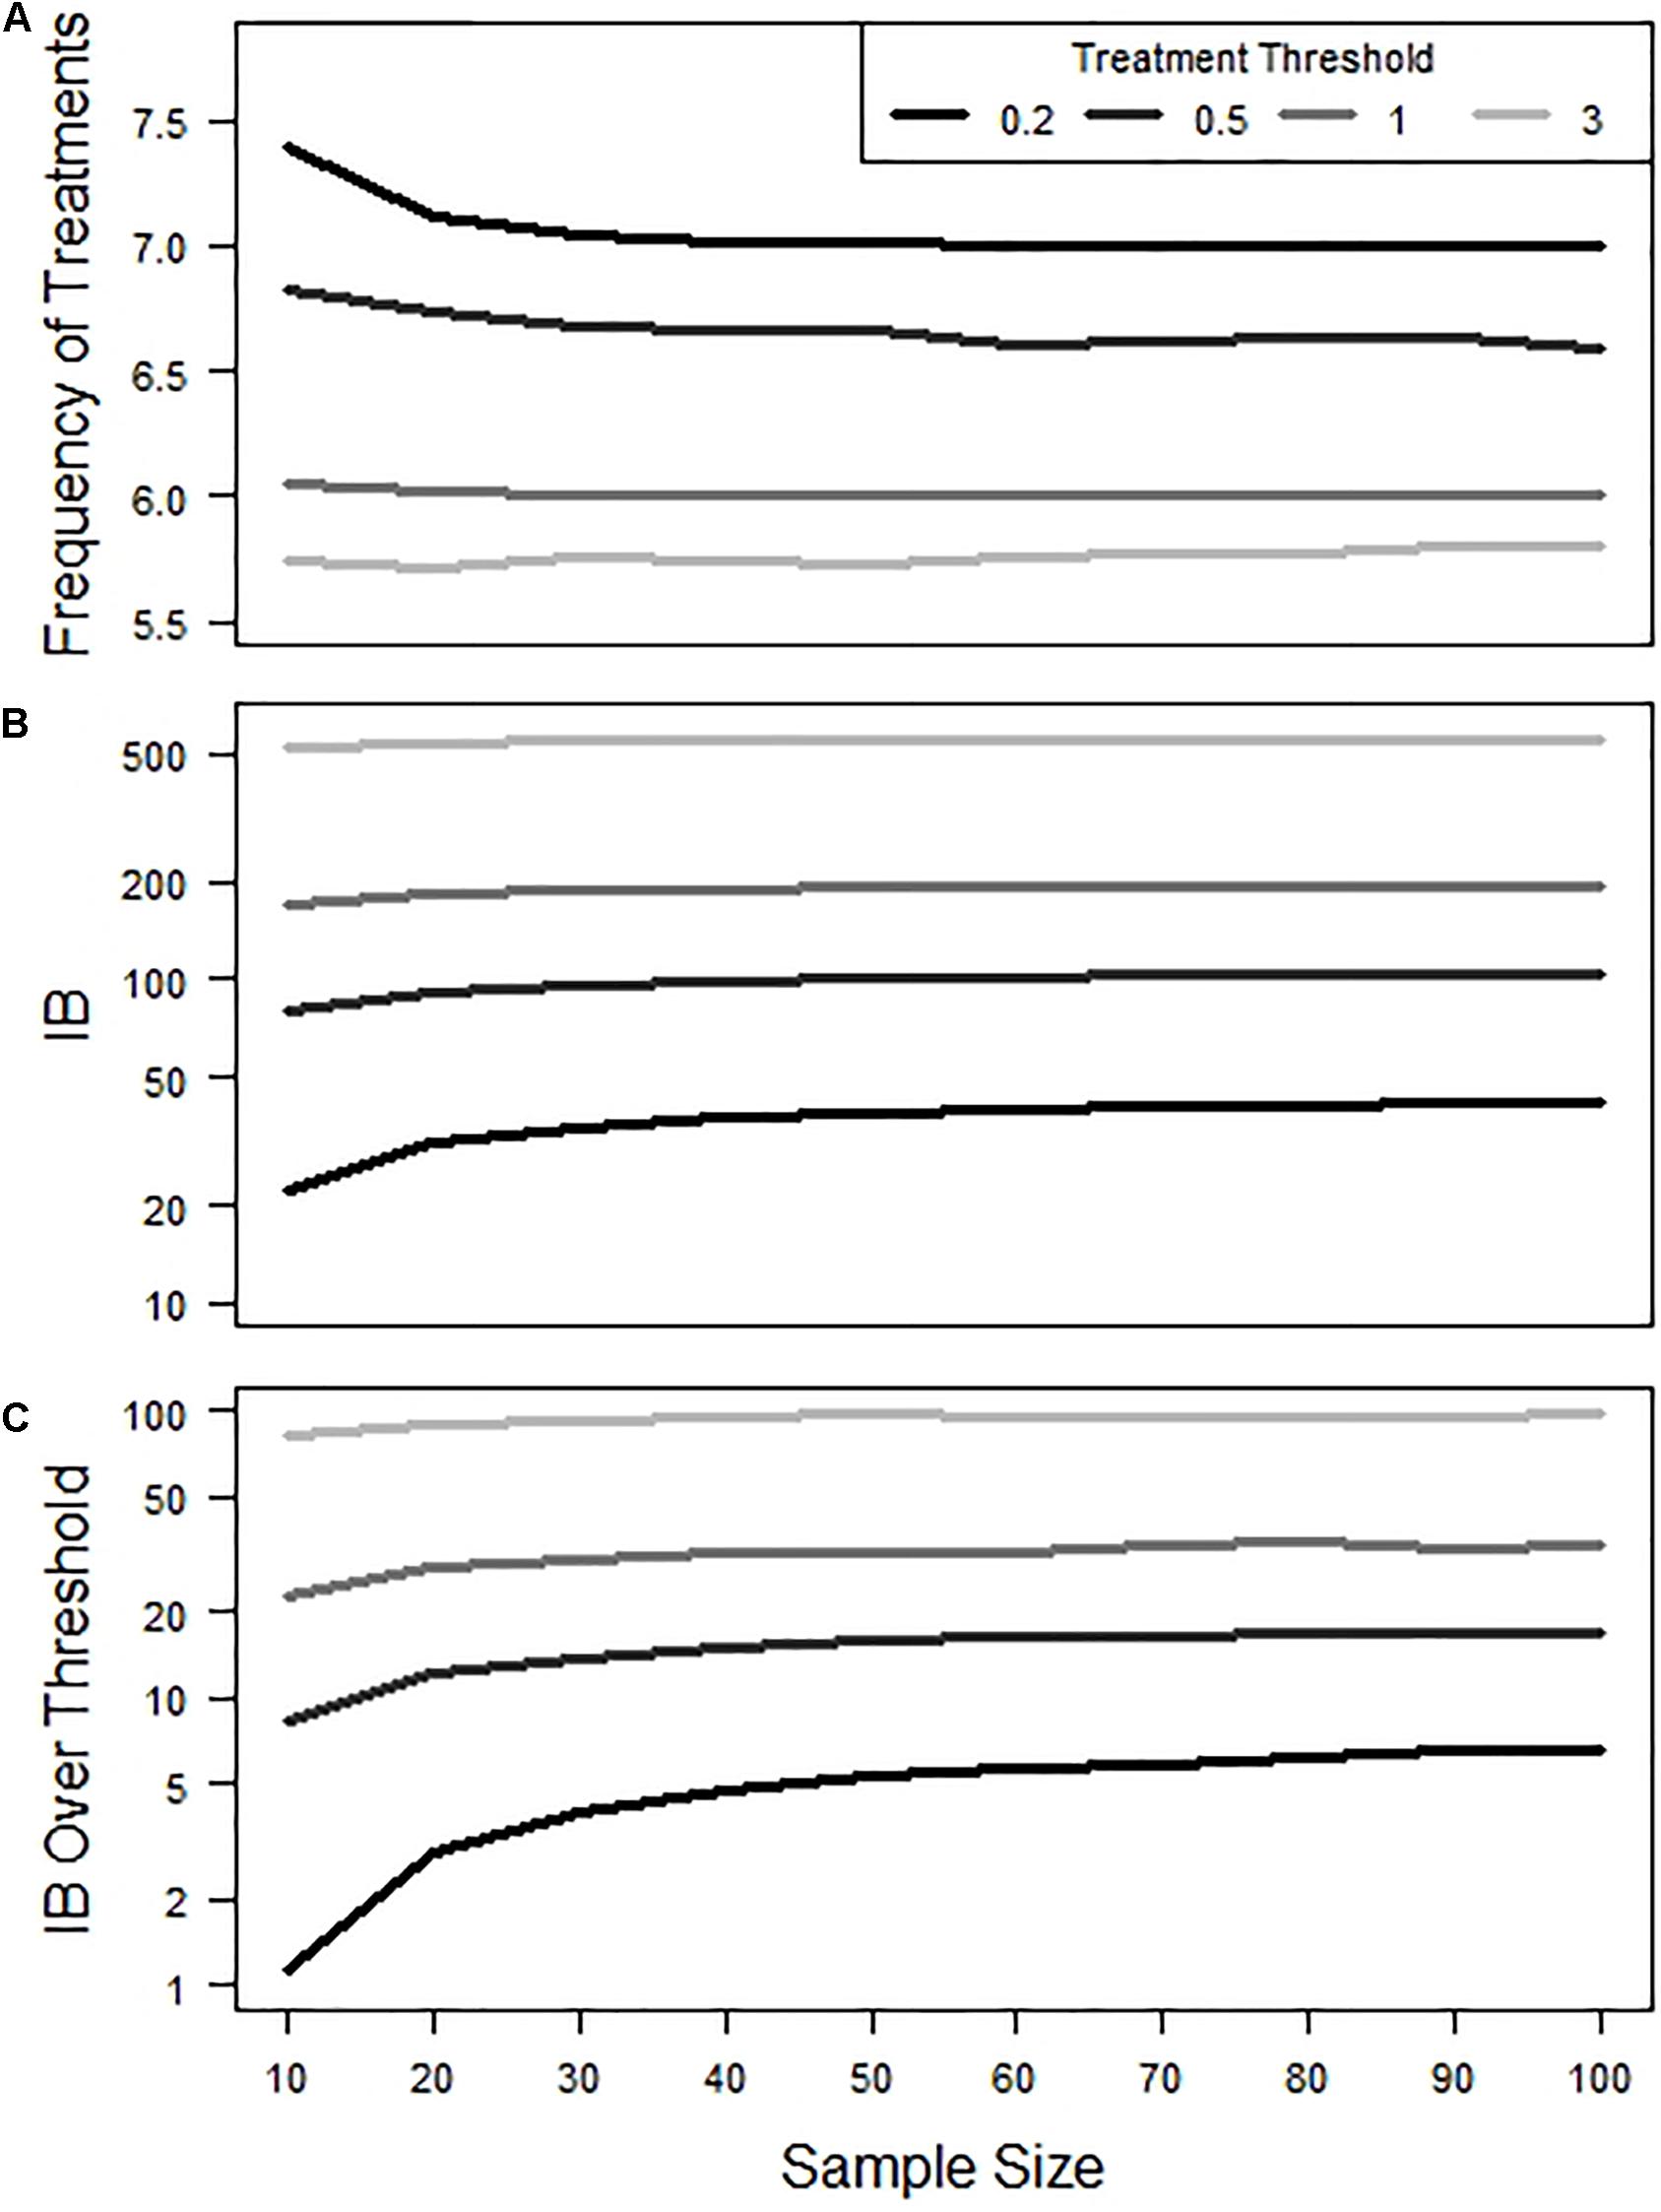
Figure 4. Effect of sample size and treatment threshold on (A) frequency of total treatments, (B) Infestation Burden (IB), and (C) IB over Threshold during a production cycle. Y-axis in panels (B,C) are shown on a log scale.
In contrast, both IB and IB over threshold were observed to show some sensitivity to changes in sample size, particularly at lower treatment threshold values (Figures 4B,C). In terms of IB, the impact of early treatments was to reduce IB, while late treatments led to increased IB (Figure 5A). Consequently, when the frequency of early and late treatments was similar over a production cycle, their final IB was approximately equivalent to the value of IB in simulations that contained no untimely treatments. In terms of IB over the threshold, the impact of late treatment was found to be more influential than the impact of early treatment (Figure 5B). Thus, a similar number of early and late treatments would result in a larger value for IB over the threshold than in simulations with no untimely executed treatments.
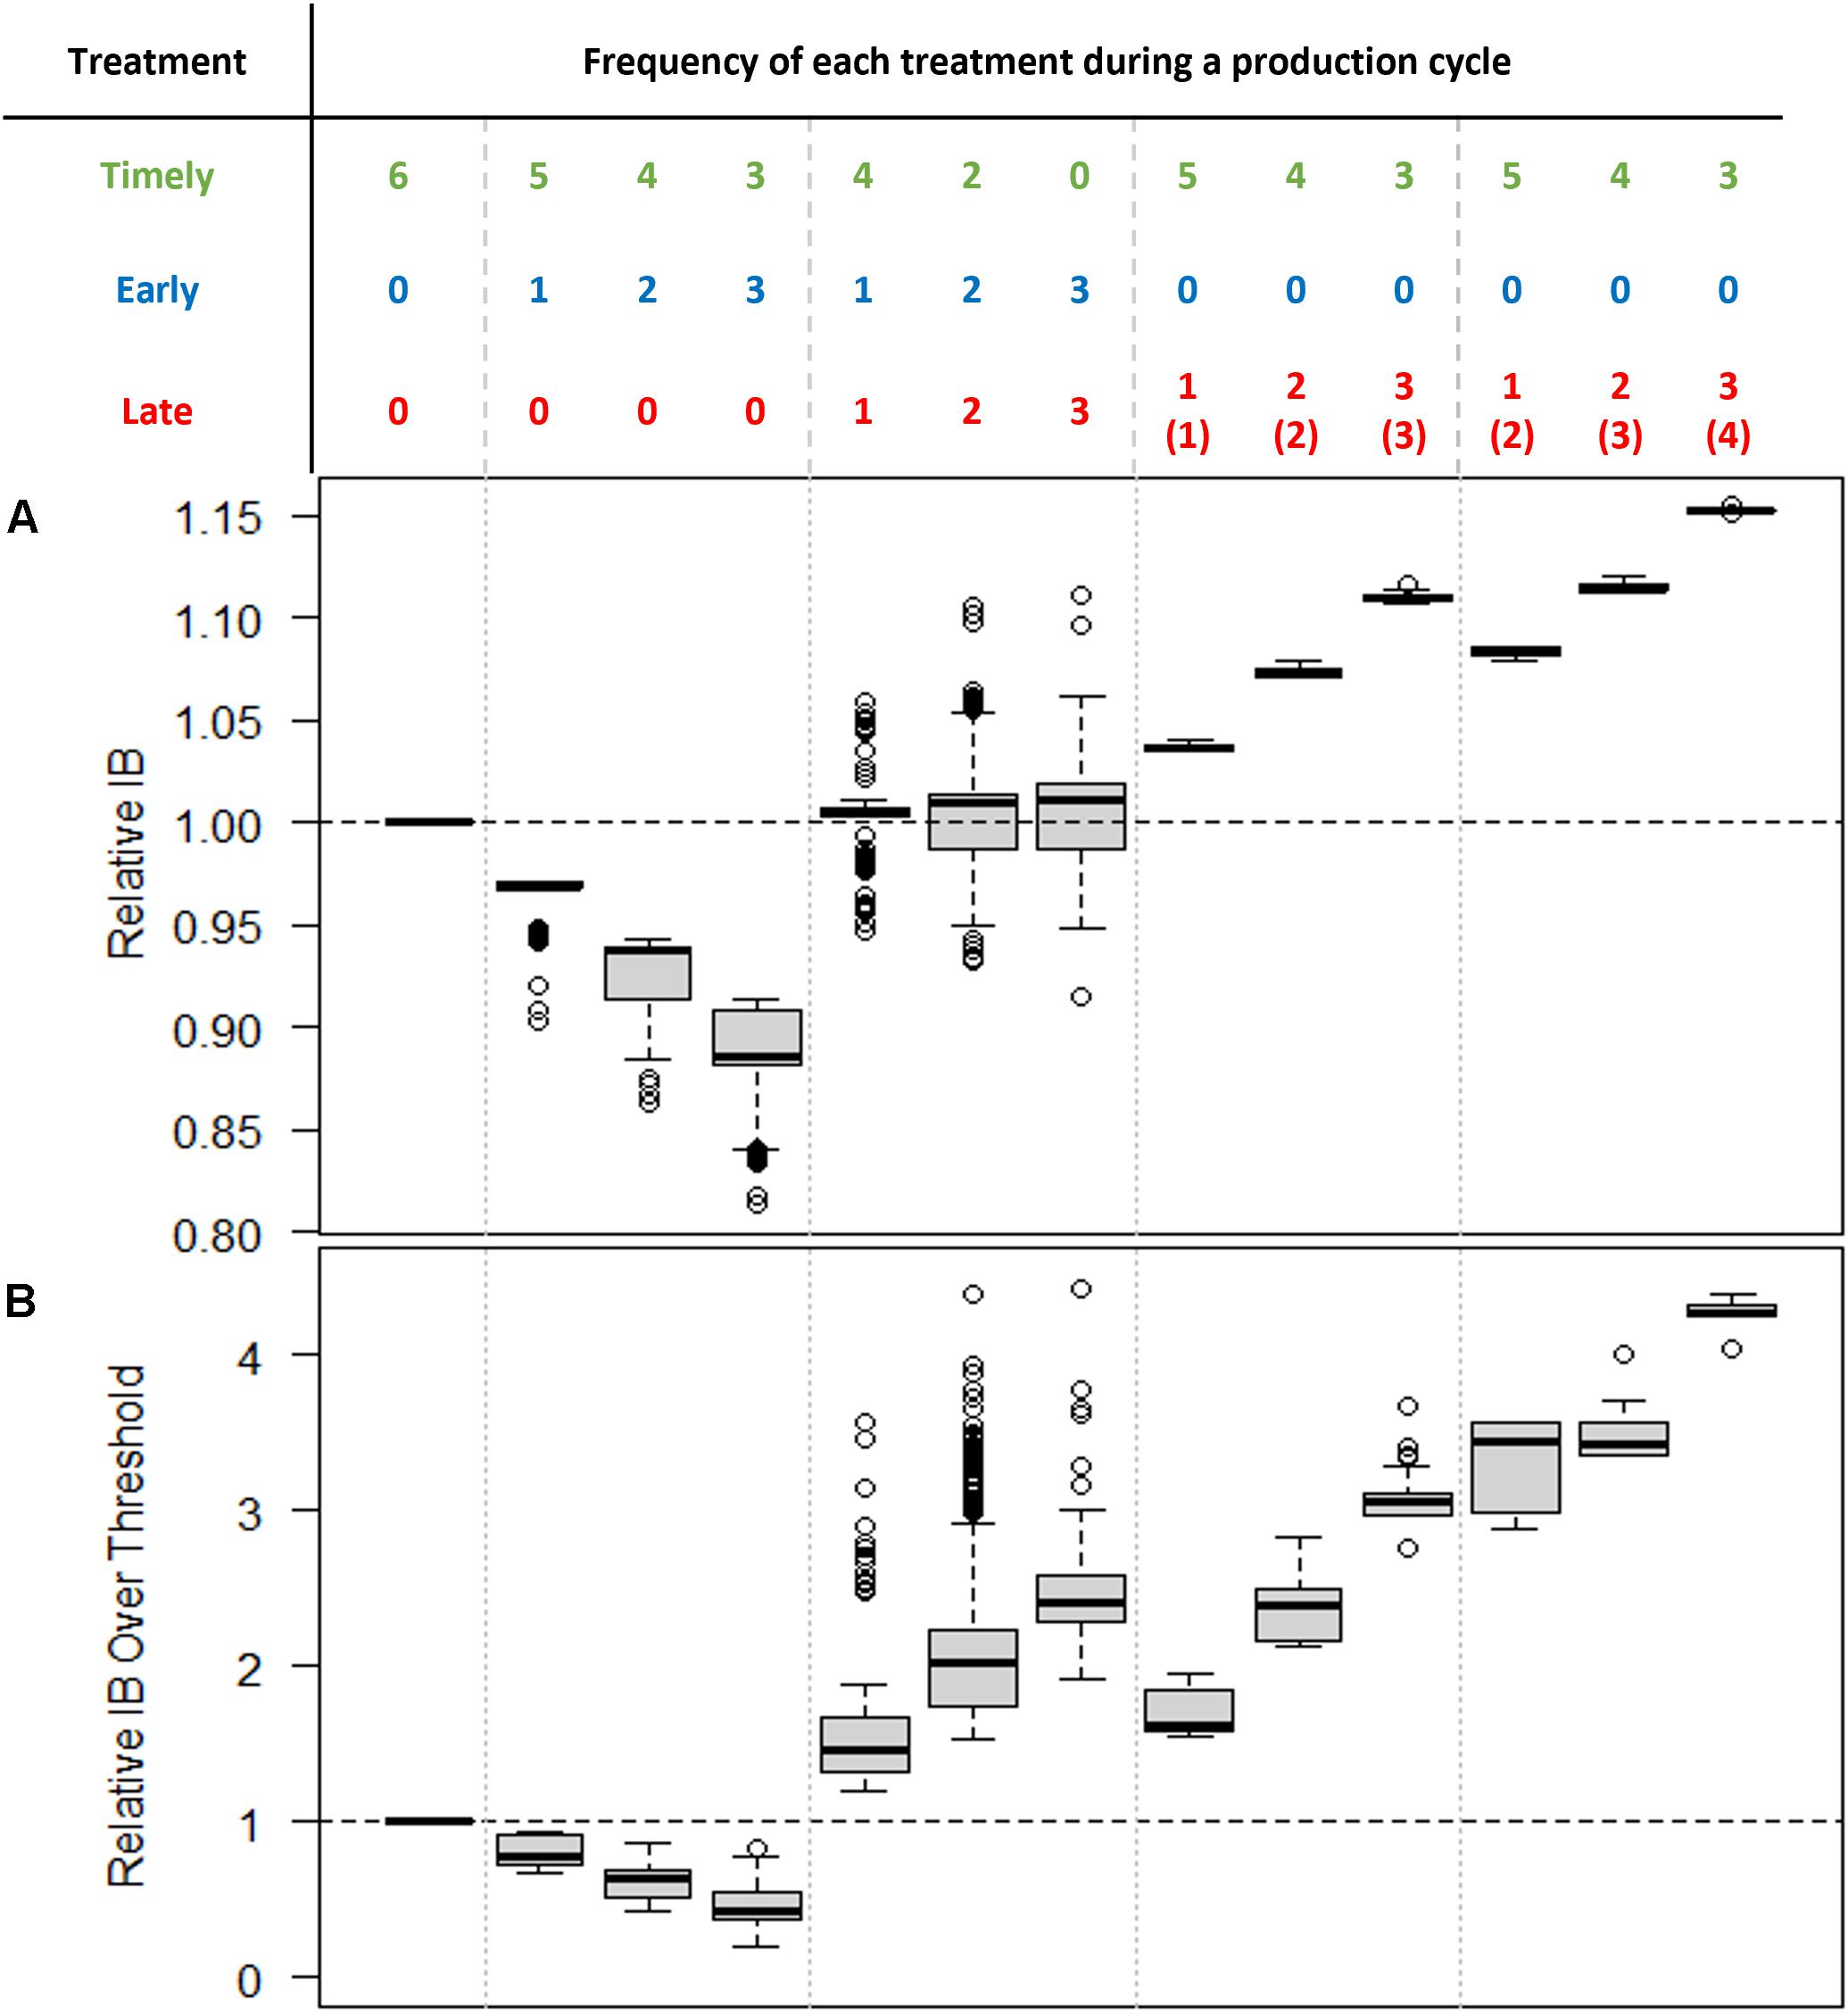
Figure 5. Relative (A) Infestation Burden (IB) and (B) Infestation Burden over the threshold. In all cases, the treatment threshold is one and the sample size is 30. The relative values were calculated by dividing the actual values of IB by the value of IB where only timely treatments occurred (i.e., the “ideal” situation, shown in the leftmost column). The numbers in brackets in the rightmost three columns indicate the number of treatments required but missed before the late treatment. Note that even production cycles with the same number of late treatments can produce significantly different IB values depending on the overall frequency of missed treatments.
As was illustrated in Figure 1 (the fourth treatment at around Day 410), more than one necessary treatment could be missed before a “late” treatment was administered. It was found that the frequency of missed treatments before this late treatment affected the IB significantly. The six boxplots to the right of Figure 5 show the simulated results for the cycles that had late treatments but no early treatments. For example, the cycle with one late and two missed treatments indicated two sampling points that failed to bring about treatment (i.e., gave an estimated abundance below the threshold) before a late treatment was applied (such as in the fourth treatment illustrated in Figure 1). Alternatively, the cycle with two late and two missed treatments would indicate one missed treatment before each of two late treatments (as would be the case where only the second and third treatments shown in Figure 1 had occurred). Two successively missed treatments resulted in a greater increase in both IB and IB over threshold values than in the case of two temporally separated missed treatments. This finding emphasizes that how late a “late treatment” is, is more important than how frequently “late treatments” occur.
Sampling Interval
Intuitively, the shorter the sampling interval would result in more accurate salmon lice treatment decisions, but our modeling results showed that it was not the case. Compared to a typical length of sampling interval (Figure 6B), too short a sampling interval increased the probability of incorrectly estimating a monitored abundance that exceeded the treatment threshold. Thus, even though the true abundance was still below the treatment threshold, a treatment was likely to be applied, increasing the number of early treatments (Figure 6A). In contrast, a longer sampling interval could result in a higher probability of officially designated “timely” treatments, which were in practice not correctly timed (Figure 6C). These treatments occur after the true abundance has exceeded the treatment threshold and will tend to result in higher overall IB than would be desired.
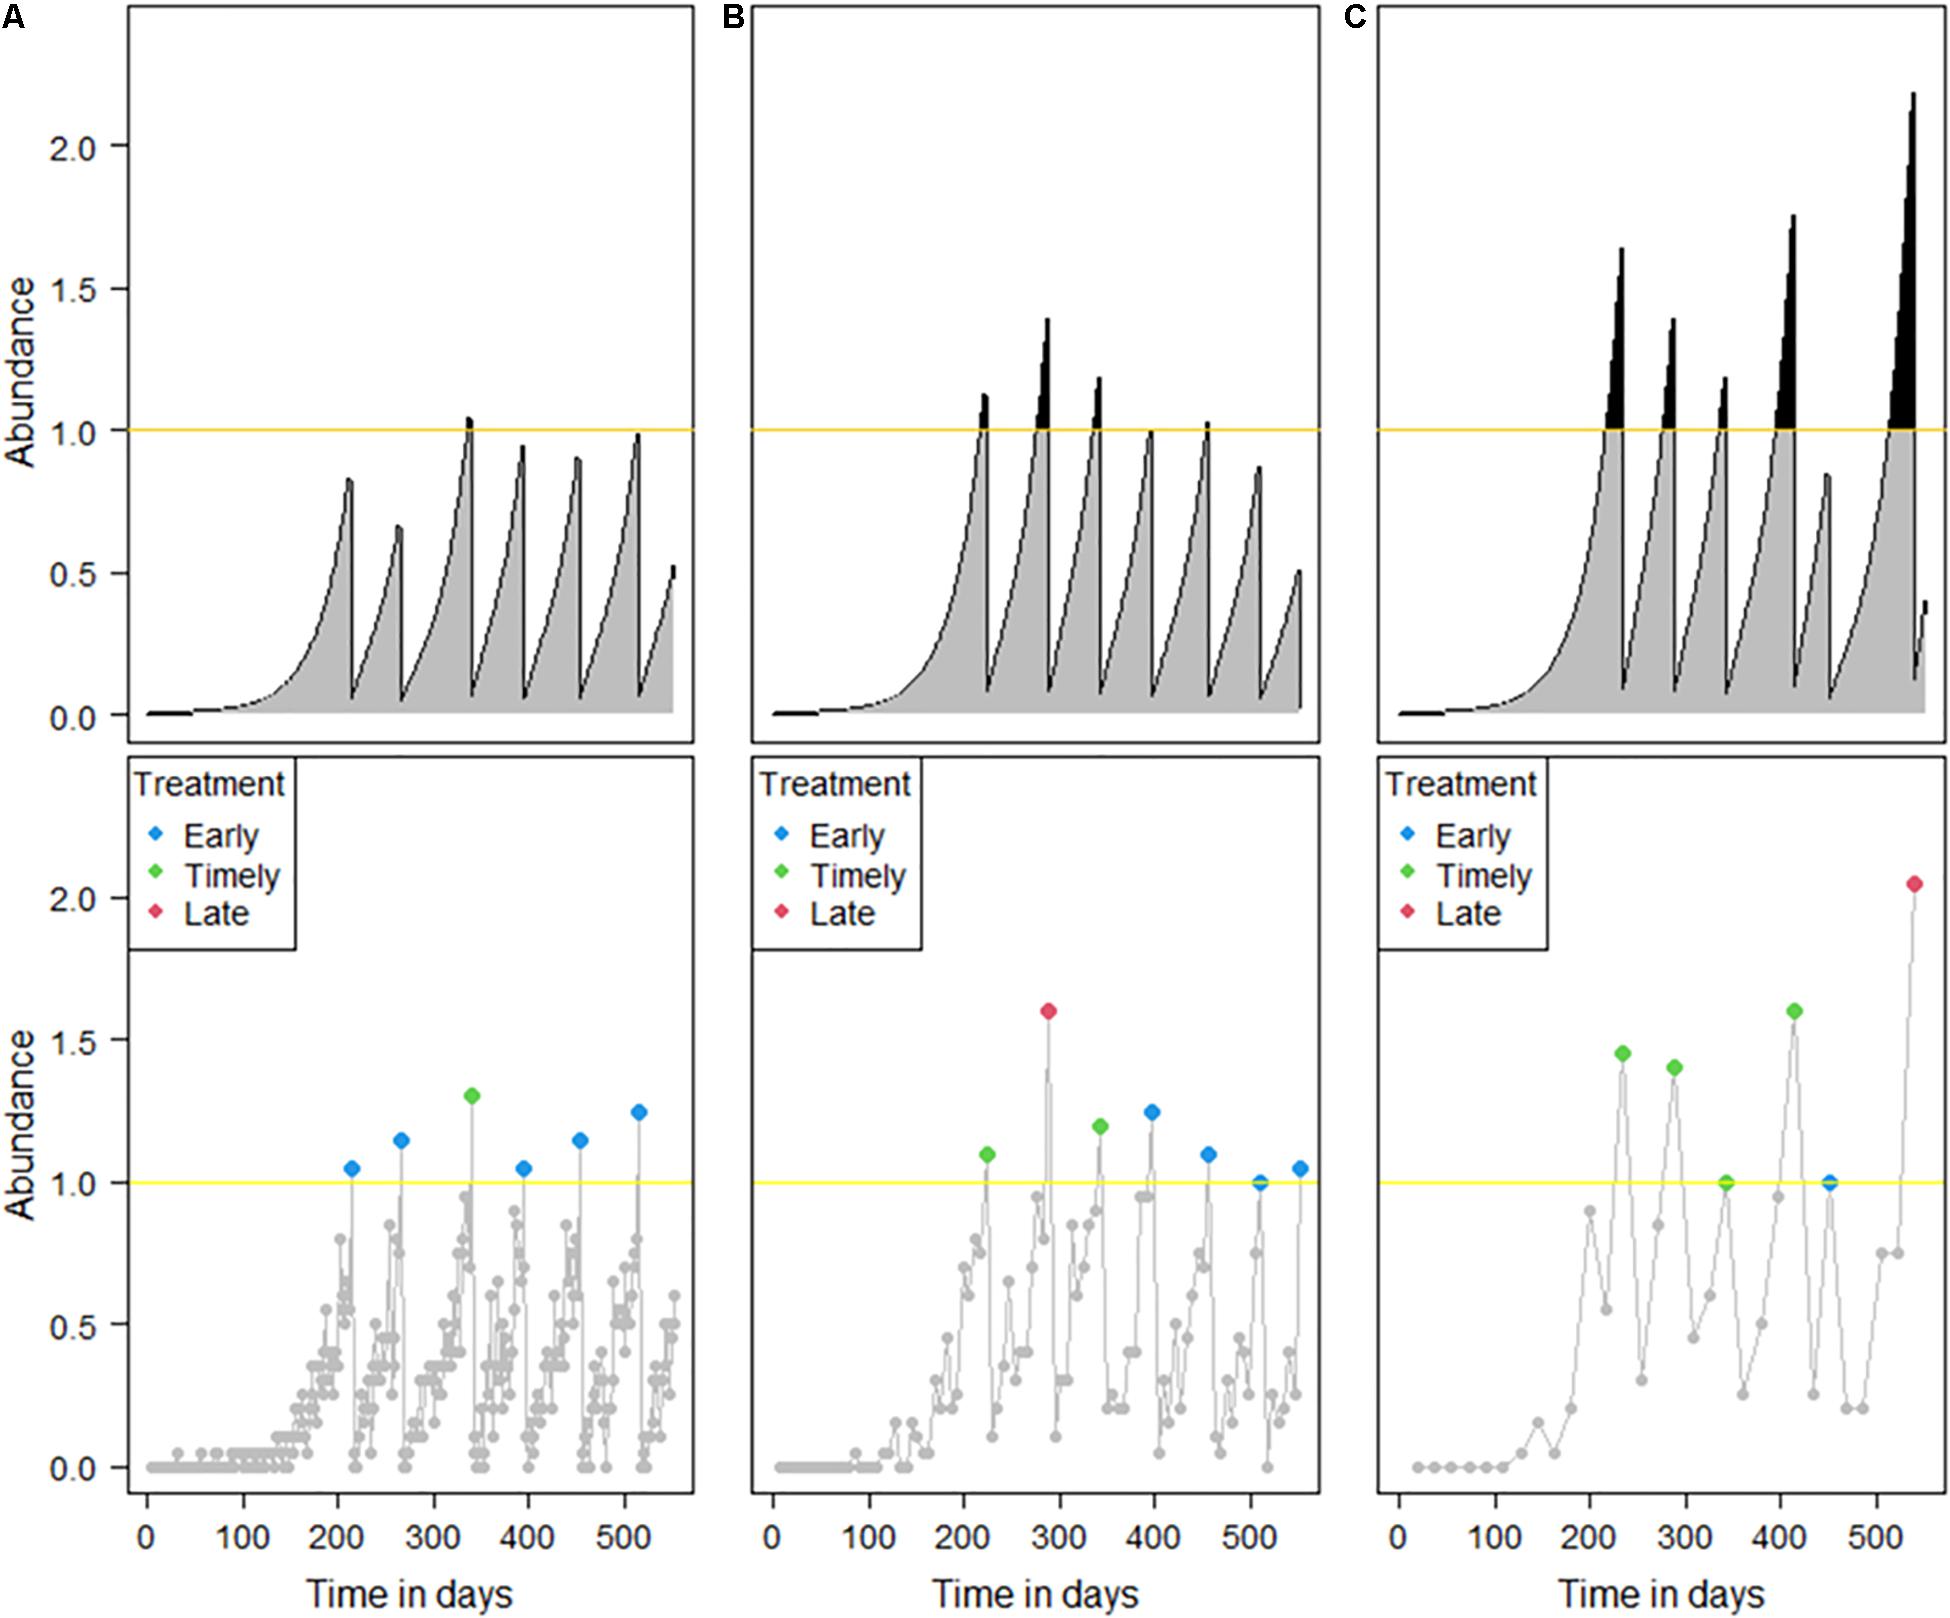
Figure 6. Example simulations that show the effect of the different sampling intervals. The framework is the same as that in Figure 1. Sampling intervals of (A) 2, (B) 6, and (C) 18 days were simulated with a sample size of 20.
When the difference between the treatment threshold and the salmon lice abundance at the time of treatments was set as a metric to indicate the efficiency of salmon lice treatment on salmon farms, the efficiency deteriorated as the sampling interval diverged from an “ideal” spacing (Figure 7). Exploring how sampling interval might interact with sample size in determining the accuracy of the abundance estimation, the ideal sampling interval decreased with increasing sample sizes (dashed line in Figure 7). This was because the wider variance in monitored abundance when using a smaller sample size resulted in an increased probability of early treatment. In addition, the effect of sample size was minimal when the sampling interval was longer (upper part in Figure 7), while sample size still played an important role in determining the timeliness of treatment when using a relatively short sampling interval (bottom part in Figure 7).
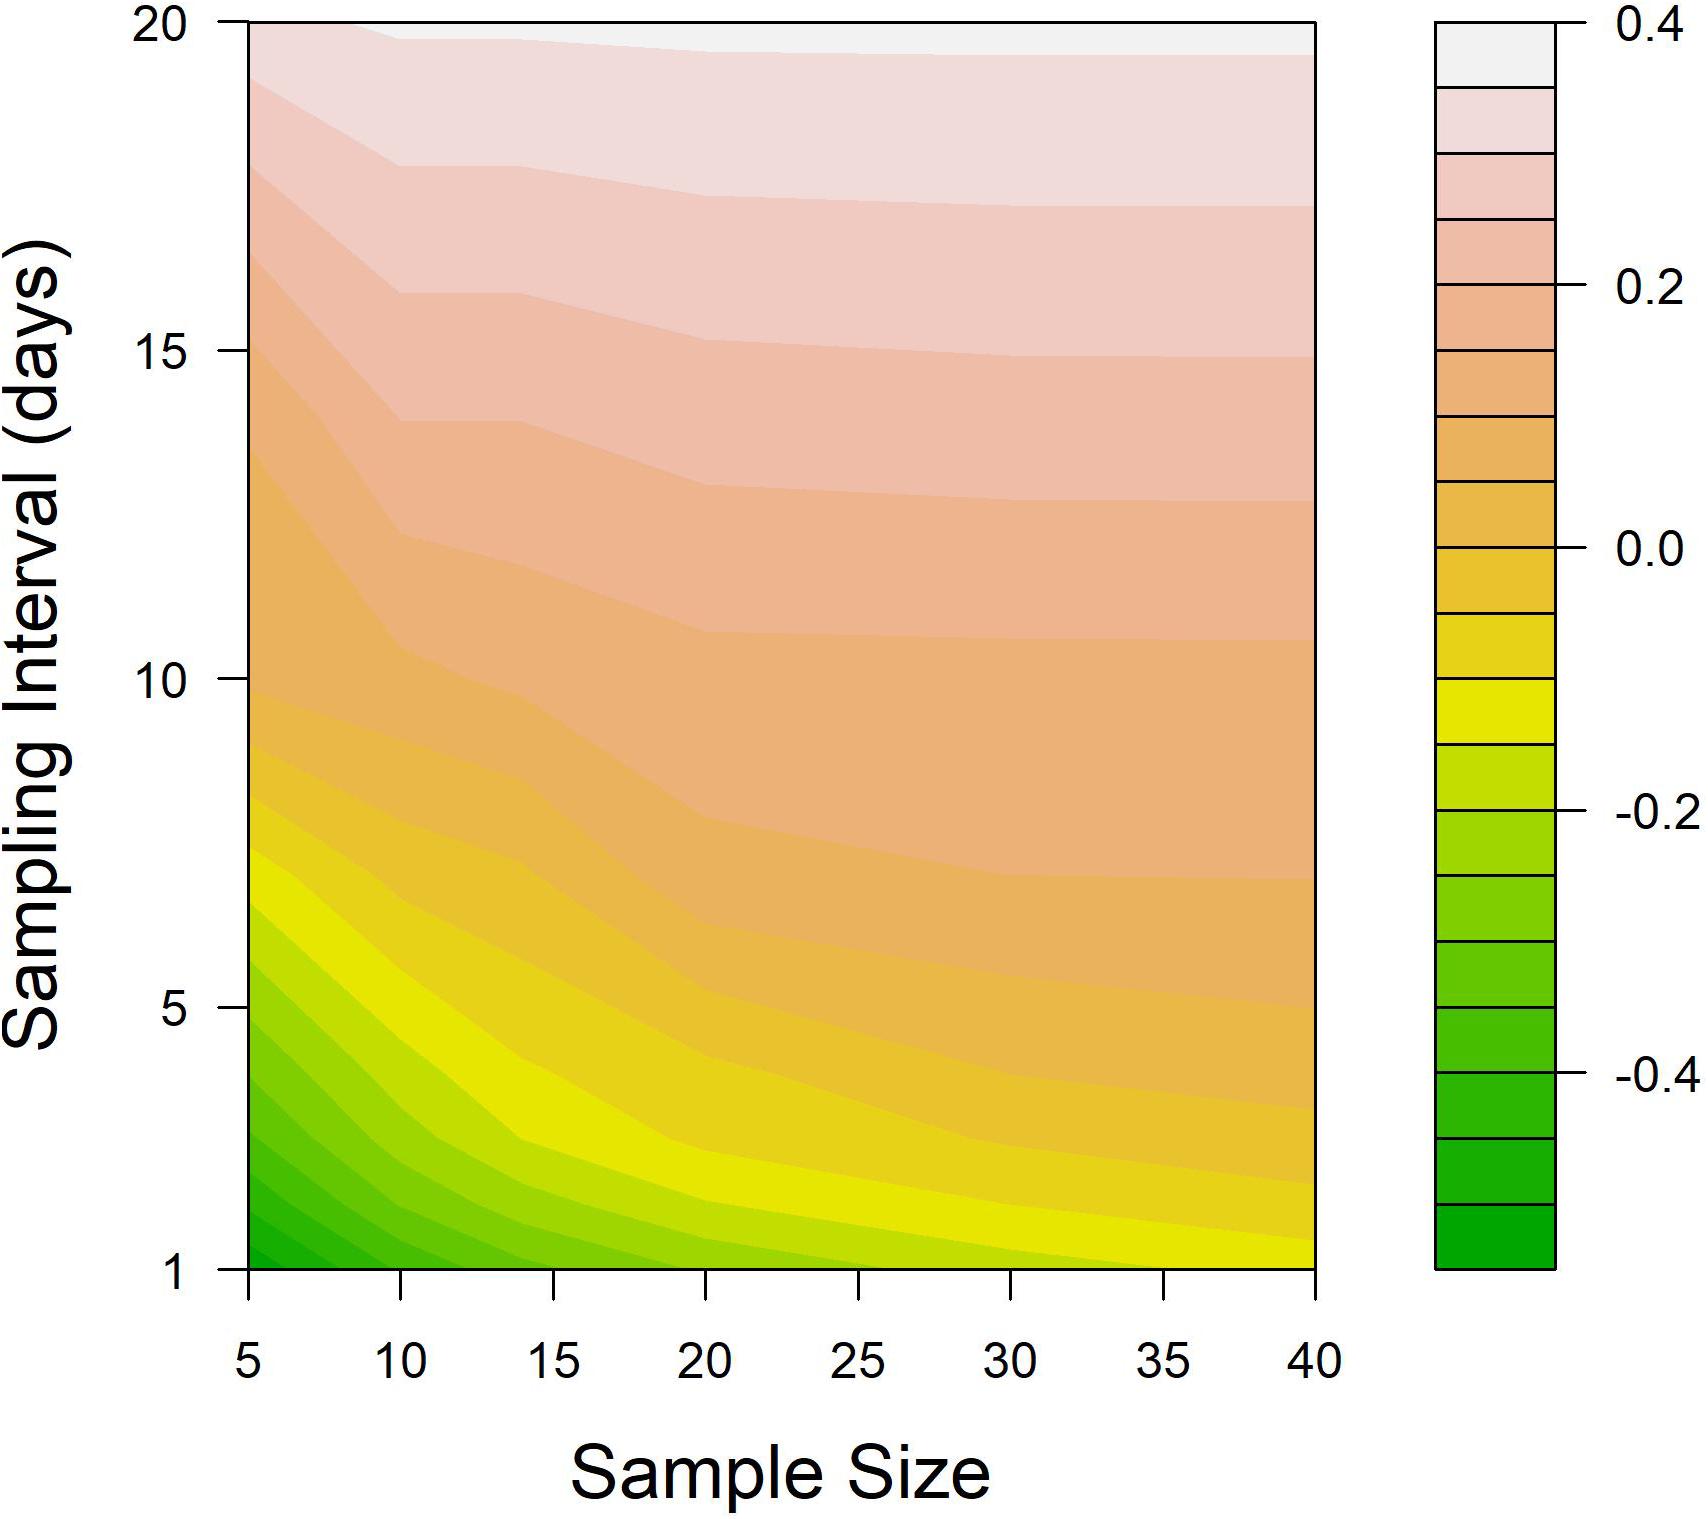
Figure 7. Contour plot illustrating the impact of various sample sizes and sampling interval combinations on the suitability of treatment application. The suitability was assessed as the median value of True abundance – Treatment threshold at the time of all treatment, based on 5,000 simulations. The treatment threshold for these simulations was fixed at one adult female salmon louse.
Discussion
This study has demonstrated a model for the description of salmon lice abundance during a production cycle in a salmon farm, linking salmon sampling for salmon lice abundance estimation with salmon lice treatment dependent on that sampling. This allowed us to calculate the proportions of timely and untimely treatments, as well as the differences between true abundance and monitored abundance, and to explore how the relevant factors such as sample size, treatment thresholds, and sampling interval affect the management of salmon lice. Each salmon producing country has established regulations regarding salmon sampling for salmon lice abundance estimation (Revie et al., 2009; Torrissen et al., 2013). Investigations presented by this study are expected to offer references to improve their sampling strategies to enhance the more appropriate application of the salmon lice treatments.
For the timely application of salmon lice treatments, the key is to wait until the abundance reaches a treatment threshold and to apply treatment as soon as the abundance violates the threshold (Roebuck and Wristen, 2018). However, with a smaller sample size, monitored abundance is more likely to overpass a treatment threshold even before true abundance reaches the threshold because of the wide variance of probable values of monitored abundance, which increases the likelihood of occurrences of early treatments. Such frequent occurrences of early treatments precluded the possibility of late treatments because the number of treatments within a period of a production cycle is limited, which results in a predominantly higher likelihood of early treatments than that of late treatments (Figure 2). A high proportion of early treatments with small sample sizes explains why the monitored abundance minus true abundance tended to have positive values with small sample sizes but negative values with large sample sizes (Figure 3). Even though both early and late treatments are untimely treatments that violate the standard we set, early treatments have a favorable effect on decreasing the infestation burden, especially without increasing the frequency of treatment during a production cycle.
The levels at which salmon lice treatment is triggered vary depending on the salmon-producing countries, salmon lice developmental stages counted for abundance estimation, and the period involved in wild salmon migration. The levels range from as low as 0.2 to as high as 6, depending on salmon producing countries and wild salmon migration season (Jones and Johnson, 2015; Arriagada et al., 2017; Kragesteen et al., 2019). Maintaining a low treatment threshold can be regarded as being desirable because it reduces the negative effect of salmon lice infestation not only on farmed salmon but also on wild salmon (Torrissen et al., 2013). However, it should be recognized that reducing the treatment threshold brings about significant costs. Increasing the sample size should be a prerequisite for lowering the treatment threshold. Otherwise, the treatments might go differently to our expectation. Treatments might be determined to be applied more often than we planned or lice infestation by a low treatment threshold might be even more suppressed than we intended. In addition, we assumed that fishes were randomly sampled regardless their body conditions. This assumption may not be the case because their weight and infection status can affect their likelihood of being sampled (Nilsson and Folkedal, 2019). Therefore, modeling results generated by this study might have to be impaired.
An interesting finding was that increasing sample size improves the timeliness of lice treatments, whereas shortening sampling interval does not necessarily improve the timeliness, given constant environmental factors such as temperature and salinity. Too short sampling intervals do not wait for salmon lice abundance to exceed the treatment threshold and result in early treatments. This unintended situation occurs more frequently with smaller sample sizes. On the other hand, an extended sampling interval is likely to allow lice abundance to keep increasing even after the abundance overpasses the threshold. Therefore, too long a sampling interval leads to excessive salmon lice population growth, whereas too short a sampling interval rather leads to more treatments than we intended due to frequent overestimation of abundance. In many cases, sampling for salmon lice abundance estimates is carried out weekly (Tardiff, 2019), which appears to be reasonably effective based on our modeled results. At this sampling interval, abundance estimates can be sensitively affected by varying sample sizes. However, during the periods when seawater temperatures are low or wild salmon is not migrating, sampling intervals can be extended as long as a month (Elmoslemany et al., 2013; Arriagada et al., 2017; Sandvik et al., 2020). Our findings suggest that such an extension of the sampling interval will worsen the timeliness of treatment irrespective of sample size. These findings emphasize that not only sample size, but also sampling interval, are important factors if salmon lice treatments are to be appropriately administered.
As the primary objective of this study was to evaluate the effect and the relative importance of three key sampling related factors (sample size, treatment threshold, and sampling interval) on the accuracy of salmon lice abundance estimates and timing of treatments, we have prioritized understanding straightforwardly the effects of these key factors over reflecting precisely the reality of various farming scenarios in our models. Consequently, sea lice dynamics on a single farm were simulated using deterministic models in order to preclude stochasticity and other sources of variability in the modeled outcomes. Nevertheless, future studies should account for other factors that could potentially influence the accuracy of sea lice abundance estimates and timing of treatment, such as within and between site variability in abundance (Parent et al., 2021), resistance to applied chemotherapeutics (Aaen et al., 2015), and variability in environmental factors (Rittenhouse et al., 2016) or external sources of infestation (Adams et al., 2021).
A key message to be taken from this work is that the estimation of salmon lice abundance based on field sampling may differ markedly from the true abundance and, therefore, that salmon lice treatments and interventions may not be optimally administered (Revie et al., 2002). Early treatments may be regarded as a better management strategy when compared to late treatments, in that they will tend to decrease the infestation burden without an excessive increase in the total number of treatments. Nevertheless, it should be noted that early treatments may still have negative impacts, particularly in terms of selective pressure for treatment resistance (McEwan et al., 2015). To improve the accuracy in decisions around salmon lice treatments, it is therefore necessary to consider the interactions of sample size, treatment threshold and sampling interval for each specific situation.
Data Availability Statement
The original contributions presented in the study are included in the article/supplementary material, and the code files for the model are available on GitHub: https://github.com/jaewoonjeong/ImperfectSampling. Further inquiries can be directed to the corresponding author.
Author Contributions
JJ conceptualized the study ideas, parametrized and simulated the models, conducted the statistical analysis, generated the figures, and wrote the first draft of the manuscript. MS and KT contributed to conceptualization and writing and editing. CR acquired funding, managed the project, and also contributed to writing and editing. All authors approved the submitted version.
Funding
This work was partially funded through an FHF Norwegian Seafood Research Fund (Grant FHF 901411 – Developing standardized methods for counting sea lice and calculating the amounts of sea lice) and by the Ocean Frontier Institute’s New Models of Salmon Health Management (OFI Module L) program.
Conflict of Interest
The authors declare that the research was conducted in the absence of any commercial or financial relationships that could be construed as a potential conflict of interest.
Publisher’s Note
All claims expressed in this article are solely those of the authors and do not necessarily represent those of their affiliated organizations, or those of the publisher, the editors and the reviewers. Any product that may be evaluated in this article, or claim that may be made by its manufacturer, is not guaranteed or endorsed by the publisher.
References
Aaen, S. M., Helgesen, K. O., Bakke, M. J., Kaur, K., and Horsberg, T. E. (2015). Drug resistance in sea lice: a threat to salmonid aquaculture. Trends Parasitol. 31, 72–81. doi: 10.1016/j.pt.2014.12.006
Abolofia, J., Asche, F., and Wilen, J. E. (2017). The cost of lice: quantifying the impacts of parasitic sea lice on farmed salmon. Mar. Resour. Econ. 32, 329–349. doi: 10.1086/691981
Arriagada, G., Stryhn, H., Sanchez, J., Vanderstichel, R., Campistó, J. L., Rees, E. E., et al. (2017). Evaluating the effect of synchronized sea lice treatments in Chile. Prev. Vet. Med. 136, 1–10.
Barrett, L. T., Oppedal, F., Robinson, N., and Dempster, T. (2020). Prevention not cure: a review of methods to avoid sea lice infestations in salmon aquaculture. Rev. Aquacult. 12, 2527–2543. doi: 10.1111/raq.12456
Burka, J. F., Fast, M. D., and Revie, C. W. (2012). “22 Lepeophtheirus salmonis and Caligus rogercresseyi,” in Fish Parasites, eds K. Buchmann and P. T. K. Woo (Wallingford: CABI), 360–380.
Burridge, L., Weis, J. S., Cabello, F., Pizarro, J., and Bostick, K. (2010). Chemical use in salmon aquaculture: a review of current practices and possible environmental effects. Aquaculture 306, 7–23. doi: 10.1016/j.aquaculture.2010.05.020
Costello, M. (2009). The global economic cost of sea lice to the salmonid farming industry. J. Fish Dis. 32, 115–118. doi: 10.1111/j.1365-2761.2008.01011.x
Dohoo, I. R., Martin, W., and Stryhn, H. E. (2003). Veterinary Epidemiologic Research. Prince Edward Island: AVC.
Elmoslemany, A., Whyte, S. K., Revie, C. W., and Hammell, K. L. (2013). Sea lice monitoring on Atlantic salmon farms in New Brunswick, Canada: comparing audit and farm staff counts. J. Fish Dis. 36, 241–247. doi: 10.1111/jfd.12051
Groner, M. L., Rogers, L. A., Bateman, A. W., Connors, B. M., Frazer, L. N., Godwin, S. C., et al. (2016b). Lessons from sea louse and salmon epidemiology. Philos. Trans. R. Soc. Lond. B Biol. Sci. 371:20150203. doi: 10.1098/rstb.2015.0203
Groner, M. L., McEwan, G. F., Rees, E. E., Gettinby, G., and Revie, C. W. (2016a). Quantifying the influence of salinity and temperature on the population dynamics of a marine ectoparasite. Can. J. Fish. Aquat. Sci. 73, 1281–1291. doi: 10.1139/cjfas-2015-0444
Heuch, P. A., Gettinby, G., and Revie, C. W. (2011). Counting sea lice on Atlantic salmon farms—Empirical and theoretical observations. Aquaculture 320, 149–153. doi: 10.1016/j.aquaculture.2011.05.002
Jeong, J., and Revie, C. W. (2020). Appropriate sampling strategies to estimate sea lice prevalence on salmon farms with low infestation levels. Aquaculture 518:734858. doi: 10.1016/j.aquaculture.2019.734858
Jeong, J., Stormoen, M., McEwan, G. F., Thakur, K. K., and Revie, C. W. (2021). Salmon lice should be managed before they attach to salmon: exploring epidemiological factors affecting Lepeophtheirus salmonis abundance on salmon farms. Aquaculture 541:736792.
Jones, S., and Johnson, S. (2015). Biology of Sea Lice, Lepeophtheirus salmonis and Caligus spp in Western and Eastern Canada. Ottawa, ON: Canadian Science Advisory Secretariat.
Kragesteen, T. J., Simonsen, K., Visser, A. W., and Andersen, K. H. (2019). Optimal salmon lice treatment threshold and tragedy of the commons in salmon farm networks. Aquaculture 512:734329. doi: 10.1016/j.aquaculture.2019.734329
Krkošek, M., Ford, J. S., Morton, A., Lele, S., Myers, R. A., and Lewis, M. A. (2007). Declining wild salmon populations in relation to parasites from farm salmon. Science 318, 1772–1775. doi: 10.1126/science.1148744
McEwan, G. F., Groner, M. L., Fast, M. D., Gettinby, G., and Revie, C. W. (2015). Using agent-based modelling to predict the role of wild refugia in the evolution of resistance of sea lice to chemotherapeutants. PLoS One 10:e0139128. doi: 10.1371/journal.pone.0139128
Nilsson, J., and Folkedal, O. (2019). Sampling of Atlantic salmon Salmo salar from tanks and sea cages is size-biased. Aquaculture. 502, 272–279.
Parent, M. I., Stryhn, H., Hammell, K. L., Fast, M. D., Grant, J., and Vanderstichel, R. (2021). Estimating the dispersal of Lepeophtheirus salmonis sea lice within and among Atlantic salmon sites of the Bay of Fundy, New Brunswick. J. Fish Dis. 00, 1–14. doi: 10.1111/jfd.13511
Revie, C. W., Gettinby, G., Treasurer, J. W., and Wallace, C. (2005). Evaluating the effect of clustering when monitoring the abundance of sea lice populations on farmed Atlantic salmon. J. Fish Biol. 66, 773–783. doi: 10.1111/j.0022-1112.2005.00642.x
Revie, C. W., Gettinby, G., Treasurer, J. W., Grant, A. N., and Reid, S. W. J. (2002). Sea lice infestations on farmed Atlantic salmon in Scotland and the use of ectoparasitic treatments. Vet. Rec. 151, 753–757.
Revie, C. W., Hollinger, E., Gettinby, G., Lees, F., and Heuch, P. A. (2007). Clustering of parasites within cages on Scottish and Norwegian salmon farms: alternative sampling strategies illustrated using simulation. Prev. Vet. Med. 81, 135–147. doi: 10.1016/j.prevetmed.2007.04.004
Revie, C., Dill, L., Finstad, B., and Todd, C. D. (2009). Sea Lice Working Group Report. NINA Special Report 39. Trondheim: Norwegian Institute for Nature Research, 1–17.
Rittenhouse, M. A., Revie, C. W., and Hurford, A. (2016). A model for sea lice (Lepeophtheirus salmonis) dynamics in a seasonally changing environment. Epidemics 16, 8–16.
Robbins, C., Gettinby, G., Lees, F., Baillie, M., Wallace, C., and Revie, C. W. (2010). Assessing topical treatment interventions on Scottish salmon farms using a sea lice (Lepeophtheirus salmonis) population model. Aquaculture 306, 191–197. doi: 10.1016/j.aquaculture.2010.05.006
Roebuck, K., and Wristen, K. (2018). Global Review of the Aquaculture Stewardship Council’s Salmon Standard. Technical Report. Vancouver, BC: SeaChoice.
Sandvik, A. D., Johnsen, I. A., Myksvoll, M. S., Sævik, P. N., and Skogen, M. D. (2020). Prediction of the salmon lice infestation pressure in a Norwegian fjord. ICES J. Mar. Sci. 77, 746–756. doi: 10.1093/icesjms/fsz256
Soetaert, K., Petzoldt, T., and Setzer, R. W. (2010). Solving differential equations in R: package deSolve. J. Stat. Softw. 33, 1–25.
Stien, A., Bjørn, P. A., Heuch, P. A., and Elston, D. A. (2005). Population dynamics of salmon lice Lepeophtheirus salmonis on Atlantic salmon and sea trout. Mar. Ecol. Prog. Ser. 290, 263–275. doi: 10.3354/meps290263
Sviland Walde, C., Bang Jensen, B., Pettersen, J. M., and Stormoen, M. (2021). Estimating cage−level mortality distributions following different delousing treatments of Atlantic salmon (salmo salar) in Norway. J. Fish Dis. 44, 899–912. doi: 10.1111/jfd.13348
Tardiff, R. (2019). The Current State of Sea Lice Management. Aquaculture Stewardship Council. Available online at: https://www.asc-aqua.org/the-current-state-of-sea-lice-management/ (accessed April 29, 2021).
Thakur, K. K., Vanderstichel, R., Barrell, J., Stryhn, H., Patanasatienkul, T., and Revie, C. W. (2018). Comparison of remotely-sensed sea surface temperature and salinity products with in situ measurements from British Columbia, Canada. Front. Mar. Sci. 5:121. doi: 10.3389/fmars.2018.00121
Torrissen, O., Jones, S., Asche, F., Guttormsen, A., Skilbrei, O. T., Nilsen, F., et al. (2013). Salmon lice–impact on wild salmonids and salmon aquaculture. J. Fish Dis. 36, 171–194. doi: 10.1111/jfd.12061
Keywords: abundance, Atlantic salmon (Salmo salar), aquaculture, sampling, parasite treatment, sea lice
Citation: Jeong J, Stormoen M, Thakur KK and Revie CW (2021) Imperfect Estimation of Lepeophtheirus salmonis Abundance and Its Impact on Salmon Lice Treatment on Atlantic Salmon Farms. Front. Mar. Sci. 8:763206. doi: 10.3389/fmars.2021.763206
Received: 23 August 2021; Accepted: 24 September 2021;
Published: 20 October 2021.
Edited by:
Morten Omholt Alver, Norwegian University of Science and Technology, NorwayReviewed by:
Alexander Murray, Marine Scotland, United KingdomFrancisca Samsing, The University of Sydney, Australia
Copyright © 2021 Jeong, Stormoen, Thakur and Revie. This is an open-access article distributed under the terms of the Creative Commons Attribution License (CC BY). The use, distribution or reproduction in other forums is permitted, provided the original author(s) and the copyright owner(s) are credited and that the original publication in this journal is cited, in accordance with accepted academic practice. No use, distribution or reproduction is permitted which does not comply with these terms.
*Correspondence: Jaewoon Jeong, amplb25nQHVwZWkuY2E=