 Jichen Zhao1
 Minze Liao1
 Zexu Lin1Yiyi Huang1Yunqi Zhong1Luyao Liu1
 Guoliang Chen2Zuotao Ni3*
 Chengbo Sun1,4,5*
- 1College of Fisheries, Guangdong Ocean University, Zhanjiang, China
- 2Guangdong Haimao Investment Co., Ltd., Zhanjiang, China
- 3Institute of Oceanology, Chinese Academy of Sciences, Qingdao, China
- 4Guangdong Provincial Laboratory of Southern Marine Science and Engineering, Zhanjiang, China
- 5Guangdong Provincial Key Laboratory of Pathogenic Biology and Epidemiology for Aquatic Economic Animals, Zhanjiang, China
Unsynchronized growth is a common phenomenon in farmed crustaceans. The underlying molecular mechanism of unsynchronized growth of crustaceans is unclear. In this study, a comparative proteomic analysis focusing on growth differences was performed using kuruma shrimp Marsupenaeus japonicus, an economic crustacean species, as the model. The study analyzed kuruma shrimp at fast growth stage and steady growth stage from both fast growth group and slow growth group by an Isobaric tags for relative and absolute quantitation (iTRAQ)-based quantitative proteomic analysis method. A total of 1,720 proteins, including 12,291 peptides, were identified. Fifty-two and 70 differentially expressed proteins (DEPs) were identified in the fast growth stage and steady growth stage, respectively. Interestingly, 10 DEPs, including 14-3-3-epsilon-like, GPI, GPD1, MHC-1a, and MHC-1b, were presented in both growth stages. In addition, all these 10 DEPs shared the same expression tendency at these two growth stages. The results indicated that these 10 DEPs are potential growth biomarkers of M. japonicus. Proteins associated with faster growth of M. japonicus may promote cell growth and inhibit cell apoptosis through the Hippo signaling pathway. The fast growth group of M. japonicus may also achieve growth superiority by activating multiple related metabolic pathways, including glycolysis, glycerophospholipid metabolism and Citrate cycle. The present study provides a new perspective to explore the molecular mechanism of unsynchronized growth in crustacean species.
Introduction
Growth rate is a key factor to associate with the yield and economic benefits for the crustacean farming industry. However, for most crustacean species, the growth is unsynchronized, which means even cultured under the same genetic and environmental conditions (Ren et al., 2017; Jiang et al., 2020; Uengwetwanit et al., 2020), individual crustacean grows at different rates. The unsynchronized growth phenomenon expands the total harvest time, leads to more management efforts and higher farming cost (Hao et al., 2019; Jiang et al., 2020). With more and more large-scale farming models being developed in recent years, how to efficiently minimize the unsynchronized growth becomes a critical question for the industry. However, there is limit information on the underlying mechanism of unsynchronized growth in crustaceans, which hinders the industry development.
Proteomics is one of the most powerful tools available to investigate molecular mechanisms of different phenotypes. Gene expression regulation is a complex multilevel process. In this process, genes are the carriers of genetic information (Cheng et al., 2018), and proteins are the executors of the physiological functions and direct manifestations of life activity (Zhang et al., 2014). However, the correlation between mRNA and protein abundances was only approximately 27∼40% (Maier et al., 2009). Therefore, proteomics analysis focusing on expressed proteins, becomes an effective method to explore the molecular mechanisms corresponding to different phenotypes. Currently, although a number of studies on crustaceans’ unsynchronized growth at the gene-level were observed (Lv et al., 2015; Uengwetwanit et al., 2020), there are few related studies focusing on protein identification and quantification (Ren et al., 2017).
iTRAQ-based quantitative proteomic analysis method, a new reliable approach, has been widely used in the field of crustacean proteomics in recent years. iTRAQ allows simultaneous identification and quantification of proteins from multiple samples with high coverage (Ren et al., 2017; Xu et al., 2017). In terms of unsynchronized growth of crustaceans, Ren et al. (2017) identified 30 differentially expressed proteins (DEPs) related to the growth of Portunus trituberculatus, among these 30 DEPs, most of the growth-related proteins were upregulated, including those in metabolism, immune responses, DNA duplication and protein synthesis.
Current studies provide valuable information to better understand the genetic regulation mechanism of unsynchronized growth in crustacean species. However, previous research lacks recognizing the impact of sex and molting cycle, which influence crustacean growth at various levels (Liang et al., 2017; Lin et al., 2019). Unsynchronized growth is a life-long process common for most animals, the study on crustacean will not only illuminate the understanding on invertebrate animals, it will also offer valuable information for our interpretation of the overall biology research.
Kuruma shrimp Marsupenaeus japonicus is a broadly farmed economical shrimp species in the Indo-West Pacific region in both tropical and subtropical waters (Wang et al., 2018, 2020; Liu et al., 2019), where the supply of wild M. japonicus cannot meet the demand. So, shrimp farming industry developed fast in recent years to fill the gap (Jung et al., 2013). In this study, a proteomic analysis comparing the fast growth group and slow growth group of M. japonicus in both fast growth stage (40 days of age with higher specific growth rate) and steady growth stage (70 days of age with lower specific growth rate) by iTRAQ was conducted. The study identified Hippo signaling pathway and some metabolic pathways potentially impact the growth of M. japonicus. Our research not only shed light on molecular mechanisms underlying the growth of M. japonicus but also would promote related research focusing on solve problems in the agricultural production and better advance the farming industry.
Materials and Methods
Shrimp and Experimental Design
The study protocol was approved by the ethics review board of the Institutional Animal Care and Use Committee of Guangdong Ocean University. Shrimp were obtained from the East Sea Island Marine Research Station of Guangdong Ocean University. The shrimp culture management was as described in our previous report (Zhao et al., 2021). Briefly, the shrimp came from a full-sib family (Family 1) constructed by our team. Ten days after larval metamorphosis to postlarvae (10 days of age), the family was transported to an 800 m2 ponds. The culture densities was 40 individuals/m2. The shrimp were fed 2 times daily with commercial pellet diets with crude protein ≥ 43.0% (Guangdong Yuequn Biotechnology Co., Ltd., China). The zero-exchange water culture pattern was adopted. Throughout the culture experiment, the pond was aerated to maintain the dissolved oxygen at > 5 mg/L. The pH and salinity of the pond remained stable, ranging from 8.16 to 8.62 and 28 to 32‰, respectively. The concentrations of ammonia nitrogen, nitrite nitrogen and nitrate nitrogen were kept at low levels, lower than 1.017, 0.206, and 1.336 mg/L, respectively. Based on the growth characterization of kuruma shrimp (Zhao et al., 2021), two time points, 40 days of age (fast growth stage with higher specific growth rate) and 70 days of age (steady growth stage with lower specific growth rate), individuals exhibiting significant differences in size, were selected for subsequent analysis. In addition, since sex is a key factor in determining shrimp development and growth, only female shrimp were selected for the experimental analysis in this study (Lin et al., 2019; Zhao et al., 2021). At each time point, 500 female shrimp were randomly captured. The 10 with the highest body weight were defined as the fast growth group (FG), and the 10 with the lowest body weight were defined as the slow growth group (SG). Then, 3 female shrimp in the intermolt stage (Chan et al., 1988) were sampled in each group. The average body weights of the FG40, SG40, FG70, and SG70 group shrimp were 1.21 ± 0.08, 0.33 ± 0.01, 2.37 ± 0.08, and 0.73 ± 0.03 g, respectively. The body weight of the FG and SG group shrimp at each age was found to be significantly different by t-test. After dissecting each shrimp, the abdominal muscle, the main target organ for shrimp growth, was taken as a sample for analysis (Zhao et al., 2021). There were 3 samples obtained from each group, with 12 samples in total. After dissection, the samples were immediately placed in liquid nitrogen and then stored in an ultralow temperature freezer at −80°C until protein extraction.
Protein Extraction and Digestion
According to the manufacturer’s instructions, 12 muscle samples were extracted using an animal tissue total protein extraction kit (Bangfei Biotech, China). The protein concentration of each sample was quantified using a 2D Quant kit (GE Healthcare, Waukesha, WI, United States). Subsequently, 200 mg of total protein obtained from each sample solution was digested with trypsin (Promega, Madison, WI, United States) at a protein:trypsin ratio of 50:1 at 37°C for 12 h.
Isobaric Tags for Relative and Absolute Quantitation Isobaric Labeling and High-Performance Liquid Chromatography Fractionation
The peptides were labeled using the iTRAQ Reagent-8 Plex Multiplex kit according to the manufacturer’s instructions (Applied Biosystems Sciex, United States). Briefly, limited by the number of iTRAQ tags, the samples were divided into two batches. The same amount of protein from 12 muscle samples was mixed into a single sample. Then, 12 samples from FG40, SG40, FG70, and SG70 and the mixed sample were divided into two batches for labeling with the isobaric iTQAQ tags (Figure 1). The first batch included FG40-1 (113), SG40-1 (114), FG70-1 (115), SG70-1 (116), FG40-3 (117), SG40-3 (118), and Mix (121), and the second batch included FG40-2 (113), SG40-2 (114), FG70-2 (115), SG70-2 (116), FG70-3 (117), SG70-3 (118), and Mix (121). Subsequently, the labeled peptides were fractionated into 60 fractions via high-pH reverse-phase HPLC using a Waters XBridge Peptide BEH C18 Column 130Å (5 μm, 4.6 mm × 100 mm, 1/pkg). The peptides were dissolved in buffer A (2% ACN, pH10), and the gradient included 3%, 3%–5%, 5%–18%, 18%–34%, 34%–95% and 95% solvent B (80% ACN, pH10), and the corresponding times were 0–5, 5–10, 10–35, 35–45, 45–53 and 53–58 min, respectively. The flow rate was 700 μL min–1. The peptides were then combined into 10 fractions and dried by vacuum centrifugation.
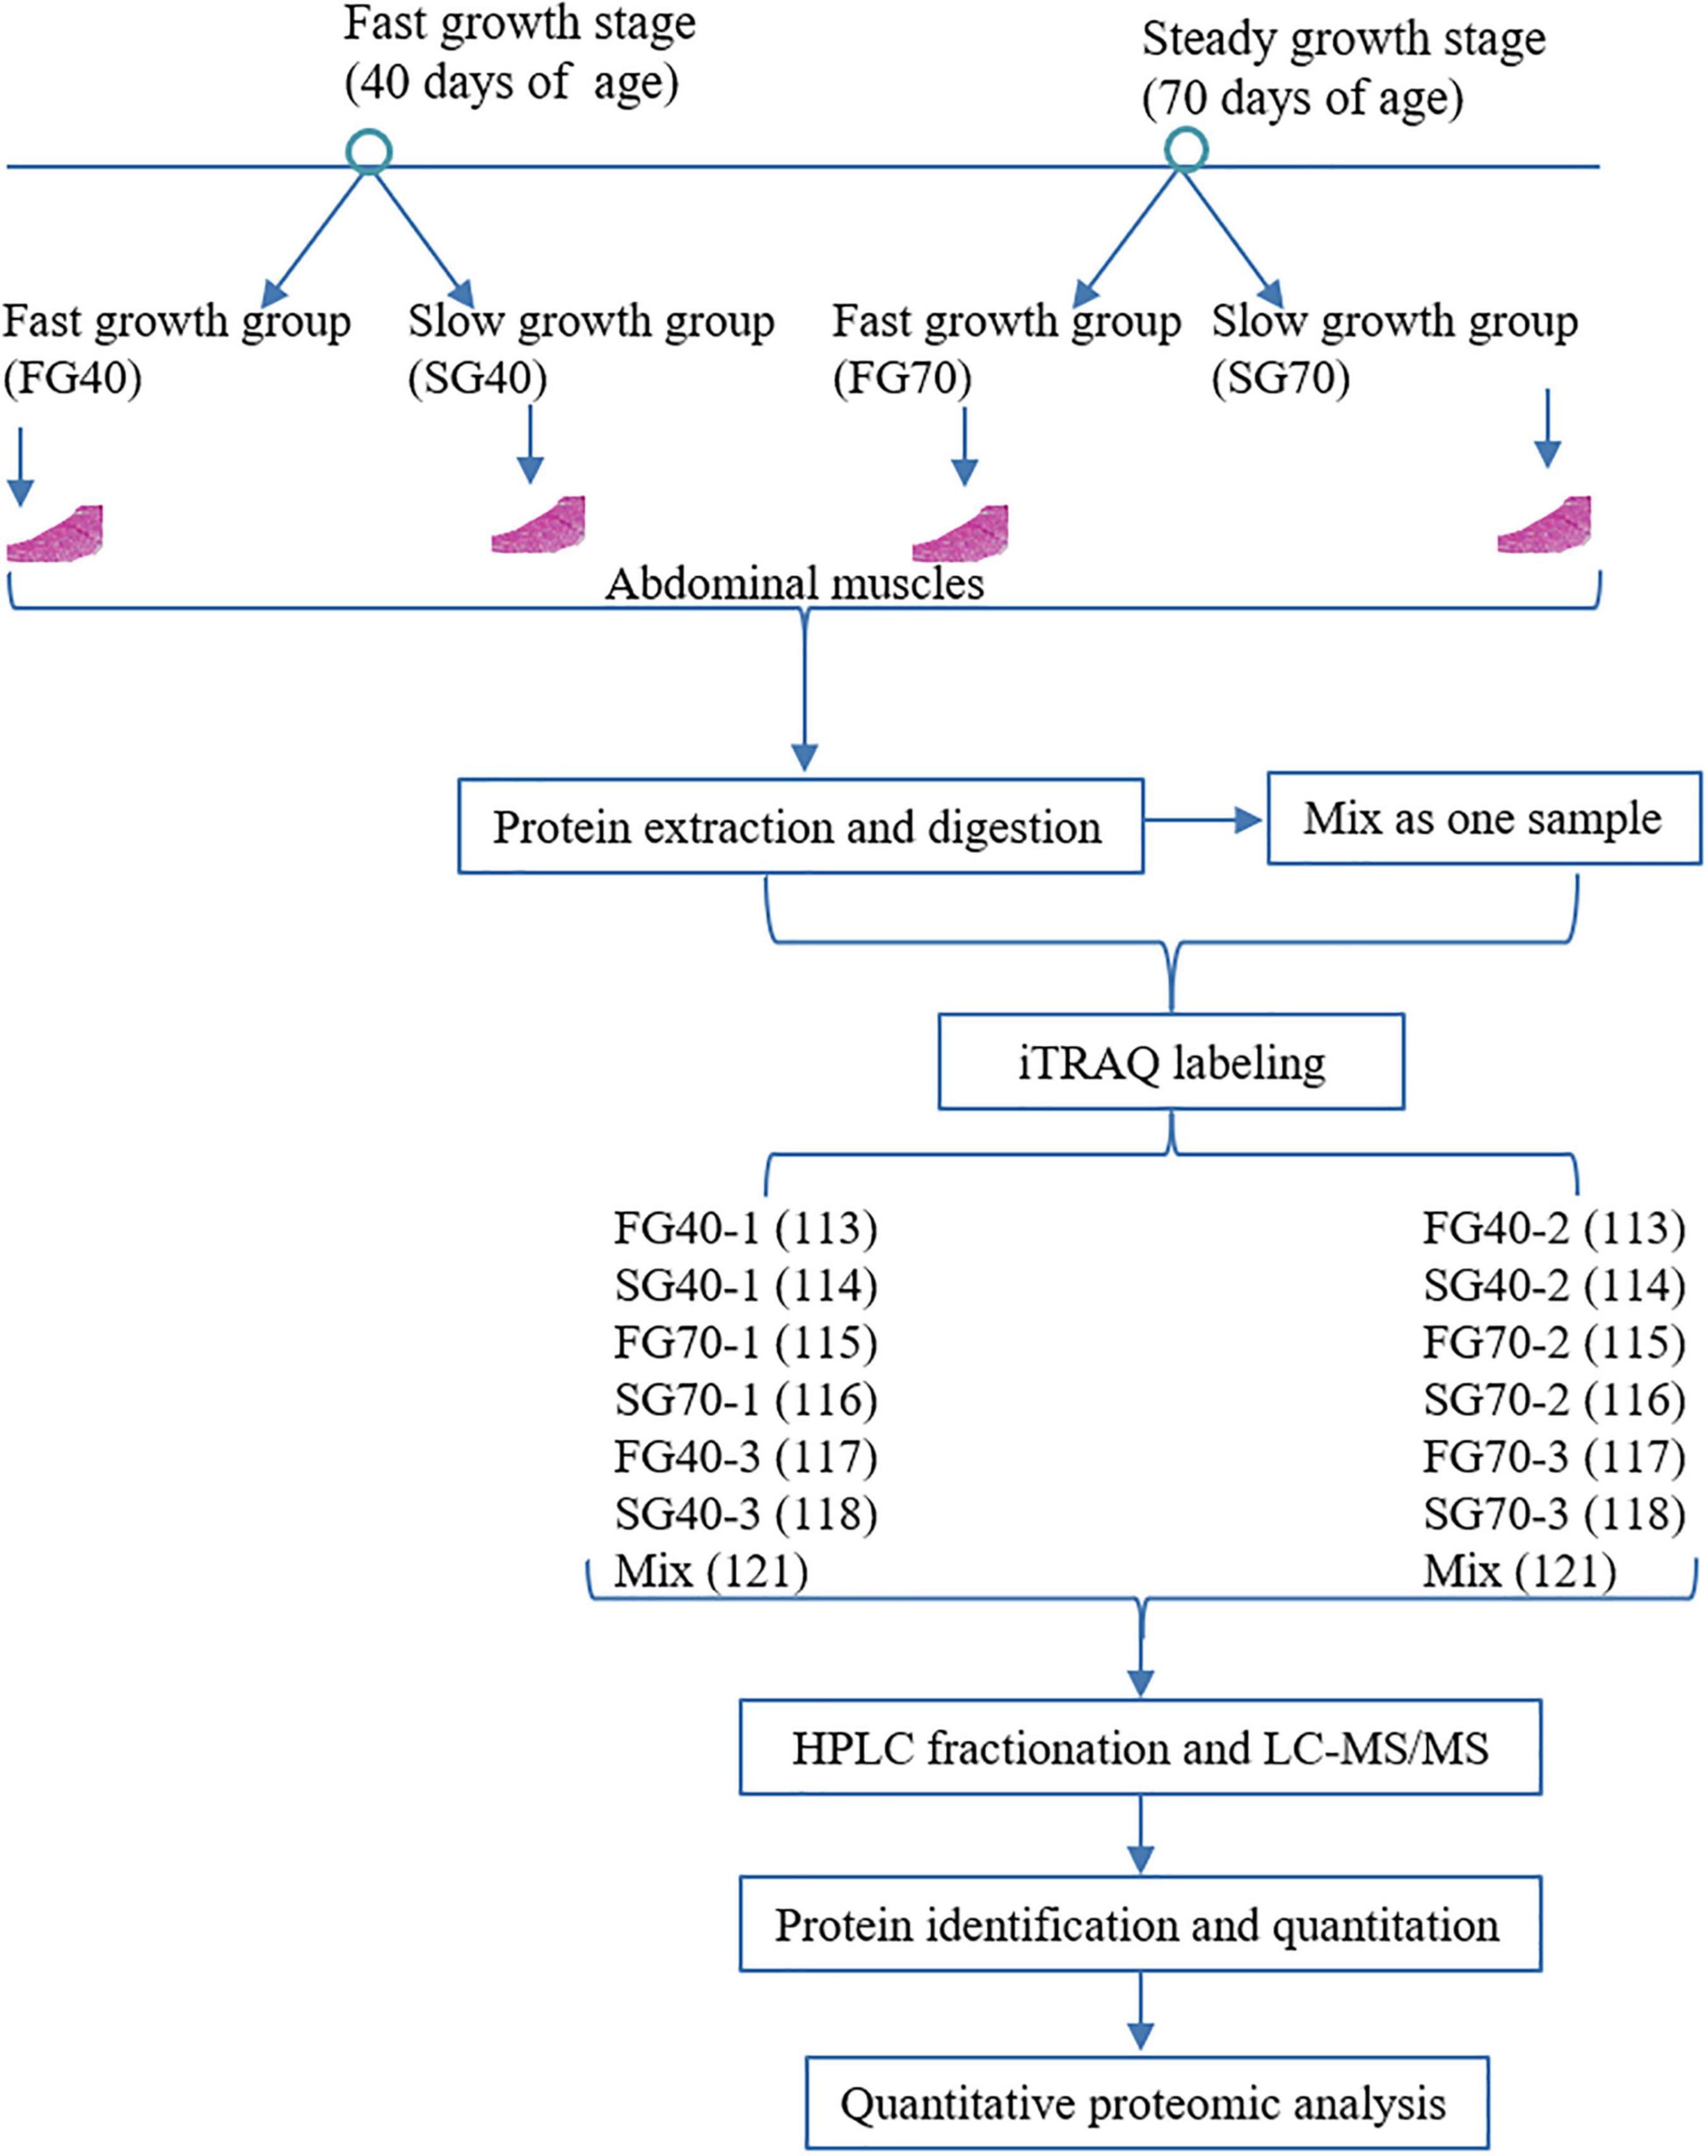
Figure 1. Workflow of the proteomic analysis performed to examine the unsynchronized growth of M. japonicus.
Liquid Chromatography–Mass Spectrometry Analysis
The fractionated peptides were dissolved in buffer A (0.1% FA) and loaded onto a Thermo Scientific reversed-phase C18 precolumn (3 mm, 100 μm × 20 mm). The gradient included 6, 6–28, 28–38, 38–100, and 100% solvent B (0.1% FA and 80% ACN), and the corresponding times were 0–3, 3–45, 45–50, 50–55, and 55–60 min, respectively. The samples were analyzed at a constant flow rate of 300 nl min–1 on an EASY-nLC UPLC system (Thermo Fisher Scientific). The peptides were then analyzed on a Q ExactiveTM plus hybrid quadrupole–Orbitrap mass spectrometer (Thermo Fisher Scientific). Intact peptides were detected in the Orbitrap at a resolution of 60,000. Peptides were selected for MS/MS using an NCE setting of 30. Ion fragments were detected in the Orbitrap at a resolution of 15,000. A data-dependent procedure alternating between one MS scan and 20 MS/MS scans was applied for the top 20 precursor ions above a threshold ion count of 10,000 in the MS survey scan with 30.0-s dynamic exclusion. The electrospray voltage applied was 2.0 kV. The m/z scan range was 350–1,800.
Protein Identification and Data Analysis
Protein identification was performed using the Proteome Discover 2.2.0.388 (Thermo Fisher Scientific). The database (SRP305604) used for identification was the M. japonicus transcriptome constructed by our team (Zhao et al., 2021). The parameters for analysis were set as follows: enzyme, trypsin; 15.0 ppm for peptide mass tolerance; up to 2 cleavages; carboxymethyl (C), iTRAQ 8-plex (N-term), iTRAQ 8-plex (K) and iTRAQ 8-plex (Y) as fixed modifications; and oxidation (M) and acetyl (protein N-term) as variable modifications. To reduce the probability of false protein identification, the protein identification was based on at least one unique peptide with 99% confidence and a FDR (false discovery rate) ≤ 0.01. For protein quantification, at least two unique peptides were required. The quantitative protein ratios were weighted and normalized by the median ratio in Mascot. Only proteins with P-values < 0.05 and FC (fold-change) values > 1.0 were considered DEPs. The Gene Ontology (GO) terms1 and Clusters of Orthologous Groups of Proteins database2 were used to classify and group all identified proteins. In addition, the COG database and Kyoto Encyclopedia of Genes and Genomes (KEGG)3 were used to analyze the identified DEPs.
Quantitative Real-Time PCR
To verify the protein expression levels determined by proteomic analysis, the expression levels of myosin heavy chain type-1a (MHC-1a) and myosin heavy chain type-1b (MHC-1b) were further quantified by Quantitative Real-Time PCR (qPCR) using the original protein samples (FG40, SG40, FG70, and SG70). The primers were designed using Primer 5 (Supplementary Table 1), and elongation factor 1-α (Qiao et al., 2017) and 18S ribosomal RNA (Sellars et al., 2007) of M. japonicus were used as internal controls. qPCR was performed in a total volume of 20.0 μl, including 10.0 μl of 2 × SYBR Green PCR Mix, 0.4 μl of each primer (10 μM), 8.2 μl ddH2O, and 1.0 μl cDNA (50 ng). The cycling parameters were as follows: 95°C for 30 s, then 40 cycles of 95°C for 5 s and holding at 60°C for 30 s. Dissociation curve analysis was further performed to check if only one PCR product was amplified. Three biological replicates were analyzed for each gene, and three technical replicates were analyzed for each biological replicate. Gene expression levels were compared and converted to fold differences using the comparative CT method (2–ΔΔCT) (Vandesompele et al., 2002).
Results
Protein Profiling
To obtain an overview of the M. japonicus proteome, protein samples were prepared from the fast growth group and slow growth group at the fast growth stage and steady growth stage (FG40, SG40, FG70, and SG70) and quantified by iTRAQ (Figure 1). A total of 1,720 proteins, including 12,291 peptides, were identified. In addition, 1,656 proteins were annotated in at least one of the protein databases, including Nr (1,656), GO (1,301), COG (805), and KEGG (730). In total, 805 proteins were further classified into 25 COG classifications (Figure 2A). The largest category was translation, ribosomal structure, and biogenesis (J) (143), followed by posttranslational modification, protein turnover, chaperones (O) (111), general function prediction only (R) (102), energy production and conversion (C) (68), cytoskeleton (Z) (66), signal transduction mechanism (T) (55), amino acid transport and metabolism (E) (55), and carbohydrate transport and metabolism (G) (51). Moreover, 1,301 proteins were assigned to different classes in three main GO categories, namely, biological process (21 subcategories), cellular component (16 subcategories), and molecular function (12 subcategories) (Figure 2B). In the category of biological process, the largest number of proteins was assigned to the term cellular process, whereas the binding and cell subcategories contained the largest number of proteins in the categories of molecular function and cellular component, respectively.
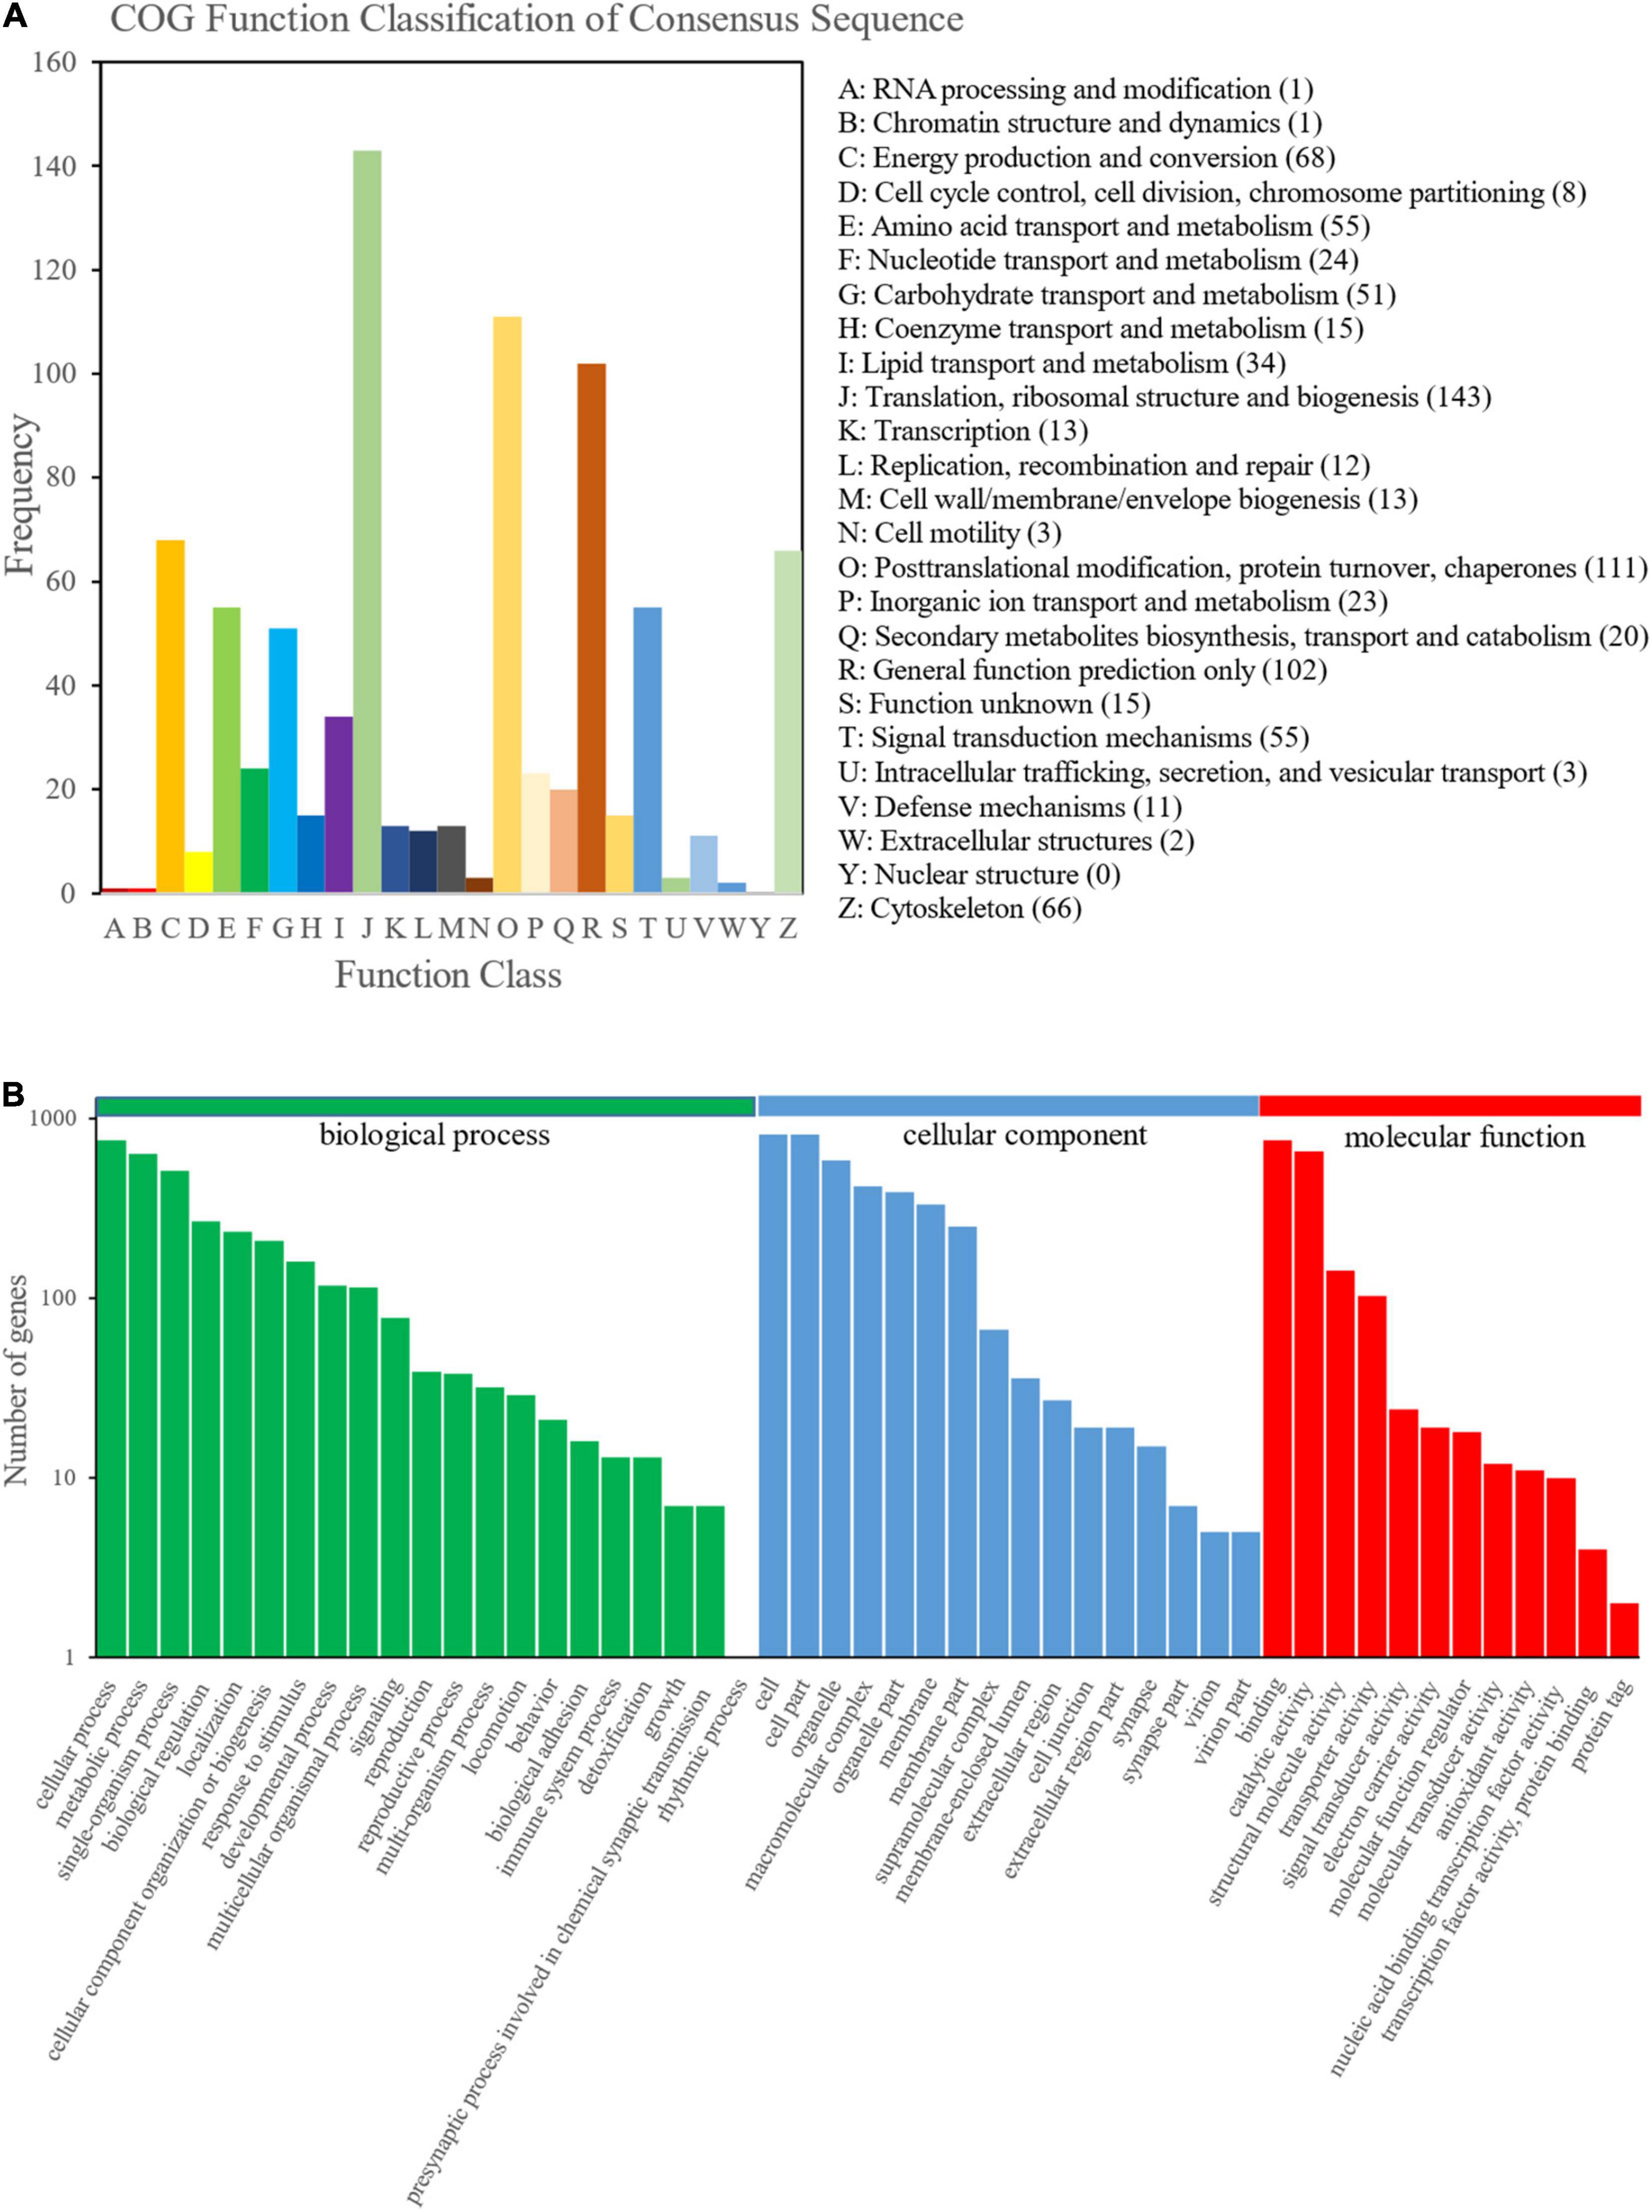
Figure 2. COG and GO analysis of M. japonicus proteins. (A) COG analysis and (B) GO analysis.
Isobaric Tags for Relative and Absolute Quantitation Quantification
In the present study, SG40 vs. FG40 and SG70 vs. FG70 were set as comparison groups. Finally, 52 DEPs (28 upregulated proteins and 24 downregulated proteins) between SG40 and FG40 (Supplementary Table 2) and 70 DEPs (8 upregulated proteins and 62 downregulated proteins) between SG70 and FG70 (Supplementary Table 3) were identified (Figure 3A). Ten DEPs were found to be present in both the SG40 vs. FG40 and SG70 vs. FG70 comparisons (Figure 3B). Interestingly, all shared DEPs expressed the same tendency in the two comparative groups (Figure 3C). Among these 10 DEPs, glucose-6-phosphate isomerase (GPI) and glycerol-3-phosphate dehydrogenase (GPD1) were upregulated in the fast growth group at both growth stages, whereas the other 8 DEPs, including 14-3-3-epsilon-like and cyclophilin A, were downregulated in the fast growth group at both growth stages.
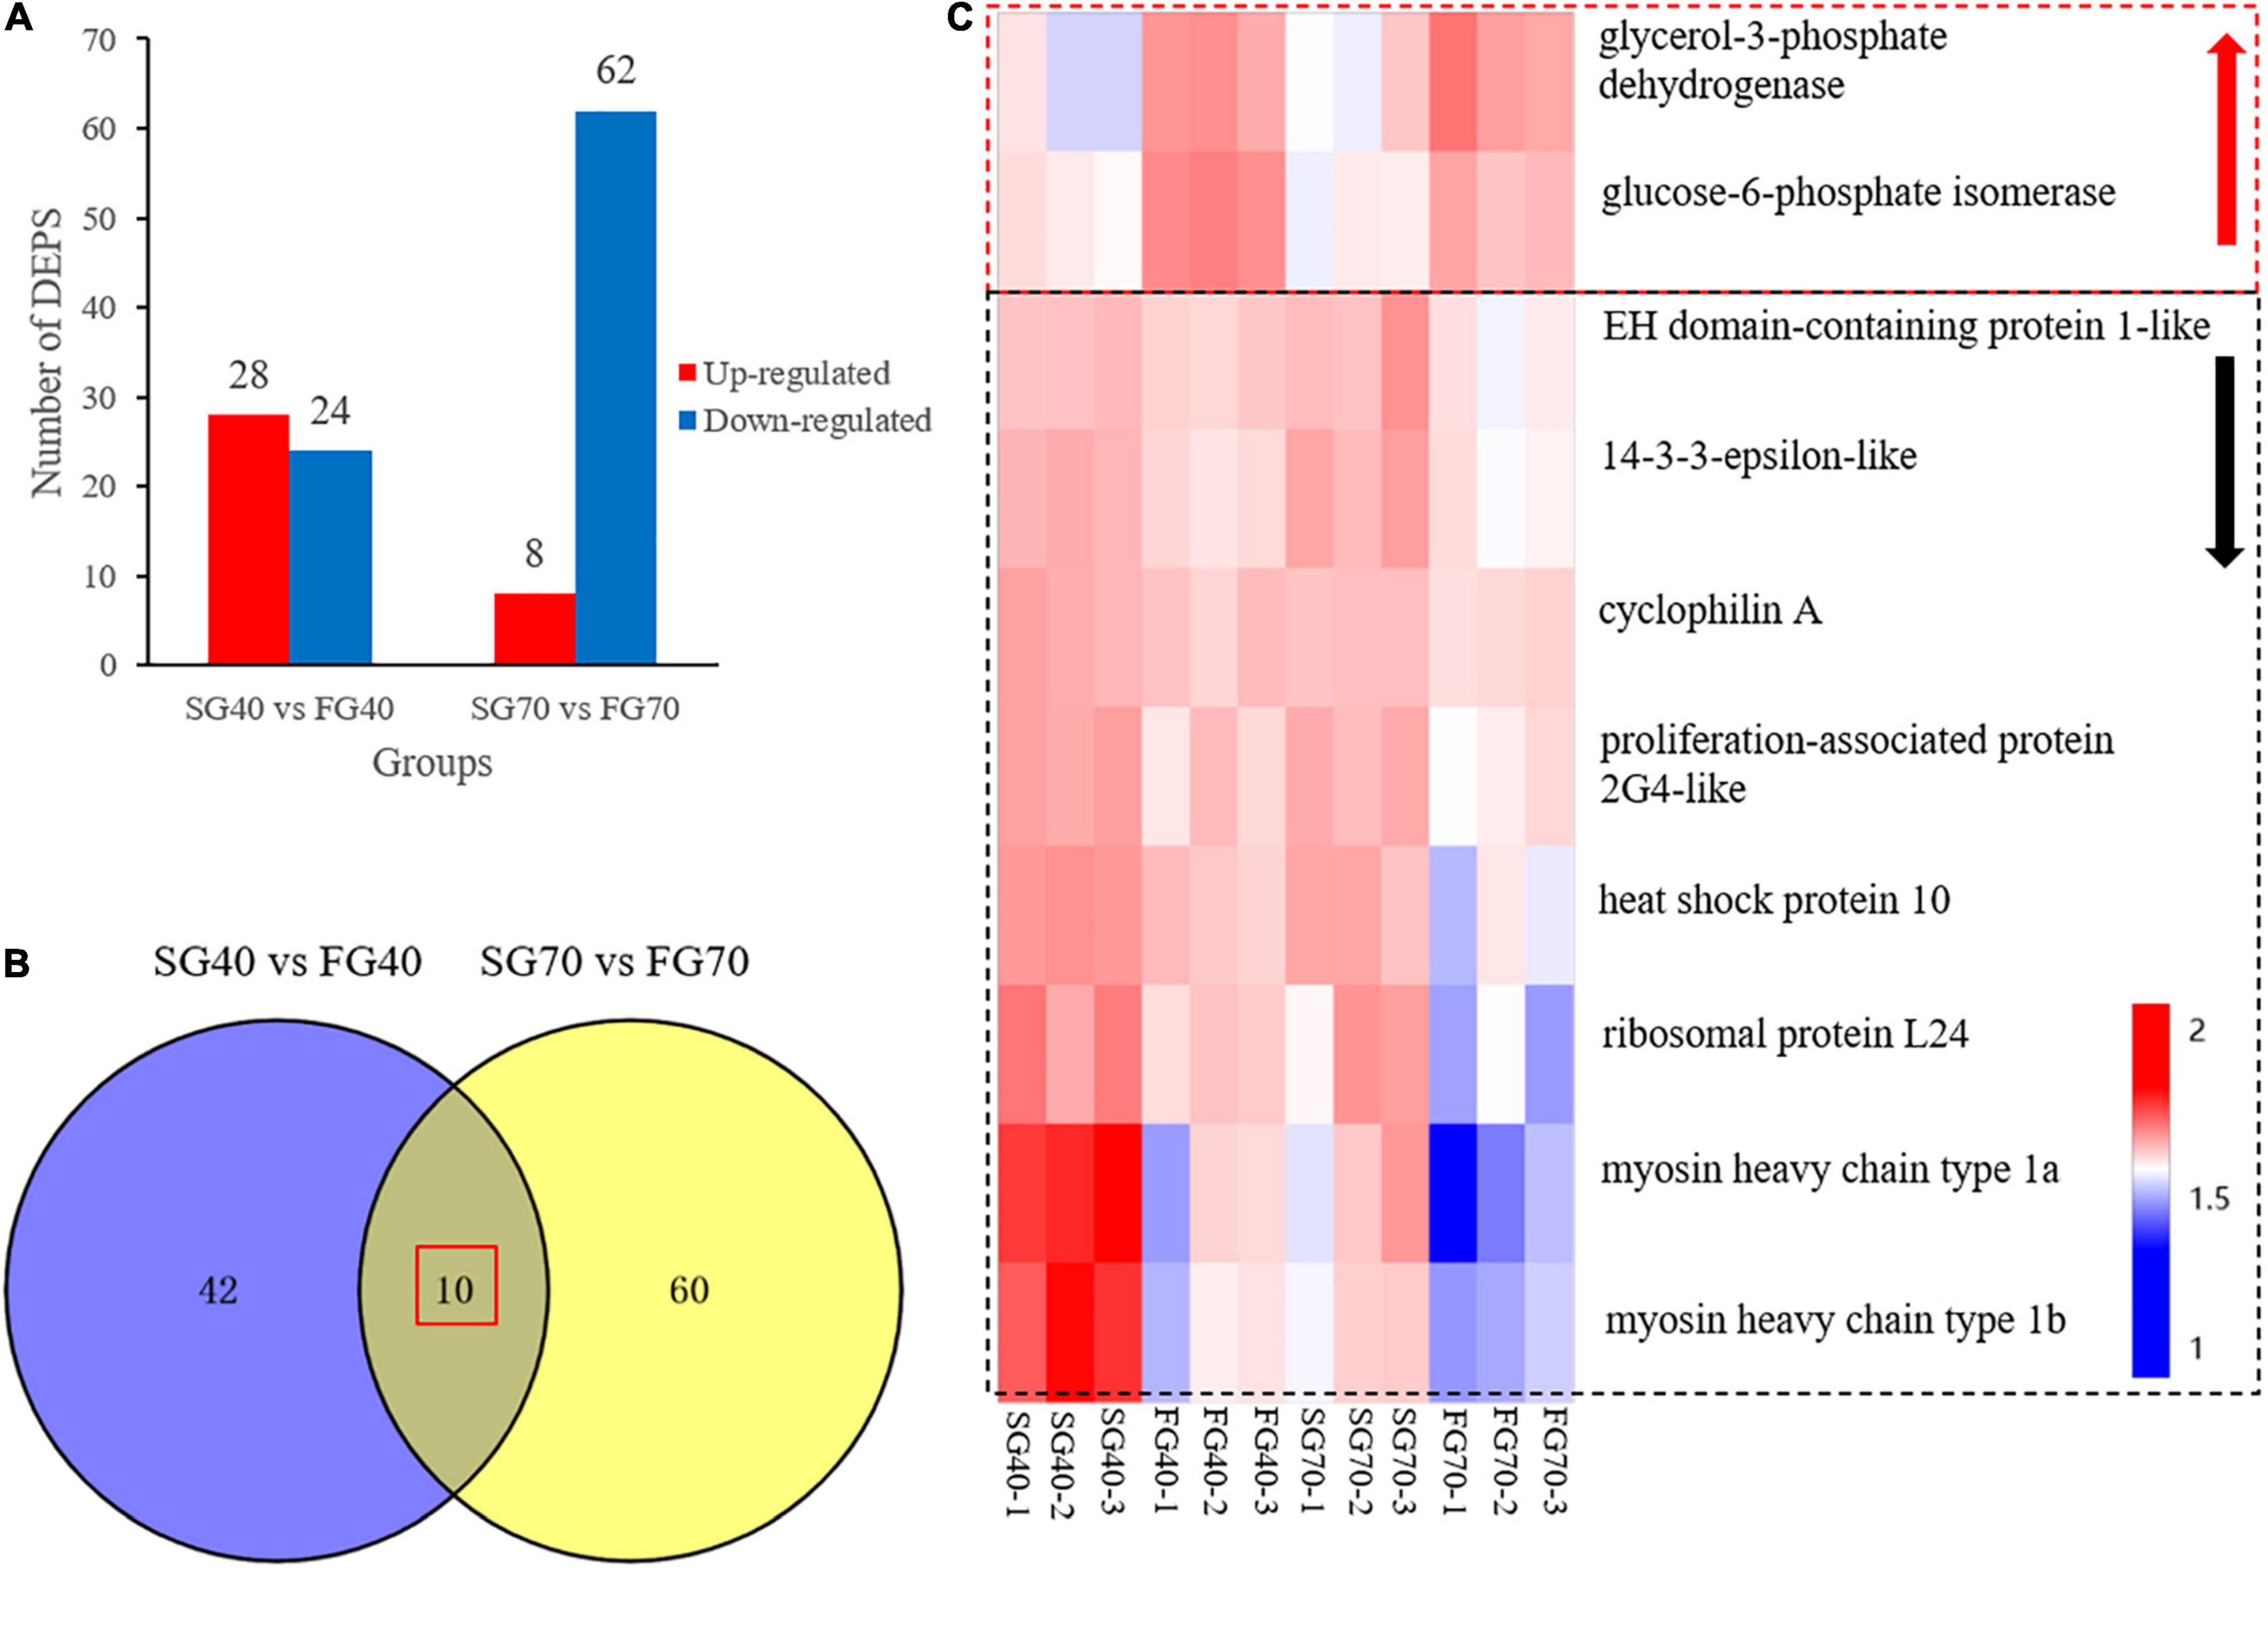
Figure 3. Comparative analysis of DEPs of M. japonicus in the fast growth group and slow growth group at the fast growth stage and steady growth stage. (A) Number of DEPs in the fast growth stage and steady growth stage; (B) Venn diagram of DEPs in the fast growth stage and steady growth stage; (C) heat map of the 10 shared DEPs identified during the fast growth stage and steady growth stage.
Differentially Expressed Protein Analysis by COG and Kyoto Encyclopedia of Genes and Genomes
The DEPs in the SG40 vs. FG40 and SG70 vs. FG70 groups were further categorized according to COG classification. Translation, ribosomal structure, and biogenesis, carbohydrate transport and metabolism, and posttranslational modification, protein turnover, and chaperones were the 3 COG classifications enriched with the most proteins in the two comparative groups (Figure 4A). Moreover, DEP functions and biological processes were analyzed by KEGG. Twenty-five DEPs in SG40 vs. FG40 and 40 DEPs in SG70 vs. FG70 were enriched in 13 and 16 Level 2 pathways, respectively, of which 9 Level 2 pathways were shared by the two comparative groups (Supplementary Figure 1). Further analysis of the pathways included in these 9 Level 2 pathways revealed 20 pathways in SG40 vs. FG40 and 34 pathways in SG70 vs. FG70, of which 16 pathways were shared by the two comparison groups (Figure 4B). These pathways were involved in the following physiological activities: lipid metabolism (glycerophospholipid metabolism), global and overview maps (carbon metabolism, biosynthesis of amino acids), energy metabolism (oxidative phosphorylation), carbohydrate metabolism (starch sucrose metabolism, pentose phosphate pathway, glycolysis/gluconeogenesis, amino sugar and nucleotide sugar metabolism), amino acid metabolism (tryptophan metabolism, lysine degradation, glycine, serine and threonine metabolism), translation (ribosome), folding, sorting, and degradation (protein processing in the endoplasmic reticulum), signal transduction (the Hippo signaling pathway), and transport and catabolism (phagosome, endocytosis).
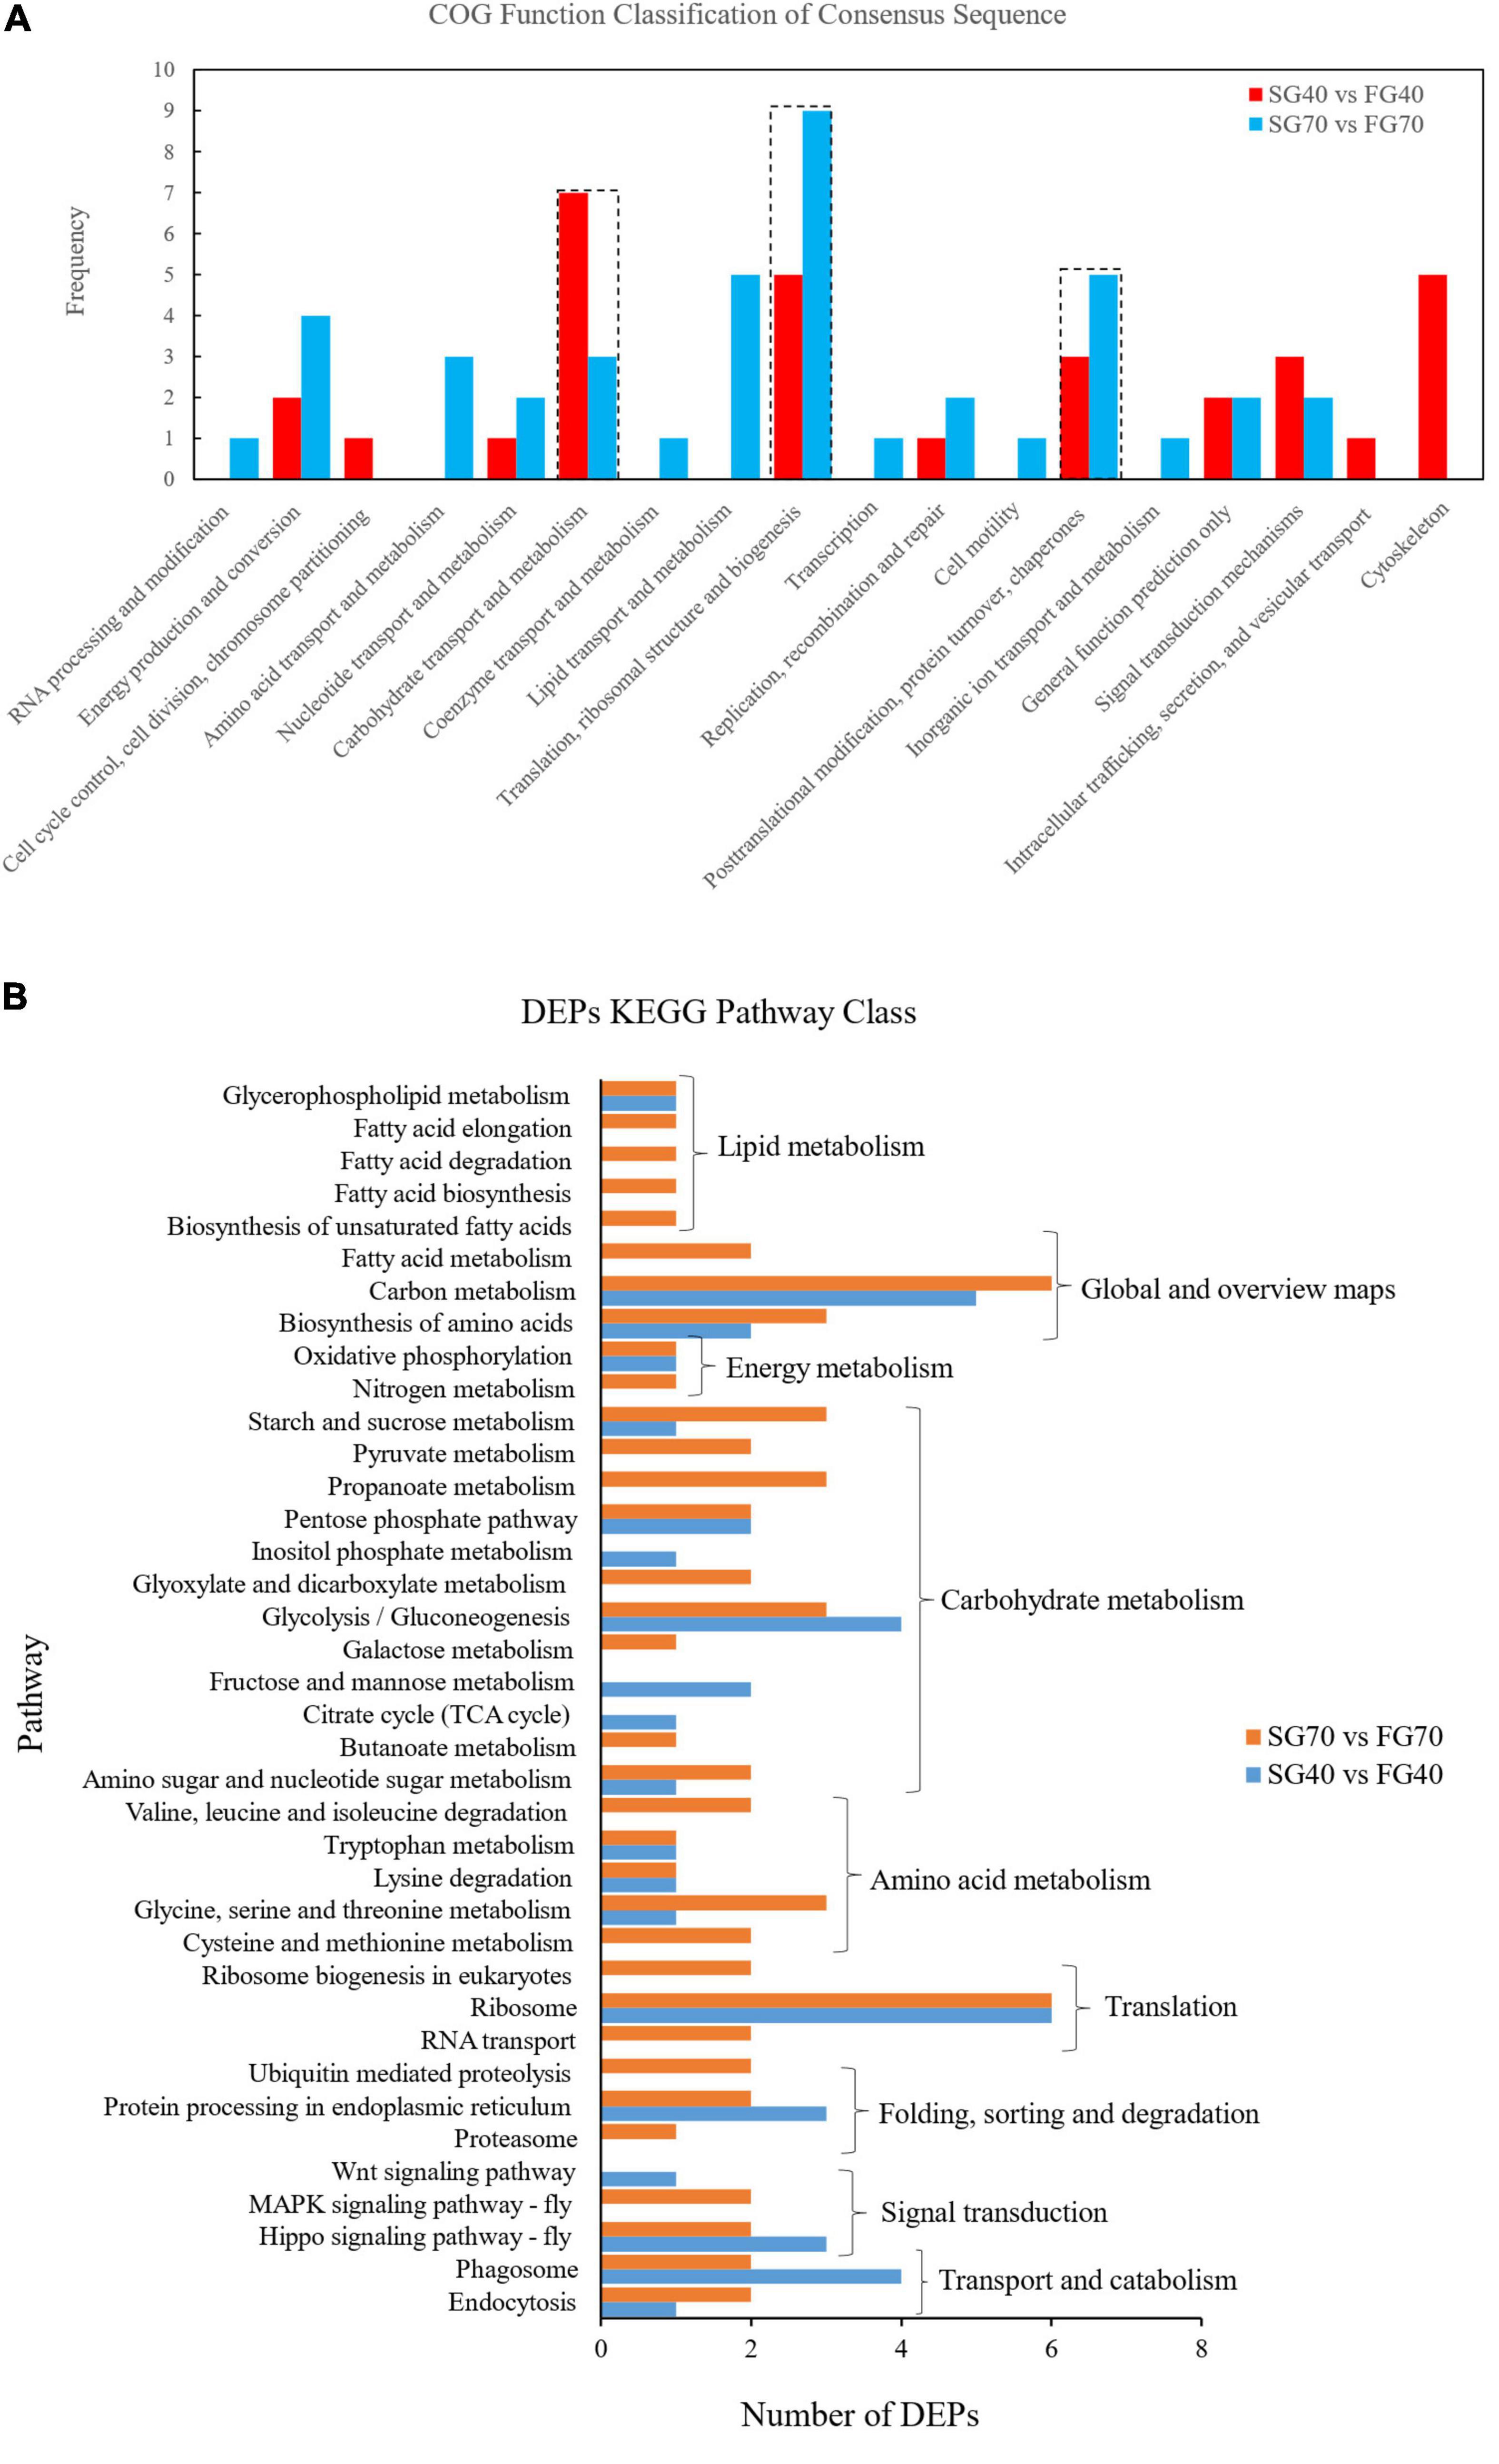
Figure 4. COG and KEGG analysis of the DEPs in M. japonicus. (A) COG analysis and (B) KEGG analysis.
Potential Pathways and Genes Related to Unsynchronized Growth
The Hippo signaling pathway is an essential regulator of cell proliferation and apoptosis during development. In this study, we identified some key genes of the Hippo signaling pathway in M. japonicus. As mentioned above, 14-3-3-epsilon-like was downregulated in the fast growth group at both growth stages (Figure 5B), whereas two types of actin1 were upregulated in the fast growth group at the fast growth stage (Figure 5B). In addition, the Hippo signaling pathway had an impact on the downstream pathways. Calcineurin subunit A (CaN) in the Wnt signaling pathway was also upregulated in the fast growth group at the fast growth stage (Figure 5C), and eukaryotic translation initiation factor 5-like (eIF5-like) in the apoptosis pathway was downregulated in the fast growth group at the steady growth stage (Figure 5D). The regulatory network centered on the Hippo signaling pathway, which showed a great impact on muscle growth (Figure 5A).
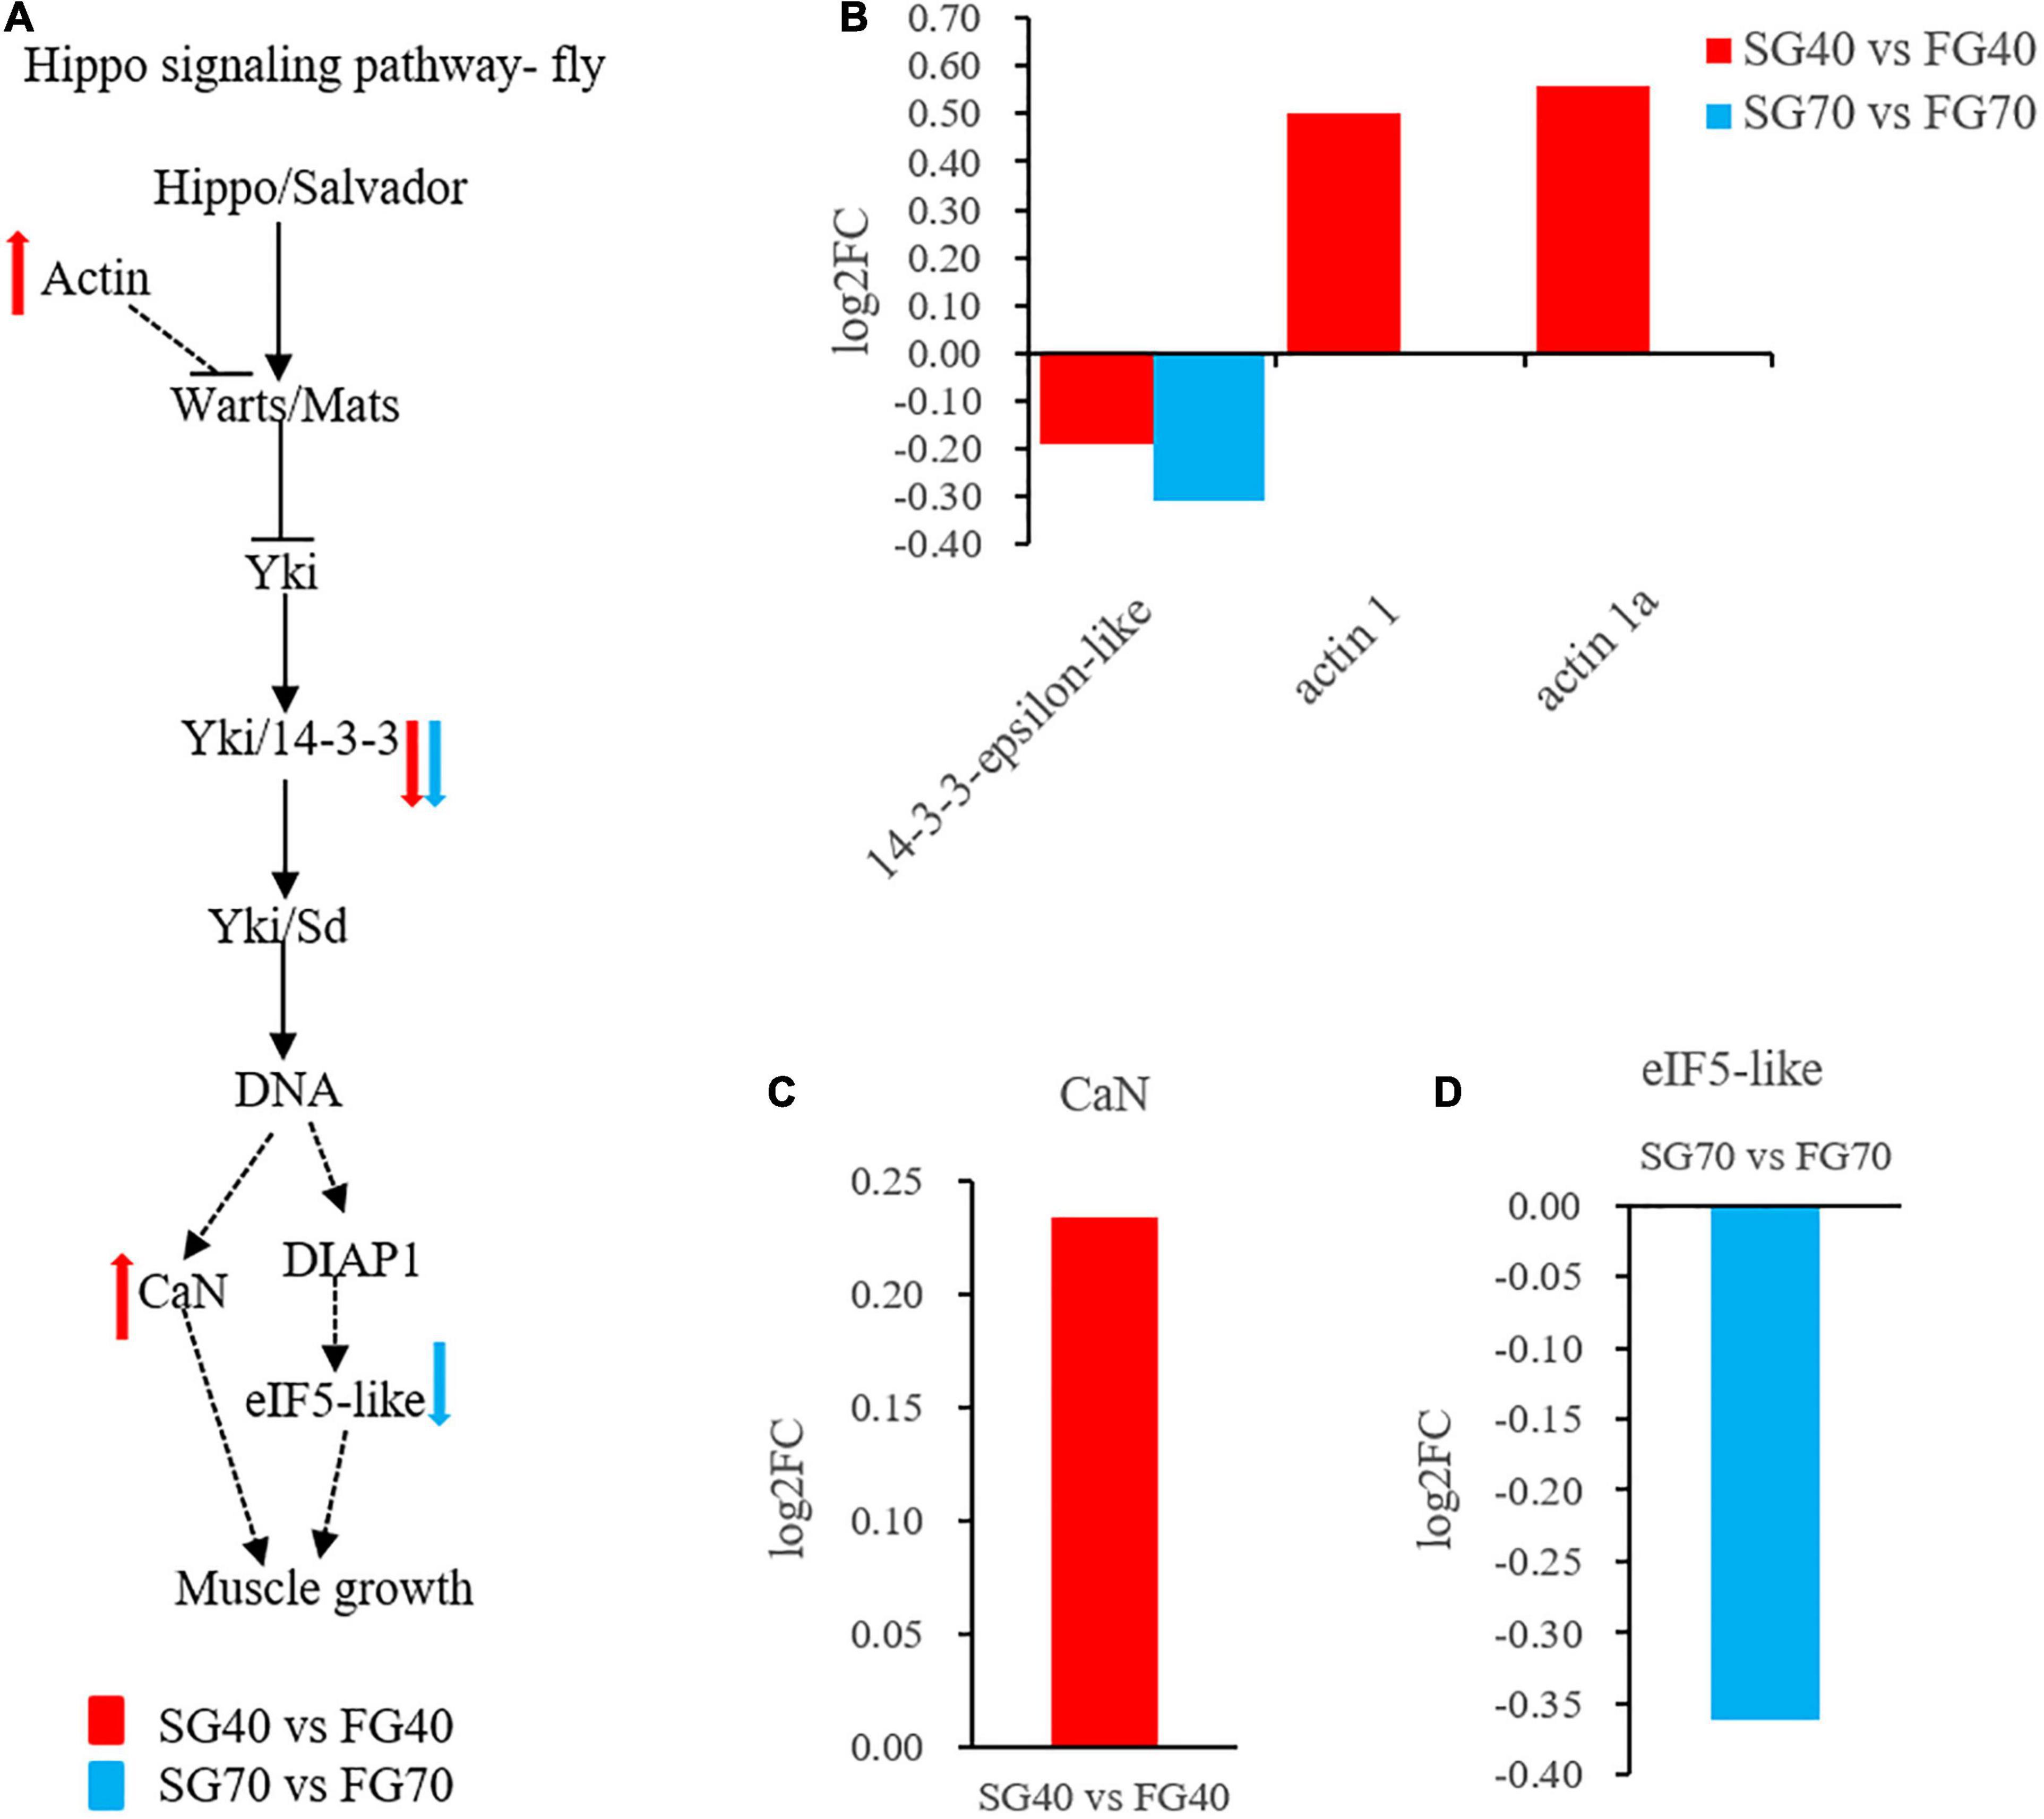
Figure 5. The Hippo signaling pathway regulates the growth of M. japonicus. (A) Hippo signaling pathway network regulation diagram; (B) DEPs expression in Hippo signaling pathway; (C) DEP expression in Wnt signaling pathway; and (D) DEP expression in apoptosis.
Glycolysis plays a central role in the anabolism and catabolism of organisms and provides intermediates for other metabolic pathways and energy for life activities. In this study, both the SG40 vs. FG40 and SG70 vs. FG70 comparison groups had 3 DEPs enriched in this pathway. Among these DEPs, GPI was shared by the two comparison groups (Figure 6B). Except for phosphoglucomutase (PGM), GPI, 2,3-bisphosphoglycerate-dependent phosphoglycerate mutase (PGAM) and triosephosphate isomerase (TPI) in SG 40 vs. FG 40, and GPI and pyruvate kinase 3 (PK3) in SG 70 vs. FG 70, were upregulated in the fast growth group (Figure 6B). In addition, a variety of metabolic pathways related to glycolysis were affected. Fructose 1,6-bisphosphatase (FBP) in the gluconeogenesis (Figure 6C), GPD1 in the glycerophospholipid metabolism pathway (Figure 6D) and 2-oxoglutarate dehydrogenase (OGDH) in the citrate cycle were all upregulated in the fast growth group (Figure 6E). These pathways and glycolysis form a complex energy conversion network (Figure 6A).
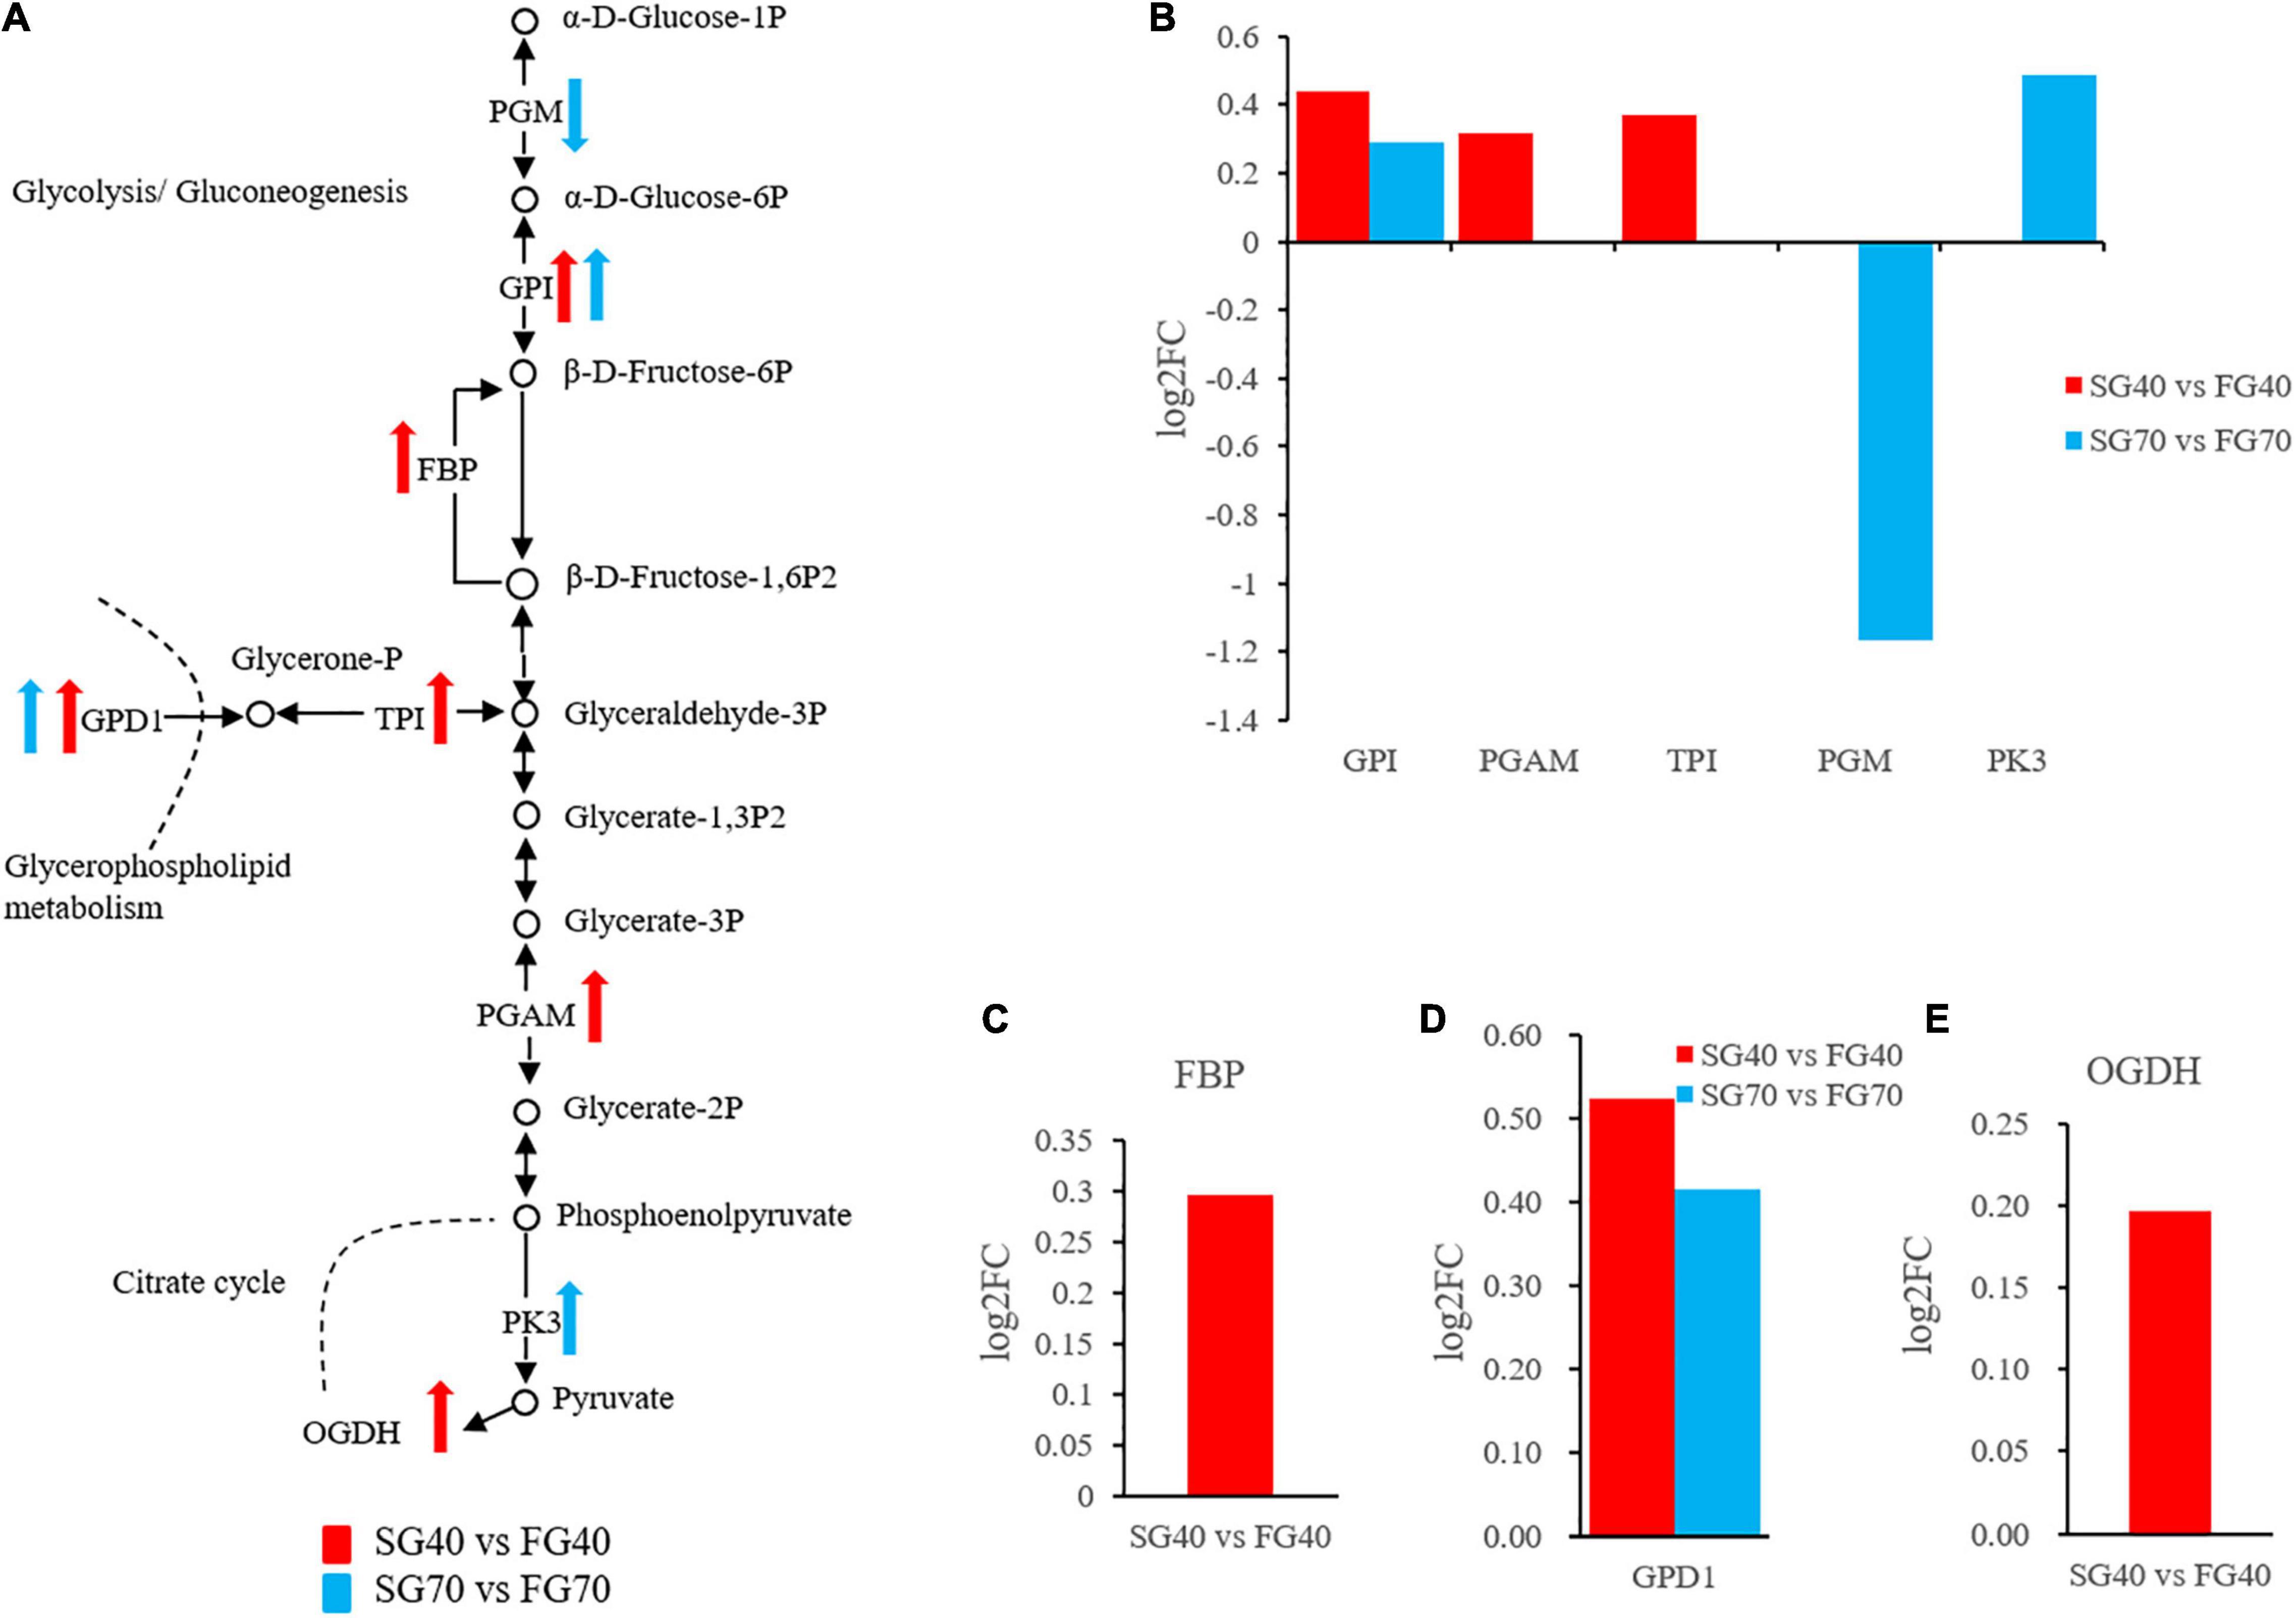
Figure 6. The glycolytic pathway regulates the growth of M. japonicus. (A) Glycolytic network regulation diagram; (B) DEPs expression in glycolysis; (C) DEP expression in gluconeogenesis; (D) DEP expression in glycerophospholipid metabolism; and (E) DEP expression in citrate cycle.
Quantitative Real-Time PCR Validation
MHC-1a and MHC-1b were verified by qPCR, and the qPCR results were consistent with the proteomic analysis results (Figure 7). MHCs are related to the growth of crustaceans (Jung et al., 2013). Compared with other MHCs identified in this study, the expression levels of MHC-1a and MHC-1b in the fast growth group were lower than those in the slow growth group during both the fast growth stage and steady growth stage.
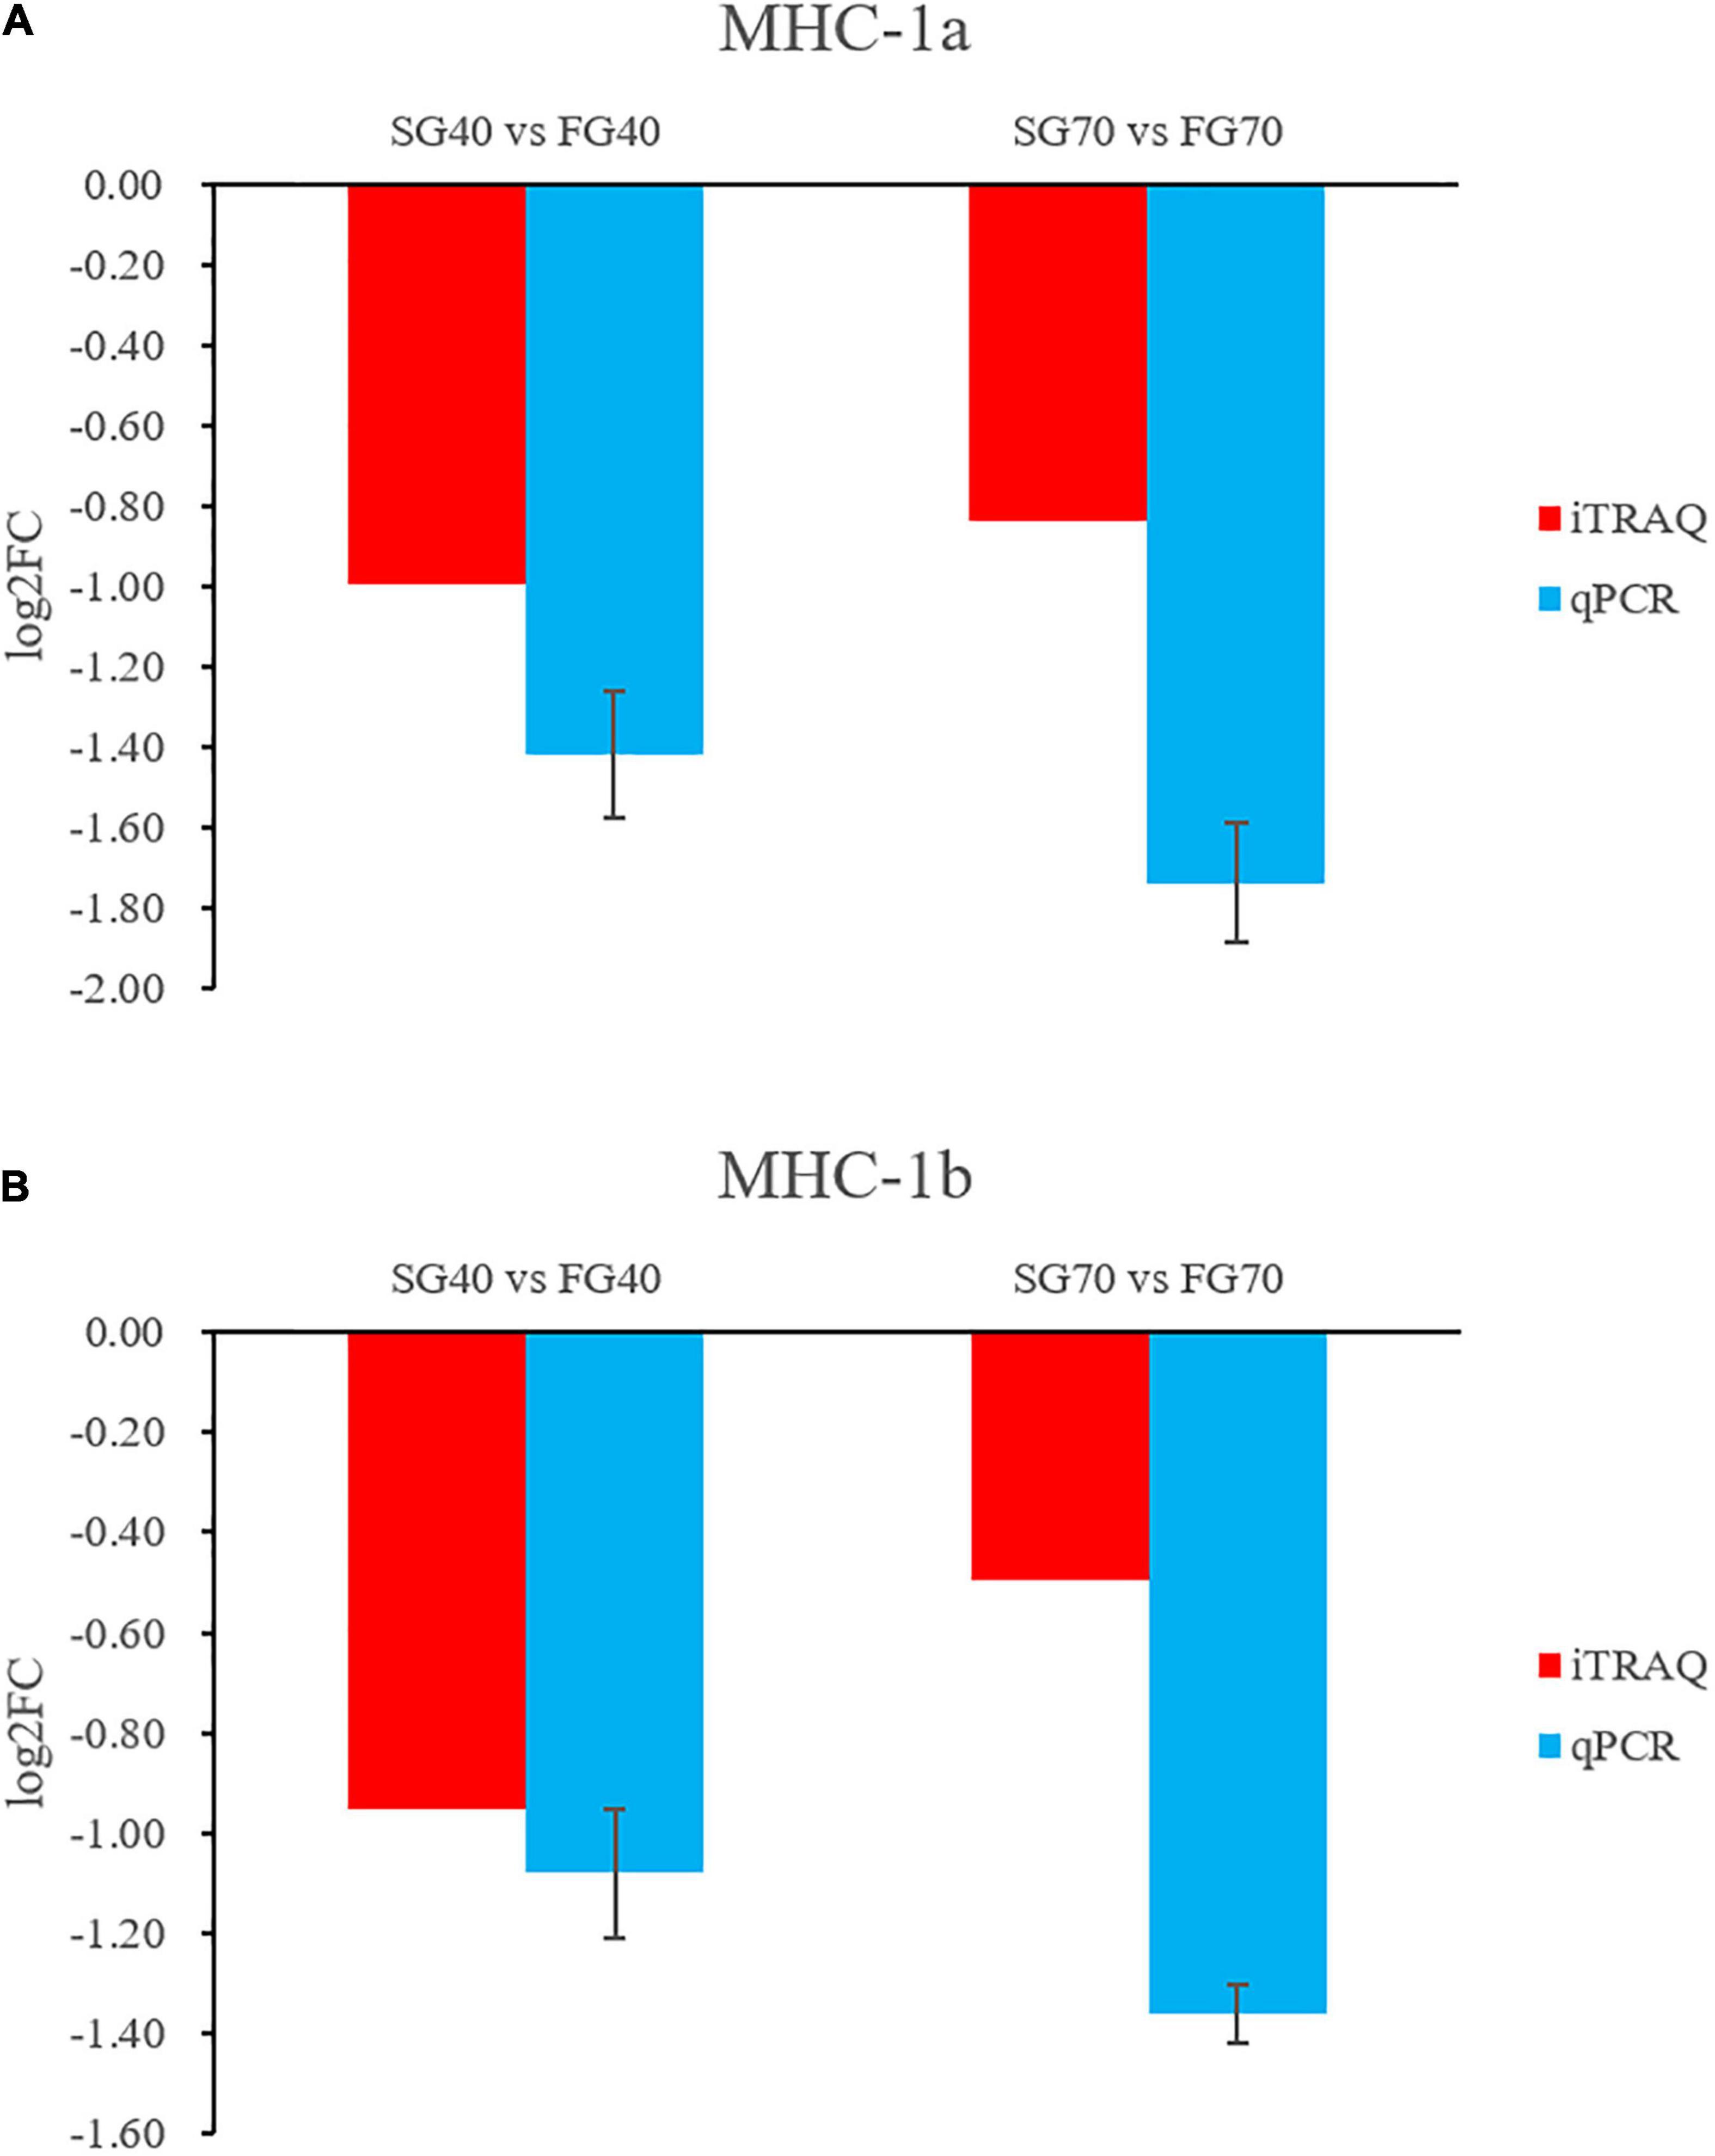
Figure 7. Verification of MHC-1a and MHC-1b by qPCR.
Discussion
In this study, a comparative proteomic analysis of M. japonicus between fast growth group and slow growth group in both fast growth stage and steady growth stage by iTRAQ was conducted. The study identified some proteins related to growth, Hippo signaling pathway or metabolic pathways potentially impact unsynchronized growth of M. japonicus, which is the first report on identification and quantification of proteins on this topic with the iTRAQ method.
The proteins involved in unsynchronized growth mechanism of M. japonicus in both fast growth stage and steady growth stages were consistent. Sixteen pathways related to lipid metabolism, global and overview maps, energy metabolism, carbohydrate metabolism, amino acid metabolism, translation, folding, sorting and degradation, signal transduction, and transport and catabolism, were shared by the two different growth stages. The data revealed that individual growth differences were the results of the continuously development of these physiological activities. Among these proteins, 10 DEPs showed consistent expression tendency in both fast and slow growth stages, which are more likely to weigh in and regulate the growth of M. japonicus. Further analysis concentrating on these 10 DEPs led us to identify a Hippo signaling pathway.
Hippo signaling pathway is a signaling pathway that controls organ size in animals through the regulation of cell proliferation and apoptosis (Tapon et al., 2002; Harvey et al., 2003; Jia et al., 2003; Pantalacci et al., 2003; Thompson and Cohen, 2006). A three-step kinase cascade trigger the center reactions in the Hippo signaling pathway and a transcriptional co-activator, Yorkie (Yki) is the key effector for the kinase cascade. Yki can interact with transcription factors in the nucleus and lead to the transcriptional upregulation of a number of target genes (Wang et al., 2016; Liang et al., 2018). Cytoskeletal protein 14-3-3 is another protein that can interact with phosphorylated Yki and cause Yki being detained in the cytoplasm (Dong et al., 2007; Oh and Irvine, 2008). When 14-3-3 is inactivated, it enhances tissue overgrowth which was induced by Yki’s overexpression (Ren et al., 2010). Remarkably, a similar regulation was observed in our study. Shrimps with a low expression level of 14-3-3 (14-3-3-epsilon-like) presented growth superiority. The results confirmed that the Hippo signaling pathway influenced the growth in M. japonicus. The Hippo signaling pathway had an impact on downstream pathway genes. For example, gene CaN, which is related to cell proliferation (Chen et al., 2003) was upregulated in the fast growth group, and the gene eIF5-like related to cell apoptosis (Li et al., 2004) was downregulated. The data signals that the fast growth group of M. japonicus achieved a growth superiority by promoting cell growth and inhibiting cell apoptosis through the Hippo signaling pathway.
Another notable finding is that almost all the differentially expressed glycolytic proteins (GPI, PGAM, TPI, PGM, PK3) were upregulated in the muscle of fast growth group of M. japonicus, which indicates that glycolysis assists in the growth superiority of M. japonicus. Glycolysis is related to muscle development. Mutation of glycolytic genes can lead to different muscle disease (García et al., 2009; Tixier et al., 2013). In return, muscle diseases can also result in glycolytic enzyme activity decrease and glycogen accumulation (Sharma et al., 2003; Coley et al., 2012). In fishes, almost all glycolysis genes in muscles were found to be upregulated in hybrid groupers showing growth superiority (Sun et al., 2016).
In addition, FBP in gluconeogenesis, GPD1 in glycerophospholipid metabolism and OGDH in Citrate cycle may also promote growth superiority in M. japonicus, since all these proteins were upregulated in the fast growth group. The reason behind the activated metabolic pathways pointed to the interaction between the glycolysis and metabolic pathways: Certain metabolites in glycolysis also are intermediates in other anabolic pathways. Therefore, the activation of the glycolysis led to the activation of multiple metabolic pathways, including gluconeogenesis (Cohen, 2014), glycerophospholipid metabolism and Citrate cycle (Panchal et al., 2001; Sharma et al., 2005).
Furthermore, MHC-1a and MHC-1b inhibits growth superiority in M. japonicus, as they were downregulated in the fast growth group, confirmed by both proteomics and qPCR methods. Our data verified a previous study on a 60-day-old Siniperca chuatsi (Chen et al., 2017). MHC contributes to muscle growth. There are studies showing that the expression of MHC correlates with the growth rate of vertebrates (Dhillon et al., 2008; Churova et al., 2015; Overturf and Hardy, 2015). In crustaceans, the expression of myosin and actin correlated with both abdominal and skeletal muscle morphology changes and biochemical composition changes in different molt stages (Medler, 2003; Cesar et al., 2006). During myogenesis, MHC binds firmly to muscle precursor cells to promote muscle development (Kreissl et al., 2008; Harzsch and Kreissl, 2010; Jirikowski et al., 2010). MHC is a large family including many members with different functions, so how to further characterize MHC-1a and MHC-1b’s functions related to the growth of M. japonicus will be an excited topic for future studies.
Conclusion
In conclusion, the present study for the first time investigated the mechanism of unsynchronized growth in shrimp by iTRAQ proteomics analysis. In our study, we analyzed DEPs between the fast growth group and slow growth group in different growth stages in M. japonicus and identified 10 key DEPs, including 14-3-3-epsilon-like, GPI, GPD1, MHC-1a and MHC-1b could impact M. japonicus’s growth. The shrimp M. japonicus can achieve a growth superiority by activating one or more pathways, such as Hippo signaling pathway and metabolic pathways with glycolysis. Our study provides a new perspective for understanding the mechanism of unsynchronized growth of crustacean species.
Data Availability Statement
The original contributions presented in the study are publicly available. This data can be found here: ProteomeXchange Consortium (http://proteomecentral.proteomexchange.org) via the iProX partner repository with the dataset identifier PXD028033.
Author Contributions
JZ, CS, and ZN conceived and designed the study. JZ performed the experiments, analyzed the data, and wrote the manuscript. ML, ZL, YH, YZ, LL, and GC assisted the experiments. CS and ZN revised the manuscript. All authors contributed to the article and approved the submitted version.
Funding
This study was funded by the R&D Program of Key Areas in Guangdong Province (#2020B0202010009), and the 2019 Annual Guangdong Provincial Special Financial Fund (#2319412525).
Conflict of Interest
GC was employed by Guangdong Haimao Investment Co., Ltd.
The remaining authors declare that the research was conducted in the absence of any commercial or financial relationships that could be construed as a potential conflict of interest.
Publisher’s Note
All claims expressed in this article are solely those of the authors and do not necessarily represent those of their affiliated organizations, or those of the publisher, the editors and the reviewers. Any product that may be evaluated in this article, or claim that may be made by its manufacturer, is not guaranteed or endorsed by the publisher.
Supplementary Material
The Supplementary Material for this article can be found online at: https://www.frontiersin.org/articles/10.3389/fmars.2021.761103/full#supplementary-material
Footnotes
References
Cesar, J. R. D., Zhao, B. Q., Malecha, S., Ako, H., and Yang, J. Z. (2006). Morphological and biochemical changes in the muscle of the marine shrimp Litopenaeus vannamei during the molt cycle. Aquaculture 261, 688–694. doi: 10.1016/j.aquaculture.2006.08.003
Chan, S. M., Rankin, S. M., and Keeley, R. L. L. (1988). Characterization of the molt stages in Penaeus vannamei: Setogenesis and hemolymph levels of total protein, ecdysteroids, and glucose. Biolog. Bulletin. 175, 185–192. doi: 10.2307/1541558
Chen, Y. H., Zhao, M. W., Fu, M. G., Yao, W. Z., and Tang, C. S. (2003). The role of calcineurin in the lung fibroblasts proliferation and collagen synthesis induced by basic fibroblast growth factor. Chinese Med. J-Peking. 116, 857–862.
Chen, Z., Dong, J., Sun, C., Tian, Y., and Xing, Y. E. (2017). cDNA Cloning and analyses of two myosin heavy chain isoforms of mandarin fish (Siniperca chuatsi) based on transcriptome sequencing. Prog. Fish. Sci. 38, 51–61.
Cheng, F., Xiang, C., Zhang, X. J., Liu, Z. Q., and Zheng, Y. G. (2018). ReToAd: simple method for the rapid replacement of promoters to improve protein production. Biotechnol. Lett. 40, 957–964. doi: 10.1007/s10529-018-2541-4
Churova, M. V., Meshcheryakova, O. V., Veselov, A. E., and Nemova, N. N. (2015). Activity of enzymes involved in the energy and carbohydrate metabolism and the level of some molecular-genetic characteristics in young salmons (Salmo salar L.) with different age and weight. Ontogenez 46:304. doi: 10.1134/S1062360415050021
Cohen, G. N. (2014). Glycolysis, Gluconeogenesis and Glycogen and Cellulose Synthesis. Netherlands: Springer. doi: 10.1007/978-94-017-8908-0_6
Coley, W., Rayavarapu, S., Pandey, G. S., Sabina, R. L., and Nagaraju, K. (2012). The molecular basis of skeletal muscle weakness in a mouse model of inflammatory myopathy. Arthritis Rheumatol. 64, 3750–3759. doi: 10.1002/art.34625
Dhillon, R. S., Wang, Y., and Tufts, B. L. (2008). Using molecular tools to assess muscle growth in fish: Applications for aquaculture and fisheries management. Compar. Biochem. Physiol. Part C. 148:452. doi: 10.1016/j.cbpc.2008.10.020
Dong, J. X., Feldmann, G., Huang, J. B., Wu, S., Zhang, N. L., Comerford, S. A., et al. (2007). Elucidation of a universal size-control mechanism in Drosophila and mammals. Cell 130, 1120–1133. doi: 10.1016/j.cell.2007.07.019
García, M., Pujol, A., Ruzo, A., Riu, E., Ruberte, J., Arbós, A., et al. (2009). Phosphofructo-1-Kinase deficiency leads to a severe cardiac and hematological disorder in addition to skeletal muscle glycogenosis. PLoS Genet. 5:e1000615. doi: 10.1371/journal.pgen.1000615
Hao, R. J., Du, X. D., Yang, C. Y., Deng, Y. W., Zheng, Z., and Wang, Q. H. (2019). Integrated application of transcriptomics and metabolomics provides insights into unsynchronized growth in pearl oyster Pinctada fucata smartensii. Sci. Total Environ. 666, 46–56. doi: 10.1016/j.scitotenv.2019.02.221
Harvey, K. F., Pfleger, C. M., and Hariharan, I. K. (2003). The Drosophila Mst ortholog, hippo, restricts growth and cell proliferation and promotes apoptosis. Cell 114, 457–467. doi: 10.1016/S0092-8674(03)00557-9
Harzsch, S., and Kreissl, S. (2010). Myogenesis in the thoracic limbs of the American lobster. Arthropod Struct Dev. 39, 423–435. doi: 10.1016/j.asd.2010.06.001
Jia, J. H., Zhang, W. S., Wang, B., Trinko, R., and Jiang, J. (2003). The Drosophila Ste20 family kinase dMST functions as a tumor suppressor by restricting cell proliferation and promoting apoptosis. Gene Dev. 17, 2514–2519. doi: 10.1101/gad.1134003
Jiang, J. P., Yuan, X., Huang, G. H., Shi, W., Yang, X. M., Jiang, Q. Y., et al. (2020). Hepatopancreatic metabolomics shedding light on the mechanism underlying unsynchronized growth in giant freshwater prawn, Macrobrachium rosenbergii. PLoS One 2020:15. doi: 10.1371/journal.pone.0243778
Jirikowski, G., Kreissl, S., Richter, S., and Wolff, C. (2010). Muscle development in the marbled crayfish—insights from an emerging model organism (Crustacea, Malacostraca, Decapoda). Dev. Genes Evol. 220:89. doi: 10.1007/s00427-010-0331-7
Jung, H., Lyons, R. E., Hurwood, D. A., and Mather, P. B. (2013). Genes and growth performance in crustacean species: a review of relevant genomic studies in crustaceans and other taxa. Rev. Aquacult. 5, 77–110. doi: 10.1111/raq.12005
Kreissl, S., Uber, A., and Harzsch, S. (2008). Muscle precursor cells in the developing limbs of two isopods (Crustacea, Peracarida): an immunohistochemical study using a novel monoclonal antibody against myosin heavy chain. Dev. Genes Evol. 218, 253–265. doi: 10.1007/s00427-008-0216-1
Li, A. L., Li, H. Y., Jin, B. F., Ye, Q. N., Zhou, T., Yu, X. D., et al. (2004). A novel eIF5A complex functions as a regulator of p53 and p53-dependent apoptosis. J. Biol. Chem. 279, 49251–49258. doi: 10.1074/jbc.M407165200
Liang, H., Lau, Y., Zhou, T. T., Li, X., Li, B., and Chan, S. F. (2017). Molecular characterization, RNA interference and recombinant protein approach to study the function of the putative Molt Inhibiting Hormone (FmMIH1) gene from the shrimp Fenneropenaeus merguiensis. Peptides. 122:169854. doi: 10.1016/j.peptides.2017.10.017
Liang, Z., Lu, Y. H., Qian, Y., Zhu, L. Y., Kuang, S. L., Chen, F., et al. (2018). Cultured cells and wing disc size of silkworm can be controlled by the Hippo pathway. Open Biol. 8:180029. doi: 10.1098/rsob.180029
Lin, J. L., Shi, X., Fang, S. B., Zhang, Y., You, C. H., Ma, H. Y., et al. (2019). Comparative transcriptome analysis combining SMRT and NGS sequencing provides novel insights into sex differentiation and development in mud crab (Scylla paramamosain). Aquaculture 513, 1–11. doi: 10.1016/j.aquaculture.2019.734447
Liu, J. H., Zheng, J. J., and Liu, J. Y. (2019). Genetic parameters for growth-related traits and survival with age in the Kuruma shrimp Marsupenaeus japonicus. Aquac. Res. 50, 42–48. doi: 10.1111/are.13862
Lv, J. J., Zhang, D. N., Gao, B. Q., Liu, P., and Li, J. (2015). Transcriptome and MassARRAY analysis for identification of transcripts and SNPs for growth traits of the swimming crab Portunus trituberculatus. Gene. 566, 229–235. doi: 10.1016/j.gene.2015.04.050
Maier, T., Guell, M., and Serrano, L. (2009). Correlation of mRNA and protein in complex biological samples. Febs Lett. 583, 3966–3973. doi: 10.1016/j.febslet.2009.10.036
Medler, S. (2003). Analysis of myofibrillar proteins and transcripts in adult skeletal muscles of the American lobster Homarus americanus: variable expression of myosins, actin and troponins in fast, slow-twitch and slow-tonic fibres. J. Exp. Biol. 206:3557. doi: 10.1242/jeb.00587
Oh, H., and Irvine, K. D. (2008). In vivo regulation of Yorkie phosphorylation and localization. Development 135, 1081–1088. doi: 10.1242/dev.015255
Overturf, K., and Hardy, R. W. (2015). Myosin expression levels in trout muscle: a new method for monitoring specific growth rates for rainbow trout Oncorhynchus mykiss (Walbaum) on varied planes of nutrition. Aquac. Res. 32, 315–322. doi: 10.1046/j.1365-2109.2001.00582.x
Panchal, A. R., Comte, B., Huang, H., Dudar, B., and Stanley, W. C. (2001). Acute hibernation decreases myocardial pyruvate carboxylation and citrate release. Am. J. Physiol. Heart Circulat. Physiol. 281:H1613. doi: 10.1152/ajpheart.2001.281.4.H1613
Pantalacci, S., Tapon, N., and Leopold, P. (2003). The Salvador partner Hippo promotes apoptosis and cell-cycle exit in Drosophila. Nat. Cell Biol. 5, 921–927. doi: 10.1038/ncb1051
Qiao, Y., Wang, J., Mao, Y., Liu, M., Song, X. H., Su, Y. Q., et al. (2017). Identification and molecular characterization of Cathepsin L gene and its expression analysis during early ontogenetic development of kuruma shrimp Marsupenaeus japonicus. Acta Oceanol. Sin. 36, 52–60. doi: 10.1007/s13131-017-0983-5
Ren, F. F., Zhang, L., and Jiang, J. (2010). Hippo signaling regulates Yorkie nuclear localization and activity through 14-3-3 dependent and independent mechanisms. Dev. Biol. 337, 303–312. doi: 10.1016/j.ydbio.2009.10.046
Ren, X. Y., Yu, X., Gao, B. Q., Li, J., and Liu, P. (2017). iTRAQ-based identification of differentially expressed proteins related to growth in the swimming crab, Portunus trituberculatus. Aquac. Res. 48, 3257–3267. doi: 10.1111/are.13155
Sellars, M. J., Vuocolo, T., Leeton, L. A., Coman, G. J., Degnan, B. M., and Preston, N. P. (2007). Real-time RT-PCR quantification of Kuruma shrimp transcripts: A comparison of relative and absolute quantification procedures. J. Biotechnol. 129, 391–399. doi: 10.1016/j.jbiotec.2007.01.029
Sharma, N., Okere, I. C., Brunengraber, D. Z., McElfresh, T. A., King, K. L., Sterk, J. P., et al. (2005). Regulation of pyruvate dehydrogenase activity and citric acid cycle intermediates during high cardiac power generation. J. Physiol-London. 562, 593–603. doi: 10.1113/jphysiol.2004.075713
Sharma, U., Atri, S., Sharma, M. C., Sarkar, C., and Jagannathan, N. R. (2003). Skeletal muscle metabolism in Duchenne muscular dystrophy (DMD): an in-vitro proton NMR spectroscopy study. Magn. Reson. Imaging 21, 145–153. doi: 10.1016/S0730-725X(02)00646-X
Sun, Y., Huang, Y., Hu, G., Zhang, X., and Shi, Q. (2016). Comparative transcriptomic study of muscle provides new insights into the growth superiority of a novel grouper hybrid. PLoS One 2016:11.
Tapon, N., Harvey, K. F., Bell, D. W., Wahrer, D. C. R., Schiripo, T. A., Haber, D. A., et al. (2002). salvador promotes both cell cycle exit and apoptosis in Drosophila and is mutated in human cancer cell lines. Cell 110, 467–478. doi: 10.1016/S0092-8674(02)00824-3
Thompson, B. J., and Cohen, S. M. (2006). The hippo pathway regulates the bantam microRNA to control cell proliferation and apoptosis in Drosophila. Cell 126, 767–774. doi: 10.1016/j.cell.2006.07.013
Tixier, V., Bataille, L., Etard, C., Jagla, T., Weger, M., Daponte, J. P., et al. (2013). Glycolysis supports embryonic muscle growth by promoting myoblast fusion. P. Natl. Acad. Sci. USA. 110, 18982–18987. doi: 10.1073/pnas.1301262110
Uengwetwanit, T., Uawisetwathana, U., Arayamethakorn, S., Khudet, J., Chaiyapechara, S., Karoonuthaisiri, N., et al. (2020). Multi-omics analysis to examine microbiota, host gene expression and metabolites in the intestine of black tiger shrimp (Penaeus monodon) with different growth performance. Peerj. 8, e9646–e9646. doi: 10.7717/peerj.9646
Vandesompele, J., De Preter, K., Pattyn, F., Poppe, B., Van Roy, N., De Paepe, A., et al. (2002). Accurate normalization of real-time quantitative RT-PCR data by geometric averaging of multiple internal control genes. Genome Biol. 3, 467–470. doi: 10.1186/gb-2002-3-7-research0034
Wang, P. P., Chen, B. H., Zheng, J. B., Cheng, W. Z., Zhang, H. Q., Wang, J., et al. (2020). Fine-scale population genetic structure and parapatric cryptic species of kuruma shrimp (Marsupenaeus japonicus), along the northwestern pacific coast of China. Front. Genet. 11, 1–12. doi: 10.3389/fgene.2020.00118
Wang, S. M., Lu, Y., Yin, M. X., Wang, C., Wu, W., Li, J. H., et al. (2016). Importin 1 mediates Yorkie nuclear import via an N-terminal non-canonical nuclear localization signal. J. Biol. Chem. 291, 7926–7937. doi: 10.1074/jbc.M115.700823
Wang, W. L., Ishikawa, M., Koshio, S., Yokoyama, S., Hossain, M. S., and Moss, A. S. (2018). Effects of dietary astaxanthin supplementation on juvenile kuruma shrimp, Marsupenaeus japonicus. Aquaculture 491, 197–204. doi: 10.1016/j.aquaculture.2018.03.025
Xu, C., Li, E. C., Liu, Y., Wang, X. D., Qin, J. G., and Chen, L. Q. (2017). Comparative proteome analysis of the hepatopancreas from the Pacific white shrimp Litopenaeus vannamei under long-term low salinity stress. J. Proteomics. 162, 1–10. doi: 10.1016/j.jprot.2017.04.013
Zhang, Y., Xu, P., Li, W., and Tao, Y. (2014). Advances in actinobacterial proteomics. Chin. J. Biotechnol. 30, 1044–1058. doi: 10.1007/s40242-014-4247-z
Keywords: Marsupenaeus japonicus, unsynchronized growth, proteomics, growth biomarkers, molecular mechanism
Citation: Zhao J, Liao M, Lin Z, Huang Y, Zhong Y, Liu L, Chen G, Ni Z and Sun C (2021) Isobaric Tags for Relative and Absolute Quantitation-Based Proteomics Analysis Provides a New Perspective Into Unsynchronized Growth in Kuruma Shrimp (Marsupenaeus japonicus). Front. Mar. Sci. 8:761103. doi: 10.3389/fmars.2021.761103
Received: 19 August 2021; Accepted: 08 November 2021;
Published: 02 December 2021.
Edited by:
Huang Wei, Second Institute of Oceanography, ChinaReviewed by:
Denise Schrama, University of Algarve, PortugalLuqing Pan, Ocean University of China, China
Dan Xu, Shanghai Ocean University, China
Copyright © 2021 Zhao, Liao, Lin, Huang, Zhong, Liu, Chen, Ni and Sun. This is an open-access article distributed under the terms of the Creative Commons Attribution License (CC BY). The use, distribution or reproduction in other forums is permitted, provided the original author(s) and the copyright owner(s) are credited and that the original publication in this journal is cited, in accordance with accepted academic practice. No use, distribution or reproduction is permitted which does not comply with these terms.
*Correspondence: Chengbo Sun, c3VuY2JAZ2RvdS5lZHUuY24=; Zuotao Ni, bml6dW90YW8wN0BxZGlvLmFjLmNu