 Di-an Fang
 Xiang-ping Xue1†
 Dong-po Xu
 Bai-dong Zhang
95% of researchers rate our articles as excellent or good
Learn more about the work of our research integrity team to safeguard the quality of each article we publish.
Find out more
ORIGINAL RESEARCH article
Front. Mar. Sci. , 16 December 2021
Sec. Marine Fisheries, Aquaculture and Living Resources
Volume 8 - 2021 | https://doi.org/10.3389/fmars.2021.759429
Estuary river–lake (ERL) complex is critical for the development of ichthyoplankton, which plays an essential role in the breeding, nursing, and recruitment of freshwater fish species. In this study, different ERL sections were selected to investigate the ichthyoplankton assemblage from the Changjiang River estuary to its Hukou section between May 2018 and August 2020. During the study period, fish larvae of 40, 35, 54, and 46 fish species were sampled in the Rugao (RG), Nanjing (NJ) (nearby estuary), Anqing (AQ), and Hukou (HK) (connected river–lake) sections in the Changjiang River, respectively. Results on ichthyoplankton surveys revealed fluctuating assemblage patterns in the different river sections; larval fish species composition presented ecological habitat-dependent characteristics, which supported the importance of ERL complex for ichthyoplankton development. Furthermore, the density of fish larvae was negatively correlated with water transparency but positively correlated with water temperature, the daily rate of water level increase, and runoff in the limitative range. A generalized additive model analysis indicated that the hydrological factors significantly affecting larval fish abundance are water temperature, transparency, the daily rate of water level increase, and runoff (p < 0.05). These results also indicated that river estuaries and river–lake connected complexes are essential for ichthyoplankton recruitment and migration. In combination with the historical record, ichthyoplankton assemblage’s patterns in the Changjiang River lower reaches were preliminarily elucidated, although additional works are needed such as assessing effects on their survival and recruitment.
The Changjiang River is the longest and also one of the most human-impacted large rivers in China (Zhou et al., 2015; Zhao et al., 2021). In general, the Changjiang River can be divided into three reaches, an upper reach above the Yichang section, a middle reach from the Yichang to the Hukou (HK) section, and a lower reach from the HK section to the East China Sea estuary (Hu et al., 2020; Zhang et al., 2020). The aquatic organisms and their habitats in the Changjiang River have been adversely affected by the continuous socioeconomic development over the last 50 years (Chen et al., 2017). Fishery sustainability and biodiversity conservation in the Changjiang River have faced great challenges, which include damming, isolation between lakes and rivers, construction of waterway channels, vessel navigation, water pollution, and overfishing (Fu et al., 2003; Tao et al., 2017; Liu et al., 2019; Gao et al., 2021). Based on recent survey results, the fish larvae resource of the dominant commercial fish species in the Changjiang River has been reduced sharply (Zhang et al., 2017). Renewal situations for pursuing natural resource sustainability and biodiversity conservation warrant considerable attention to achieve progress in addressing ecological issues (Bryan et al., 2018), especially for ichthyofauna in freshwater and estuarine habitats.
Ichthyoplankton data can provide a base of information for research involving major fish species population change (Vorsatz et al., 2021). The dispersal pattern of ichthyoplankton is affected by not only fish species traits such as adult fish spawning mode and larval fish duration but also different river features and various environmental factors (Mohammad et al., 2021). Larval fish also can serve as a sensitive indicator for monitoring potential recruitment effects of lakes, main river channels, and connected lake–river habitats (Amorim et al., 2017; Gao et al., 2018). In addition, information concerning ichthyoplankton ecology represents an important component of fish stock assessment and fisheries’ resource management practices (Borges et al., 2007).
However, data regarding larval fish assemblages in the lower reach of the Changjiang River are relatively limited, with the exception of some data pertaining to annual spatial and temporal assemblages for larval fish (Ren et al., 2016; Gao et al., 2018). Understanding the factors that determine the distribution and abundance of ichthyoplankton remains a major research component in fish ecology (Wu et al., 2019). The abundance, dispersal, distribution, and also identification of fish larvae have received considerable attention from researchers (Nagel et al., 2021). It is well known that the spatial distribution of larval fish assemblage is affected by many factors, such as water temperature, water flow, water turbidity, depth, physical and chemical indicators, and river dynamics (Fu et al., 2003; Song et al., 2019). Habitat variability can also lead to spatial pattern and temporal pattern differences in fish species distribution on both regional and geographical scales (Stacy-Duffy et al., 2021). For instance, some fish species undergo their entire life cycle in the same habitat, whereas others migrate between freshwater and marine environments to complete their life cycle (Medeiros et al., 2018). The spatial-temporal distribution of ichthyoplankton and the knowledge on how fish larvae respond to environmental variables are essential for obtaining a better understanding of the mechanism that controls the recruitment and complements adult fish populations (Saunders et al., 2002). Such data can also provide valuable insights into the development of appropriate management strategies (Tulloch et al., 2021). Thus, in this study, larval fish assemblages were investigated during the fish spawning season from the Changjiang River estuary to the HK section. The specific objectives of this study were to investigate the ichthyoplankton taxa and characterize their spatial–temporal distribution, further to clarify the relationship between larval fish changes and the associated environmental factors, and to verify the essential function of the ERL complex for fish larvae development.
Ichthyoplankton was sampled from the HK section to the river estuary, and sampling sites were set in four sections as follows (Figure 1): HK, Anqing (AQ), Nanjing (NJ), and Rugao (RG). Sampling sites were selected to ensure that they typified each of the four designated sections in terms of the early life histories (Cao et al., 2007). Three sampling sites were designated in each section: the right bank (R), the left bank (L), and the middle (M) (magnified graph in Figure 1).
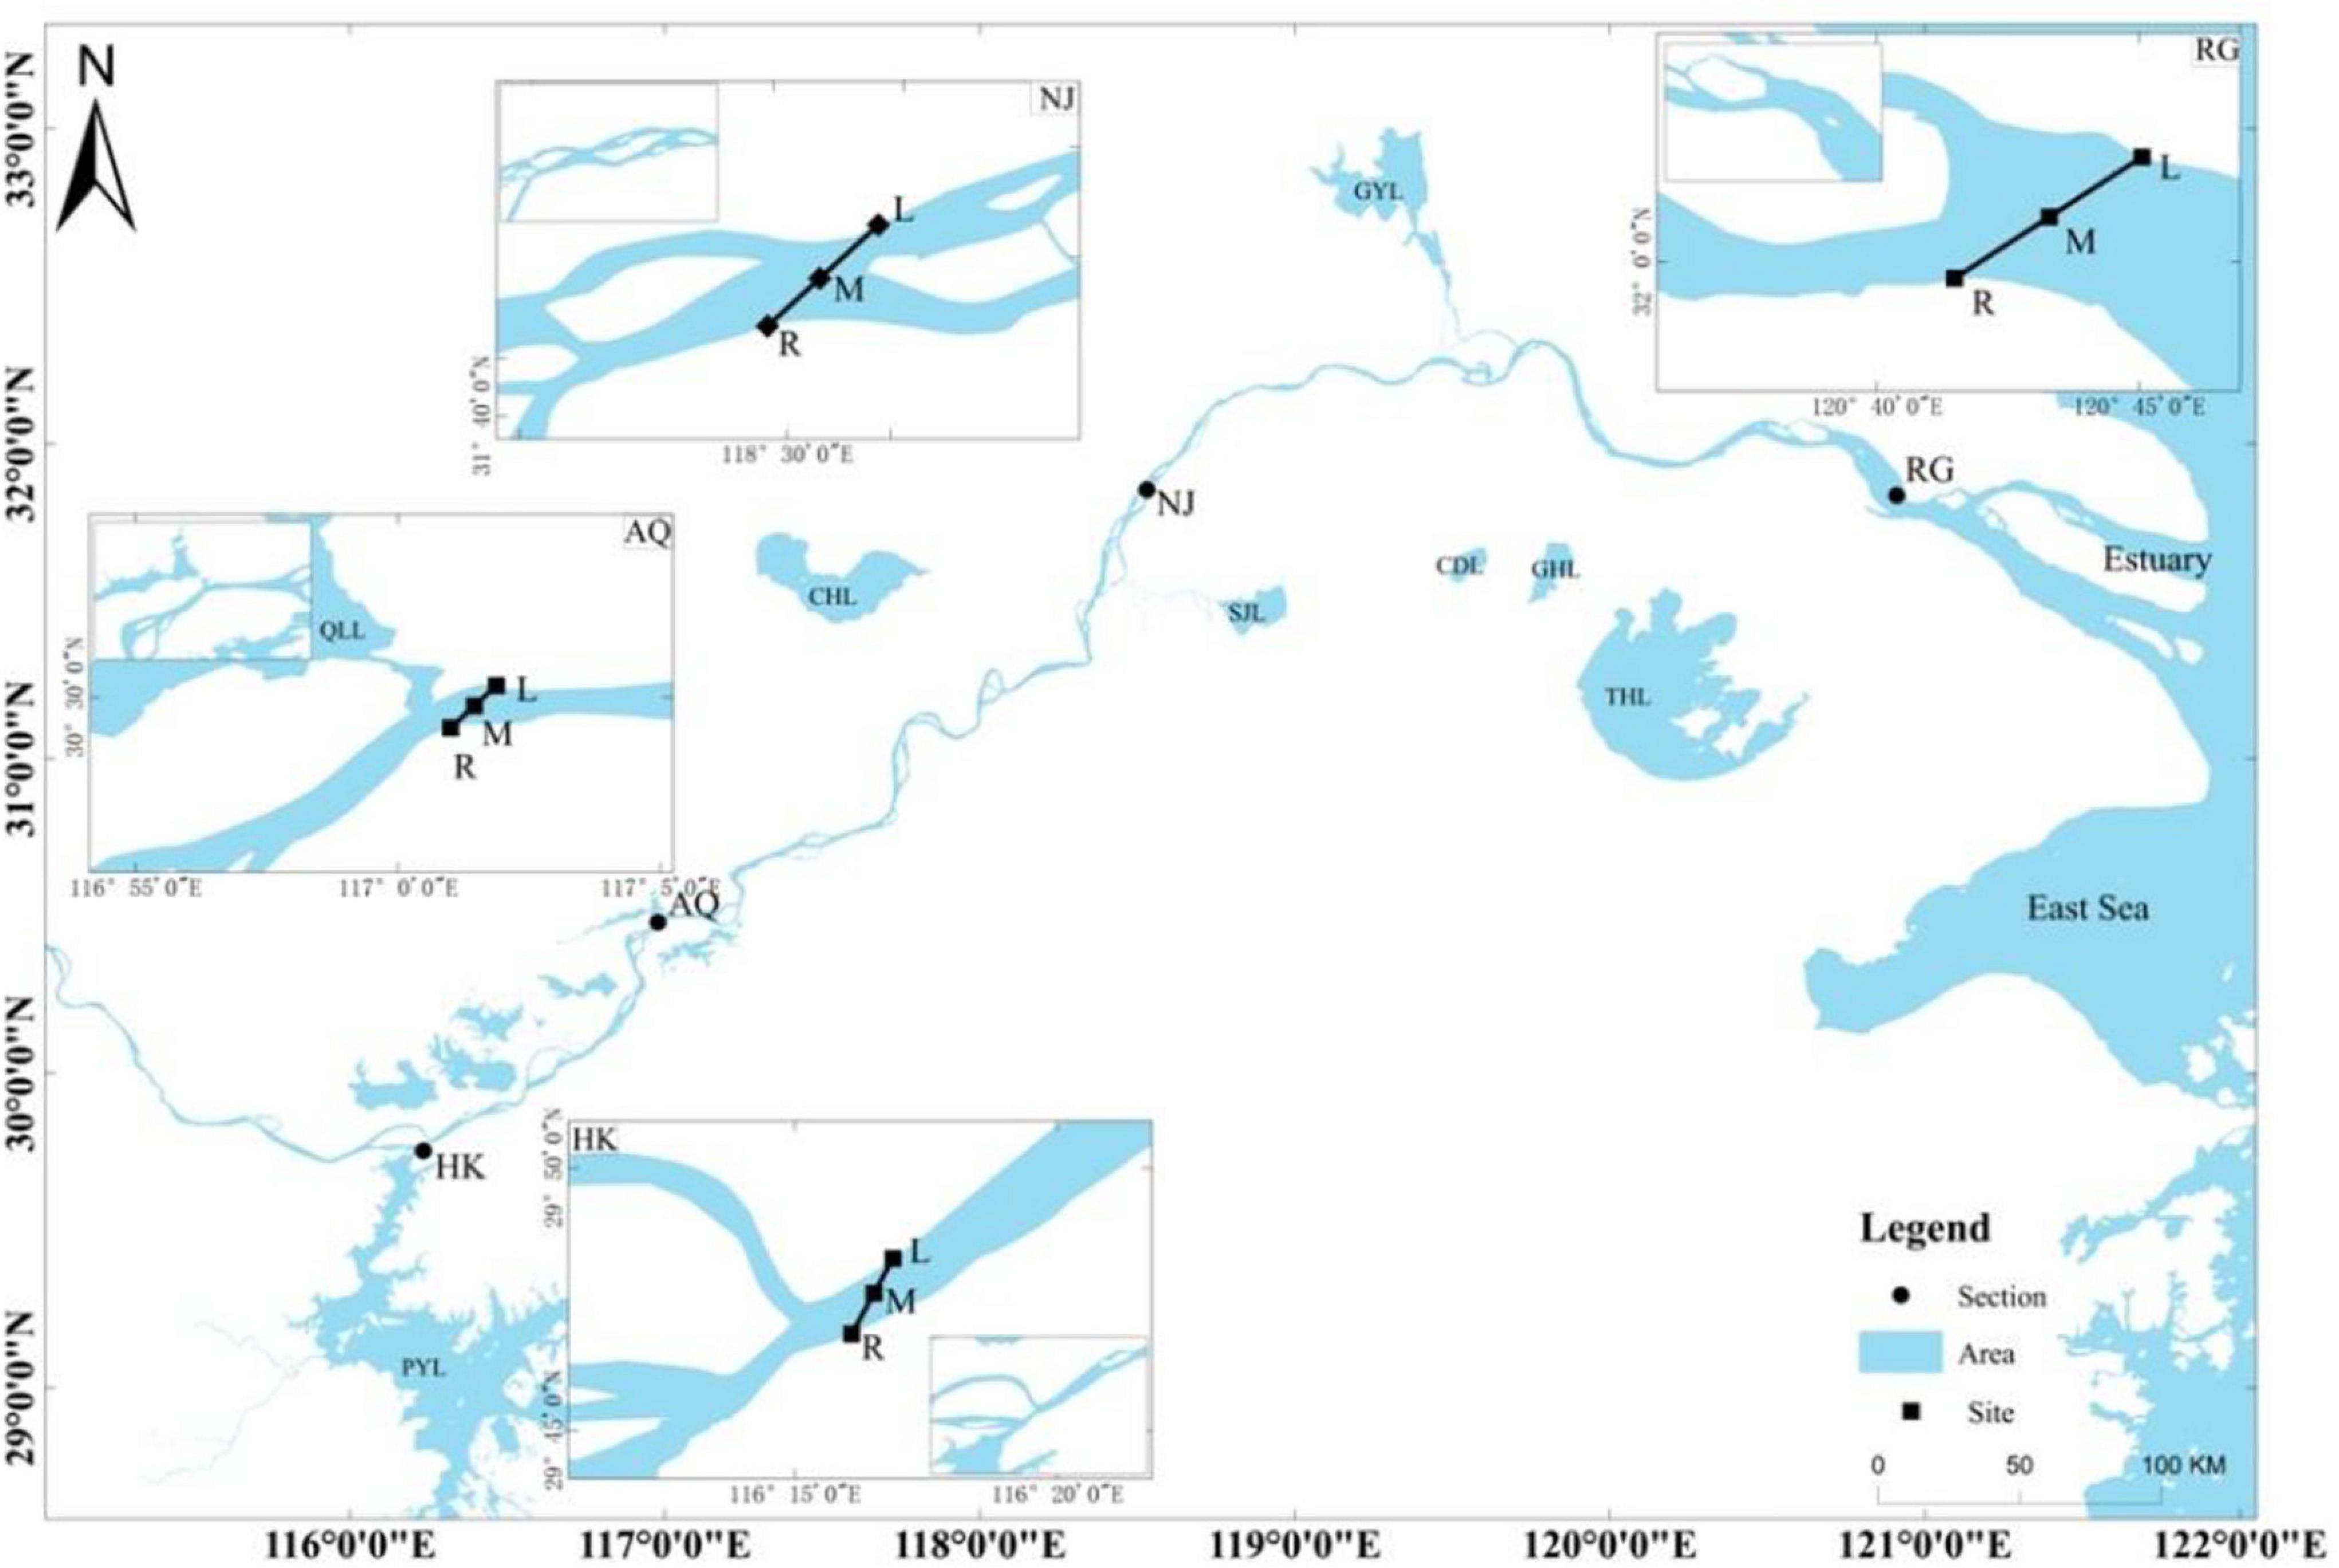
Figure 1. Sampling sites for ichthyoplankton in the Changjiang River. Four sections were set in the lower reach of the Changjiang River. HK, Hukou; AQ, Anqing; NJ, Nanjing; RG, Rugao. Three sampling sites were set in each section: the right bank (R), the left bank (L), and the middle (M). PYL, Poyang Lake; WR, Wan River; QLL, Qili Lake; CHL, Chaohu Lake; SJL, Shijiu Lake; GYL, Gaoyou Lake; CDL, Changdang Lake; GHL, Gehu Lake; THL, Taihu Lake.
Sampling was performed as the following methods. Sampling was conducted daily in the morning (06:00–11:00) during the fish spawning season from May to July during 2018–2020. Larval fish was collected using an ichthyologic traps net (0.5-mm mesh size and 4.9 m2 area of the net mouth). A flow meter (Digital Flow Meter 23090, Silkeborg, Denmark) was tied in the net mouth to measure the water flow volume through the net. Sampling was conducted upstream using a traditional fishing boat at a speed of about 2 km/h. According to the quantity of ichthyoplankton, sampling time was set approximately 3–10 min on spot situation. Triplicates were collected out along each river section at L, M, and R sites (Figure 1). The net was deployed approximately 20 m from the edge of the riverbank along the chosen sampling sections. For each sample, drifting vegetation and foreign matter were discarded by manual picking. The ichthyoplankton was collected and fixed in 4% formalin solution for 2 h to maintain the morphological shape and then preserved in 75% ethanol for later molecular identification (Cheng et al., 2013).
Along with the ichthyoplankton, data on the four environmental variables of pH, dissolved oxygen (DO), water temperature (WT), water transparency (WTP), and also water flow (WF), were collected simultaneously during each sampling of the three sites in the four river sections. Being the different hydrographic environments in each sampled section, HK section of daily water level, runoff, and water flow data were acquired from the China Hydrology Information Network,1 and AQ, NJ, and RG section of the data were acquired from the Changjiang River Hydrographic Network2.
Ichthyoplankton was identified to the species level in the laboratory via morphological and molecular analyses (Cheng et al., 2013; Ren et al., 2016). The collected larval fish was morphologically identified under Olympus SZX 16 anatomical microscope, and the morphological classification for the larval fish referred to a treatise on the Early Fish Resources of Yangtze River (Cao et al., 2007). Furthermore, for the unidentifiable specimens, the MOTU analysis method was used to identify (Cheng et al., 2013). Larval fish was counted by species for each sample. Fish species exhibiting different spawning types differ greatly in hydrological conditions preference (Song et al., 2019).
The Margalef richness index (D) (Margalef, 1958), the Shannon diversity index (H) (Shannon and Weaver, 1949), the Pielou evenness index (J) (Pielou, 1977), and the Simpson diversity index (C) (Simpson, 1949) were used to assess community characteristics (Jin and Tang, 1996). Each biological indicator of the community was calculated using the following formula:
where S denotes the number of species of all species in the community, N denotes the number of all species, and Ni denotes the number of individuals of the ichthyoplankton species.
The density of ichthyoplankton was calculated as the number of fish larvae per 100 m3 of the filtered water volume. Species data were analyzed by detrended correspondence analysis (DCA) to identify the most appropriate model (linear or unimodal). Distance-based redundancy analysis (db-RDA) was used to characterize the variables explaining differences in larval fish assemblages (Pan et al., 2015). When the longest (maximum) gradient exceeds four, it is more appropriate to choose single-peak model sorting; if it is less than three, it is more reasonable to choose the linear model. To reduce the weight of outliers, as to water environmental factors, we processed with log (x + 1) to satisfy the normal distribution assumption of the analyzed data, and the Monte Carlo permutation test was used to sieve environmental factors. Statistical significance was set at p < 0.05.
The effect of hydrological factors on the abundance of larval fish was analyzed using a generalized additive model (GAM) with the mgcv package of R, version R 3.5.3 (Daskalov, 1999). The GAM model expression is:
where the g(p) is the correlation function, the p is the density of fish larvae (ind/100 mł), the α is the interception in the fitness function, and the xjis the explanatory variable, including WT, WTP, daily increase rate of water level (DIWL), and daily increase rate of runoff (DIWR). The fi(xj) is a nonparametric function to explain the relationship between variables. The ε is the error term and unrelated to the explanatory variable xj. E(ε) = 0, ε=ɓ2 model adopts the smoothing method to draw data graphs. In this study, the function of GAM () in the mgcv package is used to construct the GAM model by R 3.5.3 (Daskalov, 1999; Citores et al., 2020). The following two-step procedure was applied in analyzing the data. First, the functional relationship between the independent variables and each response was explored using nonparametric GAM. In this way, the form of the function was found empirically according to data without a priori assumptions. Next, more parsimonious model versions were tested, which included parametric terms. In cases of pronounced nonlinearity, piecewise polynomials were used due to the greater flexibility to fit curves. We used smoothing splines (cubic spline) to represent the nonlinear effect of predictors. The maximum degree of smoothing was set at six, to avoid unrealistic patterns in the explanatory variables and to reduce overfitting. According to the Akaike information criterion (AIC), the optimal number of nodes and the optimal model are determined (Akaike, 1973).
All sampling procedures were reviewed and approved according to the Regulations for the Administration of Affairs Concerning Experimental Animals, as approved and authorized by the State Council of the People’s Republic of China.
Based on the sampling, using a type I plankton net for three consecutive years, a total of 46 fish species belonging to seven orders and 12 families were identified in the HK section; 54 fish species belonging to six orders and 13 families were identified in the AQ section; 35 fish species belonging to six orders and nine families were identified in the Nanjing section; and 36 fish species belonging to six orders and nine families were identified in the RG section (detailed information listed in Table 1). Cyprinidae was the dominant family from the estuary to the HK section, followed by Gobiidae and Engraulidae. There were significant differences in the proportion and taxa quantity of ichthyoplankton in the different sections (Table 1 and Figure 2). It can be seen that families of Cypriniformes, Perciformes, Siluriformes, and Clupeiformes were the main part of the assemblages in the sampled sections during the survey period (Supplementary Table 1).
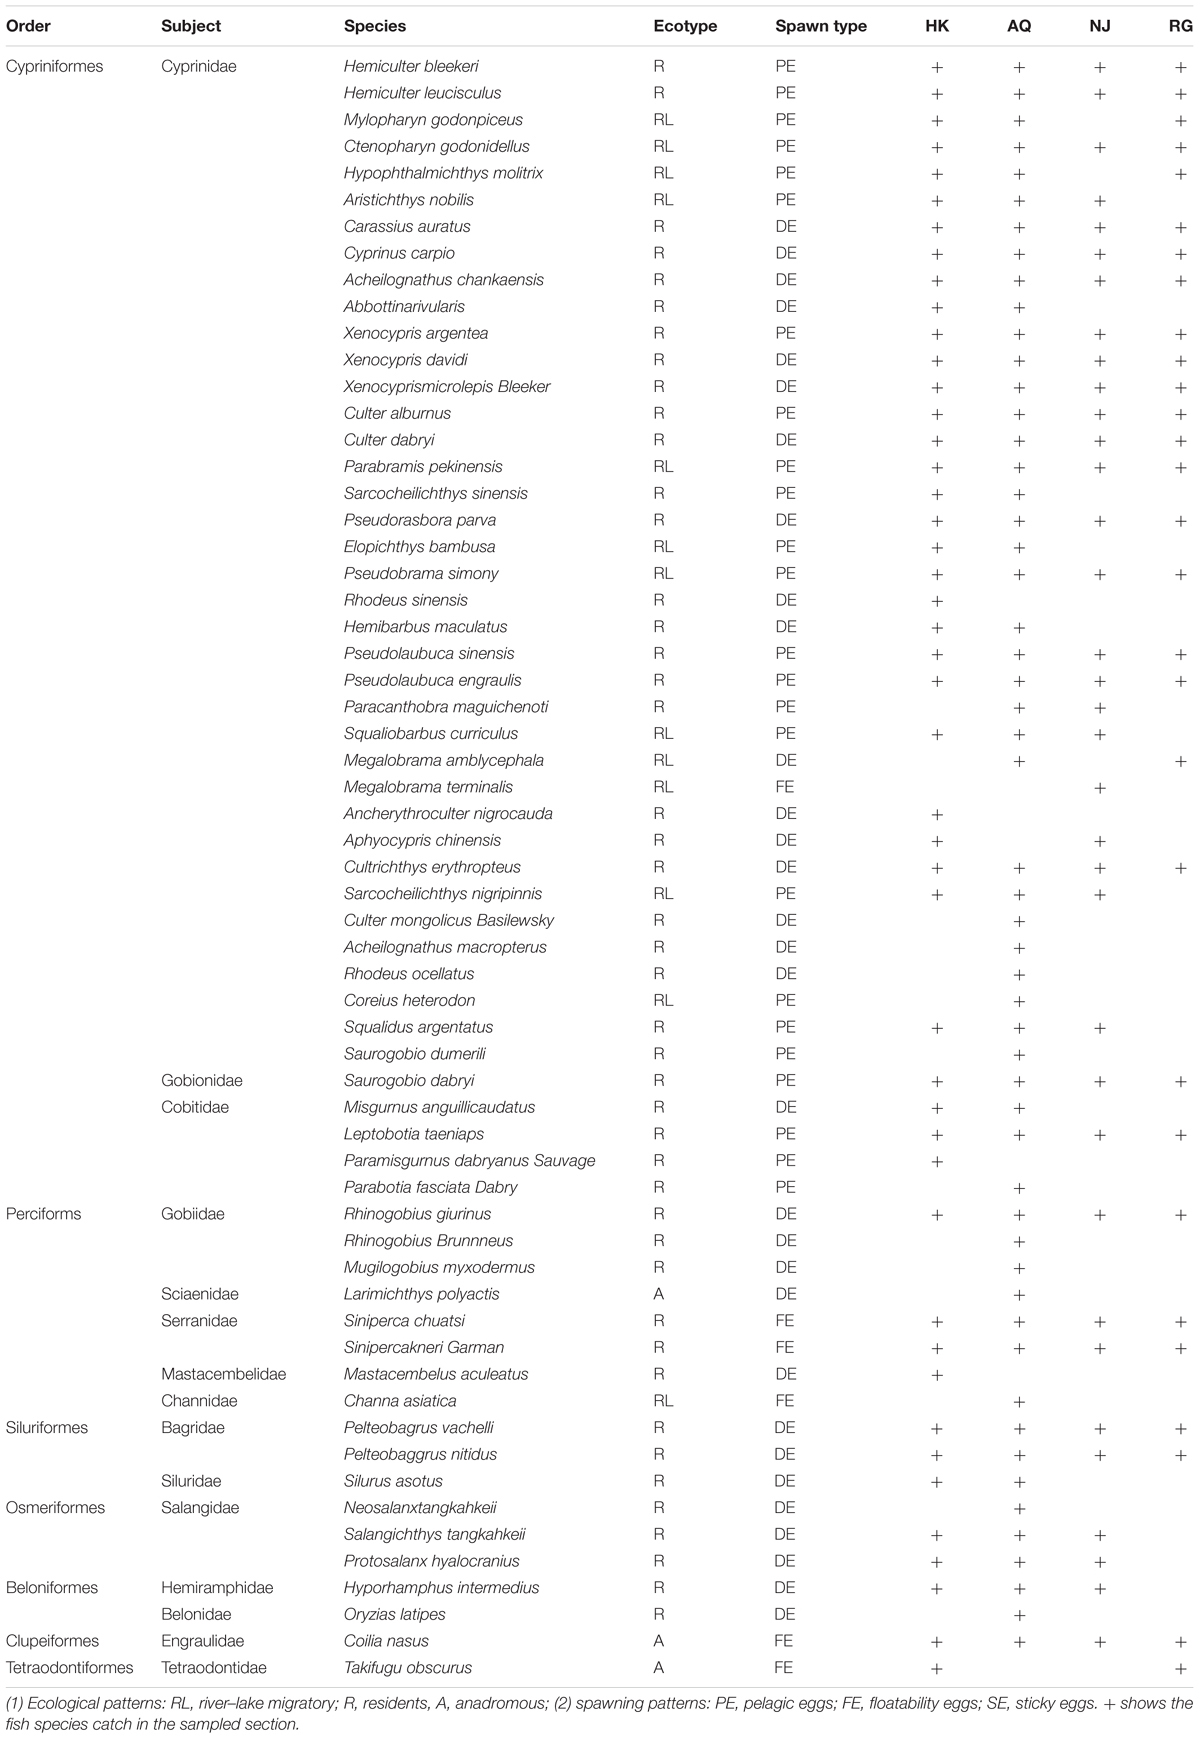
Table 1. Abundance of ichthyoplankton in each section.

Figure 2. Families and quantity percentage of ichthyoplankton in different sections.
In accordance with spawning preference and spawning type, the sampled fish larvae were classified into one of the following two ecological preferences: habitat preference [river–lake migratory (RL), river resident (RR), and river anadromous (RA) fish species] or spawning preference [pelagic eggs (PE), sticky eggs (SE), and floatable eggs (FE)] (Song et al., 2019). The RL species (e.g., H. leucisculus and H. molitrix) like living between rivers and lakes, so their larvae had high abundance in HK and AQ sections. The RR fish species (e.g., H. bleekeri, H. leucisculus, and X. argentea) like living along the river, so their distribution had no difference between sections. The RA fish species (e.g., C. nasus and T. obscurus) have distinctive habitat preferences, so their distribution had a specific pattern. As regards to the different spawning types, the PE fish species generally required strong water steam to spawn (e.g., H. bleekeri and H. molitrix). They spawned in very deep and warm water (above 20°C), with a high current river section (0.5–1.2 m/s; HK and AQ). The SE fish species preferred to spawn in shallow places with slow currents and lay their eggs by attaching water plants or submerged objects (e.g., R. giurinus, P. fulvidraco, and X. microlepis). The FE fish species (e.g., S. scherzeri and C. nasus) laid their eggs in shallow water with the subcritical flow. In a word, different types of ecological and spawning fish species from the estuary to other sections were distributed differently and varied temporally in a habitat-dependent way (Table 2).
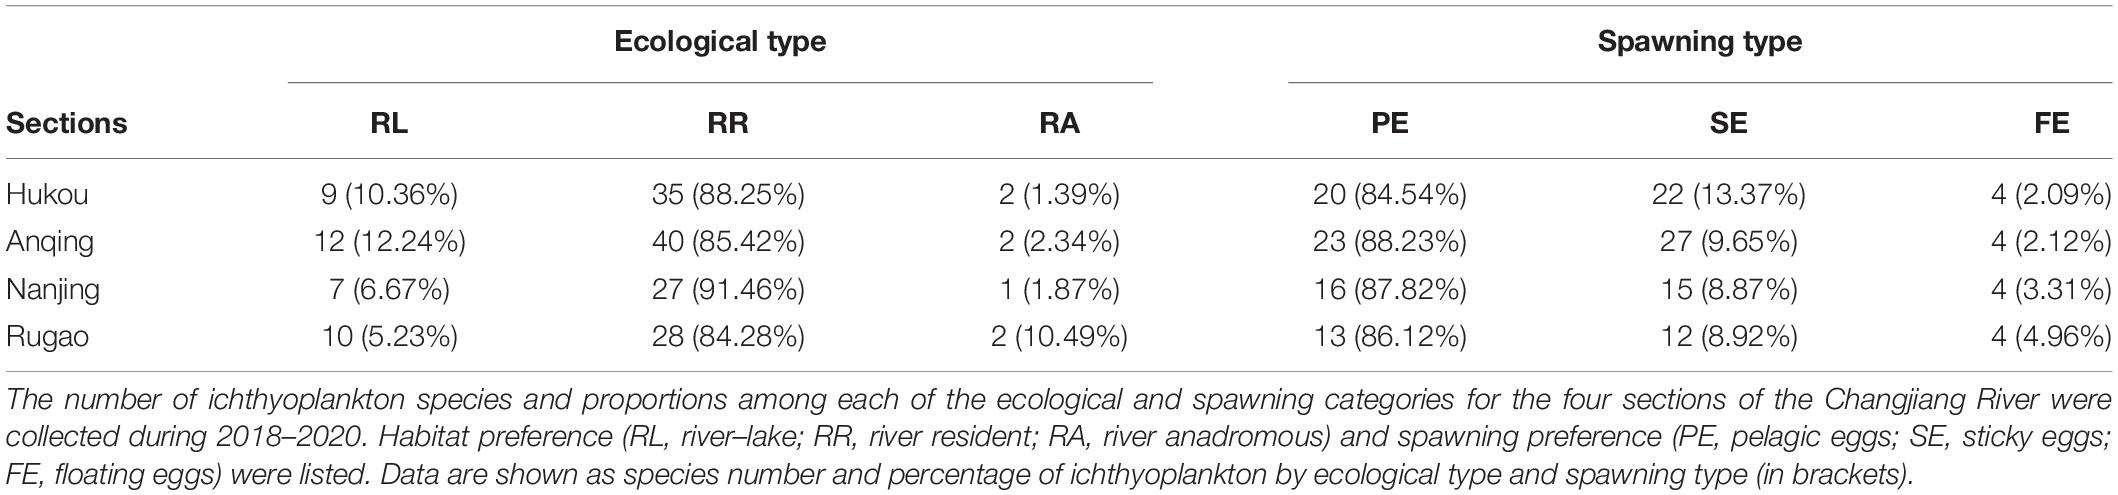
Table 2. Species quantity and percentage of ichthyoplankton distribution type.
Ichthyoplankton exhibited a fluctuating pattern of change during the surveyed period. In a detailed statement, it exhibited a low level and rising trend in May, reaching the peak in late June, with a fluctuating downward trend in July, and remaining low level in August (Figure 3). The monthly density in different river sections showed an obvious time dependent patterns. As regards to the fish species, for example, Gobiidae species appeared from late May and ended in middle August, and the density peak value was in late May. C. nasus appeared in early June with peaks in late June and disappeared in the midmonth of August. X. argentea appeared from late May to early July, peaked in late May, and then decreased continuously till ended in middle August. H. leucisculus appeared from early June to early August and peaked in early July. C. alburnus appeared from late June to early August and peaked in late June. The four major species of Chinese domestic fish appeared from early May to early August and peaked in early July. H. intermedius appeared from late May to late July and peaked in early June. S. chuatsi appeared from late May to early August and peaked in early July. Different larval fish species exhibited distinctive temporal patterns.
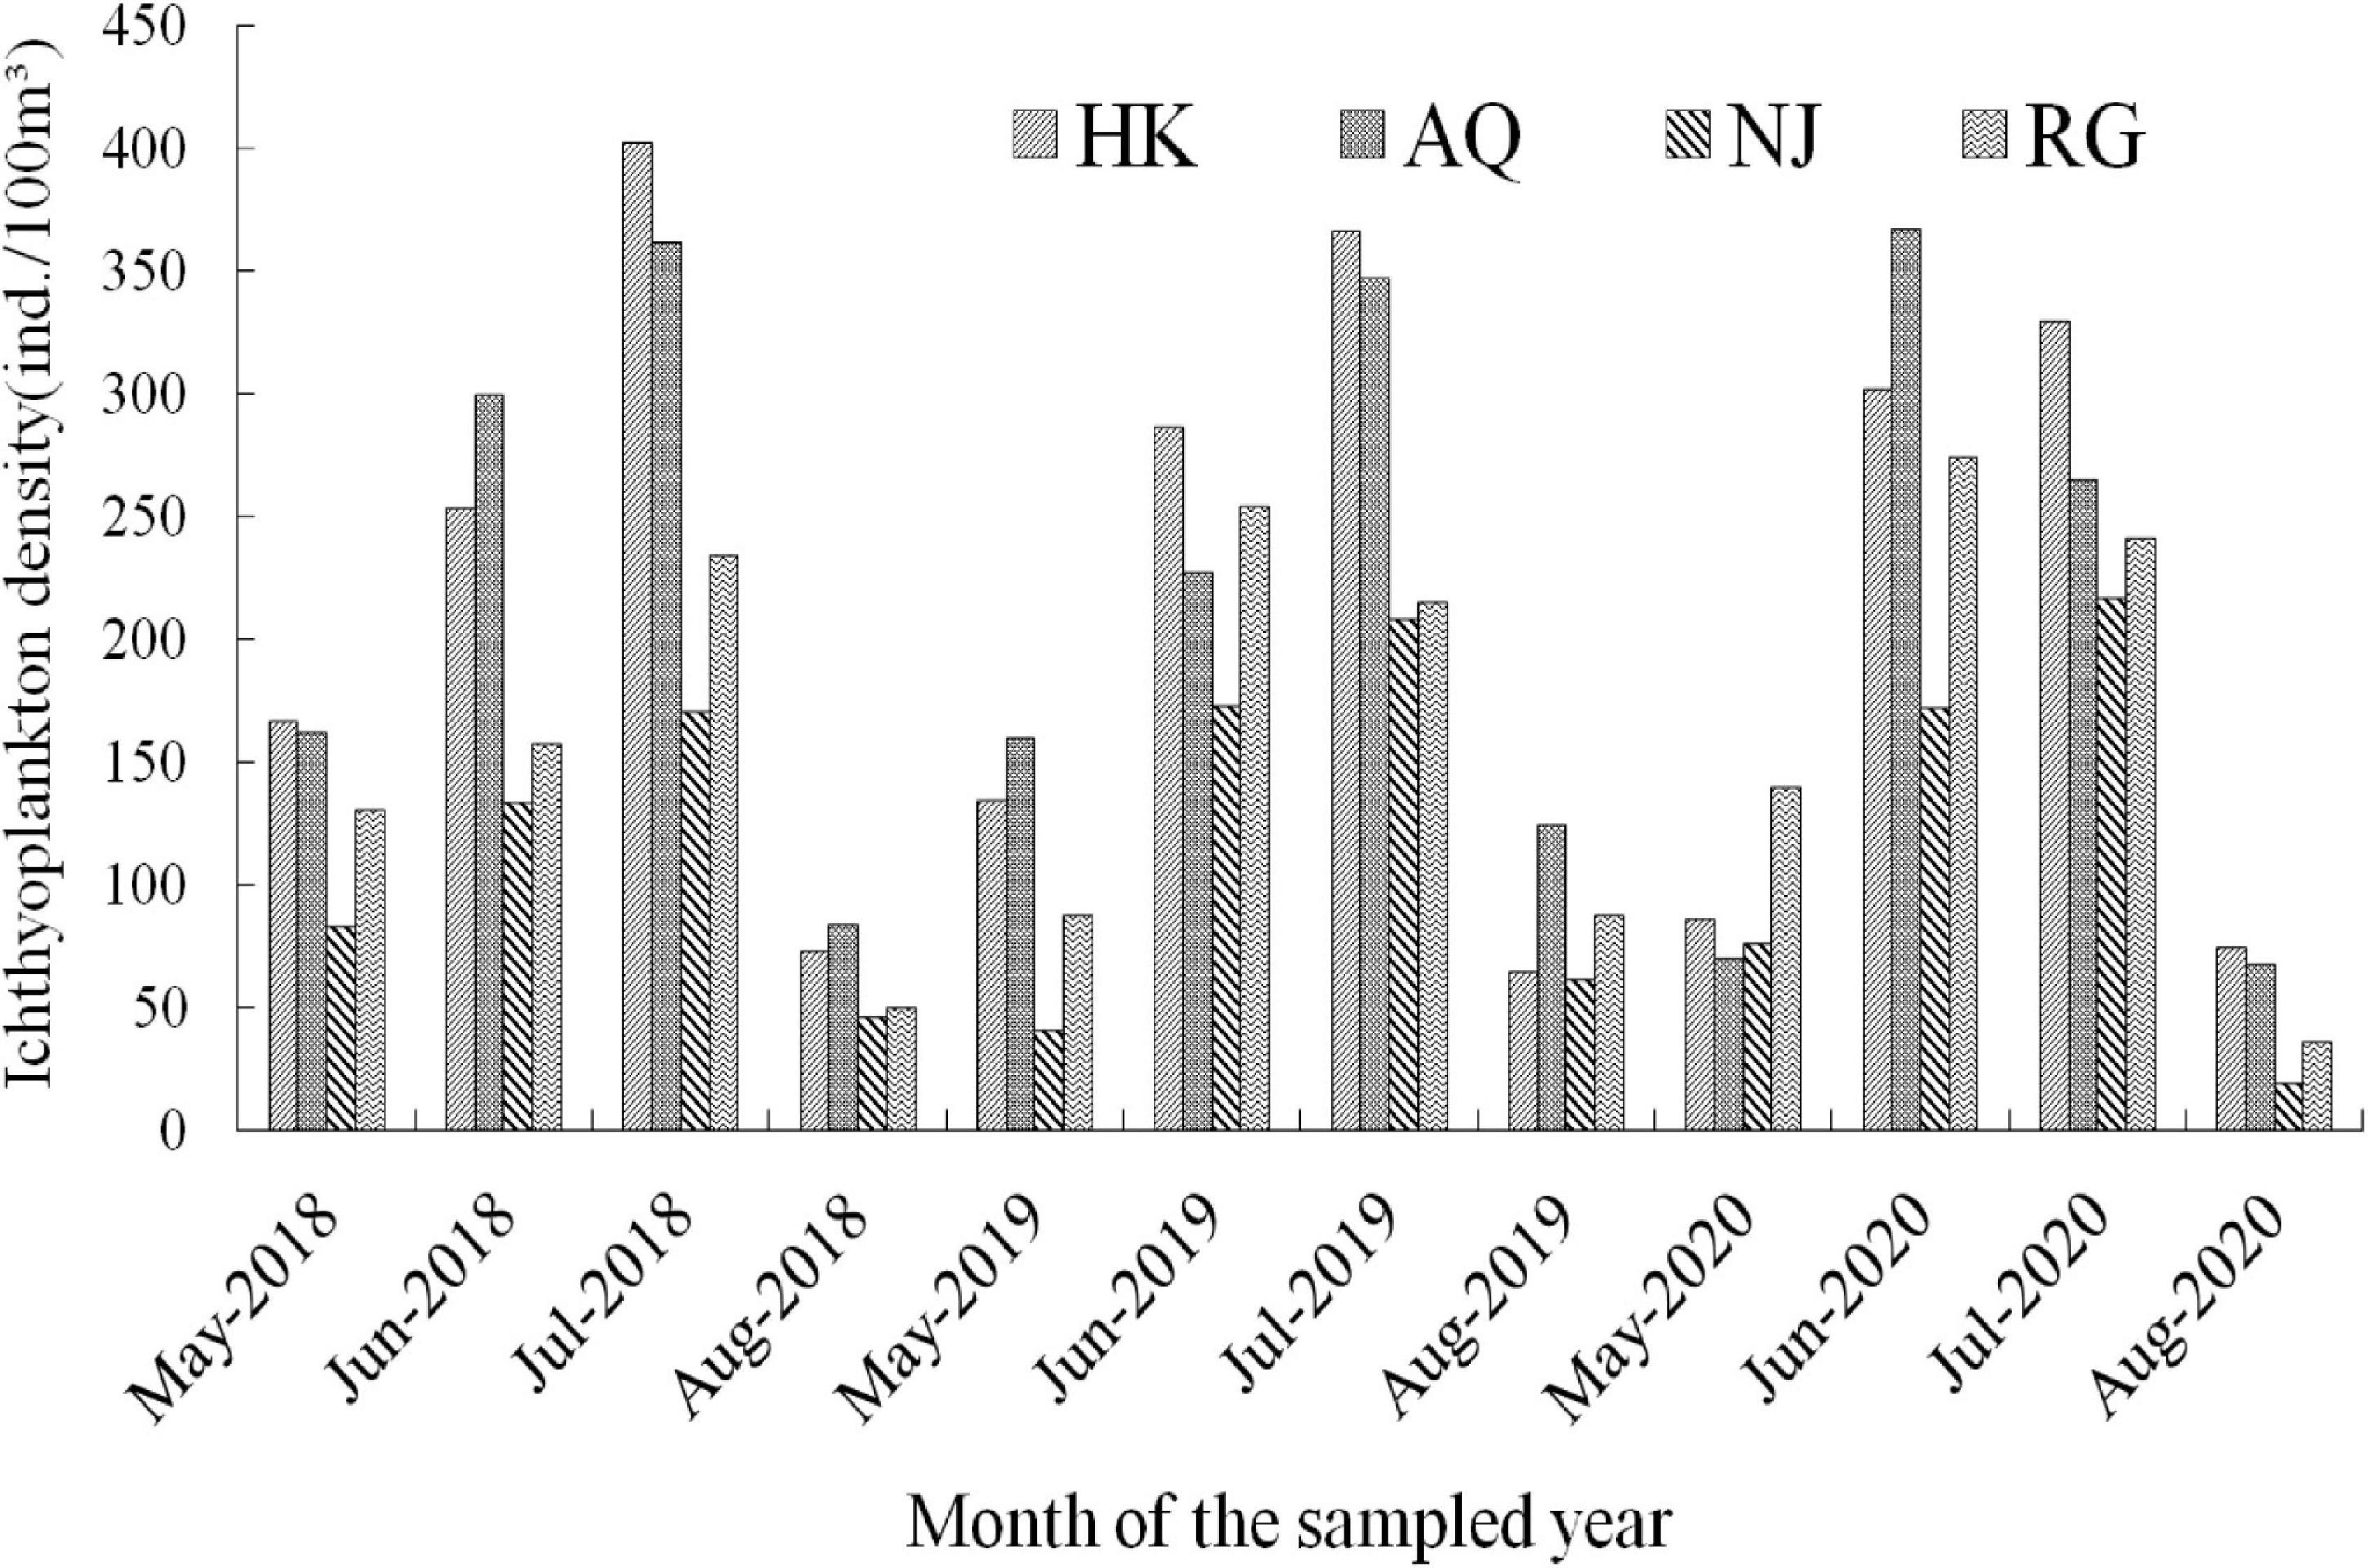
Figure 3. Monthly density of ichthyoplankton in different river sections.
Furthermore, during the survey period from 2018 to 2020, in the HK section, the annual peak of ichthyoplankton density appeared on July 25 (505.05 ind/100 m3), June 24 (1,122.82 ind/100 m3), and July 28 (865.05 ind/100 m3). In the AQ section, the annual peak appeared on June 16 (4,920.63 ind/100 m3), May 27 (2,077.96 ind/100 m3), and June 21 (2,180.81 ind/100 m3). In the NJ section, the annual peak appeared on August 4 (501.90 ind/100 m3), July 22 (347.10 ind/100 m3), and July 9 (325.93 ind/100 m3). In the RG section, the annual peak appeared on June 21 (296.46 ind/100 m3), July 14 (425.15 ind/100 m3), and July 18 (340.68 ind/100 m3), respectively. Further analysis showed that the fastigium period of ichthyoplankton in each section was maintained in June and July (Supplementary Table 2). A comparison of the ichthyoplankton density at the three sampling sites of each section showed that the average density at the L site was greater than that at the R site, which was greater than that at the M site. Interestingly, the highest density of ichthyoplankton at the R site appeared earlier than that at the L and M sites.
Diversity is determined by species richness and distribution evenness: the higher the richness and the more evenly distributed the species than the greater the diversity. Each monthly D (0.72–4.32), C (1.06–8.62), H (0.144–2.42), and E (0.07–0.71) index varied similarly in the sampled sections during the survey period (Table 3). All indices attained their highest values in July each year (Supplementary Table 3). Furthermore, the biological diversity reflected by the indices was greater in the estuary and RL sections than in the middle section (Table 3). Significant intermonth variation in all indices occurred between the sampling month, and ichthyoplankton diversity indices varied significantly among years, but their trends analogized.

Table 3. Monthly variation range of diversity index in the sampled sections.
According to the forward selection method, Monte Carlo test, and db-RDA analysis (p < 0.05), WT, WL, WF, and WTP were identified as the essential environmental factors affecting the community structure of ichthyoplankton. The different fish species exhibited different degrees of positive or negative correlations with WT, WTP, and WF. In the HK section, transparency exhibited either positive or negative correlations. For example, WTP was positively correlated with fish larvae abundance of H. bleekeri, N. tangkahkeii, E. bambusa, H. intermedius, P. simoni, X. argentea, and R. giurinus, but negatively correlated with P. engraulis. Water flow and water level were also bidirectional factors (Figure 4, p < 0.05). For example, water runoff and water level were negatively correlated with fish larvae abundance of H. bleekeri, C. idellus, S. chuatsi, X. argentea, P. simoni, and R. giurinus, but they were positively correlated with fish larvae density of H. molitrix, A. nobilis, C. nansus, P. engraulis, and C. alburnus. In the AQ and NJ sections, the primary environmental factors affecting the abundance of ichthyoplankton were WF, water level, and WTP (Figure 4, p < 0.05). The density of ichthyoplankton was negatively correlated with WF and water level but positively correlated with WTP. In the RG section, results revealed that larval fish densities were positively correlated with WT and WF but negatively correlated with WTP in the survey period (Figure 4, p < 0.05).
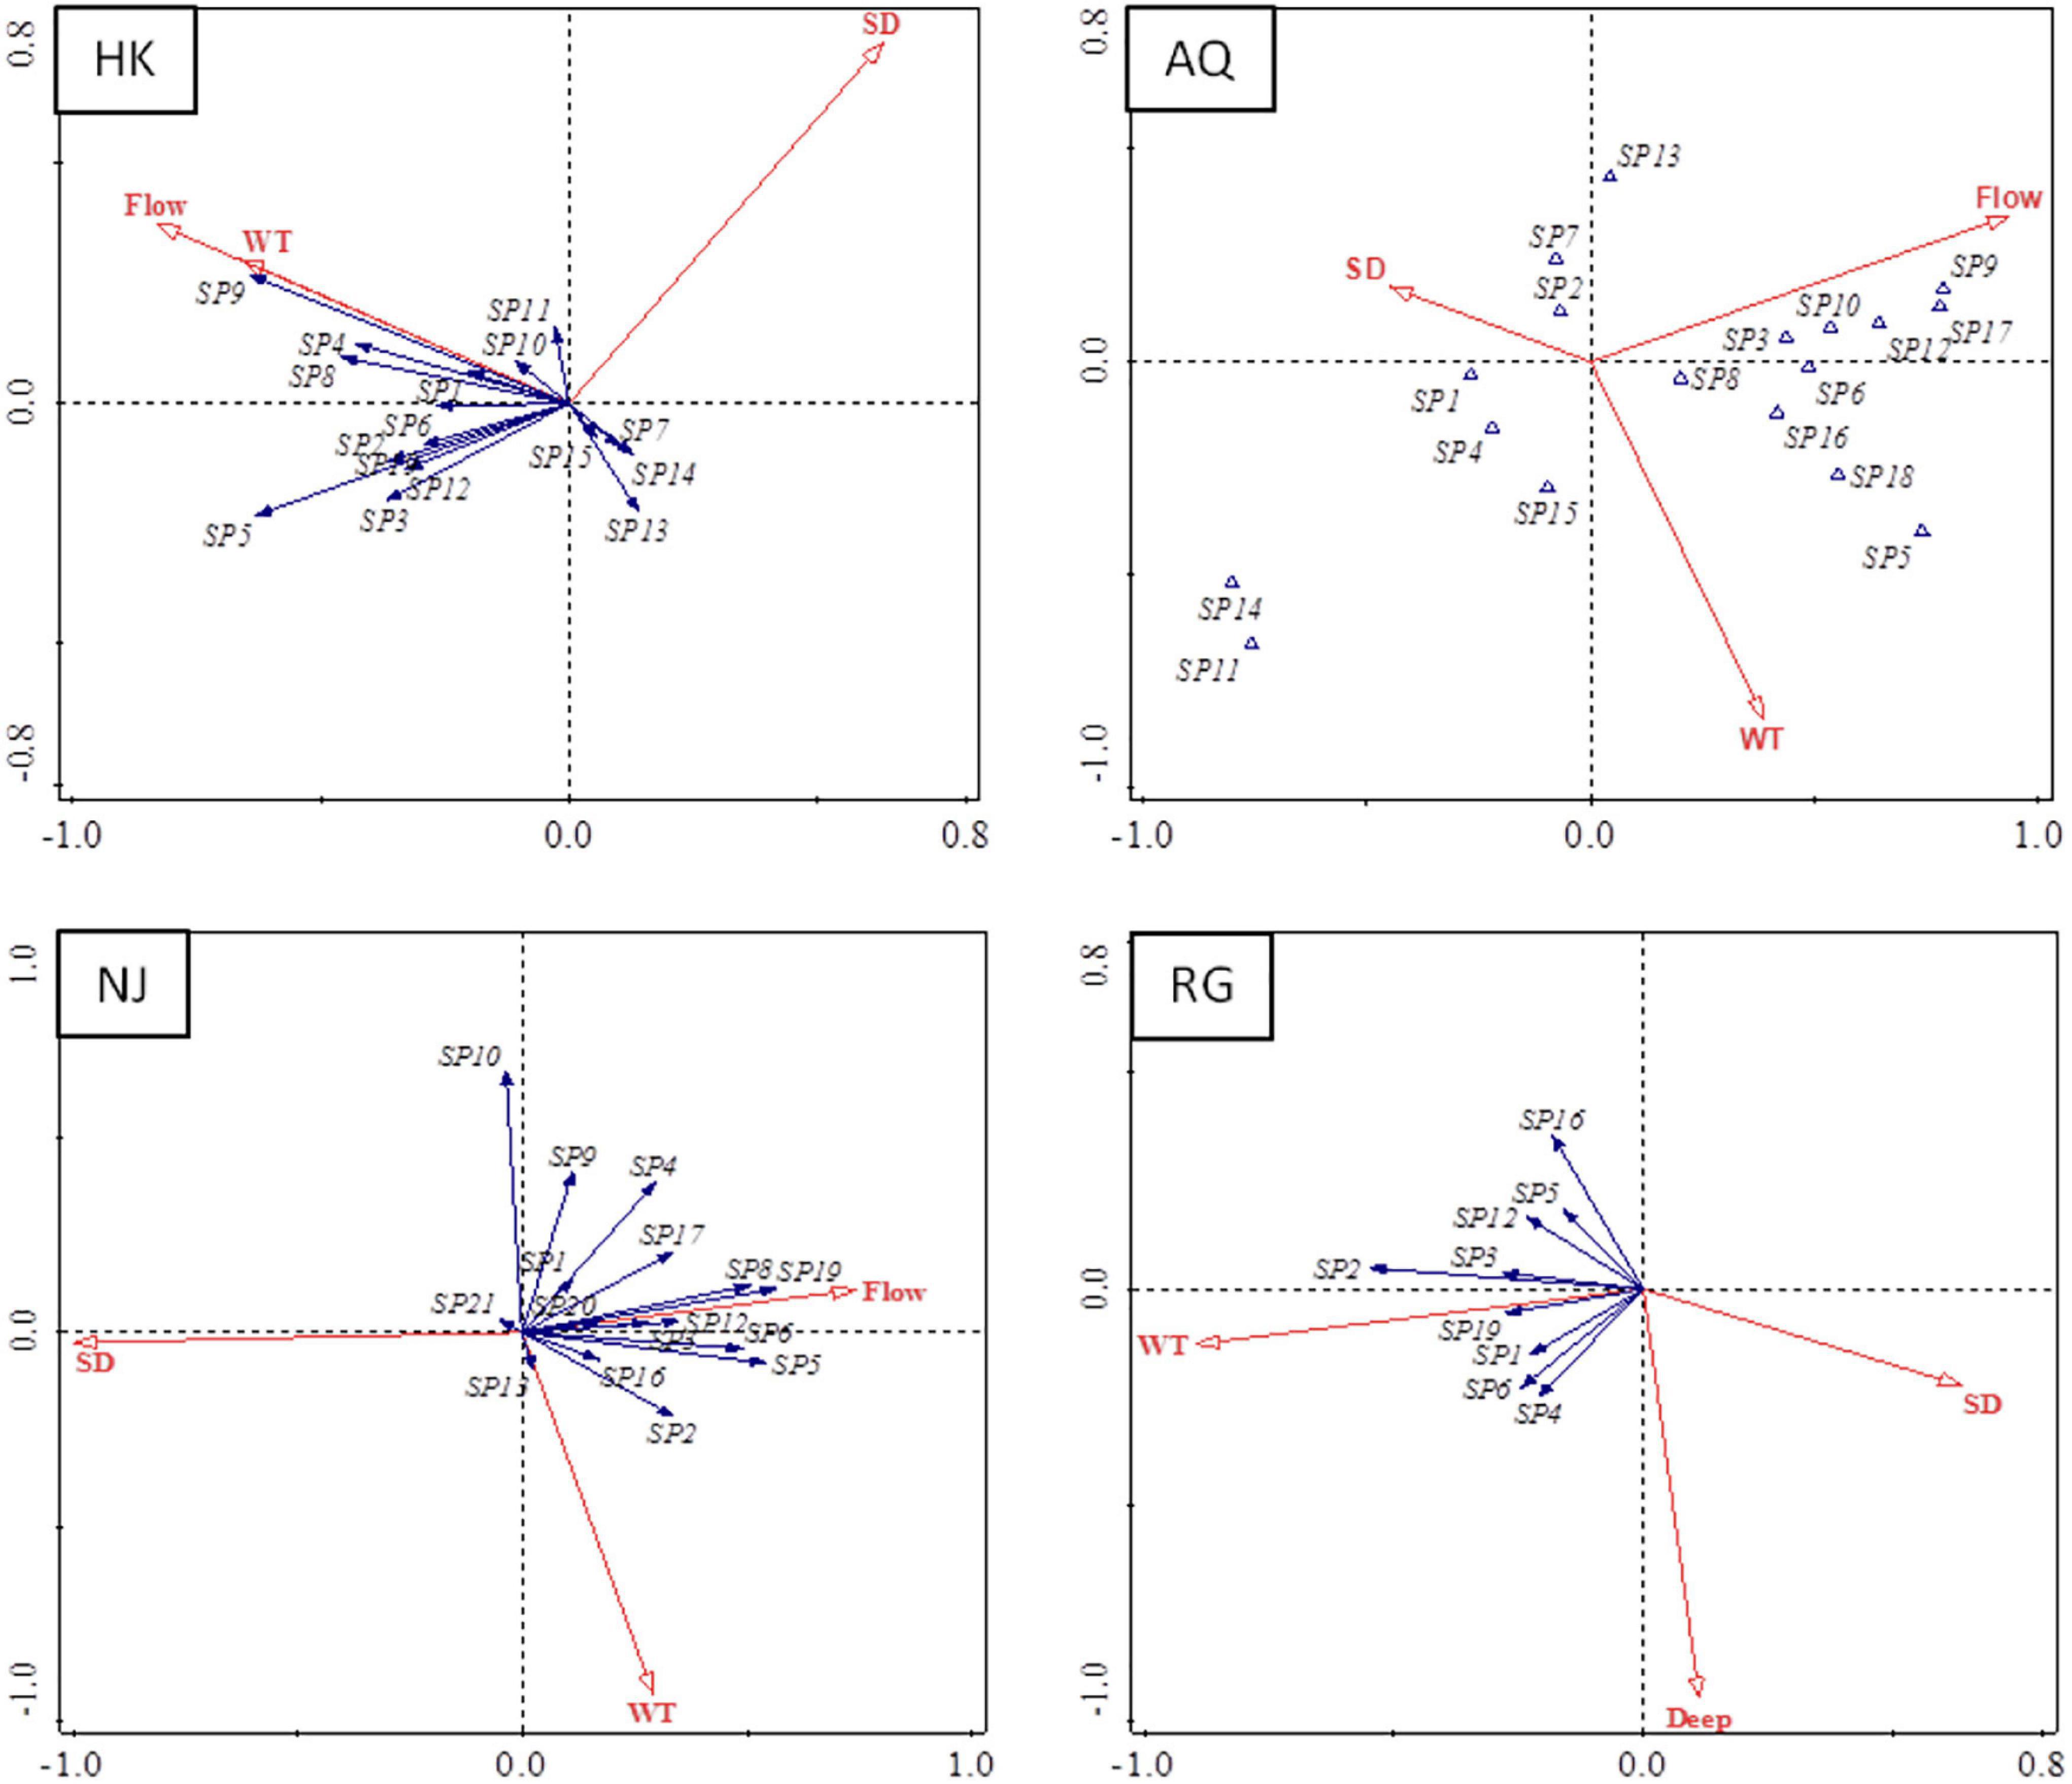
Figure 4. Distance-based redundancy analysis (db-RDA) analyses for ichthyoplankton species and environmental variables. The blue solid arrow represents the larval fish species; the red hollow arrow represents environmental variables. The quadrant of the red arrow represents the positive or negative correlation between environmental factors and the sorting axis. The length of the red arrows represents the degree of correlation between an environmental factor and community distribution. The angle between the red arrow line and the sorting axis represents the correlation between an environmental factor and the sorting axis, the smaller the angle, the higher the correlation. The spn presents different larval fish species as follows: sp1, Hemiculter bleekeri; sp2, Hemiculter leucisculus; sp3, Rhinogobius giurinus; sp4, Xenocypris argentea; sp5, Coilia nasus; sp6, Pseudolaubuca sinensis; sp7, Saurogobio dabryi; sp8, Parabramis pekinensis; sp9, Culter dabryi, sp10, Xenocypris davidi; sp11, Hyporhamphus intermedius; sp12, Culter alburnus; sp13, Neosalanx tangkahkeii; sp14, Squalidus argentatus; sp15, Pseudobrama simony; sp16, Pseudolaubuca engraulis; sp17, Xenocypris microlepis; sp18, Hypophthalmichthys molitrix; sp19, Siniperca chuatsi; sp20, Carassius auratus; and sp21, Hypophthalmichthys nobilis.
Based on the Quantile–Quantile (Q-Q) plot validation (Table 4 and Figure 5, p < 0.05), four hydrological factors (WT, WTP, DIWL, and DIWR) were added in the construction process, and the optimal model was selected according to AIC (Supplementary Table 4 and Figure 6; p < 0.05). According to the GAM analysis, in the HK section, when the high density of larval fish is maintained, the WTP ranged from 38 to 56 cm, and the density of larval fish showed a significant negative correlation with the WTP. When the DIWR ranged from -850 to 400 m3/(s × d), if the increase was accelerated, the frequency of the high larval fish density was relatively low. In this case, the larval fish density was positively correlated with DIWR. Similarly, in the AQ section, when the high larval fish density appeared, the DIWL was mainly between −0.33 and 0.37 (m/d), and it showed a significant positive function to the larval fish density. When it was lower than −0.33 (m/d), the larval fish density was very low. WT, WTP, and DIWR were closely related to the density of larval fish by different correlations. When the high larval fish density appeared in the NJ section, WTP mainly distributed in the range of 22–25 cm, the fish larvae density showed a significant negative correlation with it like that in the HK section. In the RG section, the WT, WTP, DIWL, and DIWR are closely correlated with the density of larval fish, but the distribution did not emerge intensively.
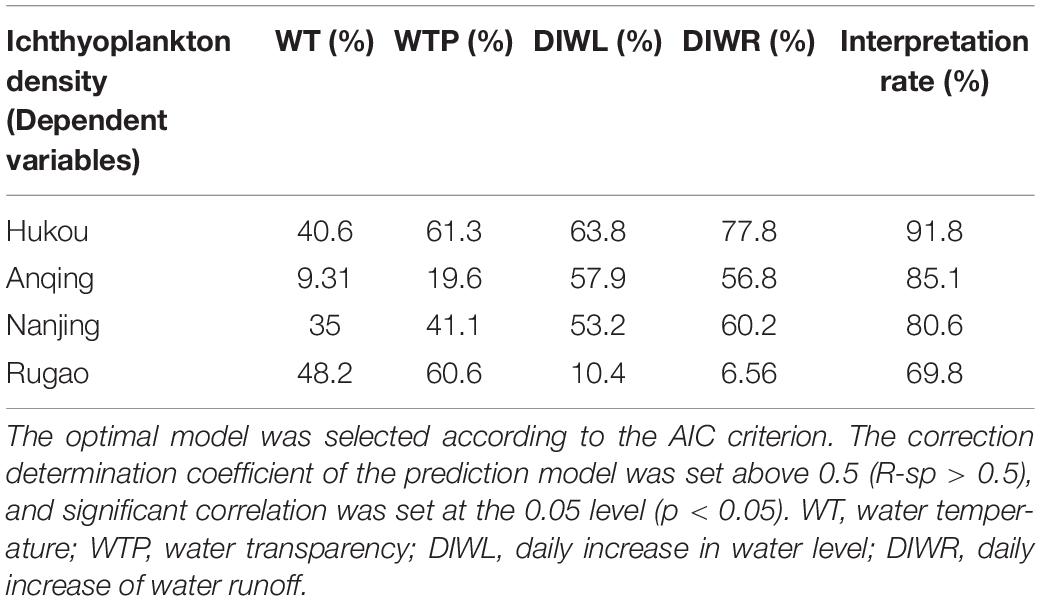
Table 4. Deviation interpretation rate of environmental factors for generalized additive model (GAM) model.
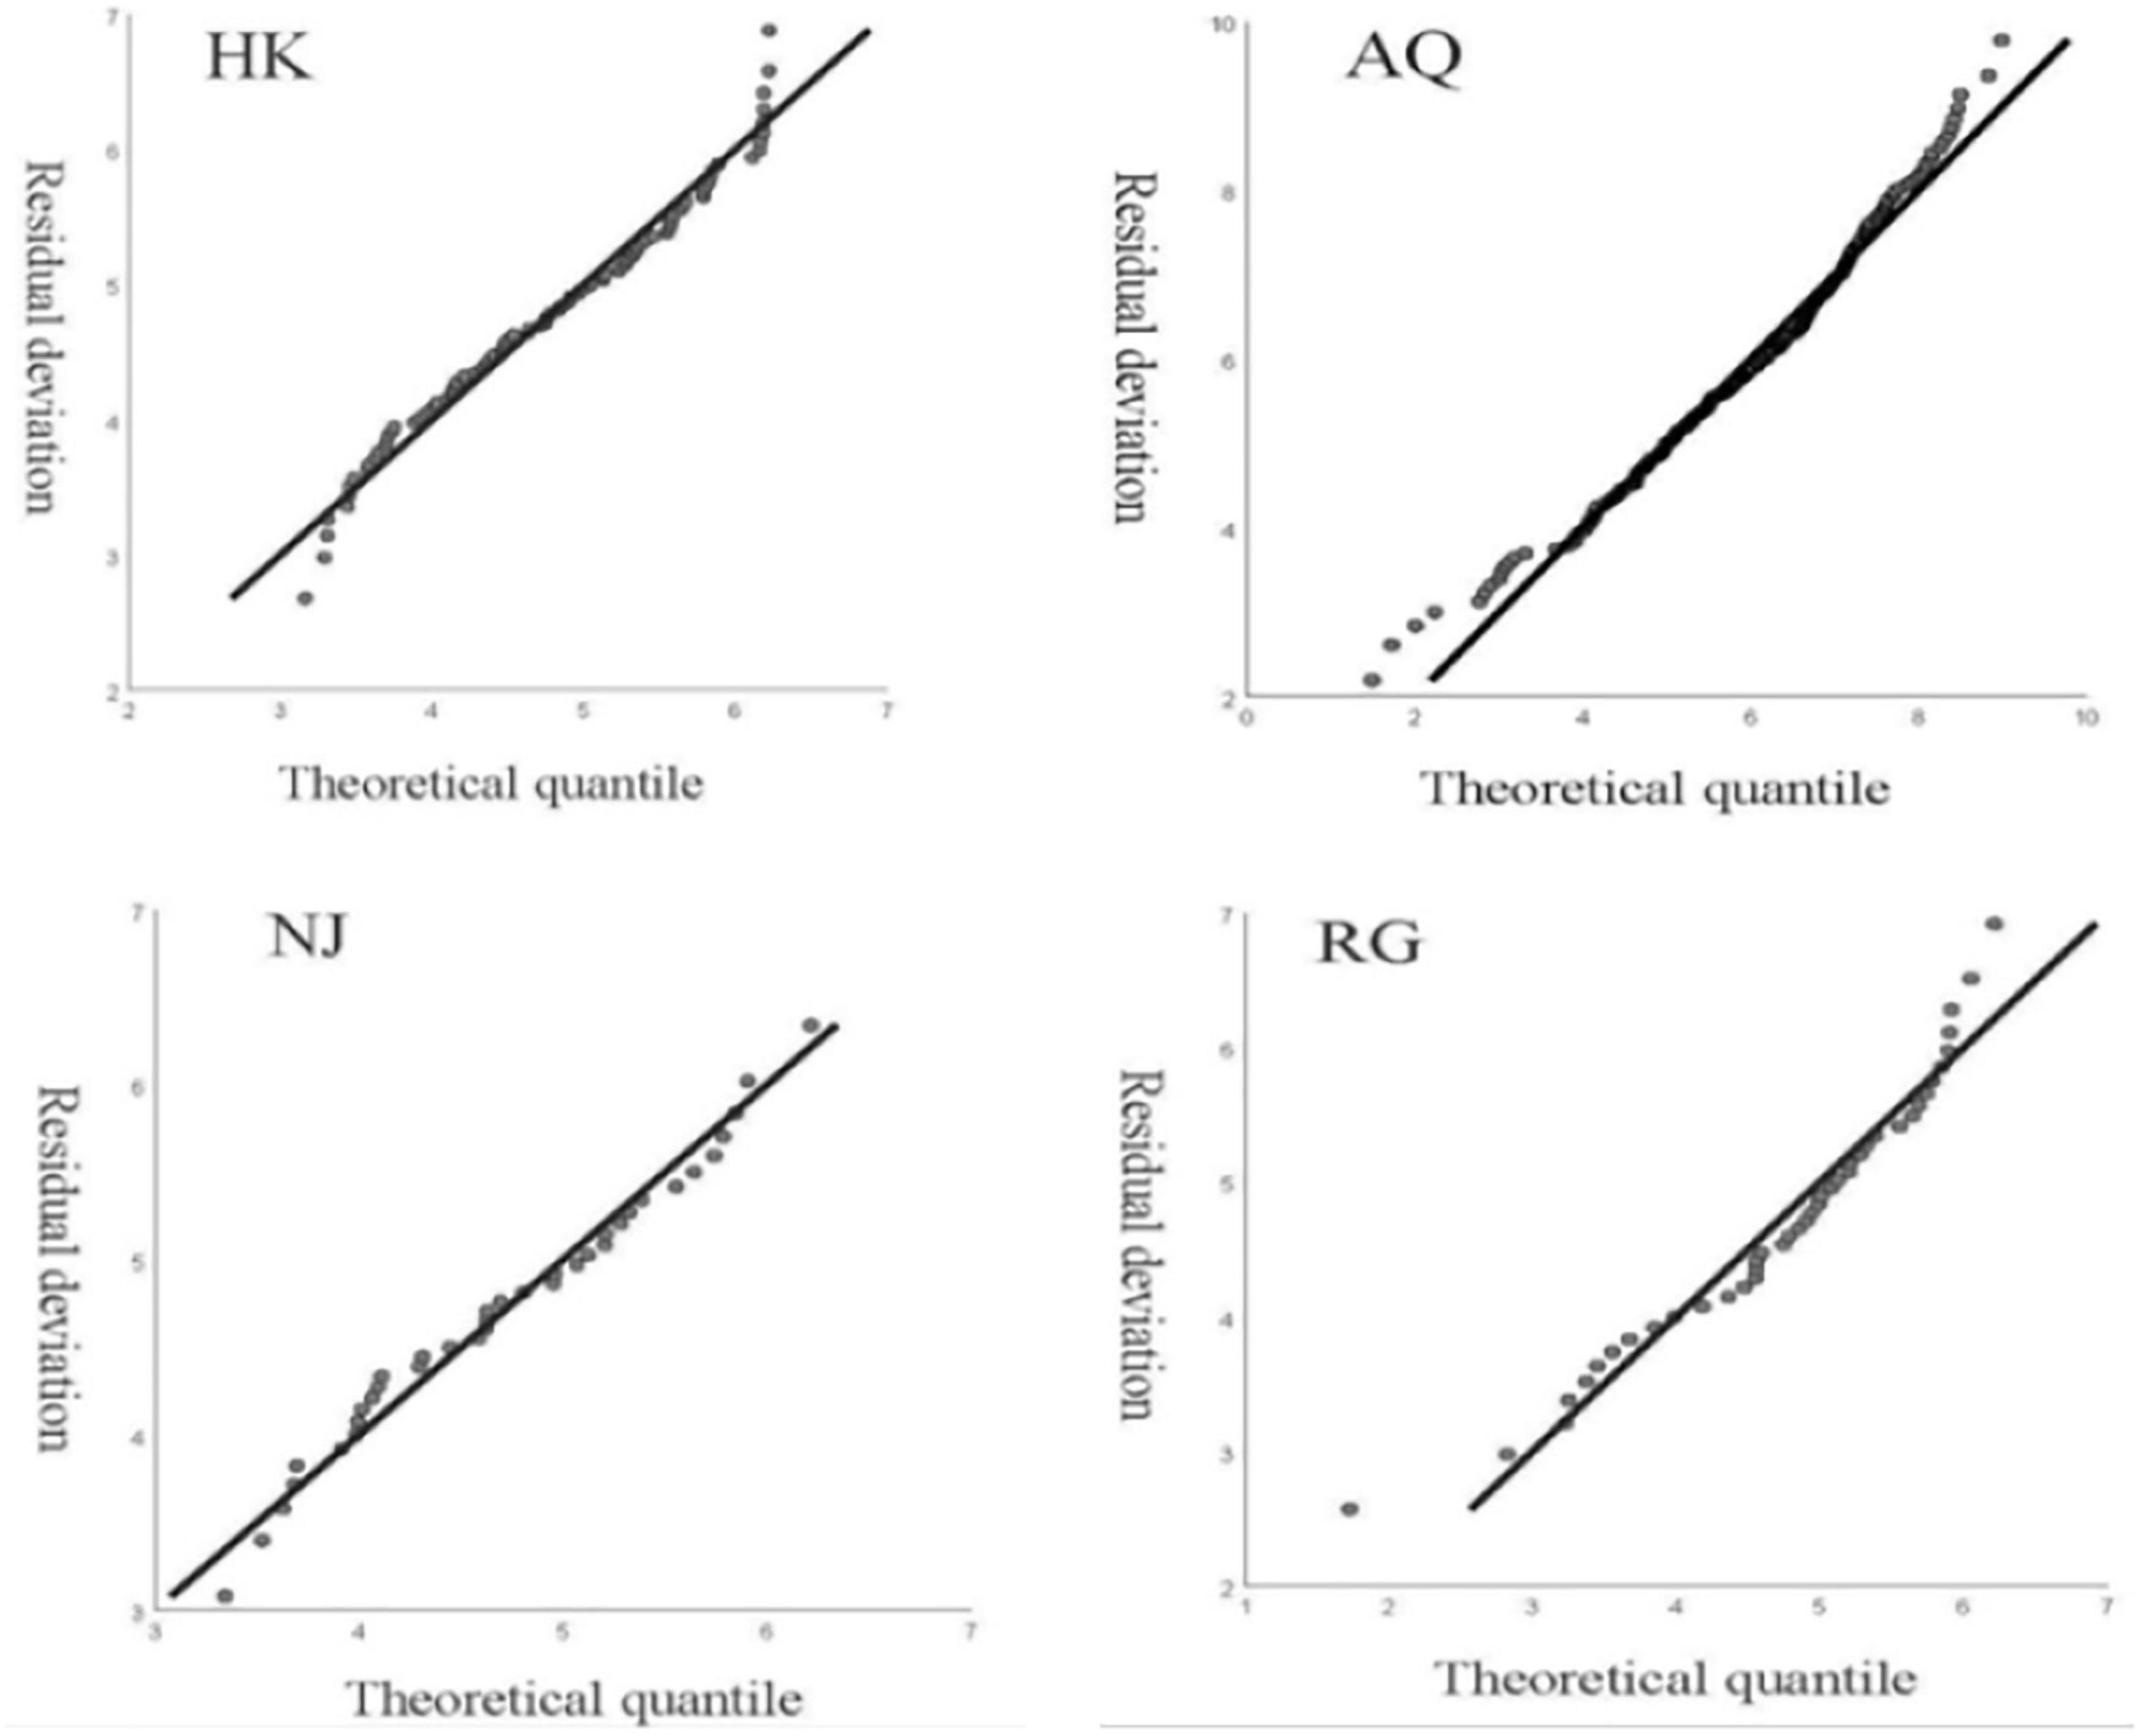
Figure 5. Quantile–Quantile (Q-Q) plot validations for GAM model. The QQ diagram showed the straight line (y = x) approximately. The slope of this straight line is the standard deviation; the QQ diagram can make the normality of the visual inspection.
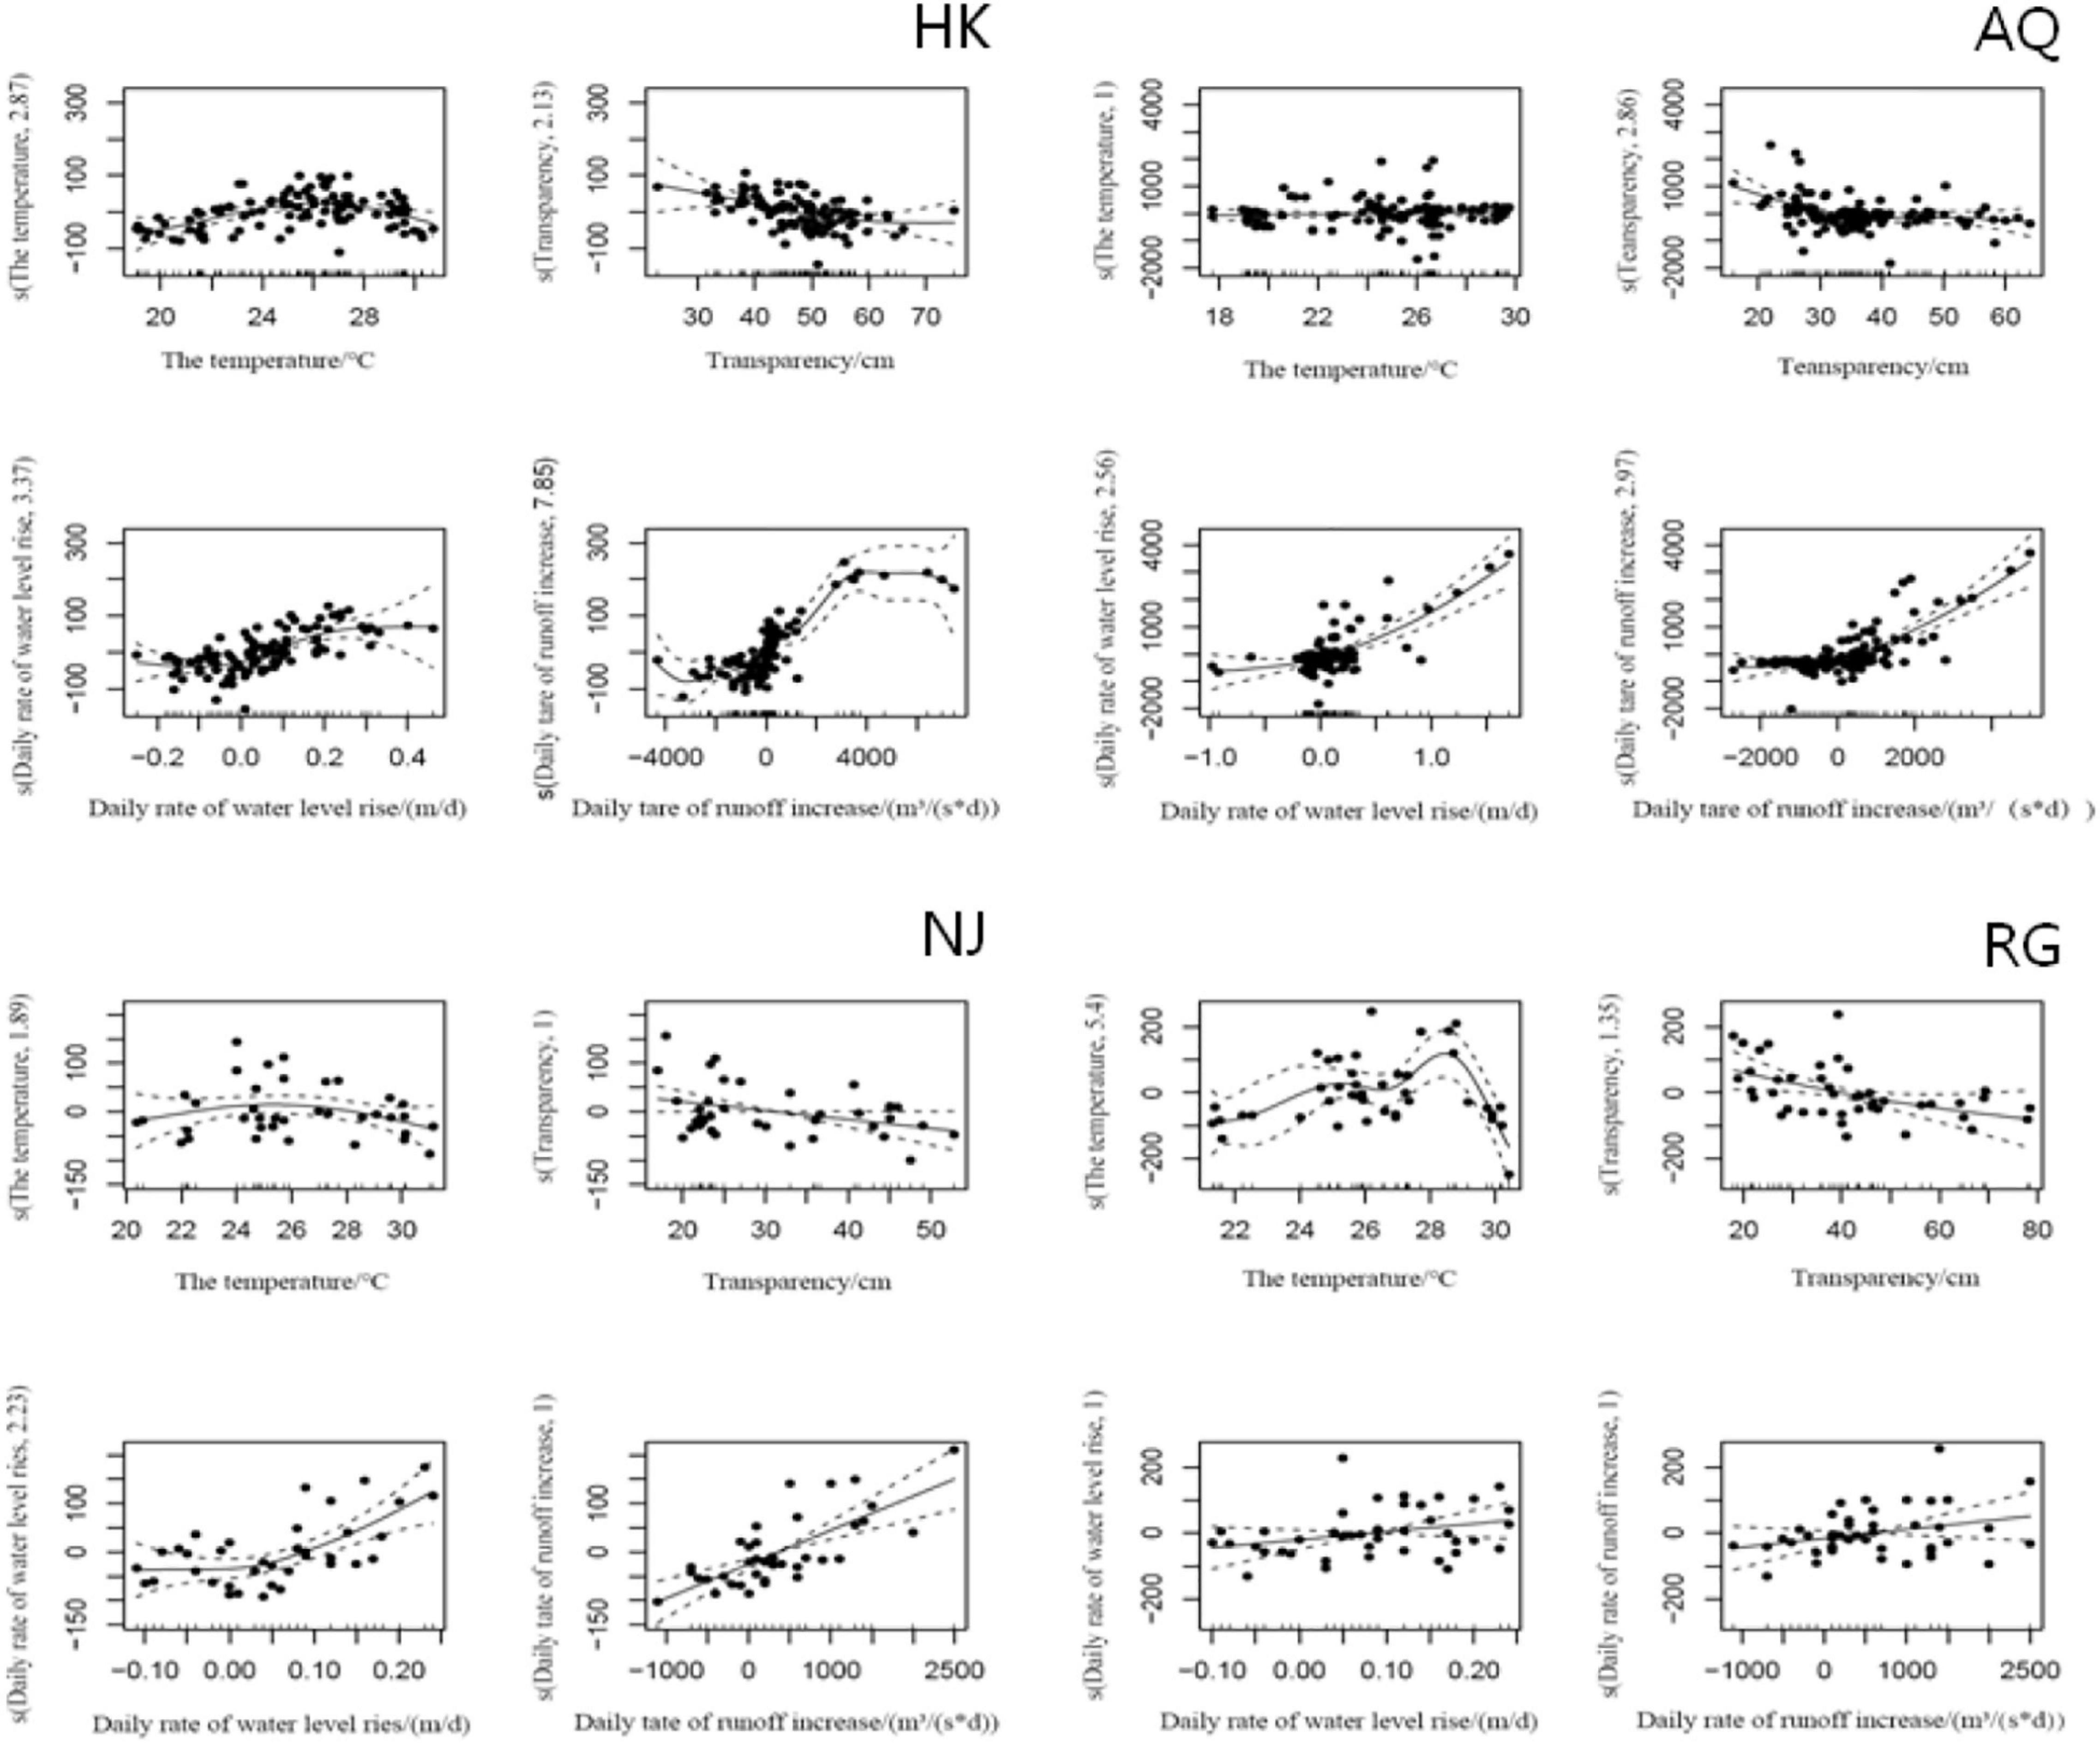
Figure 6. Generalized additive model analyses for ichthyoplankton in the sampled section. The ordinate s() is the nonparametric smoothing term, and the abscissa is the parameter value. The solid line represents the regression curve obtained by automatically determining the smoothing parameters, and the dotted line represents the possible variation range of the regression curve.
Results on the deviation interpretation rate of environmental factors showed that the order of hydrologic factors contributed to the fish larvae density differently (Table 4, p < 0.05). In the HK, AQ, and NJ sections, DIWL and DIWR had the higher contribution rate to the change in ichthyoplankton density, followed by WT and WTP. In the RG section, because of the tidal condition, DIWL and DIWR almost had no contribution to the change in ichthyoplankton density, whereas WT and WTP were the main contributory factors.
Based on the sequential systematic surveys, this study provided an extensive content of ichthyoplankton species composition and community structure in the lower reaches of the Changjiang River. The investigation results showed that larval fish species were more abundant than that reported in the previous study (Ren et al., 2016). It was found that most freshwater resident and river–lake migration fish species were sampled in the HK section, where have the river–lake connectivity feature. In the AQ section, it was found eight species of the river–lake migration fish species, accounting for 10.54%, which was lower than that of settled fish in lakes (Zhang et al., 2019; Jia et al., 2021). In the AQ section with many beaches, it can provide sufficient baits for the breeding of freshwater resident fish. In the lower sections, such as the NJ and RG sections, the ichthyoplankton composition obviously differed. The NJ section is located in the developed channel section, which could be the reason the fish species composition of ichthyoplankton was lower when compared with the other sampled sections (Wan et al., 2010). In the RG section, due to the dual effects of tides and runoff, migratory species increased sharply, C. nasus was the dominate species (Sokta et al., 2020), and there was almost no river–lake migration fish species were found. Results suggested that fish larvae species composition had a close relationship with the distinctive habitat.
It is well known that the ichthyoplankton community directly reflected the community structure of the adult fish (Thompson et al., 2019). Two primary factors affect the community structure of ichthyoplankton over time: the endogenous factor is fish life history, and the exogenous factor is external biological factors (Mohammad et al., 2021). In terms of endogenous factors, one species such as H. bleekeri occupied an absolutely dominant position throughout the survey period. Its breeding season is long, sexual maturity occurs early, and this species has a rapid generation replacement rate. For these reasons, it is a typical opportunistic strategy fish species, so that the species always occupies the dominant population position in the larval fish stages during the breeding period (Bayne, 2017). The other species such as C. alburnus are voracious carnivores, and their larvae begin to feed on fish larvae of other species so that the mandarin fish density began to increase in June and peaked in early July. Regarding the exogenous biological factor, there has been a significant impact on the ichthyoplankton density and community structure (Marina et al., 2021). Some studies have pointed out that rich bait promoted the reproduction of mandarin fish (Hu et al., 2021). Hence, results indicated that fish larvae specie’s community structure was also determined by the reproductive stratagem of their parent fish species and around biological factors (Yi et al., 2010).
Changes in the ichthyoplankton community composition structure also directly reflected the specific breeding time (Thompson et al., 2019). In the HK section, ichthyoplankton appeared in large numbers primarily from early May to late July, and the total density reached its peak in late June, perhaps due to the peak breeding period of fish species (Zhang et al., 2019). As induced by the increases in water level and water flow, the number of fish species number and density of ichthyoplankton reached a peak, which indicated the importance of river–lake connectivity to its community structure (Yi et al., 2010). It has been suggested that a spatial-temporal match between the occurrence of larval fish and the bloom of its corresponding initial food was critical for the successful recruitment of larval fish populations (Katsuragawa et al., 2014). Here, the high density of fish larvae in June revealed that most fish species in the surveyed sections spawned in early summer (in May or in June). Fish selects to spawn during early summer, which is likely to ensure a sufficient food supply and appropriate environmental conditions for their offspring, subsequently leading to high densities of fish larvae in July (Álvarez et al., 2012).
The differences in density of ichthyoplankton are the combined result of many environmental factors and adult fish reproductive behavior (Fernández-Alías et al., 2020). The RDA results showed that WT, WF, and WTP were critical environmental factors affecting the community structure of ichthyoplankton. Related studies have shown that WT was the most important environmental factor affecting the physiology, biochemistry, and life history of fish (Machado et al., 2017). Our results showed that the most suitable temperature for spawning of the surveyed fish species ranged from 18.6 to 26.8°C, which was consistent with the previous result (Lin et al., 2016). As we all know, rainfall increases in spring and summer, and it flows into the river, a rise of water level, resulting in bloom in both river flow and water level. RL migratory fish usually enters the Changjiang River from lakes or inlets for breeding as the water level rises (Rogers et al., 2019). Furthermore, seasonal flooding induced circulation of nutrients and energy flow in the river floodplain system due to the flood pulse, which in turn promoted the reproduction of river resident fish species (Nagel et al., 2021). Results also showed that water flow and the water level had a high contribution rate to the change in ichthyoplankton density, which was consistent with our findings (Paugy, 2002; Zhang et al., 2019). Furthermore, too high or too low WTP had a definite impact on fish feeding and breeding (Shahidul Islam and Tanaka, 2004). It has been reported that there was a significant negative correlation between the density of four major Chinese carp species, C. alburnus, S. chuatsi, and WTP, which is also supported by our results (Yi et al., 2010; Wang et al., 2019).
The total ichthyoplankton density deviation interpretation rate, as determined using the optimized GAM, was above 69%, which indicated that hydrological factors affected the density of ichthyoplankton. Results of GAM model analysis in this study showed that WT, WTP, the DIWL, and DIWR were significantly correlated with the larval fish density, but the contribution frequency to larval fish density was different among the hydrological factors (Supplementary Table 4). The increase of river runoff will lead to the rise of water level, which results in a bloom of larval fish appearing, also inducing the high occurrence frequency of larval fish density. For example, in July 2020, due to the surge of precipitation in the Changjiang River basin and the flood runoff, the water level and river runoff in the sampled sections increased significantly, and the larval fish density reached the highest level, but the occurrence frequency decreased significantly. Results indicated that high larval fish density was formed by the cooperation of the hydrological conditions and not decided by one of the discussed factors (Yi et al., 2010; Álvarez et al., 2012).
Many scholars regarded community diversity as an important yardstick for judging community stability (Shin and Cury, 2001). In the different sampled sections, the diversity indexes provided an indicator for determining ichthyoplankton abundance and diversity. In this study, species diversity indexes (Margalef, Shannon, and Pielou’s) exhibited an upward trend during the survey period (Supplementary Table 3); perhaps due to the implementation of the fishing ban, fish resources in the Changjiang River have exhibited remarkable recovery (Hu et al., 2021). This high ichthyoplankton diversity also reflected that there was locally high diversity in the adult fish population (Mohammad et al., 2021). The diversity index in the AQ section was higher than the other three sections, possibly due to the fact that the AQ section connected with Wan River (Figure 1) and formed the stable forked river with a lot of sandbanks, where the terrain is flat and open, resulting in the accumulation of nutrients so that it can provide superior habitats for fish spawning and living (Ren et al., 2016). It is well known that the HK section is in the typical river–lake connection ecosystem. When it was compared with the two downstream sections, the diversity index in this section also presented prevalent advantages. The NJ and RG sections are located in tidal sections, especially for the RG section, which is subjected to tidal action several times a day. Results indicated that the complex hydrological environment is not suitable to the survival of fish larvae and resulting in a lower diversity index.
In the literature, it has been reported that the fish larvae preferred to live near the river bank with enriched baits and migrated to calmer water such as inlets for later development (Álvarez et al., 2012; Goldstein et al., 2019). Many scholars also have reported that special habitats are closely related to fish reproduction and spawning behavior (Shuai et al., 2018; Goldstein et al., 2019). Interestingly, the HK section exhibited typical river–lake connectivity characteristics, which can provide good habitats for fish spawning. During the sampling period, when water flow increased rapidly, it enabled fish that lay drifting eggs to assume an absolute advantage in number. Although the number of fish laying sticking eggs was relatively small, the increasing water flow would lead to an increase in water level, and thus, the vegetation on both sides of the river covered and provided attachment for sticking eggs. The ichthyoplankton proportion of RL migratory fish species was relatively higher in the HK and AQ sections, perhaps due to this distinctive connectivity feature between the river and lake (Figure 1).
Fish larvae distribution patterns are in the dynamic equilibrium created by the lifting force of the current. Their community composition was affected by river morphology and flow, and the capacity to select their habitat is very weak (Wang et al., 2019). When the sampling site was close to the bank, and the flow, there was relatively gentle due to the barrier of water-bearing plants and the shoreline (Liu et al., 2019). Therefore, the left river bank was found to be more suitable for the survival of ichthyoplankton than the right river bank. Results also indicated that larval fish tends to be distributed in areas of a river where the flow velocity is low, the natural shoreline vegetation is intact, and human disturbances are minimal (Yi et al., 2010; Zhang et al., 2019). Most water inlets had higher fish larvae abundance, which perhaps indicated that inlets are ideal nursery grounds in the studied region (Zhang et al., 2017). Total above results indicated that the distribution pattern of ichthyoplankton was dependent on both the river section habitat and hydrodynamic characteristics.
Surveys on the early life history stages of fish can play a crucial role in elucidating the recruitment process of the adult population and their relationship between environmental factors (Álvarez et al., 2012; Lin et al., 2016). Knowledge about the distribution pattern of fish larvae revealed essential information for guiding the efficient management and conservation of fish resources. Our studies showed the assemblage patterns of larval fish, spatial-temporal changes in ichthyoplankton in different river sections, and clarified the relationship between their density and environmental factors. Totally, assemblages of ichthyoplankton in the Changjiang River lower reaches were illuminated, although additional work is needed to assess effects on survival and recruitment. Our findings could facilitate the formulation of policies to protect fisheries’ resources in conjunction with other scientific data (Chen et al., 2020). However, this was only a preliminary study on the distribution of ichthyoplankton in the sampled area; the plankton distribution and effect of plants on the ichthyoplankton community will be explored in more detail in the subsequent investigation. Therefore, it is particularly important to study fish assemblage patterns in affected areas to identify key functional groups with specific environmental sensitivities and formulate adequate policies for protecting fisheries’ resources. Because of the unique spatial heterogeneity of the interchange between rivers and lakes, it is urgent to formulate different protection and management policies for different fish spawning grounds, nursery grounds, and key environmental factors that affect fish reproduction, so that they can effectively contribute to the supplementary population.
The raw data supporting the conclusion of this article will be made available by the authors, without undue reservation.
D-AF was responsible for data scoring and analysis and wrote the manuscript. D-PX conceived and designed the experiments. X-PX, X-HW, N-ZS, PR, and B-DZ helped selecting the icythyoplankton sample, survey work, and data analysis during the manuscript preparation. All authors have read and approved the final manuscript.
This study was funded by the National Key Research and Development Program of China (2019YFD0901205) and the science and technology innovation team special project from CAFS (2020TD61).
The authors declare that the research was conducted in the absence of any commercial or financial relationships that could be construed as a potential conflict of interest.
All claims expressed in this article are solely those of the authors and do not necessarily represent those of their affiliated organizations, or those of the publisher, the editors and the reviewers. Any product that may be evaluated in this article, or claim that may be made by its manufacturer, is not guaranteed or endorsed by the publisher.
We thank three reviewers for their constructive suggestions and rigorous comments.
The Supplementary Material for this article can be found online at: https://www.frontiersin.org/articles/10.3389/fmars.2021.759429/full#supplementary-material
Akaike, H. (1973). “Information Theory and an Extension of the Maximum Likelihood Principle,” in Proceedings of the 2nd International Symposium on Information Theory, eds B. N. Petrov and F. Csaki (Budapest: Academiai Kiado), 267-281.
Álvarez, I., Catalán, I., Jordi, A., Palmer, M., Sabatés, A., and Basterretxea, G. (2012). Drivers of larval fish assemblage shift during the spring-summer transition in the coastal Mediterranean. Estuar. Coast. Shelf Sci. 97, 127–135.
Amorim, E., Ramos, S., Elliott, M., Franco, A., and Bordalo, A. A. (2017). Habitat loss and gain: influence on habitat attractiveness for estuarine fish communities. Estuar. Coast. Shelf Sci. 197, 244–257.
Bayne, B. L. (2017). “Chapter 9 - Reproduction,” in Developments in Aquaculture and Fisheries Science, ed. B. Bayne (Amsterdam: Elsevier), 565–701.
Borges, R., Ben-Hamadou, R., Chícharo, M. A., Ré, P., and Gonçalves, E. J. (2007). Horizontal spatial and temporal distribution patterns of nearshore larval fish assemblages at a temperate rocky shore. Estuar. Coast. Shelf Sci. 71, 412–428. doi: 10.1016/j.ecss.2006.08.020
Bryan, B. A., Gao, L., Ye, Y., Sun, X., and Hou, X. (2018). China’s response to a national land-system sustainability emergency. Nature 559, 193–204. doi: 10.1038/s41586-018-0280-2
Cao, W., Chang, J., Qiao, Y., and Duan, Z. (2007). Fish resources of early life history stages in Yangtze River. Beijing: China Water Power Press. Chinese.
Chen, T., Wang, Y., Gardner, C., and Wu, F. (2020). Threats and protection policies of the aquatic biodiversity in the Yangtze River. J. Nat. Conserv. 58:125931. doi: 10.1016/j.jnc.2020.125931
Chen, Y., Zhang, S., Huang, D., Li, B., Liu, J., Liu, W., et al. (2017). The development of China’s Yangtze River Economic Belt: how to make it in a green way? Sci. Bull. 62, 648–651. doi: 10.1016/j.scib.2017.04.009
Cheng, F., Li, W., Wu, Q. J., Murphy, B. R., and Xie, S. G. (2013). MOTU analysis of ichthyoplankton biodiversity in the upper Yangtze River, China. J. Appl. Ichthyol. 29, 872–876. doi: 10.1111/jai.12207
Citores, L., Ibaibarriaga, L., Lee, D. J., Brewer, M. J., Santos, M., and Chust, G. (2020). Modelling species presence–absence in the ecological niche theory framework using shape-constrained generalized additive models. Ecol. Model. 418:108926. doi: 10.1016/j.ecolmodel.2019.108926
Daskalov, G. (1999). Relating fish recruitment to stock biomass and physical environment in the Black Sea using generalized additive models. Fish. Res. 41, 1–23. doi: 10.1016/s0165-7836(99)00006-5
Fernández-Alías, A., Marcos, C., Quispe, J. I., Sabah, S., and Pérez-Ruzafa, A. (2020). Population dynamics and growth in three scyphozoan jellyfishes, and their relationship with environmental conditions in a coastal lagoon. Estuar. Coast. Shelf Sci. 243:106901. doi: 10.1016/j.ecss.2020.106901
Fu, C., Wu, J., Chen, J., Wu, Q., and Lei, G. (2003). Freshwater fish biodiversity in the Yangtze River basin of China: patterns, threats and conservation. Biodivers. Conserv. 12, 1649–1685.
Gao, L., Cheng, F., Song, Y., Jiang, W., Feng, G., Luo, Y., et al. (2018). Patterns of larval fish assemblages along the direction of freshwater input within the southern branch of the Yangtze Estuary, China: implications for conservation. J. Freshw. Ecol. 33, 97–114. doi: 10.1080/02705060.2018.1426503
Gao, Y., Chen, L., Zhang, W., Li, X., and Xu, Q. (2021). Spatiotemporal variations in characteristic discharge in the Yangtze River downstream of the Three Gorges Dam. Sci. Total Environ. 785:147343. doi: 10.1016/j.scitotenv.2021.147343
Goldstein, E. D., Duffy-Anderson, J. T., Matarese, A. C., and Stockhausen, W. T. (2019). Larval fish assemblages in the eastern and western Gulf of Alaska: patterns, drivers, and implications for connectivity. Deep Sea Res. II Top. Stud. Oceanogr. 165, 26–40. doi: 10.1016/j.dsr2.2018.09.003
Hu, F., Zhong, H., Wu, C., Wang, S., Guo, Z., Tao, M., et al. (2021). Development of fisheries in China. Reprod. Breed. 1, 64–79.
Hu, M., Liu, Y., Zhang, Y., Shen, H., Yao, M., Dahlgren, R. A., et al. (2020). Long-term (1980–2015) changes in net anthropogenic phosphorus inputs and riverine phosphorus export in the Yangtze River basin. Water Res. 177:115779. doi: 10.1016/j.watres.2020.115779
Jia, W., Zhang, X., and Wang, Y. (2021). Assessing the pollutant evolution mechanisms of heavy pollution episodes in the Yangtze-Huaihe valley: a multiscale perspective. Atmos. Environ. 244:117986. doi: 10.1016/j.atmosenv.2020.117986
Jin, X., and Tang, Q. (1996). Changes in fish species diversity and dominant species composition in the Yellow Sea. Fish. Res. 26, 337–352. doi: 10.1371/journal.pone.0216590
Katsuragawa, M., Dias, J. F., Harari, J., Namiki, C., and Zani-Teixeira, M. L. (2014). Patterns in larval fish assemblages under the influence of the Brazil current. Cont. Shelf Res. 89, 103–117. doi: 10.1016/j.csr.2014.04.024
Lin, H.-Y., Chiu, M.-Y., Shih, Y.-M., Chen, I. S., Lee, M.-A., and Shao, K.-T. (2016). Species composition and assemblages of ichthyoplankton during summer in the East China Sea. Cont. Shelf Res. 126, 64–78. doi: 10.1016/j.csr.2016.07.016
Liu, X., Qin, J., Xu, Y., Ouyang, S., and Wu, X. (2019). Biodiversity decline of fish assemblages after the impoundment of the Three Gorges Dam in the Yangtze River Basin, China. Rev. Fish Biol. Fish. 29, 177–195. doi: 10.1007/s11160-019-09548-0
Machado, I., Calliari, D., Denicola, A., and Rodríguez-Graña, L. (2017). Coupling suitable prey field to in situ fish larval condition and abundance in a subtropical estuary. Estuar. Coast. Shelf Sci. 187, 31–42. doi: 10.1016/j.ecss.2016.12.021
Marina, B., Svetlana, K., and Francesco, F. (2021). The long-term ichthyoplankton abundance summer trends in the coastal waters of the Black Sea under conditions of hydrometeorological changes. Estuar. Coast. Shelf Sci. 258:107450.
Medeiros, M. C., Barboza, R. R. D., Martel, G., and Mourão, J. D. S. (2018). Combining local fishers’ and scientific ecological knowledge: implications for comanagement. Ocean Coast. Manag. 158, 1–10. doi: 10.1007/s13280-019-01154-5
Mohammad, A. C., Shabani, A., Naddafi, R., Ghorbani, R., Rabbaniha, M., and Noorinejad, M. (2021). Diversity, distribution, and abundance patterns of ichthyoplankton assemblages in some inlets of the northern Persian Gulf. J. Sea Res. 167:101981.
Nagel, C., Mueller, M., Pander, J., Stoeckle, B. C., and Geist, J. (2021). Going with the flow: spatio-temporal drift patterns of larval fish in a large alpine river. Freshw. Biol. 66, 1765–1781. doi: 10.1111/fwb.13790
Pan, B. Z., Wang, H. Z., Ban, X., and Yin, X. A. (2015). An exploratory analysis of ecological water requirements of macroinvertebrates in the Wuhan branch of the Yangtze River. Quat. Int. 380, 256–261. doi: 10.1016/j.quaint.2014.10.011
Paugy, D. (2002). Reproductive strategies of fishes in a tropical temporary stream of the Upper Senegal basin: baoulé River in Mali. Aquat. Living Resour. 15, 25–35. doi: 10.1016/s0990-7440(01)01144-5
Ren, P., He, H., Song, Y., Cheng, F., and Xie, S. (2016). The spatial pattern of larval fish assemblages in the lower reach of the Yangtze River: potential influences of river–lake connectivity and tidal intrusion. Hydrobiologia 766, 365–379. doi: 10.1007/s10750-015-2471-2
Rogers, T. A., Fowler, A. J., Steer, M. A., and Gillanders, B. M. (2019). Spatial connectivity during the early life history of a temperate marine fish inferred from otolith microstructure and geochemistry. Estuar. Coast. Shelf Sci. 227:106342. doi: 10.1016/j.ecss.2019.106342
Saunders, D. L., Meeuwig, J. J., and Vincent, A. (2002). Freshwater Protected Areas: strategies for Conservation. Conserv. Biol. 16, 30–41. doi: 10.1046/j.1523-1739.2002.99562.x
Shahidul Islam, M., and Tanaka, M. (2004). Impacts of pollution on coastal and marine ecosystems including coastal and marine fisheries and approach for management: a review and synthesis. Mar. Pollut. Bull. 48, 624–649. doi: 10.1016/j.marpolbul.2003.12.004
Shannon, C. E., and Weaver, W. (1949). The Mathematical Theory of Communication. Urbana: University of Illinois Press.
Shin, Y. J., and Cury, P. (2001). Exploring fish community dynamics through size-dependent trophic interactions using a spatialized individual-based model. Aquat. Living Resour. 14, 65–80.
Shuai, F., Lek, S., Baehr, C., Park, Y.-S., Li, Y., and Li, X. (2018). Silver carp larva abundance in response to river flow rate revealed by cross-wavelet modelling. Ecol. Model. 383, 98–105. doi: 10.1016/j.ecolmodel.2018.05.020
Sokta, L., Jiang, T., Liu, H., Xuan, Z., Qiu, C., Chen, X., et al. (2020). Loss of Coilia nasus habitats in Chinese freshwater lakes: an otolith microchemistry assessment. Heliyon 6:e04571. doi: 10.1016/j.heliyon.2020.e04571
Song, Y., Cheng, F., Ren, P., Wang, Z., and Xie, S. (2019). Longitudinal recovery gradients of drifting larval fish assemblages in the middle reach of the Yangtze River: impact of the Three Gorges Dam and conservation implementation. Can. J. Fish. Aquat. Sci. 76, 2256–2267.
Stacy-Duffy, W. L., Thomas, S., and Czesny, S. J. (2021). Exploring potential drivers of spatiotemporal variation in length-at-age and condition of two common nearshore fishes in southwestern Lake Michigan. J. Great Lakes Res. 47, 504–513.
Tao, J., Yang, Z., Cai, Y., Wang, X., and Chang, J. (2017). Spatiotemporal response of pelagic fish aggregations in their spawning grounds of middle Yangtze to the flood process optimized by the Three Gorges Reservoir operation. Ecol. Eng. 103, 86–94. doi: 10.1016/j.ecoleng.2017.03.002
Thompson, A. R., Harvey, C. J., Sydeman, W. J., Barceló, C., Bograd, S. J., Brodeur, R. D., et al. (2019). Indicators of pelagic forage community shifts in the California Current Large Marine Ecosystem, 1998–2016. Ecol. Indic. 105, 215–228. doi: 10.1016/j.ecolind.2019.05.057
Tulloch, V. J. D., Atkinson, S., Possingham, H. P., Peterson, N., Linke, S., Allan, J. R., et al. (2021). Minimizing cross-realm threats from land-use change: a national-scale conservation framework connecting land, freshwater and marine systems. Biol. Conserv. 254:108954. doi: 10.1016/j.biocon.2021.108954
Vorsatz, L. D., Pattrick, P., and Porri, F. (2021). Ecological scaling in mangroves: the role of microhabitats for the distribution of larval assemblages. Estuar. Coast. Shelf Sci. 253:107318. doi: 10.1016/j.ecss.2021.107318
Wan, R., Zhou, F., Shan, X., and Sun, S. (2010). Impacts of variability of habitat factors on species composition of ichthyoplankton and distribution of fish spawning ground in the Changjiang River estuary and its adjacent waters. Acta Ecol. Sin. 30, 155–165.
Wang, Y., Kao, Y.-C., Zhou, Y., Zhang, H., Yu, X., and Lei, G. (2019). Can water level management, stock enhancement, and fishery restriction offset negative effects of hydrological changes on the four major Chinese carps in China’s largest freshwater lake? Ecol. Model. 403, 1–10. doi: 10.1016/j.ecolmodel.2019.03.020
Wu, H., Chen, J., Xu, J., Zeng, G., Sang, L., Liu, Q., et al. (2019). Effects of dam construction on biodiversity: a review. J. Clean. Prod. 221, 480–489.
Yi, Y., Yang, Z., and Zhang, S. (2010). Ecological influence of dam construction and river-lake connectivity on migration fish habitat in the Yangtze River basin, China. Procedia Environ. Sci. 2, 1942–1954. doi: 10.1016/j.proenv.2010.10.207
Zhang, H., Kang, M., Shen, L., Wu, J., Li, J., Du, H., et al. (2020). Rapid change in Yangtze fisheries and its implications for global freshwater ecosystem management. Fish Fish. 21, 601–620. doi: 10.1111/faf.12449
Zhang, H., Li, J., Wu, J., Wang, C., and Kang, M. (2017). Ecological effects of the first dam on yangtze main stream and future conservation recommendations: a review of the past 60 years. Appl. Ecol. Environ. Res. 15, 2081–2097. doi: 10.15666/aeer/1504_20812097
Zhang, K., Jiang, F., Chen, H., Dibar, D. T., Wu, Q., and Zhou, Z. (2019). Temporal and spatial variations in zooplankton communities in relation to environmental factors in four floodplain lakes located in the middle reach of the Yangtze River, China. Environ. Pollut. 251, 277–284. doi: 10.1016/j.envpol.2019.04.139
Zhao, B., Yao, P., Li, D., and Yu, Z. (2021). Effects of river damming and delta erosion on organic carbon burial in the Changjiang Estuary and adjacent East China Sea inner shelf. Sci. Total Environ. 793:148610. doi: 10.1016/j.scitotenv.2021.148610
Keywords: river lake connectivity, environmental factors, fish larvae, species composition, spatial-temporal changes
Citation: Fang D-a, Xue X-p, Xu D-p, Wang X-h, Sun N-z, Zhang B-d and Ren P (2021) Ichthyoplankton Species Composition and Assemblages From the Estuary to the Hukou Section of the Changjiang River. Front. Mar. Sci. 8:759429. doi: 10.3389/fmars.2021.759429
Received: 16 August 2021; Accepted: 15 November 2021;
Published: 16 December 2021.
Edited by:
Tomaso Fortibuoni, Istituto Superiore per la Protezione e la Ricerca Ambientale (ISPRA), ItalyReviewed by:
Angela Cuttitta, National Research Council (CNR), ItalyCopyright © 2021 Fang, Xue, Xu, Wang, Sun, Zhang and Ren. This is an open-access article distributed under the terms of the Creative Commons Attribution License (CC BY). The use, distribution or reproduction in other forums is permitted, provided the original author(s) and the copyright owner(s) are credited and that the original publication in this journal is cited, in accordance with accepted academic practice. No use, distribution or reproduction is permitted which does not comply with these terms.
*Correspondence: Di-an Fang, ZmFuZ2RhQGZmcmMuY24=
†These authors have contributed equally to this work
Disclaimer: All claims expressed in this article are solely those of the authors and do not necessarily represent those of their affiliated organizations, or those of the publisher, the editors and the reviewers. Any product that may be evaluated in this article or claim that may be made by its manufacturer is not guaranteed or endorsed by the publisher.
Research integrity at Frontiers
Learn more about the work of our research integrity team to safeguard the quality of each article we publish.