 Trang Minh Duong1,2,3*
- 1Department of Coastal & Urban Risk & Resilience, IHE Delft Institute for Water Education, Delft, Netherlands
- 2Department of Water Engineering & Management, University of Twente, Enschede, Netherlands
- 3Harbour, Coastal and Offshore Engineering, Deltares, Delft, Netherlands
The many thousands of small tidal inlets (STIs), and their adjacent coastlines, are almost certain to be affected by climate change in multiple ways, due to their behaviour being closely linked to both oceanic and terrestrial drivers such as riverflow, sea level, and ocean waves, all which are projected to change over the 21st century. Development of risk informed adaptation strategies for these highly utilized and inhabited inlet-interrupted coast zones requires projections of both alongshore average coastline recession and alongshore variability in coastline position along the coast under future forcing conditions, the latter being an aspect that has not received much attention to date. Here, a combination of a process-based morphodynamic model (Delft3D) and the reduced complexity coastline model (SMIC), concurrently forced with tides, waves, riverflows, and sea level rise, is used to investigate both of these phenomena at STI-interrupted coasts. The models are here applied to schematised conditions representing two systems in Sri Lanka, representing two of the three main Types of STIs: Negombo lagoon – permanently open, locationally stable inlet (Type 1), and Kalutara lagoon – permanently open, alongshore migrating inlet (Type 2). Results indicate that, under a high emissions climate scenario following RCP 8.5, by end-century, the coastline adjacent to the Type 1 STI may experience an alongshore average recession as large as 200 m, and that the alongshore variability in coastline position may be up to twice that at present. The Type 2 STI is projected to experience an alongshore average coastline recession of about 120 m, and up to a 75% increase in alongshore variability in coastline position by end-century, relative to the present. Thus, both the alongshore average coastline recession and the increase in the alongshore variability in coastline position are greater at the Type 1 STI, compared to at the Type 2 STI. These findings highlight the importance of accounting for both alongshore average coastline recession and future changes in alongshore variability in coastline position when assessing coastal hazards and risk on inlet-interrupted coasts to adequately inform climate adaptation strategies.
Introduction
There are thousands small tidal inlets (STIs), known as “bar-built” or “barrier” estuaries, along the world’s coastline. These are most commonly found along wave-dominated, microtidal mainland coasts, comprising about 50% of the world’s coastline (Ranasinghe et al., 2013; Duong et al., 2016, 2017, 2018). Duong et al. (2016) defined STIs as systems that have little or no intertidal flats, backwater marshes or ebb tidal deltas, with the estuary/lagoon being separated from the ocean by a sand spit that is connected on one end to the mainland (unlike barrier islands where the barrier is not connected to the mainland). STI systems usually comprise inlet channels that are less than 500 m wide, connected to relatively shallow (average depth <10 m) estuaries/lagoons with surface areas less than 50 km2 (Duong et al., 2016). A majority of these STIs are located in tropical and sub-tropical regions with several examples in India, Sri Lanka, Vietnam, Florida (United States), South America (Brazil), West and South Africa, and SW/SE Australia (McSweeney et al., 2017). STI environs, including the inlet-adjacent coast, have historically supported a number of human activities, including navigation, sand mining, fishing, tourism, and waterfront developments (Kjerfve, 1994; Nicholls et al., 2007; Ranasinghe et al., 2013; Bamunawala et al., 2020a). Thus, any changes in inlet dynamics might negatively affect some or all of these human activities, with associated socio-economic losses (Ranasinghe et al., 2013; Bamunawala et al., 2020a,b).
The general behaviour of STIs is a function of fluvial processes (e.g., fluvial sediment fluxes) and oceanic processes [e.g., wave driven longshore sediment transport (LST)], all of which are projected to change as a result of climate change (Ranasinghe et al., 2013; Duong et al., 2016). Several studies over the last decade or so have shown that climate change will lead to multiple impacts in STI environs, including a decrease in inlet stability, erosion of inlet-adjacent coasts, erosion of estuary margin shorelines, permanent or frequent inundation of low lying areas along estuary margins, estuarine eutrophication, and toxic algal blooms (Duong et al., 2017, 2018; Bamunawala et al., 2020a,b, 2021).
Using the process-based Delft3D model, Duong et al. (2017, 2018) investigated how climate change might affect the stability (i.e., the inlet condition) of the three main STI Types: Type 1 – permanently open, locationally stable inlets, Type 2 – permanently open, alongshore migrating inlets, and Type 3 – seasonally/intermittently open, locationally stable inlets (Duong et al., 2016). These results showed that in general none of the three STI Types will change Types by the year 2100, but that the inlet stability level, represented by the widely used Bruun inlet stability criterion r = P/M [where P = ebb tidal prism which also takes into account the riverflow effect (m3), M = annual LST rate (m3/year)] (Bruun, 1978), will change due to climate change.
Climate change effects at STI environs will however not be limited to variations in inlet stability, but will also extend to the beaches adjacent to inlets. As inlet-adjacent beach areas are usually highly developed and utilised by local communities and businesses (fishing and tourism), any future changes in the beach position (i.e., recession/progradation) and plan form (i.e., alongshore variability) could have severe socio-economic ramifications. Reliable information on how much coastline recession on average as well as how much alongshore variability in coastline position can be expected with climate change, will be invaluable for local authorities who are faced with the difficult task of making decisions on how to adapt and mitigate the potential impacts on inlet-adjacent coasts while maximising gains from coastal zone investments. While studies to date have mostly focussed on deriving 21st century projections of alongshore average coastline recession (e.g., Ranasinghe et al., 2012, 2013; Dastgheib et al., 2018; Le Cozannet et al., 2019; Athanasiou et al., 2020; Vousdoukas et al., 2020), there have been virtually no investigations on whether climate change may also result in more/less alongshore variability in coastline position. This study takes a first step toward addressing this knowledge gap, for the particular case of STI-interrupted coasts, and excluding possible long term signatures of extreme events.
This study employs the same Delft3D models that were used by Duong et al. (2017, 2018) in combination with the Scale aggregated Model for Inlet-interrupted Coasts (SMIC), a reduced complexity model presented by Ranasinghe et al. (2013), to investigate how climate change might affect coastline recession and alongshore variability of STI-interrupted coasts. It should be noted that Duong et al. (2017) adopted schematised system bathymetries and forcing, while Duong et al. (2018) used real-world system bathymetries and forcing derived from detailed area specific dynamic downscaling of climate variables from two different Global Climate Models (GCMs). The results of the two approaches agreed very well, providing confidence in the schematised approach which is more widely and easily applicable, especially in data poor regions, due to significantly reduced input data requirements. This study is therefore based on the schematised approach.
Materials and Methods
The modelling approach used in this study revolves around the application of the process-based coastal area morphodynamic model Delft3D (to simulate alongshore variability in coastline position) and the reduced complexity coastline change model SMIC (to obtain projections of alongshore average coastline recession). The former is fully described in Lesser et al. (2004) and the latter is fully described in Ranasinghe et al. (2013). Brief descriptions of the two models are provided below.
Delft3D
Delft3D is a process-based model that combines a short wave model (SWAN), a depth-averaged flow module, a sediment transport module (van Rijn, 1993), and a bed level update scheme based on the 2D sediment continuity equation. Delft3D has an in-built morphodynamic accelerator MORFAC (Roelvink, 2006; Ranasinghe et al., 2011) to enable faster computations. The MORFAC approach represents the lag between hydrodynamic forcing and morphological response, by multiplying the bed levels computed after each hydrodynamic time step by a time varying or constant factor (MORFAC), which enables much faster computation. The upscaled new bathymetry computed after each hydrodynamic time step is used for the subsequent hydrodynamic time step. The model structure is shown in Figure 1A. The main output from Delft3D utilized in this study is the simulated alongshore variable mean water line position along the coastline of the study areas.
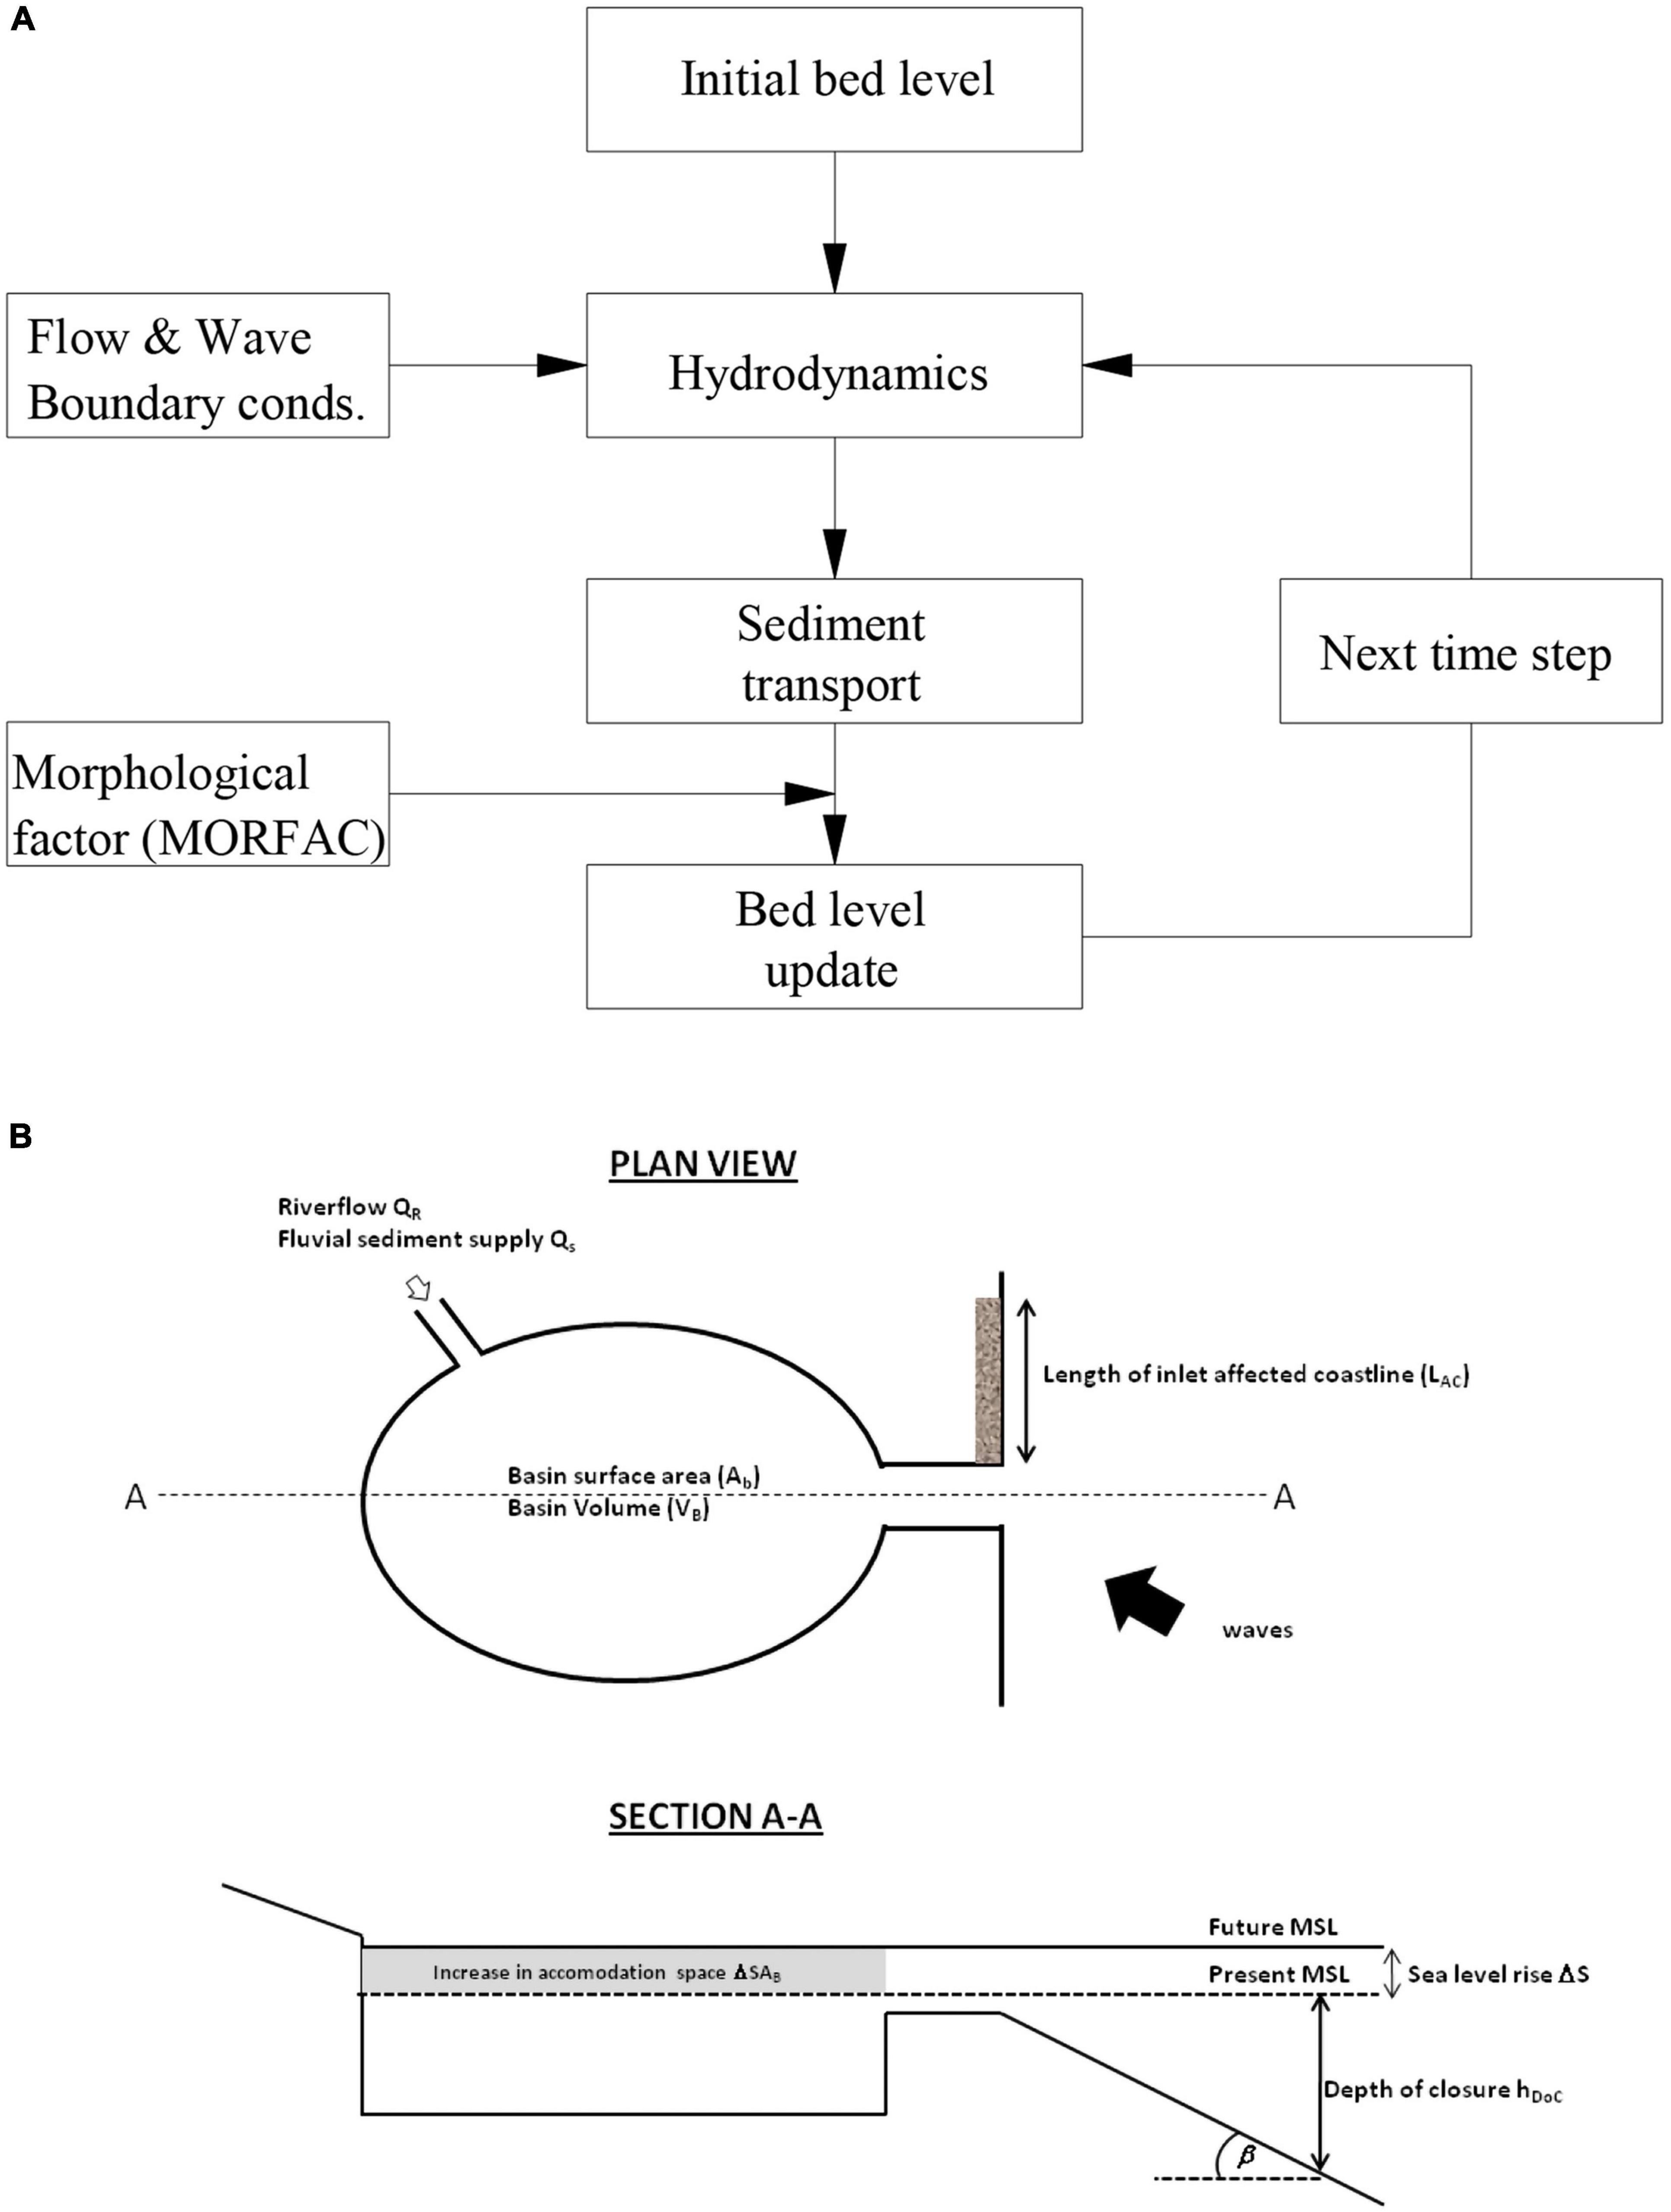
Figure 1. Modelling method: (A) Delft3D model structure and (B) schematic diagram illustrating the key processes accounted for in SMIC [(B) from Ranasinghe et al. (2013)].
Scale Aggregated Model for Inlet-Interrupted Coasts
The scale-aggregated model SMIC (Ranasinghe et al., 2013) provides rapid 100-year projections of coastline change adjacent to small inlet-interrupted coasts due to the combination of climate change driven sea level rise (SLR) (including Bruun effect and SLR driven basin infilling) and climate change driven variations in rainfall/runoff (including basin volume change and fluvial sediment supply effect). The schematic diagram of the model is shown in Figure 1B. The total “potential” coastline change due to the four main physical processes is calculated using Equation 1.
where, △CT is the total potential coastline recession (m), △CBE is the coastline change due to the SLR driven Bruun effect (m), △CBI is the coastline change due to the SLR driven basin infilling effect (m), △CBV is the coastline change due to the riverflow driven basin volume change effect (m), and DCFS is the coastline change due to the rainfall/runoff driven fluvial sediment supply change effect (m). The main output from SMIC utilized in this study is the projected alongshore average coastline recession by 2100 at the study areas.
Study Areas
This study focusses on two real-world STIs located along the South West (SW) coast of Sri Lanka: Negombo lagoon – permanently open, locationally stable inlets (Type 1) and Kalutara lagoon – permanently open, alongshore migrating inlets (Type 2). Type 3 STIs (seasonally/intermittently open, locationally stable inlets) were excluded from this study as the available modelling approaches do not allow the quantification of coastline recession and alongshore variability of inlet-adjacent coasts for systems that are only open for some part of the year, as is the case with Type 3 STIs. This study adopts the same schematised bathymetries developed for the two study areas in Duong et al. (2017).
The two study areas on which the schematised bathymetries are based on are shown in Figure 2. In general, Sri Lanka has a monsoonal climate with a Northeast monsoon and Southwest monsoon operating respectively in the months November–February and May–September. The country’s coastal environment is classified as micro-tidal, wave dominated with a mean tidal range of about 0.5 m and an average offshore significant wave height of 1.12 m (Duong et al., 2018). The SW coast, where the two study areas are located, experiences energetic wave conditions during the SW monsoon (significant wave heights of 1–2 m, incident from the SW-W octant). Almost the entire coastline of Sri Lanka contains sandy beaches with grain diameters (D50) varying between 0.2 and 0.45 mm depending on the location (Jayathilaka, 2015).
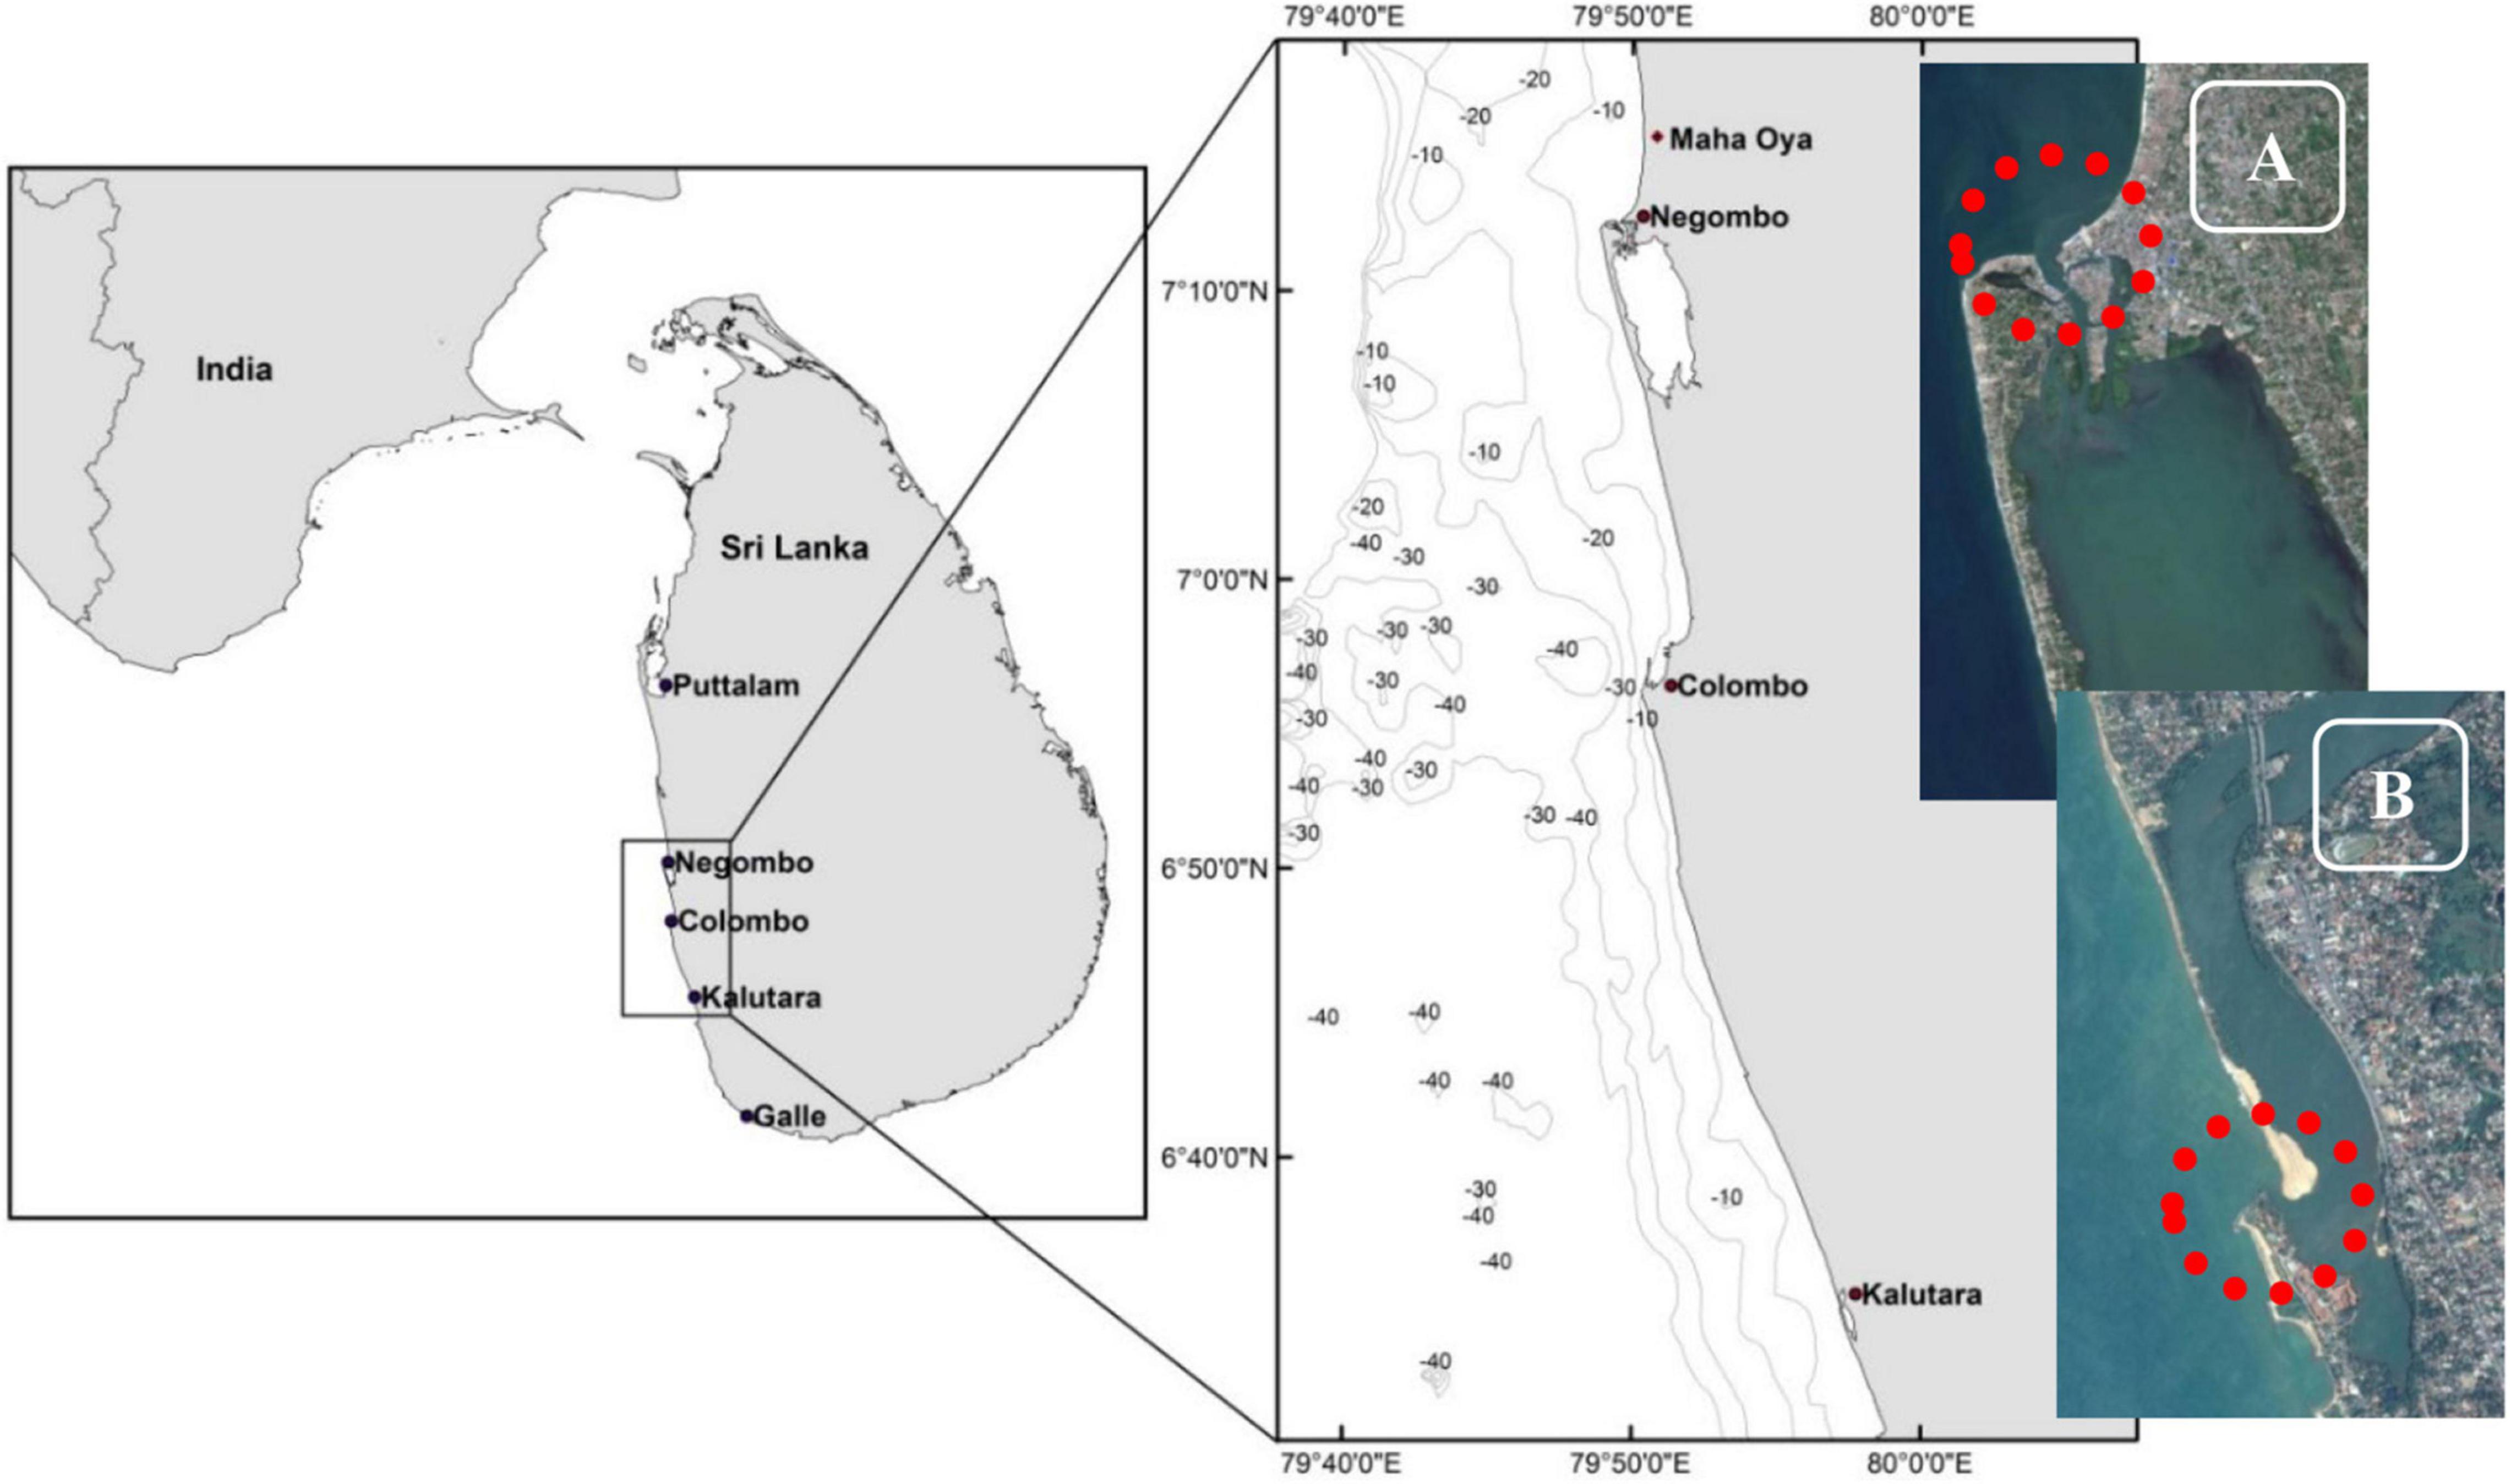
Figure 2. Location of Sri Lanka (left) and the two case study sites (right): (A) Type 1 – Negombo lagoon (permanently open, locationally stable inlet; top) and (B) Type 2 – Kalutara lagoon (permanently open, alongshore migrating inlet; bottom). Inlet locations are shown by the red dotted circles. The location of the capital city Colombo is also shown for reference.
Negombo Lagoon
Negombo lagoon (Figure 2A), situated about 30 km north of the capital Colombo, has a permanently open inlet channel with average dimensions of: width 400 m, length 300 m, depth 3 m. The lagoon is about 45 km2 in surface area and has an average depth of approximately 1 m. Due to sheltered nature of the coastline adjacent to the inlet, there is hardly any LST in the area (Chandramohan et al., 1990). Beach sand near the inlet has a D50 of 0.25 mm. Most of the riverflow into the lagoon occurs during the SW monsoon through several small streams. The combined average annual riverflow volume reaching the lagoon varies from almost 0 m3/s during dry seasons to more than 200 m3/s during rainy seasons (University of Moratuwa, 2003).
Kalutara Lagoon
Kalutara lagoon, situated about 40 km south of Colombo (Figure 2B), historically had a permanently open, alongshore migrating (north to south) inlet, before it was artificially stabilized in the south. The historical alongshore migration cycle of the inlet had a 3–4 year cycle during which the inlet migrated about 2 km to the south (∼ 500 m/year southerly migration) before a more hydraulically efficient new inlet was created (naturally or artificially) at the northern end of the lagoon barrier (Perera, 1993). The inlet channel has average dimensions of: width 150 m, length 150 m, and depth 4.5 m. The lagoon has a small surface area of less than 2 km2 and its average depth is about 3 m. Due to the highly exposed nature of the coast, the net LST rate along the sand barrier fronting the lagoon is about 0.5 million m3/year to the south. The beach sand along this part of the coast has a D50 of 0.25 mm. Kalutara lagoon derives riverflow from the Kalu river, which has the second highest annual riverflow volume (∼ 7500 million m3/year) in the country. As the catchment of the Kalu river receives rainfall during both the SW and NE monsoons, river discharges are higher than 100 m3/s most of the year (peak flows greater than 280 m3/s in June and October).
Schematised Bathymetries
The first step in the schematised modelling approach is to generate a schematic, simplified bathymetry that follows the main characteristics of the target real-world system. The key system dimensions determined from available literature and Google Earth, and used in creating the schematised bathymetries (in Figure 3), are shown in Table 1. The schematised STI bathymetries consist of a rectangular flat-bed estuary/lagoon connected to the ocean through a straight channel. The near-shore zone consists of shore parallel depth contours, down to 10 m depth, following a Dean’s equilibrium profile corresponding with the local median sediment diameter of the area (also given in Table 1). Riverflow was introduced to the estuary/lagoon based on observation at the target STI as a flow discharge at the landward boundary of the domain. Model grid resolutions in both cross-shore and alongshore directions were optimised for Delft3D computations. High resolution (∼ 10 m × 10 m) grid cells were used in the (approximate) surf zone and inlet channel, to ensure that key physical processes in the vicinity of the inlet entrance and channel were accurately resolved by the model. The flow computational domain was extended 5 km either side of the inlet to avoid boundary instabilities affecting the area of interest (i.e., the inlet entrance), and the wave domain was created larger than flow domain to avoid any wave shadowing effect at lateral boundaries.
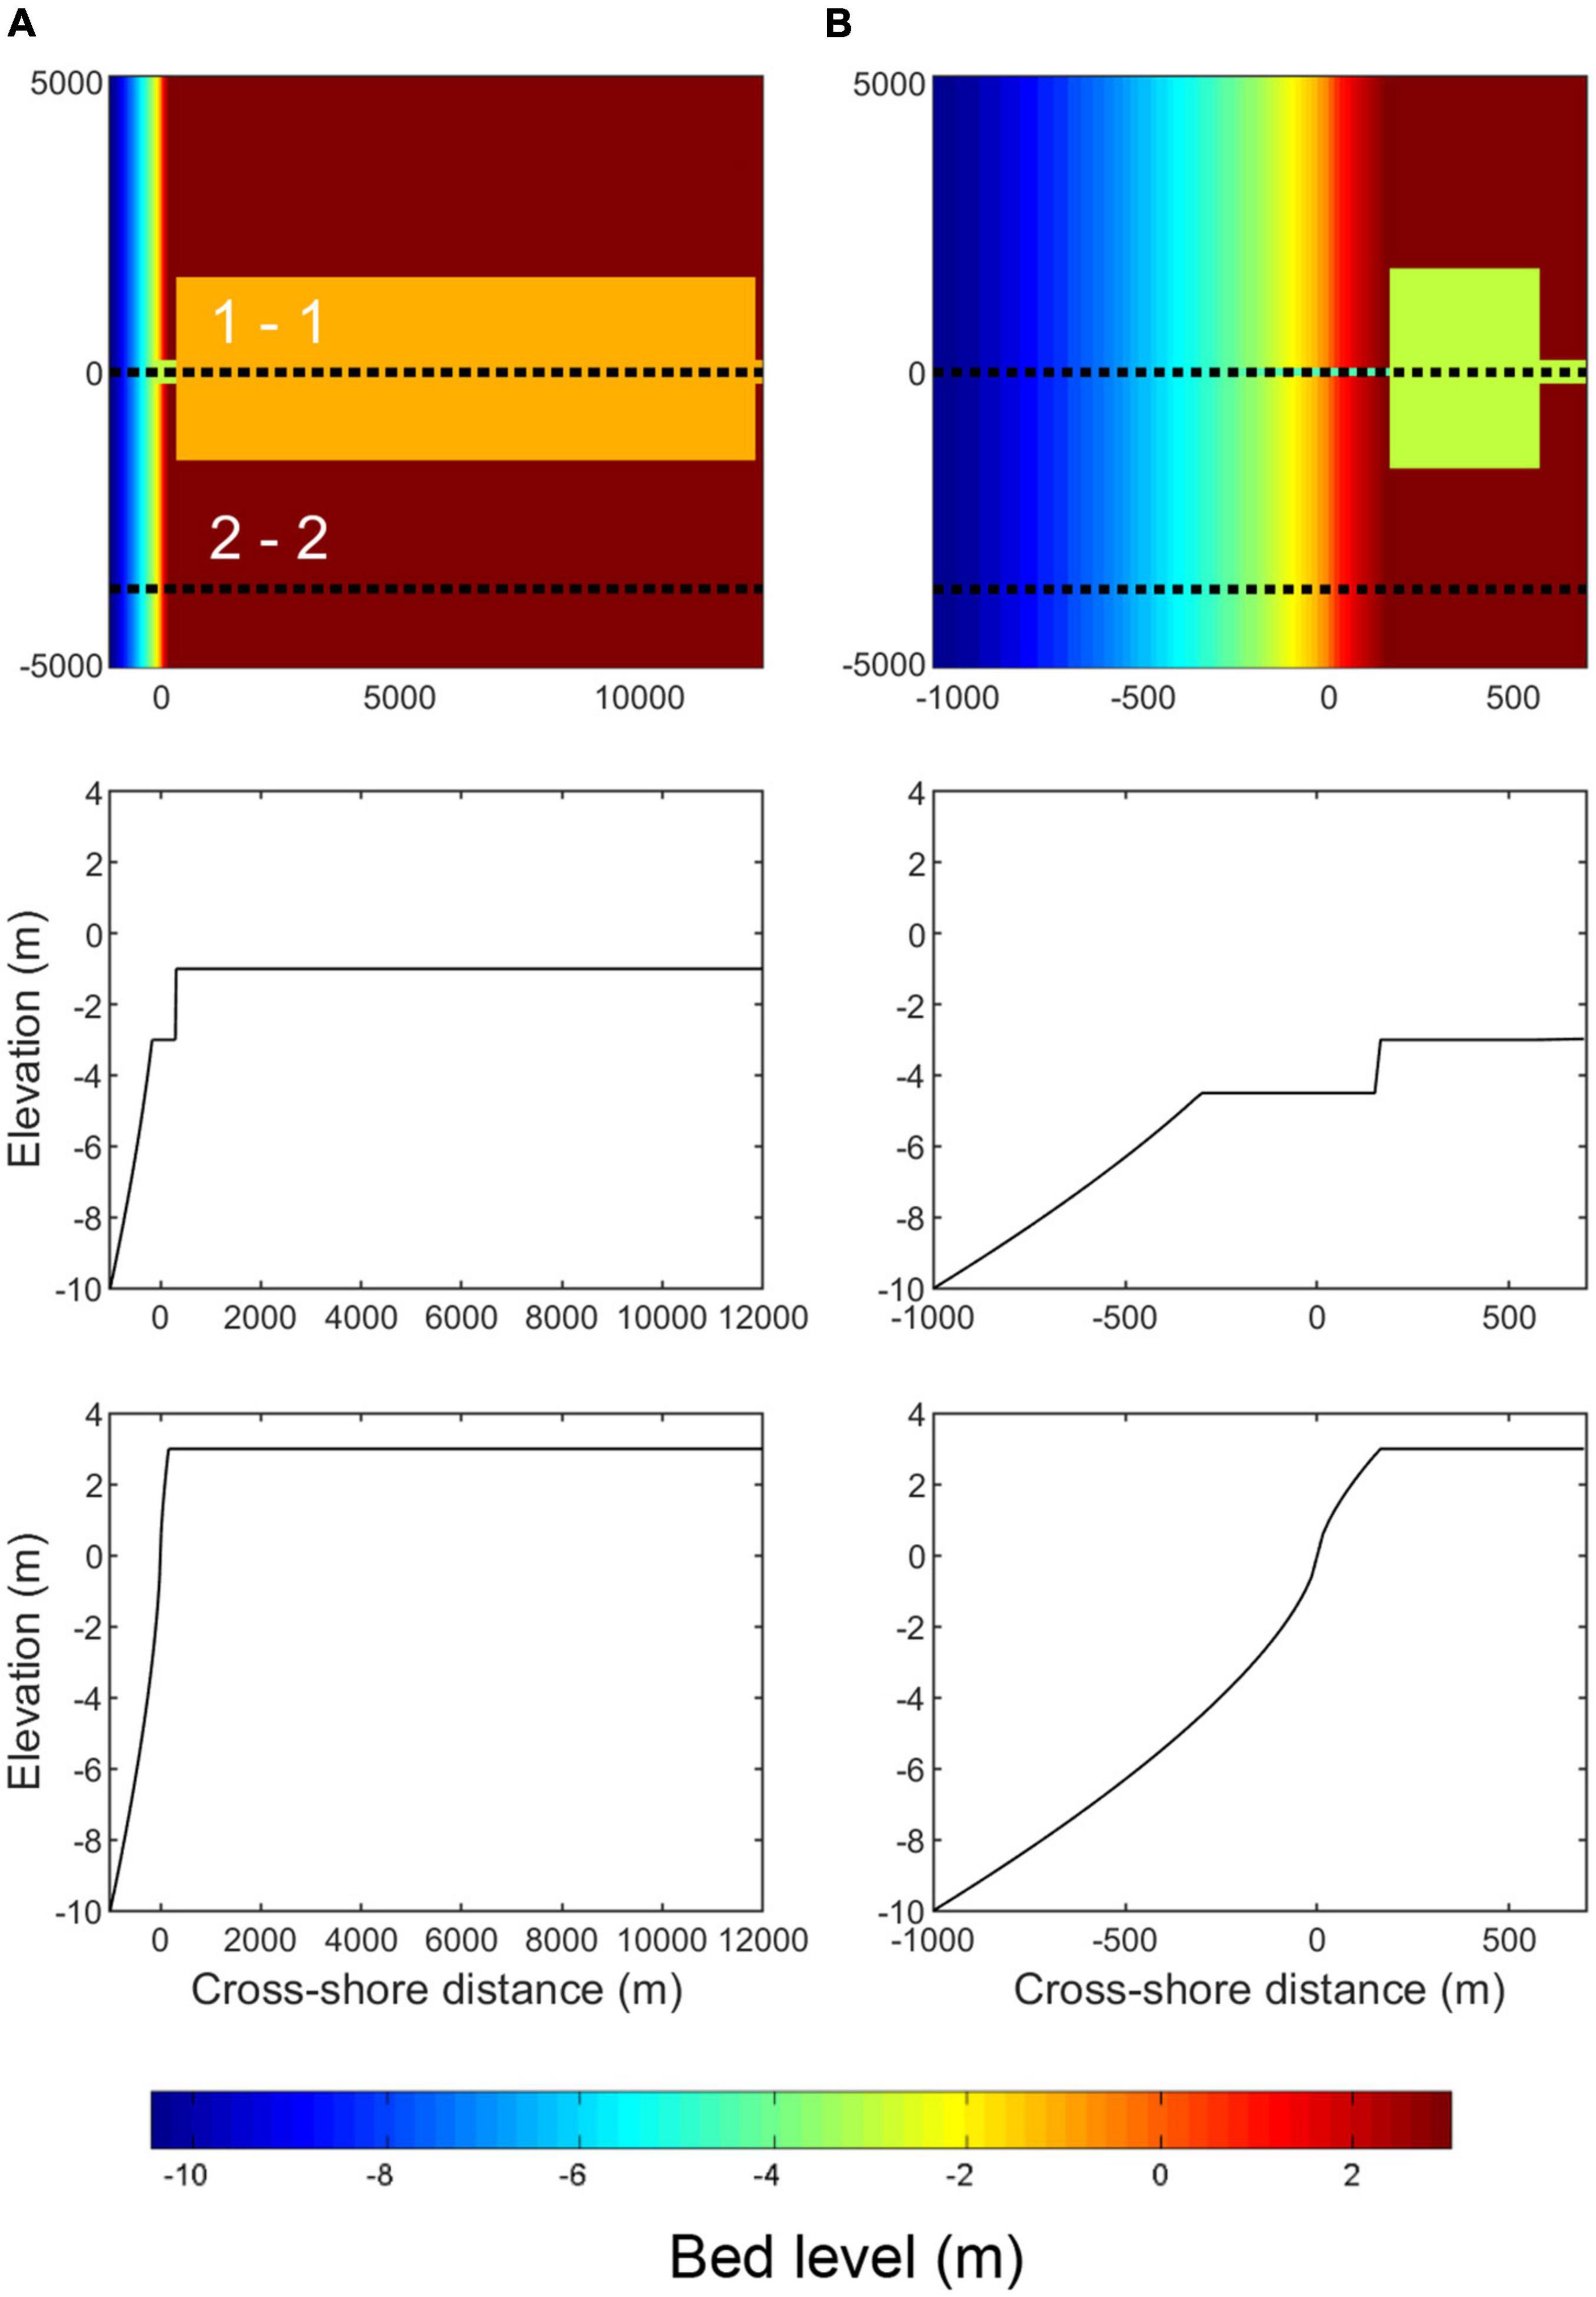
Figure 3. Schematised bathymetries for: (A) Negombo lagoon (Type 1) (left) and (B) Kalutara lagoon (Type 2) (right); plan view (top); section 1-1 (middle); section 2-2 (bottom) [after Duong et al. (2017)].
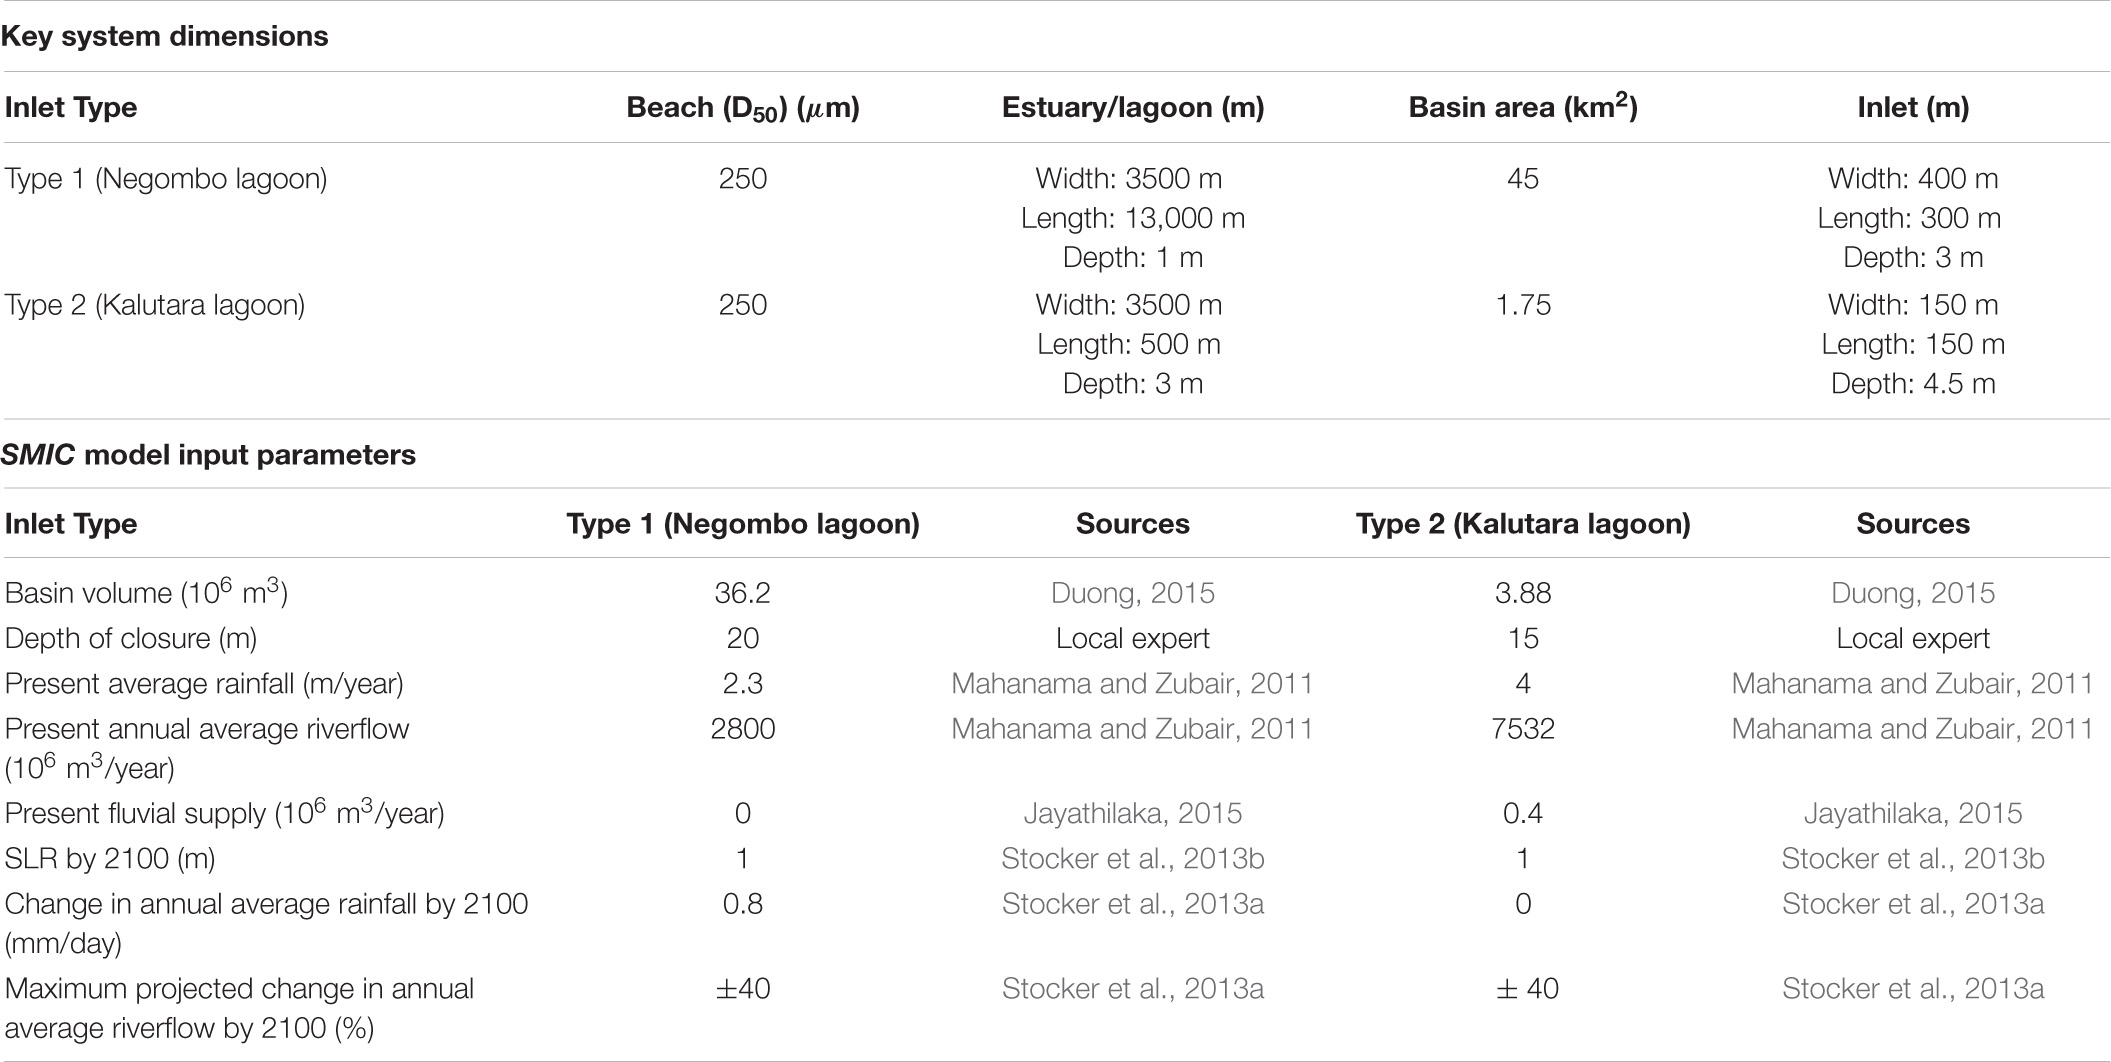
Table 1. Key dimensions of the two systems used to generate the schematised bathymetries and the adopted SMIC model input parameter values and sources.
Model Implementation
Delft3D
The schematised process-based modelling approach used here using Delft3D has been successfully applied in various previous studies such as: Marciano (2005), Dastgheib et al. (2008), van der Wegen and Roelvink (2008), Bruneau et al. (2011), Dissanayake et al. (2012), Nahon et al. (2012), van Maanen et al. (2013), Zhou et al. (2014), Nienhuis et al. (2016). The implementation of this approach to investigate climate change effects on STIs is described in detail in Duong et al. (2017) and therefore only a summary is provided here for the sake of completeness. Essentially, this approach entails the application of Delft3D to flat bed, schematised estuary/lagoon bathymetries that are constructed based on published literature and other freely available sources (e.g., aerial photographs and Google Earth), and with present and future forcing also obtained from freely available sources.
A Delft3D Present Simulation (PS) was undertaken for each schematised system, with contemporary harmonic tides together with monthly average wave and riverflow forcing (derived from measurements – see Duong et al., 2017) to reproduce the general contemporary morphodynamic behaviour of the system, to gain confidence in the model’s ability to simulate system morphodynamics. In all Delft3D simulations employed here, a MORFAC of 30 was used to capture the annual cycle of hydrodynamic forcing within a 1 year long morphodynamic simulation. The PS model has been qualitatively validated against available aerial/satellite images of the study area and compared with empirical relationships including A–P relationship (O’Brien, 1931, 1969; Jarrett, 1976), Escoffier curve (Escoffier, 1940), and Bruun inlet stability criterion (Bruun, 1978) in Duong et al. (2017) and is therefore not further described here, however, for the sake of convenience, key validation results presented by Duong et al. (2017) for the two study sites are summarised in the Supplementary Material. The validated model was implemented in a series of future snap-shot (1-year long) Delft3D simulations (CS) to investigate climate change impacts on the system (at year 2100). Here, the future forcing used represents a worse-case climate scenario following RCP 8.5, and climate change driven variations in mean water level (MWL) (i.e., SLR) and other forcing (i.e., wave conditions and riverflows) were obtained from freely available, coarse resolution sources [such as: (Stocker et al., 2013a,b), global projections by Hemer et al. (2013); see Table 2]. The basin infilling effect due to SLR was also taken into account in an offline fashion in CS simulations that included SLR. All PS and CS simulations were undertaken for a 1 year duration to represent the annual cycle of forcing (including riverflows and wave conditions).
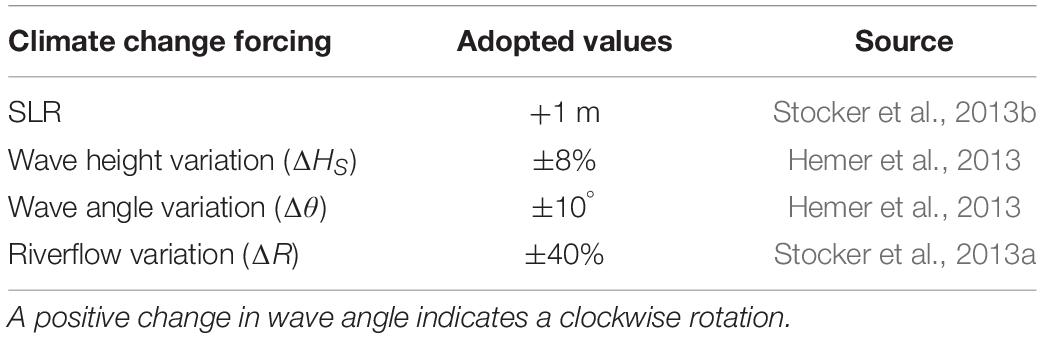
Table 2. Adopted climate change forcing and sources.
Two sets of CS simulations were undertaken for each system to investigate: the first set investigated the impact of climate change driven variations in individual system forcings (i.e., SLR, wave height, wave direction, and riverflow), and the second set investigated the impact of climate change modified key physical processes [e.g., LST – M, ebb tidal prism (including riverflow effects) – P]. In total, 15 CS simulations were undertaken for each of the two study systems.
Although Delft3D (and other similar coastal area models) has good skill at simulating bed level changes below MWL, it is not designed specifically to simulate changes in the MWL contour (i.e., shoreline) itself, and thus the Delft3D computed coastline (i.e., the zero meter depth contour) positions are not very reliable. Therefore, the momentary coastline (i.e., MKL) approach (or in Dutch, Momentary Kustlijn – MKL) philosophy (van Koningsveld and Mulder, 2004) was adopted here to compute the alongshore variability of the coastline from Delft3D output. The MKL approach defines the coastline position as a function of the sand volume in the near shore zone, which is calculated along individual cross-shore profiles based on the volume of sand per unit alongshore length between two pre-defined, stable horizontal planes that are located above and below mean low water (MLW) and bounded by a fixed vertical landward boundary, as shown in Figure 4. In each simulation undertaken here, the standard deviation of the MKL positions calculated at all the individual cross-shore profiles was taken as an indicator of the alongshore variability in coastline position under the conditions simulated.
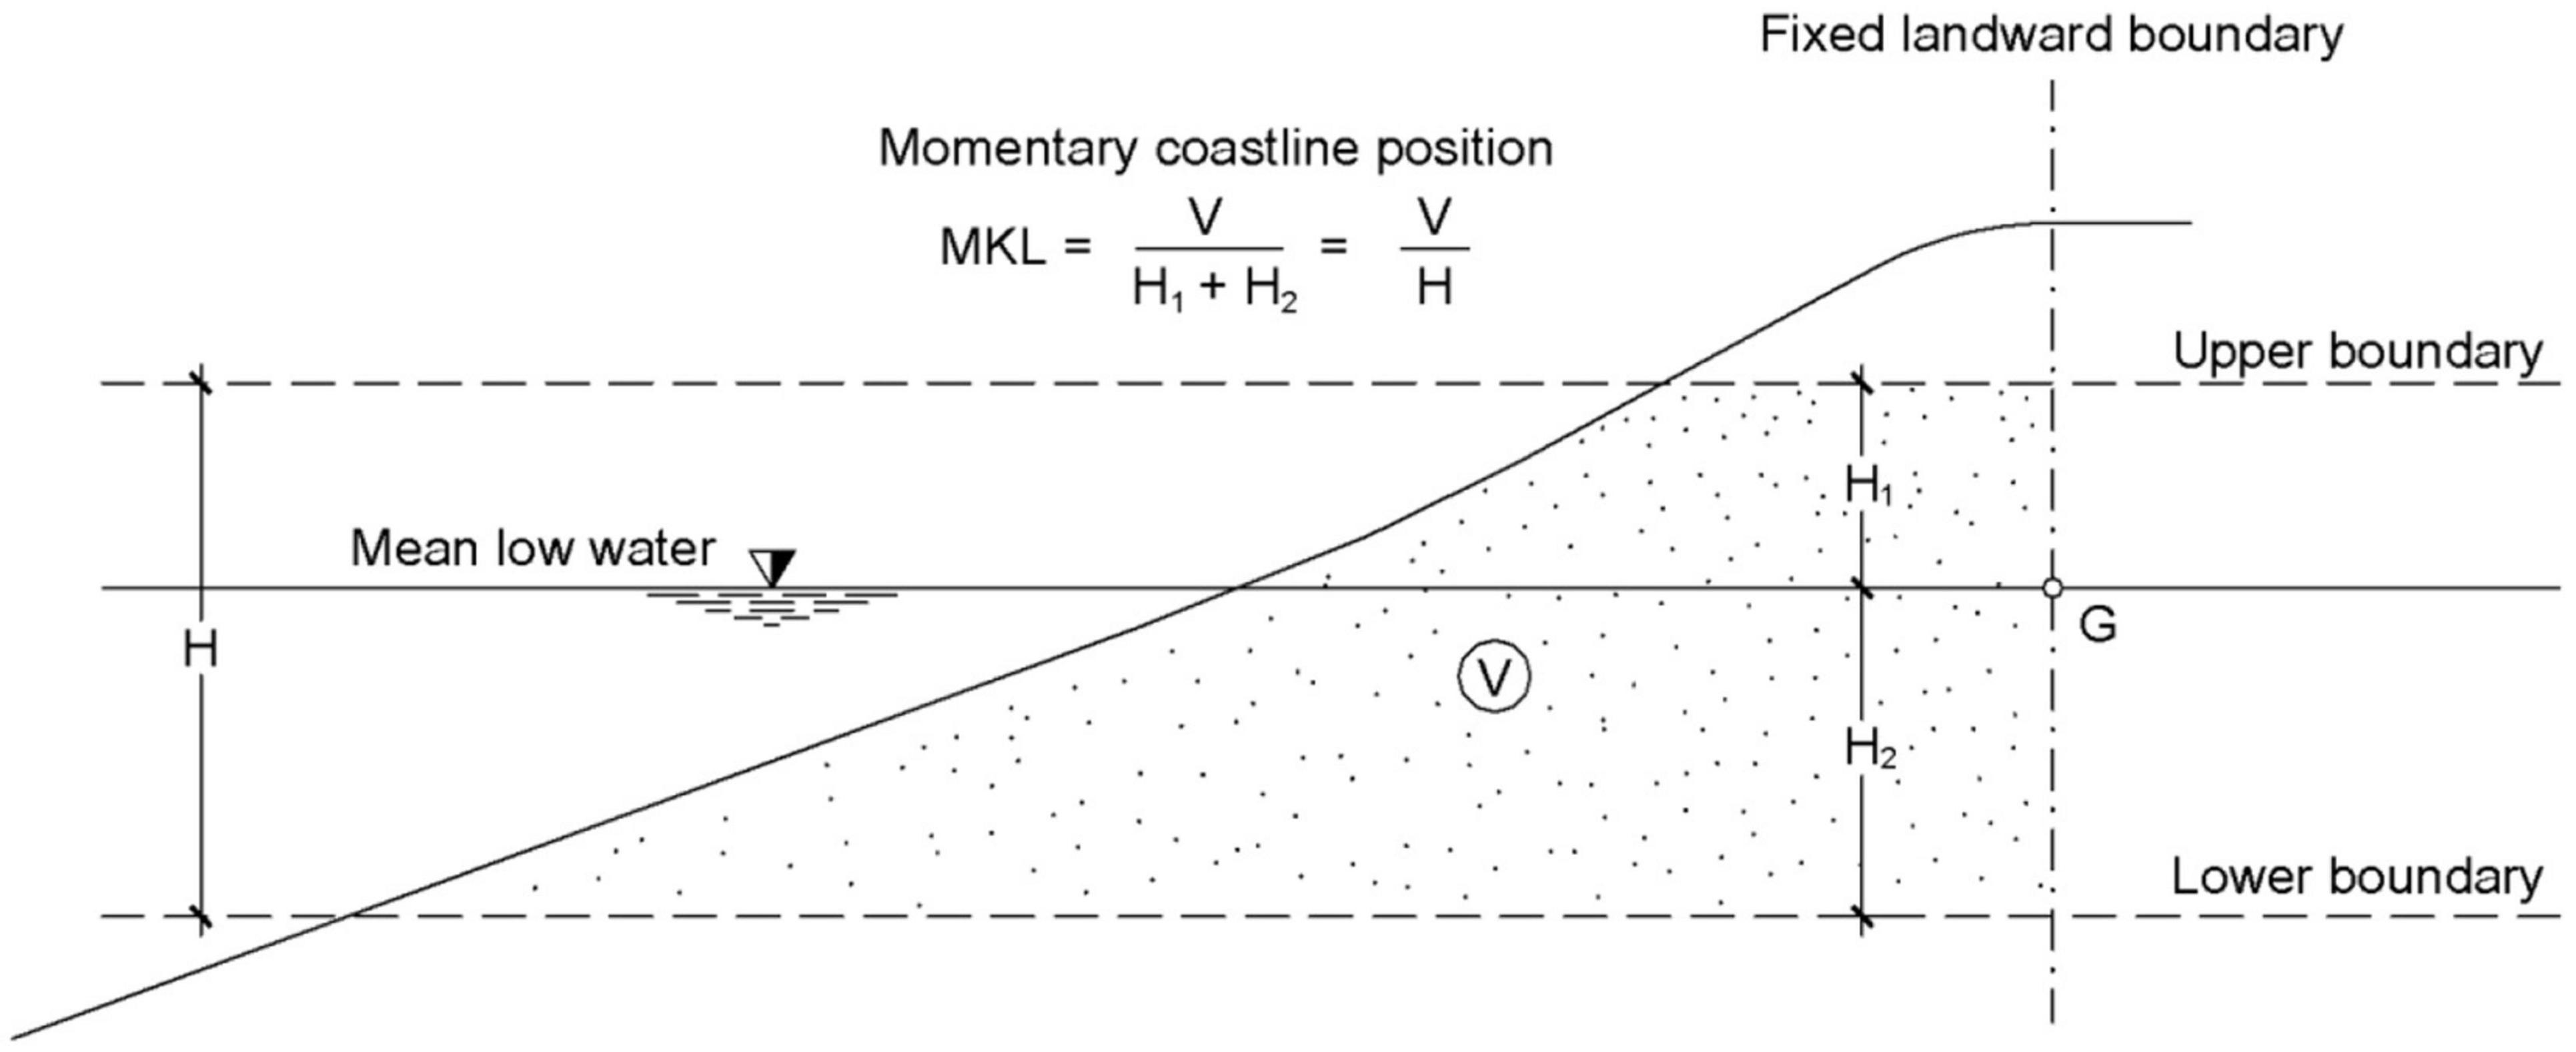
Figure 4. Schematic diagram showing the momentary coastline (MKL) concept [from Duong et al. (2017)].
In this study, the momentary coastlines MKL were calculated for each STI Type at the end of each PS and CS Delft3D simulations (i.e., at the end of 1 year simulations). The (spatial) standard deviation of this end-MKL is then taken to be representative of the alongshore variability in coastline position.
Scale Aggregated Model for Inlet-Interrupted Coasts
As Delft3D is not an ideal tool to accurately compute alongshore average coastline recession, the reduced complexity model SMIC was used to obtain estimated of alongshore average coastline recession (by 2100, relative to the present) due to the combined effect of SLR driven Bruun effect and basin infilling, changes in riverflow volume and fluvial sediment supply (note: SMIC does not provide any information on the alongshore variability of the coastline). The model was applied to the two STIs using values obtained from published literature as shown in Table 1.
The standard deviations of the Delft3D derived MKLs were then plotted around the SMIC predicted alongshore average future coastline positions to illustrate alongshore variability in coastline position resulting from the considered climate change driven variations in system forcing.
Results
Permanently Open, Locationally Stable Inlet (Type 1)
Type 1 – Climate Change Driven Variations in Individual Forcings and Inlet-Adjacent Coastline
The climate change driven variations (representing year 2100 conditions) applied to contemporary forcing in the seven simulations (T1_C1 to T1_C7) undertaken for this analysis at Type 1 inlet are shown in Table 3A. The associated changes in tidal prism (P) and annual LST volume (M) are also shown in the last column of the table.
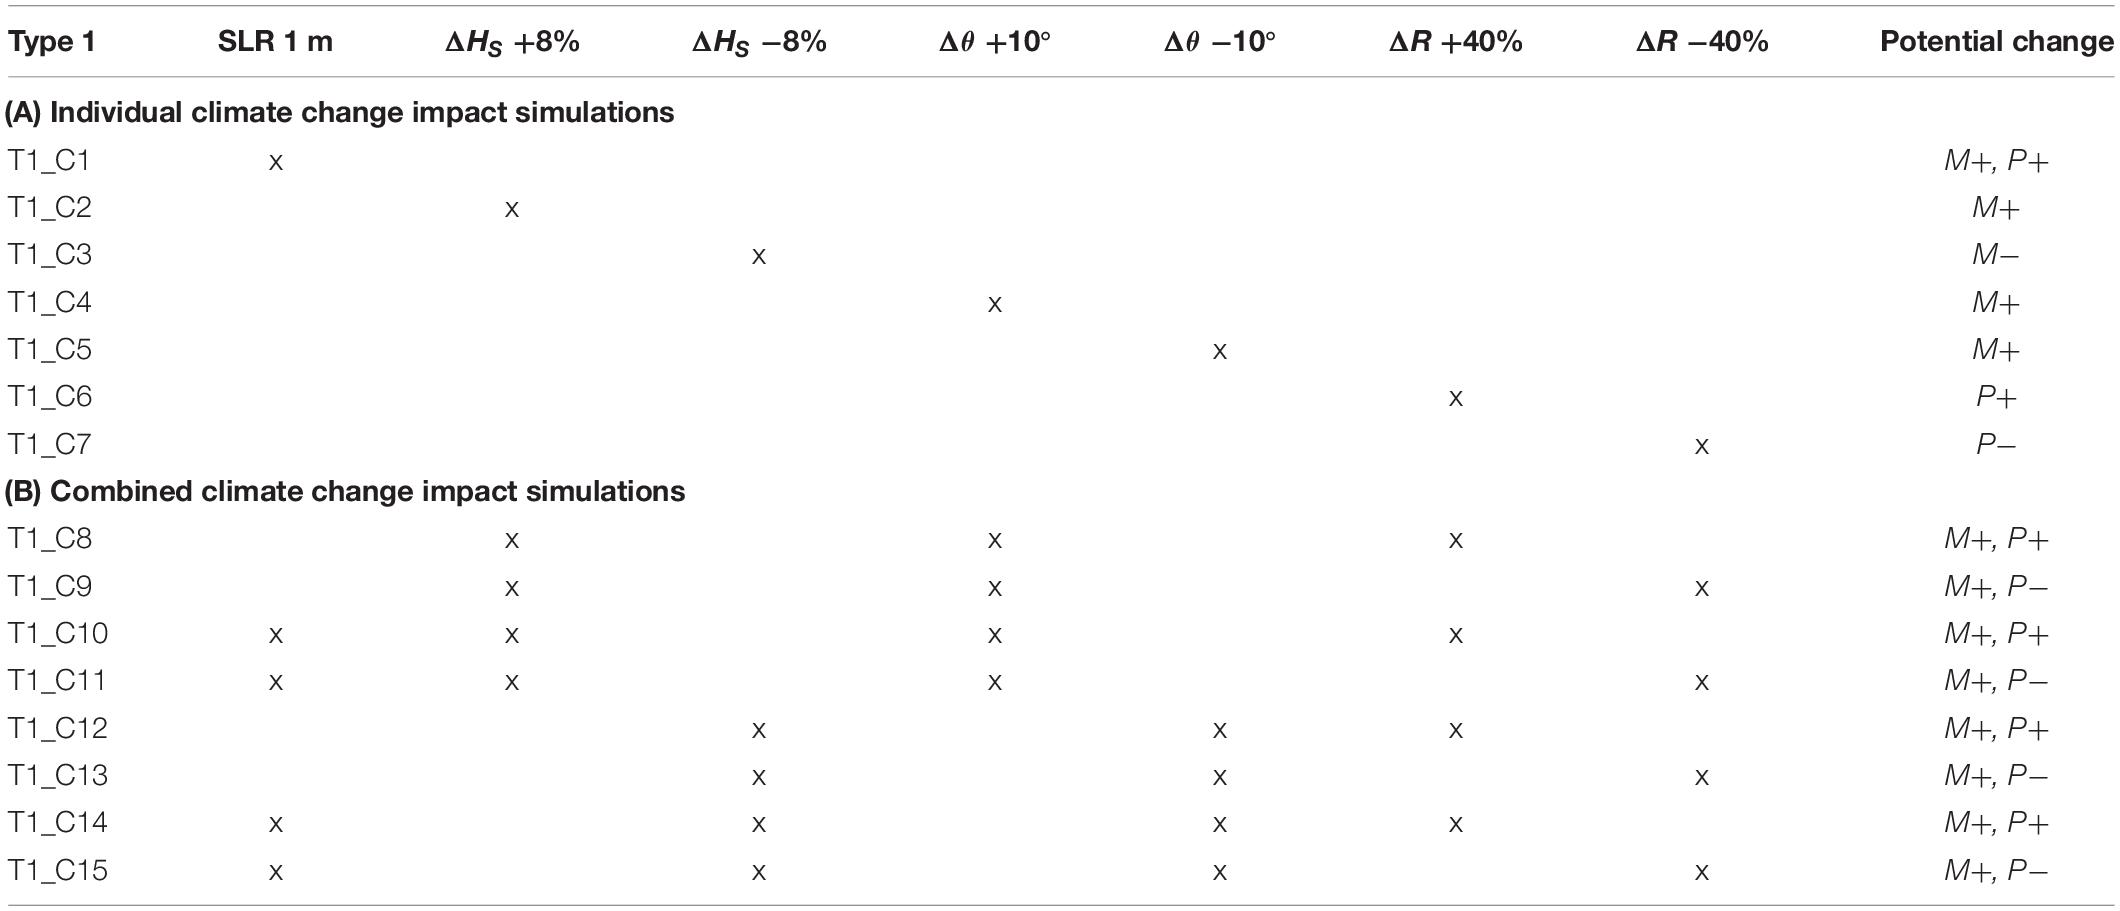
Table 3. Climate change impact simulations of the Type 1 inlet: (A) individual impact and (B) combined impact; forcing, associated changes in tidal prism P and annual longshore sediment transport M (ΔHS, change in wave height; Δθ, change in wave angle, a positive change in wave angle indicates a clockwise rotation; ΔR, change in riverflow).
Figure 5A below shows that SLR (simulation T1_C1) is the major cause of alongshore average coastline recession [up to ∼ 200 m, compared to about 150 m recession by 2100 under RCP 8.5 projected by Vousdoukas et al. (2020) for this area], which is not unexpected, while other climate change driven changes in individual system forcings do not appear to result in significant coastline recession/progradation. The alongshore variability in coastline position appears to differ significantly from the contemporary condition (i.e., T1_PS) in the T1_C5 simulation (spatial standard deviation of ∼ 50 m, as opposed to ∼ 25 m in the T1_PS), when M increases due to a climate change driven southerly rotation (of 10°) in mean wave direction.
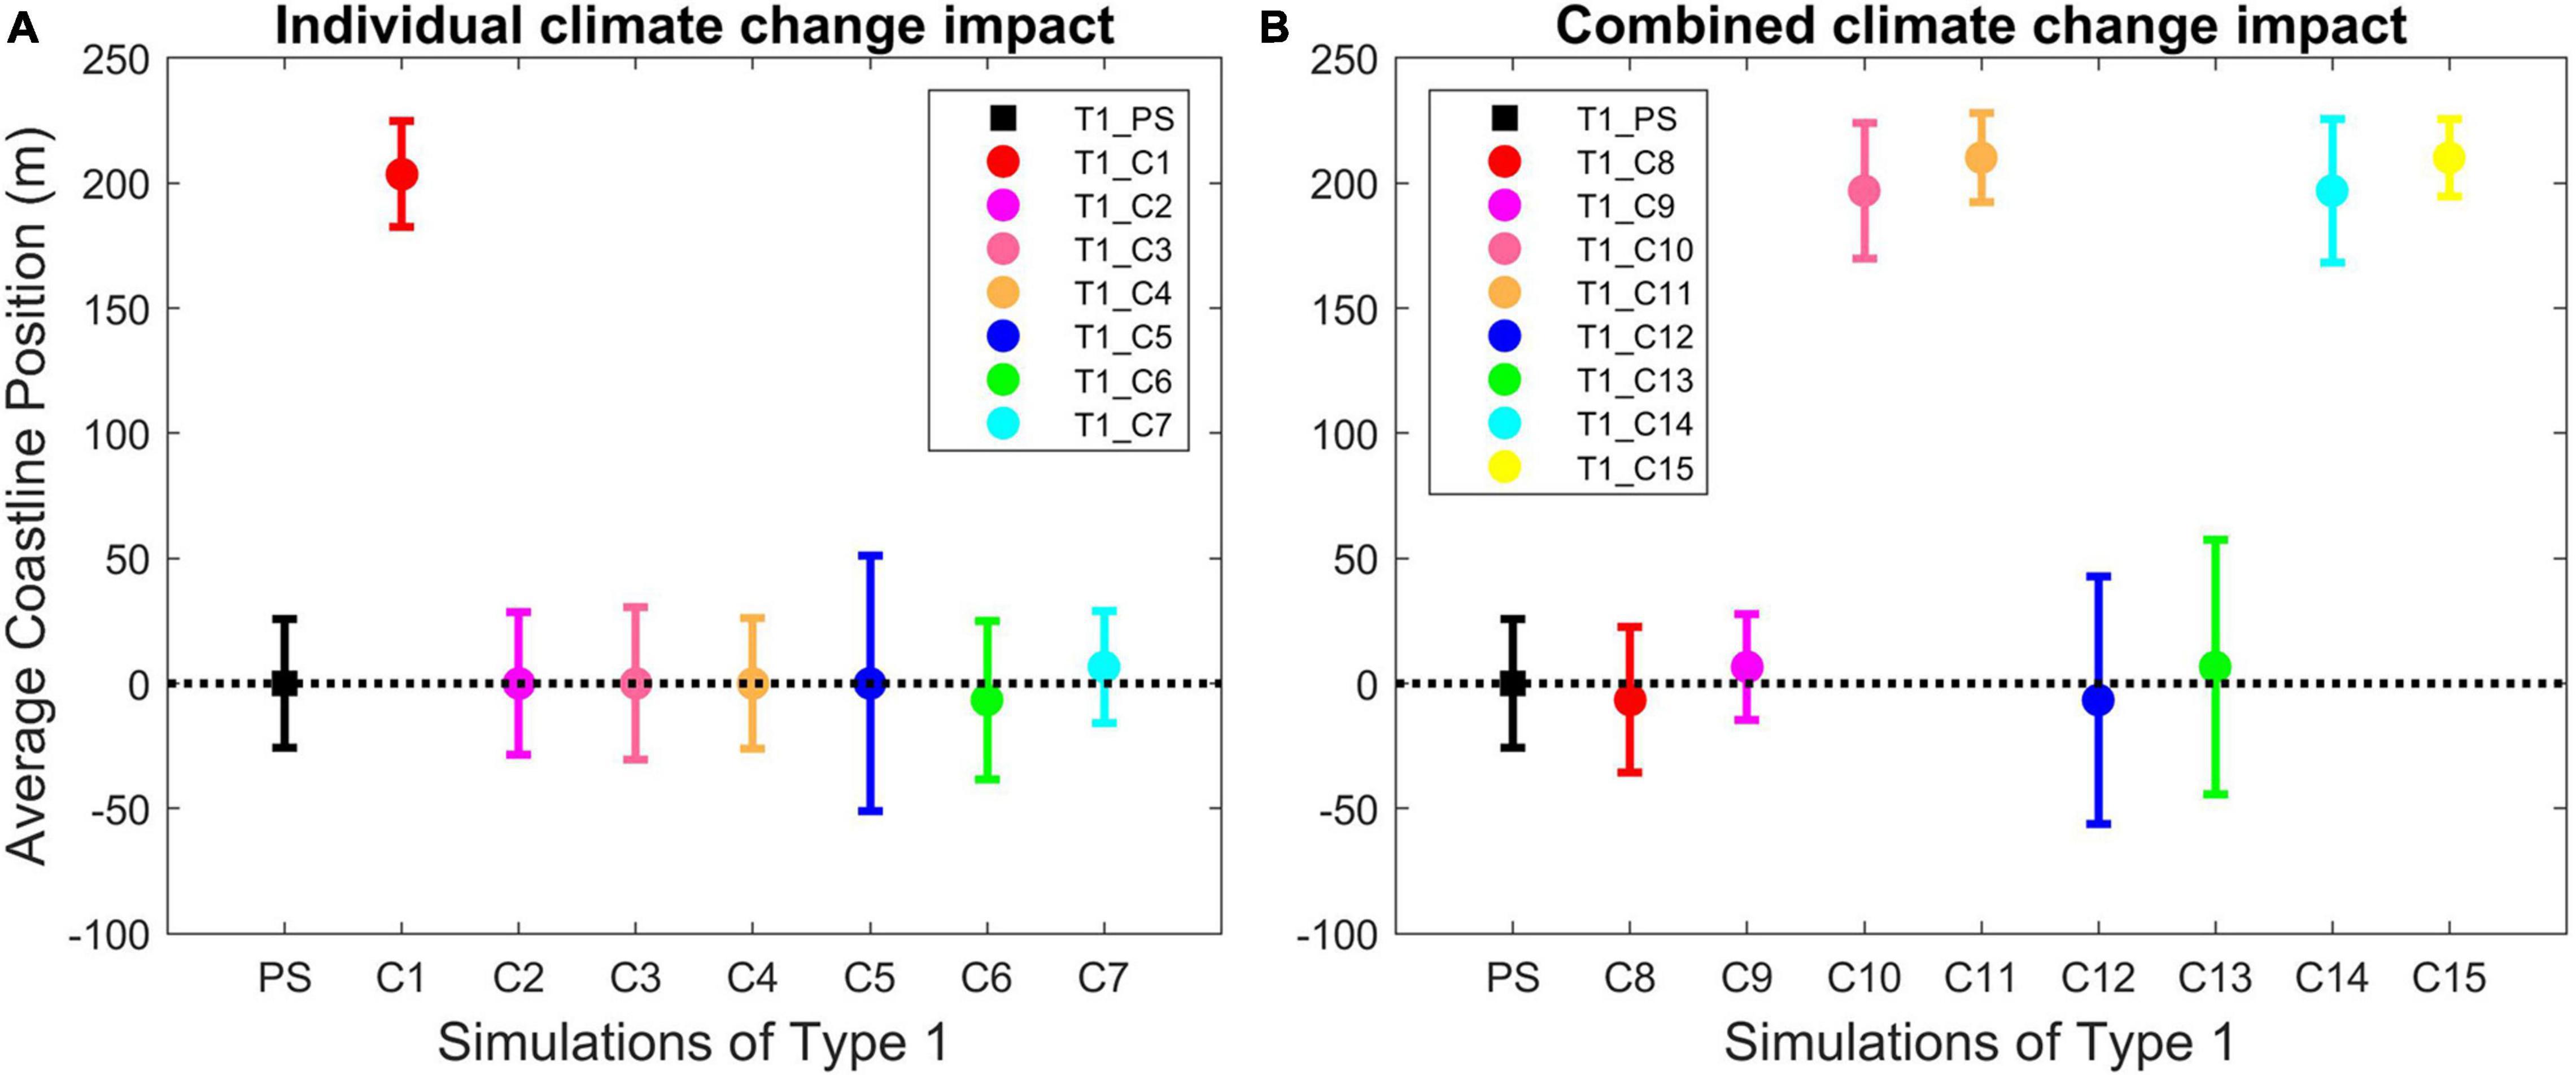
Figure 5. Type 1 inlet – changes in alongshore average coastline position (positive = recession) and alongshore variability in coastline position due to climate change driven variations: (A) in individual forcing and (B) in physical processes. The present conditions (T1_PS) are shown for comparison.
Type 1 – Climate Change Driven Variations in Physical Processes and Inlet-Adjacent Coastline
Strategic combinations of climate change modified forcing were used to investigate the impact of climate change modified key physical processes on alongshore average coastline recession and alongshore variability in coastline position adjacent to the inlet. The combinations of climate change forcing adopted in simulations (T1_C8 to T1_C15) are shown in Table 3B.
Similar to the individual forcings results, here too, as can be seen in Figure 5B, SLR shows the major impact on alongshore average coastline recession (up to ∼ 200 m) as evident by all simulations including SLR, while climate change driven variations in tidal prism (P) (due to changing riverflows) in the absence of SLR (T1_C8 and T1_C12, with increases in riverflow; T1_C9 and T1_C13, with decreases in riverflow) do not result in much coastline recession. In addition, similar to the individual forcing results, the highest coastline variability here too is indicated when M increases due to an anti-clockwise rotation of 10° in the wave direction (T1_C12 and T1_C13 with spatial standard deviations of ∼ 50 m, as opposed to ∼ 25 m in the T1_PS). Interestingly, the lower coastline variability in T1_C14 and T1_C15 relative to T1_C12 and T1_C13 (all simulations in which a climate change driven 10° anti-clockwise rotation of waves is affected) indicates that SLR appears to have a damping effect of coastline variability.
Permanently Open, Alongshore Migrating Inlet (Type 2)
Type 2 – Climate Change Driven Variations in Individual Forcings and Inlet-Adjacent Coastline
The model predicted impacts of climate change driven variations in individual forcings on the inlet adjacent coast (simulations T2_C1 to T2_C7) are shown in Table 4A and Figure 6A. Figure 6A shows the variations in alongshore average coastline position and alongshore variability in coastline position resulting from the considered climate change driven variations in individual forcings at this inlet Type. SLR is also the major driver of alongshore average coastline recession [∼ 120 m recession in T2_C1, compared to 150 m recession by 2100 under RCP 8.5 projected by Vousdoukas et al. (2020) for this area], while changes in riverflow (T2_C6 and T2_C7) result in only marginal coastline recession. Alongshore variability in coastline position in this case is highest when M increases due to a 10° clockwise rotation of the wave direction or when riverflow increases (T2_C4 and T2_C6, respectively) but not significantly different from that of the T2_PS (standard deviation of ∼ 30 m relative to 20 m in T2_PS).
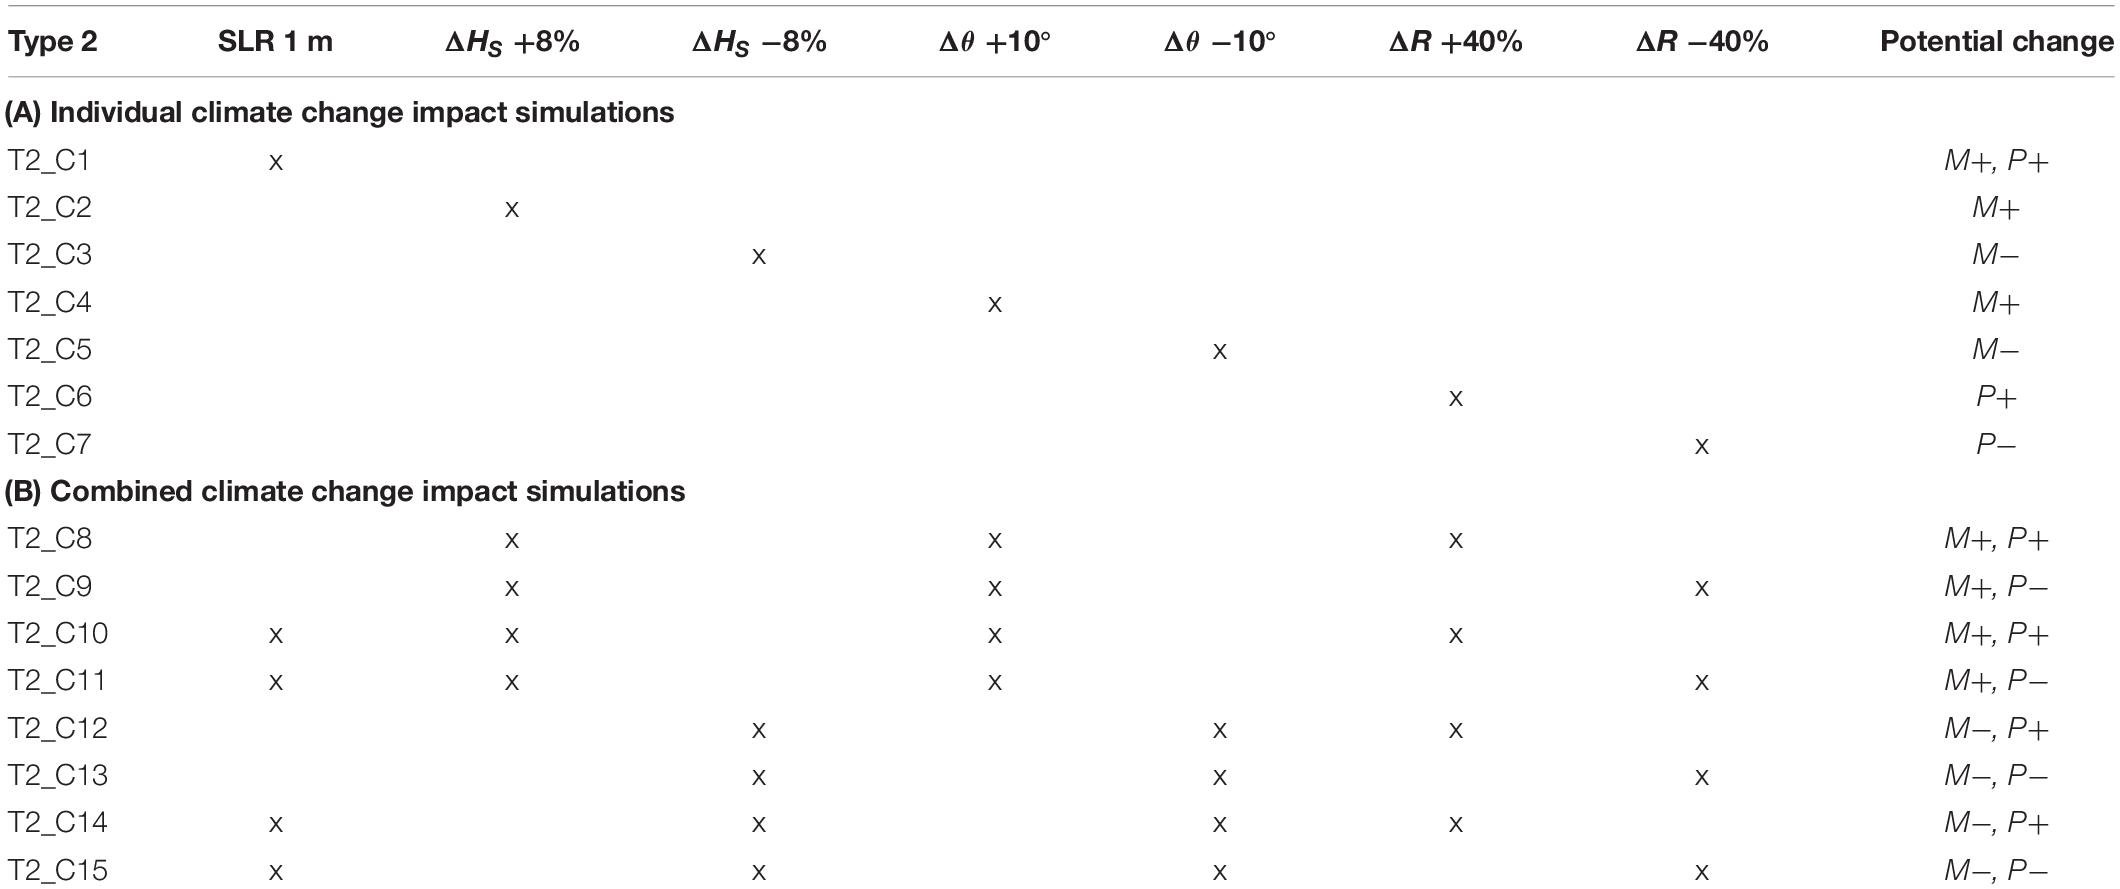
Table 4. Climate change impact simulations of the Type 2 inlet: (A) individual impact and (B) combined impact; forcing, associated changes in tidal prism P and annual longshore sediment transport M (ΔHS, change in wave height; Δθ, change in wave angle, a positive change in wave angle indicates a clockwise rotation; ΔR, change in riverflow).
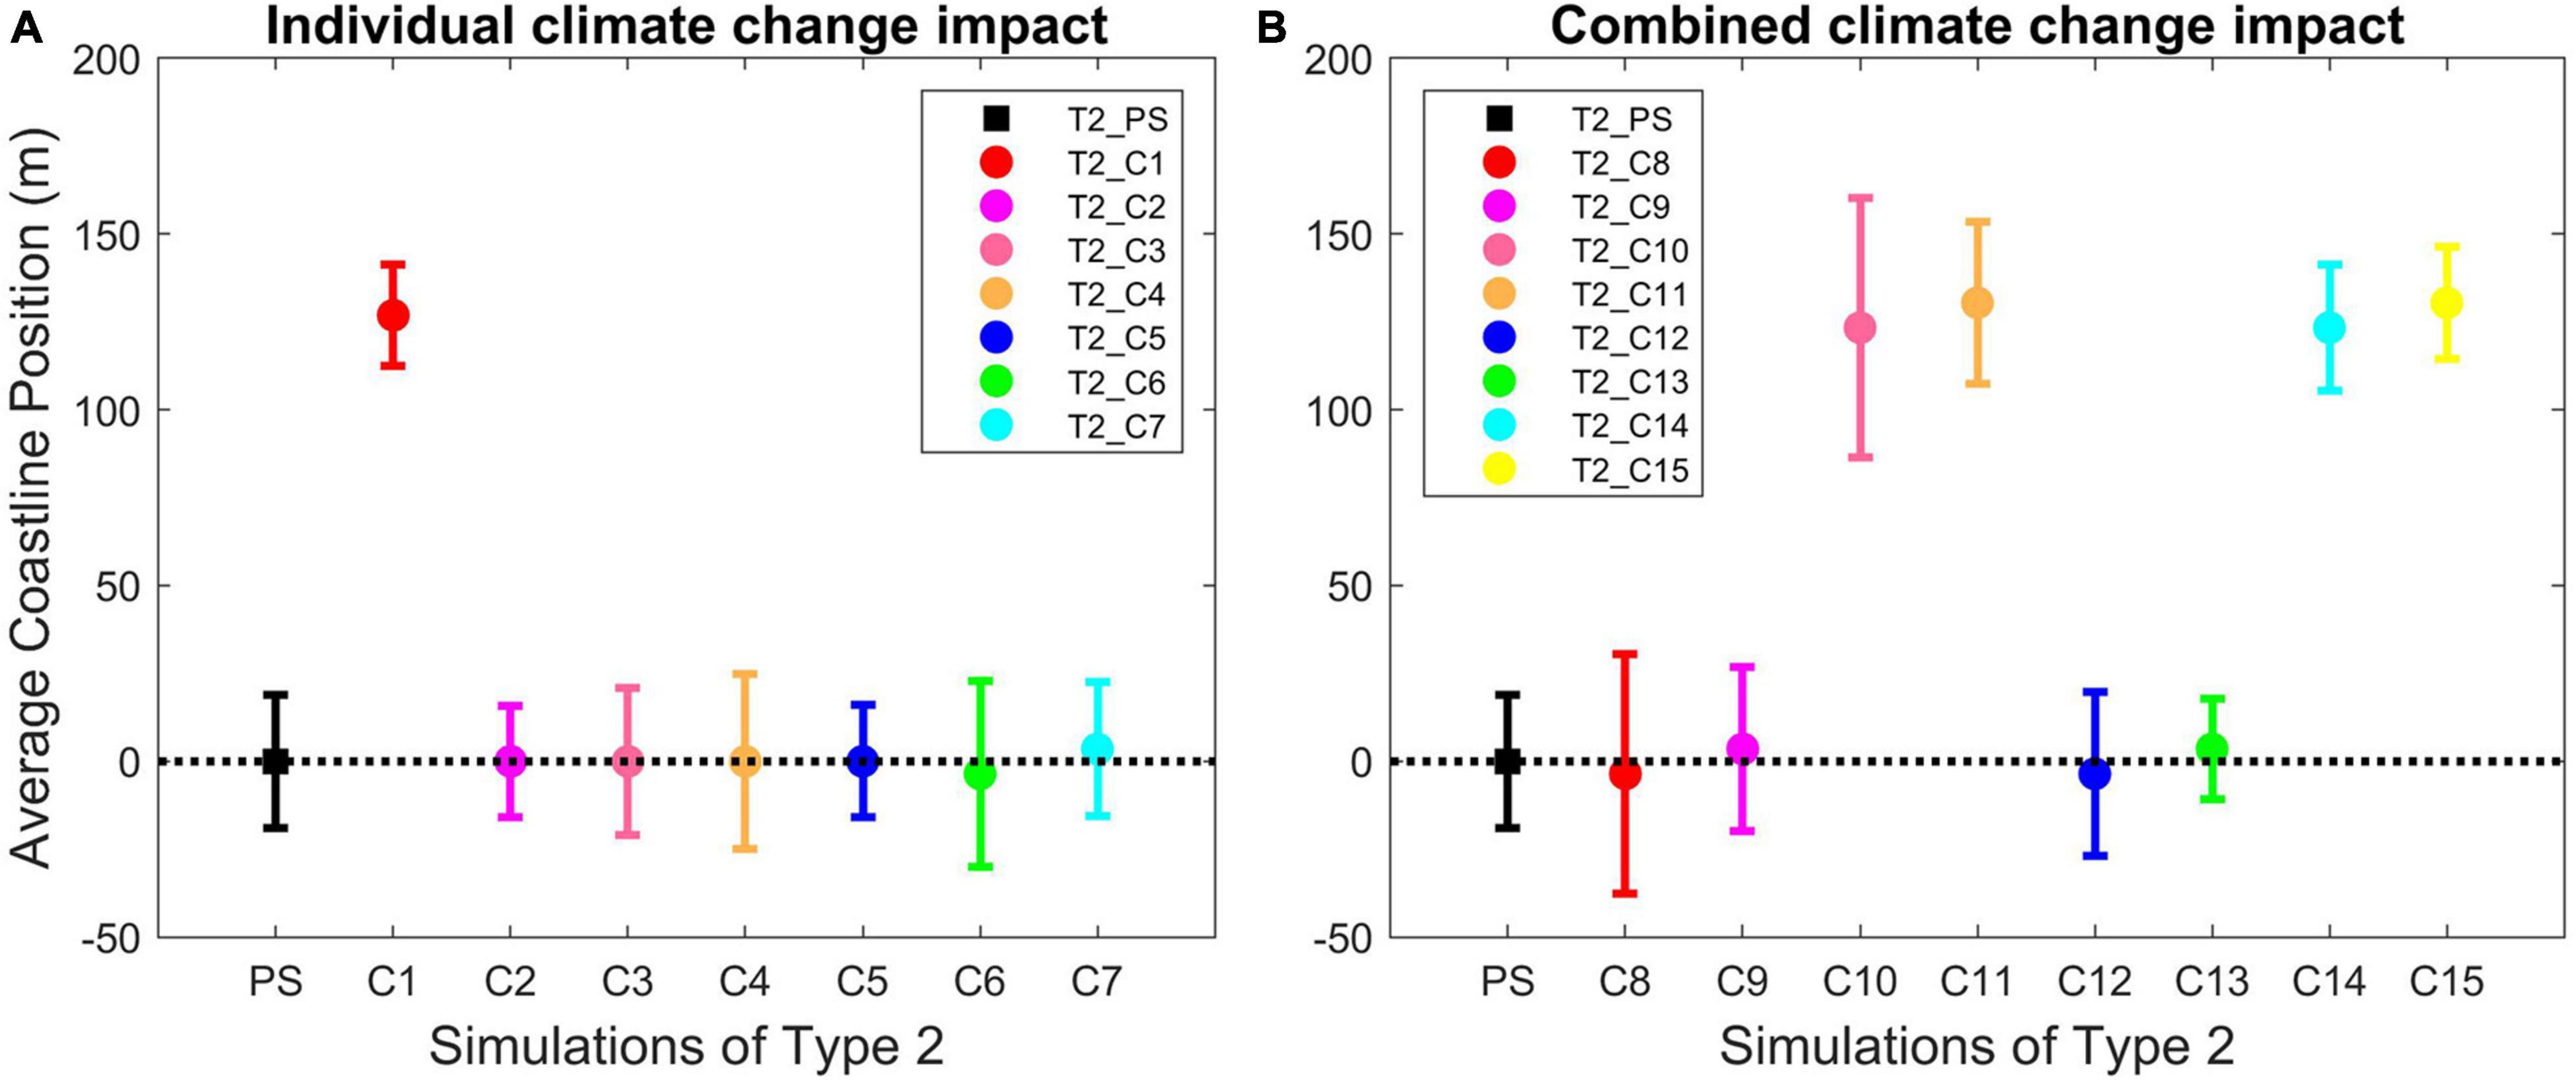
Figure 6. Type 2 inlet – changes in alongshore average coastline position (positive = recession) and alongshore variability in coastline position due to climate change driven variations: (A) in individual forcing and (B) in physical processes. The present conditions (T2_PS) are shown for comparison.
Type 2 – Climate Change Driven Variations in Physical Processes and Inlet-Adjacent Coastline
The variations in alongshore average coastline position and alongshore variability in coastline position computed for simulations T2_C8 to T2_C15, which investigate the impact of climate change modified key physical processes on alongshore average coastline recession and alongshore variability in coastline position adjacent to the inlet, are shown in Table 4B and Figure 6B. Results show that SLR is the major driver of alongshore average coastline recession (∼ 120 m recession) as evidenced by the predictions for simulations T2_C10, T2_C11, T2_C14, and T2_C15 relative to other simulations. Alongshore variability in coastline position is notably higher than that in the T2_PS only in simulations T2_C8 and T2_C10 (standard deviations of ∼ 35 m relative to ∼ 20 m in the T2_PS), when both M and P increase.
Discussion
The modelling approach adopted in this study has several limitations. Some of the main limitations are summarized below.
The Use of Global Scale Projections of Future Forcing
Future mean sea level, wave conditions and riverflow at both sites are obtained from global scale projections, which by necessity are of relatively coarse scale. As such these projections may not fully represent regional features of the climate such as monsoons and regional variations in SLR (Duong et al., 2016; Ranasinghe, 2016).
Process-Based Snap Shot Modelling With Delft3D
The present and future alongshore variability of the coastline is here determined using Duong et al.’s (2017) process-based snap shot modelling approach. In this approach year-long simulations are performed at the two ends of the study period, as a full 100 years Delft3D simulations with concurrent and realistic tide, wave and riverflow forcing is still not possible (Ranasinghe, 2016, 2020). In this approach, while the bed level changes that may occur within the estuary/lagoon between the PS and CS are represented in an aggregated and offline way (see Duong et al., 2017), coastline plan shape changes that may occur between the PS and CS are not represented. Such plan shape changes may occur, for e.g., due to beach rotation (Ranasinghe et al., 2004; Harley et al., 2011), evolution and growth of local singularities (Ashton et al., 2001) that may result from extreme events such as very low return period storm surges (new inlet formation, extreme localized shoreline retreat) and/or riverflow/fluvial sediment supply events (formation of a new ebb delta).
Alongshore Average Coastline Recession Modelling With Scale Aggregated Model for Inlet-Interrupted Coasts
Being a reduced complexity model, SMIC represents the main physical processes governing STI behaviours using aggregated equations that consider the estuary/lagoon and the inlet-adjacent coast as connected but discrete elements of an STI system. As such SMIC does not simulate local singularities such as bars, shoals, channels, shoreline protrusions/indentations that may occur and grow (e.g., due to positive feedback loops) over the 100 years simulation period. Furthermore, as in the Delft3D snap shot approach, the SMIC application here also does not account for possible long-term signatures of extreme events on mean shoreline position. SMIC also does not account for possible effects any spatio-temporal variations in LST on alongshore average coastline recession.
Alongshore Average Coastline Recession Comparisons
The alongshore average coastline recession projections obtained from SMIC are compared here with those presented by Vousdoukas et al. (2020). However, there are several noteworthy differences between the two modelling approaches. For example, SMIC takes into account the effect of estuary/lagoon processes such as basin infilling and fluvial sediment supply would have on coastline recession, which Vousdoukas et al. (2020) does not. Furthermore, Vousdoukas et al. (2020) assumes that ambient shoreline change trends would continue as they are today during the 21st century, which SMIC does not. Thus, while the effects of processes such as alongshore gradients in longshore transport on coastline recession would be included in Vousdoukas et al.’s (2020) projection, they are not accounted for in SMIC. Finally, the SMIC application here considers a single SLR value of 1 m by 2100 [representing the high end of the likely range of global mean SLR given in Intergovernmental Panel on Climate Change (IPCC) Fifth Assessment Report (AR5) (Stocker et al., 2013b) and Sixth Assessment Report (AR6) (Masson-Delmotte et al., 2021)], while Vousdoukas et al. (2020) treats SLR in a more sophisticated way using probability density functions (PDFs) of SLR for RCP 8.5 (as well as RCP 4.5) and also accounting for regional variations in SLR within a Monte Carlo simulation.
Conclusion
Sea level rise, variations in wave conditions and riverflows due to climate change are widely expected to have multiple impacts on the thousands STIs around the world, due to the high level of sensitivity of these dynamic systems to both oceanic and terrestrial system forcing. Risk informed, climate proof management of such inlet-interrupted coastal zones requires knowledge of not only how much coastline recession can be expected on average, but also whether climate change might result in higher alongshore variability in coastline position, the latter being an aspect that has not received much attention to date. Here, we investigated both of these phenomena for the particular case of coastlines adjacent to STIs, using the process-based coastal area morphodynamic model Delft3D and the reduced complexity model SMIC. The models were applied to schematised conditions representing two STIs representing the two of the three main Types of STIs present around the world; Negombo lagoon – permanently open, locationally stable inlet (Type 1); Kalutara lagoon – permanently open, alongshore migrating inlet (Type 2). The two case study sites are located along an approximately 80 km stretch of coastline along the South West coast of Sri Lanka. Results indicate that:
• At the Type 1 Negombo lagoon: the alongshore average coastline recession adjacent to the inlet can be as much as 200 m, while climate change driven increases in LST results in larger alongshore variability in coastline position that may be twice as much compared to the present.
• At the Type 2 Kalutara lagoon: SLR results in an alongshore average coastline recession adjacent to the inlet of about 120 m, and a 75% increase of the alongshore variability in coastline position relative to the present is predicted when either or both the ebb tidal prism and annual LST volume increase.
These findings imply that, when assessing coastal hazards and risk on inlet-interrupted coasts, both alongshore average coastline recession and future changes in the alongshore variability of the coastline need to be taken into account. For example, if coastal setback lines (for the 2100 planning horizon) were to be established near the Type 1 STI taking only alongshore average coastline recession into account, then a setback of about 225 m appears to be sufficient (25 m buffer at 2100). However, under the worst case scenario, an increase of 25 m in the alongshore variability of the coastline can also be expected (see Figure 5). This means, to ensure safety along the coastline, the setback should in fact be at least 250 m (200 + 25 + 25 m buffer). In coastal risk assessments, the consideration of such an additional localised erosion of around 25 m (i.e., more than 10% of the length of an average city block) due to climate change induced increases in coastline variability will likely result in a substantial increase of the “consequence” side of the risk equation, especially in highly developed areas. This may in turn have implications on the cost-benefit ratio related to risk reduction afforded by different adaptation options, in some situations affecting the choice for the optimal adaptation measure for a given location.
Data Availability Statement
The raw data supporting the conclusions of this article will be made available by the authors, without undue reservation.
Author Contributions
TD carried out the study and wrote the manuscript.
Conflict of Interest
The author declares that the research was conducted in the absence of any commercial or financial relationships that could be construed as a potential conflict of interest.
Publisher’s Note
All claims expressed in this article are solely those of the authors and do not necessarily represent those of their affiliated organizations, or those of the publisher, the editors and the reviewers. Any product that may be evaluated in this article, or claim that may be made by its manufacturer, is not guaranteed or endorsed by the publisher.
Acknowledgments
Roshanka Ranasinghe (IHE Delft/University of Twente/Deltares) is gratefully acknowledged for the many interesting discussions during the process of this study.
Supplementary Material
The Supplementary Material for this article can be found online at: https://www.frontiersin.org/articles/10.3389/fmars.2021.754756/full#supplementary-material
References
Ashton, A., Murray, A. B., and Arnoult, O. (2001). Formation of coastline features by large-scale instabilities induced by high-angle waves. Nature 414, 296–300. doi: 10.1038/35104541
Athanasiou, P., van Dongeren, A., Giardino, A., Vousdoukas, M. I., Ranasinghe, R., and Kwadijk, J. (2020). Uncertainties in projections of sandy beach erosion due to sea level rise: an analysis at the European scale. Sci. Rep. 10:11895. doi: 10.1038/s41598-020-68576-0
Bamunawala, J., Dastgheib, A., Ranasinghe, R., van der Spek, A., Maskey, S., Murray, A. B., et al. (2020a). A holistic modeling approach to project the evolution of inlet-interrupted coastlines over the 21st century. Front. Mar. Sci. 7:542. doi: 10.3389/fmars.2020.00542
Bamunawala, J., Dastgheib, A., Ranasinghe, R., van der Spek, A., Maskey, S., Murray, A. B., et al. (2020b). probabilistic application of an integrated catchment-estuary-coastal system model to assess the evolution of inlet-interrupted coasts Over the 21st century. Front. Mar. Sci. 7:1104. doi: 10.3389/fmars.2020.579203
Bamunawala, J., Ranasinghe, R., Dastgheib, A., Nicholls, R. J., Murray, A. B., Barnard, P. L., et al. (2021). Twenty-first-century projections of shoreline change along inlet-interrupted coastlines. Sci. Rep. 11, 1–14. doi: 10.1038/s41598-021-93221-9
Bruneau, N., Fortunato, A. B., Dodet, G., Freire, P., Oliveira, A., and Bertin, X. (2011). Future evolution of a tidal inlet due to changes in wave climate, Sea level and lagoon morphology (Óbidos lagoon, Portugal). Cont. Shelf Res. 31, 1915–1930. doi: 10.1016/j.csr.2011.09.001
Bruun, P. (1978). Stability of Tidal Inlets – Theory and Engineering. Amsterdam: Elsevier Scientific.
Chandramohan, P., Nayak, B. U., and Raju, V. S. (1990). Longshore-transport model for South Indian and Sri Lankan coasts. J. Waterw. Port Coast. Ocean Eng. 116, 408–424. doi: 10.1061/(ASCE)0733-950X1990116:4(408)
Dastgheib, A., Jongejan, R., Wickramanayake, M., and Ranasinghe, R. (2018). Regional scale risk-informed land-use planning using probabilistic coastline recession modelling and economical optimisation: east coast of Sri Lanka. J. Mar. Sci. Eng. 6:120. doi: 10.3390/jmse6040120
Dastgheib, A., Roelvink, J. A., and Wang, Z. B. (2008). Long-term process-based morphological modeling of the Marsdiep Tidal Basin. Mar. Geol. 256, 90–100. doi: 10.1016/j.margeo.2008.10.003
Dissanayake, D. M. P. K., Ranasinghe, R., and Roelvink, J. A. (2012). The morphological response of large tidal inlet/basin systems to relative sea level rise. Clim. Change 113, 253–276. doi: 10.1007/s10584-012-0402-z
Duong, T. M. (2015). Climate Change Impacts on the Stability of Small Tidal Inlets. Delft: Delft University of Technology.
Duong, T. M., Ranasinghe, R., Luijendijk, A., Walstra, D., and Roelvink, D. (2017). Assessing climate change impacts on the stability of small tidal inlets: part 1 – data poor environments. Mar. Geol. 390, 331–346. doi: 10.1016/j.margeo.2017.05.008
Duong, T. M., Ranasinghe, R., Thatcher, M., Mahanama, S., Wang, Z. B., Dissanayake, P. K., et al. (2018). Assessing climate change impacts on the stability of small tidal inlets: part 2 – data rich environments. Mar. Geol. 395, 65–81. doi: 10.1016/j.margeo.2017.09.007
Duong, T. M., Ranasinghe, R., Walstra, D., and Roelvink, D. (2016). Assessing climate change impacts on the stability of small tidal inlet systems: why and how? Earth Sci. Rev. 154, 369–380. doi: 10.1016/j.earscirev.2015.12.001
Harley, M. D., Turner, I. L., Short, A. D., and Ranasinghe, R. (2011). A reevaluation of coastal embayment rotation: the dominance of cross-shore versus alongshore sediment transport processes, Collaroy-Narrabeen Beach, southeast Australia. J. Geophys. Res. 116:F04033. doi: 10.1029/2011JF001989
Hemer, M. A., Fan, Y., Mori, N., Semedo, A., and Wang, X. L. (2013). Projected changes in wave climate from a multi-model ensemble. Nat. Clim. Chang. 3, 471–476. doi: 10.1038/nclimate1791
Jarrett, J. T. (1976). Tidal Prism–Inlet Area relationships. Technical Report GITI No.3. Vicksburg, MS: U.S. Army Engineer Waterways Experiment Station.
Jayathilaka, R. M. R. M. (2015). Large Scale Sediment Budgets in Data Poor Environments Via Numerical Modelling. A Case Study of Sri Lanka’s South-West coast. MSc thesis. Amawalk, NY: NARA Publications.
Le Cozannet, G., Bulteau, T., Castelle, B., Ranasinghe, R., Wöppelmann, G., Rohmer, J., et al. (2019). Quantifying uncertainties of sandy shoreline change projections as sea level rises. Sci. Rep. 9:42. doi: 10.1038/s41598-018-37017-4
Lesser, G. R., Roelvink, J. A., van Kester, J. A. T. M., and Stelling, G. S. (2004). Development and validation of a three-dimensional morphological model. Coast. Eng. 51, 883–915. doi: 10.1016/j.coastaleng.2004.07.014
Mahanama, S. P. P., and Zubair, L. (2011). Production of Streamflow Estimates for the Climate Change Impacts on Seasonally and Intermittently Open Tidal Inlets (CC-SIOTI) Project. FECT Technical Report 2011-01. Digana: Climate and Technology.
Marciano, R. (2005). Modeling of channel patterns in short tidal basins. J. Geophys. Res. 110:F01001. doi: 10.1029/2003JF000092
Masson-Delmotte, V., Zhai, P., Pirani, A., Connors, S. L., Péan, C., Berger, S., et al. (2021). IPCC, 2021: Climate Change 2021: The Physical Science Basis. Contribution of Working Group I to the Sixth Assessment Report of the Intergovernmental Panel on Climate Change. Geneva: IPCC.
McSweeney, S. L., Kennedy, D. M., Rutherfurd, I. D., and Stout, J. C. (2017). Intermittently closed/open Lakes and Lagoons: their global distribution and boundary conditions. Geomorphology 292, 142–152. doi: 10.1016/j.geomorph.2017.04.022
Nahon, A., Bertin, X., Fortunato, A. B., and Oliveira, A. (2012). Process-based 2DH morphodynamic modeling of tidal inlets: a comparison with empirical classifications and theories. Mar. Geol. 291–294, 1–11. doi: 10.1016/j.margeo.2011.10.001
Nicholls, R. J., Wong, P. P., Burket, V. R., Codignotto, J., Hay, J. E., McLean, R. F., et al. (2007). “Coastal systems and low-lying areas,” in Climate Change 2007: Impacts, Adaptation and Vulnerability. Contribution of Working Group II to the Fourth Assessment Report of the Intergovernmental Panel on Climate Change, eds M. L. Parry, O. F. Canziani, J. P. Palutikof, P. J. van der Linden, and C. E. Hanson (Cambridge: Cambridge University Press), 315–356.
Nienhuis, J. H., Ashton, A. D., Nardin, W., Fagherazzi, S., and Giosan, L. (2016). Alongshore sediment bypassing as a control on river mouth morphodynamics. J. Geophys. Res. Earth Surf. 121, 664–683. doi: 10.1002/2015JF003780
O’Brien, M. P. (1969). Equilibrium flow areas of inlets on Sandy Coasts. J. Waterw. Harb. Div. 95, 43–52. doi: 10.1061/JWHEAU.0000622
Perera, J. A. S. C. (1993). Stabilization of the Kaluganga River Mouth in Sri Lanka. MSc thesis. Delft: International Institute for Infrastructural Hydraulic and Environmental Engineering.
Ranasinghe, R. (2016). Assessing climate change impacts on open sandy coasts: a review. Earth Sci. Rev. 160, 320–332. doi: 10.1016/j.earscirev.2016.07.011
Ranasinghe, R. (2020). On the need for a new generation of coastal change models for the 21st century. Sci. Rep. 10:2010. doi: 10.1038/s41598-020-58376-x
Ranasinghe, R., Callaghan, D., and Stive, M. J. F. (2012). Estimating coastal recession due to sea level rise: beyond the Bruun rule. Clim. Change 110, 561–574. doi: 10.1007/s10584-011-0107-8
Ranasinghe, R., Duong, T. M., Uhlenbrook, S., Roelvink, D., and Stive, M. (2013). Climate-change impact assessment for inlet-interrupted coastlines. Nat. Clim. Chang. 3, 83–87. doi: 10.1038/nclimate1664
Ranasinghe, R., McLoughlin, R., Short, A., and Symonds, G. (2004). The Southern oscillation index, wave climate, and beach rotation. Mar. Geol. 204, 273–287. doi: 10.1016/S0025-3227(04)00002-7
Ranasinghe, R., Swinkels, C., Luijendijk, A., Roelvink, D., Bosboom, J., Stive, M., et al. (2011). Morphodynamic upscaling with the MORFAC approach: dependencies and sensitivities. Coast. Eng. 58, 806–811. doi: 10.1016/j.coastaleng.2011.03.010
Roelvink, J. A. (2006). Coastal morphodynamic evolution techniques. Coast. Eng. 53, 277–287. doi: 10.1016/j.coastaleng.2005.10.015
Stocker, T. F., Qin, D., Plattner, G.-K., Alexander, L. V., Allen, S. K., Bindoff, N. L., et al. (2013a). “Technical summary,” in Climate Change 2013: The Physical Science Basis. Contribution of Working Group I to the Fifth Assessment Report of the Intergovernmental Panel on Climate Change, eds T. F. Stocker, D. Qin, G.-K. Plattner, M. Tignor, S. K. Allen, J. Boschung, et al. (Cambridge: Cambridge University Press).
Stocker, T. F., Qin, D., Plattner, G.-K., Tignor, M., Allen, S. K., Boschung, J., et al. (2013b). “IPCC, 2013: summary for policymakers,” in Climate Change 2013: The Physical Science Basis. Contribution of Working Group I to the Fifth Assessment Report of the Intergovernmental Panel on Climate Change, eds T. F. Stocker, D. Qin, G.-K. Plattner, M. Tignor, S. K. Allen, J. Boschung, et al. (Cambridge: Cambridge University Press).
University of Moratuwa (2003). Engineering Study on the Feasibility of Dredging the Negombo Lagoon to Improve Water Quality. Final Report. Part II: Technical & Environmental Feasibility. Moratuwa: University of Moratuwa.
van der Wegen, M., and Roelvink, J. A. (2008). Long-term morphodynamic evolution of a tidal embayment using a two-dimensional, process-based model. J. Geophys. Res. 113:C03016. doi: 10.1029/2006JC003983
van Koningsveld, M., and Mulder, J. P. M. (2004). Sustainable coastal policy developments in the Netherlands. A systematic approach revealed. J. Coast. Res. 20, 375–385. doi: 10.2112/1551-5036(2004)020[0375:scpdit]2.0.co;2
van Maanen, B., Coco, G., Bryan, K. R., and Friedrichs, C. T. (2013). Modeling the morphodynamic response of tidal embayments to sea-level rise. Ocean Dyn. 63, 1249–1262. doi: 10.1007/s10236-013-0649-6
van Rijn, L. (1993). Principles of Sediment Transport in Rivers, Estuaries and Coastal Seas. Part 1. Blokzijl: Aqua Publlications.
Vousdoukas, M. I., Ranasinghe, R., Mentaschi, L., Plomaritis, T. A., Athanasiou, P., Luijendijk, A., et al. (2020). Sandy coastlines under threat of erosion. Nat. Clim. Change 10, 260–263. doi: 10.1038/s41558-020-0697-0
Keywords: tidal inlets, climate change, coastline recession, coastline variability, Sri Lanka, numerical modeling, Delft3D, SMIC
Citation: Duong TM (2021) Climate Change Induced Coastline Change Adjacent to Small Tidal Inlets. Front. Mar. Sci. 8:754756. doi: 10.3389/fmars.2021.754756
Received: 06 August 2021; Accepted: 19 November 2021;
Published: 15 December 2021.
Edited by:
Rodolfo Silva, National Autonomous University of Mexico, MexicoReviewed by:
Alec Torres-Freyermuth, Universidad Nacional Autónoma de México, MexicoTomoya Shimura, Kyoto University, Japan
Copyright © 2021 Duong. This is an open-access article distributed under the terms of the Creative Commons Attribution License (CC BY). The use, distribution or reproduction in other forums is permitted, provided the original author(s) and the copyright owner(s) are credited and that the original publication in this journal is cited, in accordance with accepted academic practice. No use, distribution or reproduction is permitted which does not comply with these terms.
*Correspondence: Trang Minh Duong, dC5kdW9uZ0B1bi1paGUub3Jn