 Chunyang Xu
 Chunyan Zhou
 Kao Ma1
 Xihe Yue
- 1College of Harbour, Coastal and Offshore Engineering, Hohai University, Nanjing, China
- 2Marine Academy of Zhejiang Province, Hangzhou, China
Jiaozhou Bay (JZB), located at Qingdao City, north China, is a semi-enclosed shallow bay that has undergone large-scale land reclamation and is suffering from a deteriorated water environment. Long-term evolution of JZB with respect of coastline, tidal prism, tidal dynamics, water-exchange capacity, and pollutant transport from 1863 to 2020 was investigated in this paper, using remote sensing images, historical charts, and a numerical model. The JZB was predominated by natural evolution from 1863 to 1935, during which the coastline barely changed. Thereafter, human intervention became intense and more and more natural tidal flats were replaced by salt ponds, aquaculture area, and reclamation very quickly. As a result, tidal prism, area of tidal flats, and area of JZB decreased sharply by 0.290 km3, 182 km2, and 223 km2, respectively, from 1935 to 2020, corresponding to annual decreasing rates being of 123 times, 10 times, 12 times, respectively, as that of before 1935. A numerical model showed that the residual current in JZB tended to be weaker due to the change of coastline and bathymetry, which is not favoring the water-exchange and pollutant transport, especially in the northeast of JZB. The basin residence time increased from 15.5 days in 1935 to 17.6 days in 2020, because of weaker residual tidal current and smaller tidal prism. Local residence time increased significantly near the area with large land reclamation, especially in the northeast and west of JZB. Distribution of dissolved inorganic nitrogen (DIN), in each year, which is the dominant pollutant in JZB, indicated higher DIN concentration and weaker transport along with reclamation. The research on JZB evolution over the last 150 years can provide useful suggestions for the decision-makers of the local government to improve the marine ecosystem. The systematic method to investigate long-term water environment evolution of JZB can be used to study other semi-closed bays.
Introduction
Coastal areas are the zone where human activities are most intensive. Developed countries pay great attention to the utilization of coastal zones, especially bays. In recent decades, large-scale land reclamation has changed the natural coastline and the area and tidal prism of bays, resulting in a deteriorated environment. Most bays face the contradiction between the deterioration of the ecological environment and the increasing demand for human resources. For example, large-scale reclamation of the intertidal zone and shallow water area in Tokyo Bay, Japan resulted in weaker water-exchange leading to eutrophication, red tide, and other water quality deterioration phenomena (Furukawa and Okada, 2006; Okada et al., 2011). The water-exchange capacity of Venice Lagoon in Italy decreased due to land reclamation, dredging, and mobile-barrier construction (Ferrarin et al., 2013). Many researchers have paid attention to the environment change of different bays due to human intervention (Plus et al., 2009; Patgaonkar et al., 2012; Grifoll et al., 2013; Zarzuelo et al., 2015; Sun et al., 2018). Understanding the long-term evolution of water environment in human-impacted bays may require specific modeling of individual bays (Zhu et al., 2015; Jia et al., 2018).
Jiaozhou Bay, a semi-closed bay located in the northeast of China (Figure 1), has excellent natural harbors with deep water and light waves. It has played an extremely important role in the development of Qingdao City (Li et al., 2014; Qiao et al., 2019). With the rapid economic development of Qingdao, JZB has experienced significant land reclamation, which makes it an ideal place to investigate long-term evolution of a semi-closed bay under intensive human intervention. Yuan et al. (2016) investigated the impact of anthropogenic activities on the marine environment in JZB in term of pollutant indicators’ response to the coastline evolution. Shi et al. (2011) studied the water-exchange capacity of JZB from 1966 to 2008 based on EFDC model. Li et al. (2014) used MIKE21 model to investigate the tidal dynamic change induced by JZB Bridge, built in 2011, and showed that tidal prism decreased by 1.7% during spring tide induced by the pier blockage effect. Zhao et al. (2015) studied the sedimentary dynamic enviroment in the western JZB in the 1980s, 2000s, and early 2010s according to collected bottom sediments and numerical model results. Yuan et al. (2021) caculated the basin, regional, and local residence time from 1935 to 2013 based on the Finite Volume Community Ocean Model, and found that residence time continued to increase from 1986 to 2000 in the northeast and north-bridge regions but decreased slightly from 2000.
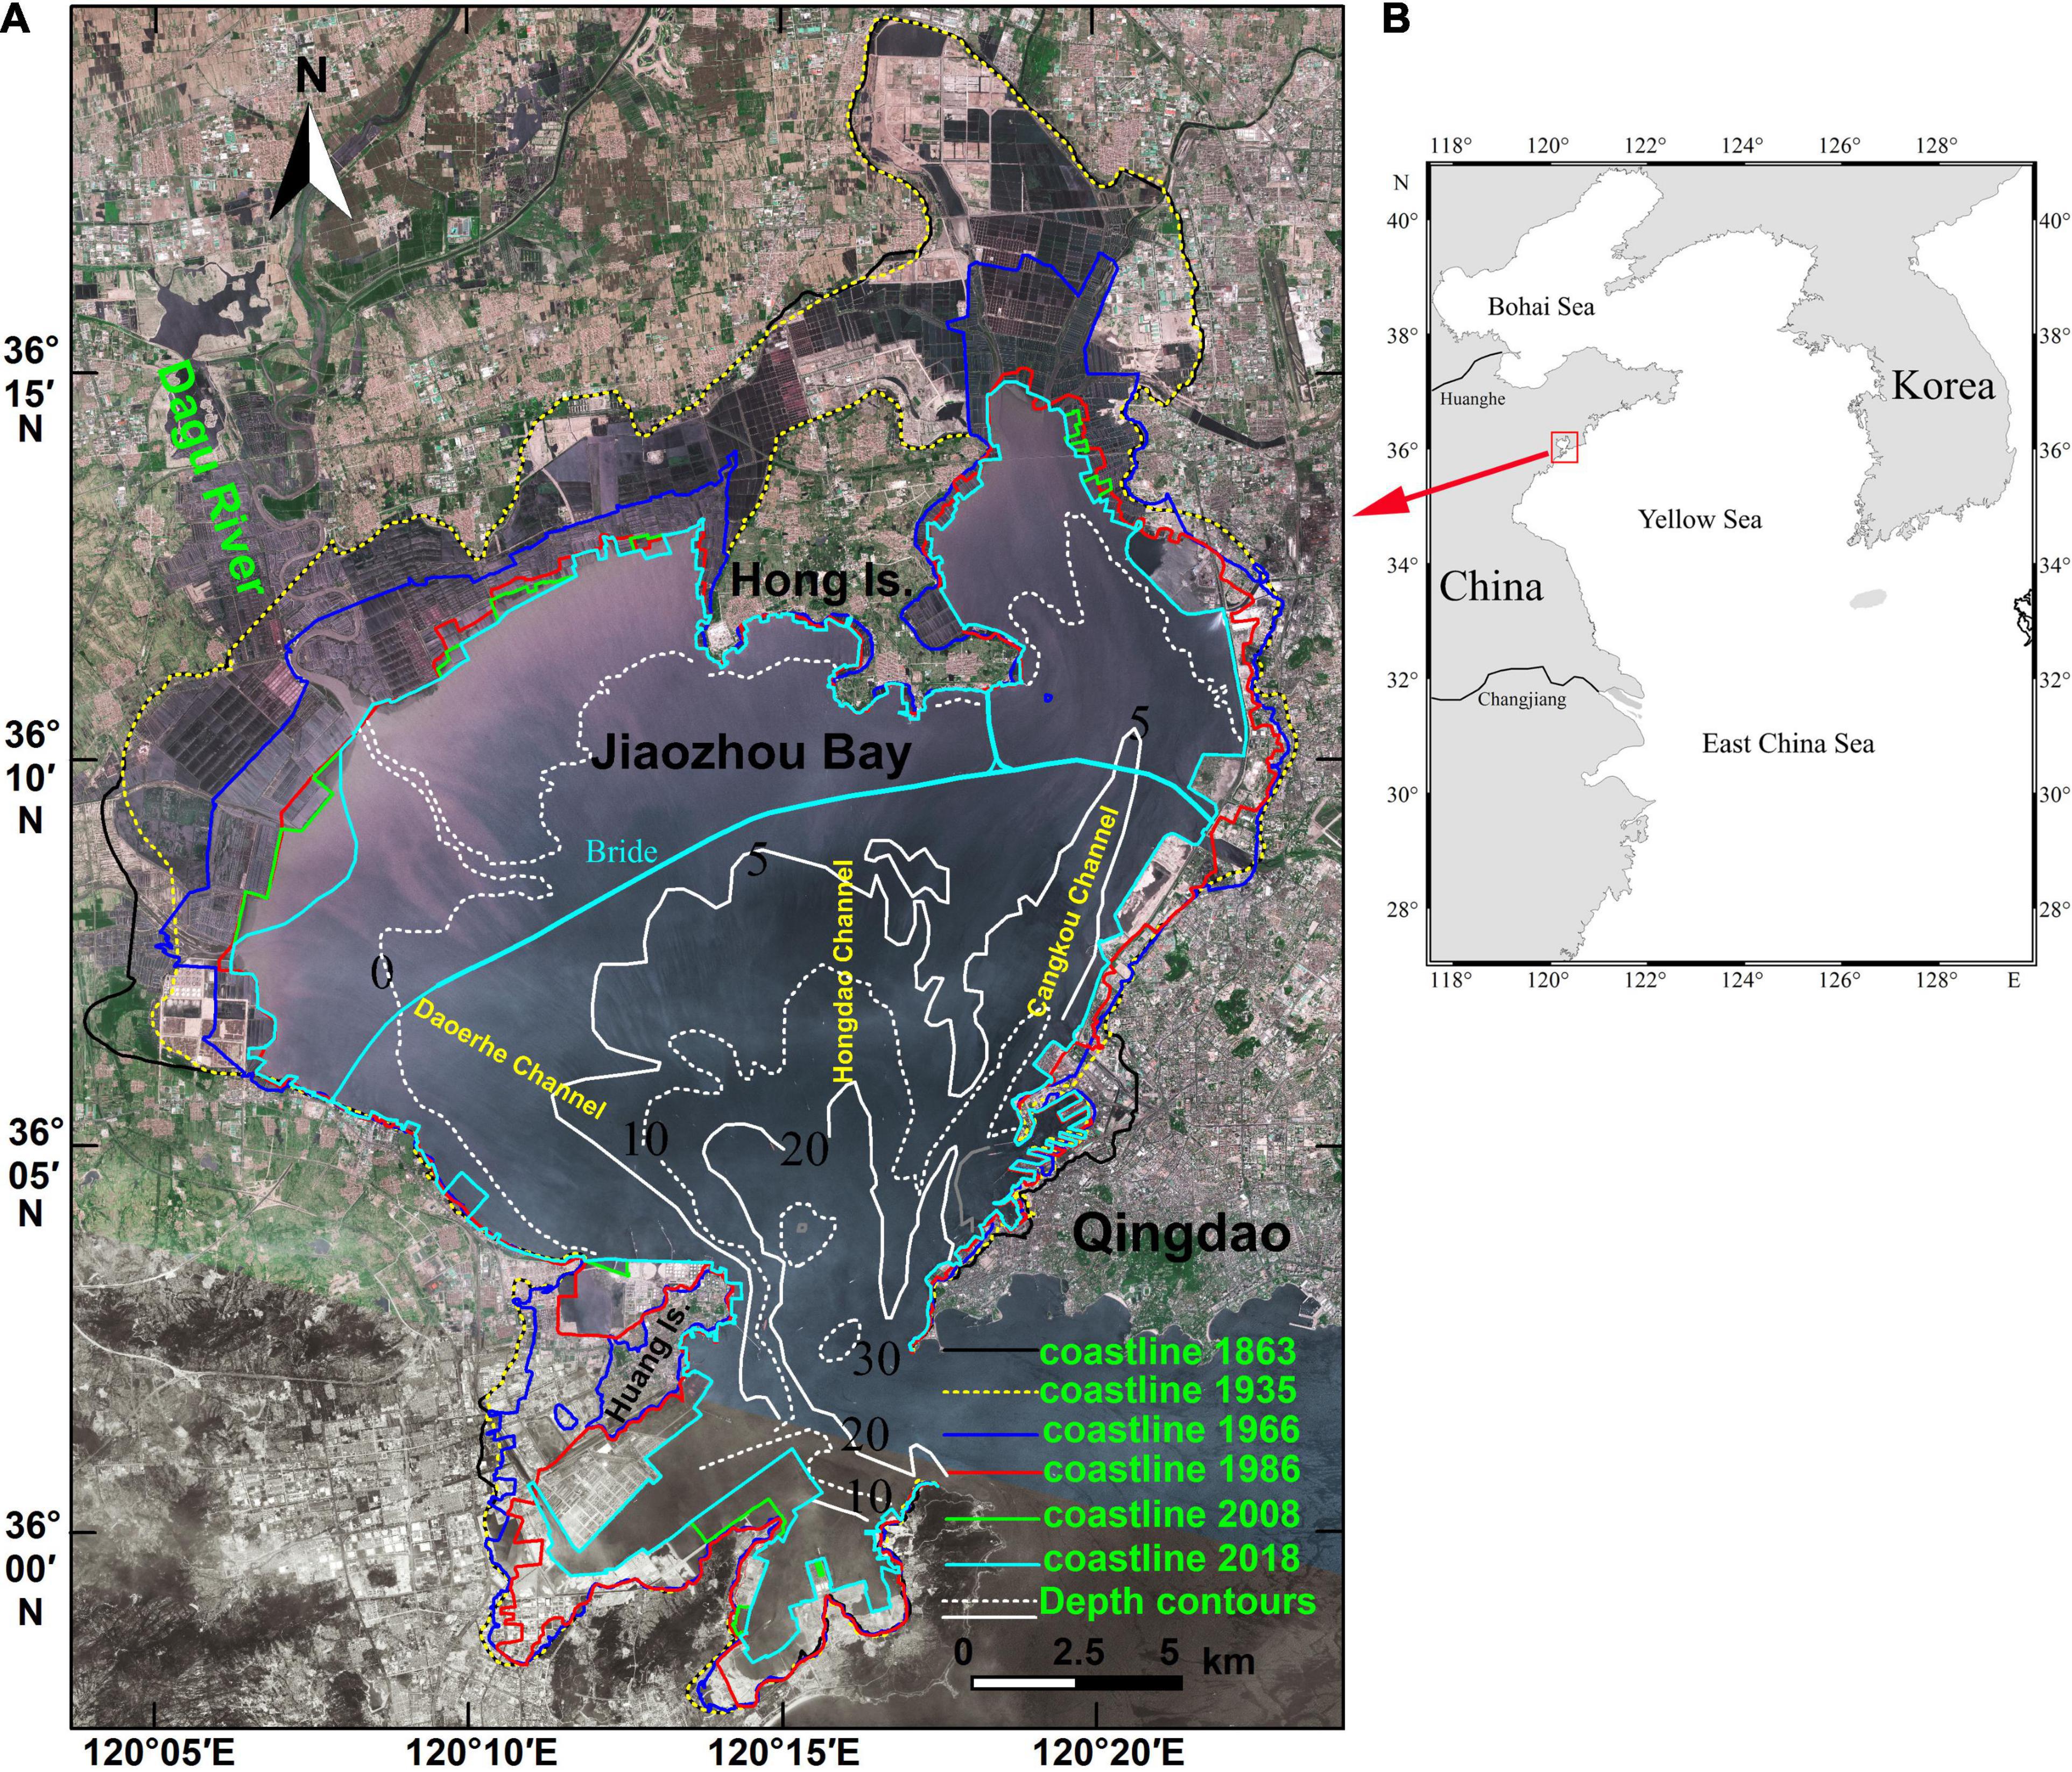
Figure 1. Spatio-temporal coastline change and bathymetric contours of Jiaozhou Bay (A), and location of Jiaozhou Bay (B); the background is from remote sensing imaging from 2008 and the bathymetric contours are derived from chart of 2005.
However, there is still a lack of comprehensive and systematic research on the long-term evolution of the water environment of JZB, which is very much needed for decision-makers to take necessary measures to improve the marine environment. This research emphasizes the long-term response of coastline, tidal prism, water-exchange, and pollutant transport to land reclamation in JZB over the last 150 years, and provides a reference for similar studies in other semi-closed bays with intense anthropogenic activities.
Data and Methods
Coastline and Water Depth Extraction
This section introduces information on remote sensing images and historical charts of JZB. Coastlines were extracted from remote sensing images or historical charts while water depth was derived from historical charts.
Historical charts of JZB, including charts from 1863, 1935, 1966, 1986, 1992, 1996, and 2005 (Table 1), were collected and then registered, as were the Landsat-5 Thematic Mapper (TM) images with resolution of 30 m in 1988, 1900, 1997, 2000, 2003, and 2005 and SPOT-5 satellite images in 2008 and 2020 with resolution of 2.5 m.

Table 1. Historical chart information of Jiaozhou Bay.
The coastline of the charts was modified according to the remote sensing map of nearby years if there were any. The extracted coastlines were divided into artificial coastlines (such as port, salt or aquaculture pond, and other artificial coastlines) and natural ones (estuary, island, sand or gravel beach, muddy tidal flats, and rocky). The length of each coastline type from each remote sensing image or historical chart was characterized and measured under the same principle.
The original depth values were derived from each chart including scattered water depth points and depth contours. Due to the large range of time, the projections, depth units, and chart datum of JZB charts are not the same. All the Mercator projections in the six charts collected were converted into Gauss-Kruger.
For the same sea area, the depth datum of various charts published in different historical periods is not always the same, because the determination of the depth datum is related to the position of the tide station, the length of the tide data, and the calculation method. The time interval and length of the tide data used in the chart of JZB in different periods are different, as are the positions of the depth datum (Table 1), thus, it is necessary to unify the depth datum. Here all the depth datum were corrected respective to the datum of the chart from 2005, by referencing the relationship of mean sea level and tide tables listed in charts, since the mean sea level is relatively stable. For example, according to the tide information table of 1996 chart, mean sea level is 2.4 m higher than the datum (Lowest Normal Low Water), while tide information table of 2005s chart indicated that mean sea level is 2.3 m higher than the chart datum (Lowest Normal Low Water). The mean sea level of JZB stayed the same from 1996 to 2005, thus, the Lowest Normal Low Water in 1996 is 0.1 m lower than that in 2005. Thus, the water depth of 1996s chart is uniformly added to by 0.1 m to be consistent with datum of 2005 chart. The standard deviation of depth correction in this way is less than ± 7 cm, which is higher than the current accuracy of depth sounding, thus the accuracy of water depth is guaranteed by correcting in this way. The above unified water depth points are grid-interpolated with the same grid distance (100 × 100 m) for each chart, thus the area and volume below or between certain contour values can be calculated accordingly based on the mesh water depth for each period.
Numerical Model
MIKE 21, a very popular numerical model for simulating hydrodynamics, especially in bays and coastal zones, was applied here to simulate the tidal dynamics and pollution transport for each historical scenario. MIKE 21 is based on the numerical solution of Navier-Stokes equations, using unstructured triangular mesh and dry-wet boundary (Danish Hydraulic Institute, 2012), which can adapt well to the complicated coastlines of JZB.
The continuity equation is as Equation 1,
where h is the total water depth, t is time, x and y are the Cartesian coordinates, and are depth average value of velocity components in x and y direction, and S is the magnitude of the discharge due to point sources.
The two horizontal momentum equations for the x and y components are given in Equations 2 and 3, respectively:
where f is the Coriolis parameter, g is gravitational acceleration, η is surface elevation, ρ0 is reference density of water, Pa is atmospheric pressure, ρ is the density of water, τsx and τsy are the x and y components of surface wind and τbx and τby are the components of bottom stress, us, vs is the velocity by which the water is discharged into the ambient water, Sxx, Sxy, Syx and Syy are components of the wave radiation stress tensor. Txy, Tx, and Tyy includes viscous friction, turbulent friction, and differential advection estimated using eddy viscosity formulation.
A Eulerian tracer-tracking module (Equation 4) was coupled to the Mike21 hydrodynamic model to simulate tracer transport for each scenario.
where is the depth-averaged concentration of the tracer, Dh is the horizontal diffusion coefficient, kp is the linear decay rate of the tracer, and Cs is the concentration of tracer at the source.
The bay entrance of JZB is very narrow and the wave in JZB is generally very weak. Thus, the wave was not taken into account in this paper. As there is a large area of tidal flats in JZB, the flow of which sometimes dries out and sometimes is flooded, the dry-wet boundary is used in the model. When the water depth is less than the wetting depth at 0.1 m, the problem is reformulated, and only if the water depth is less than the drying depth of 0.005 m is the element removed from the calculation. The flooding depth, set as 0.05 m, is used to determine when an element is flooded (i.e., reentered into the computations). The reformulation is made by setting the momentum fluxes to zero and only taking the mass fluxes into consideration. In this way, continuity is fully preserved during the flooding and drying process as the water depths at the elements which are dried out are saved and then reused when the elements become flooded again. The bottom friction is set as Manning coefficient of 58 m1/3/s. Eight major tidal constituents (M2, S2, K1, O1, N2, K2, P1, and Q1) are used to generate the tidal water levels at the open boundary located in the Yellow Sea.
The model in August 2012 was used for verification. Its coastline was derived from satellite in 2012 while topography was extracted mainly from 2005 nautical chart with some corrections where the change of coastline partially affected the water depth, because the depth of JZB has not changed obviously since 2005 (Li et al., 2014). The mesh of 2012 has 36,094 triangular elements with mesh size 60–100 m in the JZB (Figure 2A). The effect of 864 bridge square piers, with a side length of 6 m, is modeled as sub-grid structures using a simple drag-law to capture the increasing resistance imposed by the piers as the flow speed increases (Figure 2B).
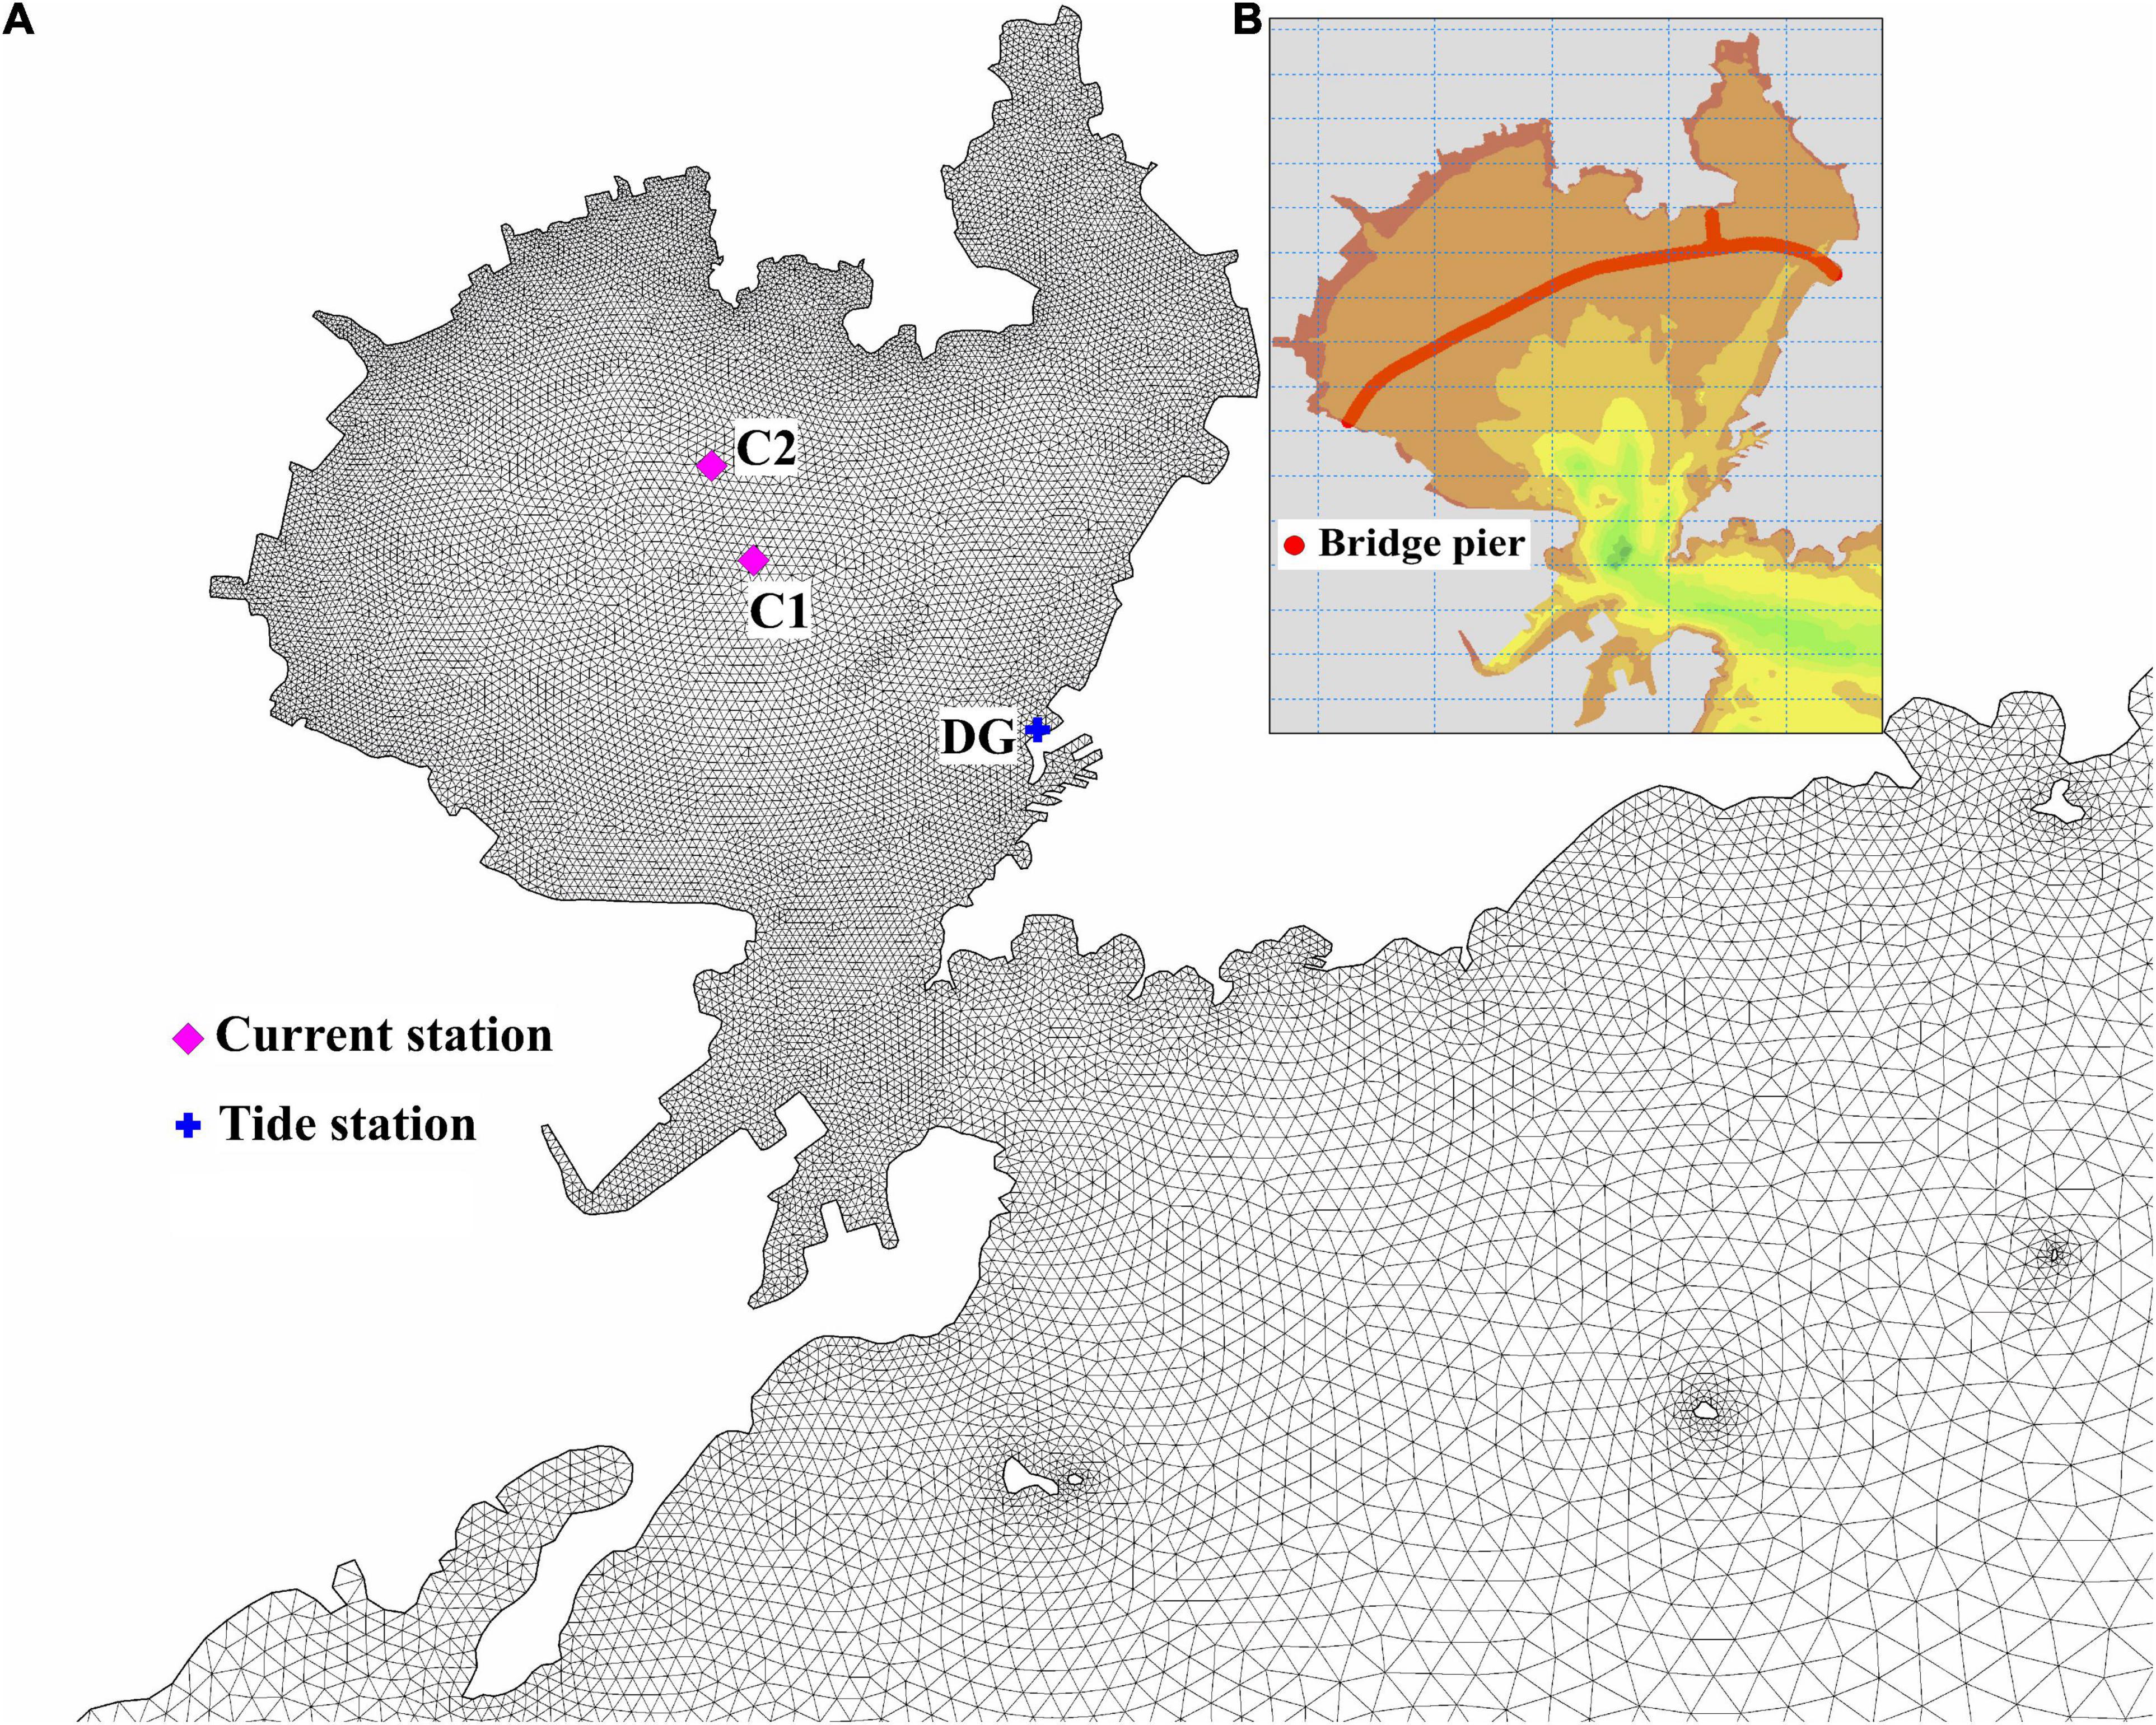
Figure 2. Mesh of JZB. (A) Mesh of 2012; (B) JZB bridge piers modeled as sub-grid structures.
Model Validation
The measured tidal level from the long-term tide station DG and current from station C1 and station C2, as shown in Figure 2A, were used for model validation. Figure 3 shows that the modeled tide levels match the observation data very well, with an average absolute error of 0.02 m. It is shown from Figure 4 that the model results of tidal velocity and direction agree with the observation data fairly well. Independence tests of the mesh size were then carried out to exclude the possibility that the results were affected by the intensification of mesh.
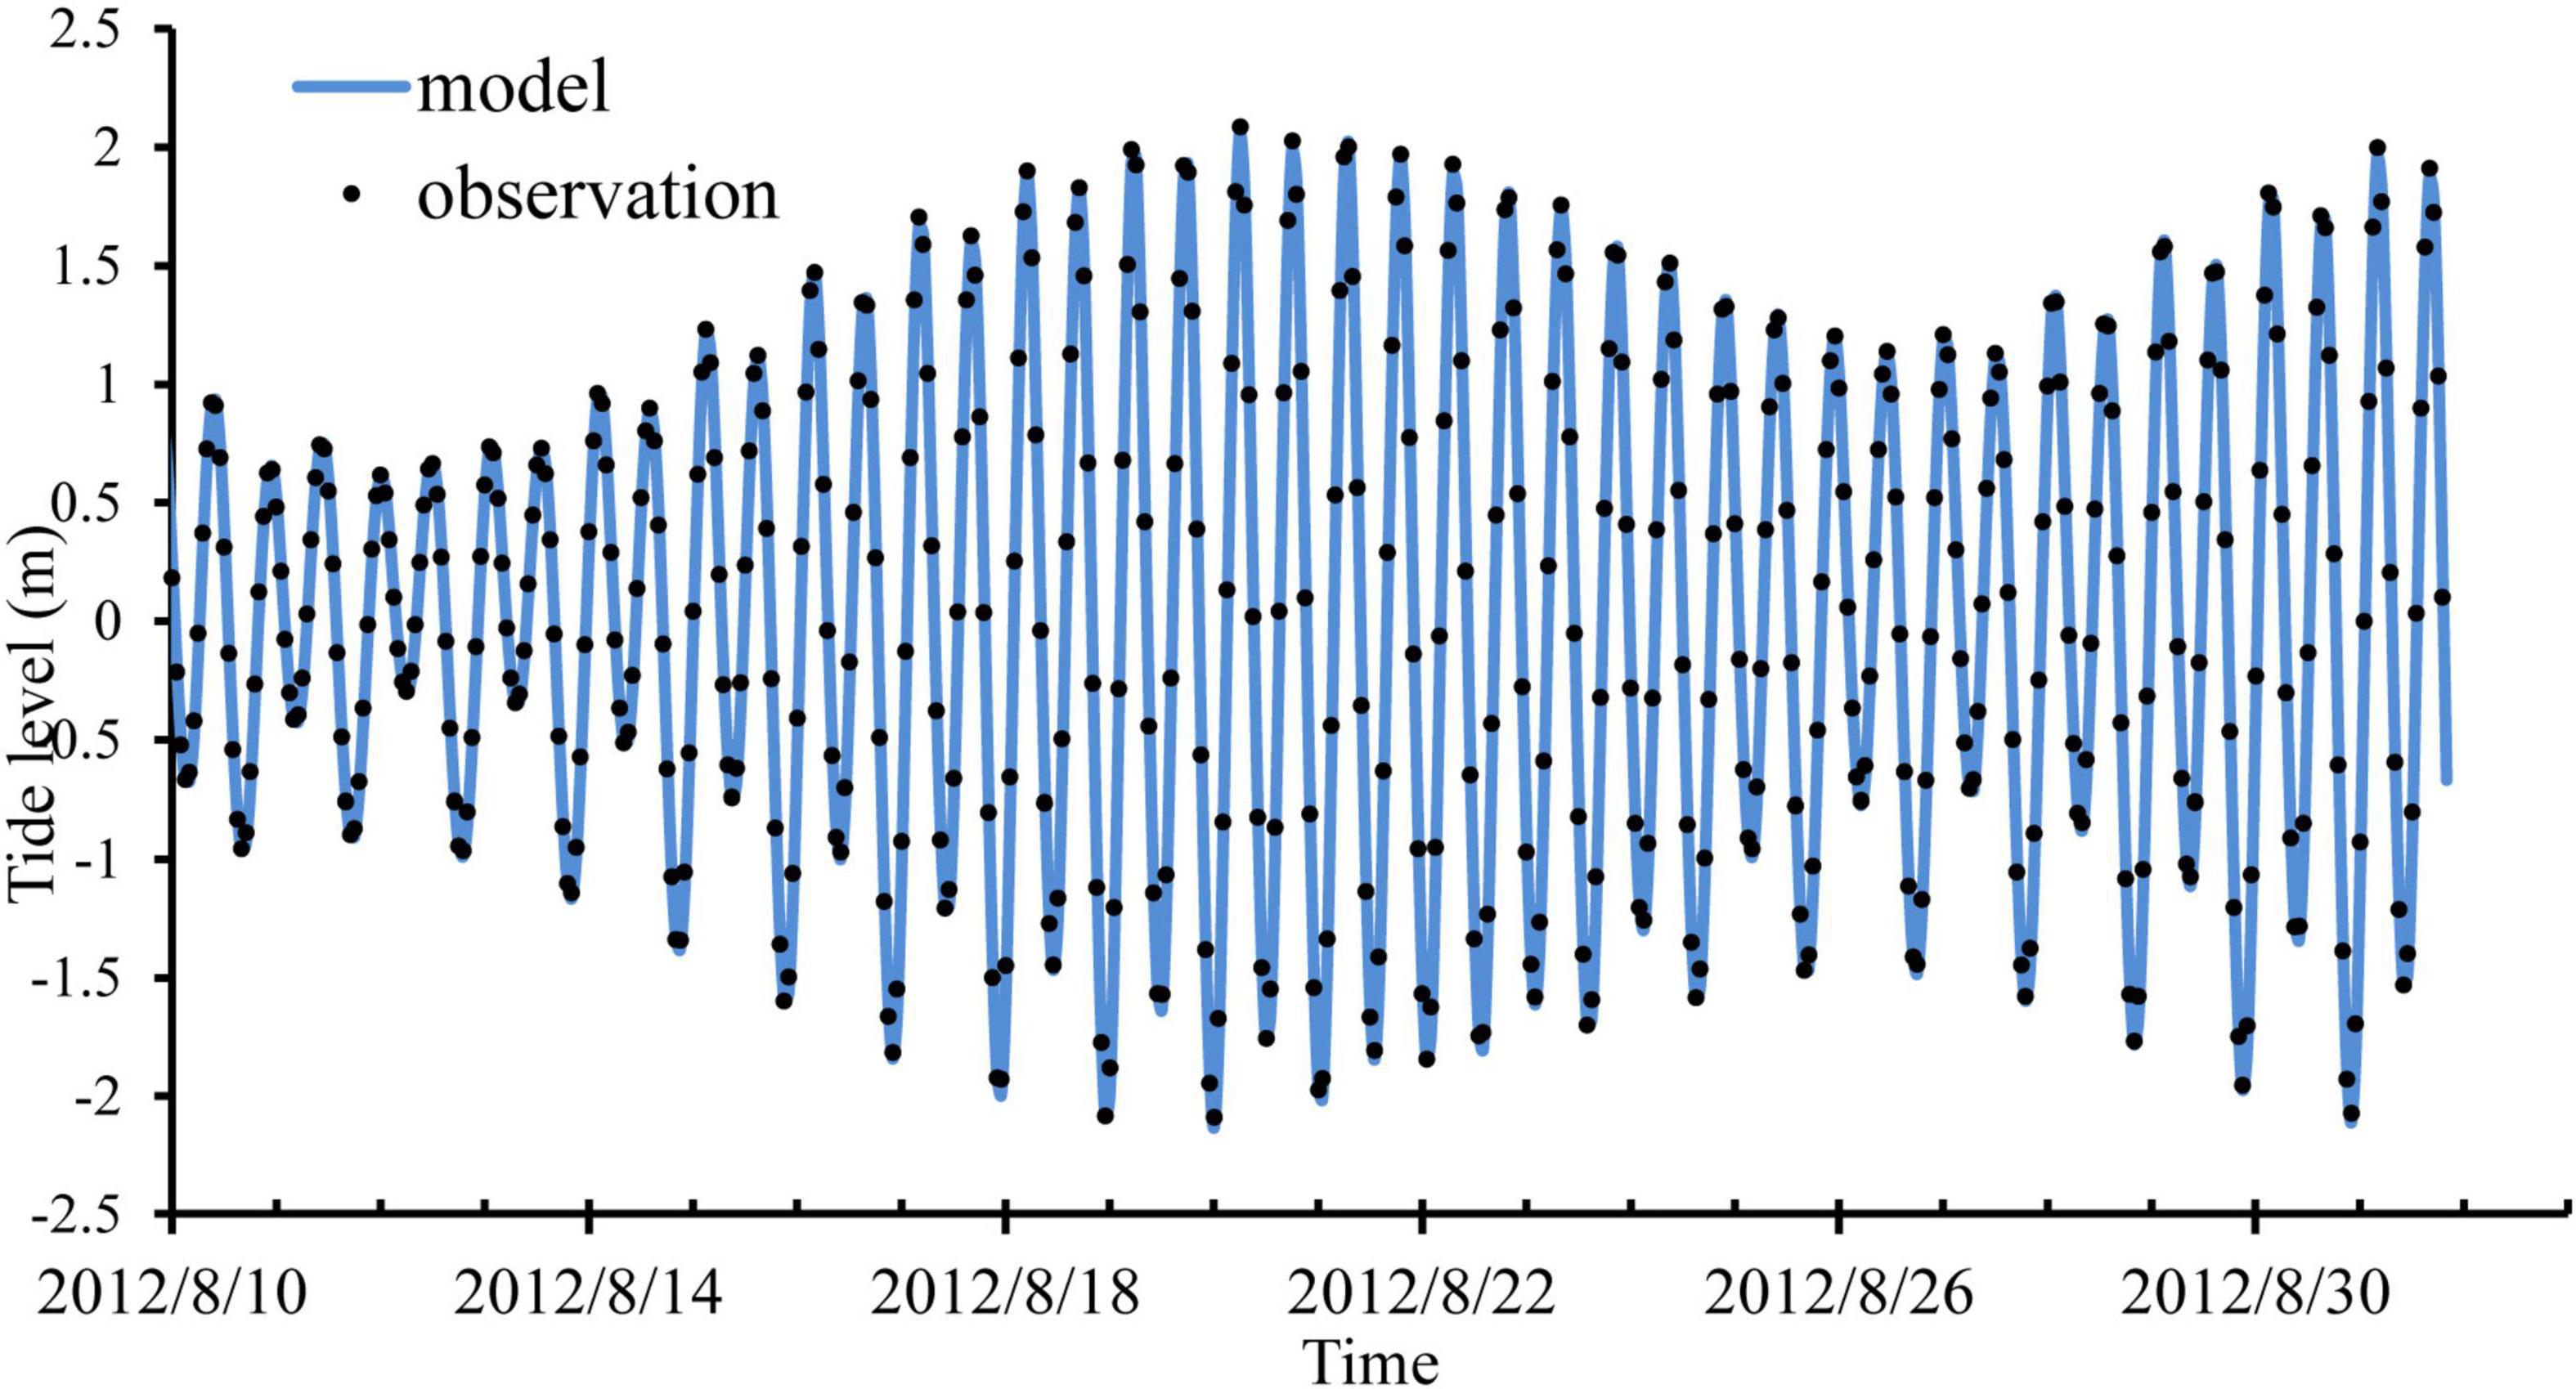
Figure 3. Tidal level comparison between model results and measured data at Station DG.
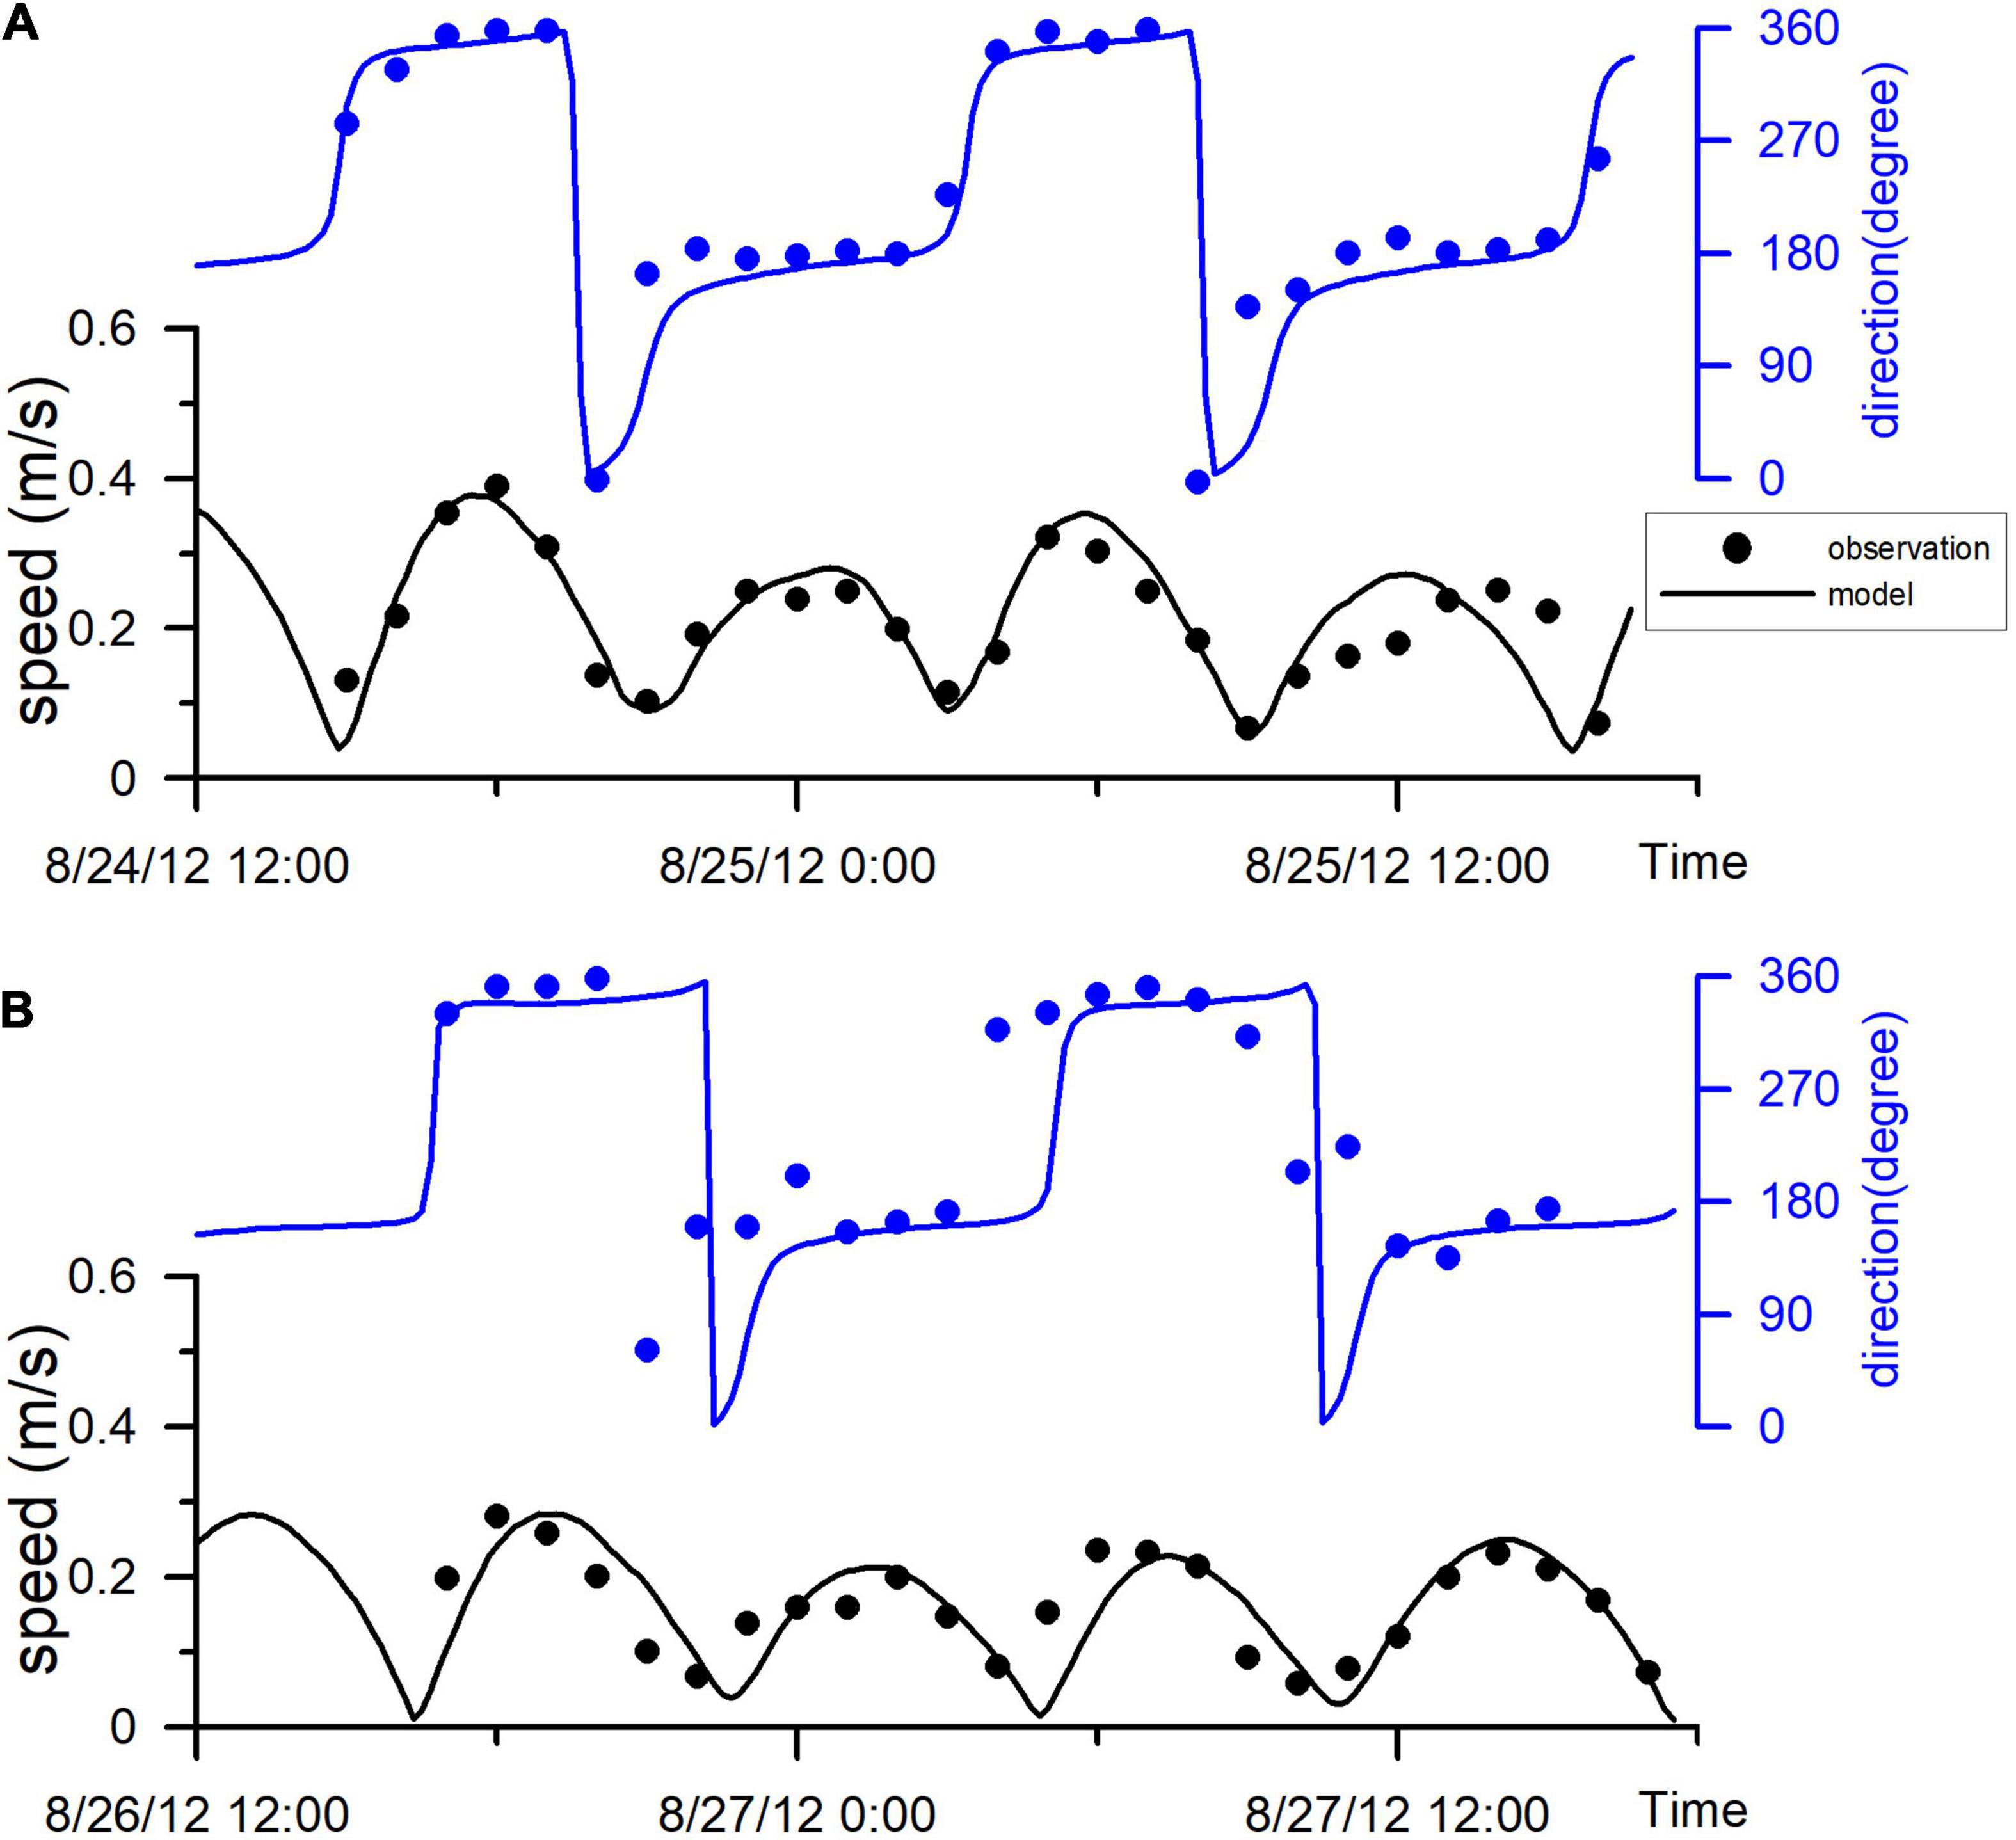
Figure 4. Tidal current speed and direction comparison between model results and measured data at (A) Station C1, (B) Station C2.
Tidal Prism Calculation
The coastline change in JZB mainly happened in the tidal flats. Thus, change of tidal flats area was inevitable, as was the change of tidal prism. Tidal prism is an important index for the environmental assessment of a bay and it reflects the self-purification capacity of a bay and determines the exchange intensity between the bay and the open sea, which is of great significance to the environment, ecology, erosion, and deposition of the bay (Shi et al., 2011).
Tidal prism Pm for any tidal period is calculated as the product of the mean of the high- and low-water surface areas of the bay behind the bay entrance and the tidal range in each segment, shown as Equation 5:
where H1 is low-water level, H2 is high-water level, and S(l) refers to the water area corresponding to the water level H and water boundary l. According to the definition, tidal prism can be calculated as the volume between the spring high-water and the spring low-water based on the detailed bathymetric data in section “Coastline and Water Depth Extraction.” The volume between the spring high-level and the spring low-water are taken as the tidal prism in this paper. Similarly, the area between the spring high-water and the spring low-water are taken as the area of tidal flats.
Residence Time Calculation
Water-exchange of a semi-closed bay determines the transport and redistribution of pollutants, nutrients, and suspended sediments, which is essential for the ecosystem of the bay. Residence time is one of the most frequently used timescales to reflect the water-exchange capacity of a bay.
Eulerian definition of residence time is applied in this paper, which has been widely used in numerous shallow coastal areas such as the Archachon Bay (Plus et al., 2009), Bay of Biscay (Grifoll et al., 2013), Jervis Bay (Sun et al., 2018), and Jiaozhou Bay (Yuan et al., 2021). A Eulerian passive tracer with a concentration of 1 was released at each grid cell inside the JZB on 1st February (time t0). No further tracer was added after t0, and the volume of each grid cell Vi in the bay remained constant over time. The concentration of tracer at each grid cell Ci evolved with time (t) as the bay exchanged water with the open sea. The relative tracer mass (RTM) is given as Equation 6:
where the subscript i labels the grid points within the bay. Here the Ci(t0) = 1 as the initial conditions. The numerator and denominator of Equation 6 are the total tracer mass inside the bay at time t and time t0, respectively.
The basin residence time is taken as the time at which the RTM inside the bay first fell below e–1 (37%). Similarly, the local residence time at a grid cell was obtained as the time required for the tracer concentration at that grid cell to fell below 37% of the initial concentration.
Three runs to investigate the tidal current pattern, residence time, and pollutant transport, respectively, were then carried out for each year in 1863, 1935, 1966, 1986, 2005, and 2020.
Results and Discussion
Long-term evolution of JZB over the last 150 years was systematically analyzed in terms of coastline change, tidal prism, tidal residual current, water-exchange capacity, and pollutant transport.
Coastline and Tidal Prism Change of Jiaozhou Bay
As shown in Figure 1, the coastline barely changed from 1863 to 1935, only the northwest coastline of JZB moved seaward slightly due to the construction of salt ponds. From 1935 to 1966, the coastline in the northwest and northeast of JZB changed significantly, especially the isolated Hong Island in the northeast of JZB which merged into mainland due to the great expansion of salt and aquaculture ponds. From 1966 to 1986, the salt and aquaculture ponds in the northwest and northeast of JZB were further expanded toward the sea. During this period, another isolated island, Huang Island, in the southwest of JZB was incorporated into the mainland. From 1986 to 2020, the coastline in the southwest and east of JZB changed greatly, and the JZB Bridge across the northern bay, with a length of 31.63 km, was built in 2011. During this period, the coastline generally moved toward the sea and tended to be straight, due to port construction and urban expansion. Overall, the area of JZB shrank significantly by 42% (567.95 km2) from 1863 to 2020.
According to the coastline attribute indicated by charts and images, the length of each coastline type in JZB was measured.
Figure 5 shows that the length of nature coastline barely changed from 1863 to 1935, then the natural coastline decreased sharply from 1935, especially in the 50 years from 1935 to 1986, during which the natural coastline had been reduced by 137.9 km (70%). In 1986, the tidal flat coastline in a large area had basically disappeared, most of which had been replaced by salt and aquaculture ponds and port, and the rocky coastline had also decreased by 83%. After 1986, the decrease rate of natural coastline became slower.
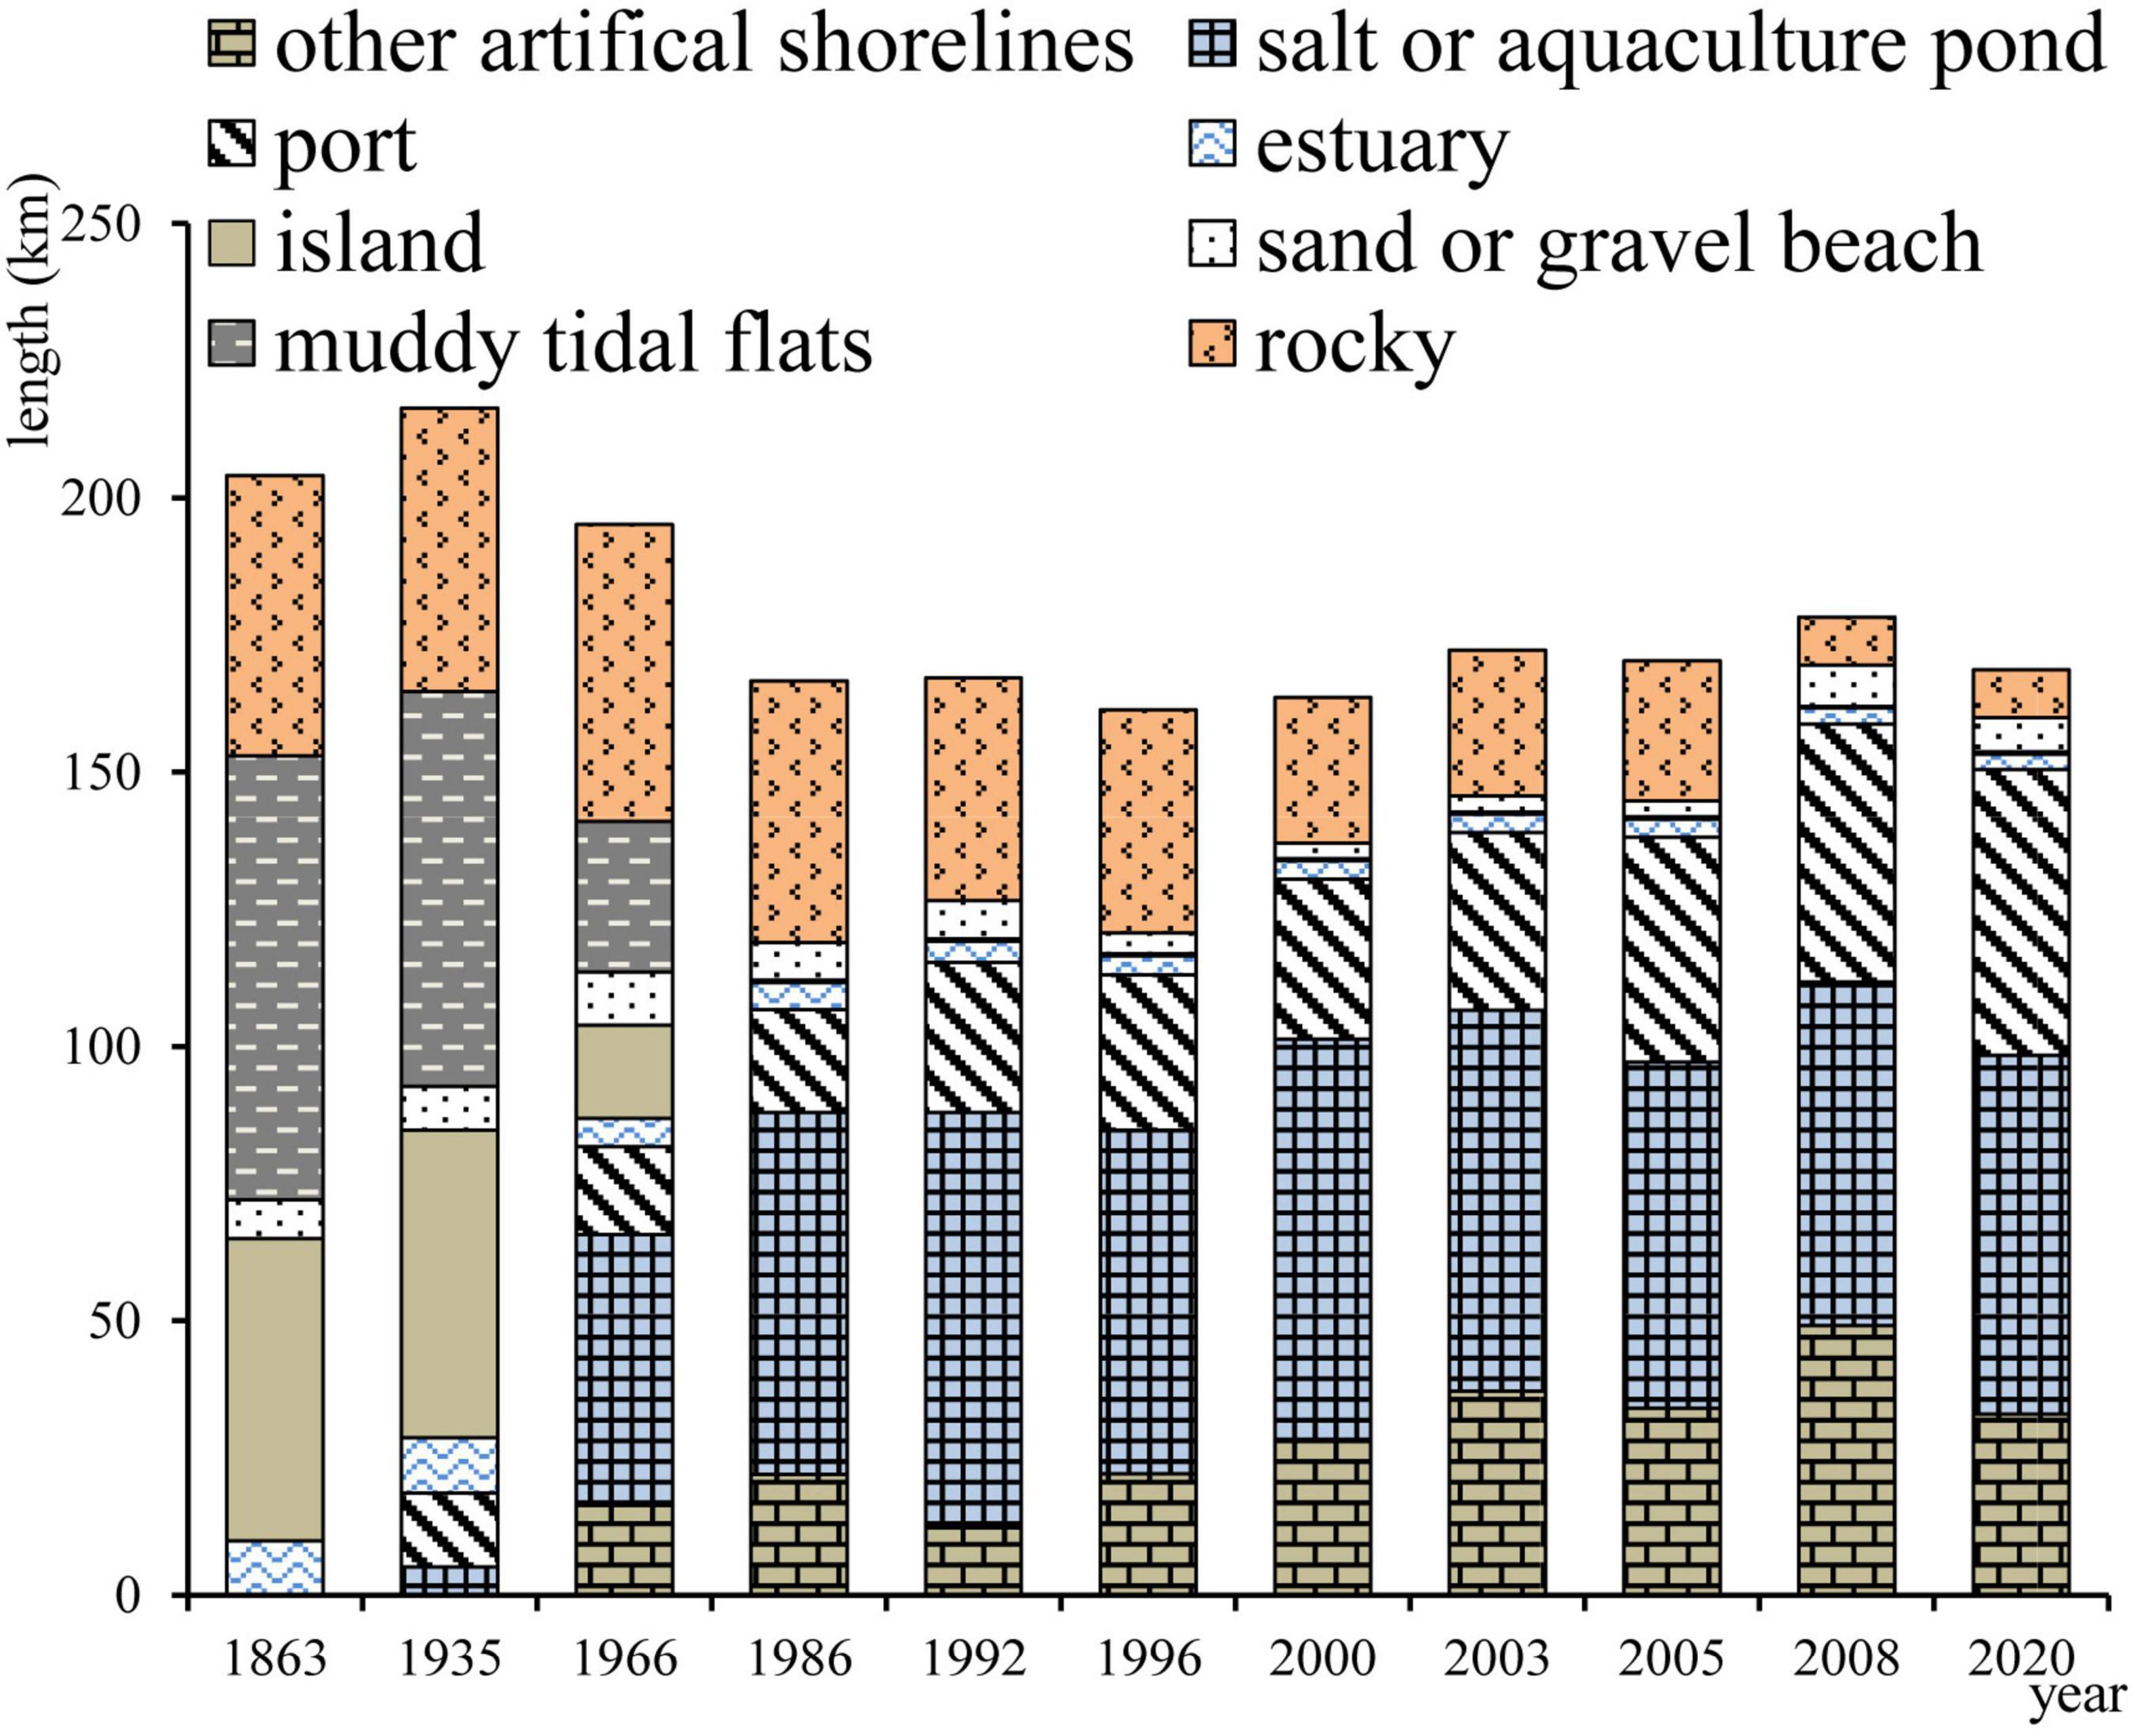
Figure 5. Length of each coastline type in Jiaozhou Bay over 150 years.
The significant coastline change corresponded with rapid economic development and the coastline type change was mainly affected by human intervention. JZB had experienced salt and aquaculture pond construction in 1950s, reclamation of tidal flats from the mid-1960s to the 1970s, and reclamation for agriculture, port development, highway construction, and port adjacent projects since the 1980s. With the intensification of human development activities, the coastline moved toward the sea gradually while the natural coastline was lessening, and was gradually replaced by artificial coastlines.
As presented in section “Tidal Prism Calculation,” the water volume and area below spring high-water and the spring low-water in JZB can be calculated and the resulting tidal prism and area of tidal flats are listed in Table 2. According to Table 2 and Figure 6, the area of tidal flats decreased only by 6% (15.67 km2) in 72 years from 1863 to 1935 due to little human influence. Thereafter, the area of tidal flats decreased sharply by 76% (182.22 km2) in 85 years from 1935 to 2020 due to intense human activities. Large areas of natural tidal flats were replaced by salt/aquaculture ponds and artificial reclamation. The tidal prism decreased by 0.002 km3 during the 72 years from 1863 to 1935, and decreased by 0.290 km3 during the next 85 years from 1935 to 2020.
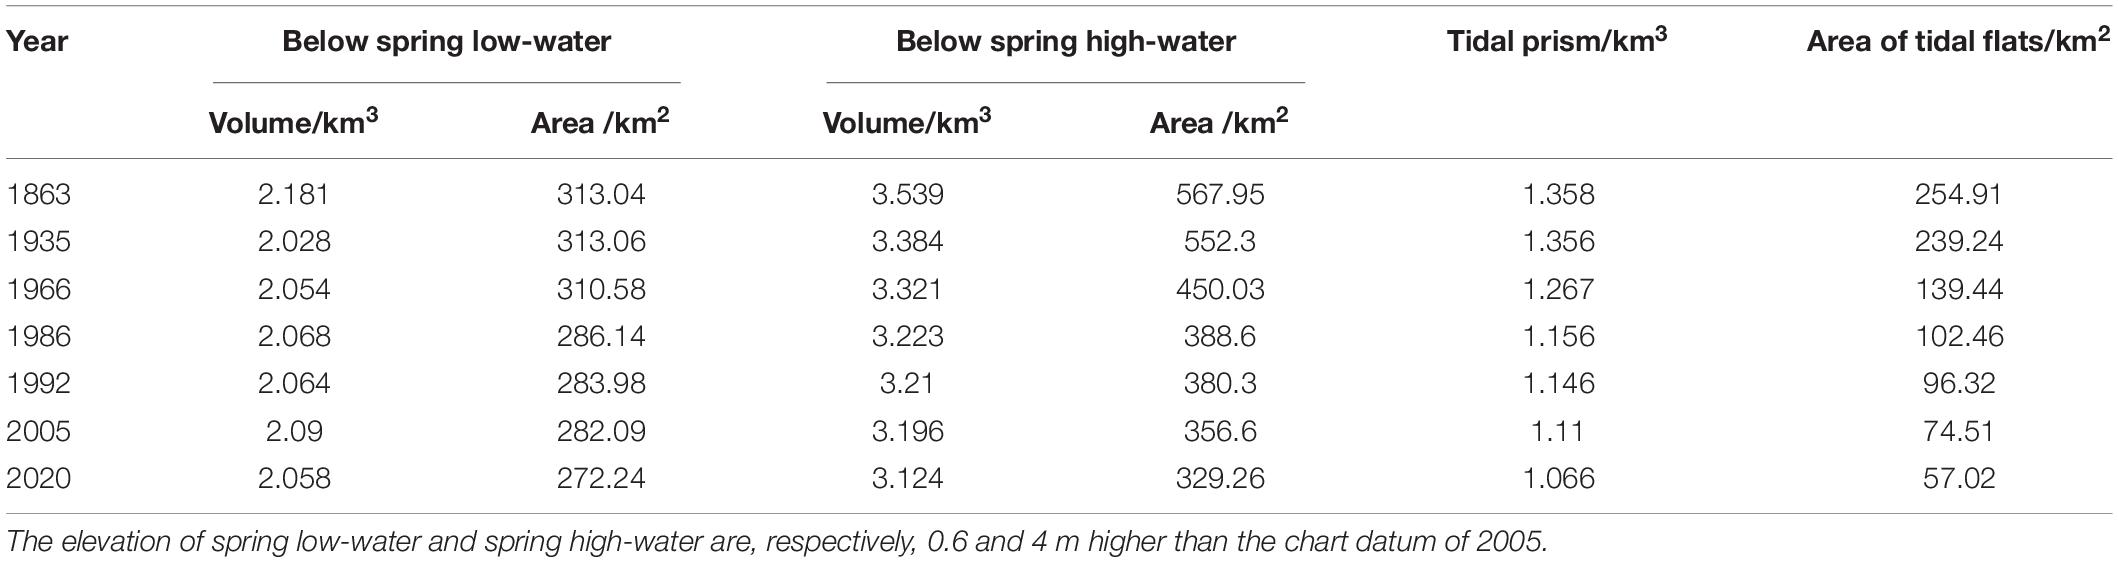
Table 2. Tidal prism and area of tidal flats of Jiaozhou Bay.
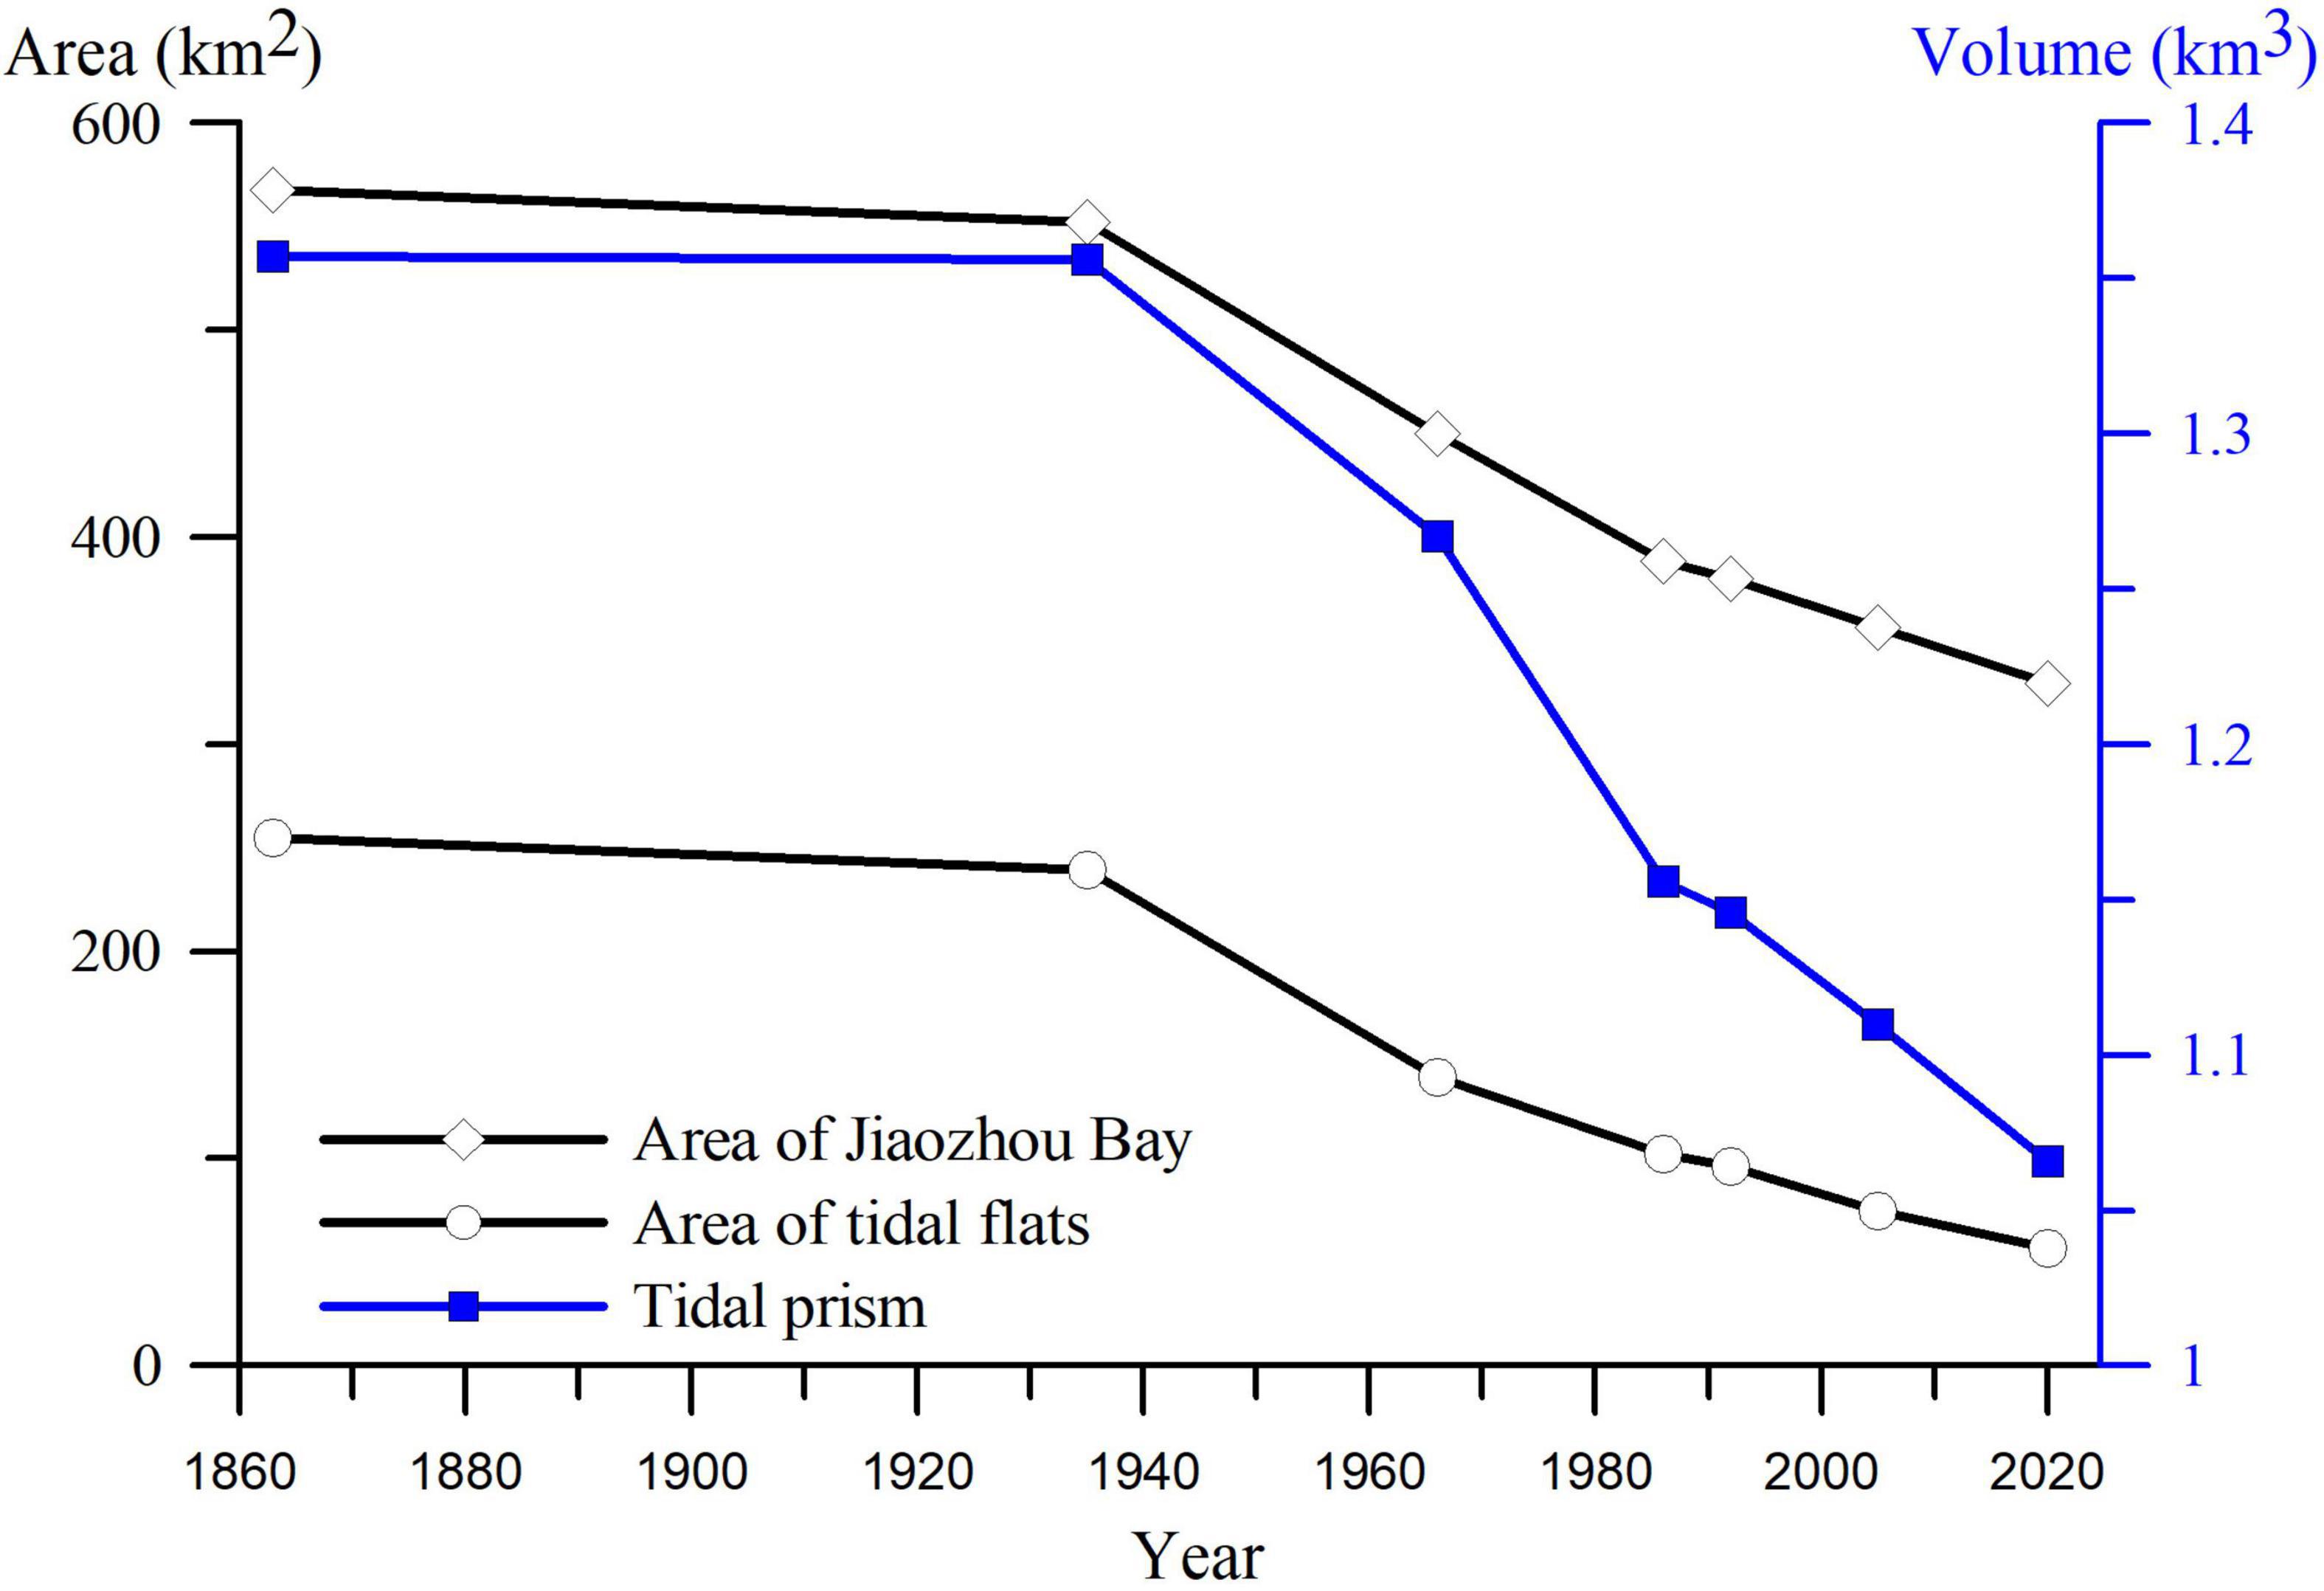
Figure 6. Time series of tidal prism of Jiaozhou Bay, area of Jiaozhou Bay, and area of tidal flats.
Generally, JZB was predominated by natural evolution from 1863 to 1935, during which the tidal prism barely changed. Thereafter, intensified human intervention resulted in more natural tidal flats being occupied by salt ponds, aquaculture area, and reclamation very quickly. Consequently, tidal prism, area of tidal flats, and area of JZB decreased sharply by 0.290 km3, 182 km2, and 223 km2, respectively, from 1935 to 2020, corresponding to shrinking rates of 123, 10, and 12 times, respectively, as that of before 1935.
Evolution of Tidal Dynamics
Tidal dynamics have a significant effect on the water exchange capacity and pollutant transport in a bay. In this section, the evolution of mean tidal velocity and tidal residual currents of JZB are discussed.
The mean tidal velocity during 1 month (August) is calculated for each year and is shown in Figure 7. Generally, the average velocity in the area surrounded by Huangdao island, Tuandao, and the bay entrance was the largest, up to 0.80 m/s, and gradually decreased northward from the bay entrance. Along with the land reclamation, the mean tidal velocity in JZB decreased and the tidal dynamic weakened. The area with mean velocity greater than 0.2 m/s shrank considerably, especially in the northern part with only sporadic distribution in the deep channel in 2020.
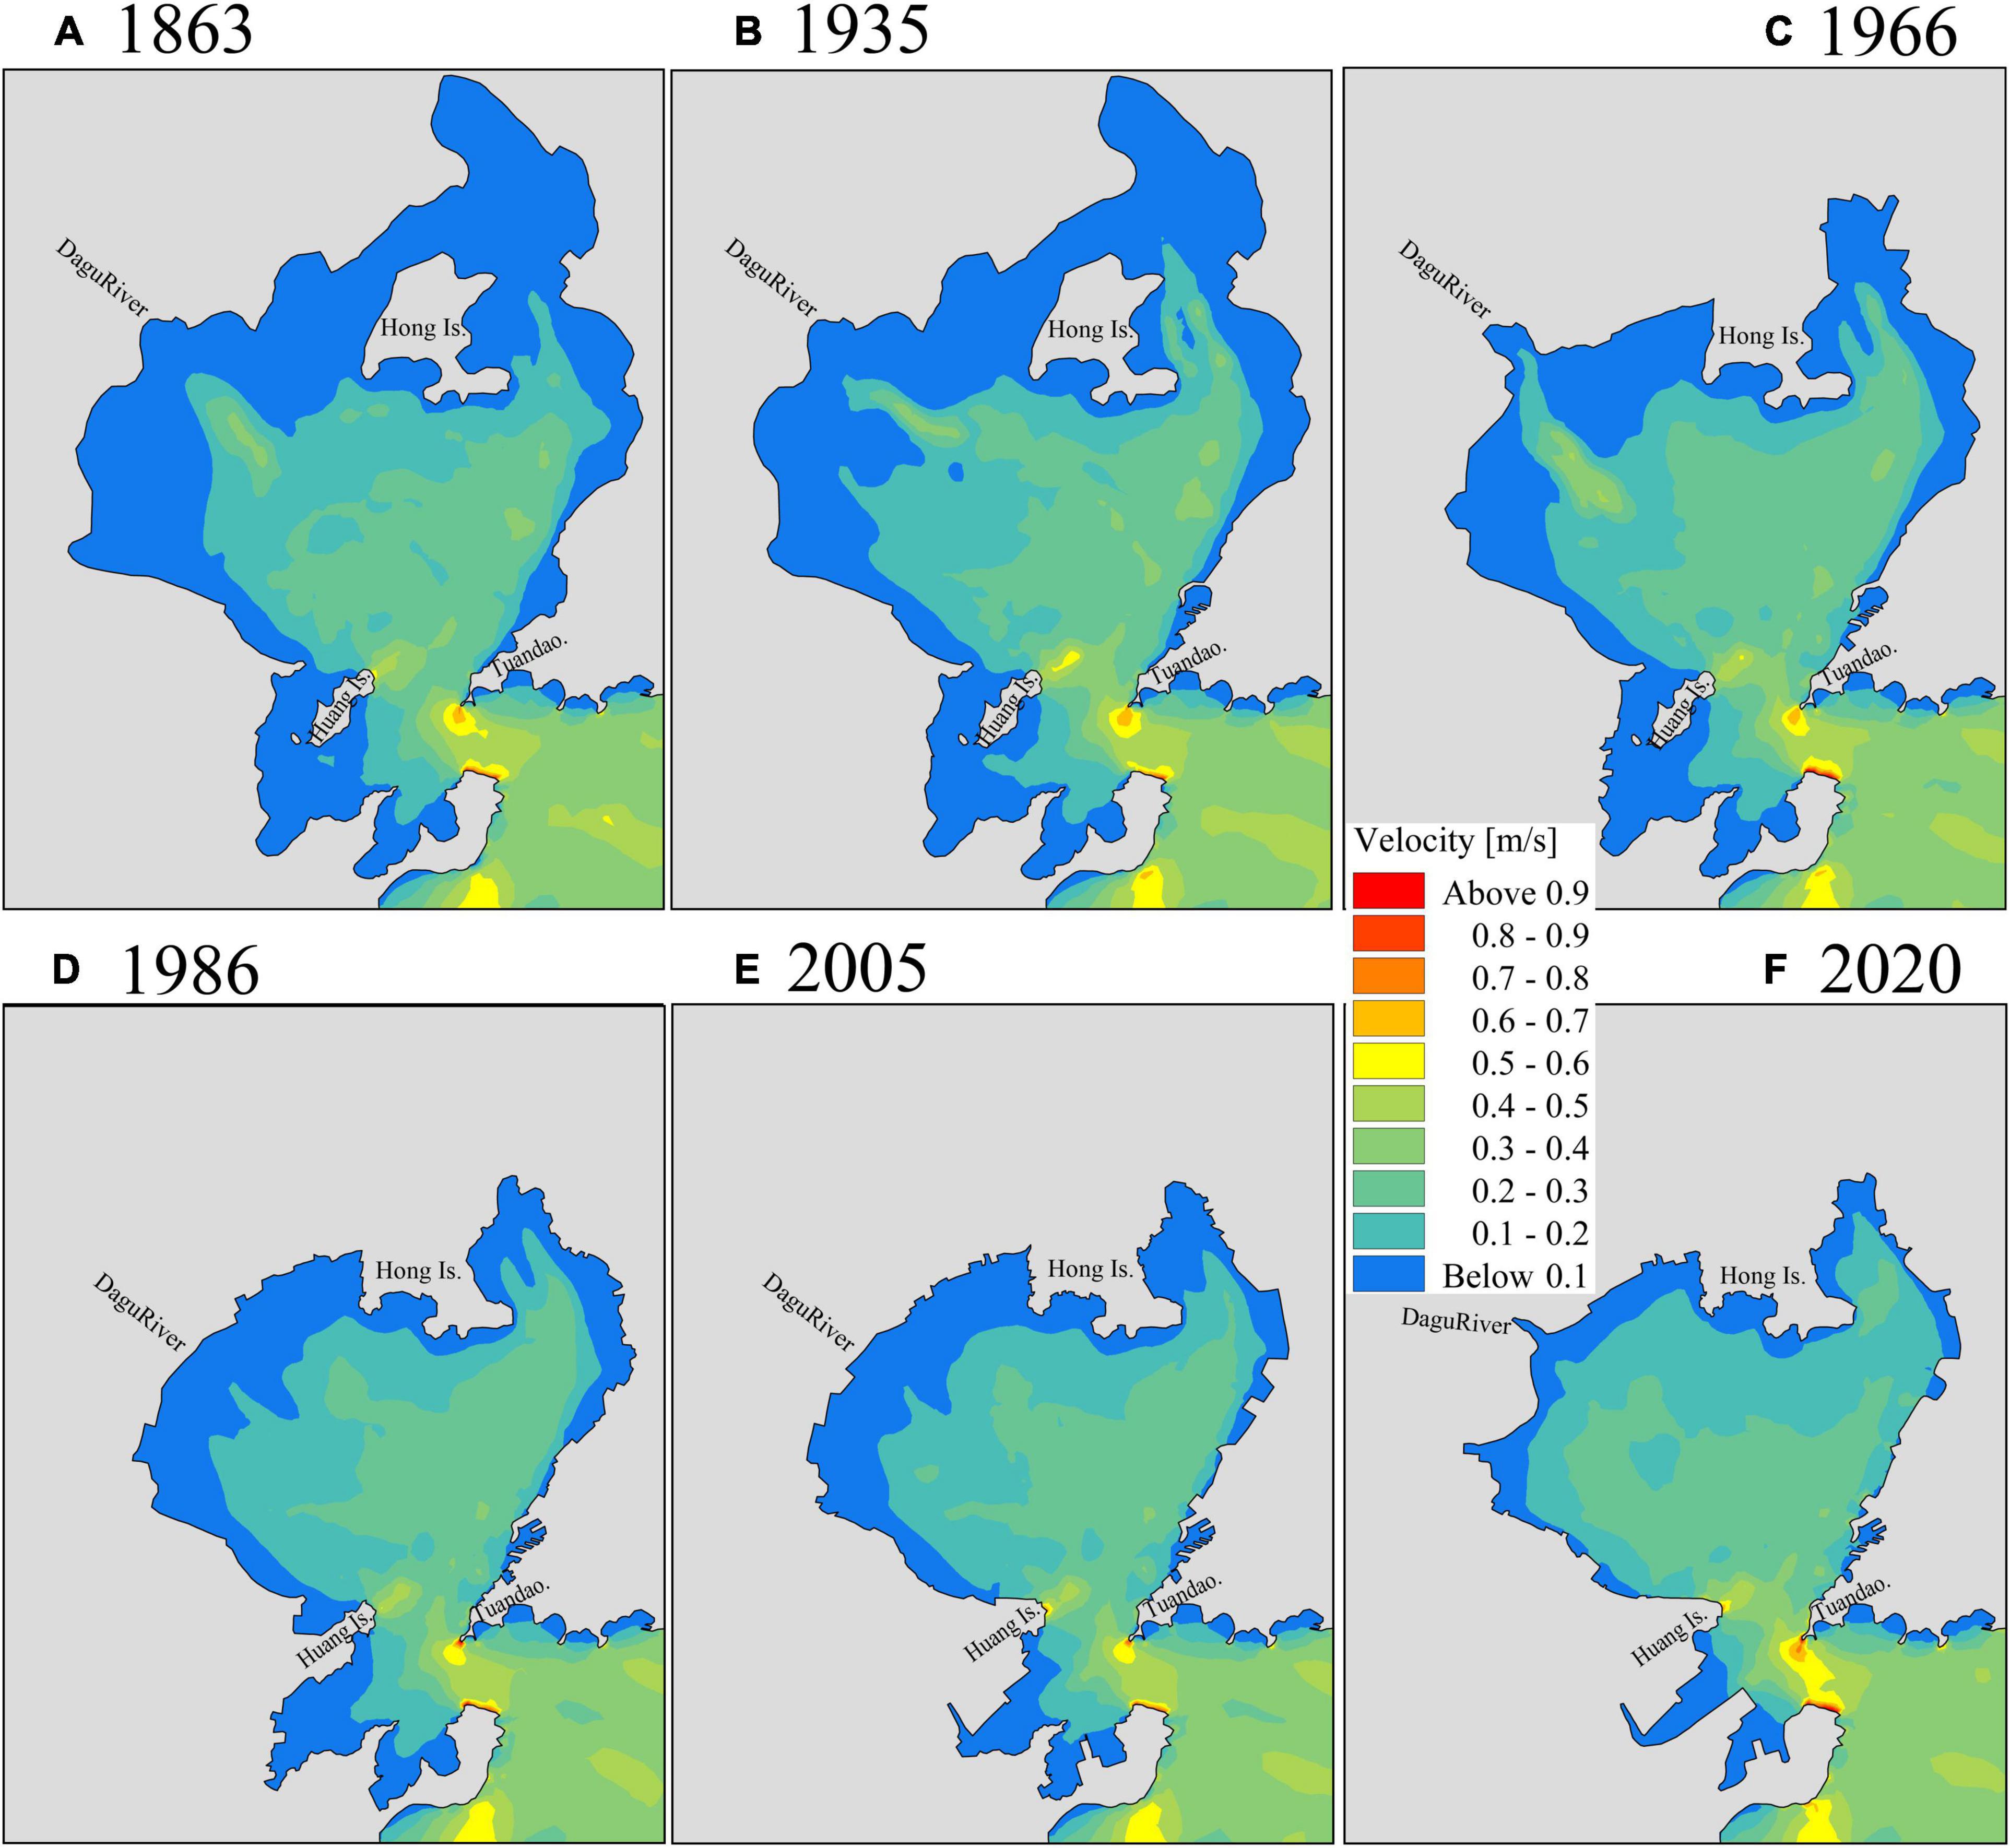
Figure 7. Distributions of mean tidal velocity in (A) 1863 (B) 1935 (C) 1966 (D) 1986 (E) 2005 (F) 2020.
Tidal residual currents, though much smaller than tidal currents, are essential for long-term mass-transport and evaluating the water exchange capacity (Chen et al., 2012; Li et al., 2014). The most calculated residual current in studies on tidal dynamics is the Euler residual current due to its simplicity. Eulerian residual current uEuler is defined as the averaged velocity at a fixed location, over one or many tidal cycles (Leonardi et al., 2015), calculated as Equation 7 (Rodríguez et al., 2017).
where u is the tidal current at time t, T is the period of a tidal cycle, and n is the number of tidal cycles. In this section, the Euler residual current of JZB in each year is calculated on the basis of 1 month’s model results.
uEuler is decomposed into UE and VE in x and y direction,
where t0 is the initial time for calculation and and are depth-average value of velocity components in x and y direction at a fixed location x0.
Figure 8 shows that residual currents are mostly less than 0.10 m/s in most scenarios, and larger (0.3 m/s) near the bay entrance. There are about 7–8 residual current eddies in JZB with blue character denoting clockwise eddy and red representing counterclockwise one. The strongest eddies of residual currents a, b and c (one anticyclonic between two cyclonic) are near the bay entrance and Huang Island in all scenarios.
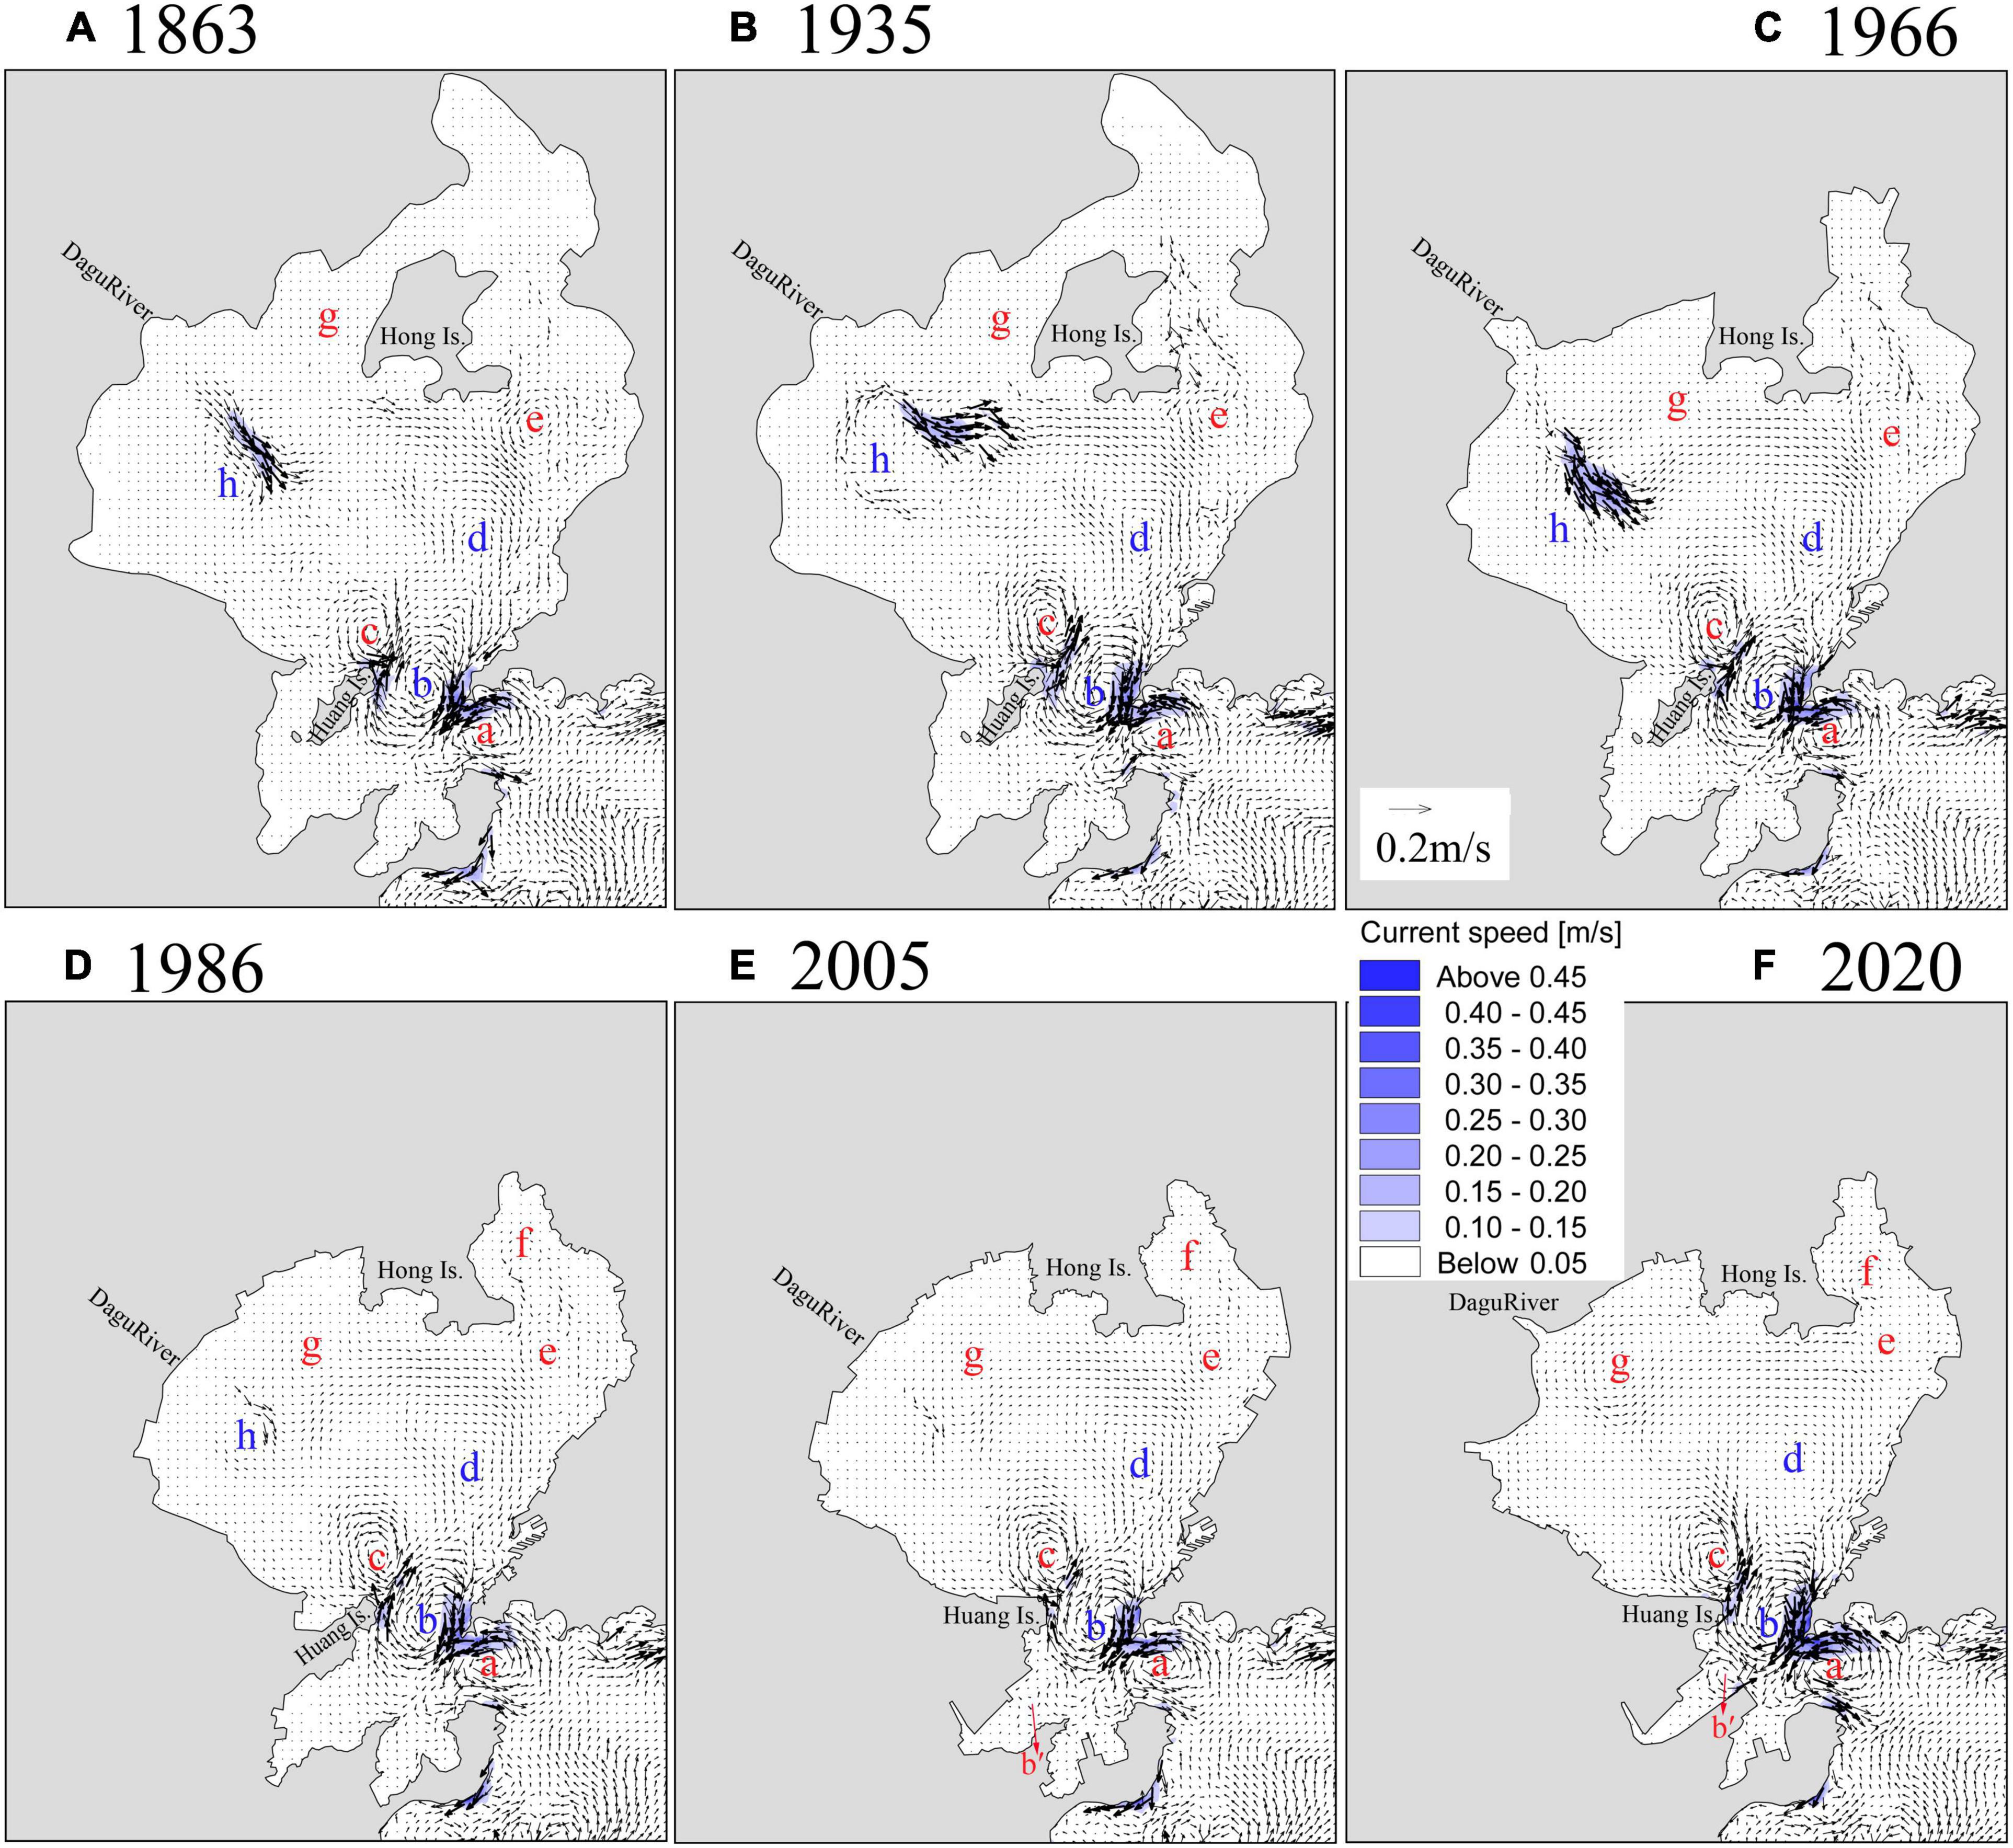
Figure 8. Distributions of residual currents in (A) 1863 (B) 1935 (C) 1966 (D) 1986 (E) 2005 (F) 2020.
Circulation pattern of residual current in JZB also varied due to the change of coastline and bathymetry. Residual currents eddy a was basically stable over the 150 years, but became a bit stronger in 2020, which is mainly related to the smaller cross-sectional area near the bay entrance due to large land reclamation in the southwest of JZB during 2005–2020. The clockwise residual current eddy b had been basically stable, a small counterclockwise residual current eddy b’ was formed at the southwest of b since 2005 (Figures 8E,F), mainly due to great coastline changes in the southwest of JZB. Increased reclamation projects on the north side of Huang Island had gradually narrowed the scope of counterclockwise residual current eddy c. The clockwise residual current eddy d tended to move westward and its intensity became weaker over time, which was probably related to the position change of Cangkou Channel and reclamation seaward of east coastline. The counterclockwise residual current eddy e barely changed before 1986, but its scope decreased and intensity became weaker and weaker thereafter due to large land reclamation in the northeast of JZB.
The residual current was very weak in the northeast of JZB before 1935 because of large areas of tidal flats. Since 1966, a counterclockwise residual current eddy f formed in the northeast of JZB (Figure 8C). The counterclockwise residual current eddy g between Dagu estuary and Hong Island tends to move to the southwest along with land reclamation, while the counterclockwise residual current eddy h became weaker and weaker, and finally disappeared in 2005.
Overall, most residual current eddies became weaker and smaller with geometry change of JZB. Some local residual current eddies disappeared while new eddies appeared at the places with the greatest coastline change. Change of residual flow field will directly affect the water exchange and transport of pollutants in JZB.
Water-Exchange Capacity Evolution Due to Reclamation
The coastline changed a lot due to land reclamation over the last 150 years as discussed in section “Coastline and Tidal Prism Change of Jiaozhou Bay,” which leads to some differences in grid resolution, especially near the coastline change area. According to the sensitivity analysis of horizontal diffusion coefficient conducted by Yuan et al. (2021), the horizontal diffusion coefficient Dh in Equation 4 is set at a constant of 3 m2/s, in order to eliminate the effects of grid resolution on the residence time between different scenarios. Thus, the differences in the residence time were affected only by reclamation.
Spatial distribution of residence time in each scenario shown in Figure 9 indicated that the residence time increased northward from the bay entrance in general, with the smallest in the southern bay entrance (less than 5 days) and largest in the northeast (130–160 days).
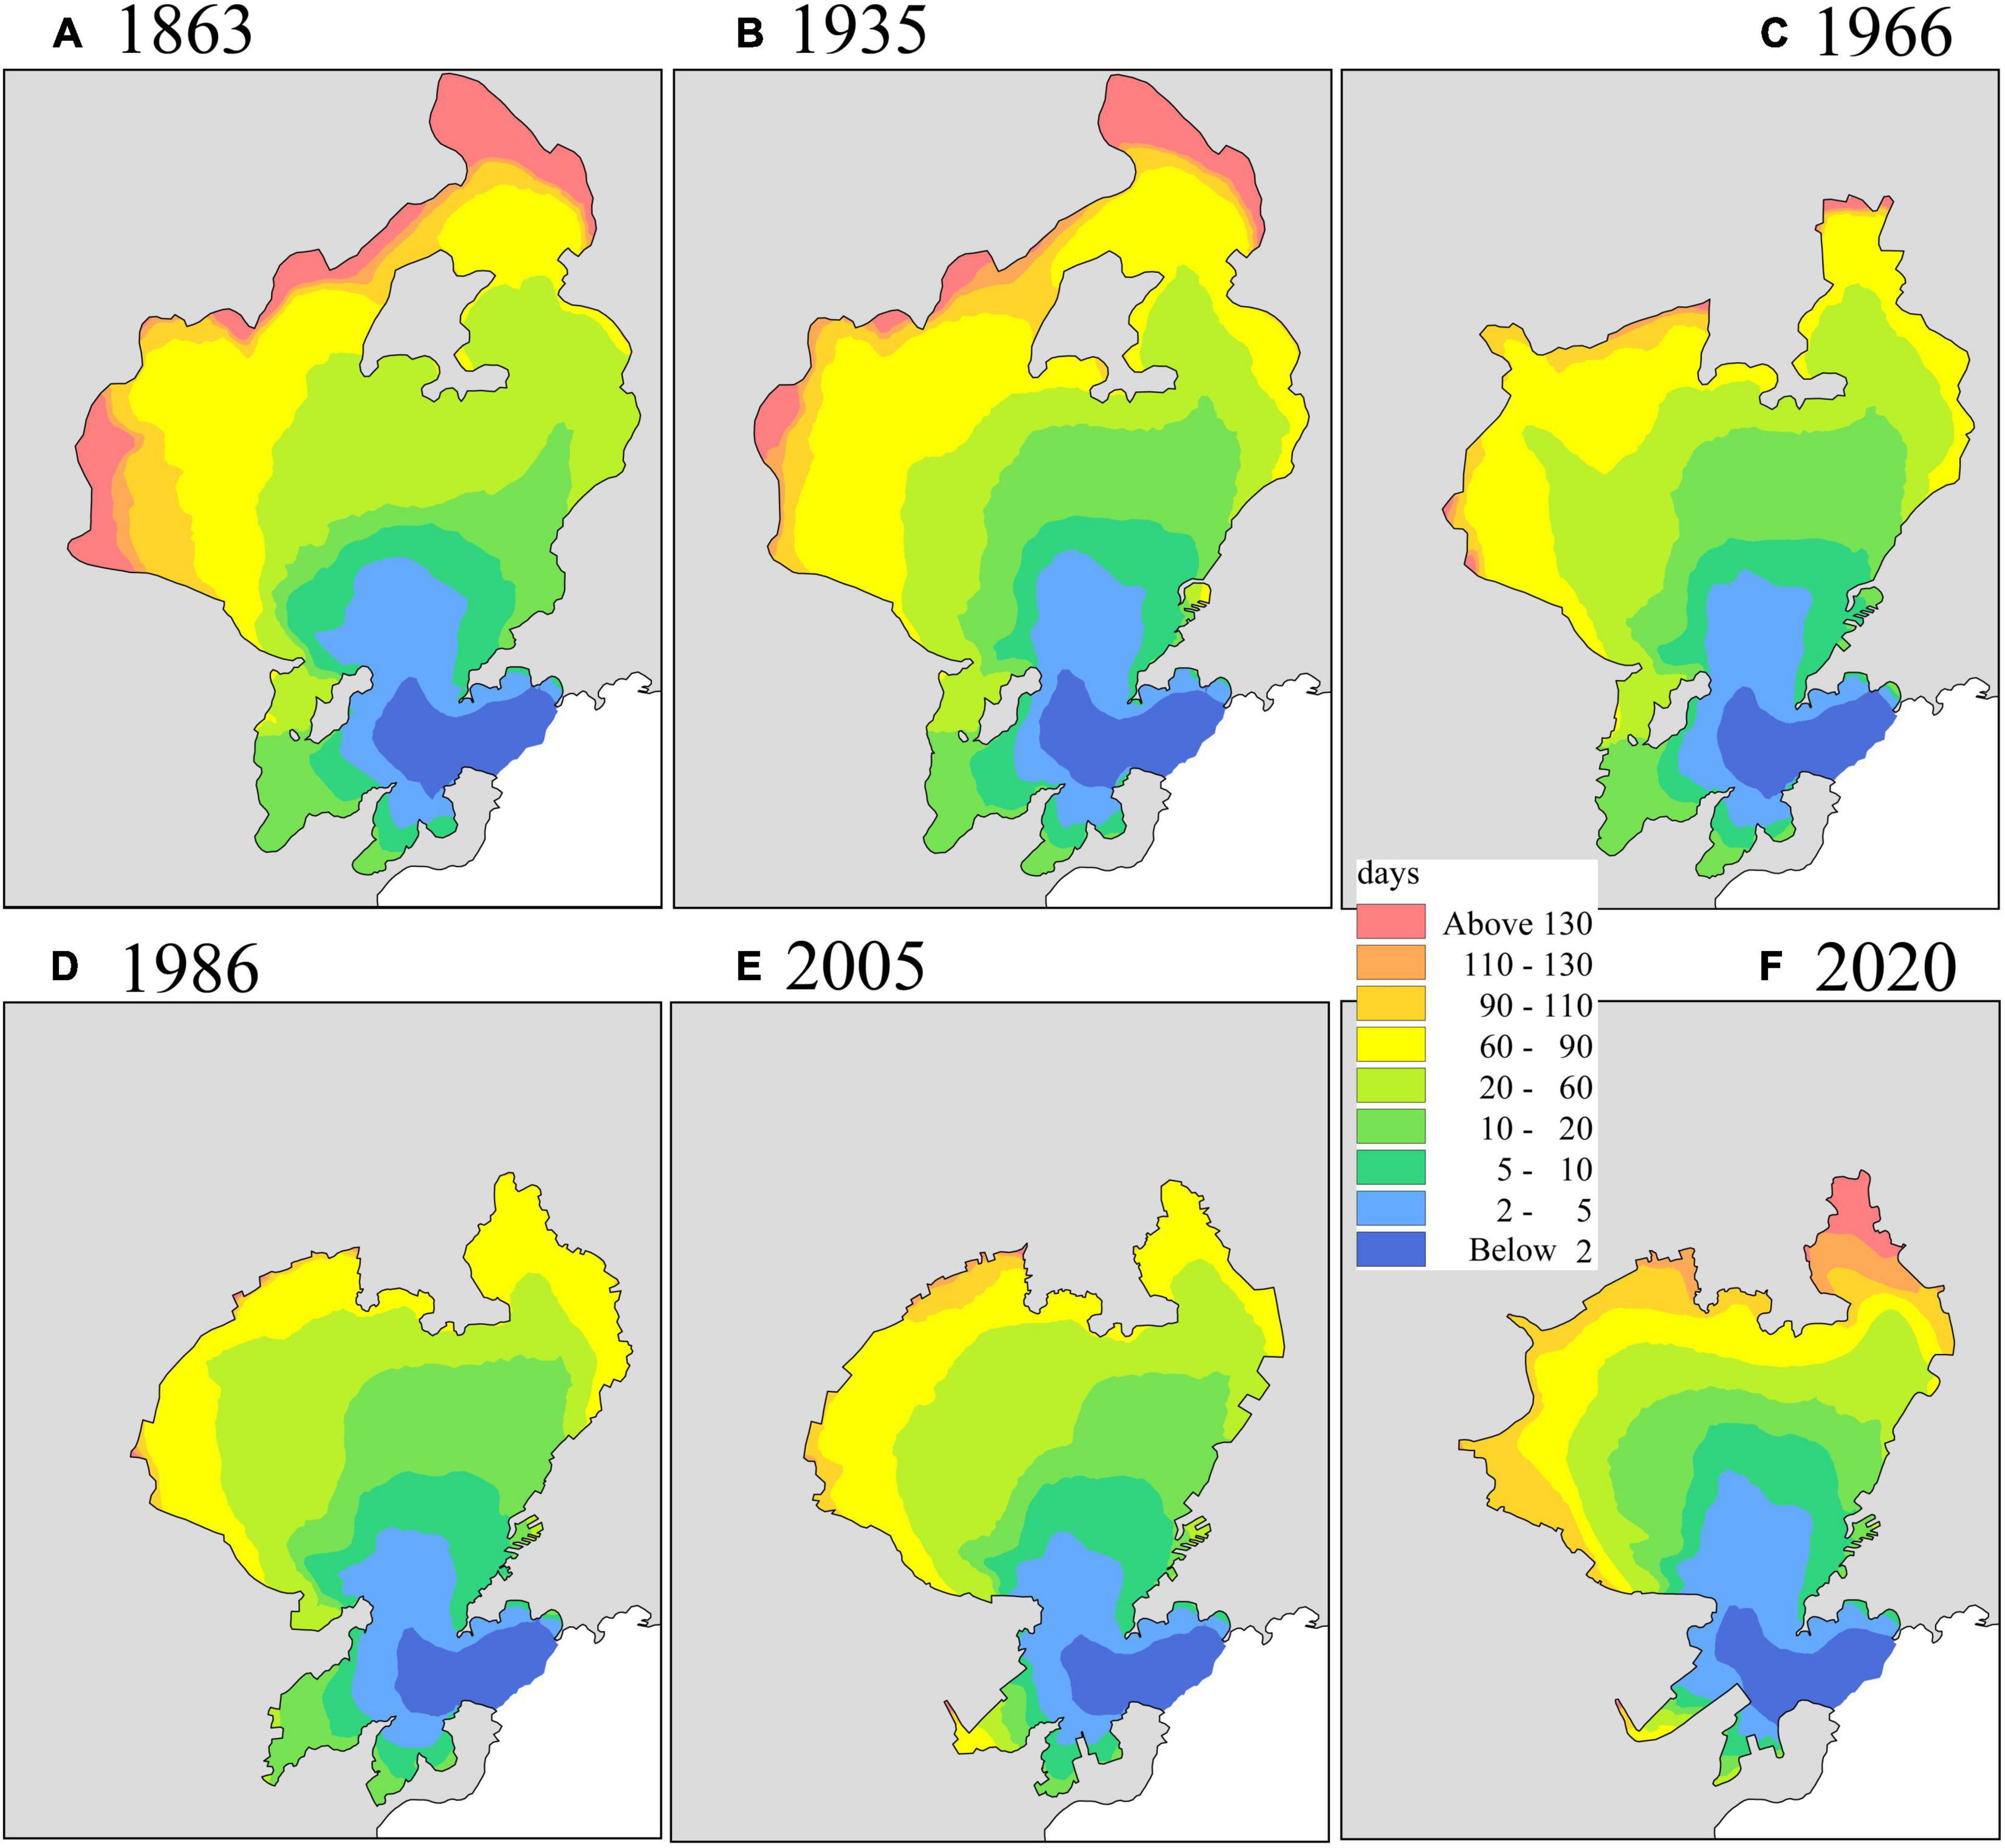
Figure 9. Spatial distribution of residence time in (A) 1863 (B) 1935 (C) 1966 (D) 1986 (E) 2005 (F) 2020.
Distribution of residence time in JZB is mainly controlled by three factors: the distance to the bay entrance, the pattern of the tidal current field, and size of the inter-tidal flat. The southern bay entrance is the only channel connecting JZB and the open water area of Yellow Sea. Therefore, the water near the bay entrance is preferentially diluted by the open sea water, which makes the water exchange time lower in the southern bay entrance and higher in the north bay head. In addition, the water near the bay entrance easily exchanged with the open sea water due to strong eddies of residual current of a and b as shown in Figure 8. The gradient of residence time nearby the north of Huang Island is relatively large, mainly due to the existence of a counterclockwise residual current eddy c in this area, making the tracers entering this eddy difficult to move outside the bay. Most of the tracers in the northwest of JZB are transported southeastward through the residual current eddy d, then southward along the east coast of JZB, and finally transported outside the bay by the two strong eddies of residual current a and b. The northeast of JZB is mainly controlled by the counter-clockwise eddy of residual current e, which makes it very difficult for the tracers to be transported to the open sea. Thus, the residence time in the northeast is the largest.
Most of the tidal flats, located at the northern bay head and the west of Huang Island, were far from the bay entrance, resulting in longer exchange time. In addition, the tidal current on the tidal flats is very weak, making it especially difficult for the tracer to exchange with the nearby waters. Thus, the residence time in tidal flats is relatively large and area of tidal flats also affects the basin residence time of JZB.
Basin residence time, corresponding to the TM of 37% calculated by Equation 6, was shown in Figure 10. Basin residence time slightly decreased during 1863–1935, because the area of tidal flats slightly decreased and the residual current stayed the same. Basin residence time then increased from 15.5 days (1935) to 17.6 days (2020), which indicated that the basin water-exchange capacity deteriorated significantly since 1935. The increased rate of basin residence time was smaller since 2005, because the land reclamation was on a smaller scale.
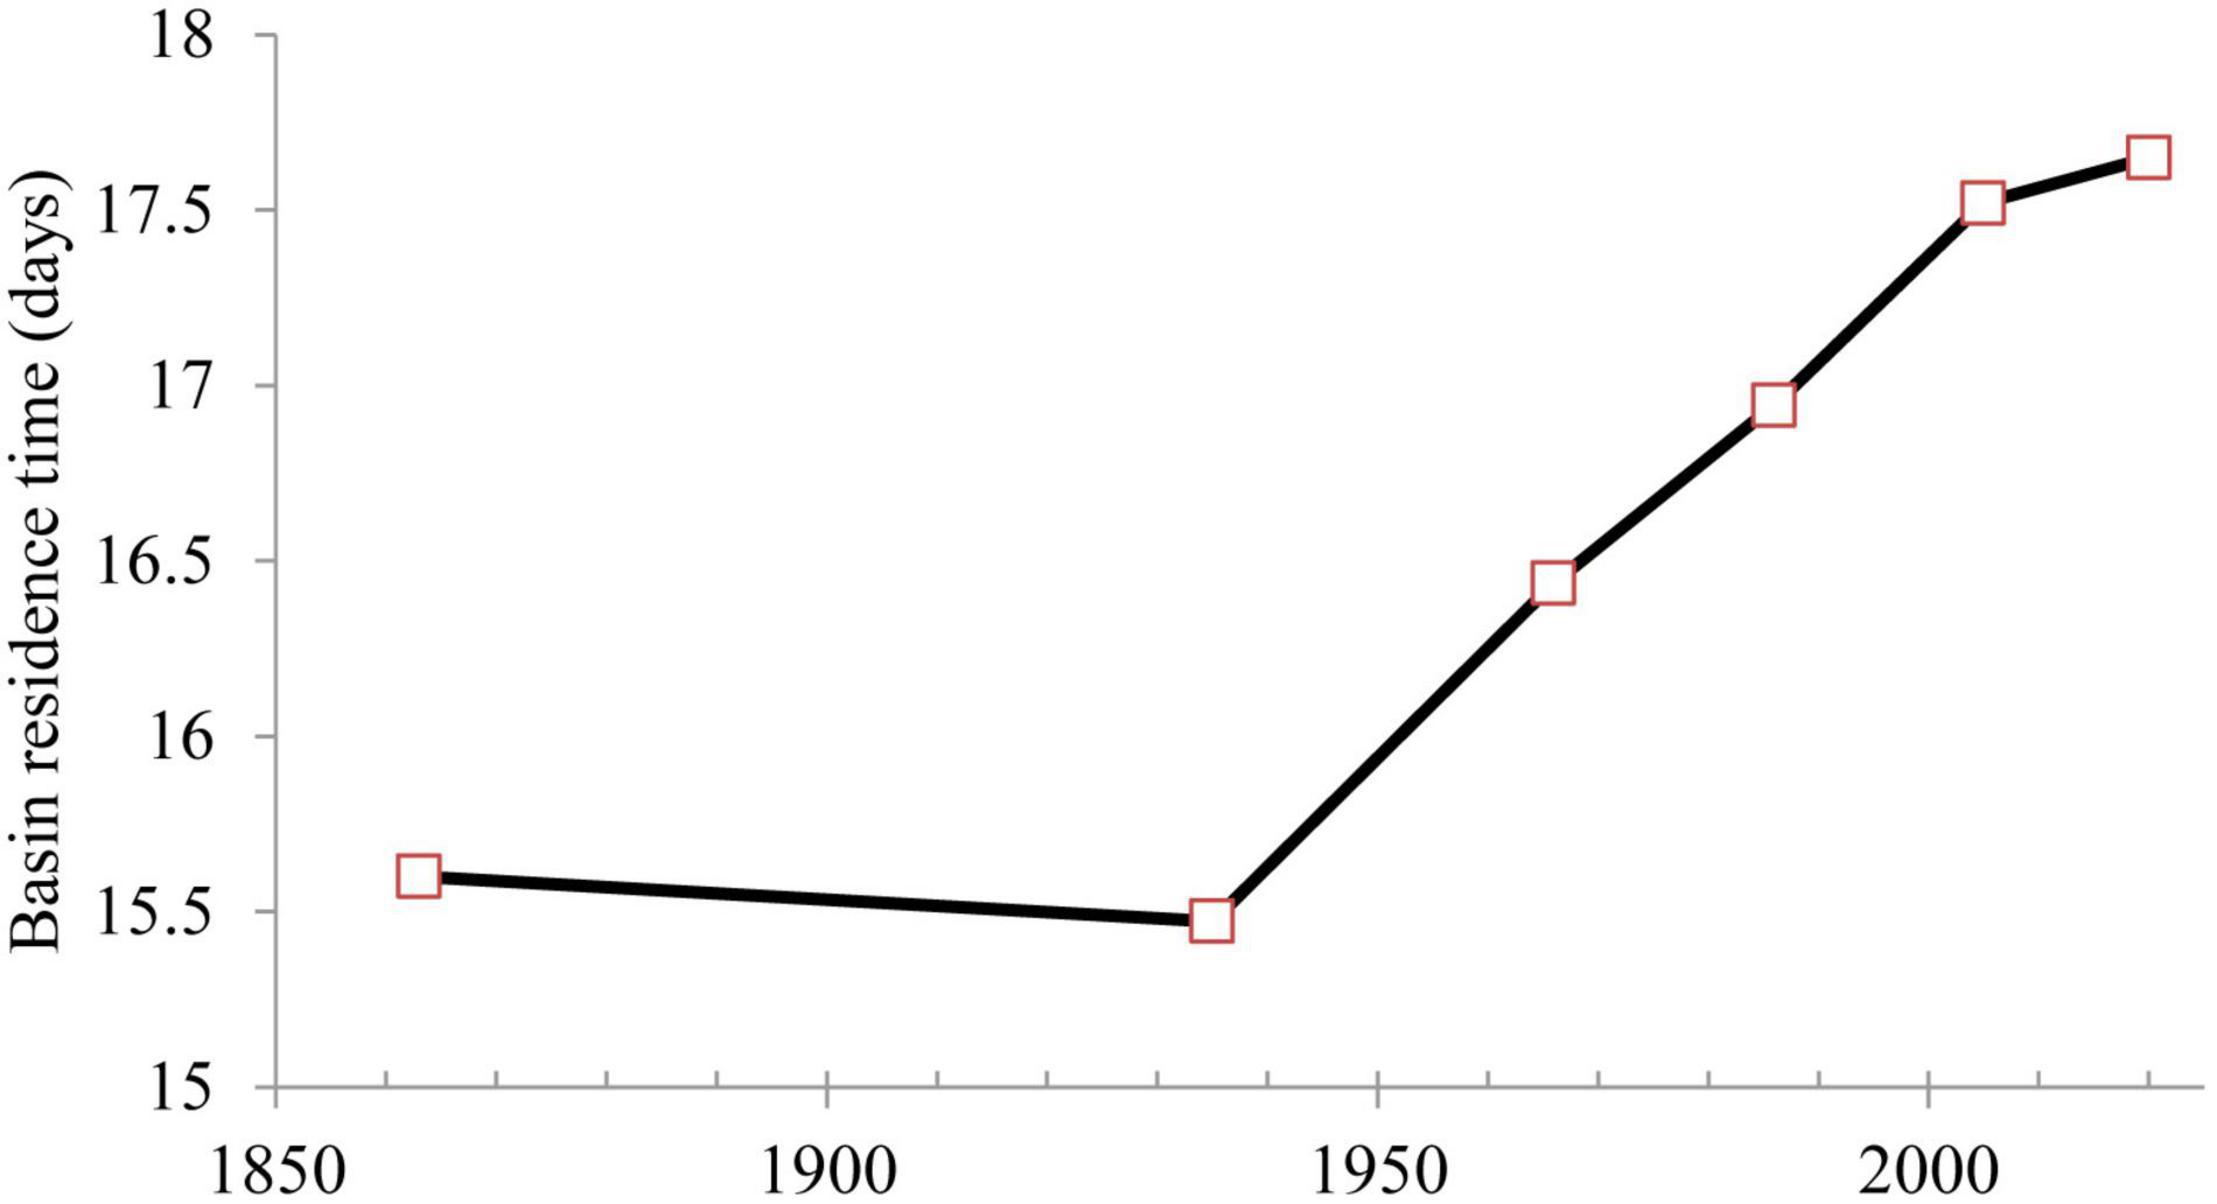
Figure 10. Time series of basin residence time of Jiaozhou Bay.
Pollutant Transport in Jiaozhou Bay
Along with the quick economic development and population growth of Qingdao, the wastewater discharge increased significantly from 147 million tons per year in 1987 to 633 million tons in 2019 (Qingdao Municipal Statistics Bureau, 2020). In addition, with large areas of land reclamation, the ecosystem was deteriorating. JZB is now a eutrophic ecosystem with high nitrogen and phosphorus concentrations, resulting in both the recession of marine resources and the environmental carrying capacity (Zhang et al., 2017). Currently, the main pollutants are dissolved inorganic nitrogen (DIN), phosphorus, and petroleum pollutants. The concentration of DIN has increased considerably and is regarded as the dominant pollutant. According to field measurements by Qingdao Environment Monitoring Centre, the average concentration of JZB is 286 μg/L in 2014, corresponding to second grade of the Chinese national seawater quality standard. The water quality in the northeast of JZB is even worse than the fourth grade. Therefore, the DIN was chosen as a pollutant indicator to investigate the effect of long-term land reclamation on the pollutant transport in this section. The DIN discharge measured in 2007 at nine sewage outlets and rivers in JZB was set in each year (Yuan et al., 2016). Positions of sources were adjusted according to the coastline evolution. All the scenarios have the same initial condition and boundary forcing.
The spatial distribution of spring-neap tidal averaged DIN in each year is presented in Figure 11. The area of seawater with concentrations of DIN larger than 5 μg/L, which can reflect the diffusion range of DIN from the discharge sources, decreased and the concentration gradient became larger from 1986 to 2020, which indicated worse water exchange after intense human intervention of JZB. The relatively large offshore residual current near the Dagu River estuary shown in Figures 8A–C favored the pollutant spreading to offshore area. However, this residual current became very weak since 1986 (Figure 8D), so the spread area narrowed and the contour lines of DIN concentration were becoming almost parallel to the coastlines. Similarly, situations happened in waters near Yang River estuary, the Lianwan sewage, and the eastern bay.
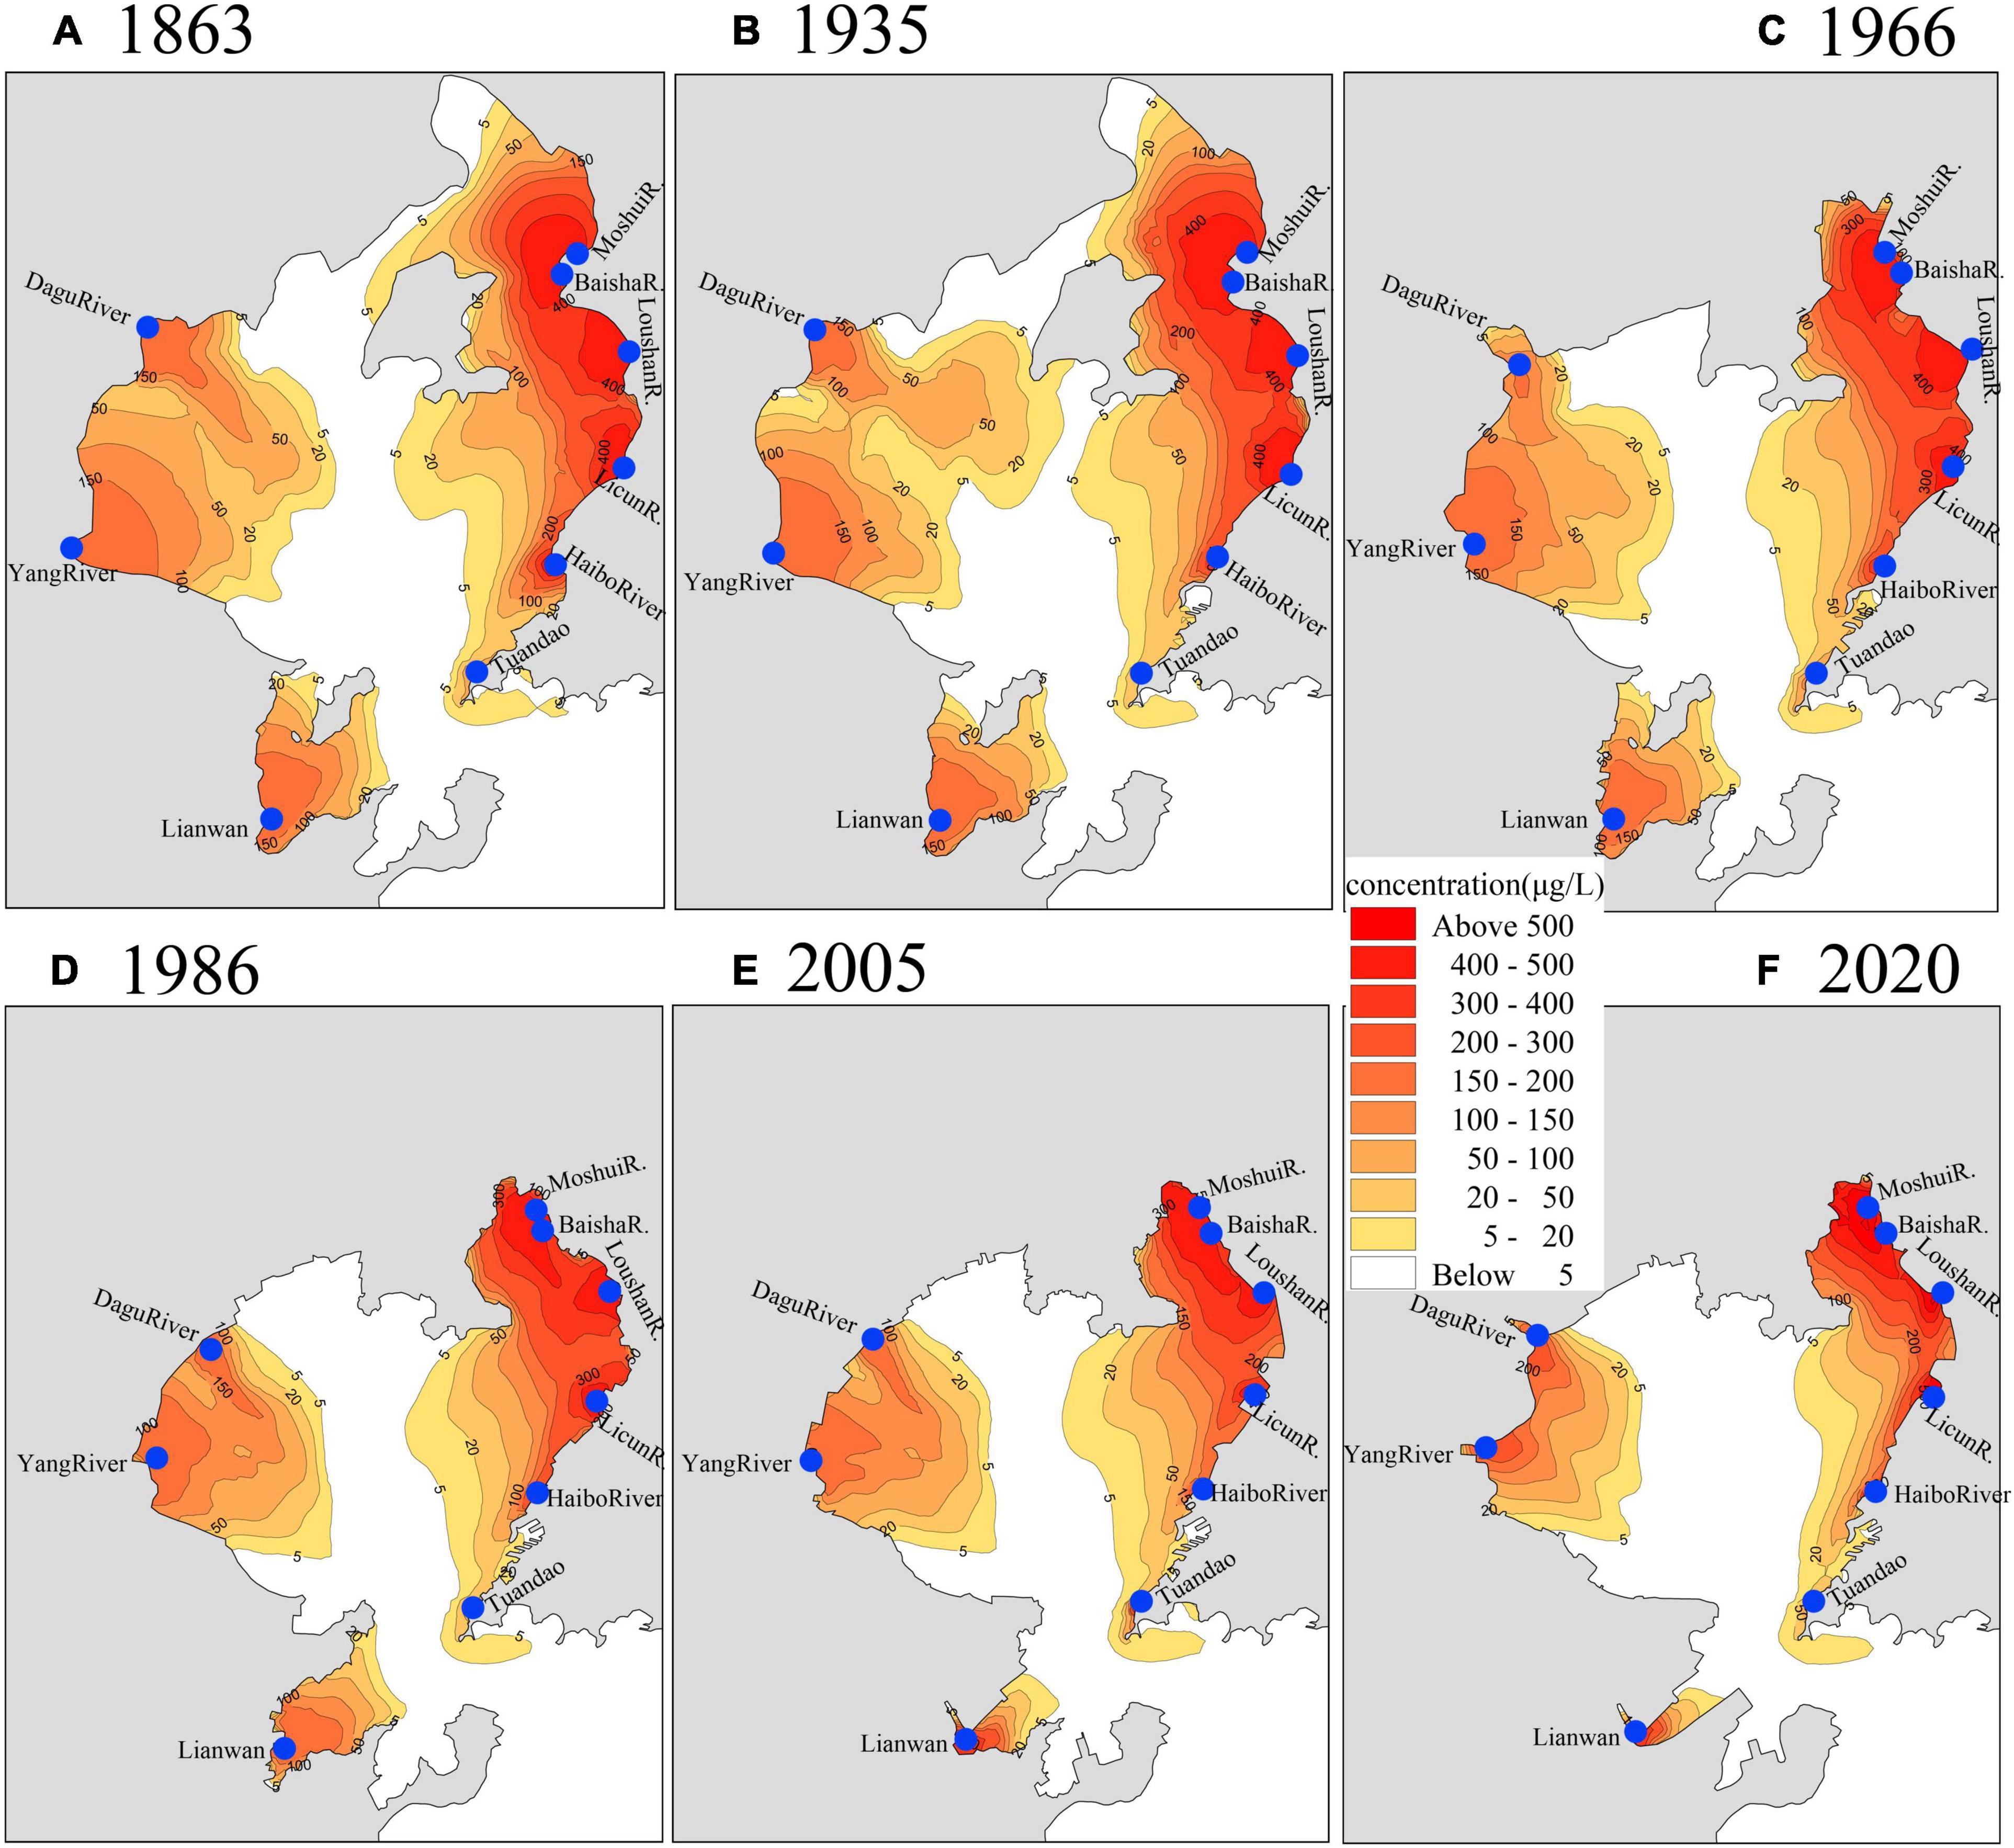
Figure 11. Spring-neap tidal averaged dissolved inorganic nitrogen concentration in (A) 1863 (B) 1935 (C) 1966 (D) 1986 (E) 2005 (F) 2020.
According to the Chinese national seawater quality standard, seawaters with concentrations of DIN less than 200, 300, 400, and 500 μg/L are classified as the first, second, third, and fourth grade respectively, where the fourth grade is regarded as poor quality. Thus, seawater with DIN concentrations larger than 500 μg/L represent serious deterioration of seawater quality and urgently needs to be treated and improved. The water area with DIN concentrations larger than 500 μg/L increased along with intense land reclamation, especially in the northeastern area of JZB. Decision-makers in the local government should pay more attention to improving the water quality of this area.
Conclusion
The environment evolution of JZB from 1863 to 2020 was comprehensively investigated in this paper based on historical charts, remote sensing images, and numerical model. JZB’s sea area decreased sharply by 42% (238.7 km2) from 1863 to 2020, and the prism of JZB decreased by 21% (0.292 km3), while the area of tidal flats shrank significantly by 77% (197.9 km2), most of which was occupied by salt ponds, aquaculture area, reclamation, and harbor construction. The largest decrease rate happened during 1935–1986, coherent with the most intensive land reclamation.
Tidal residual current was generally weaker along with decreasing prism of JZB. Some local residual current eddies disappeared while new eddies appeared at the places with the greatest coastline change. The evolution of pattern of tidal residual current is less favorable for the water-exchange and pollutant transport, especially for the northeast and west of JZB. Thus, the local residence time also increased sharply in the northeast of JZB from 130 to 160 days. The basin residence time increased from 15.5 days in 1935 to 17.6 days in 2020 due to weaker residual tidal current and smaller tidal prism. The evolution of DIN concentration also reflected deteriorated water quality and ecosystems in the bay. The comprehensive research of JZB can fill the knowledge gaps between science and coast zone management. The method to study long-term evolution of JZB can be used to study other similar semi-closed bays.
Data Availability Statement
The raw data supporting the conclusions of this article will be made available by the authors, without undue reservation.
Author Contributions
CX ran the numerical model, analyzed the results, and wrote the manuscript draft. KM digitalized all the historical charts. CZ designed the numerical experiments and revised the manuscript. PW collected charts of JZB and revised the manuscript. XY was in charge of remote sensing image processing. All authors contributed to the article and approved the submitted version.
Funding
This work was funded by the National Natural Science Foundation of China (Grant No. 51620105005), the Fundamental Research Funds for the Central Universities (Grant No. B210202031), and the National Natural Science Foundation of China (Grant No. 41606042).
Conflict of Interest
The authors declare that the research was conducted in the absence of any commercial or financial relationships that could be construed as a potential conflict of interest.
Publisher’s Note
All claims expressed in this article are solely those of the authors and do not necessarily represent those of their affiliated organizations, or those of the publisher, the editors and the reviewers. Any product that may be evaluated in this article, or claim that may be made by its manufacturer, is not guaranteed or endorsed by the publisher.
References
Chen, B., Zhang, Y., Liu, J., and Kong, X. H. (2012). Tidal current dynamic characteristic and its relation with suspended sediment concentration in Jiaozhou Bay. Adv. Mar. Sci. 30, 24–35. doi: 10.1007/s11783-011-0280-z
Danish Hydraulic Institute (2012). MIKE 21 & MIKE 3 Flow Model FM. Hydrodynamic and Transport Module Scientific Documentation. Available online at: https://manuals.mikepoweredbydhi.help/2017/Coast_and_Sea/MIKE_321_FM_Scientific_Doc.pdf
Ferrarin, C., Ghezzo, M., Umgiesser, G., Tagliapietra, D., Camatti, E., Zaggia, L., et al. (2013). Assessing hydrological effects of human interventions on coastal systems: numerical applications to the Venice Lagoon. Hydrol. Earth Syst. Sci. 17, 1733–1748. doi: 10.5194/hess-17-1733-2013
Furukawa, K., and Okada, T. (2006). “Tokyo bay: its environmental status — past, present, and future,” in The Environment in Asia Pacific Harbours, ed. E. Wolanski (Dordrecht: Springer).
Grifoll, M., Del Campo, A., Espino, M., Mader, J., González, M., and Borja, Á (2013). Water renewal and risk assessment of water pollution in semi-enclosed domains: application to Bilbao Harbour (Bay of Biscay). J. Mar. Syst. 109–110, S241–S251. doi: 10.1016/j.jmarsys.2011.07.010
Jia, H., Shen, Y., Su, M., and Yu, C. (2018). Numerical simulation of hydrodynamic and water quality effects of shoreline changes in Bohai Bay. Front. Earth Sci. 12:625–639. doi: 10.1007/s11707-018-0688-x
Leonardi, N., Kolker, A. S., and Fagherazzi, S. (2015). Interplay between river discharge and tides in a delta distributary. Adv. Water Resour. 80, 69–78. doi: 10.1016/j.advwatres.2015.03.005
Li, P., Li, G., Qiao, L., Chen, X., Shi, J., Gao, F., et al. (2014). Modeling the tidal dynamic changes induced by the bridge in Jiaozhou Bay, Qingdao, China. Cont. Shelf Res. 84, 43–53. doi: 10.1016/j.csr.2014.05.006
Okada, T., Nakayama, K., Takao, T., and Furukawa, K. (2011). Influence of freshwater input and bay reclamation on long-term changes in seawater residence times in Tokyo bay, Japan. Hydrol. Process. 25, 2694–2702. doi: 10.1002/hyp.8010
Patgaonkar, R. S., Vethamony, P., Lokesh, K. S., and Babu, M. T. (2012). Residence time of pollutants discharged in the Gulf of Kachchh, northwestern Arabian Sea. Mar. Pollut. Bull. 64, 1659–1666. doi: 10.1016/j.marpolbul.2012.05.033
Plus, M., Dumas, F., Stanisière, J. Y., and Maurer, D. (2009). Hydrodynamic characterization of the Arcachon Bay, using model-derived descriptors. Cont. Shelf Res. 29, 1008–1013. doi: 10.1016/j.csr.2008.12.016
Qiao, L., Liang, S., Song, D., Wu, W., and Wang, X. H. (2019). “Jiaozhou Bay,” in Sediment Dynamics of Chinese Muddy Coasts and Estuaries, ed. X. H. Wang (Amsterdam: Elsevier), 5–23.
Qingdao Municipal Statistics Bureau (2020). Qingdao Statistical Yearbook 2020. Beijing: China Statistics Press, 414.
Rodríguez, P. A., Carbajal, N., and Rodríguez, J. H. G. (2017). Lagrangian trajectories, residual currents and rectification process in the Northern Gulf of California. Estuar. Coast. Shelf Sci. 194, 263–275. doi: 10.1016/j.ecss.2017.06.019
Shi, J. H., Li, G., and Wang, P. (2011). Anthropogenic influences on the tidal prism and water exchanges in Jiaozhou Bay, Qingdao, China. J. Coast. Res. 27, 57–72. doi: 10.2112/JCOASTRES-D-09-00011.1
Sun, Y.-J., Jalón-Rojas, I., Wang, X. H., and Jiang, D. (2018). Coastal upwelling by wind-driven forcing in Jervis Bay, New South Wales: a numerical study for 2011. Estuar. Coast. Shelf Sci. 206, 101–115. doi: 10.1016/j.ecss.2017.11.022
Yuan, Y., Jalón-Rojas, I., and Wang, X. H. (2021). Response of water-exchange capacity to human interventions in Jiaozhou Bay, China. Estuar. Coast. Shelf Sci. 249:107088. doi: 10.1016/j.ecss.2020.107088
Yuan, Y., Song, D., Wu, W., Liang, S., Wang, Y., and Ren, Z. (2016). The impact of anthropogenic activities on marine environment in Jiaozhou Bay, Qingdao, China: a review and a case study. Reg. Stud. Mar. Sci. 8, 287–296. doi: 10.1016/j.rsma.2016.01.004
Zarzuelo, C., Díez-Minguito, M., Ortega-Sánchez, M., López-Ruiz, A., and Losada, M. Á (2015). Hydrodynamics response to planned human interventions in a highly altered embayment: the example of the Bay of Cádiz (Spain). Estuar. Coast. Shelf Sci. 167, 75–85. doi: 10.1016/j.ecss.2015.07.010
Zhang, P., Su, Y., Liang, S., Li, K., Li, Y., and Wang, X. (2017). Assessment of long-term water quality variation affected by high-intensity land-based inputs and land reclamation in Jiaozhou Bay, China. Ecol. Indic. 75, 210–219. doi: 10.1016/j.ecolind.2016.12.035
Zhao, K., Qiao, L., Shi, J., He, S., Li, G., and Yin, P. (2015). Evolution of sedimentary dynamic environment in the western Jiaozhou Bay, Qingdao, China in the last 30 years. Estuar. Coast. Shelf Sci. 163, 244–253. doi: 10.1016/j.ecss.2014.12.011
Keywords: Jiaozhou Bay, coastline change, water-exchange, pollutant transport, land reclamation, long-term evolution
Citation: Xu C, Zhou C, Ma K, Wang P and Yue X (2021) Response of Water Environment to Land Reclamation in Jiaozhou Bay, China Over the Last 150 Years. Front. Mar. Sci. 8:750288. doi: 10.3389/fmars.2021.750288
Received: 30 July 2021; Accepted: 24 November 2021;
Published: 20 December 2021.
Edited by:
Zhan Hu, Sun Yat-sen University, ChinaCopyright © 2021 Xu, Zhou, Ma, Wang and Yue. This is an open-access article distributed under the terms of the Creative Commons Attribution License (CC BY). The use, distribution or reproduction in other forums is permitted, provided the original author(s) and the copyright owner(s) are credited and that the original publication in this journal is cited, in accordance with accepted academic practice. No use, distribution or reproduction is permitted which does not comply with these terms.
*Correspondence: Chunyan Zhou, Y3l6aG91QGhodS5lZHUuY24=