 Ying Chen
 Haiyi Shi
 Hui Zhao
- 1College of Chemistry and Environmental Science, Guangdong Ocean University, Zhanjiang, China
- 2Southern Marine Science and Engineering Guangdong Laboratory, Zhuhai, China
During summer, phytoplankton blooms occur frequently off the southeast Vietnam coast in the western South China Sea (WSCS). Using multi-source remote sensing data, such as sea surface temperature (SST), sea surface wind (SSW), aerosol optical thickness (AOT), sea level anomalies (SLA), and chlorophyll-a (Chl-a) data from 1998 to 2020 and in situ observations of analyzed data, we report the patterns of spatial variation of summer phytoplankton blooms in this region. The partial correlation and multiple stepwise linear regression analyses reveal that Ekman transport (ET) and Ekman pumping velocity (EPV) exert a greater impact on the summer phytoplankton blooms than the other environmental factors, suggesting that the phytoplankton blooms in the region may be mainly triggered by the enhanced nutrients by wind-induced upwelling and vertical mixing. AOT only weakly correlates with Chl-a concentration in the region, probably these prominent abundant nutrients in the region come from upwelling and convective-overturn. A northeastward jet causes the distribution of high Chl-a in the WSCS to be plume-shaped. A new finding in this study is that the northward current in this area may cause the northward deviation of phytoplankton blooms from the areas of upwelling.
Introduction
The South China Sea (SCS) (Figure 1A) is a large, semi-enclosed tropical marginal sea, the depth of which can exceed 5,500 m (Qiu et al., 2011; Zhao and Zhang, 2014). The influence of East Asian monsoonal flows renders the winds primarily southwesterly in summer and northeasterly in winter (Shaw and Chao, 1994; Shaw et al., 1999; Qu, 2000; Yang et al., 2002). Seawater is essentially oligotrophic, with plenty of light in upper layers but nutrients are limited throughout the year (Gong et al., 1992; Ning et al., 2004). The upwelling systems off the west coast of the SCS, where deeper nutrients are uplifted into the shallow layers, prove to be key locations of phytoplankton growth (Figure 1B) (Chen et al., 2006; Piedras and Odebrecht, 2012; Behrenfeld and Boss, 2014).
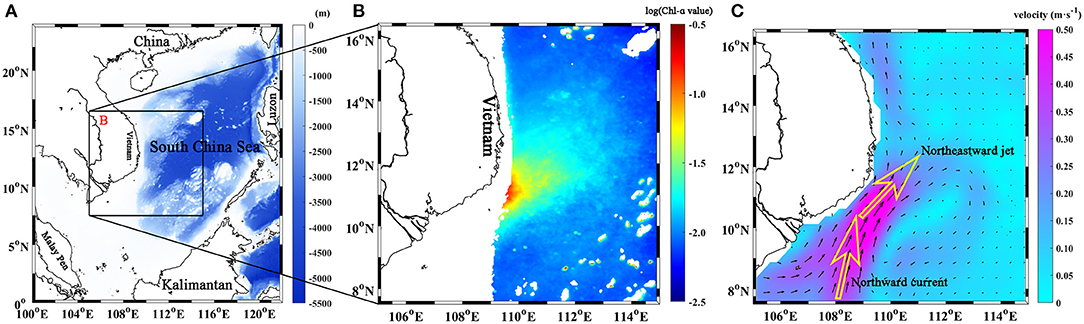
Figure 1. (A) Depth map of the South China Sea (SCS) and the study region of box A; (B) the summer (June–September) climatological chlorophyll-a (Chl-a) concentration (1998–2020) in the study region (in this study, we ignore the region where the depth is shallower than 200 m to remove the influence of coastal water. The Chl-a concentration is processed by logarithm with a base of e = 2.71828); (C) The geostrophic flow velocity northwest of SCS. The arrow indicates the direction and size of the geostrophic flow. Box B (7.5–16.5°N, 105–115°E) in the (A), is the region of (B).
In summer, the prevailing southwestern monsoon winds induce coastal upwelling and drive a northeastward jet (Figure 1C) of water along the Vietnamese coast (Lin et al., 2009). Coastal upwelling off Vietnam occurs from about 109–114°E, 7.5–17.5°N (Chai et al., 2002); this upwelling was first discovered by Wyrtki (1961), with sea surface temperature (SST) dropping by more than 1°C in June and July. Satellite observations reveal chlorophyll-a (Chl-a) concentrations in the Vietnam upwelling area generally to be higher than in the non-upwelling areas (Zhao et al., 2005a).
A negative correlation between Chl-a concentration and SST was also proposed by Lin and Zhao (2012). The upwelling systems bring nutrient-rich, cooler subsurface water into upper layers, leading to an increased concentration of Chl-a. The previous studies revealed that a northeastward jet at the inter-gyre boundary in summer (Kuo et al., 2000; Fang et al., 2002; Xie et al., 2003; Ma et al., 2012; Shao et al., 2015) from 110–113°E, 12°N with surface velocities > 0.5 m·s−1 (Lin et al., 2009), causing advection of coastal upwelling water and enhancing offshore Chl-a concentrations (Liang et al., 2018). The interaction between divergence/convergence in cyclonic/anticyclonic eddies with this northeastward jet results in a high chlorophyll belt along the eddy edge (Liang et al., 2018).
One of the most significant Chl-a variations in the SCS occurs in the western South China Sea (WSCS) (Yan and Wang, 2011). The study aimed to investigate the distribution of summer high Chl-a concentrations in the WSCS and examine how phytoplankton blooms correlate with environmental variables [SST, sea surface wind (SSW), aerosol optical thickness (AOT), sea level anomalies (SLA), Ekman transport (ET), and Ekman pumping velocity (EPV)] from 1998 to 2020. This analysis improves the understanding of regional ecosystem responses to climate change.
Materials and Methods
Study Area and Data
The WSCS study region is located off the southeast Vietnam coast (Figure 1A). Southwesterly winds first appear in this study in May, extend throughout the entire SCS in July and August, and persist until late September (Shaw and Chao, 1994). The stirring effect of strong summer winds, low water temperatures, and high nutrients caused by the coastal upwelling provided favorable conditions for Chl-a, high concentrations of which first appear off southeast Vietnam in early June and persisted for about 4 months (Kuo et al., 2000; Xie et al., 2003; Tang et al., 2004, 2006; Feng et al., 2019; Shi et al., 2019). The high concentrations occurred in a long, narrow plume along with the strong offshore currents (Chen et al., 2014).
In this study, the months from June–September represented summer to investigate the entire process of plume formation and dissipation. The optical conditions in the study area were complex and affected by the terrestrial input, suspended material, sea–land interactions, sediments, and high phytoplankton primary productivity (Lu et al., 2010; Xing et al., 2019). The regions with water depth shallower than 200 m, where Chl-a is overestimated due to the influence of coastal water with high suspended matter concentration and yellow matter were excluded (Lin and Zhao, 2012; Shen et al., 2020). Time series data for Chl-a and other environmental variables were collated for the region from the box (109–111°E, 11–12.5°N) for Chl-a time series, the box (109–111°E, 11–14°N) as SST time series, 109–111°E, 10–12°N for SSW time series, 109–111°E, 11–12.5°N for AOT time series, 109–113°E, 12–15°N for SLA time series, 109–111°E, 10–11.5°N for ET time series, and the parallelogram with four vertexes (107°E, 11°N; 109.5°E, 12.5°N; 110°E, 11.5°N; and 107.5°E, 10°N) for EPV time series, where the variations of them were more significant, respectively.
Data
The data of Chl-a and AOT of T865 derived from four different sensors of Sea WiFS, MODIS, MERIS, and VIIRS with GSM Model (Maritorena and Siegel, 2005; Maritorena et al., 2010) are generated from GlobColour database provided by HERMES. The merged daily/weekly/monthly L3 products of Chl-a and monthly AOT with a spatial resolution of 0.04° × 0.04° are obtained for the period from 1998 to 2020. The influence of dust indexed by AOT is investigated through the analysis of the relation between the aerosol depth (i.e., AOT) and the Chl-a in the WSCS.
The data of SST and SSW are obtained from the European Centre for Medium-Range Weather Forecasts (ECMWF) at 0.25° × 0.25° spatial resolution. The monthly products are used from 1998 to 2020. In addition, EPV and ET in the study region are investigated to clarify the change of Chl-a, and the possible roles of wind fields play in the WSCS.
The data of SLA and geostrophic velocity both with 0.25° × 0.25° spatial resolution are available from AVISO (the Archiving, Validation and Interpretation of Satellite Oceanographic dataset). The daily multi-mission merged products are obtained from 1998 to 2020.
The World Ocean Atlas 2018 (WOA18) is obtained from the Ocean Climate Laboratory of the National Oceanographic Data Center. The spatial resolution of monthly nitrate is 1° × 1°. Considering the fact that nitrate limitation occurs in the SCS, the nitrate data are used as an indicator of available nutrients in the study.
In situ data, such as Chl-a, temperature, and salinity that were derived from the work of Wang et al. (2016), during the period from September 2 to September 9, 2007, were used in the study. The detailed data information can be found in Wang et al. (2016).
Methods
ET and EPV
Ekman pumping velocity regulated the intensity of upwelling in coastal regions by wind-driven offshore transport. We used ET and EPV to evaluate the possible vertical transport induced by wind fields and calculated them using the wind stress vector τ (Halpern, 2002).
where ET is the ET (m2·s−1), EPV is the EPV (m·s−1) induced by wind stress curls (τ); f is a Coriolis parameter (f = 2ωsinφ); t is a unit tangent vector to the local coastline; ρ and ρair are t seawater (1.025 × 10³ kg·m−3), and air (1.29 × 10³ kg·m−3) densities, respectively; U is wind speed; and CD is the drag coefficient.
Multiple Correlation Analysis
In this study, simple and multiple correlation analyses were used to determine the relative roles of environmental variables on Chl-a. The correlation matrix between variables of x1, x2, ..., xm, y is defined as (Wang et al., 2012a; Zhao et al., 2013):
Correlation coefficients Ry·1, 2, ..., m and the partial correlation coefficients Ryi·1, 2, ..., m between x and y are:
where y is the dependent variable and x1, x2, ..., xm are causative variables. |R| is the determinant of a matrix R, and Ryy, Rii, and Ryi are the algebraic complements of ryy, rii, and ryiin R, respectively. In this study, r is a simple correlation among the variables x1, x2, ..., xm, and y.
Stepwise Regression
Stepwise regression (Jennrich, 1977) is a systematic method that adds variables in a step-by-step manner, on the condition that each passes an F statistic test. After each new variable is added, old variables with F statistics are considered insignificant and will be removed. This process goes through several steps until no new variables can be added or old variables removed.
Results
Distribution of Chl-a Concentration
The monthly data for Chl-a concentrations averaged over 23 years from 1998 to 2020 reveals a plume of high concentration in the WSCS during summer (Figure 2). The high concentrations (about 0.5 mg·m−3) typically appear in early June near the southeast coast of Vietnam, then extend into the open sea in a plume induced by the northeastward jet (Figure 1C), consistent with the previous research (Xie et al., 2003; Tang et al., 2004; Zhao and Tang, 2007); high concentrations persist for about 4 months, peaking in August and dissipating in September.
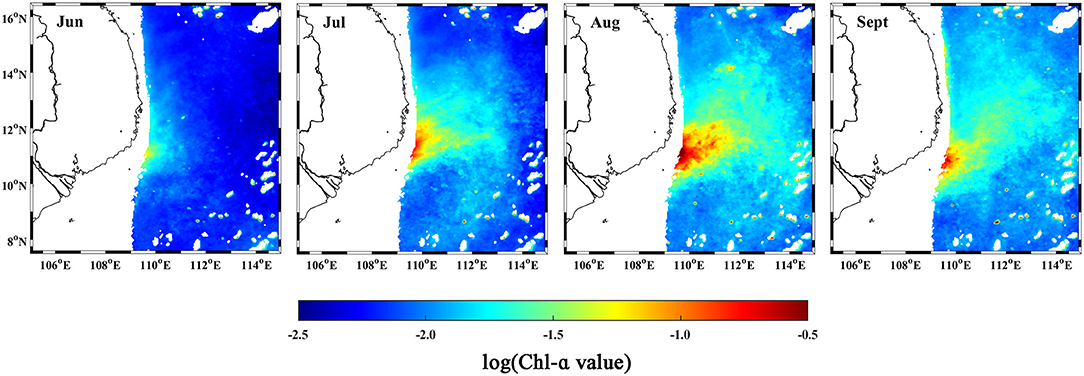
Figure 2. Monthly climatology of Chl-a with a spatial resolution of 0.04° in the period 1998–2020. The Chl-a is processed by logarithm with a base of e = 2.71828.
Satellite Observation of Environmental Variables
Sea Surface Temperature
The annual average SST in the tropical WSCS is relatively high. A strong monsoon wind forms at about 11°N in summer, which may cause considerable sea surface heat loss. The location of a relatively low SST region (<29°C) (Figure 3A) is comparable to that of a region of high Chl-a concentration off southeast Vietnam (Figure 2). During the summer, SST throughout the WSCS is relatively uniform, and except for the low SST in the region of upwelling, no obvious latitudinal temperature gradient is apparent.
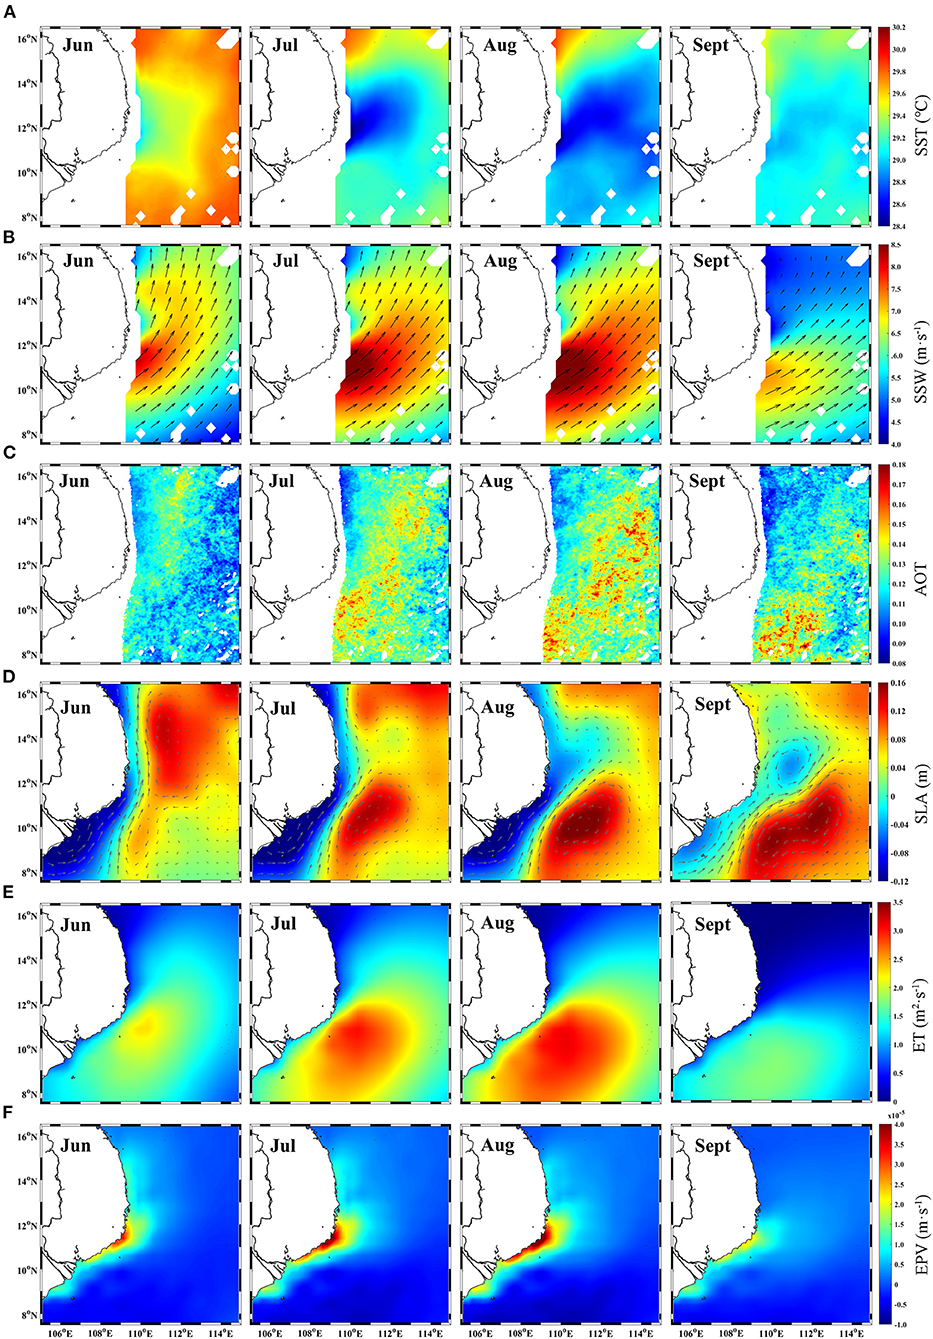
Figure 3. Monthly climatology of (A) sea surface temperature (SST), (B) sea surface wind (SSW), (C) aerosol optical thickness (AOT), (D) sea level anomaly (SLA), (E) Ekman transport (ET), and (F) Ekman pumping velocity (EPV) averaged from 1998 to 2020. The arrows in (B) indicate the direction and size of wind speed. The arrows in (D) indicate the direction and size of the geostrophic flow.
Distribution of Wind and AOT
Mean SSW can exceed 7 m·s−1 during the prevailing southwest monsoons, and speeds of over 8.5 m·s−1 near the southeast coast of Vietnam (Figure 3B); the strongest winds are mainly between 8°N and 12°N. Wind directions from June to August are similar, but wind intensity gradually increases; wind speeds begin to weaken in September. The region with higher wind speeds usually corresponds with higher AOT. Figure 3C depicts variations in monthly mean AOT values throughout the WSCS, with higher values in August (> 0.13) and lower values in June (< 0.11). The high AOT concentrations (Figure 3C) occur far from the southeast coast of Vietnam, suggesting dust precipitation, roughly coinciding with patterns in SSW (Figure 3C).
SLA and Geostrophic Flow
From SLA data (Figure 3D), a general upward trend is apparent near the southeast coast of Vietnam. Sea surface height in the upwelling region is usually lower than in the surrounding area. A large warm eddy occurs above 12°N in June, and a cold eddy occurs between 109.5–113°E and 11–15°N (Figure 3D) from July to September. The cold eddy impacts the warm eddy (i.e., dipole eddies), which is similar to “dividing into two.” The warm eddy moves below 12°N from July to September, and the cold eddy inhibits the northern movement of the warm eddy. The direction of geostrophic flow is similar to the direction in the center of high Chl-a moves in. We speculate that an advection effect caused by these phenomena affects the center of phytoplankton blooms.
Wind-Caused ET and EPV
Compared with June and July, ET off southeastern Vietnam is the strongest in August and the weakest in September (Figure 3E). Strong ET (> 3 m2·s−1) occurs southeast of Vietnam (109–112°E, 8.5–12.5°N) (Figure 3E). The wind-induced EPV patterns (Figure 3F) tend to downwell (<10−5 m·s−1), implied by negative EPV throughout most of the WSCS. However, a strong upwelling tendency from EPV (> 10−5 m·s−1; Figure 3F) is apparent near the southeast coast of Vietnam, similar in location to high Chl-a concentrations (Figure 2). Both the high ET and EPV occur near the southeast coast of Vietnam. While, high ET extends to the southeast, perpendicular to the coast, high EPV occurs off the southeast coast of Vietnam and extends to the northeast.
In situ Observations in the WSCS
Climatological Nitrate
The WOA18 summer mean nitrate concentrations at depths of 0, 20, 30, and 50 m are illustrated in Figure 4. The high nitrates occur over a 2° × 2° area centered around 109°E, 9.5°N, at 50 m depth near the southeast coast of Vietnam but become shallower with a northern progression. Until near the surface, the locations of high nitrate are broadly comparable to the phytoplankton bloom locations (Figure 2).
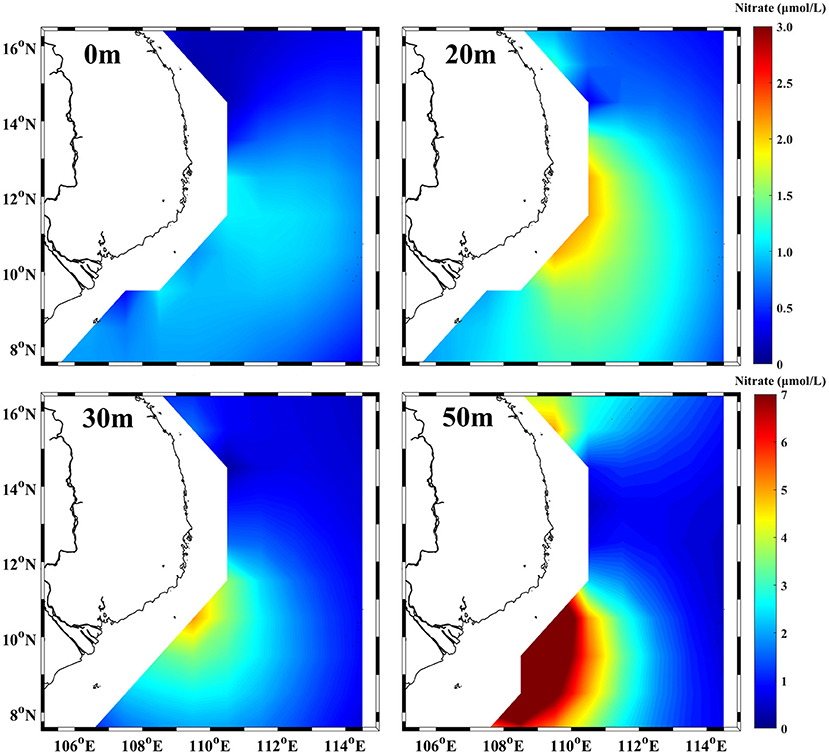
Figure 4. The summer (June–September) mean nitrate concentration in the study region at depths of 0, 20, 30, and 50 m from the World Ocean Atlas 2018 (WOA18) with a spatial resolution of 1°, respectively.
In situ Observations in the WSCS September 2–9, 2007
Satellite Chl-a images averaged for September 2–9, 2007, indicate higher Chl-a concentrations occurred in the southwestern WSCS (Figure 5A). To test the validity of these satellite Chl-a data, in situ observations at 26 stations are also used in this study. The results (Figure 5B) show a high correlation (R2 = 0.7240, p < 0.01) between the remote sensing Chl-a data and in situ surface Chl-a observations, indicating the reliability of the analyses based on the former. The maximum Chl-a concentrations occurred in subsurface layers between 25 and 75 m depth (Figure 5C). The three-dimensional structure (Figure 5) depicts the upward trend in temperature and salinity off the southeast coast of Vietnam. A high Chl-a (> 0.5 mg·m−3, Figure 5C) occurs in the 25–50 m layer; low temperature (<24°C, Figure 5D) occurs in the 25–100 m layer; and high salinity (> 34.2, Figure 5E) occurs in the 25–75 m layer; all the layers are located in a similar region (109–112°E, 10.5–13°N).
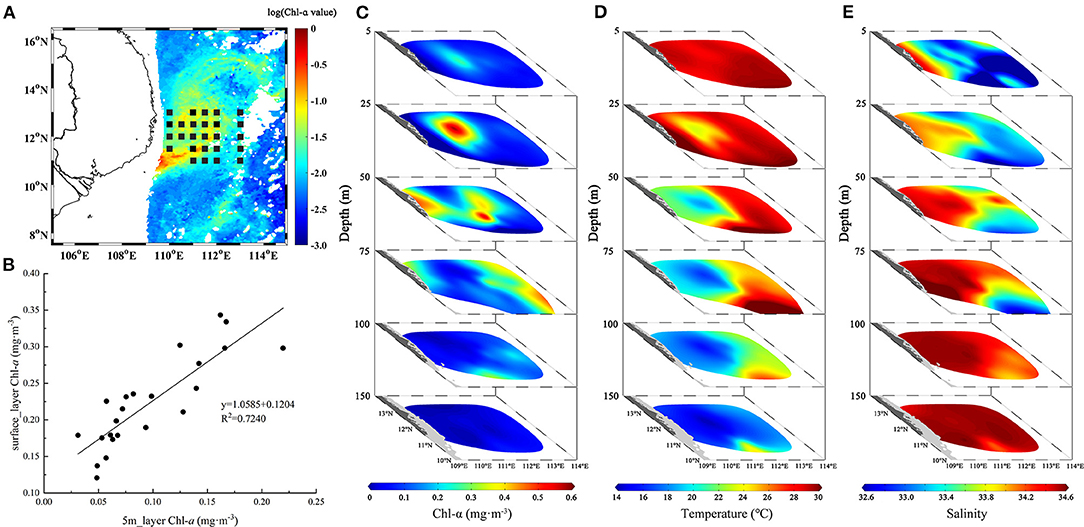
Figure 5. In situ observations during September 2–9, 2007. (A) The location of 26 Stations in the study region, the background shading denotes mean surface Chl-a from August 29, 2007, to September 13, 2007, obtained from GlobColour (weekly data). (B) Comparison of Chl-a concentration at each station derived from satellites (i.e., surface layer) and in situ observation (i.e., 5 m-layer). Three-dimensional structure of (C) Chl-a, (D) temperature, and (E) salinity at the depths of 5, 25, 50, 75, 100, and 150 m from the in situ observations.
Chl-a and EPV, ET, WS, SLA, SST Time Series Data
The scatter graphs (Figure 6) for Chl-a vs. SST, SSW, AOT, SLA, EPV, and ET, present a good tendency with each other. A correlation analysis indicates that Chl-a (Table 1) is positively correlated with SSW, AOT, ET, and EPV (Chl-a vs. SSW, Pearson's r = 0.5882, p < 0.01; Chl-a vs. AOT, r = 0.4002, p < 0.01; Chl-a vs. ET, r = 0.6171, p < 0.01; and Chl-a vs. EPV, r = 0.6115, p < 0.01), and negatively correlated with SLA and SST (Chl-a vs. SST, r = −0.7080, p < 0.01 and Chl-a vs. SLA, r = −0.4491, p < 0.01). Of these, SST and ET are most highly correlated with Chl-a, followed by EPV, SSW, and last SLA and AOT. These correlations indicate that Chl-a concentration is mainly affected by SST and ET.
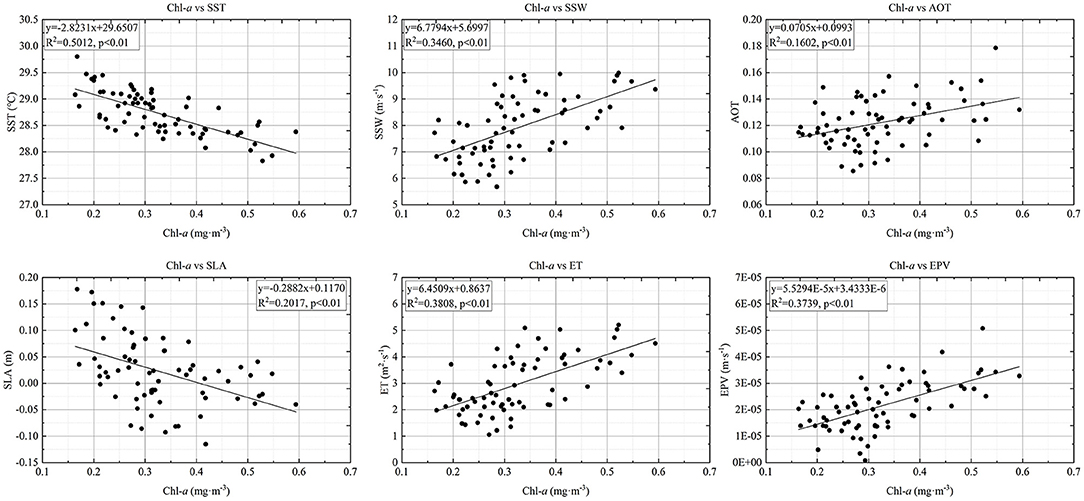
Figure 6. Scatter diagrams of monthly Chl-a, SST, SSW, AOT, SLA, ET, and EPV in summer averaged for the selected regions, respectively.
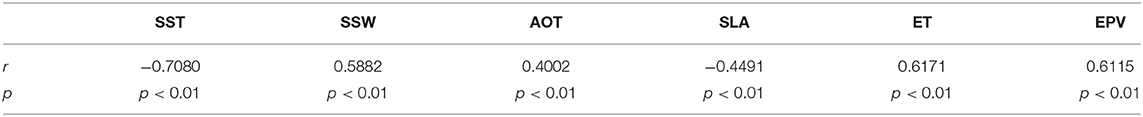
Table 1. The simple correlation coefficients between Chl-a blooms and ocean conditions.
A multiple correlation analysis is used to further analyze the influence of SST, SSW, AOT, SLA, ET, and EPV on Chl-a concentrations. A strong correlation between Chl-a concentration and ocean conditions (Figure 6; Table 2) indicates that these factors largely explain increased Chl-a. The coefficient of multiple correlation (R) (Table 2) between Chl-a and the total environmental conditions is significant (R = 0.798, p < 0.01). Additionally, partial coefficients between Chl-a concentration and SST, SSW, AOT, SLA, ET, and EPV are −0.481, −0.132, 0.094, −0.187, 0.218, and 0.144, respectively (Table 2). The partial correlation between AOT and Chl-a is the poorest and is the first to be eliminated. The variables with the lowest partial correlation coefficients are then sequentially eliminated from the remaining environmental variables. EPV also has a non-negligible role on Chl-a based on Table 2.
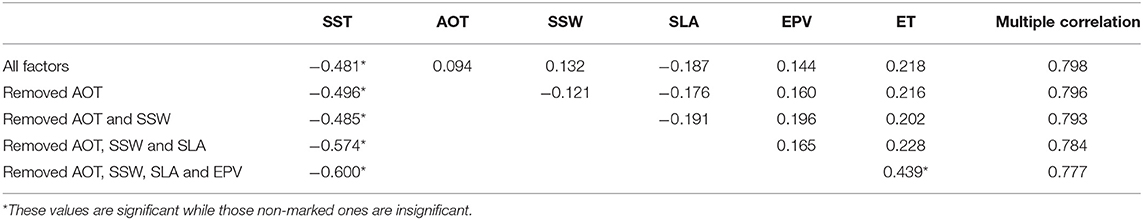
Table 2. The multiple correlations and partial coefficients between the Chl-a and others.
Relationships between Chl-a and SST, SSW, AOT, SLA, ET, and EPV are examined using multiple stepwise linear regression analysis (Table 3). AOT is first removed from the regression equation because its p-value is the greatest. After removing AOT, the SSW p-value is then, the greatest, so it is also removed in the next step, and so on, until the remaining SST and ET in the regression equation cannot be removed, revealing that these two variables most significantly impact Chl-a.
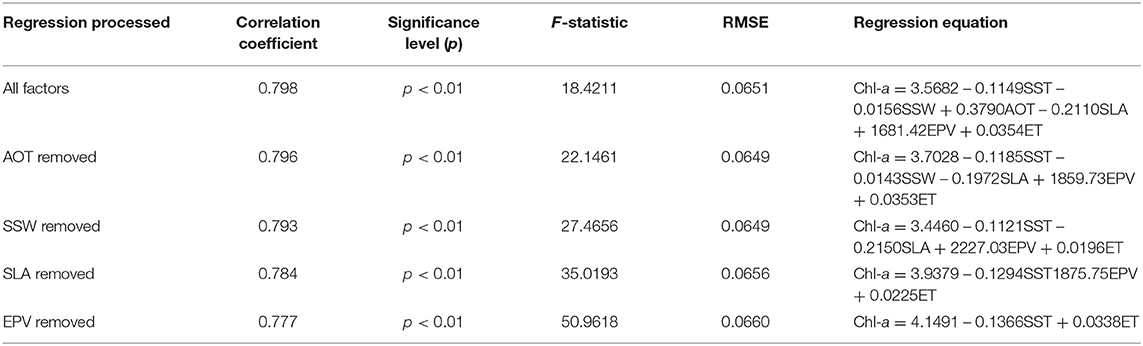
Table 3. Correlation coefficient using a stepwise multiple linear regression, significance level, F-statistic, root mean square error (RMSE), and regression equation.
Discussion
Possible Environmental Factors Regulating Summer Phytoplankton Blooms
Considerable variation in high Chl-a concentration appears off the southeast coast of Vietnam in summer (Figure 2). The high Chl-a levels typically first appear in early June and persist for about 4 months. The SST, SSW, AOT, SLA, ET, and EPV values all vary from June to September (Figure 3). Based on a simple correlation analysis (Figure 6; Table 1), six environmental factors are highly correlated with Chl-a. The multiple correlation coefficient (Table 2) between Chl-a and all the environmental factors (R = 0.798, p < 0.01) indicates that each of all factors impacts summer phytoplankton blooms in the WSCS. However, in offshore waters, ET and EPV have greater effects on summer phytoplankton blooms than any other factor, consistent with the previous studies (Liu et al., 2012; Gao et al., 2013; Tang et al., 2014; Liang et al., 2018; Zhao et al., 2018).
Analysis of multiple and partial correlations (Table 2) suggests that the influence of AOT on surface Chl-a is low, as the partial correlation (r = 0.094) is insignificant. The AOT inputs are considered major forces in regional oceanic ecosystems (Wong et al., 2007). Although AOT can significantly enhance the phytoplankton blooms in the SCS (Wang et al., 2012b), and impact primary production and ocean biogeochemical cycles (Duce, 1986; Martin et al., 1994; Migon and Sandroni, 1999; Jo et al., 2007), aerosol precipitation plays a more obvious role in the basin (open sea) (Lin et al., 2007). Lin et al. (2009) reported that with increased distance from the coastline, the potential role of atmospheric aerosols increased, and the correlation increased between Chl-a and AOT. Due to other nutrient sources (upwelling and convective-overturn), the effect of AOT is only weakly correlated with Chl-a.
Illumination conditions (such as temperature and light) and nutrients are the main limiting factors of phytoplankton growth (Wu et al., 2003; Zhao and Tang, 2007). The optimum temperatures for growth of most phytoplankton range 20–30°C (Lin et al., 2009; Li and Lin, 2019). The SCS in the tropical monsoon region has strong light penetration throughout the year (Liu et al., 2002; Zhao and Tang, 2007). Summer SST is relatively uniform at 28–30°C, and its influence on the phytoplankton distribution is deemed to be insignificant. Therefore, we believe that nutrients are the main limiting factor of Chl-a concentrations in summer throughout most of the SCS (Tac and Du, 1988). Low SST weakens the stratification and enhances the vertical mixing (Phillips, 1966; Zhao et al., 2005b), further promoting dispersal of deep nutrients into upper ocean layers, thereby contributing to phytoplankton growth. As low SST is caused by upwelling, what we see in the SCS is essentially the product of indirect stimulation of phytoplankton growth by upwelling.
Ekman pumping velocity and ET greatly influence the phytoplankton blooms (Figure 6; Tables 1–3), with correlation coefficients Chl-a of 0.6172 and 0.6115 (Figure 6; Table 1), respectively; partial correlation coefficients also suggest that both EPV and ET play important roles in the formation of phytoplankton blooms. Although the influence of EPV on surface Chl-a is less than that of ET, a significant change in EPV (Figure 3F) is more consistent with that of Chl-a (Figure 2). Figure 3F indicates a possible prevailing tendency for upwelling in this region.
The regions of low SST in Figure 3A, low temperature from 50–75 m in Figure 5D, and high nitrate concentration from 30–50 m in Figure 4, are all similar, and coincide with that of ET-induced upwelling (Figure 3). This might indicate that ET-induced upwelling provides a continuous source of cold and nutrient-rich water to surface layers, leading to the phytoplankton blooms (Chereskin and Price, 2001; Zhao et al., 2012). SLA (Figure 3C) reveals the occurrence of both cold and warm eddies in the WSCS in summer. The areas of high Chl-a appear at the junction of two eddies, where current velocity is high. The high Chl-a distribution areas are consistent with the current direction, demonstrating that current velocity and direction affect surface layer Chl-a distribution.
Influence of Upwelling, Northward Current, and the Northeastward Jet on Summer Phytoplankton Blooms
Nutrients regulate phytoplankton growth in most WSCS areas (Zhao et al., 2005a; Zhao and Tang, 2007). Stable stratification during summer in euphotic layers inhibits nutrient transport from deeper waters (Zhao et al., 2018). Vertical transport is an important source of euphotic nutrients in oligotrophic seas (Xie et al., 2003; Jin et al., 2009; Zhao et al., 2018). In summer with conditions of high SST, the growth of phytoplankton gradually migrates to the subsurface layer to adapt to the growth environment. Therefore, maximum subsurface chlorophyll concentrations appear between 25 and 75 m depth (Figure 5). High temperature and low salinity (where precipitation exceeds evaporation) in upper layers, and low temperature and high salinity in deeper layers, are general characteristics of the SCS. Therefore, the horizontal movement of relatively low-salinity high-temperature water may represent either water mass sinking or mixing (Figures 5D,E); relatively high-salinity and low-temperature water may suggest an upward trend. EPV and ET are strong (Figures 3E,F) during summer, suggesting upwelling. Additionally, the center of high nitrate concentrations in the 30–50 m layer (Figure 4) is closer to the center of ET (Figure 3E), which is indicative of upwelling. Therefore, we consider that upwelling has a major impact on the summer phytoplankton blooms in this region.
A strong northward-flowing coastal current exists from 7.5°N to the turning point of the Vietnamese coastline at about 11°N (Figure 1C). This current flows north along the southeast coast of Vietnam, and when it flows into the sea near 11°N, it turns northeastward to form a northeastward jet (Figure 1C) (Fang et al., 2012). We refer to these two currents as the “northward current” and “northeastward jet” (Figure 1C). The centers of low SST (Figure 5D) and high Chl-a (Figure 2) do not overlap; areas of abnormally SLA also do not overlap with high Chl-a concentration. These differences are probably due to the northward current (Figure 1C), which may influence the centers of phytoplankton blooms and upwelling in summer. According to WOA18 mean nitrate distributions (Figure 4), high nitrate concentrations at 30 m occur further north than that in 50 m transported northward about 100 km (Figure 4). Additionally, relatively high Chl-a concentrations occur at 50 m centered around 111.5°E, 11.5°N, but high Chl-a concentrations at 25 m are centered around 111.5°E, 12.5°N, possibly indicating northerly movement (Figure 5). These changes indicate that the upwelling and phytoplankton blooms are likely to be affected by the northward current. The position of this current and where it jets northeastward from the coast of Vietnam varies between 10 and 14°N (Shaw and Chao, 1994; Chao et al., 1996; Takano et al., 1998), possibly because of changes in the direction of the Vietnamese coastline (Shaw and Chao, 1994). The coastal waters are influenced by marine, river, and terrestrial inputs (Gao et al., 2013). In our study region, high Chl-a near the Mekong River Estuary are contributed by discharge from the Mekong River all year along flowing northeastward far (Gao et al., 2013). Although this study excludes regions with water depth shallower than 200 m where Chl-a is overestimated due to the influence of coastal water, there is still a few nutrients input from the Mekong River that may be transported to the studied region by the background circulation (northeastward jet). In summer, the strong wind drives a northeastward jet of water along the Vietnamese coast. The northeastward jet will carry a few nutrients input from the Mekong River transported northeastward, which will enhance the growth of phytoplankton and cause the distribution of high Chl-a in the WSCS to be plume-shaped (Figure 2).
Conclusion
The present study reveals a “plume-shape” distribution of the high Chl-a in the WSCS under the influence of the northeastward jet. Combining SST, SSW, AOT, SLA, ET, and EPV for analysis, we get a significant correlation between these environmental factors and the sea surface Chl-a. In addition, a further analysis using the multiple stepwise correlations suggests that the upwelling due to ET and EPV play dominant roles in the summer phytoplankton blooms. The phytoplankton blooms are caused by the nutrients enhancement through the wind-induced upwelling and vertical mixing due to SSW forcing and heat loss. In addition, AOT was only weakly correlated with Chl-a concentration, probably because of these prominent abundant nutrients from upwelling and convective-overturn. We consider that the northward current in this area may cause the northward deviation of phytoplankton blooms from the areas of upwelling.
Data Availability Statement
The original contributions presented in the study are included in the article/supplementary material, further inquiries can be directed to the corresponding author/s.
Author Contributions
YC and HZ conceived the presented idea. YC, HS, and HZ performed the analysis of the manuscript. YC processed the data, drafted the manuscript, and designed the figures. HZ was involved in planning and supervised the funding of this study. All authors listed made a substantial, direct and intellectual contribution to the study, and approved it for publication.
Funding
The present research was supported by the National Natural Science Foundation of China (No. 42076162), Natural Science Foundation of Guangdong Province, China (No. 2020A1515010496), Postgraduate Education Innovation Project of Guangdong Ocean University (202145), and project supported by Innovation Group Project of Southern Marine Science and Engineering Guangdong Laboratory (Zhuhai) (No. 311020004).
Conflict of Interest
The authors declare that the research was conducted in the absence of any commercial or financial relationships that could be construed as a potential conflict of interest.
Publisher's Note
All claims expressed in this article are solely those of the authors and do not necessarily represent those of their affiliated organizations, or those of the publisher, the editors and the reviewers. Any product that may be evaluated in this article, or claim that may be made by its manufacturer, is not guaranteed or endorsed by the publisher.
Acknowledgments
We thank GlobColor's Working Group for providing merged chlorophyll-a (Chl-a) and aerosol optical thickness (AOT) data (http://hermes.acri.fr). The European Centre for Medium-Range Weather Forecasts (ECMWF) for providing monthly sea surface temperature (SST) and sea surface wind (SSW) products (https://cds.climate.copernicus.eu/). The National Ocean Data Center (NODC) for providing the World Ocean Atlas 2018 (WOA18) climatology of nitrate data (https://www.ncei.noaa.gov/products/world-ocean-atlas). The Copernicus Marine Service for providing sea level anomalies (SLA) products (https://marine.copernicus.eu/). In situ data during the period from September 2 to 9, 2007 from the work of Wang et al. (2016).
References
Behrenfeld, M. J., and Boss, E. S. (2014). Resurrecting the ecological underpinnings of ocean plankton blooms. Ann. Rev. Mar. Sci. 6, 167–194. doi: 10.1146/annurev-marine-052913-021325
Chai, F., Xue, H. J., and Shi, M. C. (2002). Formation and Distribution of Upwelling and Downwelling in the South China Sea. Beijing: Ocean Press.
Chao, S. Y., Shaw, P. T., and Wu, S. Y. (1996). Deep water ventilation in the South China Sea. Deep-Sea Res. 43, 445–466. doi: 10.1016/0967-0637(96)00025-8
Chen, C. C., Shiah, F. K., Chung, S. W., and Liu, K. K. (2006). Winter phytoplankton blooms in the shallow mixed layer of the South China Sea enhanced by upwelling. J. Sea Res. 59, 97–110. doi: 10.1016/j.jmarsys.2005.09.002
Chen, G., Peng, X., and Fei, C. (2014). Physical and biological controls on the summer chlorophyll bloom to the east of Vietnam. J. Oceanogr. 70, 323–328. doi: 10.1007/s10872-014-0232-x
Chereskin, T. K., and Price, J. F. (2001). Ekman transport and pumping, in Encyclopedia of Ocean Sciences, eds J. H. Steele, S. A. Thorpe, and K. K. Turekian (Amsterdam: Elsevier Science), 222–227. doi: 10.1016/B978-012374473-9.00155-7
Duce, R. A. (1986). The impact of atmospheric nitrogen, phosphorus, and iron species on marine biological productivity, in The Role of Air-Sea Exchange in Geochemical Cycling. NATO ASI Series (Series C: Mathematical and Physical Sciences), vol 185, eds. P. Buat-Ménard, 497–528. doi: 10.1007/978-94-009-4738-2_19
Fang, G., Wang, G., Fang, Y., and Fang, W. (2012). A review on the South China Sea western boundary current. Acta Oceanol. Sin. 31, 1–10. doi: 10.1007/s13131-012-0231-y
Fang, W. D., Fang, G. H., Shi, P., Huang, Q. Z., and Xie, Q. (2002). Seasonal structures of upper layer circulation in the South China Sea from in situ observations. Geophys. Res. 107:3202. doi: 10.1029/2002JC001343
Feng, Y. T., Zhao, H., and Shi, Y. Z. (2019). The concentration of nutrients and chlorophyll a in the offshore of Leizhou Peninsula in autumn spatial distribution and their relationship. J. Guangdong Ocean Univ. 39, 75–82. doi: 10.3969/j.issn.1673-9159.2019.02.010
Gao, S., Wang, H., Liu, G., and Li, H. (2013). Spatio-temporal variation of chlorophyll a and its responses to sea surface temperature, winds and height anomaly in the western South China Sea. Acta Oceanol. Sin. 32, 48–58. doi: 10.1007/s13131-013-0266-8
Gong, G. C., Liu, K. K., Liu, C. T., and Pai, S. C. (1992). The chemical hydrography of the South China Sea west of Luzon and a comparison with the West Philippine Sea. Terrestr. Atmos. Ocean. Sci. 3, 587–602. doi: 10.3319/TAO.1992.3.4.587(O)
Halpern, D. (2002). Offshore ekman transport and ekman pumping off peru during the 1997–1998 el niño. Geophys. Res. Lett.. 29, 19–11. doi: 10.1029/2001GL014097
Jennrich, R. I. (1977). Stepwise regression, in Statistical Methods for Digital Computers, Vol. 3, eds K. Enslein, A. Ralston, and H. S. Wilf Vol (New York, NY: Wiley-Interscience), 58–75.
Jin, X., Dong, C., Kurian, J., Mcwilliams, J. C., and Li, Z. (2009). SST-wind interaction in coastalupwelling: oceanic simulation with empirical coupling. J. Phys. Oceanogr.. 39:2957. doi: 10.1175/2009JPO4205.1
Jo, C. O., Lee, J., Park, K., Kim, Y. H., and Kim, K. (2007). Asian dust initiated early spring bloom in the northern east/Japan sea. Geophys. Res. Lett. 34, 306–316. doi: 10.1029/2006GL027395
Kuo, N. J., Zheng, Q., and Ho, C. R. (2000). Satellite observation of upwelling along the western coast of the South China Sea. Remote Sens. Environ. 74, 463–470. doi: 10.1016/S0034-4257(00)00138-3
Li, H. F., and Lin, S. J. (2019). Research progresses of phytoplankton ecology in the South China Sea. J. Xiamen Univ. 58, 7–16. doi: 10.6043/j.issn.0438-0479.201805038
Liang, W. Z., Tang, D. L., and Xin, L. (2018). Phytoplankton size structure in the western South China Sea under the influence of a 'jet-eddy system'. J. Mar. Syst. 187, 82–95. doi: 10.1016/j.jmarsys.2018.07.001
Lin, I. I., Chen, J. P., Wong, G., Huang, C. W., and Lien, C. C. (2007). Aerosol input to the South China Sea: results from the moderate resolution imaging spectro-radiometer, the quick scatterometer, and the measurements of pollution in the Troposphere Sensor. Deep-Sea Res. Part II 54, 1589–1601. doi: 10.1016/j.dsr2.2007.05.013
Lin, I. I., Wong, G., Lien, C. C., Chien, C. Y., and Chen, J. P. (2009). Aerosol impact on the South China Sea biogeochemistry: an early assessment from remote sensing. Geophys. Res. Lett. 36, 153–159. doi: 10.1029/2009GL037484
Lin, L. R., and Zhao, H. (2012). Analysis on the relations between sea surface temperature and phytoplankton Chlorophyll-a in the South China Sea. J. Mar. Sci. 30, 46–54. doi: 10.3969/j.issn.1001-909X.2012.04.006
Liu, F., Chen, C., and Zhan, H. (2012). Decadal variability of chlorophyll a in the South China Sea: a possible mechanism. Chin. Ocean. Limnol. 30, 1054–1062. doi: 10.1007/s00343-012-1282-9
Liu, K. K., Chao, S. Y., Shaw, P. T., Gong, G. C., Chen, C. C., and Tang, T. Y. (2002). Monsoon-forced chlorophyll distribution and primary production in the South China Sea: observations and a numerical study. Deep Sea Res. Part I Oceanogr. Res. Pap. 49, 1387–1412. doi: 10.1016/S0967-0637(02)00035-3
Lu, Z., Gan, J., Dai, M., and Cheung, A. (2010). The influence of coastal upwelling and a river plume on the subsurface chlorophyll maximum over the shelf of the northeastern South China Sea. J. Mar. Syst. 82, 35–46. doi: 10.1016/j.jmarsys.2010.03.002
Ma, J. F., Liu, H. L., Zhan, H. G., Lin, P. F., and Du, Y. (2012). Effects of chlorophyll on upper ocean temperature and circulation in the upwelling regions of the South China Sea. Aquat. Ecosyst. Health Manag. 15, 127–134. doi: 10.1080/14634988.2012.687663
Maritorena, S., d'Andon, O. H. F., Manginet, A., and Siegel, D. A. (2010). Merged satellite ocean color data products using a bio-optical model: characteristics, benefits and issues. Remote Sens. Environ. 114, 1791–1804. doi: 10.1016/j.rse.2010.04.002
Maritorena, S., and Siegel, D. A. (2005). Consistent merging of satellite ocean color data sets using a bio-optical model. Remote Sens. Environ. 94, 429–440. doi: 10.1016/j.rse.2004.08.014
Martin, J. H., Coale, K. H., Johnson, K. S., Fitzwater, S. E., Gordon, R. M., and Tanner, S. J. (1994). Testing the iron hypothesis in ecosystems of the equatorial Pacific Ocean. Nature 371, 123–129. doi: 10.1038/371123a0
Migon, C., and Sandroni, V. (1999). Phosphorus in rainwater: partitioning inputs and impact on the surface coastal ocean. Limnol. Oceanogr. 44, 1160–1165. doi: 10.4319/lo.1999.44.4.1160
Ning, X., Chai, F., Xue, H., Cai, Y., Liu, C., and Shi, J. (2004). Physical-biological oceanographic coupling influencing phytoplankton and primary production in the South China Sea. J. Geophys. Res. 109:C10005. doi: 10.1029/2004JC002365
Phillips, O. M. (1966). The dynamics of the upper ocean, in Cambridge Monographs on Mechanics and Applied Mathematics, eds C. G. Batchelor, M. J. Ablowitz, S. H. Davis, E. J. Hinch, University Lecturer Damtp A Iserles, J. Ockendon, et al. (Cambridge: Cambridge University Press), 261.
Piedras, F. R., and Odebrecht, C. (2012). The response of surfzone phytoplankton to nutrient enrichment (Cassino Beach, Brazil). J. Exp. Mar. Biol. Ecol. 432–433, 156–161. doi: 10.1016/j.jembe.2012.07.020
Qiu, F. W., Fang, W. Q., and Fang, G. H. (2011). Seasonal-to-interannual variability of chlorophyll in central western South China Sea extracted from SeaWiFS. Chin. J. Oceanol. Limnol. 29, 18–25. doi: 10.1007/s00343-011-9931-y
Qu, T. (2000). Upper-layer circulation in the South China Sea. Phys. Oceanogr. 30, 1450–1460. doi: 10.1175/1520-0485(2000)0302.0.CO;2
Shao, J. C., Zhao, H., Shen, C. Y., and Lv, J. H. (2015). Influence of typhoon Matsa on phytoplankton chlorophyll-a in the northwest Pacific ocean offshore and alongshore. J. Guangdong Ocean Univ. 35, 67–74. doi: 10.3969/j.issn.1673-9159.2015.04.011
Shaw, P. T., and Chao, S. Y. (1994). Surface circulation in the South China Sea. Deep-Sea Res. I Oceanogr. Res. Pap. 41, 1663–1683. doi: 10.1016/0967-0637(94)90067-1
Shaw, P. T., Chao, S. Y., and Fu, L. L. (1999). Sea surface height variations in the South China Sea from satellite altimetry. Oceanol. Acta 22, 1–17.doi: 10.1016/S0399-1784(99)80028-0
Shen, C. Y., Zhao, H., Chen, F. J., and Xiao, H. W. (2020). The distribution of aerosols and their impacts on chlorophyll-a distribution in the South China Sea. J. Geophys. Res. Biogeosci. 125:e2019JG005490. doi: 10.1029/2019JG005490
Shi, Y. Z., Zhao, H., Wang, X. D., Zhang, J. B., Sun, X. L., and Yang, G. H. (2019). Distribution characteristics of nutritive salts and chlorophyll a in the Pearl River Estuary. J. Guangdong Ocean Univ. 39, 56–65. doi: 10.3969/j.issn.1673-9159.2019.01.009
Tac, N., and Du, H. T. (1988). Studies on phytoplankton pigments: chlorophyll, total carotenoids and degradation products in vietnamese waters, in Proceedings of the SEAFDEC Seminar on Fishery Resources in the South China Sea, Area IV : Vietnamese Waters (Bangkok: Southeast Asian Fisheries Development Center).
Takano, K., Harashima, A., and Nnmba, T. (1998). A numerical simulation of the circulation in the South China Sea—preliminary results. Acta Oceanogr. Taiwanica 37, 165–186.
Tang, D. L., Kawamura, H., Dien, T. V., and Lee, M. A. (2004). Offshore phytoplankton biomass increase and its oceanographic causes in the South China Sea. Mar. Ecol. Prog. Ser. 268, 31–41. doi: 10.3354/meps268031
Tang, D. L., Kawamura, H., Shi, P., Takahashi, W., Guan, L., Shimada, T., et al. (2006). Seasonal phytoplankton blooms associated with monsoonal influences and coastal environments in the sea areas either side of the Indochina Peninsula. J. Geophys. Res. 111:G01010. doi: 10.1029/2005JG000050
Tang, S. L., Liu, F. F., and Chen, C. Q. (2014). Seasonal and intraseasonal variability of surface chlorophyll a concentration in the South China Sea. Aquat. Ecosyst. Health Manag. 17, 242–251. doi: 10.1080/14634988.2014.942590
Wang, D. X., Zhuang, W., Xie, S. P., Hu, J. Y., Shu, Y. Q., and Wu, R. S. (2012a). Coastal upwelling in summer 2000 in the northeastern south china sea. J. Geophys. Res. Oceans 117:4009. doi: 10.1029/2011JC007465
Wang, L., Huang, B., Chiang, K. P., Liu, X., Chen, B., Xie, Y., et al. (2016). Physical-biological coupling in the Western South China Sea: the response of phytoplankton community to a mesoscale cyclonic eddy. PLoS ONE 11:e0153735. doi: 10.1371/journal.pone.0153735
Wang, S. H., Hsu, N. C., Tsay, S. C., Lin, N. H., Sayer, A. M., Huang, S. J., et al. (2012b). Can Asian dust trigger phytoplankton blooms in the oligotrophic northern South China Sea? Geophys. Res. Lett. 39:L05811. doi: 10.1029/2011GL050415
Wong, G. T. F., Ku, T. L., Mulholland, M., Tseng, C. M., and Wang, D. P. (2007). The SouthEast Asian Time-series Study (SEATS) and the biogeochemistry of the South China Sea: an overview. Deep Sea Res. Part II 54, 1434–1447. doi: 10.1016/j.dsr2.2007.05.012
Wu, J., Chung, S. W., Wen, L. S., Liu, K. K., Chen, Y. L. L., Chen, H. Y., et al. (2003). Dissolved inorganic phosphorus, dissolved iron, and Trichodesmium in the oligotrophic South China Sea. Glob. Biogeochem. Cycles 17:1008. doi: 10.1029/2002GB001924
Wyrtki, K. (1961). Physical Oceanography of the Southeast Asian Waters, vol. 2. San Diego: Scripps Institution of Oceanography.
Xie, S. P., Xie, Q., Wang, D. X., and Liu, L. W. T. (2003). Summer upwelling in the South China Sea and its role in regional climate variations. J. Geophys. Res. 108:3261. doi: 10.1029/2003JC001867
Xing, X. G., Qiu, G. Q., Boss, E., and Wang, H. L. (2019). Temporal and vertical variations of particulate and dissolved optical properties in the South China Sea. J. Geophys. Res. Oceans 124, 3779–3795. doi: 10.1029/2018JC014880
Yan, N., and Wang, J. (2011). Multi-timescale analysis of chlophyll and its related physical factors northwest of the Luzan Island based on HHT. J. Trop. Oceanogr. 5, 38–47. doi: 10.3969/j.issn.1009-5470.2011.05.00
Yang, H. J., Liu, Q. Y., Liu, Z. Y., Wang, D. X., and Liu, X. B. (2002). A general circulation model study of the dynamics of the upper ocean circulation of the South China Sea. Geophys. Res. 107, 22–31. doi: 10.1029/2003JC001084
Zhao, H., Han, G. Q., Zhang, S. W., and Wang, D. Z. (2013). Two phytoplankton blooms near luzon strait generated by lingering typhoon parma. J. Geophys. Res. Biogeosci. 118, 412–421. doi: 10.1002/jgrg.20041
Zhao, H., Qi, Y. Q., Wang, D. X., and Wang, W. Z. (2005a). Study on the features of chlorophyll-a derived from SeaWiFS in the South China Sea. Acta Oceanol. Sin. 27, 124–132. doi: 10.1111/j.1745-7254.2005.00209.x
Zhao, H., Sui, D. D., Xie, Q., Han, G. Q., Wang, D. X., Chen, N., et al. (2012). Distribution and interannual variation of winter phytoplankton blooms northwest of Luzon Islands from satellite observations. Aquat. Ecosyst. Health Manag. 15, 53–61. doi: 10.1080/14634988.2012.648875
Zhao, H., and Tang, D. L. (2007). Effect of 1998 El Niño on the distribution of phytoplankton in the South China Sea. J. Geophys. Res. 112:C02017. doi: 10.1029/2006JC003536
Zhao, H., Tang, D. L., and Wang, S. F. (2005b). Spatial distribution of chlorophyll-a concentration in summer in western South China Sea and its response to oceanographic environmental factors. J. Trop. Oceanogr. 24, 31–37. doi: 10.3969/j.issn.1009-5470.2005.06.005
Zhao, H., and Zhang, S. P. (2014). Review on spatial-temporal variation of China' offshore phytoplankton chlorophyll and primary productivity and their variational mechanism. J. Guangdong Ocean Univ. 34, 98–104. doi: 10.3969/j.issn.1673-9159.2014.01.016
Keywords: summer phytoplankton blooms, upwelling, Ekman transport, western South China Sea, Ekman pumping, northward current
Citation: Chen Y, Shi H and Zhao H (2021) Summer Phytoplankton Blooms Induced by Upwelling in the Western South China Sea. Front. Mar. Sci. 8:740130. doi: 10.3389/fmars.2021.740130
Received: 12 July 2021; Accepted: 13 August 2021;
Published: 10 September 2021.
Edited by:
Zhan Hu, Sun Yat-sen University, ChinaReviewed by:
Dz Yang, Institute of Oceanology, Chinese Academy of Sciences (CAS), ChinaMuhsan Ali Kalhoro, Lasbela University of Agriculture, Water and Marine Sciences, Pakistan
Copyright © 2021 Chen, Shi and Zhao. This is an open-access article distributed under the terms of the Creative Commons Attribution License (CC BY). The use, distribution or reproduction in other forums is permitted, provided the original author(s) and the copyright owner(s) are credited and that the original publication in this journal is cited, in accordance with accepted academic practice. No use, distribution or reproduction is permitted which does not comply with these terms.
*Correspondence: Hui Zhao, aHVpemhhbzE5NzhAMTYzLmNvbQ==