 Nery Contti Neto
 Andrew Pomeroy
 Ryan Lowe
 Marco Ghisalberti
94% of researchers rate our articles as excellent or good
Learn more about the work of our research integrity team to safeguard the quality of each article we publish.
Find out more
ORIGINAL RESEARCH article
Front. Mar. Sci. , 31 January 2022
Sec. Marine Ecosystem Ecology
Volume 8 - 2021 | https://doi.org/10.3389/fmars.2021.733542
This article is part of the Research Topic Local Hydrodynamics of Benthic Marine Organisms View all 7 articles
Seagrass meadows are prominent in many coastal zones worldwide and significant contributors to global primary production. The large bottom roughness (or canopy) created by seagrass meadows substantially alters near-bed hydrodynamics and sediment transport. In this study, we investigate how a seagrass meadow in a low-energy environment (forced by local winds) modifies near-bed mean and wave-driven flows and assess how this relates to suspended sediment concentration (SSC). A two-week field study was conducted at Garden Island in southwestern Australia, a shallow and sheltered coastal region subjected to large diurnal sea-breeze cycles, typical of many low-energy environments where seagrasses are found. The mean and turbulent flow structure, along with optical estimates of SSC, were measured within both a seagrass canopy and over an adjacent bare bed. Near-bed mean current velocities within the seagrass canopy were on average 35% of the velocity above the canopy. Oscillatory wave velocities were less attenuated than mean current velocities, with near-bed values on average being 83% of those above the canopy. Mean and maximum shear velocities inferred from currents and waves above the canopy frequently exceeded the threshold for sediment resuspension, but no significant variation was observed in the SSC. However, a significant correlation was observed between SSC and bed shear stress estimated using near-bed velocities inside the canopy. When sediment was resuspended, there were substantial differences between the SSCs within and above the canopy layer, with higher levels confined within the canopy. This study demonstrates the importance of measuring near-bed hydrodynamic processes directly within seagrass canopies for predicting the role seagrass meadows play in regulating local rates of sediment resuspension.
Seagrass meadows are a foundation ecosystem composed of marine angiosperms (flowering plants). They serve as a nursery habitat for fish and shellfish, act as coastal carbon sinks, contribute to the export of biomass in coastal zones, and enhance biodiversity (Duarte and Cebrián, 1996; Green and Short, 2003). Seagrasses are found in all continents except for Antarctica (Duarte, 2002) and are located in a range of hydrodynamic environments, from highly exposed to sheltered environments. Despite their global prevalence, few species possess strongly reinforced fibers that enable them to tolerate exposure to energetic swell conditions (Carruthers et al., 2007). Consequently, higher species richness and biomass is usually found in sheltered environments such as sounds, bays, peninsulas, and the leeward sides of reefs and islands where extreme wave conditions during storms are less frequent or absent (Lee Long et al., 1993; Copertino et al., 2016). While these regions tend to be sheltered from large swell waves, they can still be subjected to locally generated wind-waves and currents, which can drive daily variations in turbidity and ultimately light availability within the water column (Lawson et al., 2007).
Seagrasses require some of the highest light levels of any plant group worldwide (around 25% of incident radiation, Dennison et al., 1993) and light availability can often be a limiting factor for seagrass distribution and growth (Duarte, 1991). In coastal waters, light composition and intensity can be strongly influenced by turbidity caused by the resuspension of sediment from the seabed (de Boer, 2007). The above-ground structure formed by seagrass leaves and stems are known to substantially attenuate near-bed flows by exerting drag forces on the flow. This flow attenuation can reduce local rates of sediment resuspension and increase light availability, creating a feedback between seagrass growth and sediment/light in seagrass meadows (Adams et al., 2016); however, the detailed processes that govern these sediment transport processes have not been well quantified in field settings. Similar feedbacks have also been proposed for other benthic canopies such as coral reefs (Pomeroy et al., 2017); however, in contrast to those benthic environments, the flexibility of seagrass canopies results in a canopy whose geometry and flow resistance is dynamic.
The flexibility of seagrass affects how a meadow interacts with the overlying flow (Abdolahpour et al., 2018), as well as the near-bed flows in the meadow that may influence sediment resuspension. Seagrass flexibility and motion under wave-driven flows means that the canopy geometry and the drag forces exerted on the flow vary in time. When the seagrass blades are in their most upright position, drag imposed on the flow reaches its maximum value, as it is generated over the maximum canopy extent (Luhar and Nepf, 2011). However, when the seagrass bends, the drag on the flow reduces above as well as within the canopy (Abdolahpour et al., 2018). The reduction in drag as the blades bend, often during periods of strong currents, has important ecological effects such as the prevention of uprooting that would otherwise result in seagrass loss (Vogel, 1984).
A number of field studies have investigated the impact of seagrass on hydrodynamic processes over a range of conditions, water depths and coastal environments, such as open coastlines (Gacia and Duarte, 2001; Infantes et al., 2012), sheltered macro-tidal environments (Koch and Gust, 1999; Hasegawa et al., 2008; Gruber and Kemp, 2010) and shallow bays (van Keulen and Borowitzka, 2002; Lawson et al., 2007; Gruber and Kemp, 2010; Hansen and Reidenbach, 2012; Reidenbach and Thomas, 2018). While these studies have helped explain how a seagrass meadow attenuates near-bed flows, and by inference turbidity and sediment resuspension, the direct connections between the hydrodynamics within a canopy and how these processes ultimately determine suspended sediment concentrations (SSCs) remain poorly quantified.
In this study, we use in situ measurements to investigate how the hydrodynamics are modified within a seagrass canopy in a sheltered, wind-wave driven environment and how they influence sediment resuspension. The objectives of this study are to (1) quantify how the steady and oscillatory (wave) components of the flow in low energy hydrodynamic environments are affected within seagrass canopies; and (2) evaluate how the modification of the hydrodynamics within a seagrass canopy influences sediment resuspension.
Wind blowing over a water surface transfers momentum into the water column leading to the generation of mean currents. If the seabed has small bottom roughness (e.g., a bare sandy bed), these currents form a logarithmic velocity profile (Raupach et al., 1991) in a bottom boundary layer adjacent to the seabed where turbulent shear stresses are approximately constant (Figure 1A). Under these conditions, turbulent shear stresses within the bottom boundary layer are transmitted to the seabed where they exert forces that mobilize and transport sediment.
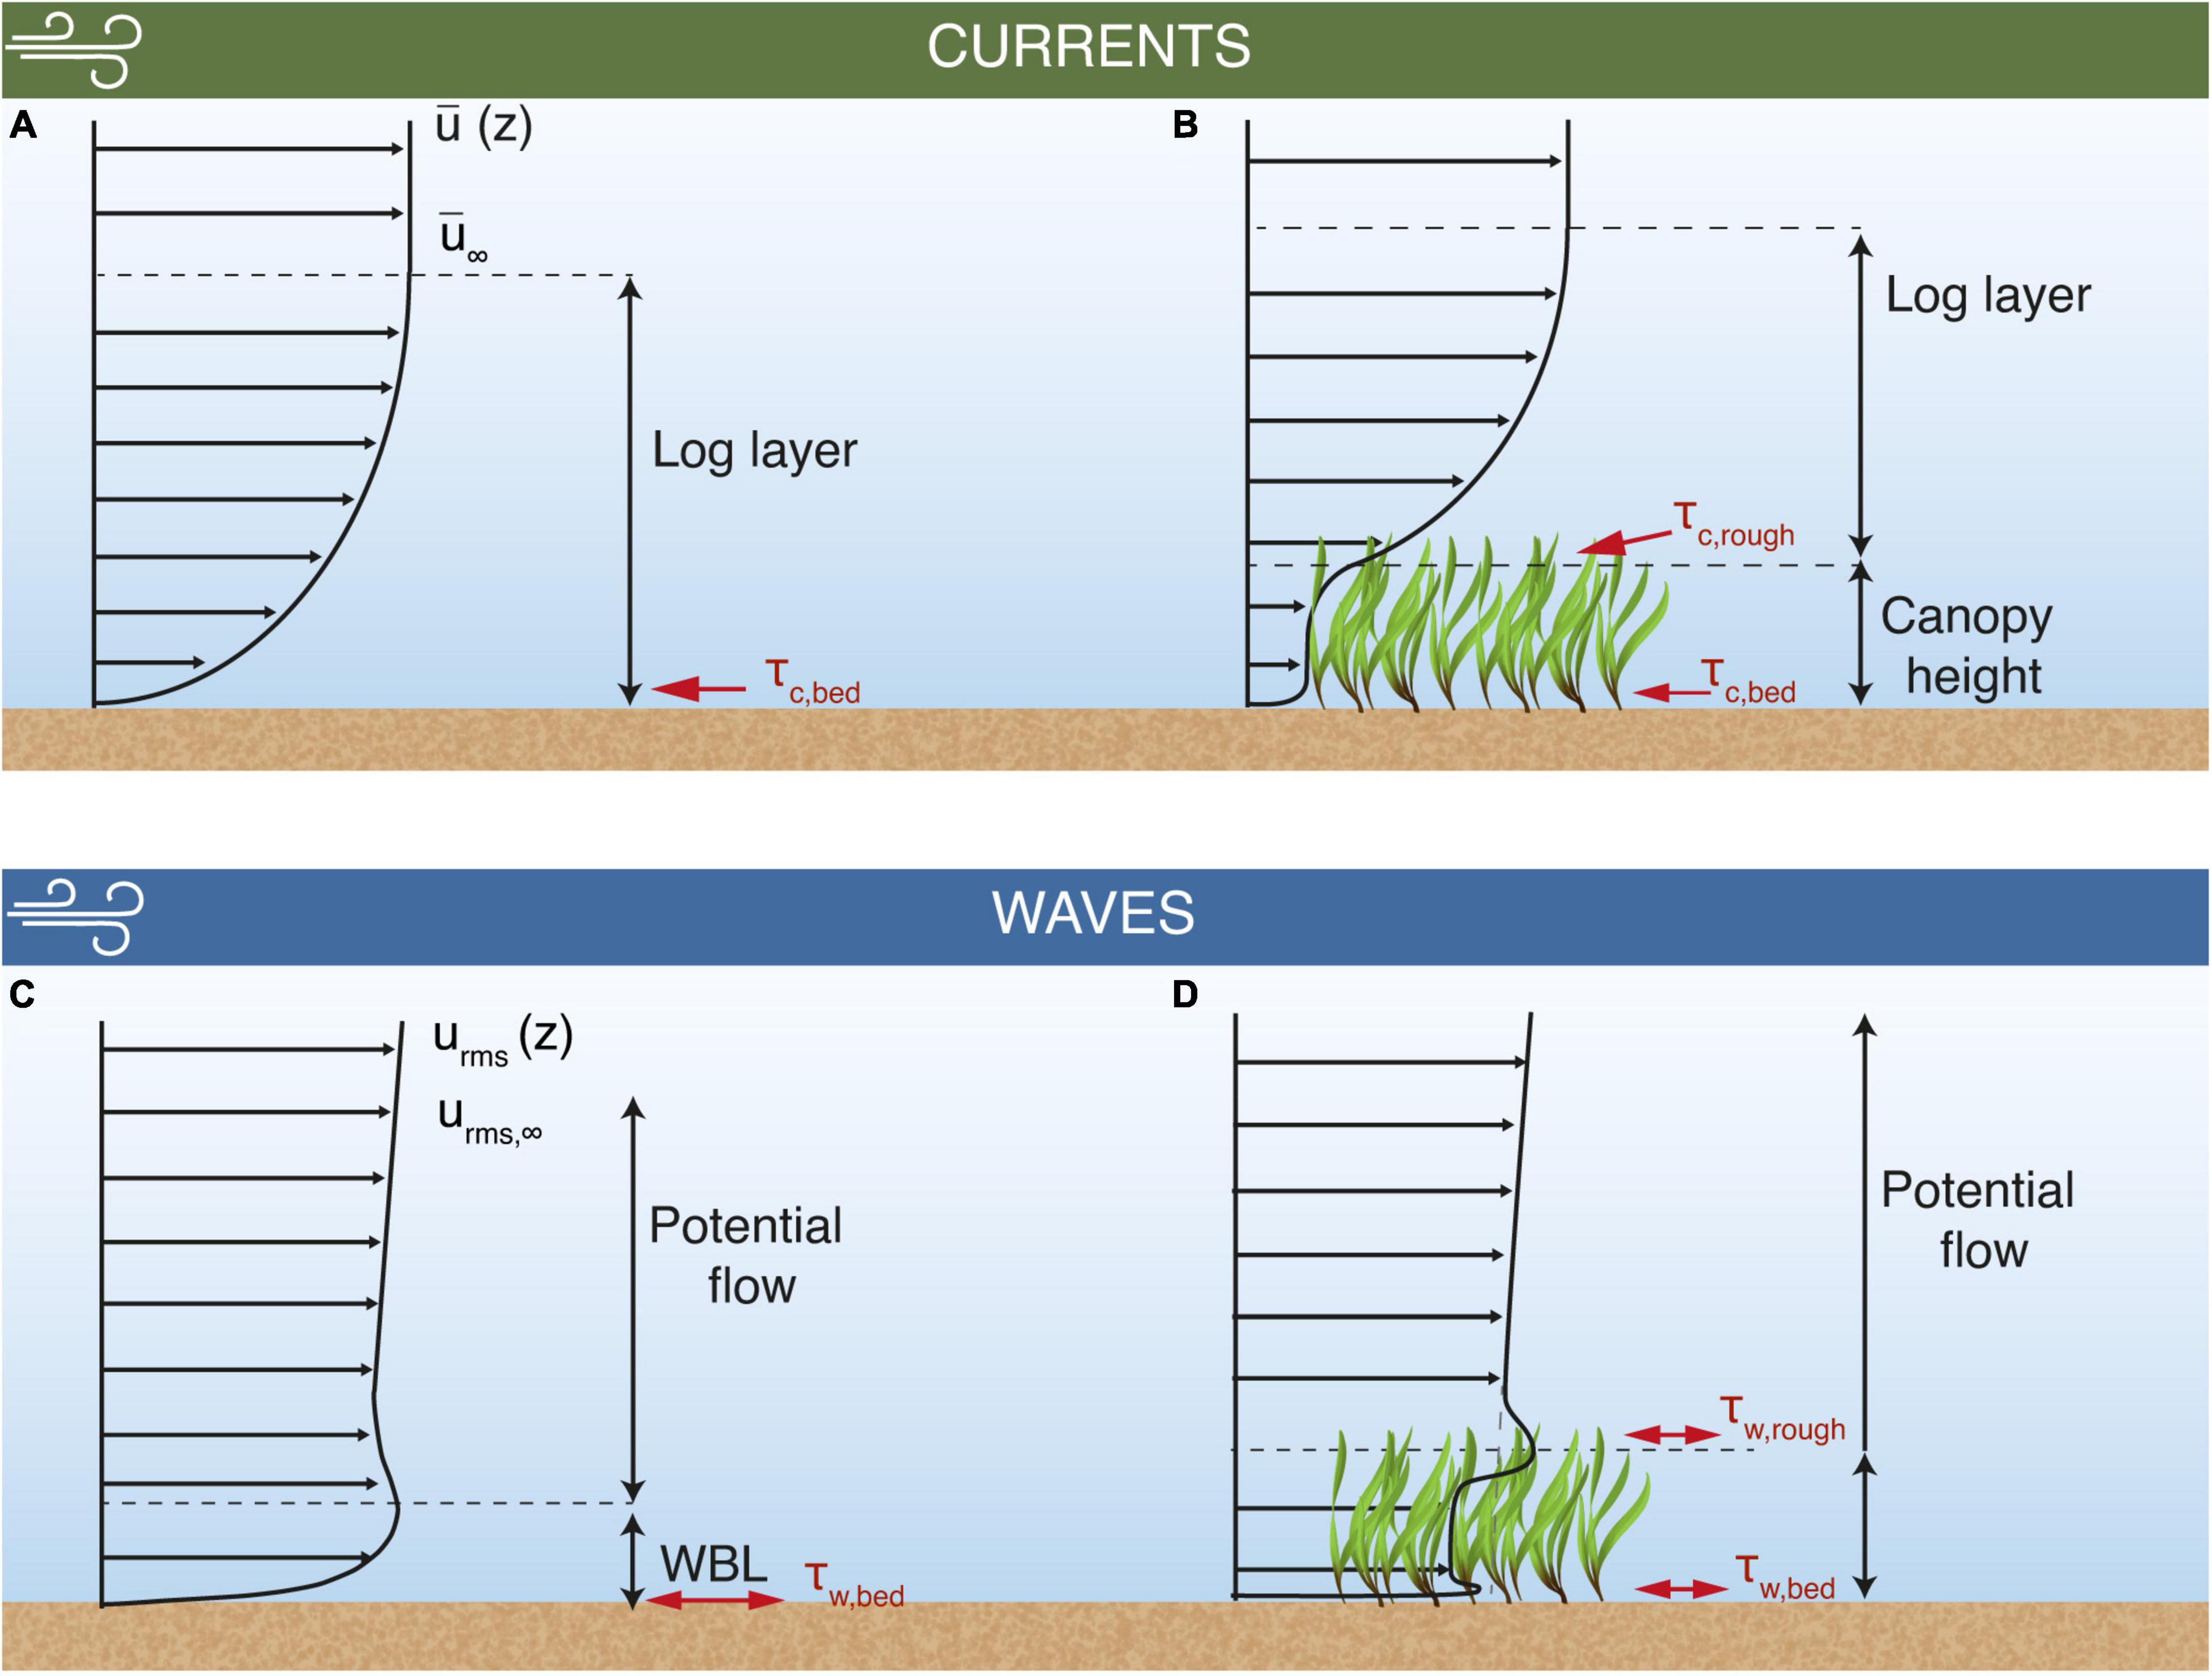
Figure 1. Conceptual model of the flow interactions between mean currents and root-mean-squared wave orbital velocities with seagrass canopies and the influence on shear stresses. The mean current develops a logarithmic velocity profile (log layer, A), exerting a shear stress on the bed sediment (τc,bed). Above the log layer, current and wave velocities attain free stream values, denoted as and urms,∞, respectively. The log layer is shifted above the canopy when a sufficiently dense seagrass meadow is present (B), altering τc,bed and enhancing the shear stress at the seagrass/water interface (τc,rough). When waves are present, the root mean square of the oscillatory velocity component (urms) develops a wave boundary layer (WBL, C) and wave bed shear stress (τw,bed). The growth of this WBL is limited when a seagrass canopy of sufficient density is present (D). Additionally, a wave-driven shear stress is created at the top of the canopy (τw,rough) due to its interaction with the waves.
Many coastal environments are characterized by having much larger bottom roughness than a bare sandy bed. This roughness can range from boulders and rocky substrata to canopies formed by seagrass meadows, coral reefs, mangroves and kelp forests. These canopies modify the vertical flow structure near the bed, attenuating the mean currents and wave velocities, which alters the distribution of turbulent shear stresses within the water column (Ghisalberti and Nepf, 2002; Nepf, 2012). When mean currents interact with seagrass meadows (and canopies in general), the largest shear stresses τc,rough occur at the top of the canopy due to the vertical gradient in velocity created by the drag discontinuity at that height (Luhar and Nepf, 2011; Abdolahpour et al., 2018; Figure 1B). Note that a summary of all notations that will be used in this paper is provided in Table 1. The canopy drag forces then attenuate the in-canopy flow, which reduces the shear stresses exerted on the bed(τc,bed). Dimensional reasoning suggests that when spatially averaged, this bed shear stress is related to the (i) canopy density, (ii) canopy/submergence depth and (iii) the contribution of wake turbulence to the near-bed flow (Nepf, 2012).

Table 1. Summary of the notation used within this manuscript.
If the wind is consistent and the fetch sufficiently large, locally generated wind-waves can drive oscillatory flows. These flows also interact with the bed to form a thin wave boundary layer (WBL) (Figure 1C). Due to the oscillatory nature of the flow, this WBL has variable thickness, which is a function of the maximum shear velocity within a wave cycle (u*,max) and the wave angular frequency (ω) (Grant and Madsen, 1979). We note that the shear velocity (u*) and shear stress (τ) are used interchangeably in this paper as they are related based on seawater density ρwthrough . In addition to the bottom WBL, wave-generated flows that interact with a canopy create another region of shear at the top of the canopy (Figure 1D), due to drag imposed by the canopy. As a consequence of these mean shear stresses, wave-driven mean currents can be generated within the meadow (Luhar et al., 2010; van Rooijen et al., 2020). Due to how wave-driven pressure gradients interact with canopy drag and inertial forces, the oscillatory flows generated by waves are less attenuated within a seagrass canopy when compared to an unidirectional flow, with high-frequency waves also less attenuated than longer period swell waves (Lowe et al., 2005; Nepf, 2012). As sheltered, sea-breeze-dominated environments are more likely to be dominated by locally generated waves, the high-frequency waves portion of the spectrum tends to be more important for sediment resuspension (Lawson et al., 2007).
The nonlinear interactions between waves and currents largely present in field measurements influences the shear stresses exerted on a bed, which consequently affects how sediment is resuspended. Wave-current interactions result in bed shear stresses that are larger than a simple vector summation of the contributions from the current (τc,bed) and wave motions (τw,bed) (Grant and Madsen, 1979; Shaw and Trowbridge, 2001; Soulsby and Clarke, 2005). Thus, it is common to represent bed stresses by their mean (τm) and maximum (τmax) values. τm represents the average stress over a wave cycle due to waves and currents, and has been suggested to be important for the diffusion of sediment into the flow outside the WBL, thus controlling the shape of the SSC profile (Soulsby and Clarke, 2005). τmax, representing the maximum stress over a wave cycle due to waves and currents, often controls the grain sizes capable of being suspended from the bed (Grant and Madsen, 1979; Soulsby and Clarke, 2005; Malarkey and Davies, 2012).
Understanding the interactions of waves and currents with seagrass canopies is critical to predict sediment resuspension in environments where canopies are present. Due to the challenges with measuring these processes in situ in the field, studies have tended to focus on those (1) derived under controlled flume experiments, using physical models that aim to mimic the canopy with idealized forcing conditions (Chen et al., 2007; Yang and Nepf, 2019; Marin-Diaz et al., 2020); or (2) using field measurements taken from above the meadow and predicting the hydrodynamic-sediment transport processes in the canopy (e.g., Hasegawa et al., 2008; Bradley and Houser, 2009; Infantes et al., 2012). However, as the seagrass modifies the vertical structure of the flow, for many canopy systems the bed shear stresses are often much smaller than the shear stresses at the top of the canopy (τbed ≪ τrough) (Le Bouteiller and Venditti, 2015). Therefore, inferring sediment resuspension in the presence of canopies from depth-averaged velocities measured above the roughness layer and applying a friction coefficient tends to overestimate sediment transport. This has been supported by flume experiments (Bouma et al., 2007; Le Bouteiller and Venditti, 2015) and in the field (Bouma et al., 2007; Pomeroy et al., 2017), for studies of both aquatic vegetation and over coral reef canopies.
There is a need for field observations of sediment transport processes in seagrass meadow that include in-canopy measurements to fully assess how flow modifications by the canopies locally affect sediment resuspension in these coastal environments. Near-bed measurements within the seagrass meadow calculating the wave and current contribution to bed shear stress are not common, with some exceptions (see Reidenbach and Thomas, 2018). Following the methodological approach by Pomeroy et al. (2017), who studied suspended sediment transport over a coral reef canopy, this paper investigates how seagrass meadows modify hydrodynamic and sediment transport processes using direct in-canopy near-bed measurements.
To quantify flow attenuation and sediment dynamics within a sheltered seagrass meadow, we identified a site where: (1) both a bare bed and a seagrass canopy were in close proximity, (2) there was minimal incident swell with a small tidal range (i.e., a low energy environment) and (3) the forcing (in this case due to the sea-breeze) was highly variable over 2 weeks, such that different conditions could be evaluated. The selected study site was located on the eastern side of Garden Island in Cockburn Sound, approximately 30 km south of Perth, Western Australia (Figure 2). The shallow and sheltered environment found in Garden Island is representative of many other seagrass sites around the world, where there is often greater diversity of seagrass species when compared to sites exposed to energetic swell (Lee Long et al., 1993; Copertino et al., 2016). The study site provides suitable habitat for the abundant and dense seagrass patch found there, with 10 different species of seagrasses being found within the Sound, mostly dominated by the Posidonia genus (Silberstein et al., 1986).
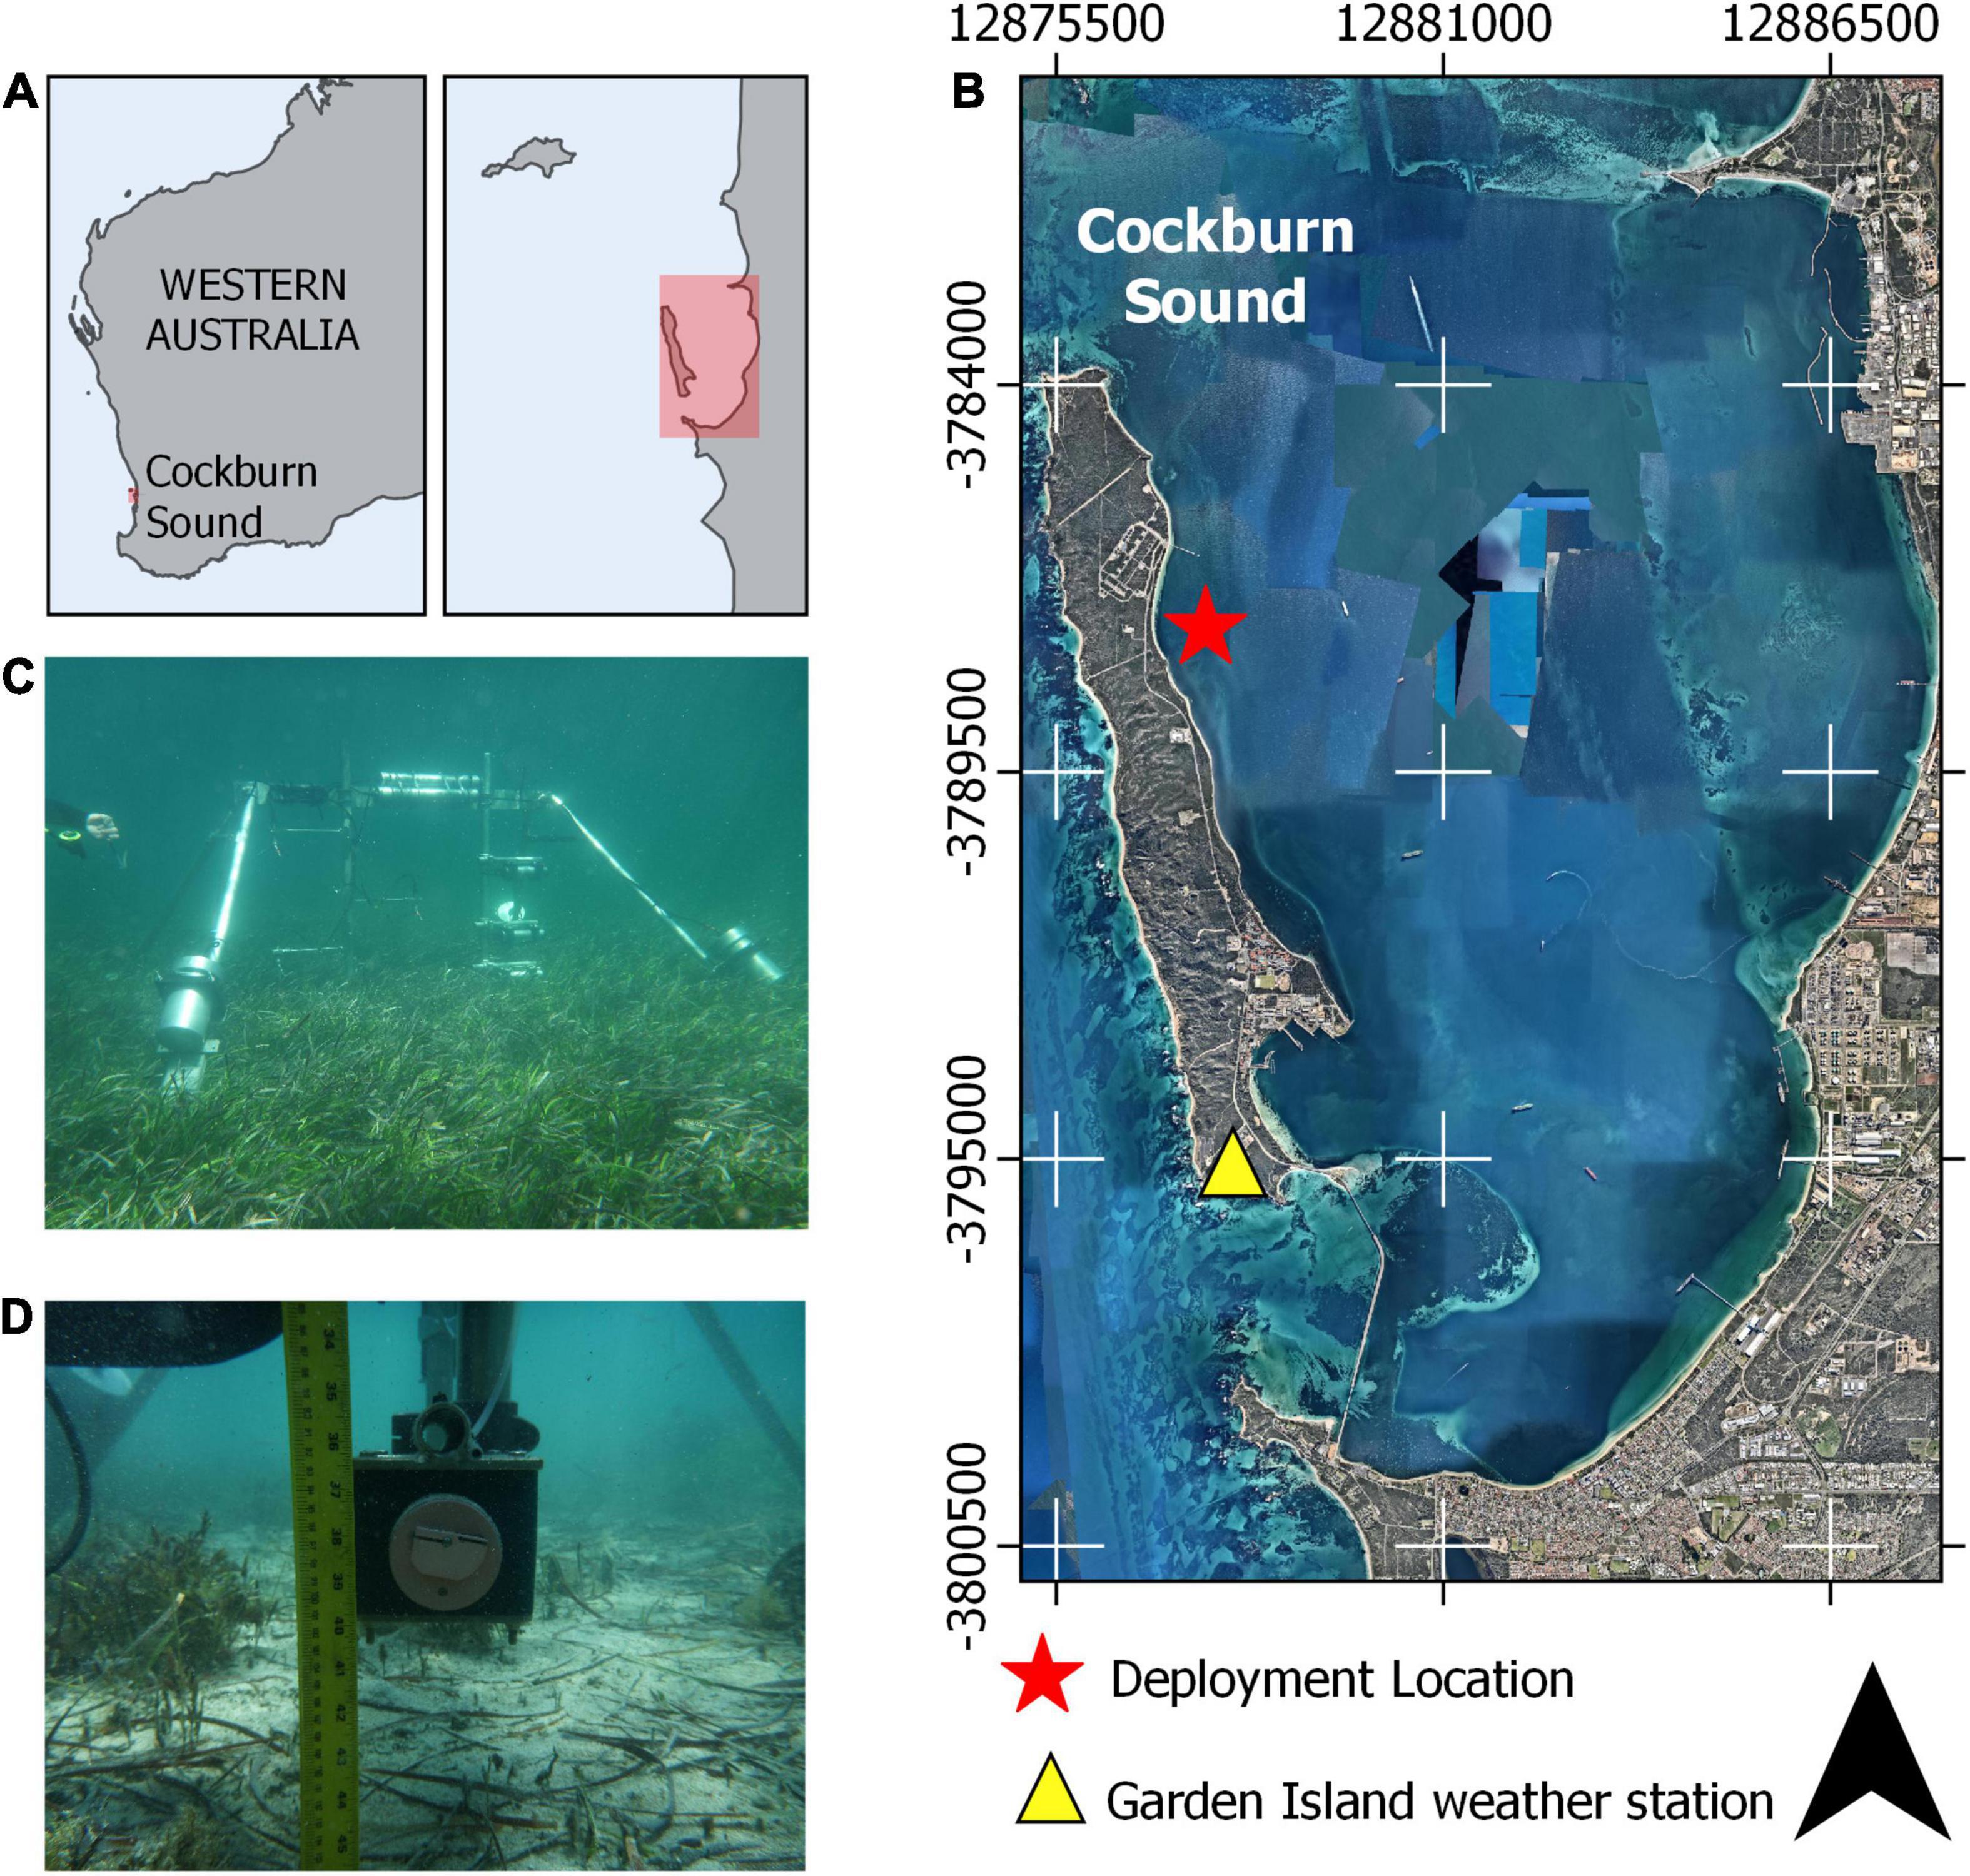
Figure 2. Instrument frame deployment location relative to (A) Western Australia and within (B) Cockburn sound. (C) Underwater photos of the instruments positioned over a seagrass canopy and (D) over a bare bed with the optical backscatter sensor and sediment intake port shown. The red box in (A) represents the approximate region shown in (B).
Garden Island, along with offshore reef systems, mostly shelters the site from offshore swell waves. The study site experiences a micro-tidal regime with a mean range of only 0.4 m (maximum spring tide range 0.6 m), which results in low tidal currents within Cockburn Sound of between 0.05 and 0.1 m s–1 (Ruiz-Montoya and Lowe, 2014). Along this section of the Western Australian coast, the presence and location of atmospheric pressure troughs and their interaction with geostrophic offshore winds drive one of the strongest and most persistent sea-breeze systems in the world. While the mean sea-breeze speed is around 8 m s–1, it frequently exceeds 15 m s–1 and can be as high as 20 m s–1, particularly during the summer months (Masselink and Pattiaratchi, 2001). This sea-breeze cycle, combined with the low tidal range and the attenuation of swell waves, often results in strong daily cycles of the hydrodynamic (Gallop et al., 2012) and sediment transport processes (Masselink and Pattiaratchi, 2001).
A 2-week field experiment (16–31 October 2015) was conducted using an instrument frame (Figure 3) deployed sequentially over a dense seagrass meadow and then a sandy bed. The instrument frame was first deployed over a dense Posidonia seagrass meadow (the “canopy” site) for 7 days. The seagrass canopy at the site had a shoot density of 400 ± 88 shoots m–2 and average height of 35 ± 3 cm when fully upright. This study was part of a larger experiment, with detailed properties of the seagrass meadow reported in Olsen et al. (2018). After the first 7 days, the instrument frame was then moved approximately 40 m to an area with no seagrass (the “bare bed” site). The water depth at both sites was ∼1.5 m. The proximity of these two sites enabled us to isolate the impact of the seagrass canopy on the hydrodynamics and sediment transport processes.
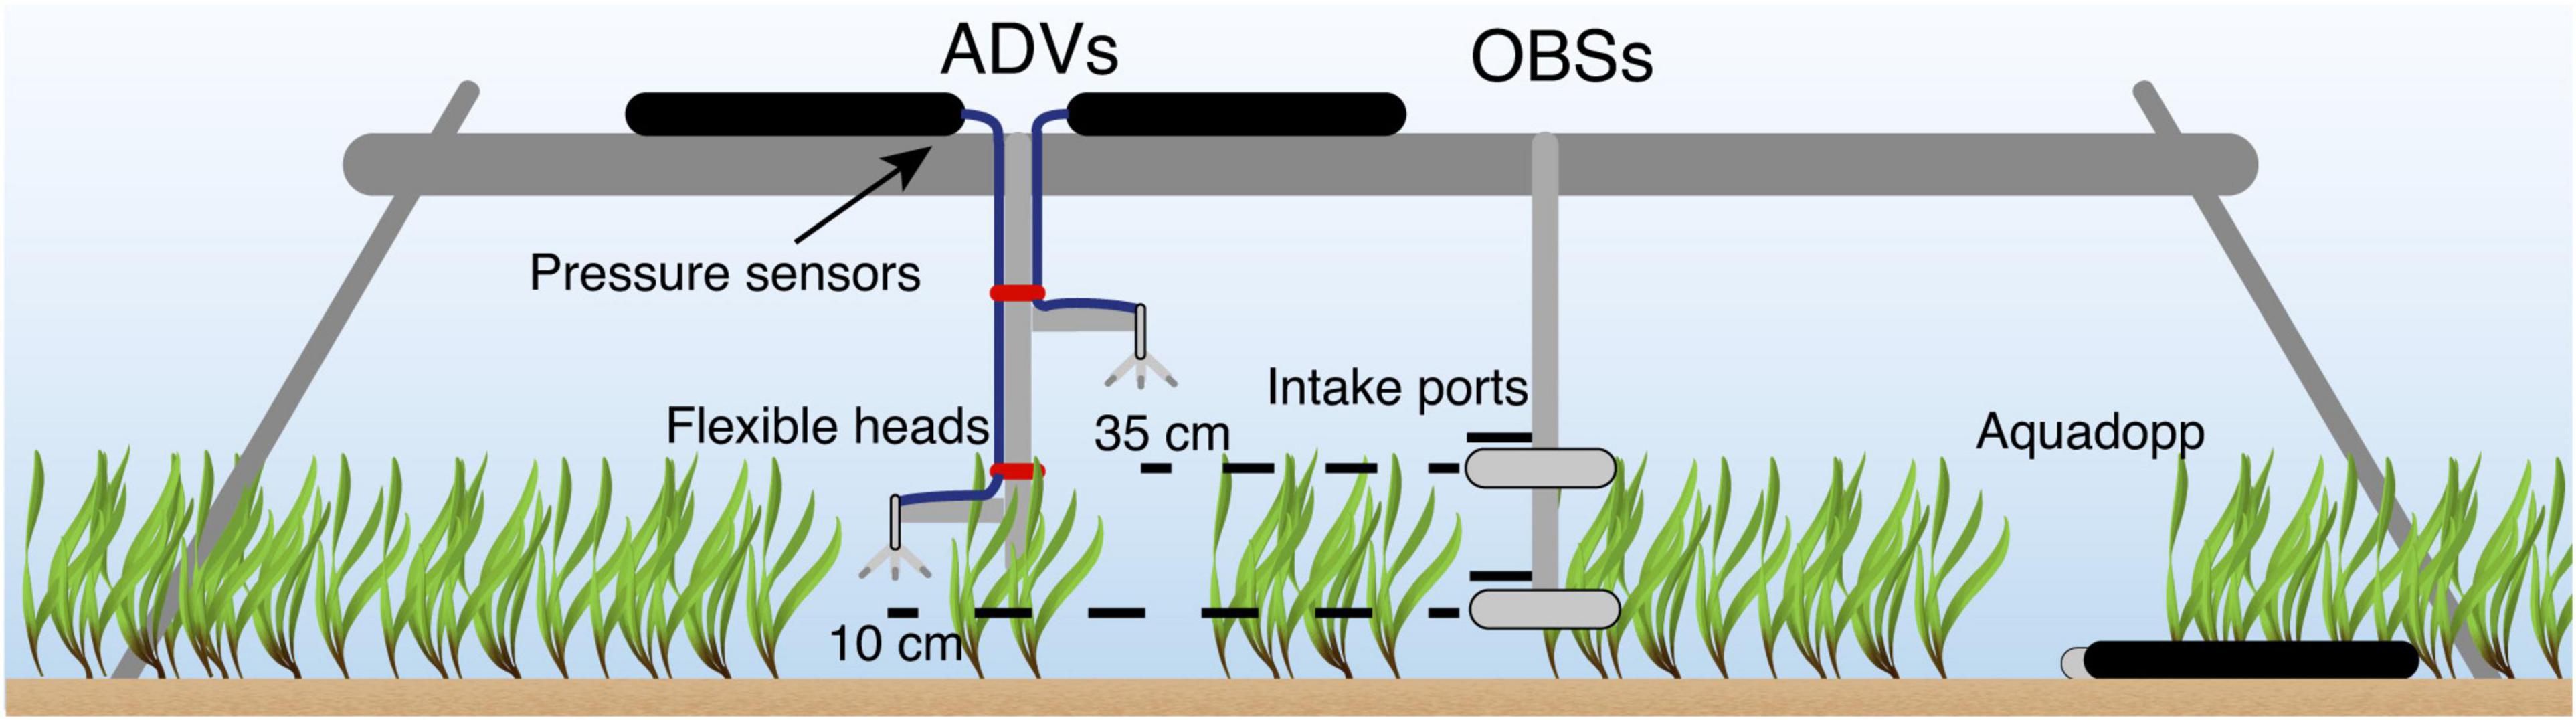
Figure 3. Schematic of the instrument frame used during the experiment.
A Sea-Bird Eco FLNTU Optical Backscatter Sensor (OBS) and a Nortek Vector Acoustic Doppler Velocimeter (ADV) were positioned ∼10 cm above the bed (cmab), which sampled within the seagrass canopy and will be hereafter referred to as the “bottom” ADV and OBS (Figure 3). A second pair of ADV and OBS was placed ∼35 cmab (hereafter referred to as “top”), which was the height of the seagrass canopy when fully extended. Each ADV measured horizontal and vertical velocities at 8 Hz for 2048 s (∼34 min) while the OBS sampled at 1 Hz for 20 s every 5 min. At both deployment locations, current velocity profiles were measured with an upward facing Nortek Aquadopp Profiler with High Resolution mode enabled (ADP) that was positioned on the bed alongside the other instrumentation and sampled continuously at 1 Hz with a cell size of 4 cm. We carefully trimmed a small patch of ∼15 cm diameter (roughly the ADV probe size) of seagrass blades around the ADV, ADP and OBSs. This procedure is widely used (e.g., Hasegawa et al., 2008; Abdolahpour et al., 2017; Reidenbach and Thomas, 2018) to minimize potential interference with the instruments. The interference is expected to be small, as the study site is situated well within a dense meadow, so that the flow would still be affected by the surrounding seagrass. High frequency wind waves were expected to dominate at this site but also more attenuated with depth. To ensure we captured the high frequency wind waves, we located the ADV canisters with pressure sensors at the top of the frame (∼120 cmab). Wind data used in this study were extracted from the Garden Island Weather Station (Figure 2), located less than 7 km from the deployment site and managed by the Australian Bureau of Meteorology.
Pressure time series data recorded by the ADVs were used to quantify wave conditions. Each burst of data was split into two ensembles of 8,192 samples (∼17 min). Pressure spectra were then determined by applying a Fast Fourier Transform with a 512-point Hamming window to the timeseries, which were then converted to wave (surface elevation) spectra using linear wave theory. From the wave spectra, the significant wave-height ( and the mean wave period ( for the wind-sea (0.125–1 Hz) and swell waves (0.05–0.125 Hz) were calculated separately from the nth-order spectral moment mn through integration of the energy within these respective bands.
The raw ADV and ADP velocity measurements were initially filtered based on low signal correlation with the threshold (60%) recommended by McLelland and Nicholas (2000). Velocity spikes in the remaining data caused by debris and seagrass blades that entered the sample volume were removed with a kernel-based algorithm (Goring and Nikora, 2002). To calculate the attenuation of the flow inside the canopy, as well as an estimate of the bed shear stress exerted on the sediment, velocity data was decomposed into a fluctuating (wave and turbulence) velocity component and a mean current component. The wave velocity direction was calculated from the covariance matrix applied to the fluctuating velocity component (Emery and Thompson, 2001), , where x and y are the velocities measured by the instruments in relation to its own compass and the overbar represents the time-averaged velocity. Within each burst of data, the wave angle relative to the instrument is defined as:
and the current angle is defined as:
For each burst, the mean velocity component was removed and the remaining oscillatory (wave) component was rotated into a coordinate system using ϕw so that the maximum velocity variance within the burst was along the principal (major) axis. The root-mean-squared wave velocity (urms) in every measurement cell over the water column was then estimated from the velocity spectra derived from the rotated data:
where Sxx and Syy represent the spectral densities of the horizontal velocities after removing the mean velocity for each burst and fi represents the ith frequency component (from 0.05 to 4 Hz for the ADVs and from 0.05 to 0.5 Hz for the ADP).
To quantify the attenuation of the flow inside the canopy, we calculated the attenuation parameter α (Lowe et al., 2005), which represents the ratio between the flow velocities within the canopy region and the flow velocities above the canopy. The time-averaged value for the mean velocity component case, αc is the simple ratio using the 15 min-averaged velocities. To evaluate the wave attenuation due to the canopy interaction for each frequency, we first determined a correction factor that accounted for the natural decay of wave orbital velocities below the free surface (i.e., independent of canopy drag), as predicted from linear wave theory:
where ki is the wave number of the ith component of the wave spectrum; d is the distance from bed; subscripts bed and refers to the measurements close to bed and at a measurement location above the canopy, respectively. Thus, for the wave attenuation, the αw value was determined as the ratio between urms,bed (correcting the attenuation accordingly for each frequency) and the free stream (urms,):
To quantify the mean and maximum stresses at the bed (τm,bed and τmax,bed) as well as in the roughness layer (τm,rough and τmax,rough) both with and without the canopy, we used the approach proposed by Soulsby and Clarke (2005) as adapted by Malarkey and Davies (2012). The differences between Soulsby and Clarke (2005) and Malarkey and Davies (2012) and other models such as Grant and Madsen (1979) and Madsen (1994) are: (1) the current velocity at the interface of the boundary layer and the overlying fluid is assumed to be steady; (2) iteration is not required to find a solution as the effective (total) friction velocity and WBL thickness are not calculated from the combined wave and current quantities, but rather is inferred from a wave-only friction velocity; and (3) the oscillatory component of the stress is not enhanced by the current; thus, τm and τmax can be calculated independently. In the Soulsby and Clarke (2005) method, the shear stresses τm and τmax are calculated by superposition of the waves and currents at an angle ϕ, using: the water depth (h), the seabed roughness, the near-bed wave velocity amplitude (representative bottom orbital velocity ubr = urms), wave period (T) and the depth-averaged current (. The key adaptation made to the Soulsby and Clarke (2005) method by Malarkey and Davies (2012) was that instead of , the calculation considers u(d). This enables point measurements at height d to be used in the analysis. While τm determines the friction imposed on currents and contributes to the diffusion of sediment into the upper flow, τmax is responsible for the initiation of the sediment motion as well as near-bed diffusion. τm is expected to be greater than τc, and τmax to be greater than the vector sum of τc and τw (Soulsby and Clarke, 2005). These methods have been successfully applied to estimate mean and maximum bed shear stresses accounting for the attenuation of the near-bed flows by the canopy, including coral reefs (Pomeroy et al., 2017, 2021), saltmarsh (Chen et al., 2020) and benthic feeding tubes (Egan et al., 2020, 2021).
To calculate a hydraulic roughness (z0) for the canopy site, we followed the methodology described by Pomeroy et al. (2017), who considered z0 = z0a, the hydraulic apparent bed roughness due to wave-current interaction. For every 15 min of data, we evaluated the logarithmic fit with the mean velocity data through the water column (starting at the top of the profile and sequentially adding the bottom cells until the fit deviated substantially, as defined by linear regression). We observed that the best fit was consistently found for the region that coincided with the top of the canopy (∼0.35 m) up to ∼5th highest cell (d = 0.92m). Applying the “law of the wall” (Raupach et al., 1991) to that region, we then calculated u*c,rough and z0. Conversely, to estimate the bed shear stress at the bare site where the bed roughness was governed by sandy bed sediment, we defined z0 = 2.5D50/30.
We next used the Malarkey and Davies (2012) set of equations to calculate the mean stress τm as well as the maximum stress τmax:
We calculated the angle ϕ as the absolute angle difference between ϕw and ϕc. To calculate τw, a wave friction factor fwr needs to be specified. We used the formulation proposed by Lawson et al. (2007), which accounts for different wave frequencies:
where A = ubrTm02/2π is a representative wave orbital excursion, ks = 3D84 and D84 is the grain diameter for which 84% of the sediment is smaller. Finally, in our application of the Malarkey and Davies (2012) formulation, we defined the WBL thickness (δ) in terms of wave-alone friction velocity u*w and a time-invariant eddy viscosity. The lower limit of the WBL thickness was set to be δ > D50, as the WBL cannot be thinner than the diameter of the bed sediment. Inside the WBL the eddy viscosity was a function of the effective shear stress, while outside the WBL the eddy viscosity was calculated following Grant and Madsen (1979).
We note that there were periods where the bottom ADV data included spikes, due to occasional interference with moving seagrass blades, that resulted in a time series with several gaps. As a consequence, data from the bottom ADV was only used to quantify the mean currents within the canopy. To estimate u*,bed we instead used data from the first cell of the ADP, which was located ∼21 cmab but still within the seagrass canopy.
We collected and analyzed three ∼500 g superficial (between 5 and 7 cm) bed sediment samples from each site. To obtain a grain size distribution, the bulk bed samples were first split using a riffle splitter and then subsampled into individual replicates with a micro riffle splitter. Particles greater than 2 mm were removed with a sieve. The samples were then immersed in a solution of 10 mL of alkaline sodium hexametaphosphate and 800 mL of deionised water, and ultrasonically stirred for 60 s before being subjected to laser diffraction analysis (Cheetham et al., 2008; Di Stefano et al., 2010) using a Malvern Mastersizer 2000 (Malvern Instruments Ltd., Malvern, United Kingdom). Laser diffraction analysis converts optical scatter from a sediment sample into a grain size distribution using a specified optical model. For sand-sized particles, the use of different optical models has been shown to have a negligible impact on the results (Blott and Pye, 2001). In this study we used Mie theory, which describes the propagation of the electromagnetic wave of light in space taking into account the light transmission (Di Stefano et al., 2010). In our study, we assumed a refractive index of 1.650.
To understand the impact of hydrodynamics in sediment resuspension, a time-series of SSC was estimated from the OBS turbidity measurements. The OBS data was calibrated with 2 L water samples that were obtained at hourly intervals (over a number of days) during the experiment. The samples were collected using peristaltic pumps via intake ports collocated with the OBS instruments and oriented perpendicular to the dominant flow. In this low energy environment, inefficiencies or bias in particle capture are expected to be minimal (Bosman et al., 1987). The in situ samples were pumped through a LISST 100X particle size analyzer to obtain a suspended sediment grain size distribution, and then vacuum filtered onto pre-weighed membrane filters (Whatman ME27, 0.8 mm), dried (75°C for 24 h) and weighed to calculate the SSCs.
To relate the suspended sediment grain size distribution to the shear stresses above and within the canopy, we determined the equivalent grain size that could be suspended by a given shear velocity based on the downward particle fall velocity (ws). We adopted the formulations by Soulsby (1997):
with dimensionless grain size D*
where D is the sediment grain size in suspension, ν is the water kinematic viscosity at , g is the gravitational acceleration (9.8m s−1), s is the ratio of carbonate sediment grain density (assumed to be ρs = 2,600kgm−3 at the site to water density (ρw = 1,026kg m−3). As the state of suspension is not within the scope of this work, we assumed fully developed suspension, ws = u*, which in our analysis was then used to defined a critical velocity u*,cr to suspend the sediment from the bed (Table 2). If the inferred shear velocity calculated from the measured data overcame the threshold calculated from Eqs 8 and 9, we expected to see a signal registered in the time series measured by the OBSs.
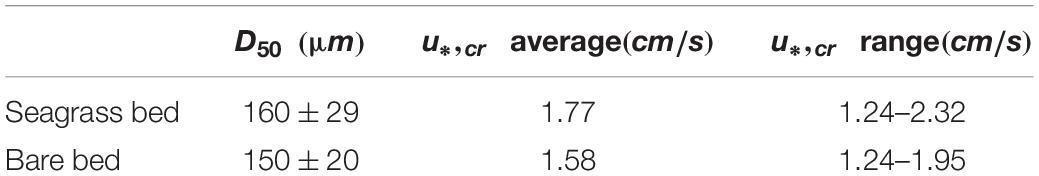
Table 2. Mean and maximum sediment size (D50) for samples taken in situ in both bare bed and canopy sites.
The diurnal sea-breeze cycle, which varied in direction and magnitude throughout the day as well as over a number of days, was the dominant forcing throughout the field experiment. During a typical day, the sea-breeze cycle followed a similar pattern. In the morning, the wind direction ranged from 70 to 120° (easterly wind) and was low in magnitude (1–5 m/s). In the afternoon, the wind direction rotated anti-clockwise to a southerly shore-parallel wind (180–230°) and increased in magnitude (5–10 m/s). The peak wind speed typically occurred between 16:30 and 19:00 (Figure 4A).
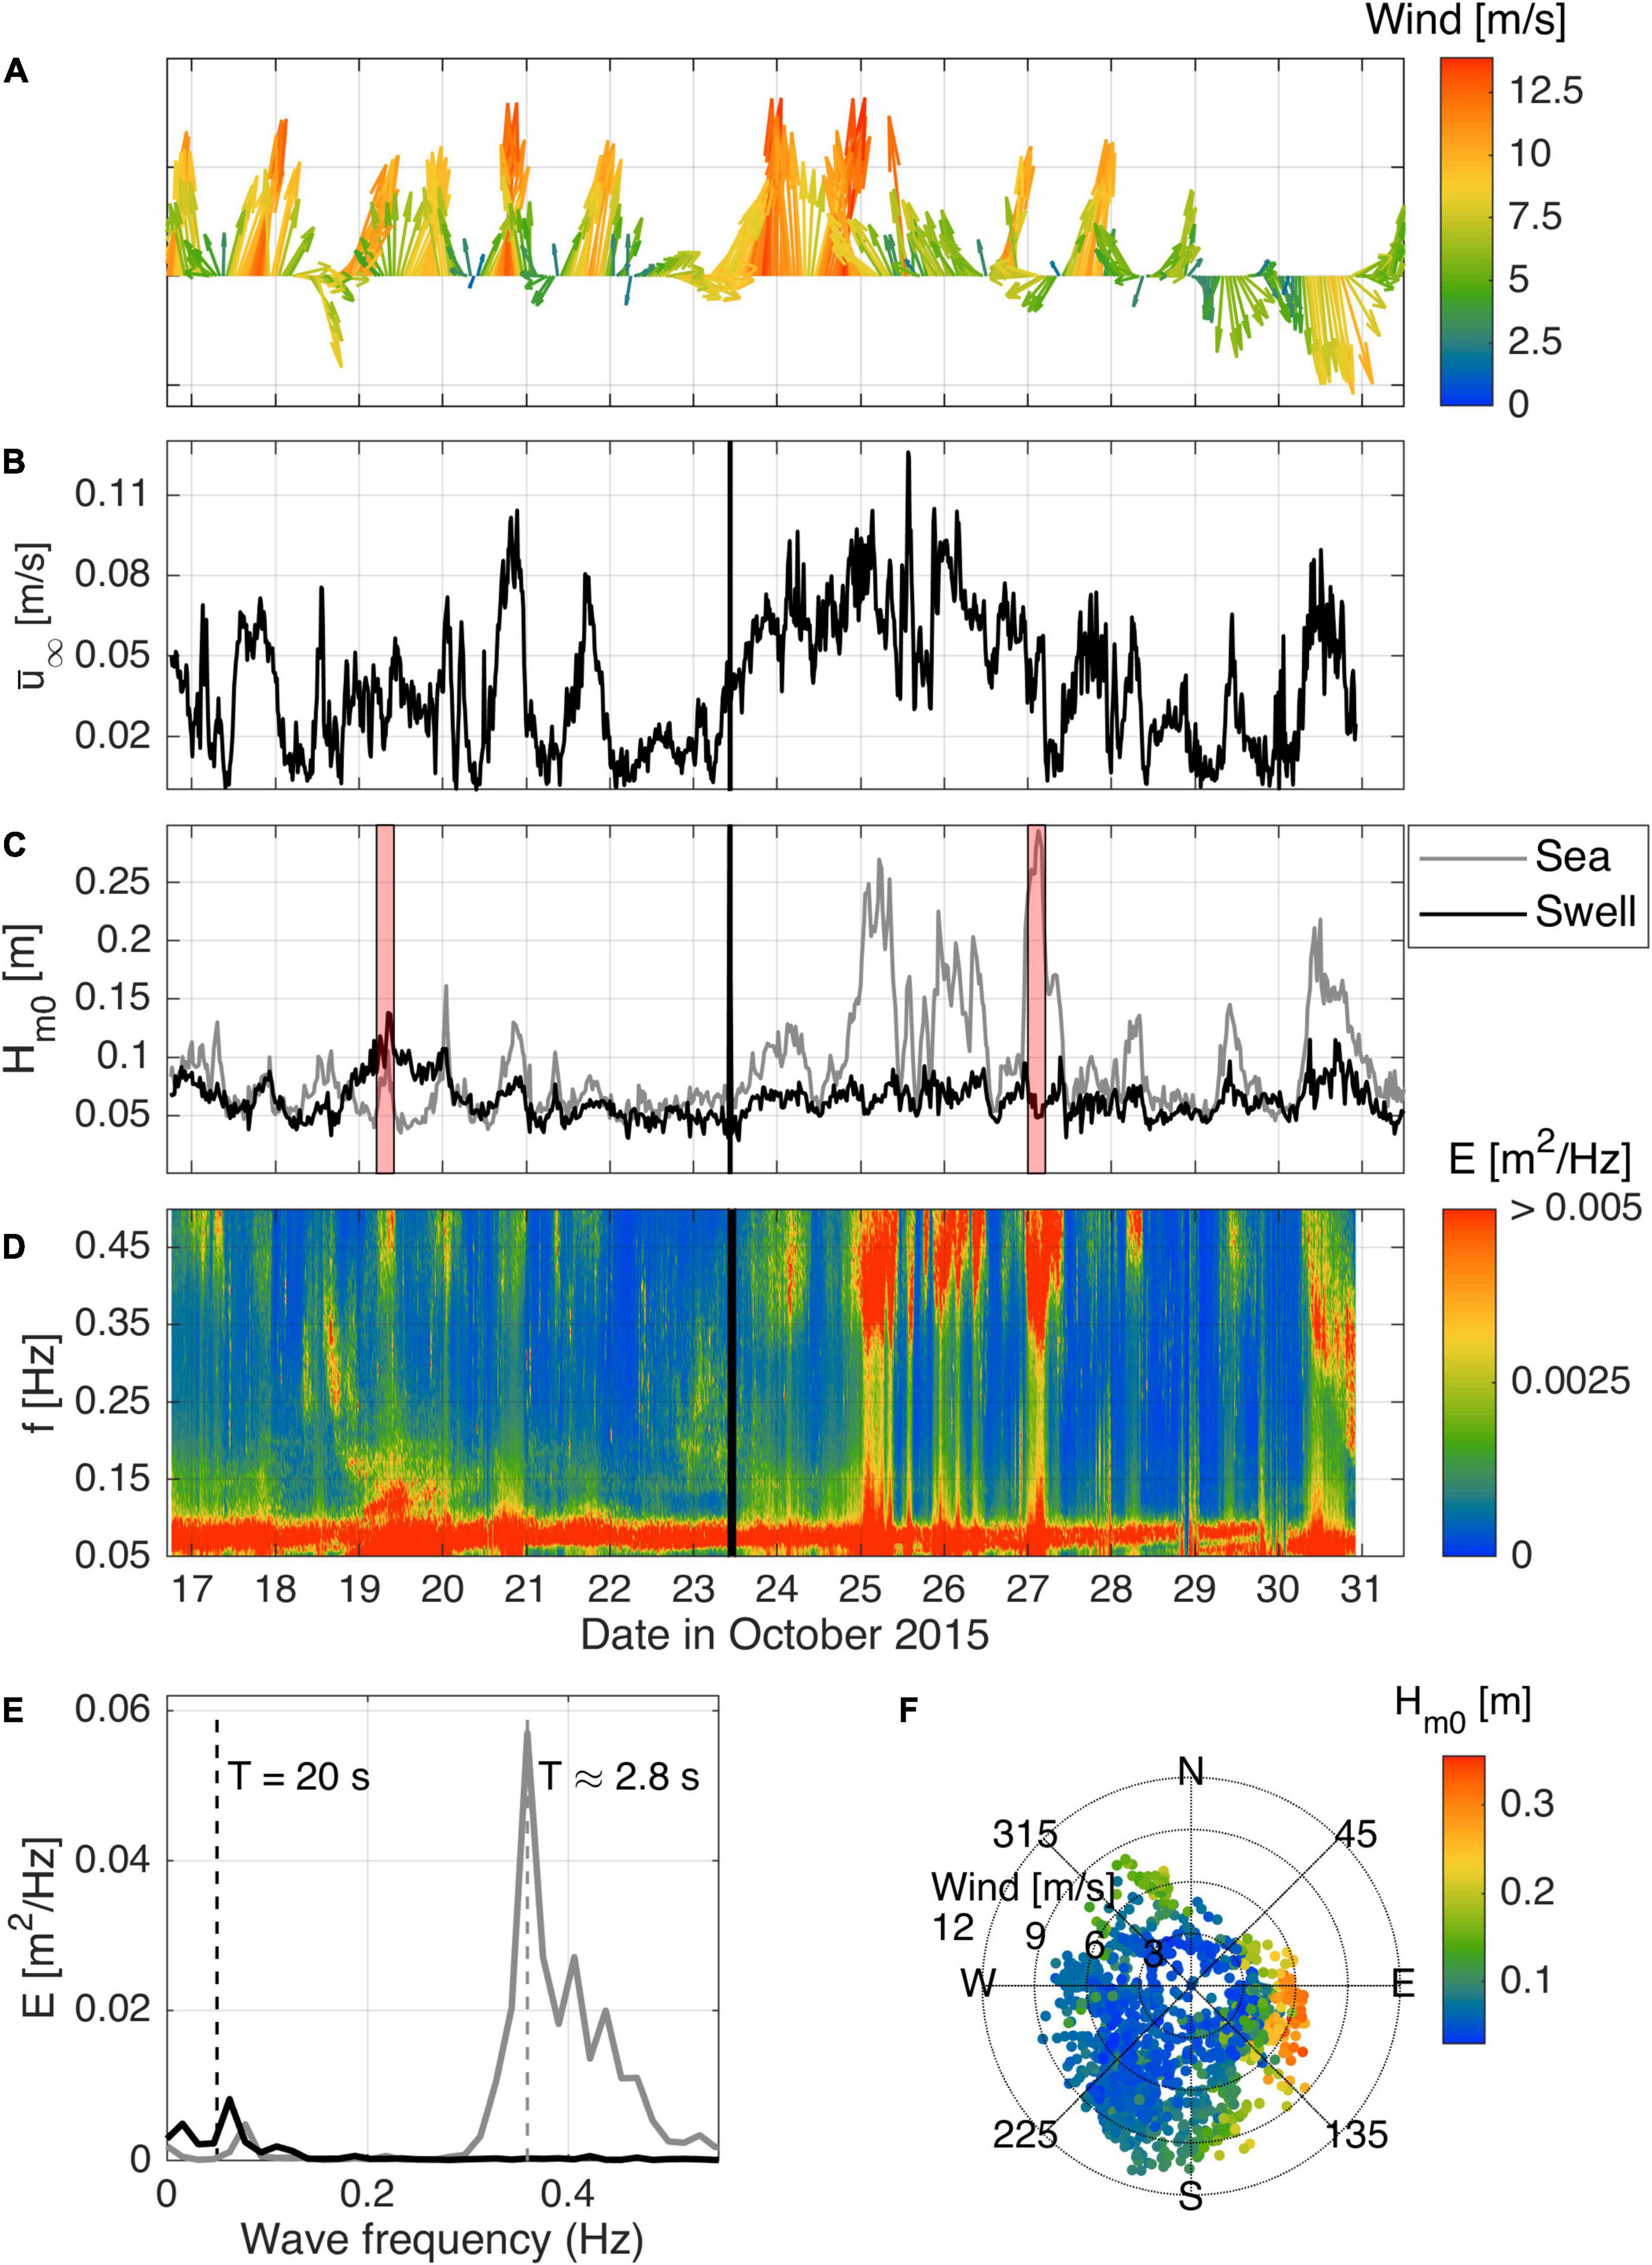
Figure 4. Local forcing conditions during the field experiment. (A) Wind speed and direction time series from the weather station at Garden Island (see Figure 2); (B) free-stream velocity measured by the ADP at 100 cmab; (C) decomposed sea and swell significant wave heights; (D) time series of wave spectra, where the colorbar was cut to emphasize the high-frequency, lower-energy part of the spectra; (E) typical wave spectra for swell- (black) and sea-dominated (gray) conditions; (F) directional scatter plot showing wind speed and wave height (colored dots). The black line in (B–D) indicates when the instrument frame was moved from the canopy site to the bare bed site (23/10/2015 10:00). The red patches in (C) identify the periods for which wave spectra in (E) were calculated.
The observed hydrodynamics varied in response to the sea-breeze cycle (Figures 4B–D). On a weak sea-breeze day (e.g., 22nd and 28th October), the increase in wind speed between the morning and afternoon was generally less than 4 m/s (peak less than 7 m/s). On these days, there was minimal increase in current speed or wave height after the onset of the sea-breeze. In contrast, during a strong sea-breeze day (e.g., 20th October) when the wind speed exceeded 10 m/s, strong mean currents were generated that lagged the wind by 1–4 h. Daily variations in the wave spectra in response to the wind are also evident (Figure 4D). With the onset of the sea-breeze late in the morning and early in the afternoon, the peak wave energy on the day occurred within higher frequencies (0.33–0.5 Hz; 2–3 s, gray line in Figure 4E), characteristic of local sea-breeze generated waves.
A persistent but weak swell wave (0.125 to 0.05 Hz) contribution was also observed throughout the experiment. Late at night or early in the morning when the sea-breeze diminished, a greater proportion of the wave energy was within this lower swell frequency range of the spectrum (around 0.05–0.07 Hz, or 14–20 s). A notable exception was the relatively large swell waves measured on the 19th October. During this event, the swell wave height (∼13 cm) was much larger than at other times during the experiment. A comparison between locally measured wave heights with offshore wave buoy data obtained from the Western Australia Department of Transport (not shown) indicate that these larger waves were related to larger offshore swell conditions (Hm0 = 2m,Tm02 = 12s) propagating to the study site within Cockburn Sound. In contrast, the three highest wave heights registered by the instruments (from the 25th to the 27th) were generated locally by strong winds, with short period waves (Tm02 = 2s) reaching heights over 25 cm on the 25th and 27th after midnight in both cases. On these days, the wind did not follow the typical sea-breeze cycle due to other atmospheric factors or the sea-breeze directional pattern was unclear. Despite the dominant direction of waves from the south for most of the experiment, the bigger waves on those days originated from the east (Figure 4F). When winds are blowing from this direction, they have enough fetch (roughly 10 km) to develop and generate waves from 5 to 27 cm and periods that varied from 2.5 to 3 s (Figure 4D), which peaked in the early hours of the following day, e.g., 2 a.m. on the 25th October (25 cm) and 4 a.m. (27 cm) on the 27th October.
The flow attenuation within the seagrass canopy varied over the experiment (Figures 5A,B). Although the free-stream values of the mean current and wave orbital velocities were often similar in magnitude during the experiment (up to ∼10 cm/s), the mean current velocities within the canopy were much more attenuated than the wave velocities (Figure 5C). On average, mean current velocities within the canopy were much smaller than above the canopy (averaging αc = 0.35, Figure 5D), a value much lower than calculated based on the root-mean-squared of wave velocities (averaging αw = 0.83, Figure 5E). When comparing flow attenuation for different portions of the wave spectrum (not shown), we found that values were comparable to the bulk (root-mean-squared) values (αw∼0.9) for wave frequencies between 0.06 and 0.2 Hz, but slightly lower for very low frequencies (< 0.01 Hz) and very high frequencies (> 0.35 Hz, αw∼0.7). As natural wave attenuation over depth according to linear wave theory (i.e., for inviscid, irrotational waves) is accounted for in the attenuation parameter calculation (Eqs 4 and 5), the observed attenuation is thus due to the influence of canopy forces alone.
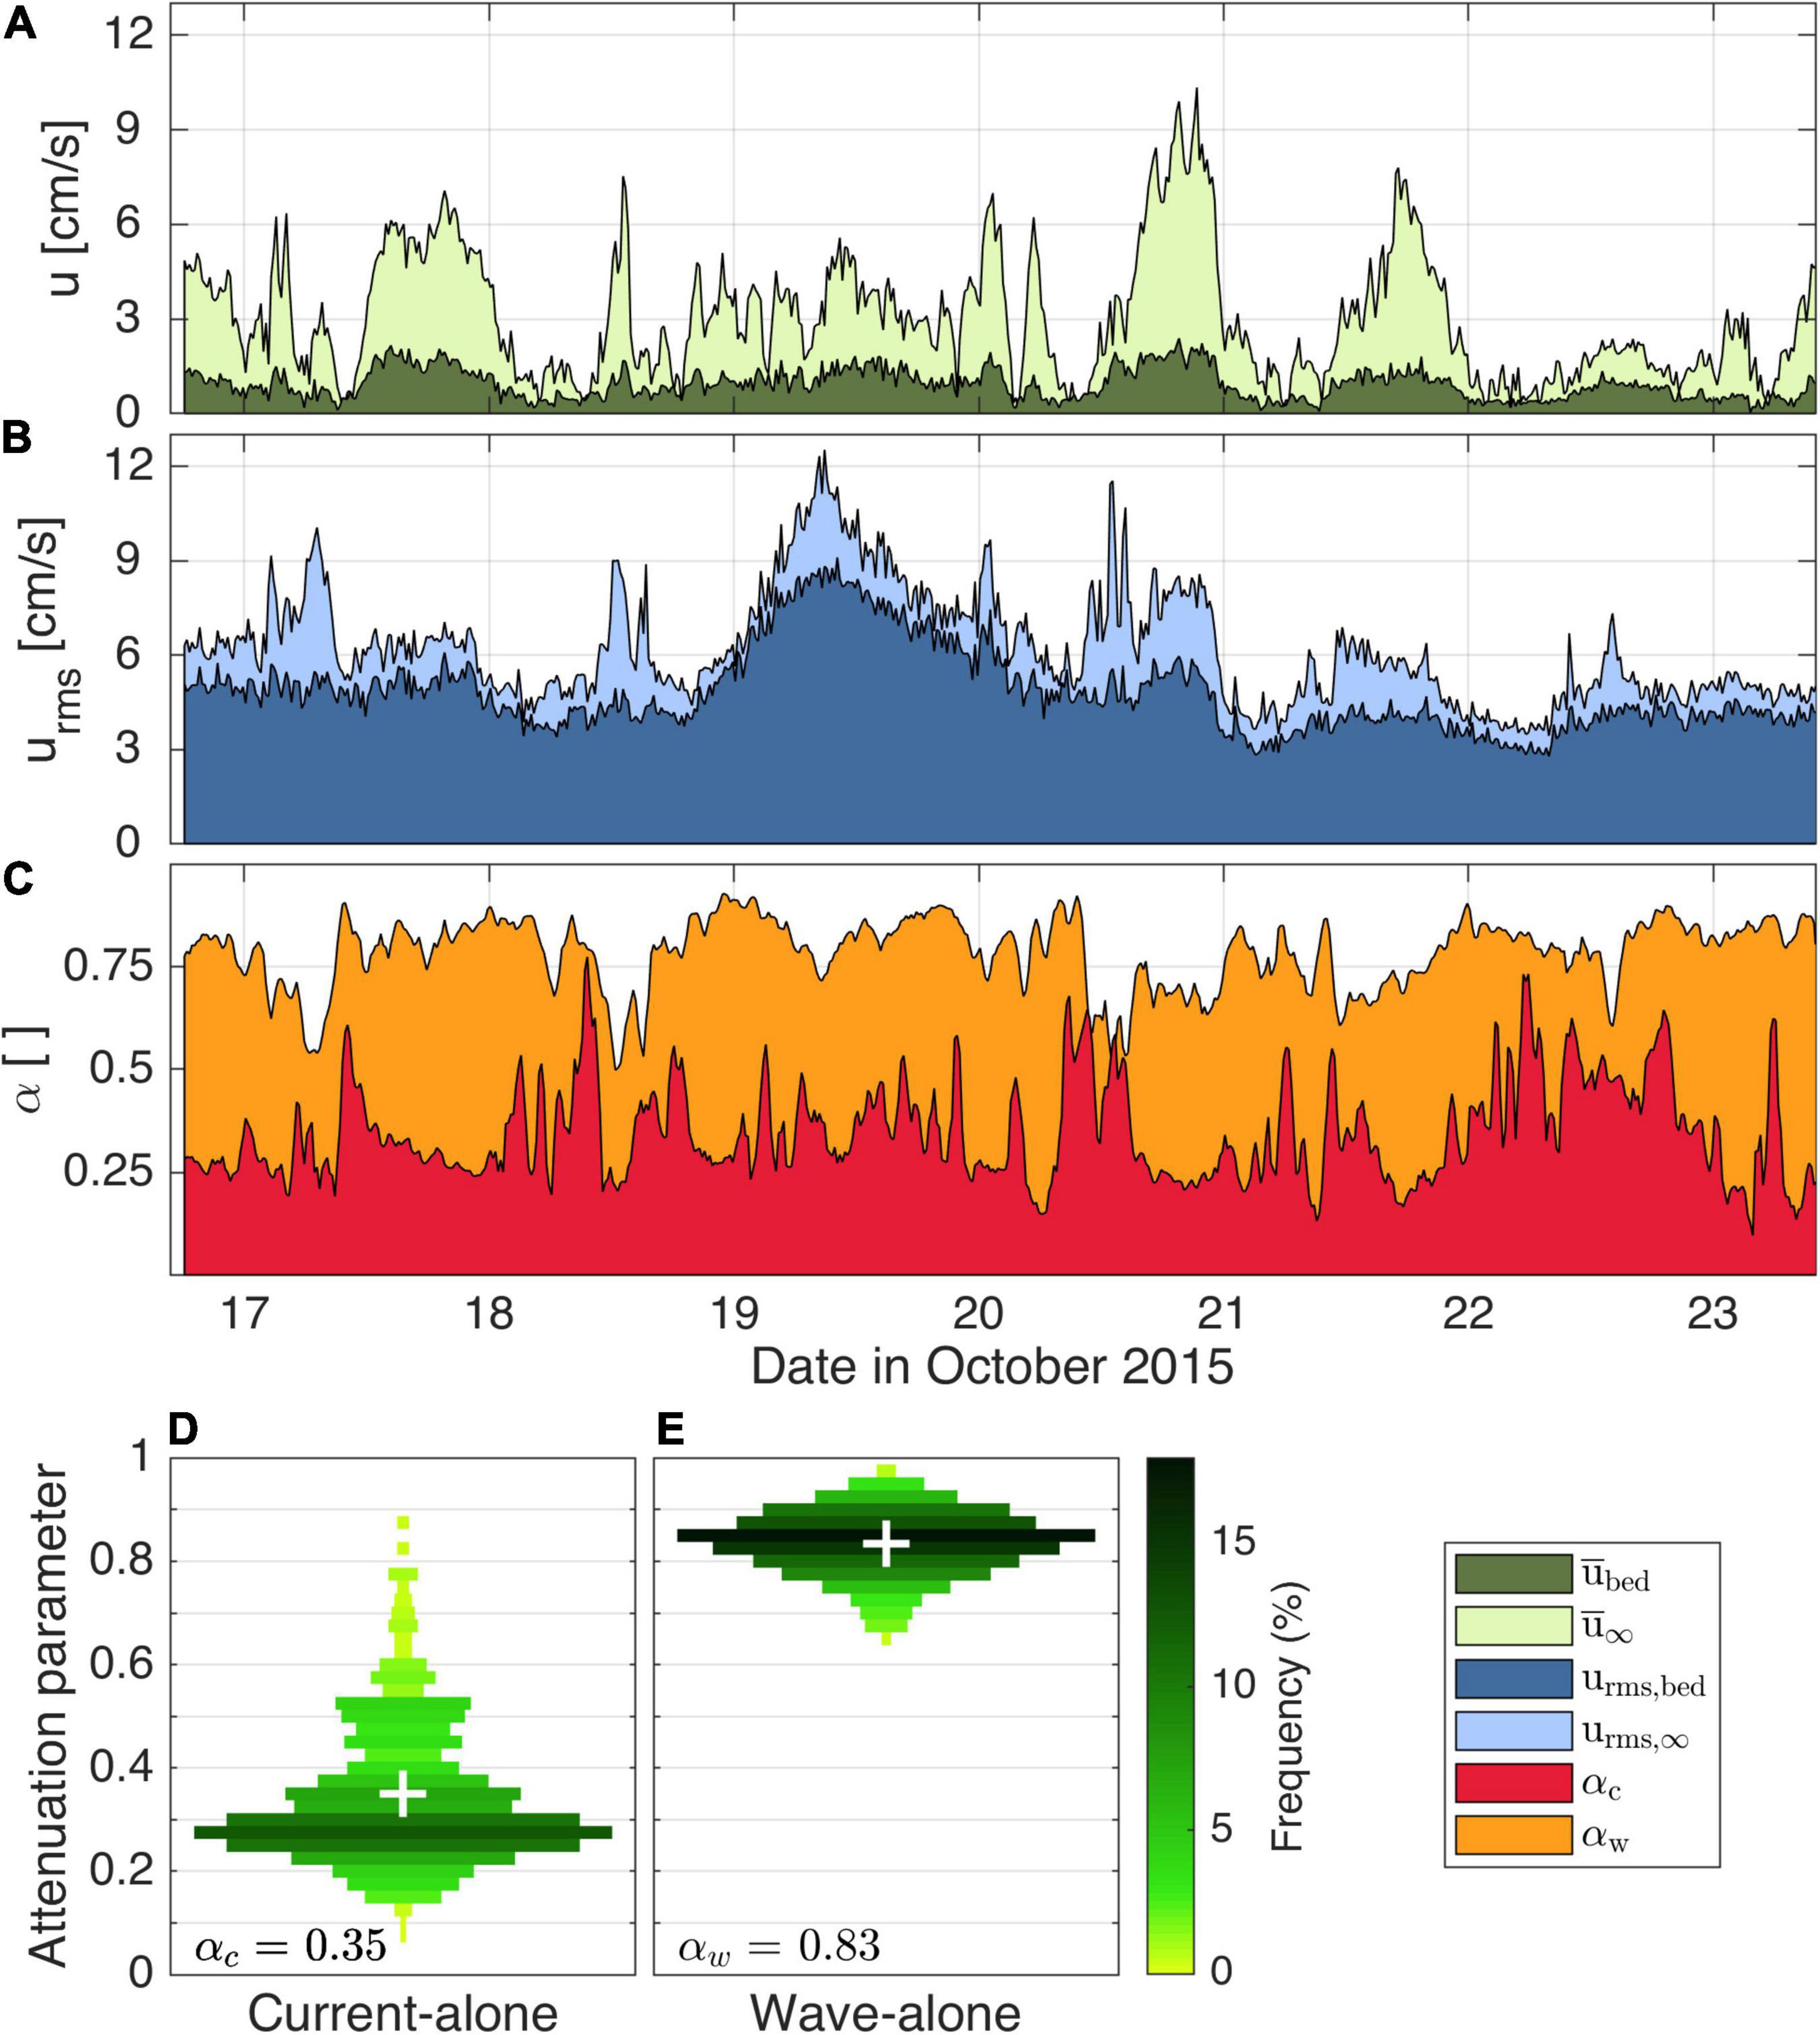
Figure 5. Current (A) and wave orbital (B) free stream and bottom velocity time series during the canopy experiment, with (C) ratio of bottom velocity to free stream in both current and wave orbital cases. (D) Shows the violin plots of time-averaged current attenuation parameter, αc and (E) shows the time-averaged wave attenuation parameter, αw within the seagrass meadow. In (D,E), shades of green represent the frequency of data in each bin and white crosses represent average attenuation parameter values.
The bed sediment within the seagrass canopy was comparable to, but slightly finer than, the sediment at the bare bed site (e.g., canopy: D50 = 440μm; bare bed: D50 = 520μm; Figures 6A,B). At both sites, the grain size was approximately normally distributed. The grain sizes of the bed samples were considerably coarser than the suspended sediment grain sizes (Figures 6C,D). The grain sizes of the suspended sediment were comparable across both sites, although slightly coarser at the canopy site (e.g., canopy: D50 = 160 μm; bare bed: D50 = 150 μm; Figures 6C,D). There was little difference in the suspended sediment grainsize distribution for samples collected at different elevations at each site (not shown).
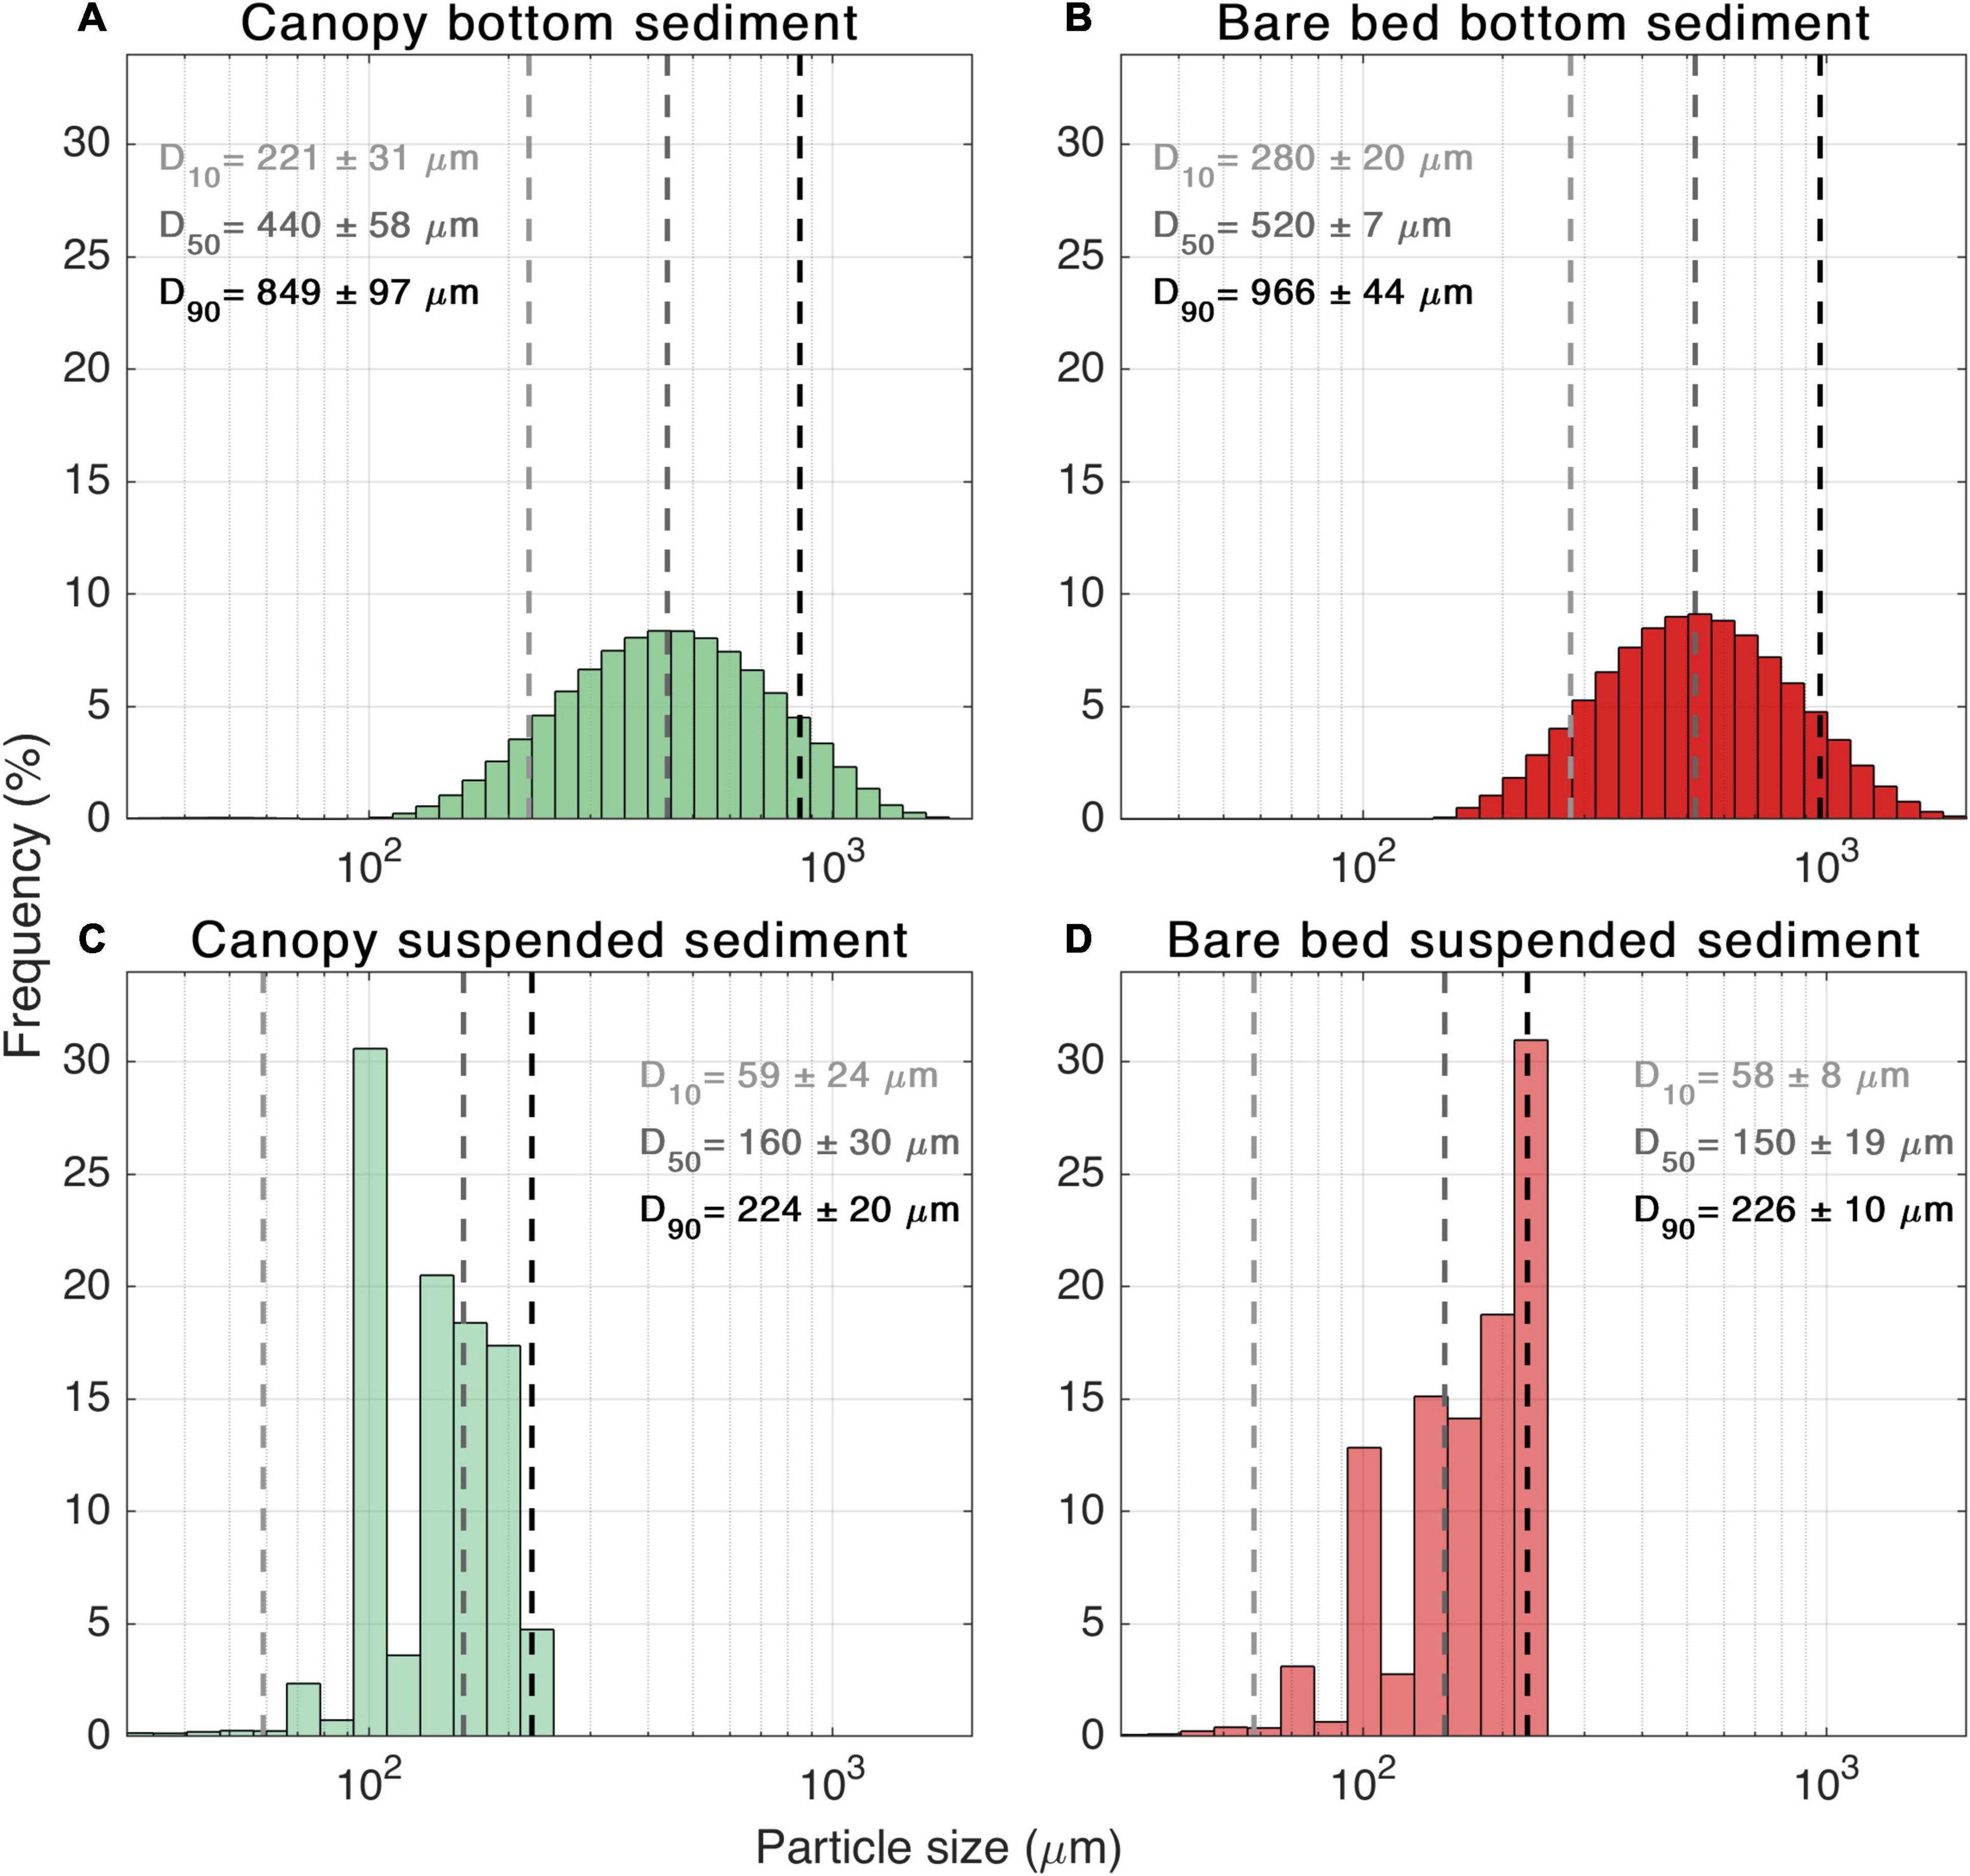
Figure 6. Sediment grain size distribution for samples collected within the canopy (A,C) and bare bed (B,D) sites. Top panels are from bed sediment samples; bottom panels represent suspended sediment sampling on 21/10/2015 16:00 (canopy) and 26/10/2015 10:15 (bare bed). Vertical dashed lines on each graph represent the average over the samples D10, D50, D90 (from left to right).
Here we investigate how the presence of the seagrass canopy influences local SSCs relative to the bare bed. Mean bed shear velocities (u*m,bed, light green time series in Figure 7A) were on average 40% of maximum bed shear velocities (u*max,bed, red time series in Figure 7B). u*m,bed was always lower than the critical shear velocity required to suspend the sediment at both the seagrass and bare bed locations (Figure 7A), averaging 29% of the critical shear velocity. At the top of seagrass canopy, mean shear velocities (u*m,rough, dark green time series in Figure 7A) were also substantially lower than the maximum shear velocities (u*max,rough, blue time series in Figure 7B) during the vast majority of the experiment, with u*m,rough on average 52% of u*max,rough. At both locations (seagrass and bare bed), the shear velocities varied mainly in response to the wave changes. The peaks in SSC in the early hours of the 25th and 27th (Figure 7C) are preceded by peaks in the wave height governed by (local) high frequency waves seen in Figure 4D).
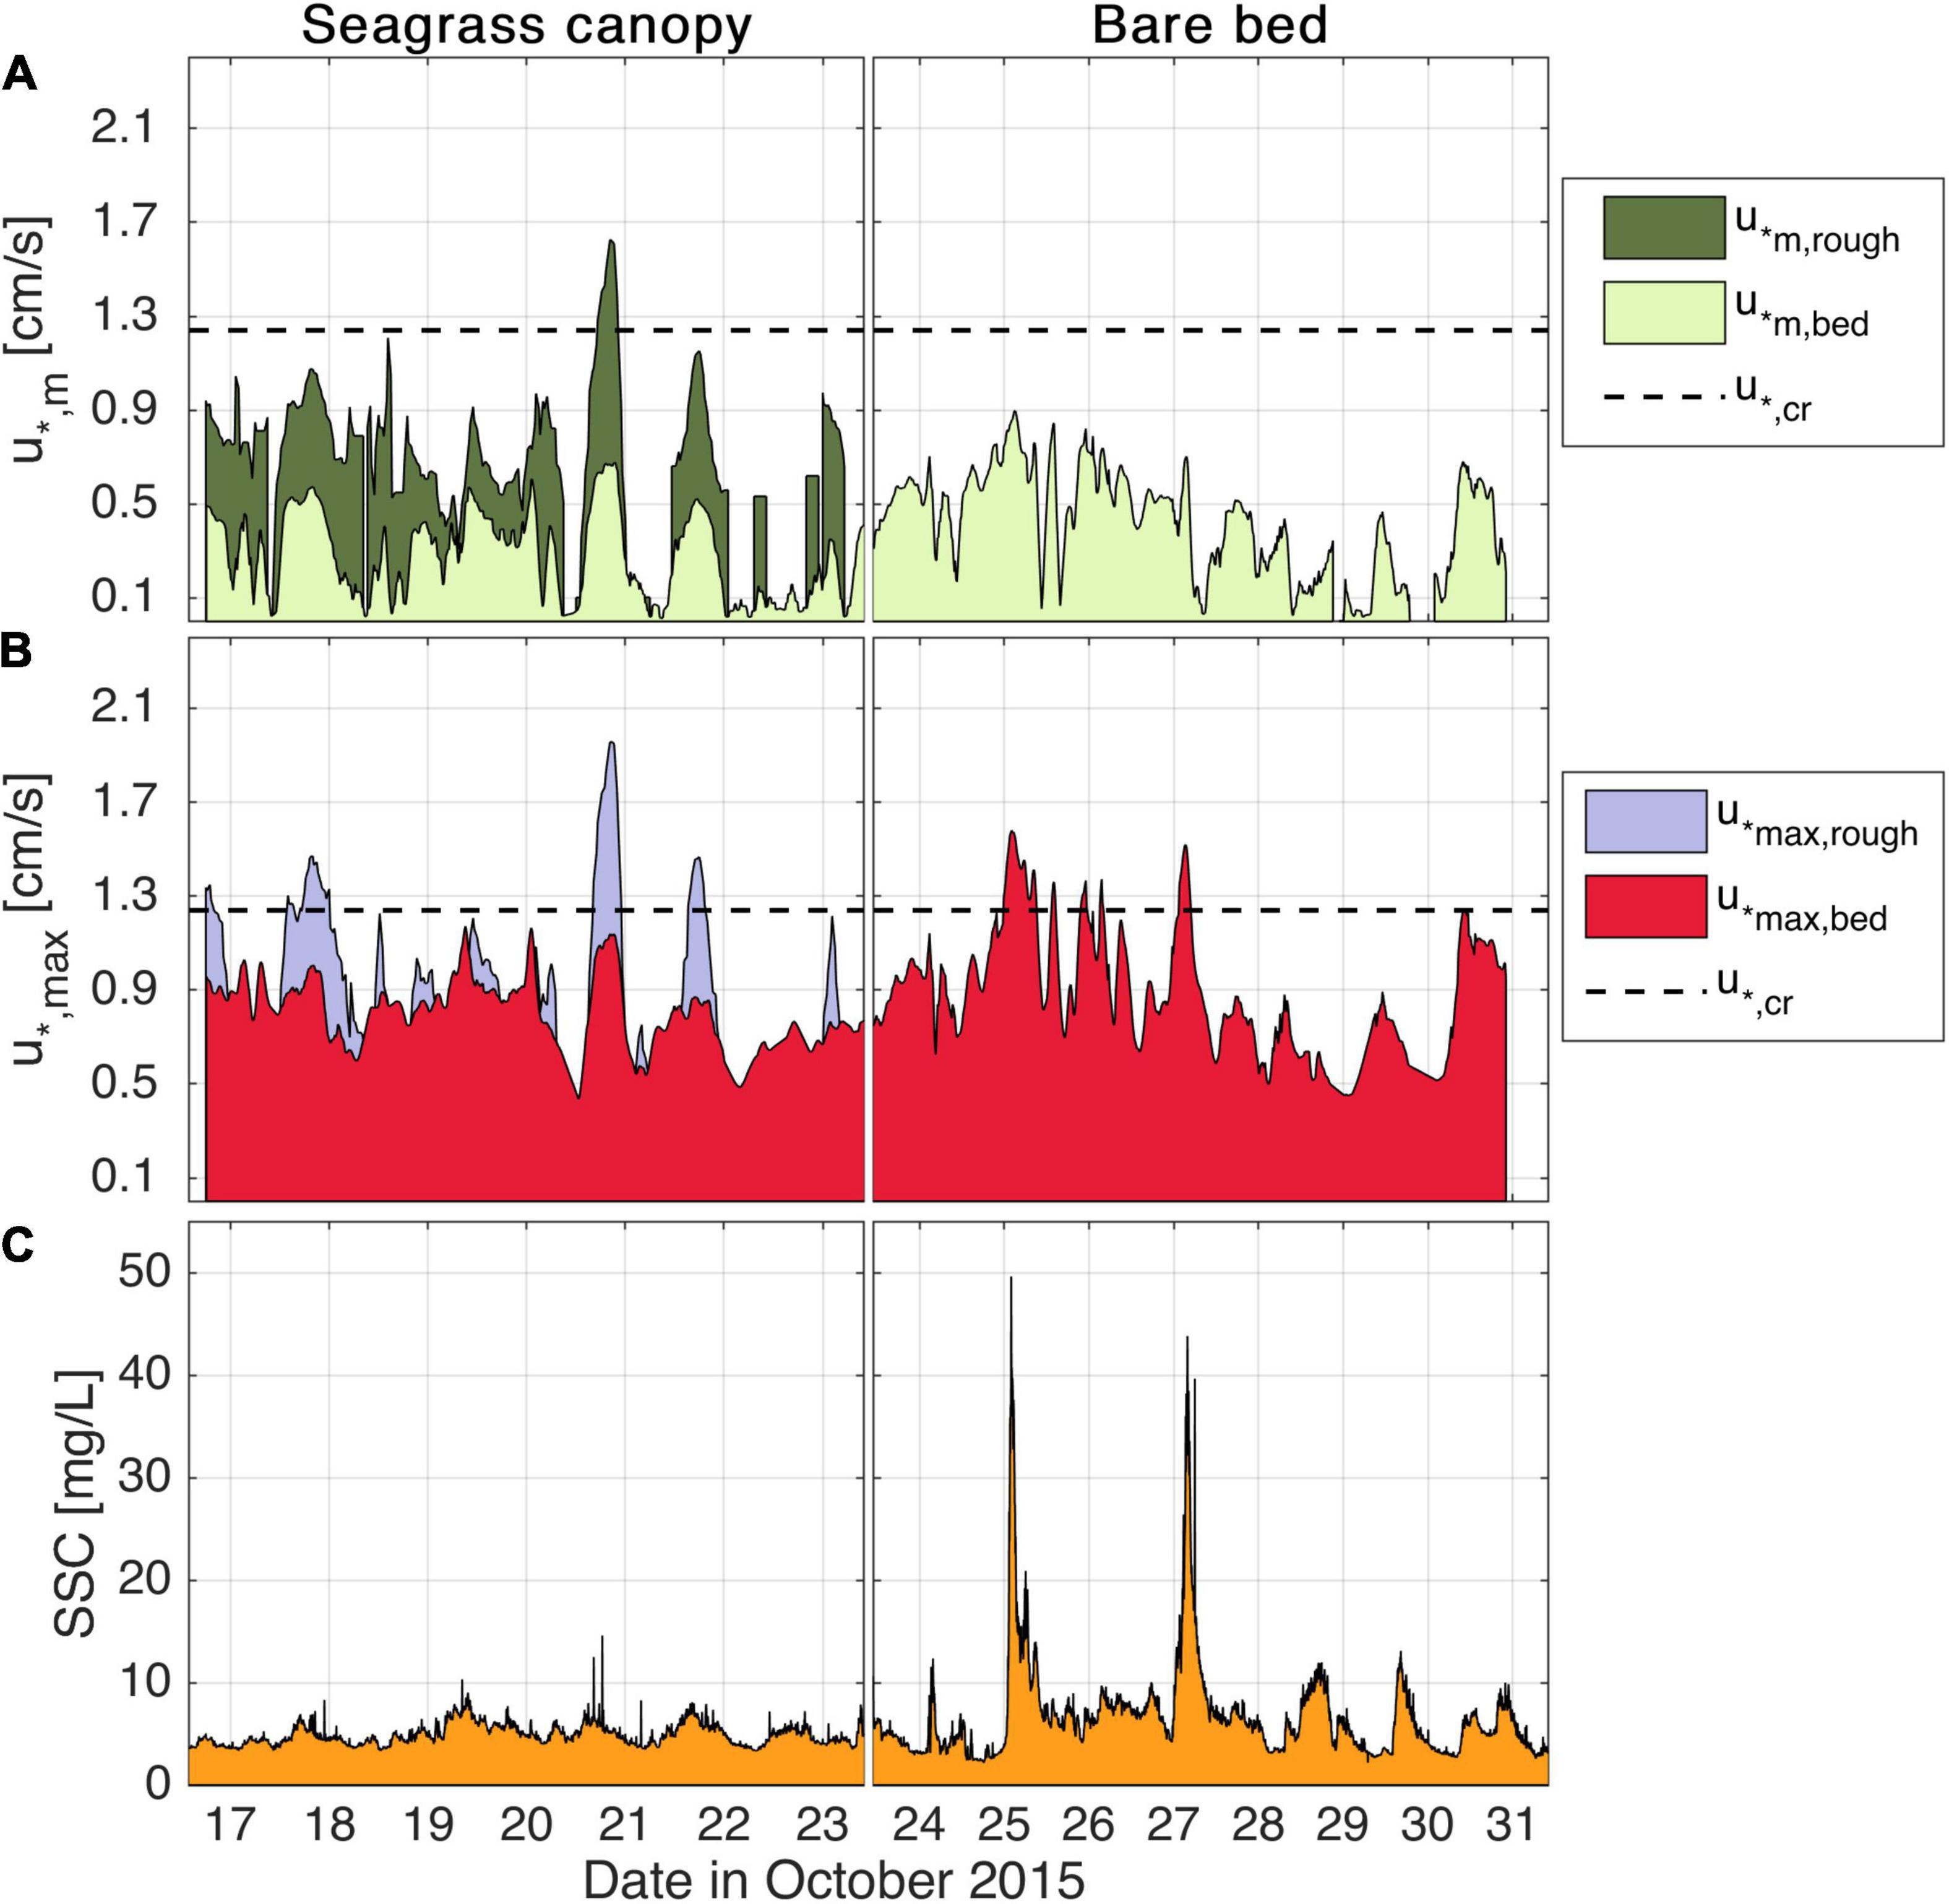
Figure 7. Time series during the canopy and bare bed experiment showing (A) mean rough (u*m,rough) and mean bed (u*m,bed) shear velocities; (B) maximum shear velocities at the top of the roughness layer (u*max,rough) and at the bed (u*max,bed); (C) average SSC (bottom and top OBS) in mg/L. In (A,B), shaded squares represent the required shear velocity to resuspend the range of D50 grain sizes sampled.
Mean and maximum bed shear velocities u*m,bed and u*max,bed within the seagrass canopy were always lower than the respective shear velocities, u*m,rough and u*max,rough, measured at the top of the canopy. While u*m,bed represented an average of 60% of u*m,rough,u*max,bed was on average 82% of u*max,rough. u*m,rough and especially u*max,rough frequently overcame the critical shear velocity threshold (dashed line in Figure 7). If shear stresses measured at the top of the canopy exceeding threshold values were a local driver of sediment resuspension, we would expect a strong correlation between SSC and either u*m,roughor u*max,rough. However, we observed only minimal increases in SSC near the bed within the seagrass canopy when these shear stresses exceeded critical values (Figure 7C).
The shear velocity at the top of the canopy is based on the elevated shear stress the overlying water column would experience due to the canopy drag. The bed shear velocity, however, is based on the stress that would be exerted by the attenuated canopy flow on the sediment at the base of the seagrass canopy. For the bare bed experiment, u*max,bed well-exceeded the critical shear velocity on two occasions, with a direct effect being observed in the sediment concentration, which increased SSC by nearly an order of magnitude from baseline typical values (Figure 7C). During the seagrass canopy experiment, u*max,bed remained below the critical threshold, and consequently, SSC was always less than 10 mg/L, increasing by a maximum factor of 2 (from ∼4 to 8 mg/L). However, during the bare bed experiment, SSC values peaked nearly 50 mg/L on the early morning of the 25th and 27th, when u*max,bed was appreciably higher than the critical shear velocity, increasing by a factor of 12 times (from ∼4 up to 48 mg/L).
To explore the relationships between these different shear velocity definitions and SSC responses, we grouped the time series data into bins with common shear velocities (using a bin interval of 0.06 cm/s) and averaged the SSC values that occurred during these collections of times. This was done to average out the effects of any noise or influence of anomalous (isolated) events and focus on the dominant trends observed during the study. There is no relationship between shear velocities measured at the top of the canopy (u*max,rough, i.e., that represents stresses exerted on the overlying water column) and the SSC, even when u*max,rough exceeded the estimated critical threshold (u*,cr) for sediment transport (R2 = 0 in Figure 8, purple dots). Bed shear velocities (u*,max,bed) during the bare bed experiment (red dots in Figure 8), also show no correlation with SSC under the critical shear velocity. These relatively low background values in SSC not driven by local sediment resuspension may be due to other particles in suspension or sediment advection that are not necessarily related to the local critical shear velocity. However, above the critical shear velocity for the bare bed, the maximum bed shear velocity and SSC are strongly correlated for the bare bed case (R2 = 0.99). This strong correlation for the bare bed sediment resuspension is thus consistent with the critical threshold being exceeded, as calculated using Eqs 8 and 9.
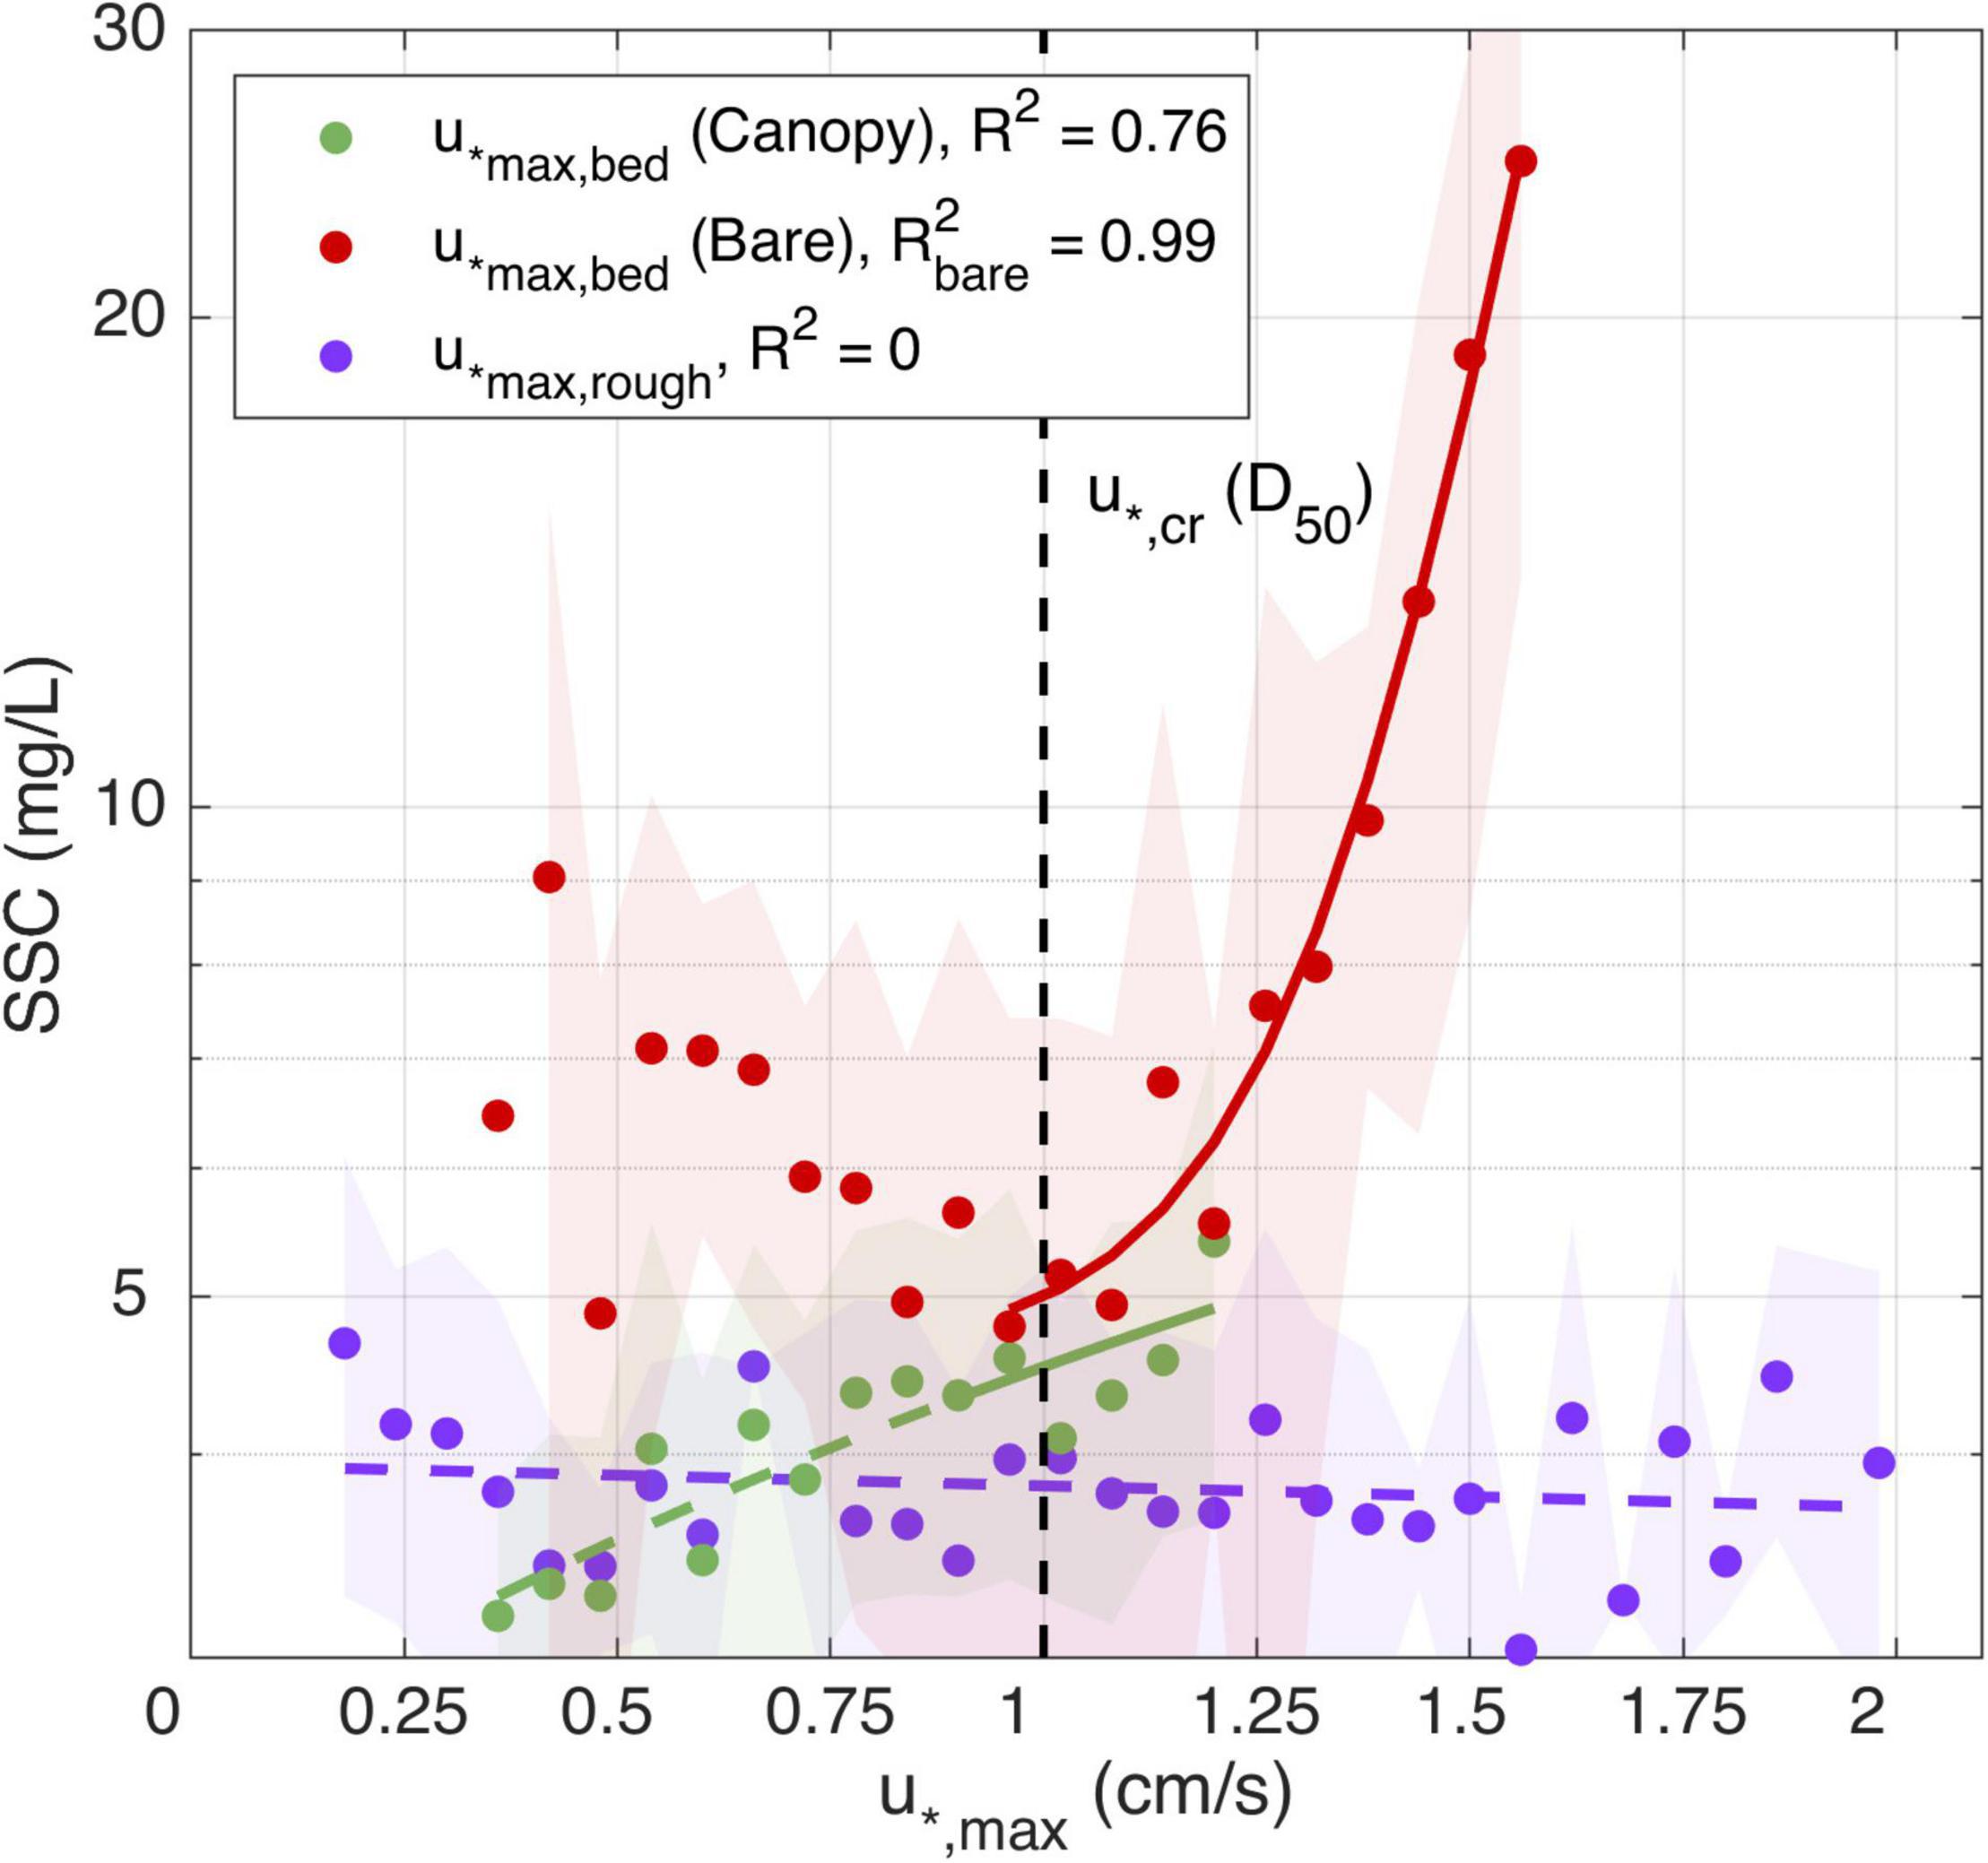
Figure 8. Regression analysis with interval confidence (shaded areas) for between maximum bed shear stress and SSC during the canopy (green dots) and bare bed (red dots); and for the maximum rough shear stress (purple dots). The vertical dashed line represents the required shear velocity to resuspend the mean grain size found in the field.
As the seagrass canopy and bare bed experiments were conducted consecutively, the natural forcing conditions were not identical, and the number of times the estimated shear velocity overcame the critical shear velocity was lower when measuring at the seagrass canopy site. However, there were still enough events to verify that the canopy had an appreciable effect on reducing the SSC. On the early morning of the 17th and 20th, and late night of the 20th, when the seagrass canopy experiment was being conducted, the waves reached comparable heights to the 24th, 28th, and 29th (during the bare bed experiment). As a consequence, the sediment experienced similar values of u*,max,bed for the two experiments, however, SSC was lower in the canopy case than in the bare bed. For the same velocities above u*,cr, the canopy SSC values were on average 82% of the bare bed values. While the u*,max,bed values did not substantially exceed the critical threshold u*,cr during within the seagrass canopy (green dots in Figure 8), even below this threshold the low SSCs were correlated with u*,max,bed. This response is different from the bare bed case, and while the cause is unknown, may indicate that even below the critical threshold there is still a weak dependency of the SSC on the canopy flow; for example, due to weak resuspension by wake-generated turbulence.
At the canopy site, we also observed evidence of some attenuation of SSC with height above the bed (Figure 9). At this site, SSC at the top of the canopy (using a 2-h window moving average) was on average ∼80% (± 11%) of that within the canopy. Over the bare bed, the equivalent ratio (SSC measured at 35 and 10 cmab, respectively) instead averaged ∼100% (± 10%) throughout the experiment, indicating no substantial vertical structure in the SSCs across these elevations.
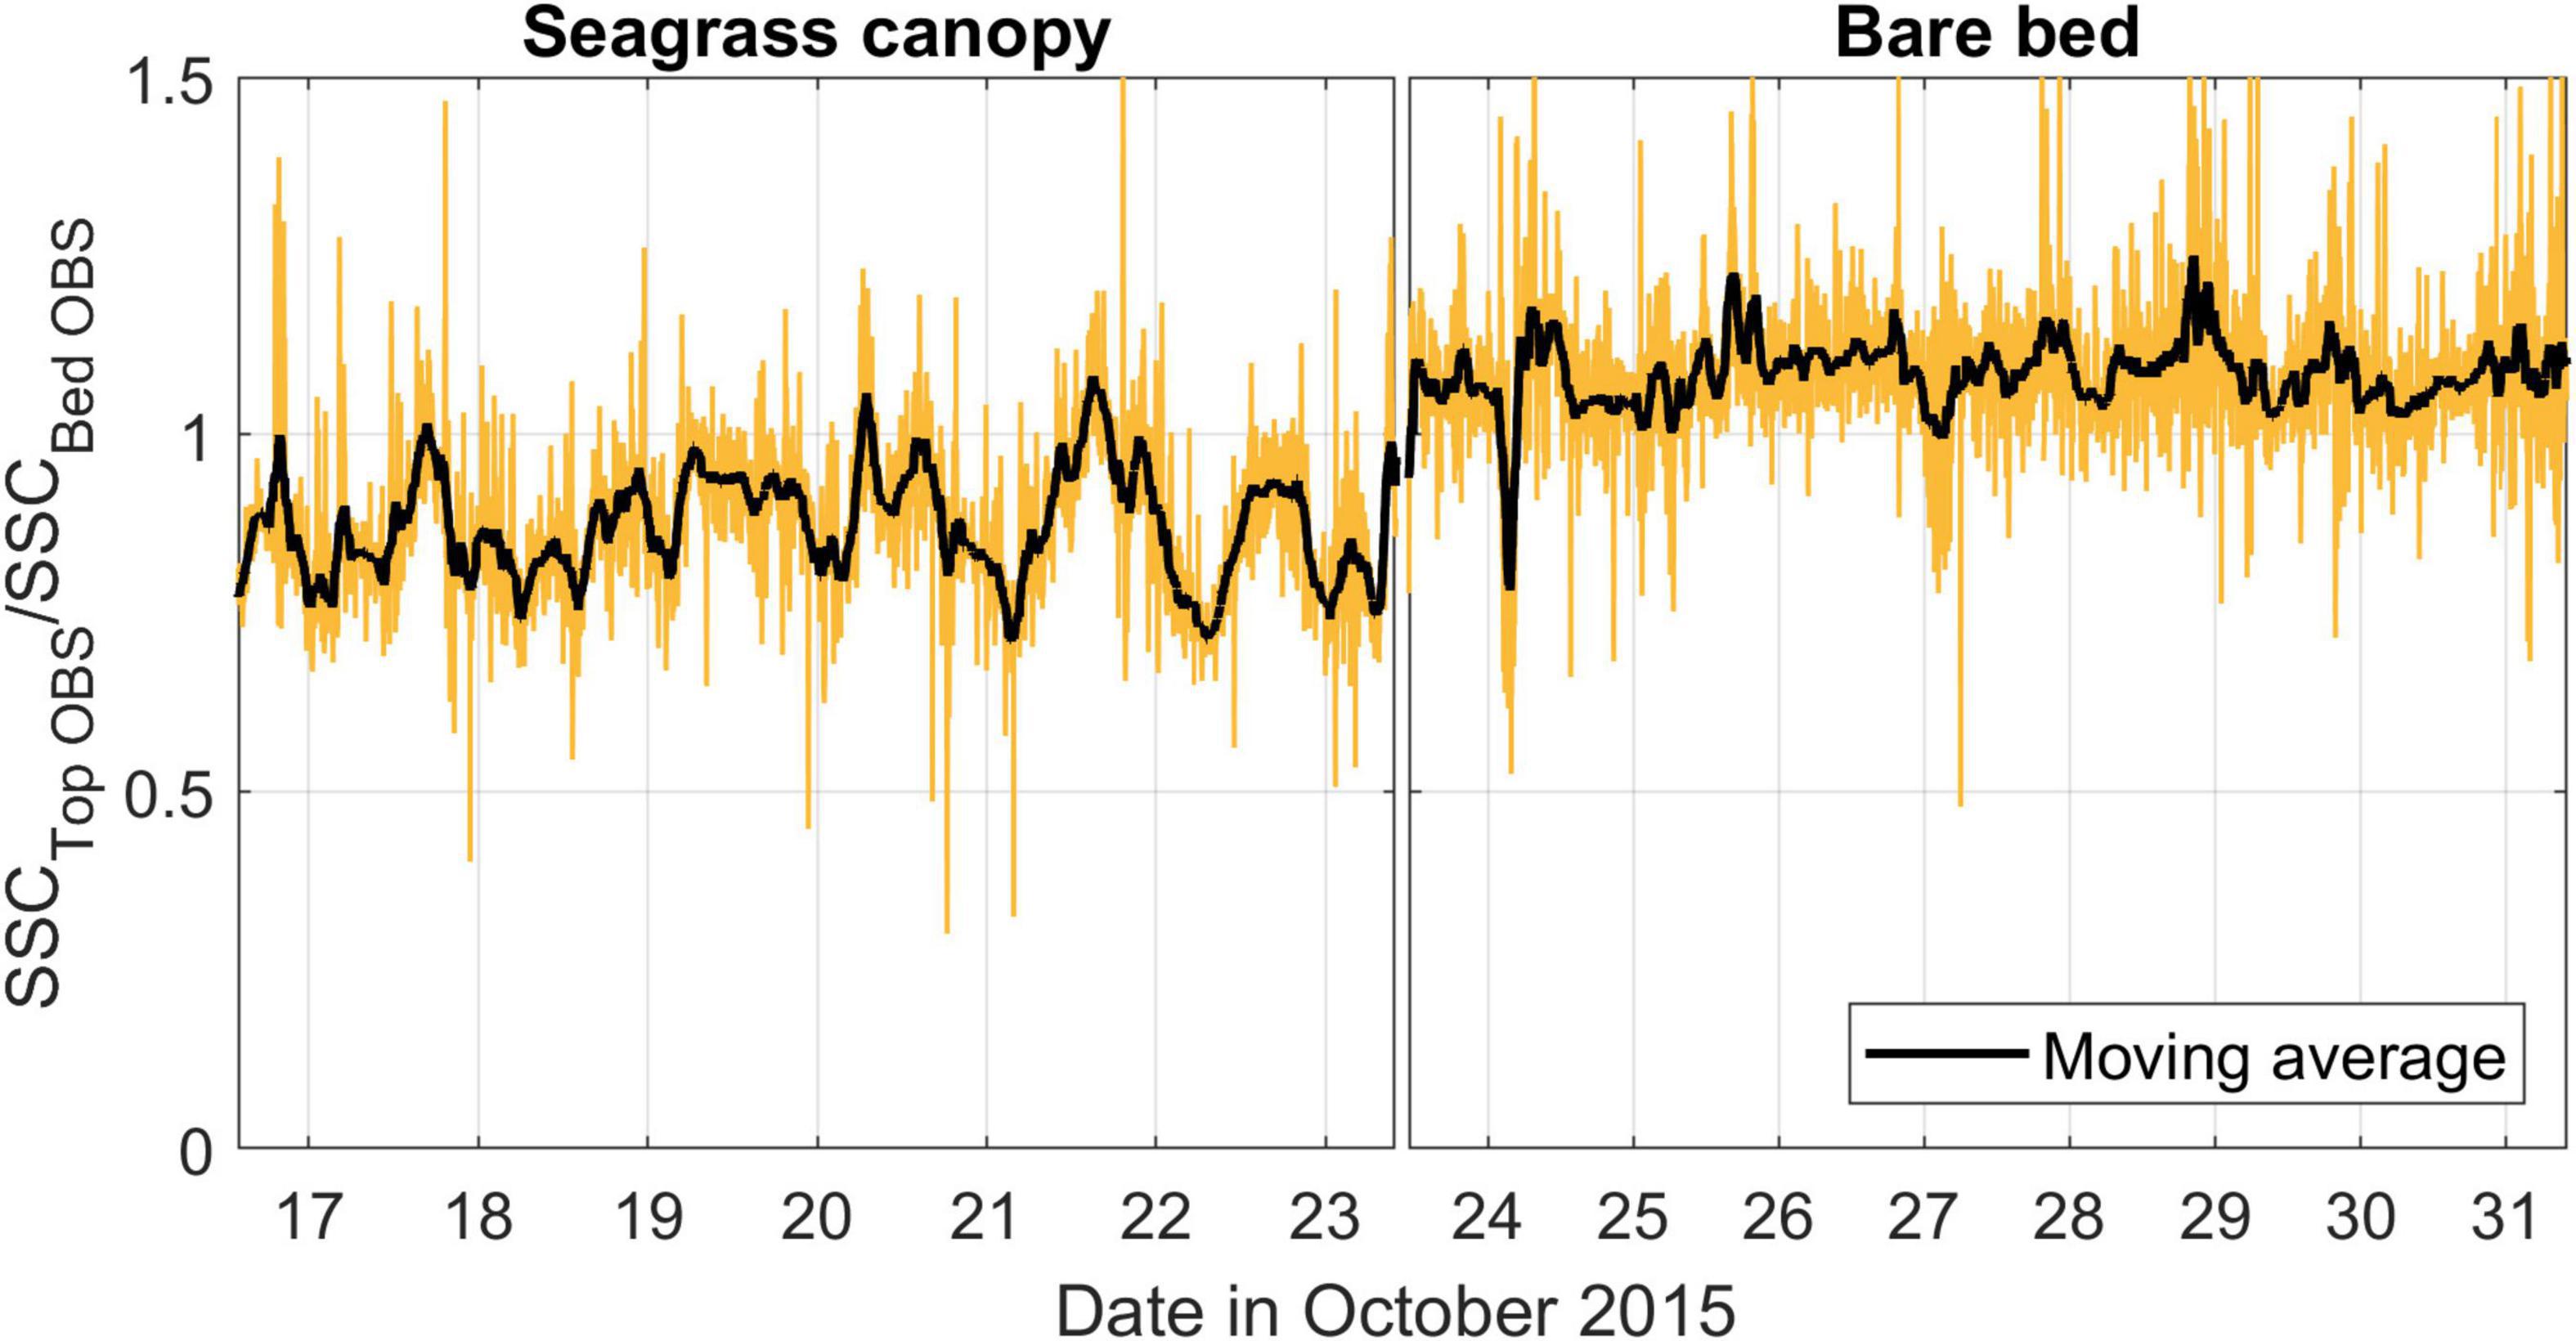
Figure 9. Ratio of the SSCs measured by the OBS located near the top of the seagrass canopy (∼35 cmab) to the OBS located within the canopy (∼10 cmab). For the bare bed study period each OBS is located at the same elevation above the bed. Data are presented as raw (yellow line) and moving average (black line, 100-min moving average).
Despite advances in understanding the interactions between hydrodynamic and sediment transport processes in submerged canopies in laboratory (physical modeling) studies, there are still limited measurements of the coupled hydrodynamic and sediment transport processes in natural seagrass meadows exposed to a range of met-ocean conditions and with natural sediments. In this study, we present new quantitative insight into how sediment resuspension is affected by the submerged canopy formed by a seagrass meadow. The study site at Garden Island, with abundant seagrass meadows, was largely sheltered from swell but experienced substantial variability in locally generated wind waves due to the strong sea breeze cycle, making it an ideal case study to investigate how different wave and current conditions interact with seagrass canopies to influence near-bed flows and sediment transport. On a weak sea-breeze day, mean currents at the site were weak; however, on a strong sea-breeze day northward-directed mean currents of order 0.1 m/s were generated, which lagged the wind by 1–2 h. Local wind-wave generation also varied in response to the strength of the sea breeze, yet wave heights were influenced by the wind direction that controlled the fetch within Cockburn Sound. In Western Australia, the predominant sea-breeze system generates southerly winds that are more shore-parallel than perpendicular (Pattiaratchi et al., 1997), which determined the fetch available for wave generation. Easterly winds, although weaker, generated larger wind waves when compared to stronger southerly winds due to larger available fetch for waves reaching the site to develop. The wave spectra also varied throughout the day: during the morning, when the sea-breeze was absent or weak, a greater fraction of wave energy occurred within the low frequencies due to some transmission of swell into Cockburn Sound. With the sea-breeze onset, in exchange, higher frequency (sea) waves became dominant.
The seagrass meadow had a substantial influence on attenuating near-bed flow velocities from free-stream (above canopy) velocities. The mean currents within the canopy were substantially more attenuated (average attenuation parameter αc = 0.35) relative to the oscillatory flows generated by the waves (average attenuation parameter αw = 0.83), consistent with both theoretical predictions (e.g., Lowe et al., 2005) and from the limited field studies of flow attenuation in seagrass canopies (Hansen and Reidenbach, 2012). Due to this near-bed flow attenuation, our results reveal the importance of estimating bed shear velocities from measurements taken directly inside the canopy, to provide more robust predictions of sediment resuspension and transport processes within seagrass meadows. Due to the flow reduction inside canopies, our results showed that the bed shear stresses (u*m,bed and u*max,bed) that exert forces on the underlying seabed were greatly reduced from those at the top of the canopy (u*m,rough and u*max,rough). Based on the sediment grain size properties at the site (i.e., D50), a critical shear velocity of approximately 1.2 cm/s was expected to represent the threshold for sediment resuspension at the site. The maximum wave-driven shear velocity associated with the canopy roughness (u*max,rough) ranged between 0.3 and 2 cm/s, reaching values repeatedly above this critical threshold; yet no significant variation was observed in SSC for measurements within the seagrass meadow. However, when accounting for the reduction of the bed shear velocity, u*max,bed was much lower (typically 0.7 cm/s), never exceeding the expected critical threshold and thus more consistent with the observed SSC variation over the canopy (Figure 7). In contrast, for measurements over a nearby bare bed site, the maximum bed shear stresses often reached values > 1 cm/s followed by a 10-fold increase in SSC, thus consistent with the estimated critical threshold being exceeded and triggering sediment resuspension. Previously, by studying sediment transport processes in the presence of coral reef canopies, Pomeroy et al. (2017) found bed shear velocities u*m,bed to be ∼25% of u*m,rough and u*max,bed to be ∼20% of u*max,rough. Over a seagrass meadow, we found higher values of u*m,bed representing ∼60% of u*m,rough and u*max,bed to be 84% of u*max,rough. Pomeroy et al. (2017) also found that currents were reduced to ∼25% of the free-stream velocities (35% in our study, in average), while the wave orbital velocities were attenuated to ∼75% of the free-stream velocities (83% in our study, in average).
As a consequence, if shear velocities were calculated from measurements taken above a canopy, which would represent the bottom stresses the overlying flow would experience, it would have led to large errors in sediment transport predictions, as predicted from flume experiments (Le Bouteiller and Venditti, 2015). These effects can be seen in both time series (Figure 7) and as a correlation between observed SSCs and u*max,bed (Figure 8). Below the required shear velocity threshold, SSC variations were negligible and uncorrelated with the local hydrodynamics, which can be explained by natural variability in SSC not driven by local sediment resuspension. For values above this threshold, which occurred on several occasions for the bare bed experiencing larger bed shear velocities, the SSC was strongly correlated to u*max,bed and (R2 = 0.99 during the bare bed experiment). This suggests that the range and relative proportions of grain sizes in suspension are explained by the maximum shear stresses induced by the wave orbital velocities measured near the bed. Although some laboratory studies have similarly shown how sediment resuspension can be overestimated when using bottom shear stresses over a canopy, our study is the first one (to our knowledge) to quantify these differences between canopy and bed shear stresses within seagrass meadows using in situ data, and in turn how this controls sediment transport.
Despite the wave velocities not being as attenuated as the currents, which would enable waves to act more uniformly from within the canopy up into the water column, we also observed some vertical attenuation of SSC concentrations above the canopy relative to within the canopy, which was not observed in measurements at the same elevations over the bare bed. This implies that even when waves are strong enough to overcome the resuspension threshold in a canopy environment, elevated SSCs may be constrained to within the canopy. A similar effect was suggested by Gacia and Duarte (2001), who observed that the meadow is responsible for buffering sediment resuspension on a similar wind-driven environment and that near-bed flow reductions by seagrass canopies can enhance particle trapping (Gacia et al., 1999; Gacia and Duarte, 2001). Using tracer particles, Agawin and Duarte (2002) found that 70% of the suspended particles within the meadow can be trapped by seagrasses, reducing the suspended sediment that would otherwise be available for current transport above the meadow. In our study site, we used optical sediment instruments located at different heights inside the meadow. As a result, SSC measured above the canopy showed an average of 77% of the values measured near the bed (∼10 cmab). This difference was smaller when wave-induced shear velocities were higher. However, in the bare bed experiment, the top and bottom SSC data were virtually the same, with SSCs at the top being on average 97% of near-bed values.
Collectively, our results support previous evidence from laboratory and some limited field studies, indicating that seagrass meadows are highly effective in attenuating current flows, but much less effective at attenuating wave-driven oscillatory flows. Sediment resuspension over seagrass meadows would be overestimated by assuming that the flows measured above a seagrass meadow (including the same relative importance of waves and currents) are representative of those responsible for initiating sediment transport.
Seagrass meadows provide a wide range of important ecological functions and are highly sensitive to light and turbidity. Despite recent advances in describing sediment resuspension in idealized physical models of seagrass canopies (i.e., in detailed flume experiments), there is a need for developing quantitative process understanding in real, complex meadows. This study shows that models for predicting sediment resuspension for bare sediment beds inaccurately describe the flow-seagrass-sediment interactions, overestimating resuspension. We conducted a detailed field experiment within a seagrass meadow relating hydrodynamics with sediment size and concentration and we found flow velocities at the bed to be significantly reduced by the canopy by an average factor of 35% for currents and 83% for waves. Near-bed shear stress measured within the canopy were strongly correlated with levels of suspended sediment. Once the sediment is resuspended, elevated SSC levels in seagrass meadows are confined to the fraction of the water column occupied by the canopy, in contrast to the bare bed. Therefore, we conclude that there are multiple mechanisms through which a seagrass canopy can modify the sediment transport processes.
The improved process-based understanding of the flow-seagrass-sediment interaction developed here can help inform research into how seagrass meadows can reduce sediment erosion (including their use for nature-based coastal protection), the conditions for when seagrasses can stabilize a seabed to promote seagrass habitat restoration, as well as act as a trap for suspended sediment to enhance water quality and other critical biogeochemical processes.
The datasets analyzed for this study can be obtained by sending a written request to the corresponding author at bmVyeS5jb250dGluZXRvQHJlc2VhcmNoLnV3YS5lZHUuYXU=.
This study was part of NC’s Ph.D. research. AP and RL did the fieldwork design and data collection. NC did the data analysis and writing under the review of the other authors, who are his supervisors. All authors contributed to the article and approved the submitted version.
This research was supported by funding from an Australian Research Council Discovery Project grants DP170100802 and DP200101545 and funding from the Western Australian Marine Science Institution Dredging Science Node. NC would like to acknowledge the support provided by an Australian Government Research Training Program Scholarship.
The authors declare that the research was conducted in the absence of any commercial or financial relationships that could be construed as a potential conflict of interest.
All claims expressed in this article are solely those of the authors and do not necessarily represent those of their affiliated organizations, or those of the publisher, the editors and the reviewers. Any product that may be evaluated in this article, or claim that may be made by its manufacturer, is not guaranteed or endorsed by the publisher.
We would like to thank Carlin Bowyer and Anton Kuret for their assistance in conducting the field experiment.
Abdolahpour, M., Ghisalberti, M., Lavery, P., and McMahon, K. (2017). Vertical mixing in coastal canopies. Limnol. Oceanogr. 62, 26–42. doi: 10.1002/lno.10368
Abdolahpour, M., Ghisalberti, M., Mcmahon, K., and Lavery, P. S. (2018). The impact of flexibility on flow, turbulence, and vertical mixing in coastal canopies. Limnol. Oceanogr. 63, 2777–2792. doi: 10.1002/lno.11008
Adams, M. P., Hovey, R. K., Hipsey, M. R., Bruce, L. C., Ghisalberti, M., Lowe, R. J., et al. (2016). Feedback between sediment and light for seagrass: where is it important? Limnol. Oceanogr. 61, 1937–1955. doi: 10.1002/lno.10319
Agawin, N. S. R., and Duarte, C. M. (2002). Evidence of direct particle trapping by a tropical seagrass meadow. Estuaries 25, 1205–1209. doi: 10.1007/BF02692217
Blott, S. J., and Pye, K. (2001). GRADISTAT: a grain size distribution and statisticks package for the analysis of unconsolidated sediments. Earth Surf. Process. Landf. 26, 1237–1248. doi: 10.1016/S0167-5648(08)70015-7./esp.261
Bosman, J. J., van der Velden, E. T. J. M., and Hulsbergen, C. H. (1987). Sediment concentration measurement by transverse suction. Coast. Eng. 11, 353–370. doi: 10.1016/0378-3839(87)90033-0
Bouma, T. J. Ã, Van Duren, L. A., Temmerman, S., Claverie, T., Ysebaert, T., and Herman, P. M. J. (2007). Spatial flow and sedimentation patterns within patches of epibenthic structures: combining field, flume and modelling experiments. Cont. Shelf Res. 27, 1020–1045. doi: 10.1016/j.csr.2005.12.019
Bradley, K., and Houser, C. (2009). Relative velocity of seagrass blades: Implications for wave attenuation in low-energy environments. J. Geophys. Res. Earth Surf. 114, 1–13. doi: 10.1029/2007JF000951
Carruthers, T. J. B., Dennison, W. C., Kendrick, G. A., Waycott, M., Walker, D. I., and Cambridge, M. L. (2007). Seagrasses of south-west Australia: a conceptual synthesis of the world’s most diverse and extensive seagrass meadows. J. Exp. Mar. Biol. Ecol. 350, 21–45. doi: 10.1016/j.jembe.2007.05.036
Cheetham, M. D., Keene, A. F., Bush, R. T., Sullivan, L. A., and Erskine, W. D. (2008). A comparison of grain-size analysis methods for sand-dominated fluvial sediments. Sedimentology 55, 1905–1913. doi: 10.1111/j.1365-3091.2008.00972.x
Chen, D., Li, M., Zhang, Y., Zhang, L., Tang, J., Wu, H., et al. (2020). Effects of diatoms on erosion and accretion processes in saltmarsh inferred from field observations of hydrodynamic and sedimentary processes. Ecohydrology 13, 1–15. doi: 10.1002/eco.2246
Chen, S. N., Sanford, L. P., Koch, E. W., Shi, F., and North, E. W. (2007). A nearshore model to investigate the effects of seagrass bed geometry on wave attenuation and suspended sediment transport. Estuaries Coasts 30, 296–310. doi: 10.1007/BF02700172
Copertino, M. S., Creed, J. C., Lanari, M. O., Barros, K., Lana, P. C., Sordo, L., et al. (2016). Seagrass and submerged aquatic vegetation (VAS) habitats off the coast of Brazil: state of knowledge, conservation and main threats. Braz. J. Oceanogr. 64, 53–80.
de Boer, W. F. (2007). Seagrass-sediment interactions, positive feedbacks and critical thresholds for occurrence: a review. Hydrobiologia 591, 5–24. doi: 10.1007/s10750-007-0780-9
Dennison, W. C., Orth, R. J., Moore, K. A., Stevenson, J. C., Carter, V., Kollar, S., et al. (1993). Assessing water quality with submersed aquatic vegetation. BioScience 43, 86–94. doi: 10.2307/1311969
Di Stefano, C., Ferro, V., and Mirabile, S. (2010). Comparison between grain-size analyses using laser diffraction and sedimentation methods. Biosyst. Eng. 106, 205–215. doi: 10.1016/j.biosystemseng.2010.03.013
Duarte, C. M. (1991). Seagrass depth limits. Aquat. Bot. 40, 363–377. doi: 10.1016/0304-3770(91)90081-F
Duarte, C. M. (2002). The future of seagrass meadows. Environ. Conserv. 29, 192–206. doi: 10.1017/S0376892902000127
Duarte, C. M., and Cebrián, J. (1996). The fate of marine autotrophic production. Limnol. Oceanogr. 41, 1758–1766. doi: 10.4319/lo.1996.41.8.1758
Egan, G., Chang, G., McWilliams, S., Revelas, G., Fringer, O., and Monismith, S. (2021). Cohesive sediment erosion in a combined wave-current boundary layer journal of geophysical research: oceans. J. Geophys. Res. Ocean. 126, 1–17. doi: 10.1029/2020JC016655
Egan, G., Chang, G., Revelas, G., Monismith, S., and Fringer, O. (2020). Bottom drag varies seasonally with biological roughness geophysical research letters. Geophys. Res. Lett. 47, 1–9. doi: 10.1029/2020GL088425
Emery, W. J., and Thompson, R. E. (2001). Data Analysis Methods in Physical Oceanography: Second and Revised Edition, 2nd Edn. Amsterdam: Elsevier Science.
Gacia, E., and Duarte, C. M. (2001). Sediment retention by a Mediterranean Posidonia oceanica meadow: the balance between deposition and resuspension. Estuar. Coast. Shelf Sci. 52, 505–514. doi: 10.1006/ecss.2000.0753
Gacia, E., Granata, T. C., and Duarte, C. M. (1999). An approach to measurement of particle flux and sediment retention within seagrass (Posidonia oceanica) meadows. Aquat. Bot. 65, 255–268. doi: 10.1016/S0304-3770(99)00044-3
Gallop, S. L., Verspecht, F., and Pattiaratchi, C. B. (2012). Sea breezes drive currents on the inner continental shelf off southwest Western Australia. Ocean Dyn. 62, 569–583. doi: 10.1007/s10236-011-0515-3
Ghisalberti, M., and Nepf, H. (2002). Mixing layers and coherent structures in vegetated aquatic flows. J. Geophys. Res. 107:3011. doi: 10.1029/2001JC000871
Goring, D. G., and Nikora, V. I. (2002). Despiking acoustic doppler velocimeter data. J. Hydraulic Eng. 128, 117–126. doi: 10.1061/(ASCE)0733-94292002128:1(117)
Grant, W. D., and Madsen, O. S. (1979). Combined wave and current interaction with a rough bottom. J. Geophys. Res. Ocean. 84, 1797–1808. doi: 10.1029/JC084iC04p01797
Green, E. P., and Short, F. (2003). “World atlas of seagrasses,” in Prepared by the UIMEP World Conservation Monitoring Centre, Vol. 47, (Berkeley, CA: University of California Press). doi: 10.1515/BOT.2004.029
Gruber, R. K., and Kemp, W. M. (2010). Feedback effects in a coastal canopy-forming submersed plant bed. Limnol. Oceanogr. 55, 2285–2298. doi: 10.4319/lo.2010.55.6.2285
Hansen, J. C. R., and Reidenbach, M. A. (2012). Wave and tidally driven flows in eelgrass beds and their effect on sediment suspension. Mar. Ecol. Prog. Ser. 448, 271–287. doi: 10.3354/meps09225
Hasegawa, N., Hori, M., and Mukai, H. (2008). Seasonal changes in eelgrass functions: current velocity reduction, prevention of sediment resuspension, and control of sediment – water column nutrient flux in relation to eelgrass dynamics. Hydrobiologia 596, 387–399. doi: 10.1007/s10750-007-9111-4
Infantes, E., Orfila, A., Simarro, G., Terrados, J., Luhar, M., and Nepf, H. (2012). Effect of a seagrass (Posidonia oceanica) meadow on wave propagation. Mar. Ecol. Prog. Ser. 456, 63–72. doi: 10.3354/meps09754
Koch, E. W., and Gust, G. (1999). Water flow in tide- and wave-dominated beds of the seagrass Thalassia testudinum. Mar. Ecol. Prog. Ser. 184, 63–72.
Lawson, S. E., Wiberg, P. L., Clathery, K. J. M., and Fugate, D. C. (2007). Wind-driven sediment suspension controls light availability in a shallow coastal lagoon. Estuaries Coasts 30, 102–112.
Le Bouteiller, C., and Venditti, J. G. (2015). Sediment transport and shear stress partitioning in a vegetated flow. Water Resour. Res. 51, 2901–2922. doi: 10.1002/2014WR016259
Lee Long, W. J. L., Mellors, J. E., and Coles, R. G. (1993). Seagrasses between Cape York and Hervey Bay, Queensland, Australia. Mar. Freshw. Res. 44, 19–31. doi: 10.1071/MF9930019
Lowe, R. J., Koseff, J. R., and Monismith, S. G. (2005). Oscillatory flow through submerged canopies: 1. Velocity structure. J. Geophys. Res. C Ocean. 110, 1–17. doi: 10.1029/2004JC002788
Luhar, M., Coutu, S., Infantes, E., Fox, S., and Nepf, H. (2010). Wave-induced velocities inside a model seagrass bed. J. Geophys. Res. Ocean. 115, 1–15. doi: 10.1029/2010JC006345
Luhar, M., and Nepf, H. M. (2011). Flow-induced reconfiguration of buoyant and flexible aquatic vegetation. Limnol. Oceanogr. 56, 2003–2017. doi: 10.4319/lo.2011.56.6.2003
Madsen, O. S. (1994). Spectral wave-current bottom boundary layer flows. Coast. Eng. Proc. 1, 384–398. doi: 10.9753/icce.v24
Malarkey, J., and Davies, A. G. (2012). A simple procedure for calculating the mean and maximum bed stress under wave and current conditions for rough turbulent flow based on Soulsby and Clarke’s (2005) method. Comput. Geosci. 43, 101–107. doi: 10.1016/j.cageo.2012.02.020
Marin-Diaz, B., Bouma, T. J., and Infantes, E. (2020). Role of eelgrass on bed-load transport and sediment resuspension under oscillatory flow. Limnol. Oceanogr. 65, 426–436. doi: 10.1002/lno.11312
Masselink, G., and Pattiaratchi, C. B. (2001). Seasonal changes in beach morphology along the sheltered coastline of Perth, Western Australia. Mar. Geol. 172, 243–263. doi: 10.1016/S0025-3227(00)00128-6
McLelland, S. J., and Nicholas, A. P. (2000). A new method for evaluating errors in high-frequency ADV measurements. Hydrol. Proc. 14, 351–366. doi: 10.1002/(SICI)1099-1085(20000215)14:2<351::AID-HYP963>3.0.CO;2-K
Nepf, H. (2012). Flow and transport in regions with aquatic vegetation. Annu. Rev. Fluid Mech. 44, 123–142. doi: 10.1146/annurev-fluid-120710-101048
Olsen, Y. S., Fraser, M. W., Martin, B. C., Pomeroy, A., Lowe, R., Pedersen, O., et al. (2018). In situ oxygen dynamics in rhizomes of the seagrass Posidonia sinuosa: impact of light, water column oxygen, current speed and wave velocity. Mar. Ecol. Prog. Ser. 590, 67–77. doi: 10.3354/meps12477
Pattiaratchi, C., Hegge, B., Gould, J., and Eliot, I. (1997). Impact of sea-breeze activity on nearshore and foreshore processes in southwestern Australia. Cont. Shelf Res. 17, 1539–1560. doi: 10.1016/S0278-4343(97)00016-2
Pomeroy, A. W. M., Lowe, R. J., Ghisalberti, M., Storlazzi, C., Symonds, G., and Roelvink, D. (2017). Sediment transport in the presence of large reef bottom roughness. J. Geophys. Res. Ocean. 122, 1347–1368. doi: 10.1002/2016JC011755
Pomeroy, A. W. M., Storlazzi, C. D., Rosenberger, K. J., Lowe, R. J., Hansen, J. E., and Buckley, M. L. (2021). The contribution of currents, sea-swell waves, and infragravity waves to suspended-sediment transport across a coral reef-lagoon system. J. Geophys. Res. Ocean. 126, 1–26. doi: 10.1029/2020JC017010
Raupach, M. R., Antonia, R. A., and Rajagopalan, S. (1991). Rough-Wall Turbulent Boundary Layers. Applied Mechanics Reviews 44, 1. doi: 10.1115/1.3119492
Reidenbach, M. A., and Thomas, E. L. (2018). Influence of the Seagrass, Zostera marina, on wave attenuation and bed shear stress within a shallow coastal bay. Front. Mar. Sci. 5:397. doi: 10.3389/fmars.2018.00397
Ruiz-Montoya, L., and Lowe, R. J. (2014). Summer circulation dynamics within the Perth coastal waters of southwestern Australia. Cont. Shelf Res. 77, 81–95. doi: 10.1016/j.csr.2014.01.022
Shaw, W. J., and Trowbridge, J. H. (2001). The direct estimation of near-bottom turbulent fluxes in the presence of energetic wave motions. J. Atmos. Ocean. Technol. 18, 1540–1557. doi: 10.1175/1520-0426(2001)018<1540:TDEONB>2.0.CO;2
Silberstein, K., Chiffings, A. W., and McComb, A. J. (1986). The loss of seagrass in Cockburn Soung, Western Australia. III.The effect of epiphytes on productivity of Posidonia australis, Hook F. Aquat. Bot. 24, 355–371.
Soulsby, R. (1997). Dynamics of Marine Sands: A Manual for Practical Applications. London: Thomas Telford.
Soulsby, R. L., and Clarke, S. (2005). Bed Shear-stresses Under Combined Waves and Currents on Smooth and Rough Beds Produced within Defra project FD1905 (EstProc). 1905(August). Wallingford: HR Wallingford.
van Keulen, M., and Borowitzka, M. A. (2002). Comparison of water velocity profiles through morphologically dissimilar seagrasses. Bull. Mar. Sci. 71, 1257–1267.
van Rooijen, A., Lowe, R., Rijnsdorp, D. P., Ghisalberti, M., Jacobsen, N. G., and McCall, R. (2020). Wave-driven mean flow dynamics in submerged canopies. J. Geophys. Res. Ocean. 125, 1–21. doi: 10.1029/2019JC015935
Keywords: canopies, sediment transport, sea-breeze, seagrass, wind waves
Citation: Contti Neto N, Pomeroy A, Lowe R and Ghisalberti M (2022) Seagrass Meadows Reduce Wind-Wave Driven Sediment Resuspension in a Sheltered Environment. Front. Mar. Sci. 8:733542. doi: 10.3389/fmars.2021.733542
Received: 30 June 2021; Accepted: 27 December 2021;
Published: 31 January 2022.
Edited by:
Anne Staples, Virginia Tech, United StatesReviewed by:
Jing Yuan, National University of Singapore, SingaporeCopyright © 2022 Contti Neto, Pomeroy, Lowe and Ghisalberti. This is an open-access article distributed under the terms of the Creative Commons Attribution License (CC BY). The use, distribution or reproduction in other forums is permitted, provided the original author(s) and the copyright owner(s) are credited and that the original publication in this journal is cited, in accordance with accepted academic practice. No use, distribution or reproduction is permitted which does not comply with these terms.
*Correspondence: Nery Contti Neto, bmVyeS5jb250dGluZXRvQHJlc2VhcmNoLnV3YS5lZHUuYXU=
Disclaimer: All claims expressed in this article are solely those of the authors and do not necessarily represent those of their affiliated organizations, or those of the publisher, the editors and the reviewers. Any product that may be evaluated in this article or claim that may be made by its manufacturer is not guaranteed or endorsed by the publisher.
Research integrity at Frontiers
Learn more about the work of our research integrity team to safeguard the quality of each article we publish.