 Cui-Ci Sun1,2,3†
 Wei-Zhong Yue1,2,4†
 You-Shao Wang1,2,3*Wei-Hong He1
 Yi-Guo Hong5
 Fu-Lin Sun1,2,3
 Hao Cheng1,2,3
 Mei-Lin Wu1,2Zhao-Yu Jiang1
 Fei Jiao1,2Yu-Tu Wang2,3
- 1State Key Laboratory of Tropical Oceanography, South China Sea Institute of Oceanology, Chinese Academy of Sciences, Guangzhou, China
- 2Southern Marine Science and Engineering Guangdong Laboratory (Guangzhou), Guangzhou, China
- 3Daya Bay Marine Biology Research Station, Chinese Academy of Sciences, Shenzhen, China
- 4University of Chinese Academy of Sciences, Beijing, China
- 5Institute of Environmental Research at Greater Bay, Guangzhou University, Guangzhou, China
Distributions of Coomassie Blue stainable particles (CSP), the sources and transports, as well as their implications for nitrogen biogeochemical cycles in the Pearl River estuary (PRE) were investigated during two cruises in August 2016 and January 2017. CSPcolor concentrations (CSP concentration determined spectrophotometrically) were 73.7–685.3 μg BSA eq L–1 [μg Bovine serum albumin (BSA) equivalent liter–1] in August 2016 and 100.6–396.4 μg BSA eq L–1 in January 2017, respectively. CSP concentrations were high in low-salinity waters (<5), and declined from the river to the middle estuary by 80% in the wet season and 55.6% in the dry season, respectively, then increased again in the lower estuary due to high primary production. CSP concentrations were mainly associated with chlorophyll a (Chl a) concentration except for the turbid mixing zone, suggesting that autochthonous phytoplankton production served as the primary source of CSP in the PRE. The concentrations of nitrogen (N) as CSP in the PRE were comparable to the nitrogen content of particulate hydrolysable amino acids (PHAA). Pictures of CSP taken by microscopy and the correlation between composition of PHAA and the ratio of Chl a/CSPcolor showed that CSP were relatively degraded due to delivery of old terrestrial protein to river section and extensive microbial degradation during mixing at the upper and middle parts of the estuary, whereas CSP in lower estuary appeared to be more labile due to higher fresh algal production. The contribution of CSP nitrogen (CSP-N) to the particulate nitrogen (PN) pool was 34.98% in summer and 30.8% in winter. The conservative estimate of CSP-N input flux in the Pearl River Delta was about 6 × 10⁶ mol N d–1. These results suggested that CSP was a significant pool of organic nitrogen in the PRE. The study of CSP composition in terms of nitrogen provides new insight into the roles of CSP on nitrogen biogeochemical processes in the turbid and productive estuarine system.
Introduction
Organic microgel particles are ubiquitous in the aquatic ecosystems of the world (Passow, 2002; Mari et al., 2017). The discovery of abundant gel-like particles, such as the proteinaceous Coomassie Blue stainable particles (CSP) and the transparent exopolymer particles (TEP) have gathered attention and highlighted the importance of organic microgel-like particles in marine ecological and biogeochemical processes in the world (Verdugo, 2012). Two mechanisms for the production of gel particles have been identified: (1) Exopolymer fibrils and colloids can be aggregated by physical processes (Engel et al., 2004; Burd and Jackson, 2009) or by the abiotic process from spontaneous coagulation of dissolved organic matter (OM) to particulate gels (Chin et al., 1998); (2) Gel particles can also be produced by the sloughing of mucus or lysis of phytoplankton cells (Thornton, 2004). Since CSP size varies over a broad size spectrum, their protein may potentially be utilized by a variety of organisms (Mari and Kiorboe, 1996; Lemarchand et al., 2006). Therefore, microgel-like particles establish an important link between the microbial loop and classic food webs (Dilling et al., 1998; Grossart et al., 1998). CSP and TEP are dissimilar particles in terms of their vertical distributions and sources (Cisternas-Novoa et al., 2015). In addition, CSP can be more easily degraded by heterotrophs and have a short turnover time, whereas TEP are more prone to aggregation, potentially promoting downward transport of OM (Engel et al., 2015; Sun et al., 2018). Previous studies demonstrated that CSP concentration was closely and positively related to the Chl a concentration (Engel et al., 2015; Ziervogel et al., 2016; Thornton, 2018). In coastal waters and lakes, CSP can range between 106 and 108 L–1 (Long and Azam, 1996; Lemarchand et al., 2006; Thornton, 2018). However, most studies are investigating CSP in ocean and freshwater, few data are available on measurement of CSP abundance and dynamics in estuarine systems (Lemarchand et al., 2006; Engel and Galgani, 2016; Yue et al., 2018), and their roles in biogeochemical and ecological processes remain largely unknown.
Estuaries are among the most challenging environments in which to investigate the sources, transformation and fates of particulate and dissolved OMs (Hedges and Keil, 1999). CSP serve as a potential source of bioavailable nitrogen (Cisternas-Novoa et al., 2015; Thornton, 2018), therefore, information on the dynamics of CSP can provide a new insight to nitrogen cycling in estuaries system.
The Pearl River estuary (PRE) is a highly dynamic estuary along the South China coast (Figure 1). The PRE receives 3.26 × 10¹¹ m3 of fresh water annually from the Pearl River and transports 85 × 106 tons of suspended particulate matter to the South China Sea (Zhang et al., 1999; Li et al., 2006). It is the second-largest river in China in terms of flow, and approximate 80% of the total river discharge takes place in the rainy season (from April to September) (Zhao, 1990). Most area of the PRE is shallow with depth <10 m, except for the area around the outer islands and the deep channels with depth >20 m. In the Pearl River basin, about 80% of the suspended solids settle in the Pearl River Delta and 20% are transported out of the adjacent waters, indicating the strong trapping effect of the PRE.

Figure 1. Sampling stations of the Pearl River estuary.
In the 1980s, the OM in the PRE mainly originated from the terrestrial soil (Gao et al., 2002). However, since the 1990s, the interception of large reservoirs in the upper reaches of the Pearl River reduced OM concentration in suspended sediment and land-sourced inputs (Zhan et al., 2019). On the contrary, a large amount of anthropogenic reactive nitrogen was discharged into the PRE being the increasing human activities (agriculture, industry, urbanization, etc.) from the Pearl River Basin and coastal areas (Huang et al., 2003; Dai et al., 2006), which greatly promoted the growth of phytoplankton in the PRE. As a result, the sources of OM in the Pearl River Delta have changed in the last 30 years, particularly in the southern waters below the Humen outlet, where the contribution of estuarine biogenic particulate matter to total OM pool has increased (He B. et al., 2010; He B. Y. et al., 2010). Thus, it can be assumed that autochthonous CSP are abundant and contribute substantially to organic C and N in the PRE. The recent study showed that sedimentary nitrogen removal mainly depended on particulate OM (POM; allochthonous or autochthonous) deposited onto sediments, rather than inorganic forms in overlying water in the PRE (Tan et al., 2019). Addition of high concentration of Skeletonema costatum and particulate polysaccharides to the sediment can accelerate nitrification and denitrification through the remineralization process (Yue et al., 2020), implying that CSP dynamics, such as their distribution, settling and transport throughout the estuary might have a potential effect on the nitrogen removal in estuaries.
Extensive research effort has been made to improve the understanding of N origin, distribution, and fate in the PRE (Chen et al., 2004; Zhang et al., 2014; Ye et al., 2015, 2016), particularly for summer when the terrestrial input is high. However, the characteristic of CSP in the PRE are largely unknown.
In this paper, it was aimed to address the following research questions: (1) What are the spatial patterns of CSP concentrations in the PRE? (2) How do CSP characteristics vary with physical and bio-chemical parameters, such as particulate hydrolysable amino acids (PHAA) and Chl a; (3) What are their origins and fate in the PRE and what are the contributions of CSP on the particulate nitrogen (PN) pool in the PRE?
Materials and Methods
Sampling and Analysis of Chemical Parameters
Two cruises were conducted by the vessel with a gross tonnage of ∼100 tons from 15 to 18 August 2016 and from 9 to 12 January 2017, respectively. Water samples were collected near the surface (0.5 m depth) and bottom (0.5 m above bottom) layers in the PRE, using 5.0-L Niskin bottle (Figure 1). In situ environmental factors (salinity, pH, turbidity, and temperature) were measured using a YSI 6600 sonde (YSI Inc., United States). Chl a concentrations were determined after extraction in 90% acetone overnight (Parsons et al., 1984).
CSPcolor concentration was the concentration of CSP determined spectrophotometrically after staining with a solution of 0.04% Coomassie Brilliant Blue (CBB, G-250) following the method of Cisternas-Novoa et al. (2014). Briefly, 10–50 mL water samples from the PRE were filtered onto 25 mm polycarbonate filters (0.4-μm) using low and constant vacuum (<150 mbar). The filters then were stained with 0.5 mL of CBB for 30 s. Then the filters were rinsed with Milli-Q water until the excess dye was removed. All filters were prepared in duplicate. Stained filters were transferred into 4 mL of extraction buffer (3% sodium dodecyl sulfate in 50% isopropyl alcohol) in 15 mL polypropylene tubes. Tubes were then sonicated at 37°C for 2 h. Absorbance of the solution was recorded at 615 nm using spectrophotometry. Milli-Q water was used for blanks in the same way. Bovine serum albumin (BSA) was used as standard (Cisternas-Novoa et al., 2014). As the measurement of CSP was calibrated using BSA, it could be effective way to convert CSP concentrations to nitrogen concentrations. The conversion assumes that CSP from the PRE bonds with Coomassie Blue in the same manner with BSA. Concentration of protein-N in CSP was calculated using the % N of the BSA (16%) supplied by the manufacturer (Sigma Chemical Co.) (Dortch et al., 1984), and the unit of CSP-N is μmol BSA-N-eq. L–1.
CSP abundances and equivalent spherical diameter (ESD) were measured by microscopy (Engel, 2009). Two to thirty mL were filtered (<150 mbar) onto polycarbonate membrane filters (0.4 μm) with Milli-Q water as blanks. The filters were stained with 0.5 mL CBB working solution and rinsed with Milli-Q water to remove excessive CBB. Then, filters were placed onto Cytoclear slides and stored at –20°C until analysis. Images were taken at a magnification of × 200 with a light microscope (Olympus BX53, Japan), and CSP abundance and ESD were determined by using Image J software. The abundance of CSP adsorbed with silt and debris materials was determined using particle recognition on filters and image processing similar to the method used by Cisternas-Novoa et al. (2019). The blue channel pictures were used to quantify silt or detritus attached CSP after RGB split. In this way, silt, sand, and debris particles were readily distinguished from CSP stained blue.
A subsample of water (200–500 ml) was filtered onto Whatman GF/F filters in duplicate (<150 mbar) for PN and PHAA. For PN, carbonates were removed by exposing filters to fuming HCl for 12 h, and then filters were dried at 60°C overnight. Filters were put into tin cups and PN was determined using elemental analyzer (Elementar, vario EL cube) calibrated with an acetanilide standard according to Sharp (1974). For PHAA samples at S1, S4, S6, and S8, analysis was performed with some modifications following Fitznar et al. (1999). Duplicate GF/F filters were hydrolyzed with HCl (16%, 20 mL) and 100 μL of 1 mmol L–1 ascorbic acid inside sealed glass ampoules at 110°C for 24 h. Thirteen derivative amino acids (AAs) serine (Ser), arginine (Arg), glutamic acid (GlX), aspartic acid (AsX), glycine (Gly), threonine (Thr), tyrosine (Tyr), valine (Val), alanine (Ala), phenylalanine (Phe), isoleucine (Ile), leucine (Leu), gamma-amino-butyric acid (GABA) were separated on a 1260HPLC (Agilent) with a Phenomenex™ Hyperclone column (BDS C18,150 × 4 mm) with guard column (4 × 2 mm) after derivatization with o-phthalaldehyde and mercaptoethanol. The internal standard was α-amino butyric acid (Aba). The relative standard deviation was <5%.
Statistics
CSP spatial differences were measured by Paired-sample t-test. Difference of CSP between each station was determined by Tukey HSD test. Pearson correlation was used to analyze the correlations between CSP properties and environmental factors. Statistical analysis was performed using Origin 8.0 (OriginLab Corporation, United States) software.
Results
The Physical Characteristics of Sample Locations in the Pearl River Estuary
The freshwater discharge from the Pearl River delta was about 552 × 109 m3 in August 2016 and 89 × 109 m3 in January 2017, respectively (Data from the Zhujiang Sediment Bulletin, 2016 and 2017)1. Vertical profiles of salinity showed distinct seasonal pattern driven by river runoff and monsoon strength. Water was stratified in the mid- and lower- estuary during the summer cruise of 2016 (Figure 2A). During the winter cruise, however, the estuary was well mixed based on salinity profiles, due to the river runoff reduction and the increased northeast winds (Figure 2B). The environmental factors are given in Table 1. Low dissolved oxygen concentration occurred in the upper section during summer and winter. Dissolved oxygen concentration below 2 mgL–1 at S1 in bottom during summer indicating hypoxia at bottom. S5 and S6 are in the edge of west channel of the estuary. High turbidity at S5 and S6 at bottom was closely related to the intrusion of salt water and resuspension of sediment.
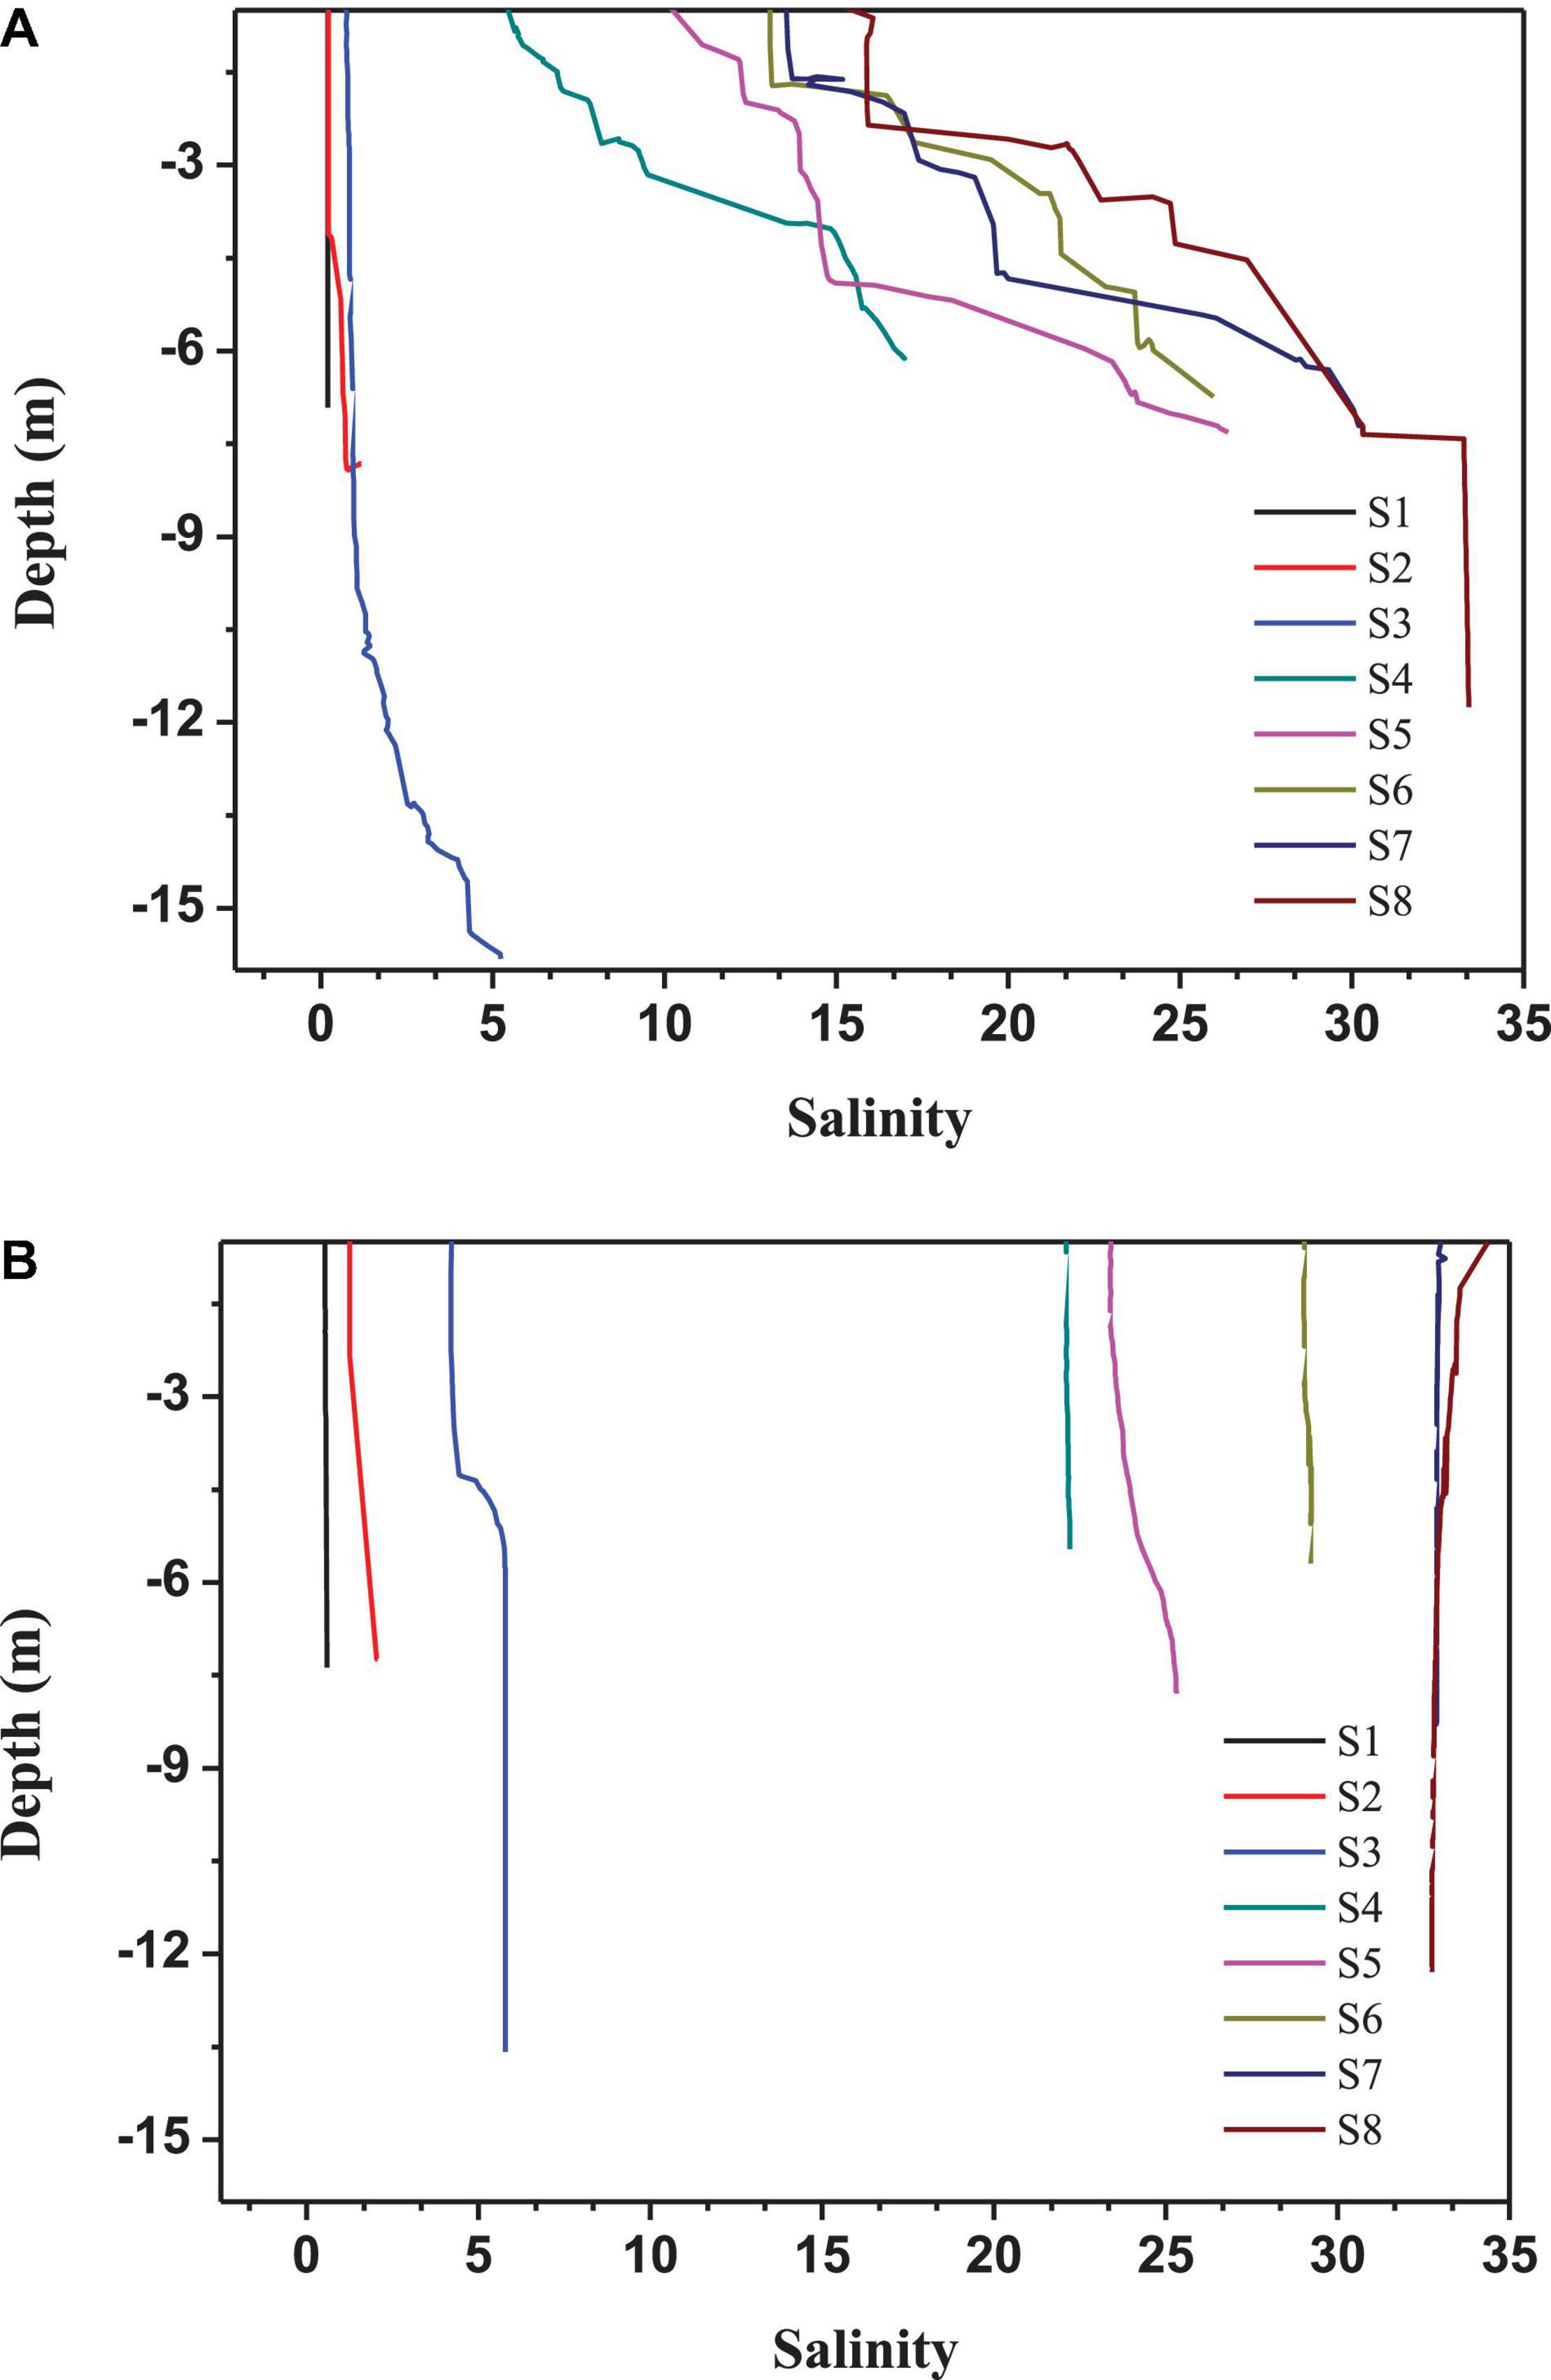
Figure 2. Vertical distribution of salinity in the Pearl River estuary in (A) August 2016 and (B) January 2017.
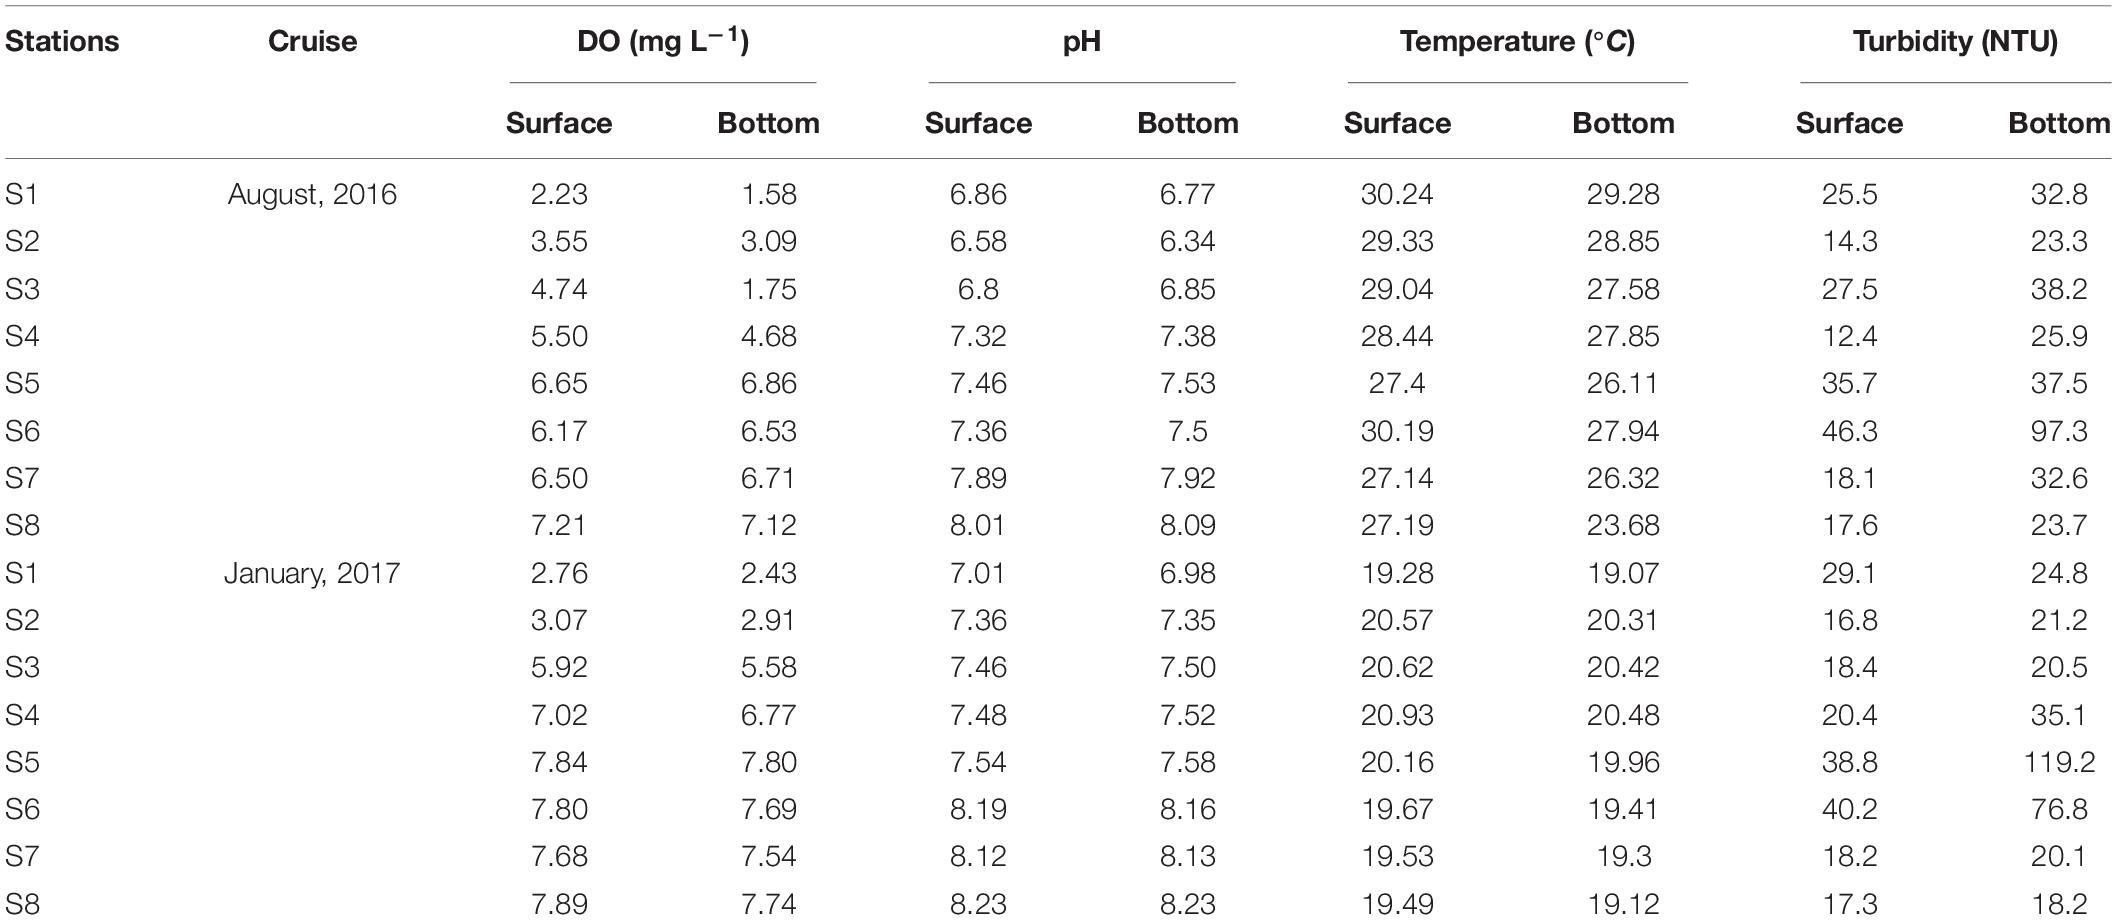
Table 1. Environmental factors in the Pearl River estuary during August 2016 and January 2017 cruise.
Concentration of CSP and Chlorophyll a
Figure 3 shows the variation of Chl a and CSPcolor concentrations during two cruises. In the summer cruise, CSPcolor concentrations ranged between 73.7 and 685.3 μg BSA eq L–1, with an average of 325 ± 227 μg BSA eq L–1 (Figure 3A). Chl a concentration in the surface was reduced from 17.3 μg L–1 at S2 in zone 1 to the lowest value 3.6 μg L–1 at S5 in zone 2. High Chl a concentration was also found at more oceanic station (S8) with 15.6 μg L–1 in the surface water. Similar to the distribution of Chl a, concentrations of CSP in surface were significantly higher in zone 1 (river section) and zone 3 than those in zone 2 (t-test; p < 0.05). CSPcolor concentration in the bottom was significantly higher than that in the surface (Figure 3B) (t-test; p < 0.05).
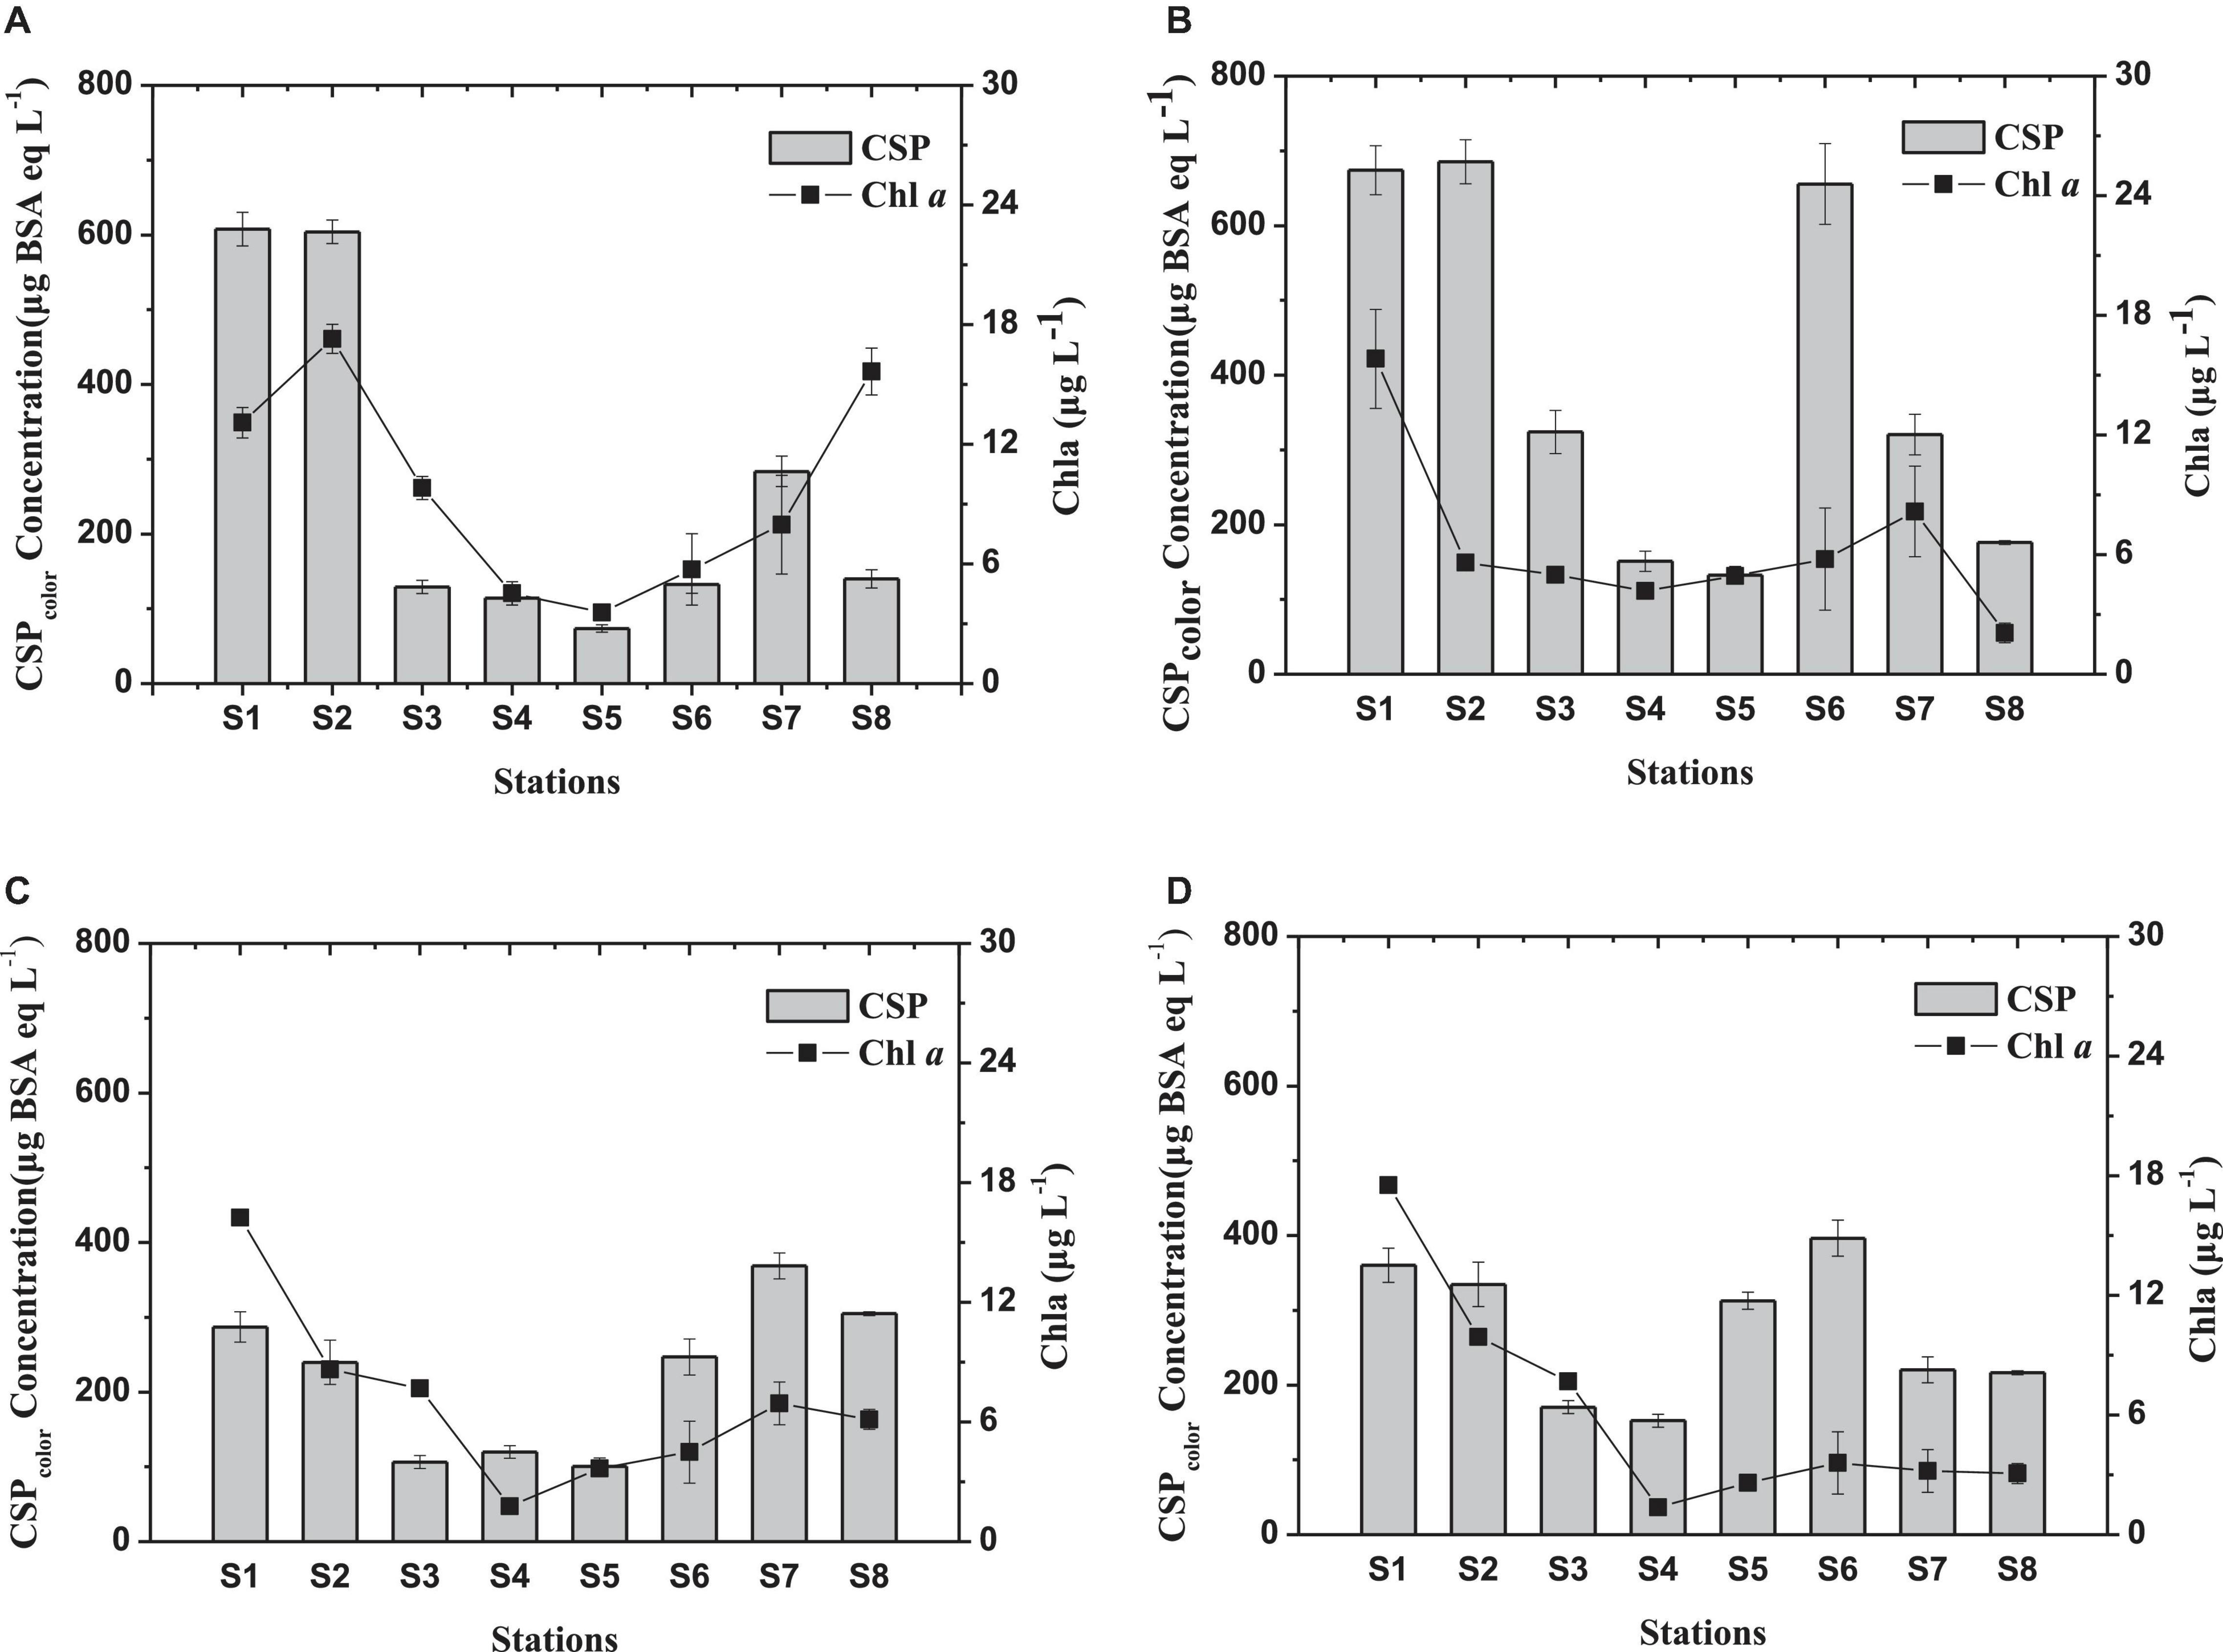
Figure 3. Spatial variations of Chl a and of CSPcolor concentration in the Pearl River estuary in August 2016 [(A) surface and (B) bottom] and January 2017 [(C) surface and (D) bottom].
During the January 2017 cruise, CSPcolor concentrations ranged from 106.4 to 396.4 μg BSA eq L–1, with an average of 246 ± 80 μg BSA eq L–1 (Figures 3C,D). High concentrations in surface were found at the lower estuary (Figure 3C). CSPcolor concentrations in the surface and the bottom was not significant different during winter (t-test; p < 0.05). The spatial variation of Chl a concentration during the winter cruise showed a similar pattern as in summer except for the sample at station S8, which showed a decrease from S7.
Although CSP showed a similar spatial distribution as Chl a, no overall significant correlation was observed between the CSPcolor and Chl a concentration (p > 0.05, n = 32). CSP(ESD ≥ = 2 μm) abundance in the surface was ranging from 6.4 × 10⁶ L–1 to 9.2 × 10⁷ L–1 and from 1.3 × 10⁷ L–1 to 6.5 × 10⁷ L–1 during summer and winter, respectively (Figure 4). The spatial distribution of CSP abundance was similar to the CSPcolor concentration determined by the spectrometer.
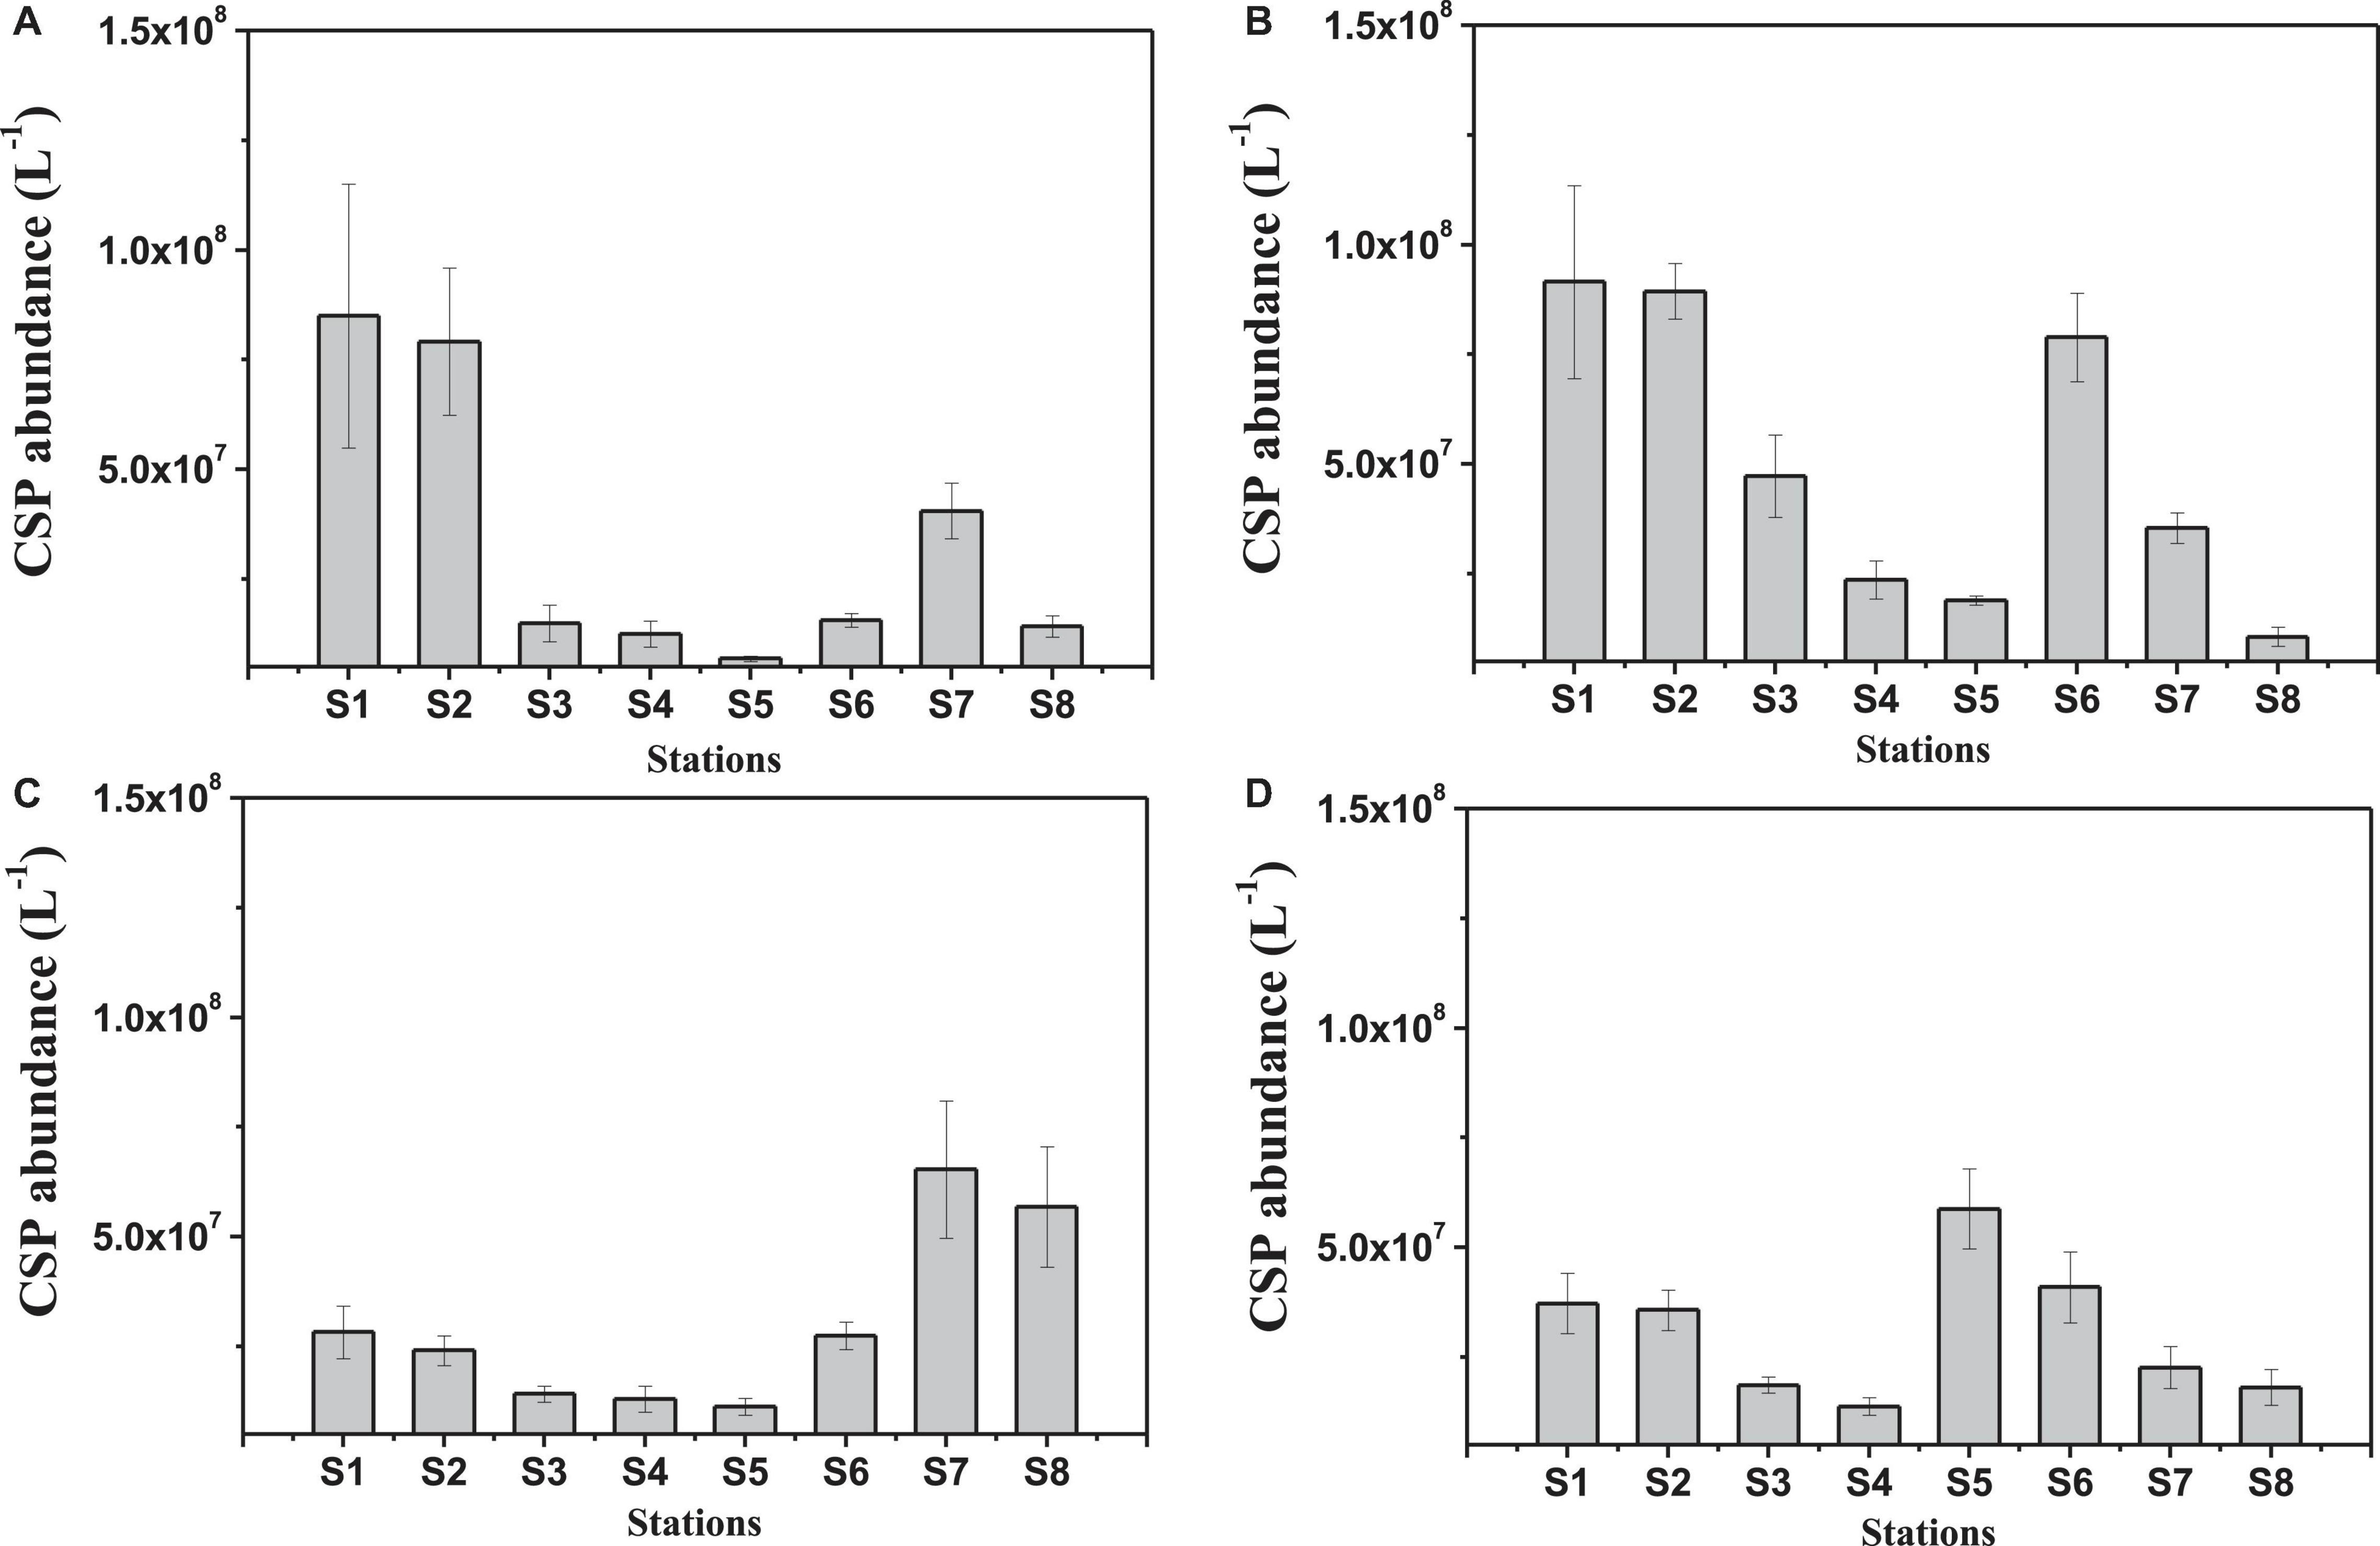
Figure 4. Spatial variations of CSP abundance in the Pearl River estuary in August 2016 [(A) surface and (B) bottom] and January 2017 [(C) surface and (D) bottom].
Figure 5 shows pictures of CSP taken by microscopy. About 20% of the CSP adsorbed with silt and debris materials to form large-size flocs in the surface samples of the river reach (Figures 5A,B), while these large biomineral floc enriched in protein rarely appeared in the mixing zone and lower estuary. Moreover, in the river reach, aggregates of cyanobacteria, such as Spirulina spp., were stained by CBB (Figure 5A). In contrast, CBB-stained diatoms or diatom spines did not occur in zone 1. In the mixing zone (zone 2), the smaller-sized CSP <10 μm were most abundant (Figure 5D). At more saline stations, many diatom aggregates stained by CBB were observed, but free and non-attached CSP were less abundant than in the upper estuary (Figures 5E,F).
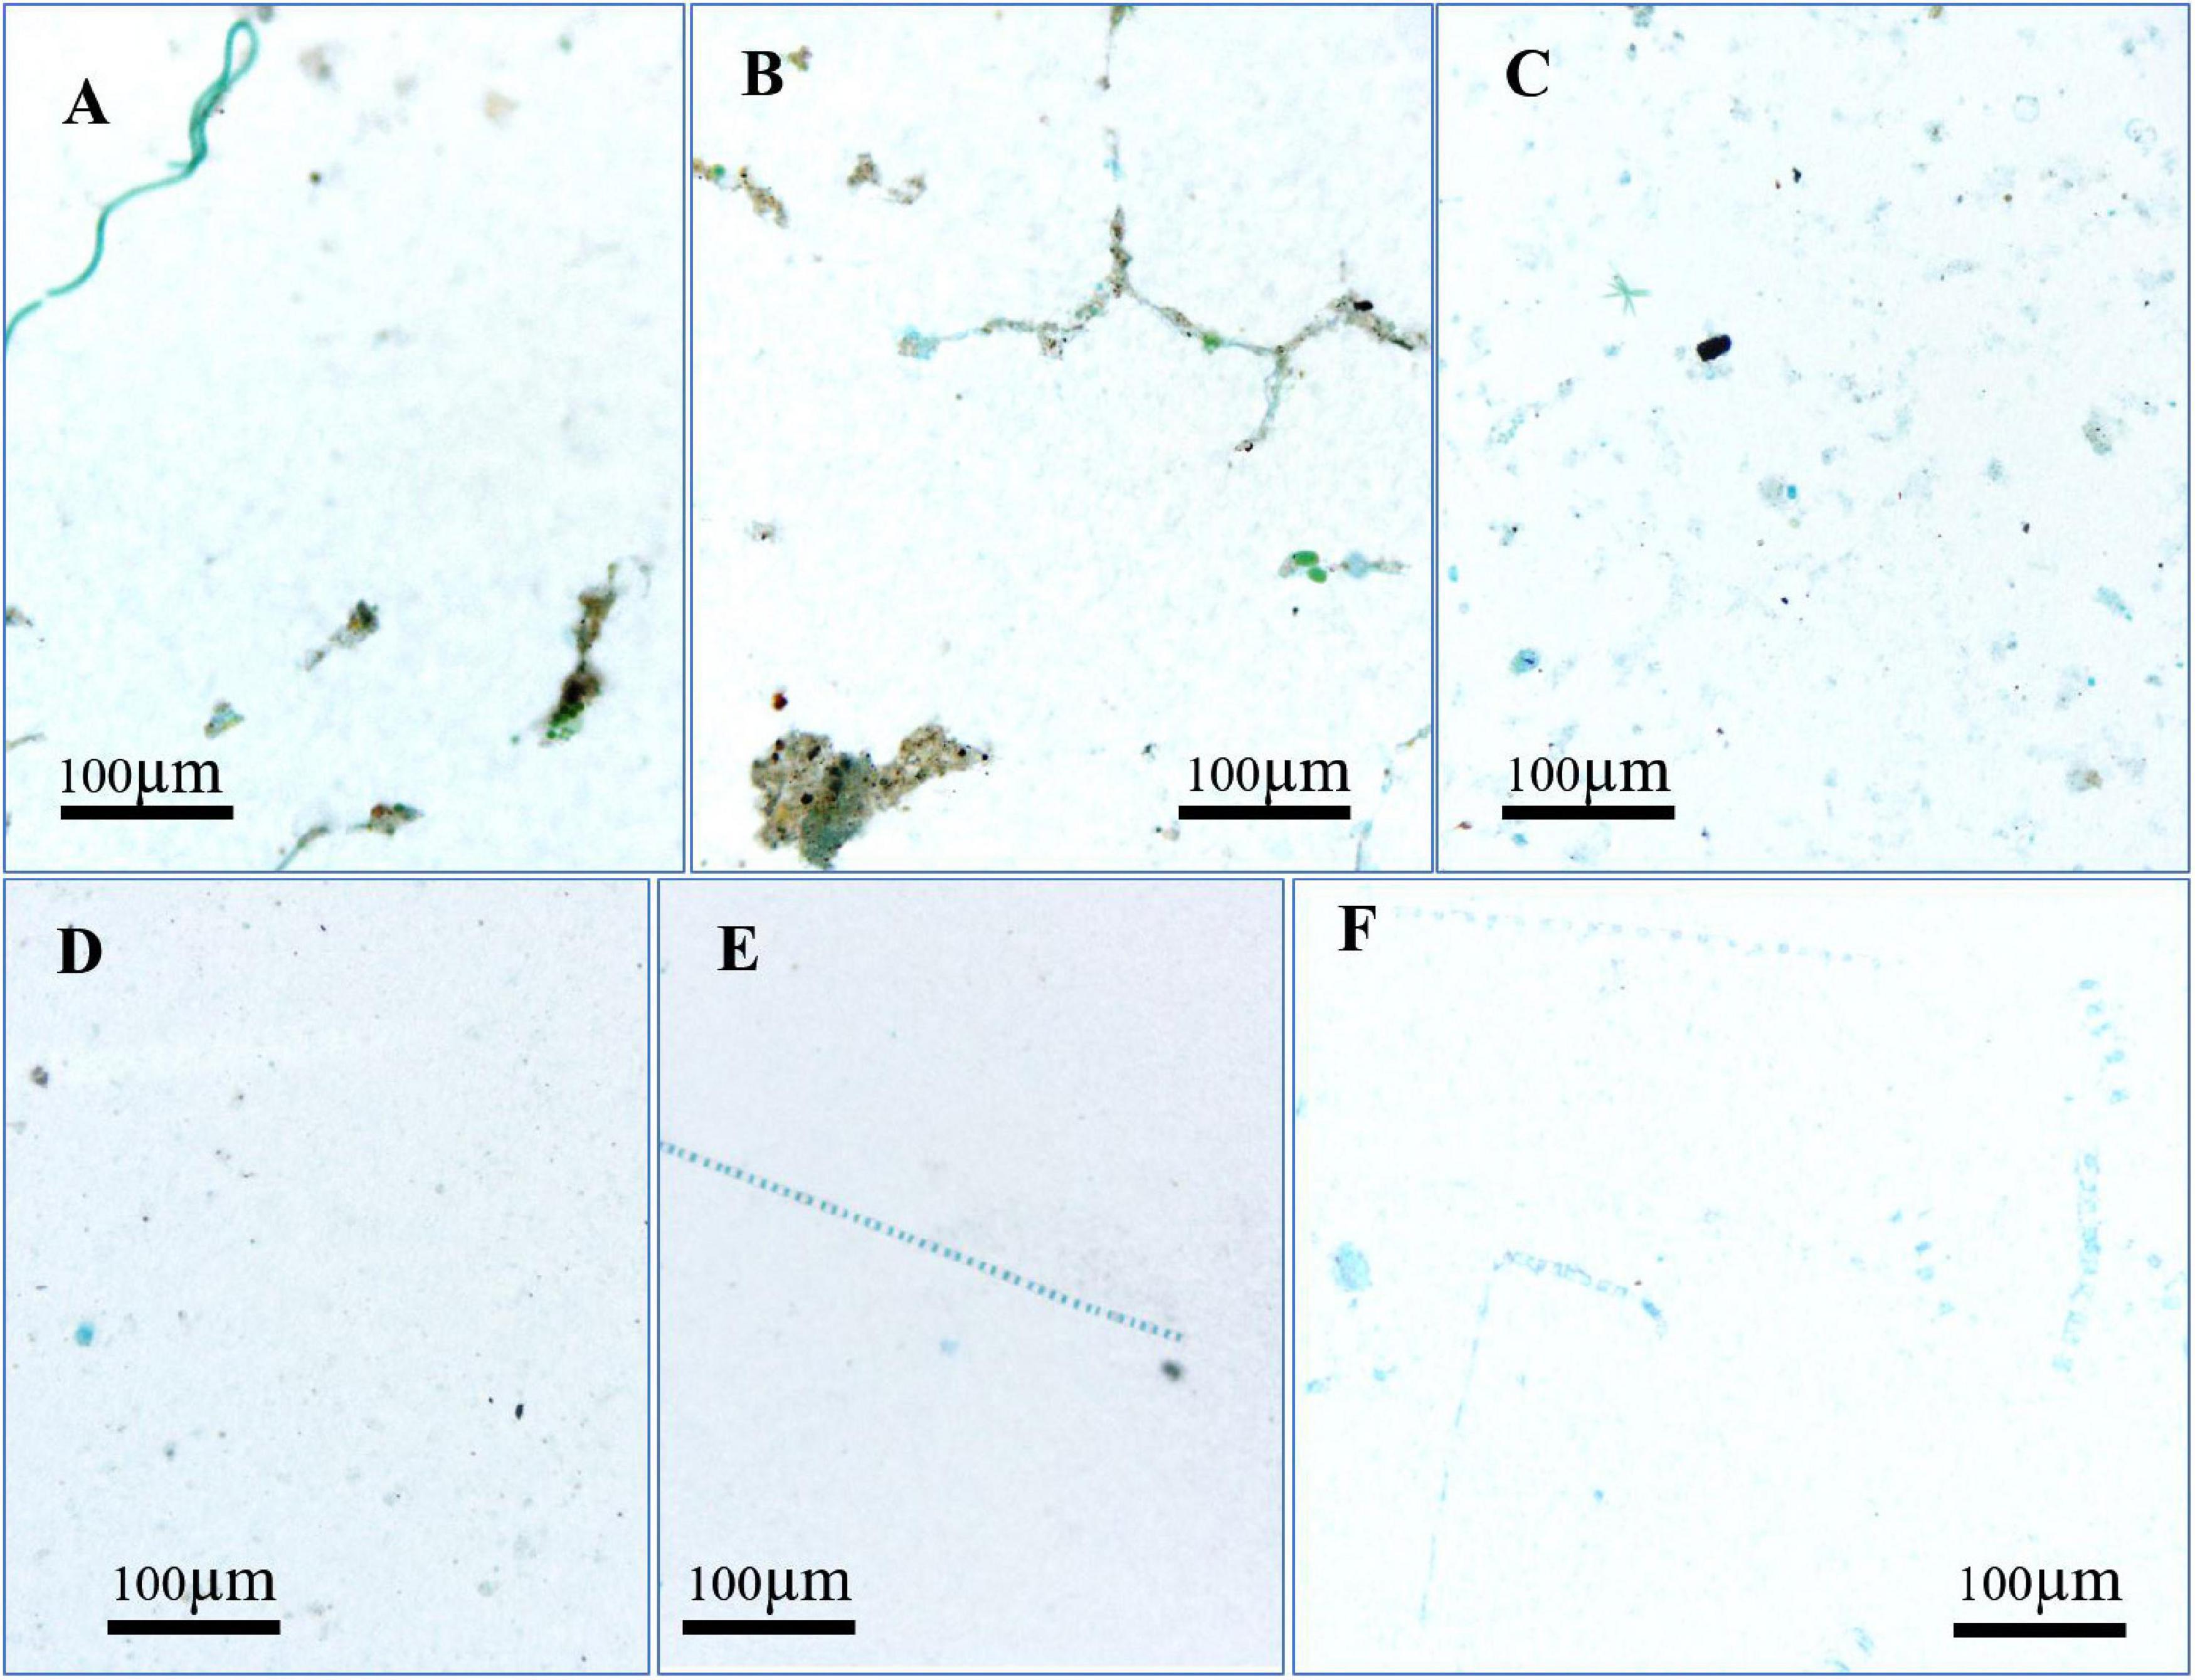
Figure 5. Microscopic photos of CSP in surface (A,B) and bottom (C) in the river section, mixing zone (D,E) and lower estuary (F).
Particulate Nitrogen and Particulate Hydrolysable Amino Acids
Figure 6 shows the distributions of PN and PHAA in the PRE. PN concentration varied between 3.1 and 23.7 μmol L–1 in August 2016 and between 4.1 and 21.0 μmol L–1 in January 2017, respectively (Figures 6A,B). High values of PN were found within the estuary relative to the water entering from land or seaward ends except for S7. The average percentage of CSP-N in the PN pool was 34.98% in summer and 30.8% in winter, respectively (Table 2). In the lower estuary, high percentages of CSP-N in PN were found from the samples in winter and from S7 samples during the August cruise, respectively (Table 2).
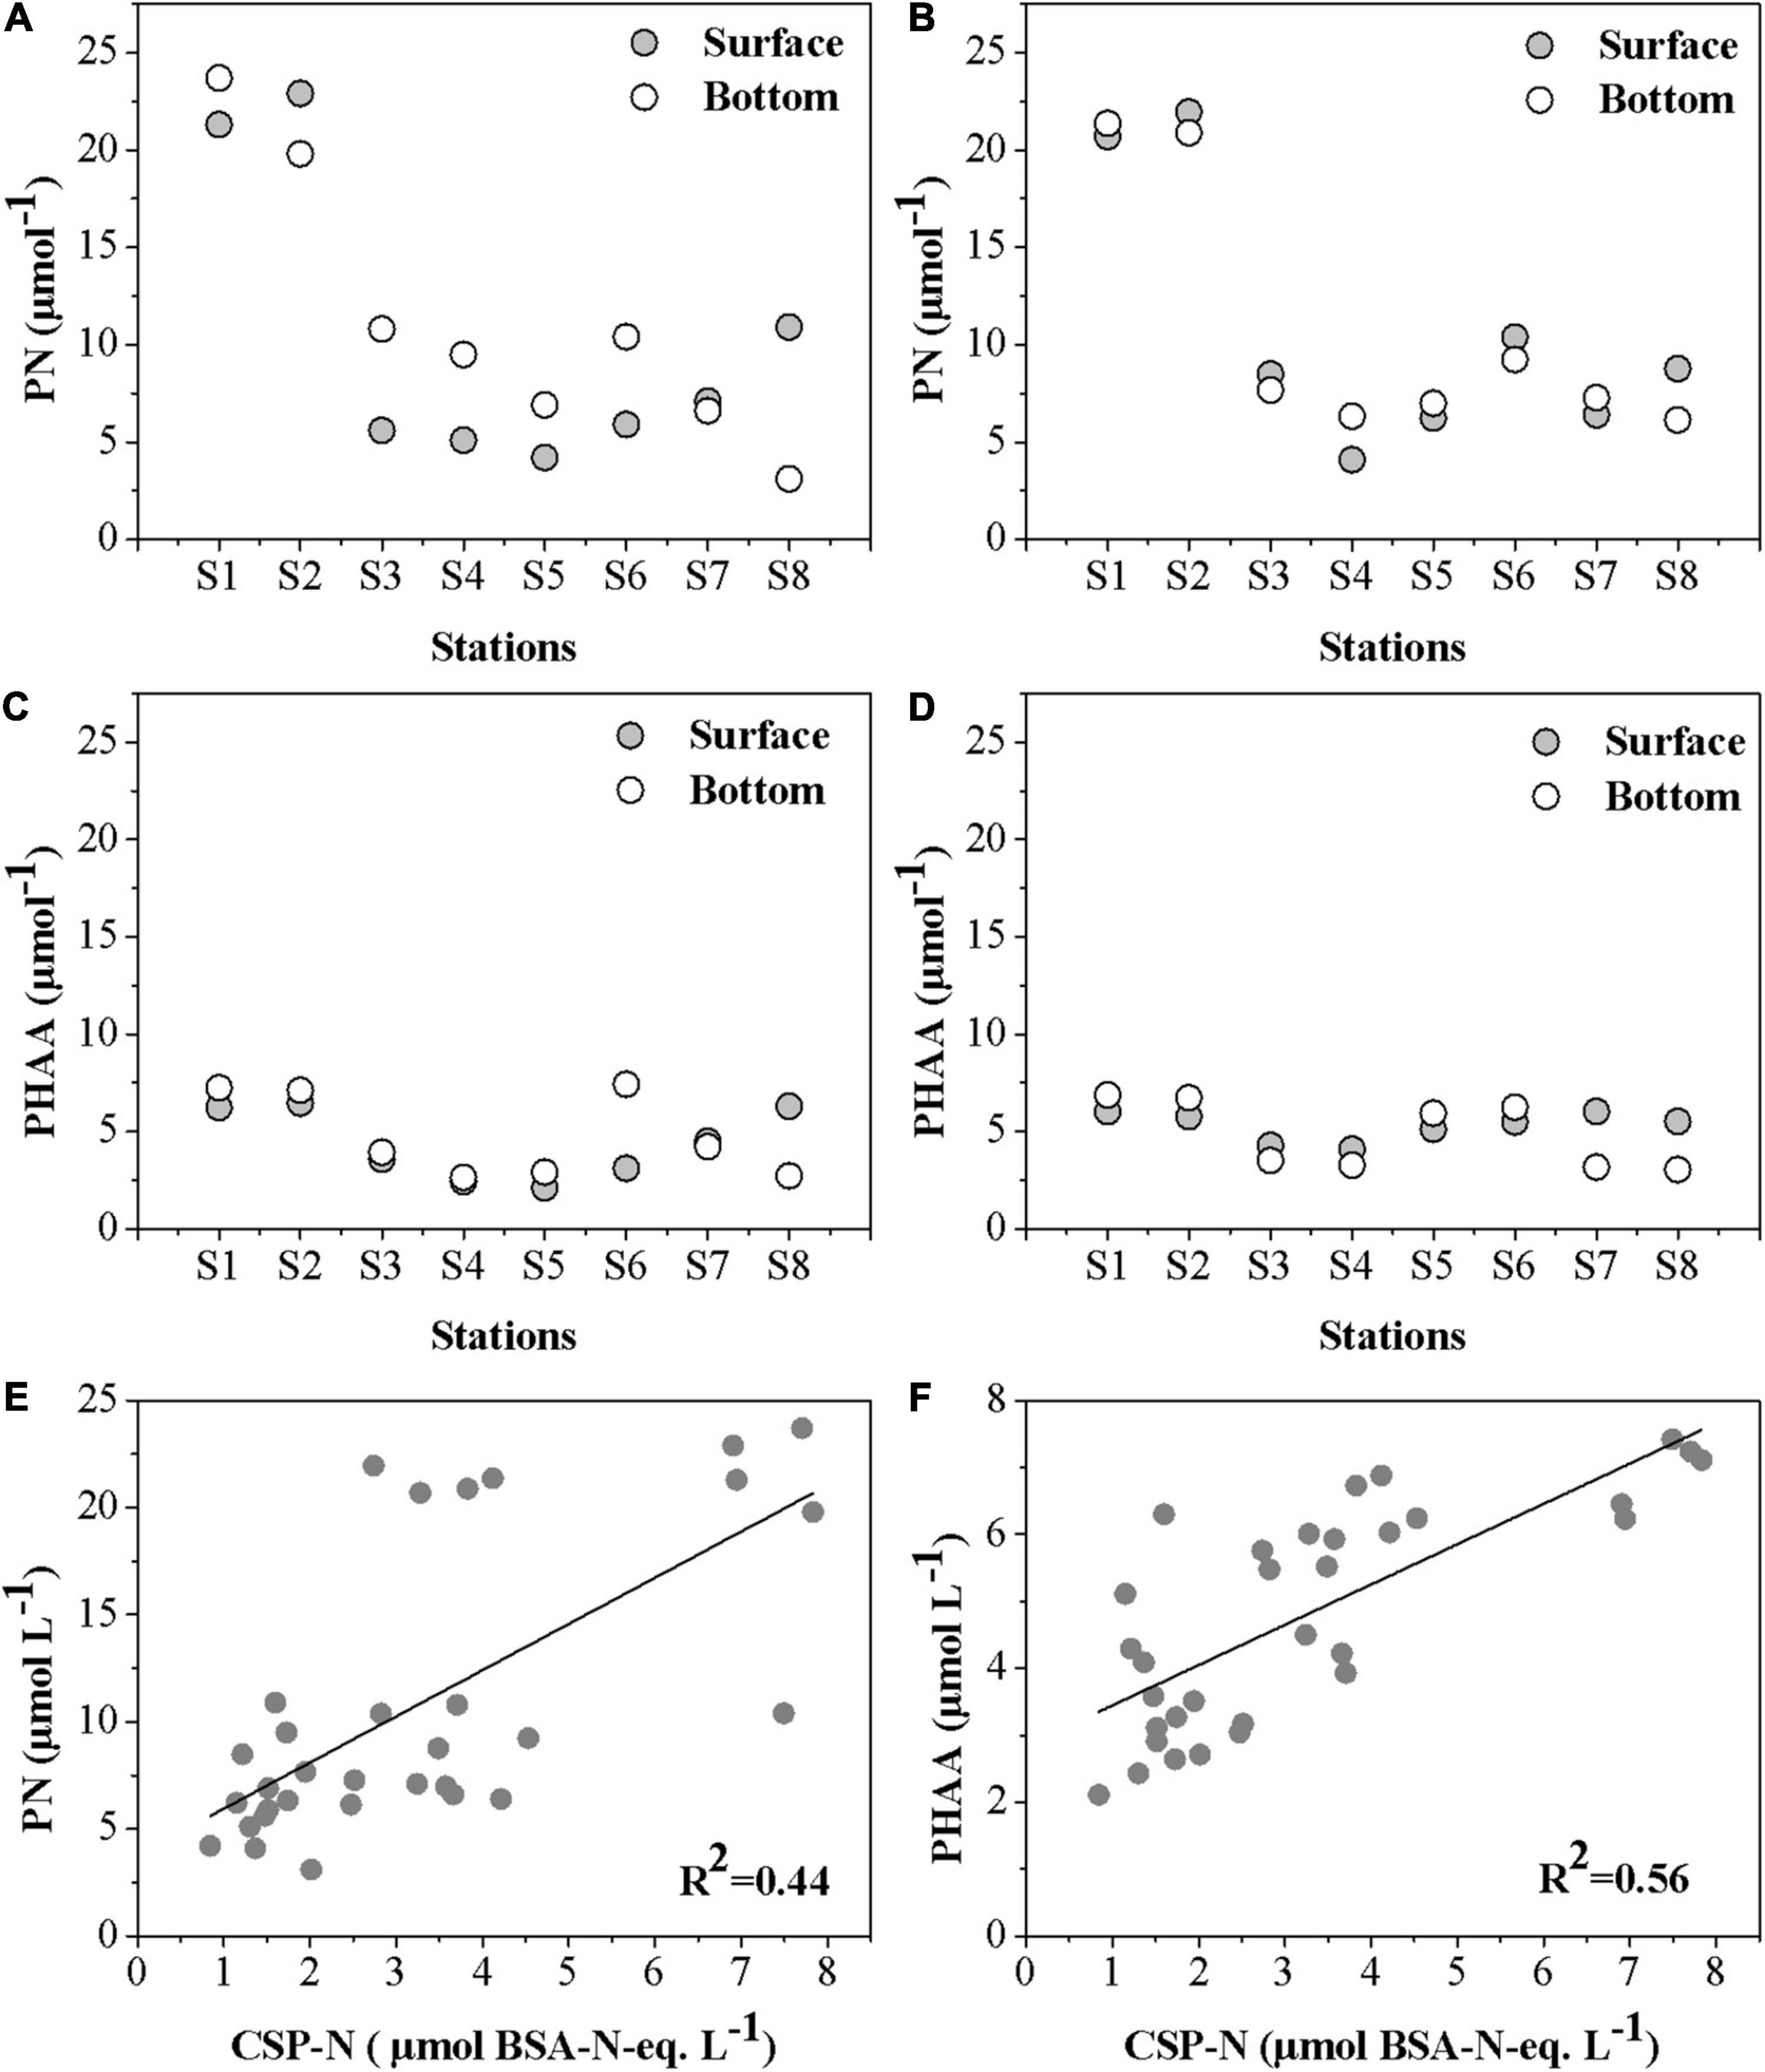
Figure 6. Spatial distribution of PN and PHAA in August 2016 (A,C) and January 2017 (B,D); and (E,F), the relationship between CSP-N concentrations and PN and PHAA in the Pearl River estuary.

Table 2. Contribution of CSP-N to PN in the Pearl River estuary during August 2016 and January 2017 cruise.
Particulate hydrolysable amino acid concentration was highest at S1 and showed lower concentrations in the middle of PRE (Figures 6C,D). CSP-N concentration was positively correlated with PN (p < 0.001, n = 16, r2 = 0.44) and PHAA (p < 0.001, n = 16, r2 = 0.56) (Figures 6E,F). The N content in CSP was comparable with the N content of PHAA. The dominant AAs in descending order were as follows: Gly, AsX, Ala, GlX, Leu, Thr, Ser, and Leu (Figure 7). Despite similar molar percentages of most AAs at different stations, some AAs showed slight differences along the estuary and between surface and bottom samples. AsX exhibited higher mole% in the mixing zone than those in in zone 1 and zone 3. Ala was high at S8 in surface (13.9%) where high Chl a concentration was observed in summer cruise. Higher distribution of AsX, Gly, and Ser appeared in the bottom than in the surface.
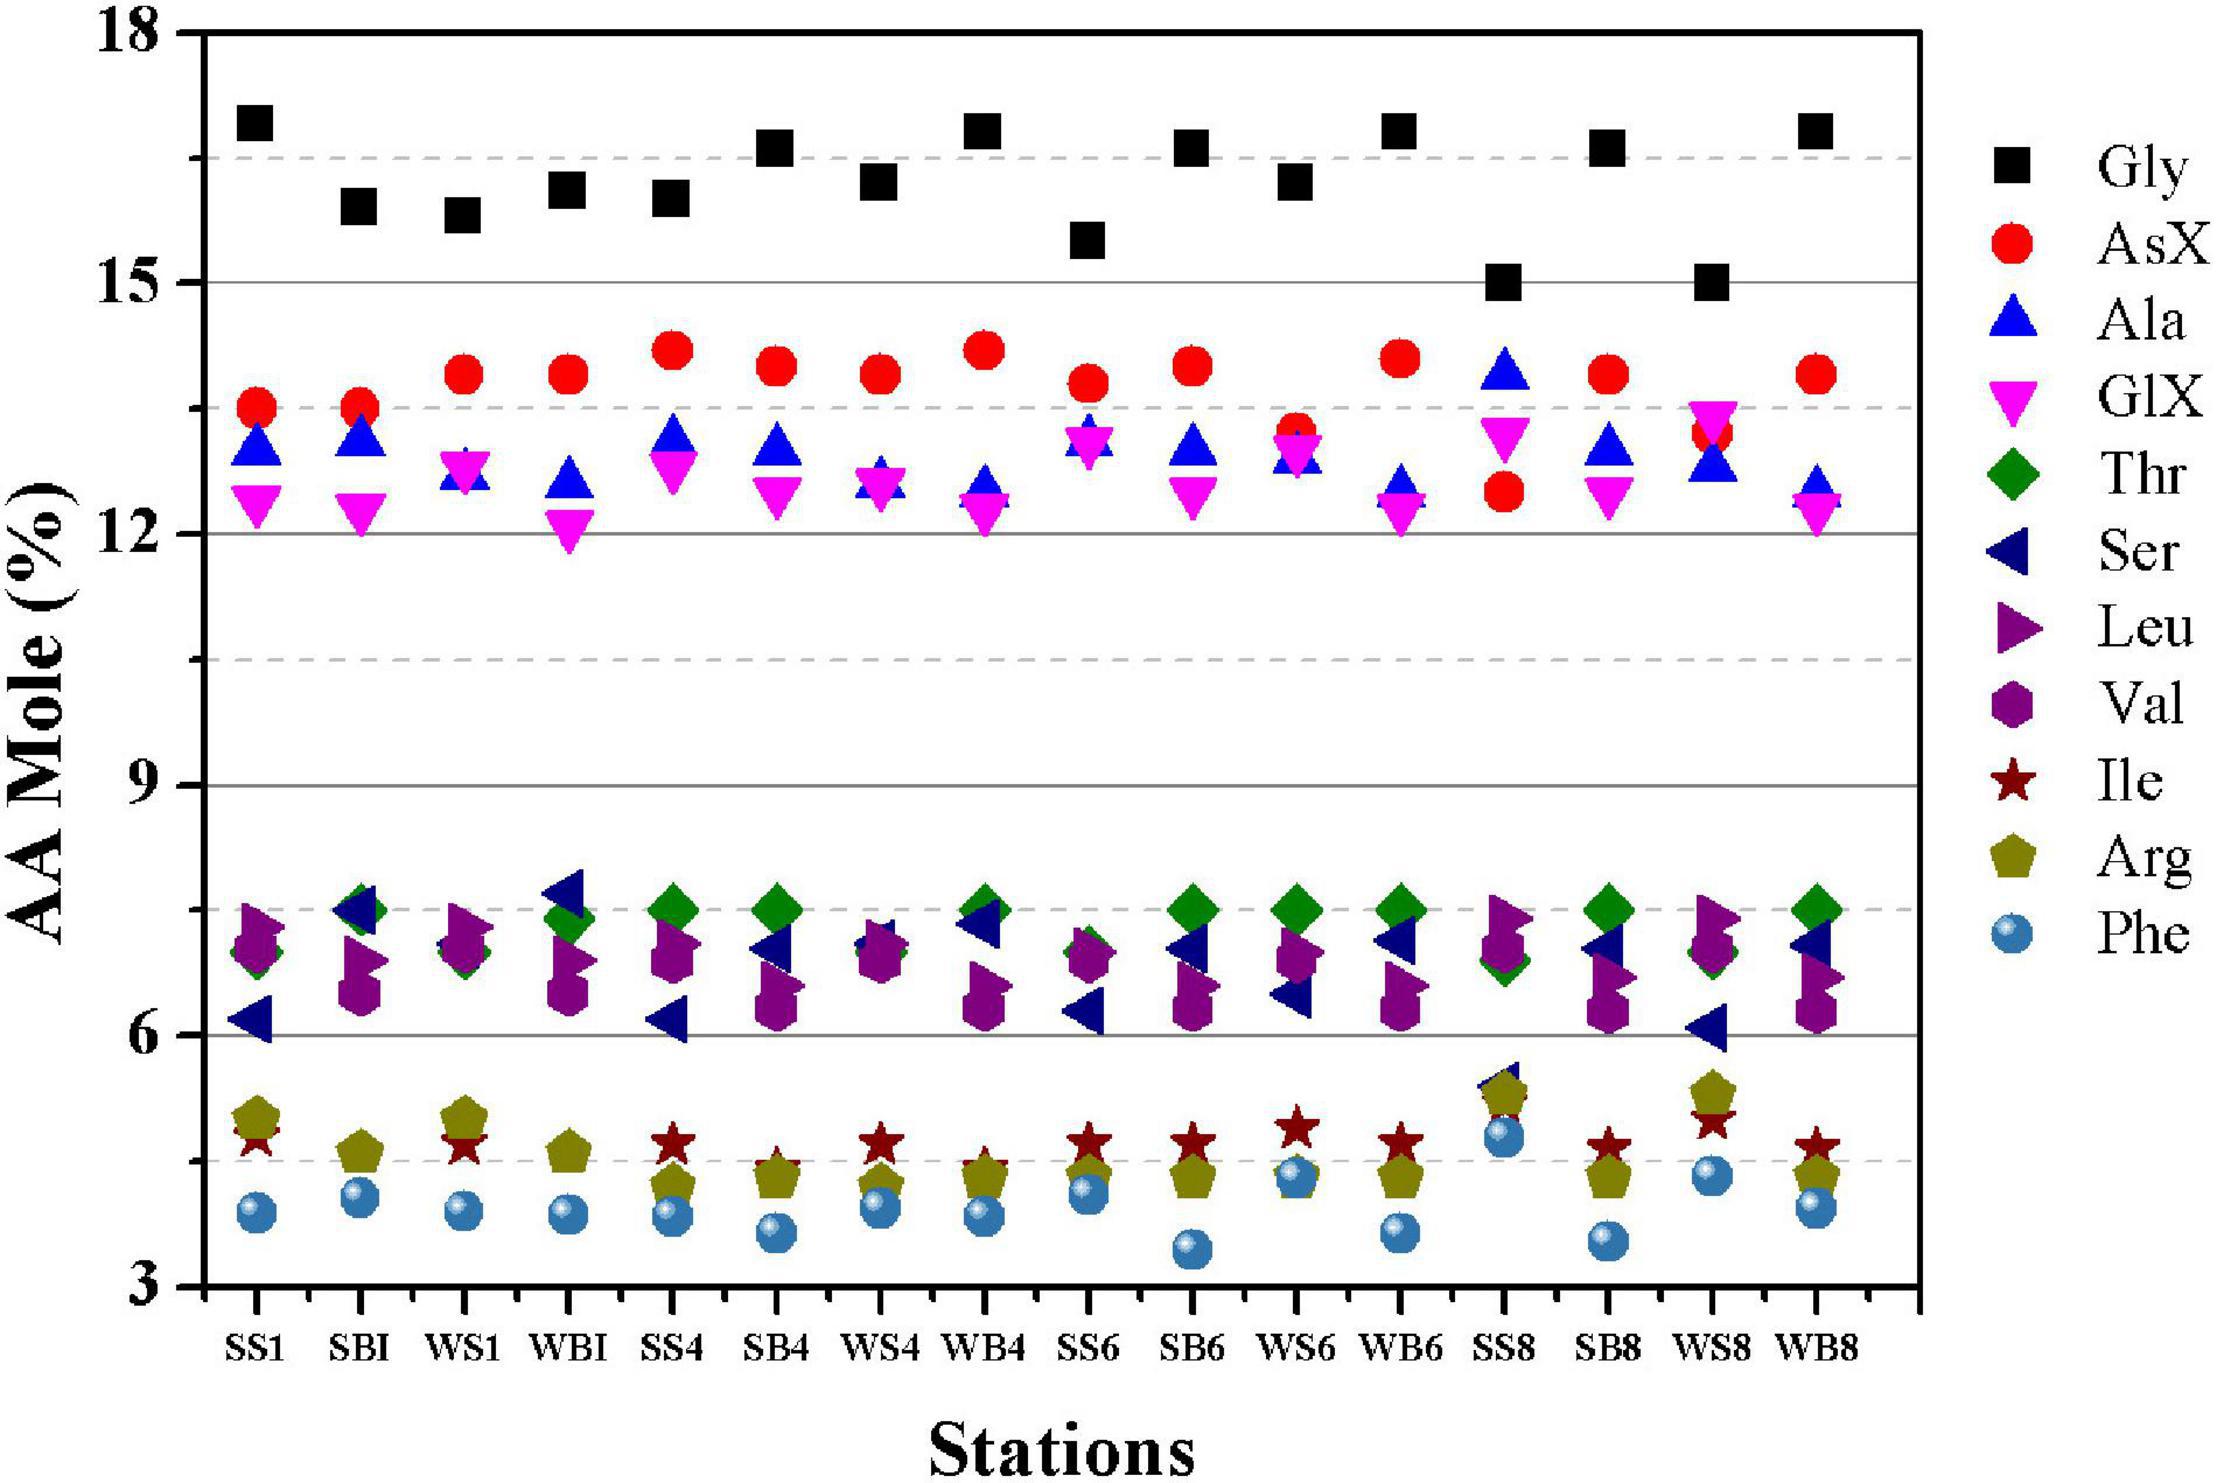
Figure 7. Amino acid spectra (mole percentages ≥ 3%) in particulate matter in the Pearl River estuary (SS1-SS8 and SB1-SB8 were the surface and bottom samples during summer at stations of S1, S4, S6, and S8, respectively; WS1-WS8 and WB1-WB8 were the surface and bottom samples during winter at stations of S1, S4, S6, and S8, respectively).
Discussion
Comparison of CSP Concentrations in the Pearl River Estuary With Other Environments
In this study, CSP abundance (ESD ≥ 2μm) in the PRE was comparable to those found in marine water ranging from 106 to 108 L–1 (Long and Azam, 1996; Engel and Galgani, 2016; Busch et al., 2017; Engel et al., 2020; Table 3). Due to higher phytoplankton biomass and terrestrial input in the PRE, in particular in the upper estuary, CSPcolor concentrations were much higher in the PRE than those in the oligotrophic seawater, i.e., a North Atlantic Bermuda Rise station (CSPcolor concentration 0.532–18.20 μg BSA eq. L–1) (Cisternas-Novoa et al., 2015). Compared to the Mississippi River plume (Ziervogel et al., 2016) and the Danube River (Luef et al., 2007; Table 3), CSP abundance in the PRE was orders of magnitude higher. In the study of Ziervogel et al. (2016), the stations were outside of the Mississippi River estuary (salinity ≥ 30) where Chl a concentration was low (average value of 1.4 μg L–1) in the surface water and the removal of CSP by the sinking and dilution was significant in the Mississippi River plume (Ziervogel et al., 2016). In contrast, most of the stations in this study were in the inner of estuary or in the river sections, which had relatively higher concentration of freshly produced CSP due to high Chl a content in the PRE (average value of 7.1 μg L–1), and received large amounts of terrestrial inputs within the inner parts, consequently yielding CSP accumulation in the PRE. Therefore, the large variability of CSP abundance among different rivers or estuaries could be attributed to the site-specific differences in environment and biological process.
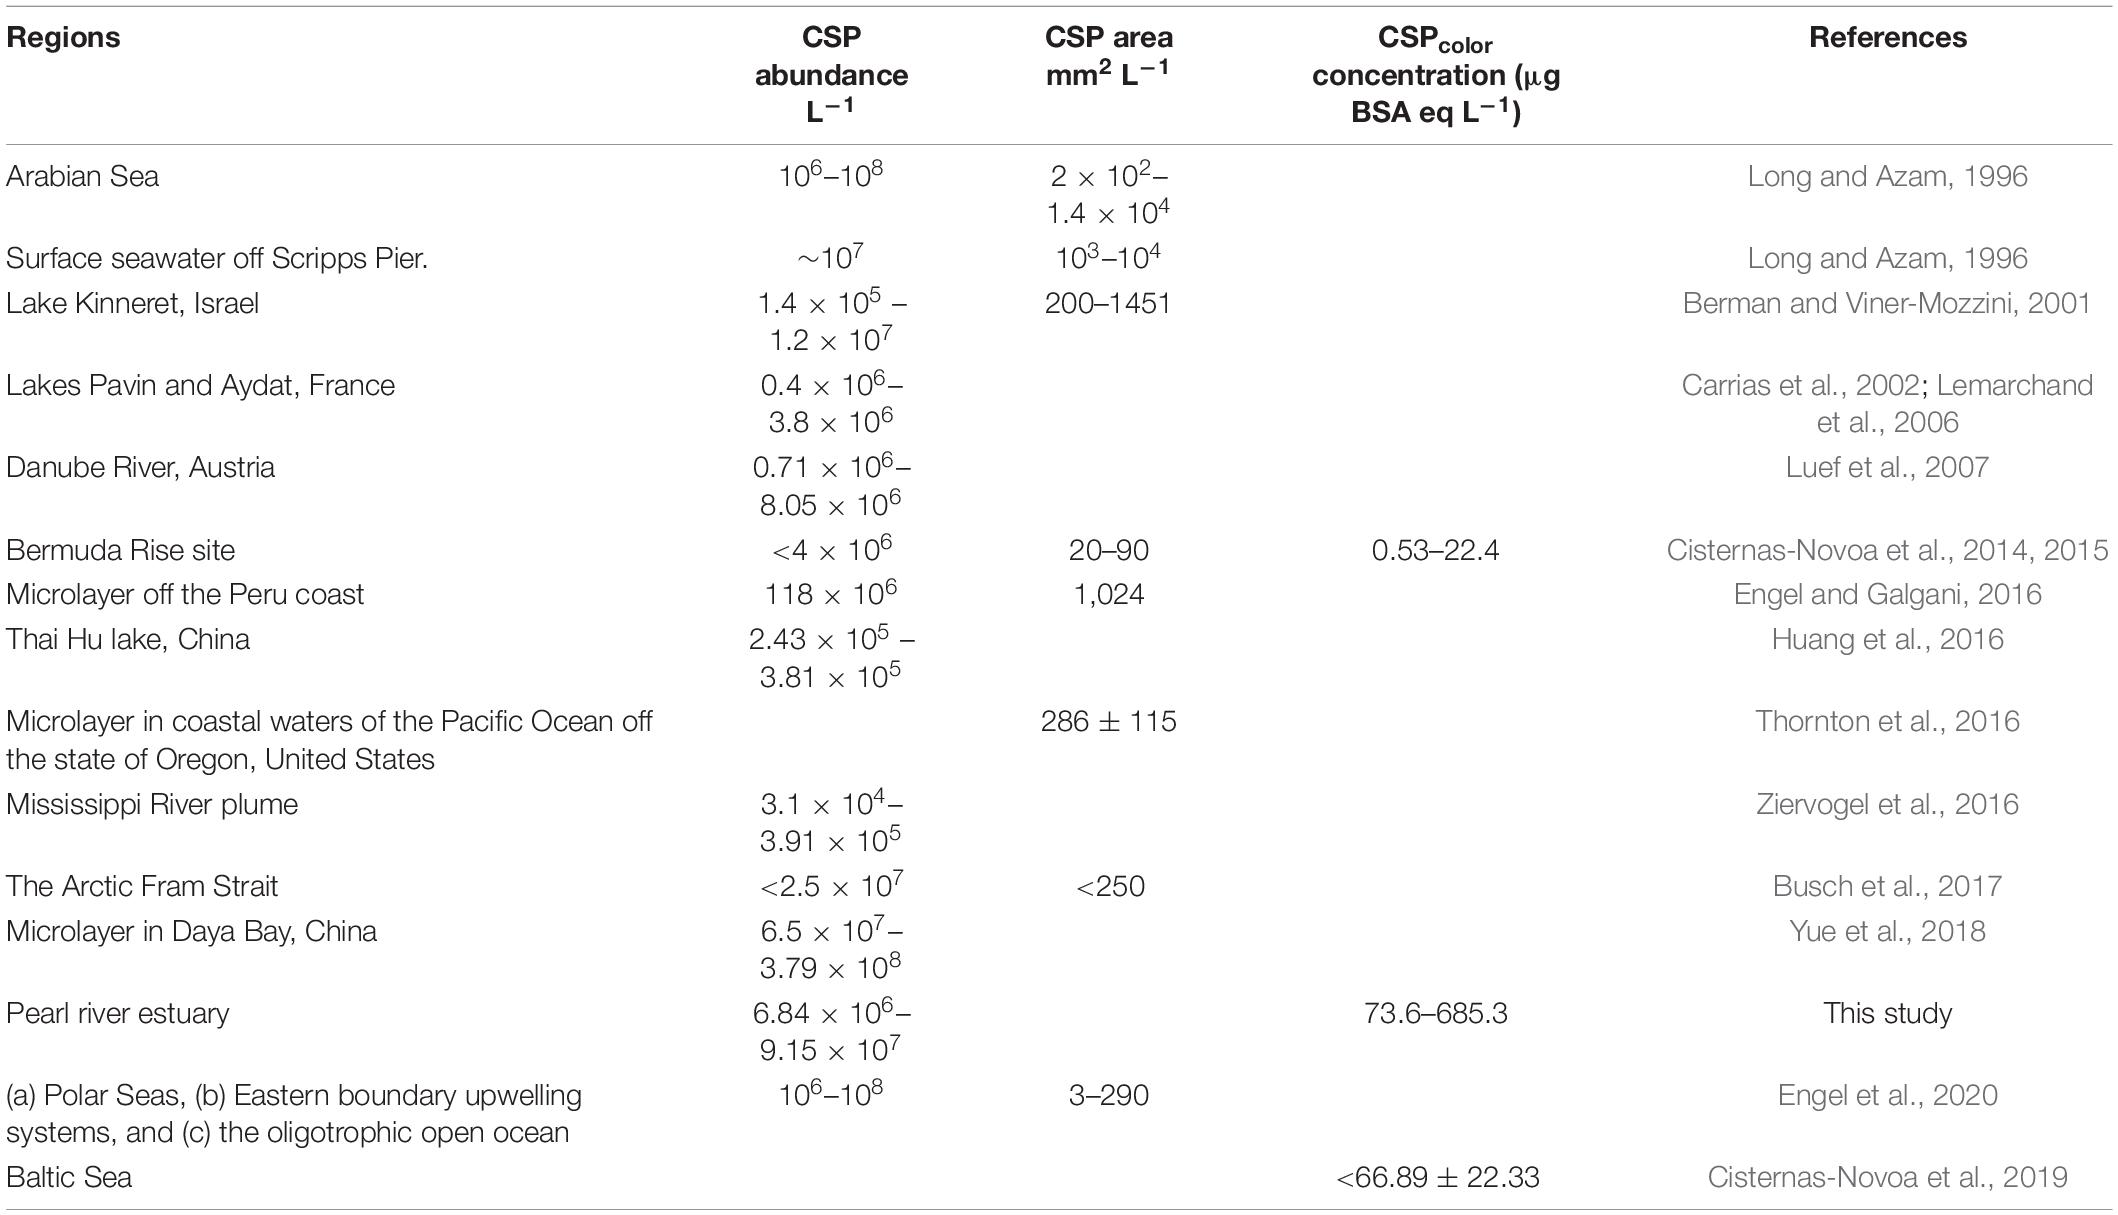
Table 3. CSP concentrations in different regions.
Phytoplankton Derived CSP
Compared to TEP, the sources and fate of CSP in most natural ecosystem remained largely unknown (Long and Azam, 1996; Engel et al., 2015; Thornton, 2018). In general, CSP in the marine system are thought to originate from autolysis and viral or bacterial lysis, extracellular excretions, grazing and microbial degradation of detritus (Mannino and Harvey, 2000; Cisternas-Novoa et al., 2015). However, estuaries are highly dynamic environments with particles originating from both terrestrial and marine inputs; data on CSP characteristics are limited for estuaries so far (Ziervogel et al., 2016).
Pictures taken by microscopy indicated that the primary origins of CSP in the PRE is autochthonous primary production. In the freshwater of the upper estuary, much of living phytoplankton cells, such as cyanobacteria and chlorophyta were stained by CBB. In the more marine stations of the estuary, chain-forming diatoms were stained by CBB, such as Skeletonema costatum, Chaetoceros spp., and Pseudo-nitzschia pungens. Although the alga themselves should not be considered as CSP, it is generally observed that higher autotrophic biomass leads to more gel particles. However, the correlation coefficient between CSP and Chl a is too low to show a good relationship. Therefore, other processes could influence the concentrations of CSP in the PRE (see section “Discussion” below). Similarly, the slight decoupling of CSP from Chl a distribution also occurred in the Mississippi River Delta (Ziervogel et al., 2016). Concentrations of CSP decreased from S7 to S8 during summer, although phytoplankton biomass was high at S8, which could be related to the sampling period coinciding with the stage of bloom building up and/or to the difference of phytoplankton composition (Granum et al., 2002; Prieto et al., 2002; Lourenco et al., 2004; Grossart et al., 2006; Engel et al., 2015).
Terrestrial Source of CSP
The discharge in August 2016 was 6 times that in January 2017 in the PRE. Therefore, higher freshwater runoff and terrestrial input could supply large amounts of CSP into the PRE in the wet season. At S1, CSPcolor concentration in the wet season was more than twice that measured in the dry season, although the difference of Chl a concentration was not significant between the two cruises. It can be speculated that one source of CSP in the PRE is the input of terrestrial material. About 20% total abundance of CSP from the surface sample in the upper of the PRE strongly adheres to debris and soil silt. Although the number of CSP that adhered to silt was small numbers, they made a greater contribution (50.2%) to the total CSP in terms of area in the upper of estuary due to their large particle size. The abundance of these bio-mineral floc decreased with distance from the upper to the lower reach of the PRE, except for the bottom water samples at S5 and S6 where the turbidity was higher. In addition, their abundance at the surface (Figures 5A,B) was higher than that in the bottom waters (Figure 5C). It is therefore unlikely that such large CSP in the river reach originated from sediment resuspension. It has been suggested that the majority of OM introduced by rivers into estuaries is tightly associated with suspended minerals (Hedges and Keil, 1999). This kind of CSP that associated with silt may be bound to, or a constituent of humic substances or be Glomalin-related soil protein (GRSP) (Koide and Peoples, 2013; Wang et al., 2018). GRSP is produced by arbuscular mycorrhizal fungi and can be leached from soil and flushed into river and coastal sediment (Wang et al., 2018), and a recalcitrant pool of glomalin generally strongly adheres to soil particles (Koide and Peoples, 2013). Therefore, GRSP is likely to be one terrestrial source of CSP in the Pearl River.
Coomassie Blue Stainable Particles Derived From Resuspension
Higher concentration in bottom than in surface waters in the middle and lower estuary [turbidity maximum (TM) zone] reflected that one source of CSP might be derived from resuspension of the bottom sediments. Wai et al. (2004) has found that there was one TM at S6 in the west channel. The contributions of the resuspension, Eulerian advection, Stokes drift and gravitational circulation to the total sediment transport at S6 were of 52.1, 16.2, 14.0, and 16.6%, respectively (Wai et al., 2004). Therefore, the CSP maximum at station S6 in bottom water may be mainly attributed to the resuspension process. This inference was supported by the observation that a large amount of TEP could be released from sediment during sediment resuspension in the turbid PRE (Sun et al., 2012), although TEP and CSP are not the same population of particles in the PRE (comparison between CSP and TEP in the PRE is available in the Online Supplement).
CSP Loss in the Pearl River Estuary
The spatial distribution of CSP showed higher concentration in the upper reach and in the lower part of the estuary compared to the mixing zone. CSPcolor concentration dropped from the upstream to the Humen downstream by 80% in summer and 55.6% in winter, respectively. This suggested that the annual average loss of CSP was 67.8% from the river to the estuary, which is consistent with profound recycling of riverine POM (≥60%) (Hedges and Keil, 1999). This high CSP loss might be associated with bacterial degradation, dilution by the mixing water, lower phytoplankton production downstream, and/or deposition to sediment. In the PRE, particles are classed depending on the hydrodynamic condition. CSP aggregates of high density, i.e., CSP flocculated with mineral or fine sand, are more prone to deposition, whereas particles with low density, e.g., free CSP, may be transported downstream or upstream by the tidal current (Sun et al., 2012). During the transport process, CSP could be involved in a series of deposition-resuspension cycles along with the time scale of estuary mixing. The residence time of the PRE is about 5 days in the wet season and 30 days in the dry season (Han, 1998). As proteinaceous particles can be rapidly turned over, this scale of residence time likely complies with the degradation time of CSP. Microbial colonization and degradation reduce CSP size and decompose CSP into DOM (Ziervogel et al., 2016). For the same reason, higher biomass of bacteria in the upstream than the downstream in winter (Liu et al., 2007) might permit bacteria to degrade CSP more sufficiently in the upper of the estuary than more oceanic stations (S6, S7, and S8), which may explain that the concentration of CSP in the river section is lower than the mouth of the PRE. Therefore, it is unlikely that large amounts of riverine CSP survive the transport from the river to marine sediments (Chen et al., 2004; Zhao et al., 2009; He B. et al., 2010). This suggested that interplay between grain-size sorting due to hydrodynamic conditions and microbial degradation determined the fate and distribution of CSP in the mixing zone of the PRE.
Implying for Nitrogen Cycling in the Pearl River Estuary
Amino Acids are reliable indicators of OM degradation and bioavailability (Hedges et al., 1994; Dauwe et al., 1999). AAs, Gly, and Ser are well-enriched in old OM (Keil et al., 2000; Chen et al., 2004), while biogenic particles (fresh and liable organic material) contained more AAs GlX+Phe+Leu+Ala+Val in the PRE (Chen et al., 2004). The percentage of particular nitrogen attributed to phytoplankton is generally in a constant range given phytoplankton cells are sufficient in nutrition, and the ratio of Chl a to PN can reflect the fraction of phytoplankton nitrogen, non-phytoplankton and detrital nitrogen (Yentsch and Vaccaro, 1958). Therefore, the ratio of Chl a/CSP was taken as proxy for labile protein contribution during this study, assuming alga are the freshest source of CSP among POM sources. The sum of (GlX+Phe+Leu+Ala+Val) mole% was positively related to the ratio of Chl a/CSP (p < 0.001, r2 = 0.46, n = 16) (Figure 8A). In contrast, there was a significant negative correlation between the ratio of Chl a/CSP and mole percentage of Gly (p < 0.001, r2 = 0.56, n = 16) (Figure 8B). The spatial distribution of the ratio of Chl a/CSP was characterized with the higher values at S8 and S1 (average value of 0.040 and 0.039, respectively) compared with those at S4 (0.022) and S6 (0.019). Moreover, the ratio of Chl a/CSP was 48.67% higher in surface than that in bottom waters except for S1 during summer (Supplementary Table 1, the percentage of increase of the ratio of Chl a/CSP in surface over that in the bottom water is presented in the online supplement). This observation is in accordance with findings of higher moles% Gly and Ser in bottom than in surface waters. Our results showed that the contribution of freshly produced CSP were lower at S4 and S6 as well as in the bottom waters, which complies with previous observations indicated by AAs distribution and δ15N (Chen et al., 2004; Ye et al., 2016; Huang et al., 2020). The study by Chen et al. (2004) showed AAs concentrations were low in waters of Humen outlet downstream (zone 2), increased to the highest in the estuary plume (salinity 10–25) and decreased beyond the coastal plume during summer. In particular, the fresh organic material (biogenic particles, Chl a ≥ 5 μgL–1 and SS < 10 mg L–1) in the estuary plume contained more AAs (Glu+Phe+Leu+Ala+Val) and had higher AAs/HAs ratios, while OM were more degraded in the upper of the zone 2 indicated by lower Glc-NH2/Gal-NH2 (glucosamine/galactosamine) and AAs/HAs ratios (Chen et al., 2004). For the nitrogen isotopic composition of POM, owing to the preferential loss of 14N and subsequently leaving the remaining PON enriched in 15N during the degradation processes of OM, high δ15N in the bottom water were found in the PRE (Ye et al., 2016; Huang et al., 2020). It suggested that particulate OM in turbidity zone of the estuary and in bottom was well-degraded and relatively refractory, while particulate OM in high salinities waters and in surface water was more recently produced. It should be noted that the sources of CSP (allochthonous or autochthonous) are complicated concluding terrestrial soil, in situ freshwater and marine plankton production as well as their detritus, and the freshly produced CSP was quite reactive and easily degradable. Therefore, Chl a/CSP could vary spatiotemporally in estuary. Future studies may need to focus on the combined effects of physical and biogeochemical process on CSP formations and removals in estuaries with large freshwater input and biomass production.
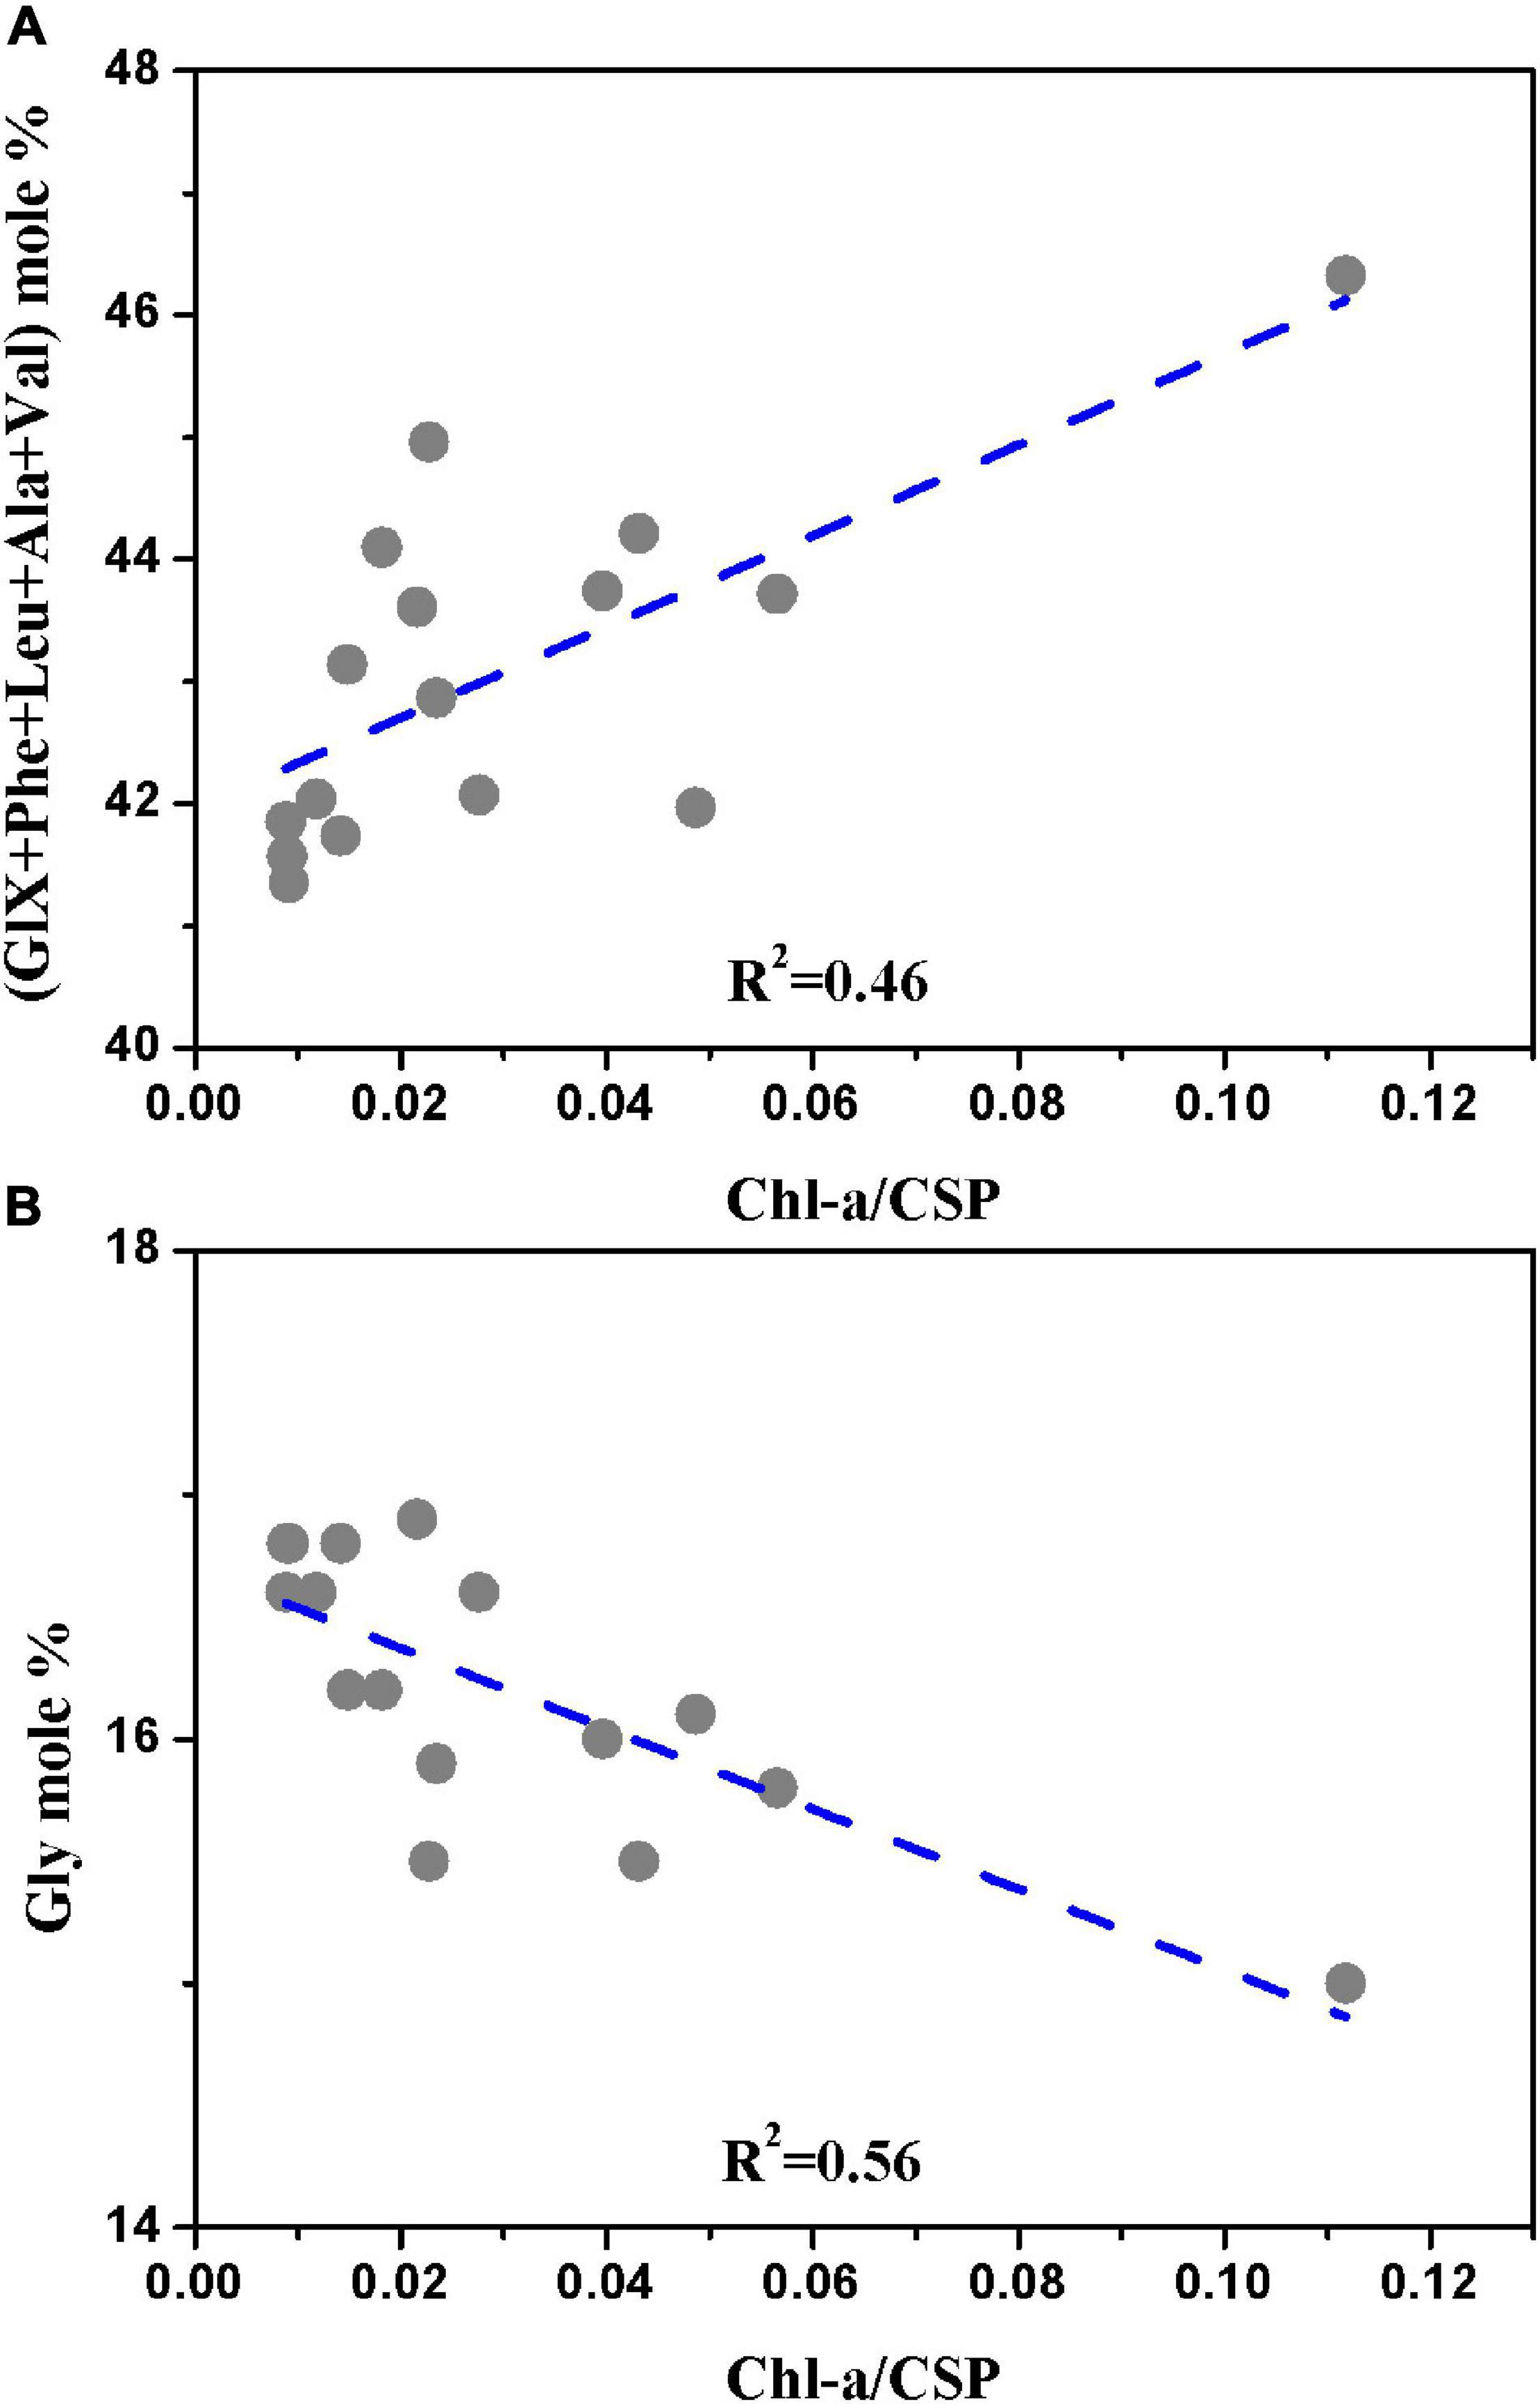
Figure 8. (A) (GlX+Phe+Leu+Ala+Val) mole% vs. Chl a/CSP; and (B) Gly mole% vs. Chl a/CSP.
Most previous studies for CSP were based on the microscopic method developed by Long and Azam (1996; Table 3). Cisternas-Novoa et al. (2014) proposed a spectrophotometric method to measure CSP concentration. Spectrophotometric analyses were validated by the microscopy, and allowed for estimation of CSP composition in terms of nitrogen. In this study, CSP-N was positively related to PN except for the upper river in the dry season and in bottom S6 during summer, which have an obvious deviation to fitted curve (Figure 6E). The deviation in the range of PN > 20 μmol L–1 and 2 < CSP-N < 4 μmol BSA-N-eq. L–1 may be attributed to the disproportional reduction of CSP and PN input in the upper river during the dry season being low discharge and the difference of lability between CSP and PN. The maximum of CSP concentration in the bottom water during summer was observed at S6. This deviation at S6 might be ascribed to two reasons: (1) the resuspension of sediment; (2) the estuarine circulation with CSP coming from sinking phytoplankton in the plume and being transported by the salt wedge advancing upstream near the bottom.
Estimated contribution of CSP to PN was comparable with that of PHAA, yielding average of 32.9%. A recent study has shown that the input of PN (allochthonous and autochthonous) in the PRE was about 2.0 × 10⁷ mol N d–1 (Tan et al., 2019). Thus, CSP-N flux in the Pearl River Delta might be as high as about 6 × 10⁶ mol N d–1. These results indicate that CSP is a potentially important PN pool in the Pearl River Delta.
Labile AAs are one important factor limiting OM degradation in anoxic waters (Pantoja et al., 2004, 2009). In the PRE, waters were characterized with a heavy load of CSP concentration in the fresh-water segment where oxygen depletion often occurs (Zhai et al., 2005; Dai et al., 2006); therefore CSP degradation may influence remineralization and nitrification, and potentially may contribute to hypoxia in the upper reach of the PRE (Xu et al., 2005; Dai et al., 2006; He B. Y. et al., 2010). Recently, Tan et al. (2019) found that ∼74% of sedimentary nitrogen removal (8.1 ± 2.0 × 10⁶ mol N d–1) from the Pearl River Delta sediment is dependent on PN from water deposited onto sediments, and about 6 × 10⁶ mol N d–1 of PN from water is mineralized to produce ammonium, and ultimately converted to N2 or N2O and released into the atmosphere in the PRE (Tan et al., 2019). Interestingly, the input flux of CSP-N (6 × 10⁶ mol N d–1) from the PRE in our study is approximately equivalent to the sediment nitrogen loss observed by Tan et al. (2019). It is presumably assumed that denitrifying and anammox bacteria may preferentially utilize CSP over DOM and non-CSP PN sources in the PRE (Zeng et al., 2019).
Conclusion
This investigation expands the current knowledge of CSP distribution in the estuaries system and for the first time provides information on the contribution of CSP-N to the PN pool. The spatial-temporal distributions of CSPcolor concentration and information obtained from microscopic pictures, reflected sources and fates of CSP in the PRE. The phytoplankton was the main producer of CSP. The degradation indicators of AAs vs. the ratio of Chl a/CSP and pictures of CSP suggested that CSP in middle mixing zone was relatively more degraded associated with the lowest concentration, while in the lower estuary CSP were originated from authochthonous production and appeared to be more labile. The amount of N as CSP was comparable with that of PHAA and contributed to 32.9% to PN, indicating that CSP may be an important component of the PN pool in the PRE. It will be needed to carry out more in-situ and experimental investigations on the relationship between CSP and bacteria and dissolved oxygen consumption, nitrification, and denitrification, to quantitatively evaluate their roles in nitrogen removal in the Pearl River Delta in the future.
Data Availability Statement
The original contributions presented in the study are included in the article/Supplementary Material, further inquiries can be directed to the corresponding author.
Author Contributions
All authors listed have made a substantial, direct, and intellectual contribution to the work, and approved it for publication.
Funding
This study was supported by the Natural Science Foundation of Guangdong Province, China (No. 2020A1515011137), National Natural Science Foundation of China (Nos. 42073078 and U1901211), Key Special Project for Introduced Talents Team of Southern Marine Science and Engineering Guangdong Laboratory (Guangzhou) (Nos. GML2019ZD0402 and GML2019ZD0305), Special Fund for Public Welfare Research and Capacity Building in Guangdong Province (No. 2016A020222018), the National Key Research and Development Plan (No. 2017FY100700), and the Key Research and Development Program of Hainan Province (ZDYF2021XDNY131).
Conflict of Interest
The authors declare that the research was conducted in the absence of any commercial or financial relationships that could be construed as a potential conflict of interest.
Publisher’s Note
All claims expressed in this article are solely those of the authors and do not necessarily represent those of their affiliated organizations, or those of the publisher, the editors and the reviewers. Any product that may be evaluated in this article, or claim that may be made by its manufacturer, is not guaranteed or endorsed by the publisher.
Acknowledgments
We thank Anja Engel (GEOMAR) and the reviewers for their comments and suggestions for improving the manuscript.
Supplementary Material
The Supplementary Material for this article can be found online at: https://www.frontiersin.org/articles/10.3389/fmars.2021.733240/full#supplementary-material
Footnotes
References
Berman, T., and Viner-Mozzini, Y. (2001). Abundance and characteristics of polysaccharide and proteinaceous particles in Lake Kinneret. Aquat. Microb. Ecol. 24, 255–264.
Busch, K., Endres, S., Iversen, M. H., Michels, J., Nothig, E. M., and Engel, A. (2017). Bacterial colonization and vertical distribution of marine gel particles (TEP and CSP) in the arctic fram strait. Front. Mar. Sci. 4:166. doi: 10.3389/fmars.2017.00166
Carrias, J. F., Serre, J. P., Sime-Ngando, T., and Amblard, C. (2002). Distribution, size, and bacterial colonization of pico- and nano-detrital organic particles (DOP) in two lakes of different trophic status. Limnol. Oceanogr. 47, 1202–1209. doi: 10.4319/lo.2002.47.4.1202
Chen, J. F., Li, Y., Yin, K. D., and Jin, H. Y. (2004). Amino acids in the pearl river estuary and adjacent waters: origins, transformation and degradation. Cont. Shelf Res. 24, 1877–1894. doi: 10.1016/j.csr.2004.06.013
Chin, W. C., Orellana, M. V., and Verdugo, P. (1998). Spontaneous assembly of marine dissolved organic matter into polymer gels. Nature 391, 568–572.
Cisternas-Novoa, C., Le Moigne, F. A. C., and Engel, A. (2019). Composition and vertical flux of particulate organic matter to the oxygen minimum zone of the central Baltic Sea: impact of a sporadic North Sea inflow. Biogeosciences 16, 927–947. doi: 10.5194/bg-16-927-2019
Cisternas-Novoa, C., Lee, C., and Engel, A. (2014). A semi-quantitative spectrophotometric, dye-binding assay for determination of Coomassie Blue stainable particles. Limnol. Oceanogr. Methods 12, 604–616.
Cisternas-Novoa, C., Lee, C., and Engel, A. (2015). Transparent exopolymer particles (TEP) and Coomassie stainable particles (CSP): differences between their origin and vertical distributions in the ocean. Mar. Chem. 175, 56–71. doi: 10.1016/j.marchem.2015.03.009
Dai, M. H., Guo, X. G., Zhai, W. D., Yuan, L. Y., Wang, B. W., Wang, L. F., et al. (2006). Oxygen depletion in the upper reach of the Pearl River estuary during a winter drought. Mar. Chem. 102, 159–169.
Dauwe, B., Middelburg, J. J., Herman, P. M. J., and Heip, C. H. R. (1999). Linking diagenetic alteration of amino acids and bulk organic matter reactivity. Limnol. Oceanogr. 44, 1809–1814. doi: 10.4319/lo.1999.44.7.1809
Dilling, L., Wilson, J., Steinberg, D., and Alldredge, A. (1998). Feeding by the euphausiid Euphausia pacifica and the copepod Calanus pacificus on marine snow. Mar. Ecol. Prog. Ser. 170, 189–201. doi: 10.3354/meps170189
Dortch, Q., Clayton, J. R., Thoresen, S. S., and Ahmed, S. I. (1984). Species differences in accumulation of nitrogen pools in phytoplankton. Mar. Biol. 81, 237–250. doi: 10.1007/bf00393218
Engel, A. (2009). “Determination of marine gel particles,” in Practical Guidelines for the Analysis of Seawater, ed. O. Wurl (Boca Raton, FL: CRC Press).
Engel, A., and Galgani, L. (2016). The organic sea-surface microlayer in the upwelling region off the coast of Peru and potential implications for air-sea exchange processes. Biogeosciences 13, 989–1007. doi: 10.5194/bg-13-989-2016
Engel, A., Borchard, C., Loginova, A., Meyer, J., Hauss, H., and Kiko, R. (2015). Effects of varied nitrate and phosphate supply on polysaccharidic and proteinaceous gel particle production during tropical phytoplankton bloom experiments. Biogeosciences 12, 5647–5665. doi: 10.5194/bg-12-5647-2015
Engel, A., Endres, S., Gaigani, L., and Schartau, M. (2020). Marvelous marine microgels: on the distribution and impact of gel-like particles in the oceanic water-column. Front. Mar. Sci. 7:405. doi: 10.3389/fmars.2020.00405
Engel, A., Thoms, S., Riebesell, U., Rochelle-Newall, E., and Zondervan, I. (2004). Polysaccharide aggregation as a potential sink of marine dissolved organic carbon. Nature 428, 929–932. doi: 10.1038/nature02453
Fitznar, H. P., Lobbes, J. M., and Kattner, G. (1999). Determination of enantiomeric amino acids with high-performance liquid chromatography and pre-column derivatisation with o-phthaldialdehyde and N-isobutyrylcysteine in seawater and fossil samples (mollusks). J. Chromatogr. A 832, 123–132.
Gao, Q., Tao, Z., Shen, C., Sun, Y., Yi, W., and Xing, C. (2002). Riverine organic carbon in the Xijiang River (South China): seasonal variation in content and flux budget. Environ. Geol. 41, 826–832.
Granum, E., Kirkvold, S., and Myklestad, S. M. (2002). Cellular and extracellular production of carbohydrates and amino acids by the marine diatom Skeletonema costatum: diel variations and effects of N depletion. Mar. Ecol. Prog. Ser. 242, 83–94. doi: 10.3354/meps242083
Grossart, H. P., Berman, T., Simon, M., and Pohlmann, K. (1998). Occurrence and microbial dynamics of macroscopic organic aggregates (lake snow) in Lake Kinneret, Israel, in fall. Aquat. Microb. Ecol. 14, 59–67. doi: 10.3354/ame014059
Grossart, H. P., Czub, G., and Simon, M. (2006). Algae-bacteria interactions and their effects on aggregation and organic matter flux in the sea. Environ. Microbiol. 8, 1074–1084. doi: 10.1111/j.1462-2920.2006.00999.x
He, B. Y., Dai, M. H., Zhai, W. D., Wang, L. F., Wang, K. J., Chen, J. H., et al. (2010). Distribution, degradation and dynamics of dissolved organic carbon and its major compound classes in the Pearl River estuary, China. Mar. Chem. 119, 52–64. doi: 10.1016/j.marchem.2009.12.006
He, B., Dai, M., Huang, W., Liu, Q., Chen, H., and Xu, L. (2010). Sources and accumulation of organic carbon in the Pearl River Estuary surface sediment as indicated by elemental, stable carbon isotopic, and carbohydrate compositions. Biogeosciences 7, 3343–3362.
Hedges, J. I., and Keil, R. G. (1999). Organic geochemical perspectives on estuarine processes: sorption reactions and consequences. Mar. Chem. 65, 55–65. doi: 10.1016/s0304-4203(99)00010-9
Hedges, J. I., Cowie, G. L., Richey, J. E., Quay, P. D., Benner, R., Strom, M., et al. (1994). Origins and processing of organic-matter in the amazon river as indicated by carbohydrates and amino-acids. Limnol. Oceanogr. 39, 743–761. doi: 10.4319/lo.1994.39.4.0743
Huang, C., Chen, F. J., Zhang, S. W., Chen, C. Q., Meng, Y. F., Zhu, Q. M., et al. (2020). Carbon and nitrogen isotopic composition of particulate organic matter in the Pearl River Estuary and the adjacent shelf. Estuar. Coast. Shelf Sci. 246:107003. doi: 10.1016/j.ecss.2020.107003
Huang, Q., Liu, L. Z., Qin, B. Q., Cai, X. L., Zhu, G. W., Zhang, Y. L., et al. (2016). Abundance, characteristics, and size spectra of transparent exopolymer particles and Coomassie stainable particles during spring in a large shallow lake, Taihu, China. J. Great Lakes Res. 42, 455–463. doi: 10.1016/j.jglr.2016.01.007
Huang, X. P., Huang, L. M., and Yue, W. Z. (2003). The characteristics of nutrients and eutrophication in the Pearl River estuary, South China. Mar. Pollut. Bull. 47, 30–36. doi: 10.1016/S0025-326X(02)00474-5
Keil, R. G., Tsamakis, E., and Hedges, J. I. (2000). “Early diagenesis of particulate amino acids in marine systems,” in Perspectives in Amino Acid and Protein Geochemistry, ed. G. Glen (New York, NY: Oxford University Press, Inc).
Koide, R. T., and Peoples, M. S. (2013). Behavior of Bradford-reactive substances is consistent with predictions for glomalin. Appl. Soil Ecol. 63, 8–14. doi: 10.1016/j.apsoil.2012.09.015
Lemarchand, C., Jardillier, L., Carrias, J. F., Richardot, M., Debroas, D., Sime-Ngando, T., et al. (2006). Community composition and activity of prokaryotes associated to detrital particles in two contrasting lake ecosystems. FEMS Microbiol. Ecol. 57, 442–451. doi: 10.1111/j.1574-6941.2006.00131.x
Li, X. D., Su, J. L., Li, Y., Xia, X. M., and Guan, W. B. (2006). Physical Processes and Sediment Dynamics in the Pearl River. Amsterdam: Springer.
Liu, C. G., Ning, X. R., Cai, Y. M., Hao, Q., and Le, F. F. (2007). Bacterioplankton production in the Zhujiang River Estuary and the adjacent northern South China Sea. Acta Oceanol. Sin. 29, 112–122.
Long, R. A., and Azam, F. (1996). Abundant protein-containing particles in the sea. Aquat. Microb. Ecol. 10, 213–221. doi: 10.1371/journal.pone.0198735
Lourenco, S. O., Barbarino, E., Lavin, P. L., Marque, U. M. L., and Aidar, E. (2004). Distribution of intracellular nitrogen in marine microalgae: calculation of new nitrogen-to-protein conversion factors. Eur. J. Phycol. 39, 17–32. doi: 10.1080/0967026032000157156
Luef, B., Aspetsberger, F., Hein, T., Huber, F., and Peduzzi, P. (2007). Impact of hydrology on free-living and particle-associated microorganisms in a river floodplain system (Danube, Austria). Freshw. Biol. 52, 1043–1057. doi: 10.1111/j.1365-2427.2007.01752.x
Mannino, A., and Harvey, H. R. (2000). Biochemical composition of particles and dissolved organic matter along an estuarine gradient: sources and implications for DOM reactivity. Limnol. Oceanogr. 45, 775–788. doi: 10.4319/lo.2000.45.4.0775
Mari, X., and Kiorboe, T. (1996). Abundance, size distribution and bacterial colonization of transparent exopolymeric particles (TEP) during spring in the Kattegat. J. Plankton Res. 18, 969–986. doi: 10.1093/plankt/18.6.969
Mari, X., Passow, U., Migon, C., Burd, A. B., and Legendre, L. (2017). Transparent exopolymer particles: effects on carbon cycling in the ocean. Prog. Oceanogr. 151, 13–37. doi: 10.1016/j.pocean.2016.11.002
Pantoja, S., Rossel, P., Castro, R., Cuevas, L. A., Daneri, G., and Cordova, C. (2009). Microbial degradation rates of small peptides and amino acids in the oxygen minimum zone of Chilean coastal waters. Deep Sea Res. Part II Top. Stud. Oceanogr. 56, 1019–1026.
Pantoja, S., Sepulveda, J. S., and Gonzalez, H. E. (2004). Decomposition of sinking proteinaceous material during fall in the oxygen minimum zone off northern Chile. Deep Sea Res. Part I Oceanogr. Res. Pap. 51, 55–70.
Parsons, T., Takahashi, M., and Hargrave, B. (1984). Biological Oceanographic Processes. Oxford: Pergamon Press.
Passow, U. (2002). Transparent exopolymer particles (TEP) in aquatic environments. Prog. Oceanogr. 55, 287–333. doi: 10.1016/s0079-6611(02)00138-6
Prieto, L., Ruiz, J., Echevarria, F., Garcia, C. M., Bartual, A., Galvez, J. A., et al. (2002). Scales and processes in the aggregation of diatom blooms: high time resolution and wide size range records in a mesocosm study. Deep Sea Res. Part I Oceanogr. Res. Pap. 49, 1233–1253. doi: 10.1016/s0967-0637(02)00024-9
Sharp, J. H. (1974). Improved analysis for particulate organic carbon and nitrogen from seawater. Limnol. Oceanogr. 19, 984–989. doi: 10.4319/lo.1974.19.6.0984
Sun, C. C., Sperling, M., and Engel, A. (2018). Effect of wind speed on the size distribution of gel particles in the sea surface microlayer: insights from a wind-wave channel experiment. Biogeosciences 15, 3577–3589. doi: 10.5194/bg-15-3577-2018
Sun, C. C., Wang, Y. S., Li, Q. P., Yue, W. Z., Wang, Y. T., Sun, F. L., et al. (2012). Distribution characteristics of transparent exopolymer particles in the Pearl River estuary, China. J. Geophys. Res. Biogeosci. 117:G00N17.
Tan, E., Zou, W. B., Jiang, X. L., Wan, X. H., Hsu, T. C., Zheng, Z. Z., et al. (2019). Organic matter decomposition sustains sedimentary nitrogen loss in the Pearl River Estuary, China. Sci. Total Environ. 648, 508–517. doi: 10.1016/j.scitotenv.2018.08.109
Thornton, D. C. O. (2004). Formation of transparent exopolymeric particles (TEP) from macroalgal detritus. Mar. Ecol. Prog. Ser. 282, 1–12. doi: 10.3354/meps282001
Thornton, D. C. O. (2018). Coomassie stainable particles (CSP): protein containing exopolymer particles in the ocean. Front. Mar. Sci. 5:206. doi: 10.3389/fmars.2018.00206
Thornton, D. C. O., Brooks, S. D., and Chen, J. (2016). Protein and carbohydrate exopolymer particles in the sea surface microlayer (SML). Front. Mar. Sci. 3:135. doi: 10.3389/fmars.2016.00135
Verdugo, P. (2012). Marine microgels. Annu. Rev. Mar. Sci. 4, 375–400. doi: 10.1146/annurev-marine-120709-142759
Wai, O. W. H., Wang, C. H., Li, Y. S., and Li, X. D. (2004). The formation mechanisms of turbidity maximum in the Pearl River estuary, China. Mar. Pollut. Bull. 48, 441–448. doi: 10.1016/j.marpolbul.2003.08.019
Wang, Q., Li, J. W., Chen, J. Y., Hong, H. L., Lu, H. L., Liu, J. C., et al. (2018). Glomalin-related soil protein deposition and carbon sequestration in the Old Yellow River delta. Sci. Total Environ. 625, 619–626. doi: 10.1016/j.scitotenv.2017.12.303
Xu, J., Wang, Y. S., Yin, J. P., Wang, Q. J., Zhang, F. Q., He, L., et al. (2005). Transformation of dissolved inorganic nitrogen species and nitrification and denitrification processes in the near sea section of Zhujiang River. Acta Sci. Circumstantiae 25, 686–692.
Ye, F., Jia, G. D., Xie, L. H., Wei, G. J., and Xu, J. (2016). Isotope constraints on seasonal dynamics of dissolved and particulate N in the Pearl River Estuary, south China. J. Geophys. Res. Oceans 121, 8689–8705.
Ye, F., Ni, Z. X., Xie, L. H., Wei, G. J., and Jia, G. D. (2015). Isotopic evidence for the turnover of biological reactive nitrogen in the Pearl River Estuary, south China. J. Geophys. Res. Biogeosci. 120, 661–672.
Yentsch, C. S., and Vaccaro, R. F. (1958). Phytoplankton nitrogen in the oceans. Limnol. Oceanogr. 3, 443–448.
Yue, W. Z., Sun, C. C., Shi, P., Engel, A., Wang, Y. S., and He, W. H. (2018). Effect of temperature on the accumulation of marine biogenic gels in the surface microlayer near the outlet of nuclear power plants and adjacent areas in the Daya Bay, China. PLoS One 13:e0198735.
Yue, W. Z., Sun, C. C., Shi, P., Hong, Y. G., He, W. H., and Wang, Y. S. (2020). Effect of autochthonous particulate organic matter on the nitrogen removal in the Pearl River Estuary sediment. Ecol. Sci. 39, 1–9.
Zeng, J., Chen, M., Guo, L. D., Lin, H., Mu, X. Y., Fan, L. F., et al. (2019). Role of organic components in regulating denitrification in the coastal water of Daya Bay, southern China. Environ. Sci. Process. Impacts 21, 831–844. doi: 10.1039/c8em00558c
Zhai, W. D., Dai, M. H., Cai, W. J., Wang, Y. C., and Wang, Z. H. (2005). High partial pressure of CO2 and its maintaining mechanism in a subtropical estuary: the Pearl River estuary, China. Mar. Chem. 93, 21–32.
Zhan, W. K., Wu, J., Wei, X., Tang, S. L., and Zhan, H. G. (2019). Spatio-temporal variation of the suspended sediment concentration in the Pearl River Estuary observed by MODIS during 2003-2015. Cont. Shelf Res. 172, 22–32. doi: 10.1016/j.csr.2018.11.007
Zhang, G., Min, Y. S., Mai, B. X., Sheng, G. Y., Fu, J. M., and Wang, Z. S. (1999). Time trend of BHCs and DDTs in a sedimentary core in Macao estuary, Southern China. Mar. Pollut. Bull. 39, 326–330.
Zhang, Y. L., Kaiser, K., Li, L., Zhang, D. N., Ran, Y., and Benner, R. (2014). Sources, distributions, and early diagenesis of sedimentary organic matter in the Pearl River region of the South China Sea. Mar. Chem. 158, 39–48.
Zhao, M., Wang, P., Tian, J., and Li, J. (2009). “Biogeochemistry and the carbon reservoir,” in The South China Sea: Paleoceanography and Sedimentology, eds P. Wang and Q. Li (Dordrecht: Springer Netherlands), 439–483.
Keywords: Coomassie Blue stainable particles (CSP), the Pearl River estuary, particulate nitrogen, particulate hydrolysable amino acids, nitrogen cycle
Citation: Sun C-C, Yue W-Z, Wang Y-S, He W-H, Hong Y-G, Sun F-L, Cheng H, Wu M-L, Jiang Z-Y, Jiao F and Wang Y-T (2022) Distribution of Coomassie Blue Stainable Particles in the Pearl River Estuary, China, Insight Into the Nitrogen Cycling in Estuarine System. Front. Mar. Sci. 8:733240. doi: 10.3389/fmars.2021.733240
Received: 30 June 2021; Accepted: 07 December 2021;
Published: 06 January 2022.
Edited by:
Jun Sun, China University of Geosciences Wuhan, ChinaReviewed by:
Haiyan Jin, Second Institute of Oceanography, Ministry of Natural Resources, ChinaXianghui Guo, Xiamen University, China
Jiayi Pan, Jiangxi Normal University, China
Copyright © 2022 Sun, Yue, Wang, He, Hong, Sun, Cheng, Wu, Jiang, Jiao and Wang. This is an open-access article distributed under the terms of the Creative Commons Attribution License (CC BY). The use, distribution or reproduction in other forums is permitted, provided the original author(s) and the copyright owner(s) are credited and that the original publication in this journal is cited, in accordance with accepted academic practice. No use, distribution or reproduction is permitted which does not comply with these terms.
*Correspondence: You-Shao Wang, eXN3YW5nQHNjc2lvLmFjLmNu
†These authors have contributed equally to this work