- 1School of Marine Sciences, Sun Yat-sen University, Guangzhou, China
- 2Southern Marine Science and Engineering Guangdong Laboratory, Zhuhai, China
- 3Physical Oceanography Laboratory, Ocean University of China, Qingdao, China
- 4State key Laboratory of Tropical Oceanography, South China Sea Institute of Oceanology, Chinese Academy of Sciences, Guangzhou, China
- 5Ocean College, Zhejiang University, Zhoushan, China
- 6Pearl River Estuary Marine Ecosystem Research Station, Ministry of Education, Zhuhai, China
- 7Department of Oceanography, Faculty of Fisheries and Marine Science, Diponegoro University, Semarang, Indonesia
- 8Center for Coastal Rehabilitation and Disaster Mitigation Studies, Diponegoro University, Semarang, Indonesia
A tropical cyclone (TC) usually induces strong sea-surface cooling due to vertical mixing. In turn, surface cooling influences the intensities and tracks of TCs. Therefore, the relationship between sea-surface temperature (SST) and TC is one of the important components of air-sea interaction. Sea-surface cooling associated with three TCs (Bailu, Lingling, and Mitag) was investigated based on wave-glider observations, satellite altimetry, and Massachusetts Institute of Technology General Circulation Model (MITgcm) numerical experiments from August 3rd to October 10th, 2019. Surface cooling varied among the three TCs. TC Lingling had the nearest distance to the wave-glider position, the slowest translation speed, and the strongest intensity of three TCs, but extreme cooling (1.4) occurred during TC Bailu. Although MITgcm underestimated the extreme cooling, the SST trend driven by the net heat flux, advection, and vertical mixing within the mixed layer was greater during TC Bailu than during other TCs. Advection was the largest of the three heat balance terms during TC Bailu, while it was quite small during the other two TCs. Interestingly, the extreme cooling occurred at the position of preexisting warm eddy. Based on heat balance analysis, we found that the eddy-induced heat advection transport reached −0.4/day, contributing 60% of the heat balance; this was attributed to extreme cooling via eddy disturbance. We suggest TC Bailu leads to the decrease in SST and increase in the area of the cold eddy, and then, the cooled-enlarged eddy is advected to the neighbored position of wave glider, which observes the extreme cooling. These findings provide the utilization of wave gliders and help improve air-sea coupled models during TCs.
Introduction
Tropical cyclones (TCs) are characterized by heavy winds and waves, which cause socioeconomic losses. TCs interact with the ocean via momentum, mass, and heat exchanges. These interactions induce significant surface cooling of 1–6°C, which, in turn, influences the track and intensity of the TC (e.g., Price, 1981; Emanuel, 2001; Cione and Uhlhorn, 2003; Price et al., 2008; Lin et al., 2013; Li et al., 2020). This surface cooling may also regulate seasonal and climatic currents (Wang et al., 2016; Guan et al., 2021). Therefore, an accurate understanding of the surface cooling magnitude and its mechanisms are important for TC forecasting and climate projection.
The amplitude of TC-induced sea-surface cooling could be affected by TC properties. Statistical analysis has shown that the mean/maximum amplitude of surface cooling is related to TC intensity, translation speed, size, and duration of forcing (Mei and Pasquero, 2013; Wang et al., 2016). Intense and slow TCs easily trigger strong surface cooling. Asymmetric surface cooling is induced by strong inertial currents and strong wind speed to the right side of the TC track (Price, 1981; Black et al., 2007; Sanford et al., 2011; Mei et al., 2015; Mitarai and Mcwilliams, 2016).
Pre-TC oceanic thermal conditions also influence the amplitude of TC-induced surface cooling. Local TC-eddy interactions have been studied. TCs strengthen when passing over a warm core eddy due to enhanced oceanic buoyant forcing (Lin et al., 2005; Jaimes et al., 2016; Sun et al., 2020). After the TC, the amplitude, radius, and kinetic energy of cyclonic eddy increase due to TC-induced current shear or current strain (Lu et al., 2016). TC-induced surface cooling is enhanced when the TC passes a preexisting cold eddy; it is weakened when the TC passes over a preexisting warm eddy (Lin et al., 2005; Walker et al., 2005). The vertical structure of a preexisting eddy can also be modified by a TC (Wang et al., 2016; Gordon et al., 2017). Composite analysis shows that after a TC, subsurface water within anticyclonic eddies becomes colder and saltier, while it becomes warmer and fresher within the cyclonic eddies (Liu et al., 2017). Subsurface eddies may form when cooling surface water is subducted to the thermocline (Gordon et al., 2017), and a TC may also induce upwelling and confine potential vorticity to the thermocline (Lu et al., 2016, 2020). Prakash et al. (2018) and Prakash et al. (2021) found that cold eddy-TC interactions induced higher barrier layer thickness than warm eddy-TC interaction and no eddy case.
The magnitudes of TC-induced sea-surface cooling can be quantitatively estimated through diagnostic analysis, which explains the contributions of air-sea heat exchange, vertical advection, compensating horizontal advection, and diapycnal mixing (e.g., Price, 1981; D'Asaro et al., 2007; Jaimes et al., 2016; Wu et al., 2020). Turbulent heat flux is presumably crucial to TC-induced surface cooling in the near-coastal shallow regions (Shen and Ginis, 2003), while diapycnal mixing is presumed to play a major role in the open ocean (Price, 1981). Potter et al. (2017) noted that the weak TC Dianmu can induce strong surface cooling; they suggested that this cooling was influenced by the westward propagation of a mesoscale eddy. The translation speed of a mesoscale eddy is usually comparable with the speed of the first baroclinic Rossby wave (Qiu, 1999; Qiu and Chen, 2005), which is much slower than the speed of a TC. Therefore, the eddy advection term is seldom considered when determining sea-surface cooling, and the processes through which eddy advection regulates the TC-induced surface cooling still merits further investigation.
In this study, we observed an instance of extreme cooling using a wave glider and found that this cooling occurred on a preexist warm eddy, which is beyond our expectation. Subsequently, the mechanisms of this cooling were examined through numerical experiments. The data and methods are presented in section Data and methods; the extreme surface cooling case is described in section Upper layer responses to TCs; possible mechanisms are illustrated in section Possible mechanisms of the extreme sea-surface cooling; and conclusions are provided in section Conclusions.
Data and Methods
Data
Wave-Glider Data
As one of the unmanned surface vehicles, a wave glider is capable of long-duration cruising because it translates wave energy into forwarding motion and generates electricity using solar panels. Wave gliders are far less expensive than manned vessels and more capable than alternative technologies. Therefore, the wave glider has become an important tool for observation of air-sea interactions, especially in extreme weather conditions of TCs (Mitarai and Mcwilliams, 2016).
The “Black Pearl” wave glider was developed by Ocean University of China and Tianjin University of Technology (Li et al., 2017; Sun et al., 2019). It was deployed in the northwestern Pacific on August 3rd, 2019; it experienced three TCs (Bailu, Lingling, and Mitag) between August 3rd, 2019, and until October 10th, 2019 (Figure 1). Sensors installed on the wave glider include a global positioning system, communication gear, a pumped Glider Payload conductivity-temperature-depth sensor from Sea-Bird Electronics, Bellevue, Washington, USA and a station. The conductivity-temperature-depth sensor measures ocean temperature at 0.3 m below the sea surface, which is considered in situ sea-surface temperature (SST) in our study. The weather station provides wind speed, wind direction, air pressure, and air temperature at a height of 1.2 m above the float. “Black Pearl” wave gliders have been successfully used to detect surface waves below TCs in the South China Sea (Tian et al., 2020) and to estimate air-sea heat fluxes in the Kuroshio extension zone (Mao et al., 2021). We use these air-sea observations to analyze the responses of air-sea turbulent heat flux and surface temperature to TCs.
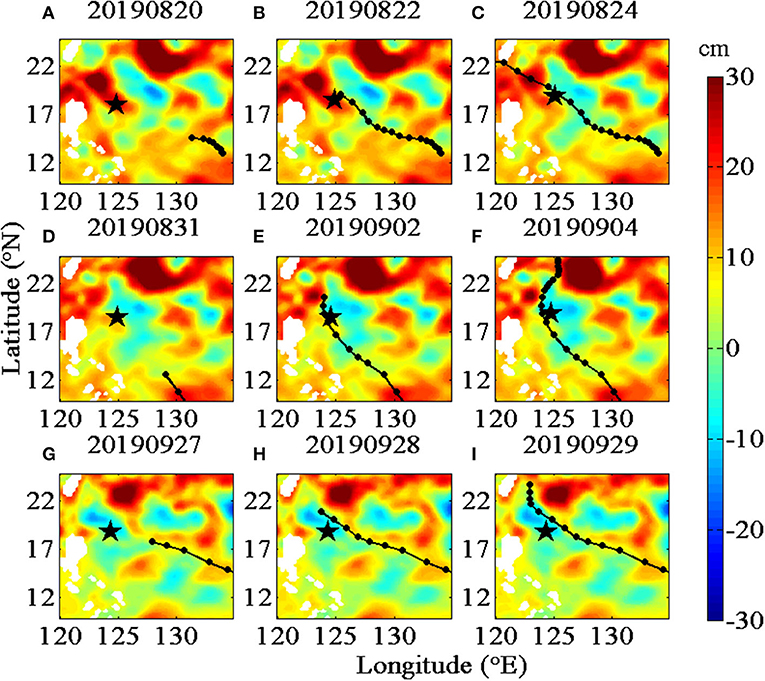
Figure 1. Distributions of sea-level anomaly (background color) during TCs (A–C) Bailu, (D–F) Lingling, and (G–I) Mitag. The white triangles are the positions of wave glider, and black dot lines are tracks of TCs. The unit of sea-level anomaly is cm. TCs, tropical cyclones.
TC Data
The tracks of TCs were obtained from the Japan Meteorology Agency, (http://www.jma.go.jp/jma/jma-eng/jma-center/rsmc-hp-pub-eg/trackarchives.html). We used data for the center positions of TCs and maximum wind speeds. The nearest approaches between TCs Bailu, Lingling, and Mitag, to the wave glider occurred on August 23rd, September 1st, and September 29th, 2019, respectively. The maximum wind speed and translation speed of the three TCs were listed in Table 1.
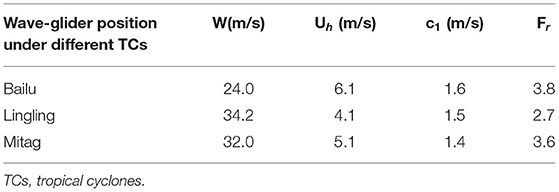
Table 1. Wind speed, W, translation speed, Uh, the first near-inertial oscillation speed, c1, and Froude number,Fr, at the position of wave glider during TCs Bailu, Lingling, and Mitag.
Reanalysis Data
ERA5 is the fifth-generation reanalysis product of the European Center for Medium-Range Weather Forecasts (Albergel et al., 2018). We used the wind speed dataset at 10-m height, which has a spatial resolution of 25 km and temporal resolution of 1 h, as the forcing field during TCs in the numerical model. Before inputting wind forcing into the numerical model, we conducted validations of ERA5 against field observations (i.e., wave-glider wind speed data). The wave-glider wind speeds at 1.2-m height were transferred to 10-m height using the Coupled Ocean Atmosphere Response Experiment (COARE 3.0) algorithm. The standard deviation between ERA5 and in situ wind speeds was 3.3 m/s under normal conditions; it rose to 4.2, 4.5, and 5.9 m/s during TCs Bailu, Lingling, and Mitag, respectively.
Initial ocean conditions were obtained from the Copernicus Marine Environment Monitoring Service (CMEMS, http://marine.copernicus.eu/). We used the daily mean products of temperature, salinity, and horizontal velocity dataset, which has a spatial resolution of 1/4°, for the period from August 3rd to October 15th, 2019. These data were collected using major global networks (Argo, GOSUD, Ocean SITES, and GTS), quality-controlled using automated procedures, and assessed using the residuals of statistical analysis.
Methods
Air-sea heat fluxes were calculated using the COARE 3.0 algorithm (Fairall et al., 2003), which was obtained from the website of https://www.coaps.fsu.edu/COARE/flux_algor/. We input the wave-glider air temperature, air pressure, wind speed, and SST into the COARE 3.0 algorithm, then set the measured height to 1.2 m.
To examine the possible mechanisms of sea-surface cooling, we used the Massachusetts Institute of Technology General Circulation Model (MITgcm). The MITgcm has a flexible non-hydrostatic formulation, which enables efficient simulation of fluid phenomena across a wide range of scales. This model can be applied to sensitivity experiments, and also parameter and state estimation problems.
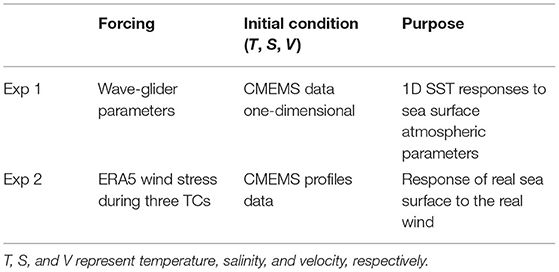
We conducted two numerical experiments, described in section Possible Mechanisms of the Extreme Sea-Surface Cooling, to examine the oceanic response to TCs (Table 2). The three-dimensional model was run using a horizontal grid of 0.25 with 18 layers in the first 300 m of the water column. For the first experiment (Exp. 1), SST was simulated on a fixed position. The temperature, salinity, and velocity of wave-glider position were used to generate the initial field on August 6th. Then we used the observed air pressure, air temperature, wind speed, and SST data to drive the initial field. The model was run for 70 days with a time step of 5 min. We compared the K-Profile Parameterization scheme, Mellor-Yamada Turbulence Closure Model, and Gaspar-Grégoris Lefevre TKE Turbulent Closure Scheme, finding that the K-Profile Parameterization scheme has the strongest vertical mixing at the bottom of the mixed layer; therefore, we used the K-Profile Parameterization scheme in this study. For the second experiment, we used the CMEMS profile as the initial field and the ERA wind field as the forcing field. We output hourly temperature and velocity data within 18 layers in the upper 300 m.
To detect mesoscale eddies, we used the vector geometry method proposed by Nencioli et al. (2010). This method has been applied successfully in the Hawaii Islands, subtropical North Pacific (Liu et al., 2012), and South China Sea (Lin et al., 2015).
Upper Layer Responses to TCs
Sea-Surface Cooling
The wave glider was located at the interface between a warm eddy and a cold eddy at the beginning of TCs Bailu and Lingling, and within a cold eddy during TC Mitag (Figure 1). We defined the days when the wave glider was within the radius of a TC as the TC forcing days. The numbers of forcing days were 2, 4, and 2 for TCs Bailu, Lingling, and Mitag, respectively.
The time series of air-sea parameters and turbulent heat fluxes are shown in Figure 2. SST shows a sharp decrease on August 23rd−24th during TC Bailu (black line in Figure 2A), and a smaller decrease on September 2nd (Lingling) and 29th (Mitag). The maximum decrease of 1.4°C was observed during TC Bailu, while the maximum decreases were ~0.6°C for TCs Lingling and Mitag. The mean magnitude of wind speeds was greatest during TC Lingling and lowest during TC Bailu (Table 1 and Figure 1B). Based on our measurements, we calculated turbulent fluxes using the COARE 3.0 algorithm (section Wave-glider Data). The turbulent heat fluxes were quite small (<10 W/m2) during TCs Bailu and Lingling (Figure 2D), indicating that the turbulent heat fluxes term cannot explain the extreme SST cooling observed during TC Bailu. The turbulent fluxes during TC Mitag were as large as the turbulent fluxes before TC Mitag. Therefore, turbulent heat fluxes cannot explain the extreme cooing that occurred during TC Bailu. The mechanisms of the extreme sea-surface cooling during TC Bailu were explored with the numerical model, and the results are presented below.
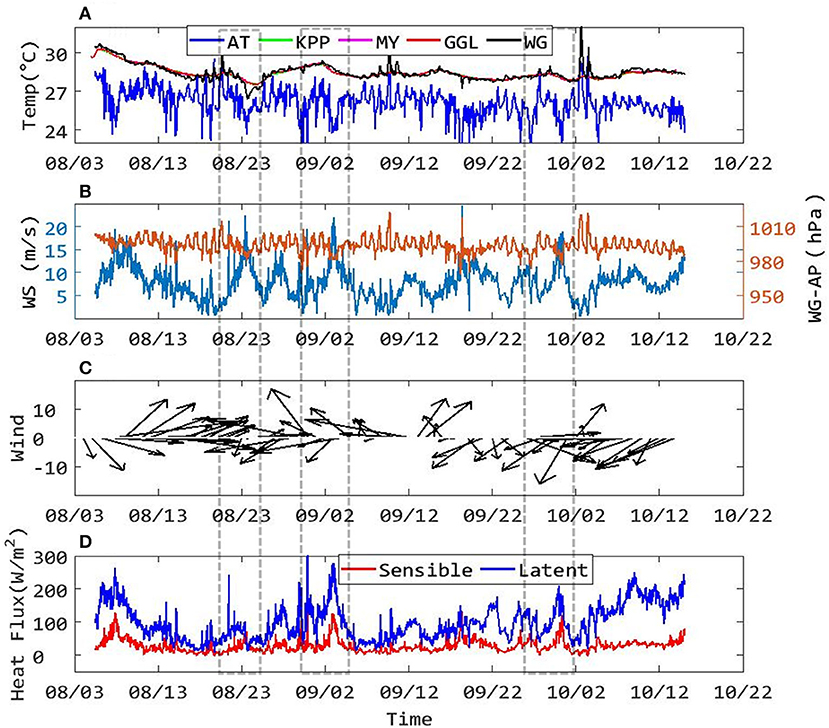
Figure 2. Time serial of wave glider observed (A) SST and air temperature (blue line), (B) magnitude of wind speed (cyan) and air pressure (yellow), (C) wind vector, and (D) turbulent heat fluxes calculated from COARE 3.0 algorithm. The red, pink, and green lines in (A) are model results from K-Profile Parameterization, Mellor-Yamada Turbulence Closure Model, and Gaspar-Grégoris Lefevre Turbulent Closure Scheme. The blue and red lines in (f) are latent and sensible heat fluxes, respectively. The gray boxes are periods of TCs Bailu, Lingling, and Mitag. TCs, tropical cyclones; SST, sea surface temperature.
Possible Mechanisms of the Extreme Sea-Surface Cooling
Sea-Surface Responses to Atmospheric Forcing
The evolution of modeled SST in the first experiment (Exp. 1) was consistent with observed SSTs (Figure 2A), except during TC Bailu, when the one-dimensional model underestimated sea-surface cooling. The vertical profiles of temperature at the location of the wave glider are shown in Figure 3. Within the mixed and thermocline layers, temperatures in the experiment demonstrate a decrease of 1.0°C, which is smaller than the decrease in wave-glider observations during TC Bailu. After TCs Bailu (August 26th) and Mitag (September 30th), the temperature began to increase within the thermocline layer (blue line). SST demonstrated minimal changes during TC Lingling.
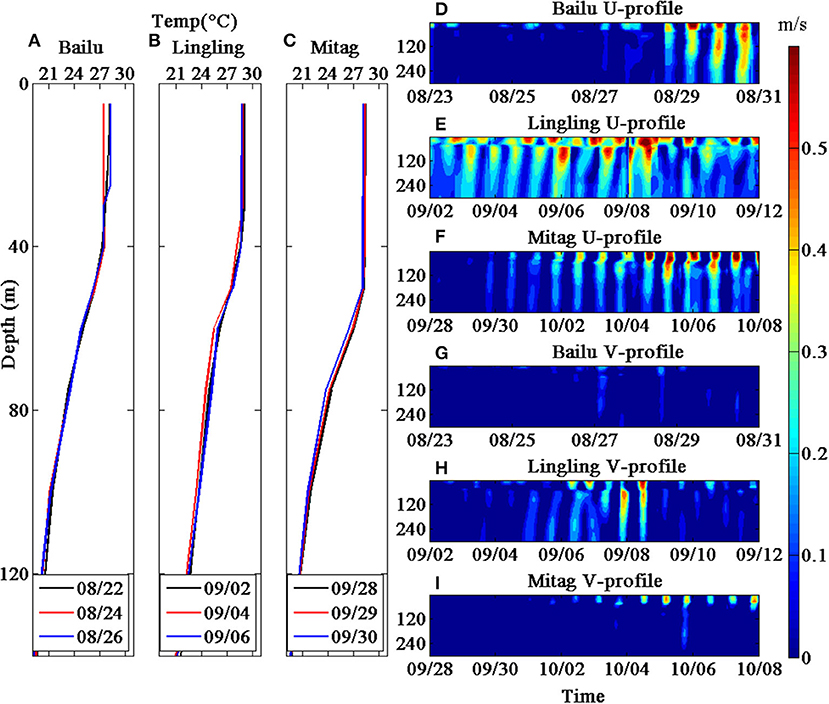
Figure 3. Profiles of temperature for TCs (A) Bailu, (B) Lingling, and (C) Mitag; profiles of eastward velocity during TCs (D) Bailu, (E) Lingling, and (F) Mitag and northward velocity during TCs (G) Bailu, (H) Lingling, and (I) Mitag. Black, red, and blue lines are before, during, and after TCs. The data are from numerical experiment set 1. TCs, tropical cyclones.
Near-inertial currents are essential to sea-surface cooling during a TC, especially currents to the front and right sides of the TC track (Price, 1981; Jaimes et al., 2011). Near-inertial motions generally have shorter or longer time scales than motions during the inertial period, because of background vorticity (Greatbatch, 1984; Sun et al., 2011). The Froude number, indicating whether near-inertial motion is predominant (e.g., Donelan et al., 2004), is defined as the ratio between the TC translation speed Uh and the first mode of near-inertial oscillation c1,
where h1 is the upper mixed layer depth; h2 is the thickness of the layer extending from the mixed layer depth to 1,000 m; and ρ1 and ρ2 are the vertical averages of density within h1 and h2, respectively.
The averages of wind speed and translation speed at the location of the wave glider during the three TCs are listed in Table 1. The Froude numbers for these three cases were all > 1 (Table 1), indicating a near-inertial ocean surface. Because our observations were made at different positions relative to the three TCs, we investigated velocity variations during TCs Bailu, Lingling, and Mitag. The modeled velocities from Exp. 1 are shown in Figure 3. During TC Bailu, the velocity (0.15 m/s) was much smaller than velocities during the other two TCs. The period of near-inertial oscillation is described by feff = ε/2+f, where ε is the relative velocity and f is the local inertial frequency. feff values were 4.18 × 10⁻⁵, 4.01 × 10⁻⁵, and 3.99 × 10⁻⁵ s−1, and the corresponding periods of near-inertial oscillation were 41, 43, and 43 h during TCs Bailu, Lingling, and Mitag, respectively. The oscillation period of modeled velocity was (<24 h) much shorter than the period of near-inertial oscillation. Therefore, local near-inertial oscillation maybe not be the main driver of the extreme cooling observed during TC Bailu.
Temperature Responses to TC-Mesoscale Eddy Interactions
To illustrate the impacts of the local oceanic state, we designed experiment 2 (Exp. 2). The wind field from ERA5 was used to drive the initial temperature, salinity, sea-level anomaly, and velocity field obtained from CMEMS. The three-dimensional structures of temperature before and after the TC are presented in Figure 4. The preexisting warm and cold eddies had smaller horizontal extents (~100 km) before TC Lingling than before TC Bailu. Within the mixed layer, the wave glider identified the boundary of a warm eddy before TC Bailu (August 20th). The warm eddy weakened during TC Bailu (August 22nd) and moved westward on August 24th, in association with the passage of TC Bailu. Below 50 m, a cold eddy increased in size and extended westward during TC Bailu. During TCs Lingling and Mitag, surface cooling was not significant. The existing subsurface warm eddy became larger during TC Lingling and the subsurface cold eddy was not affected by TC Mitag.
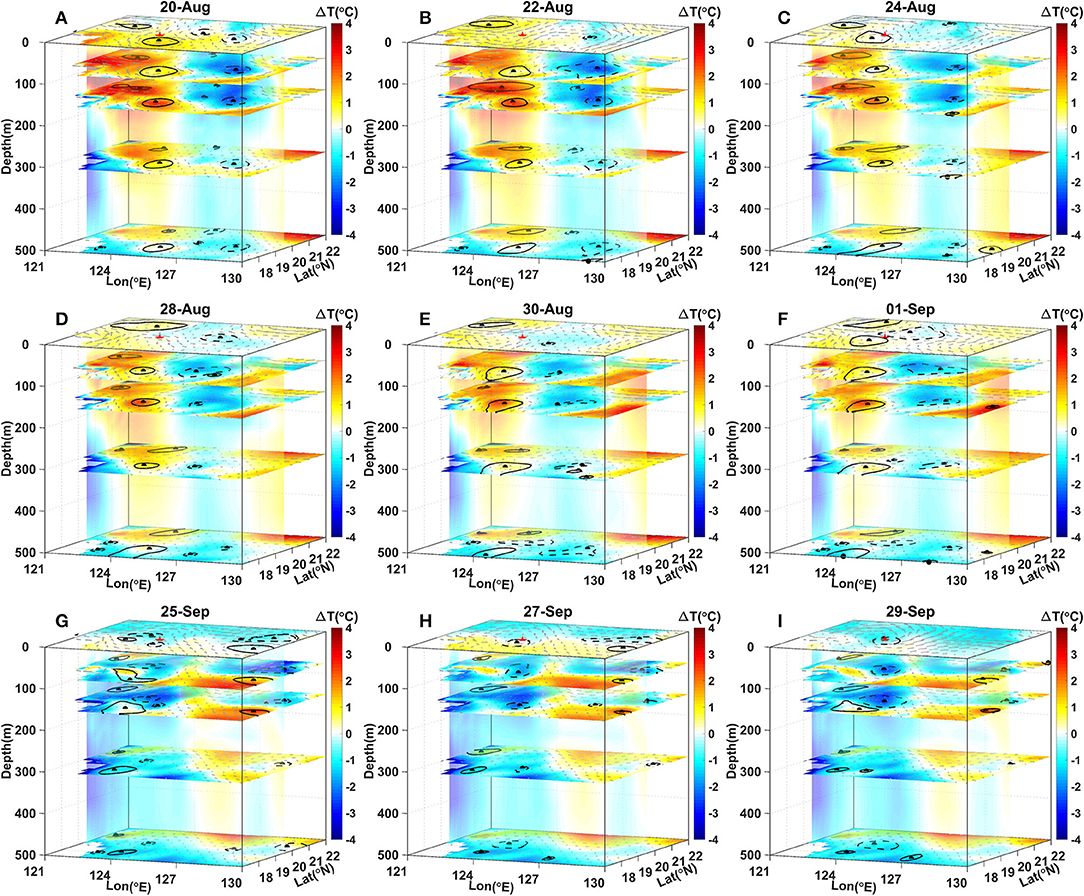
Figure 4. Three-dimensional structures of temperature profiles before TCs (A, D, G), during TCs (B, E, H), and after TCs (C, F, I). (A–C) TC Bailu, (D–F) TC Lingling, (G–I) TC Mitag. The black lines in (A–I) are the edge of cyclonic eddy (dashed lines) and anticyclonic eddies (solid lines) detected by using the velocity vector method. TCs, tropical cyclones.
The modeled temperature variations are shown in Figure 5. The SST in Exp. 2 decreased by 0.8°C, which is much smaller than the decrease observed with the wave glider (1.4°C). Note that cooling signals were enhanced on both sides of the wave-glider position, which could be attributed to the eddy-TC interaction. A subsurface cold eddy was also enhanced during TC Lingling. An increase in temperature occurred at the subsurface during TC Lingling. The temperature variations were strong during TC Mitag. The model results were consistent with previous studies, which showed that cyclonic eddies can enhance TC-induced surface cooling, while anticyclonic eddies can weaken TC-induced surface cooling (Walker et al., 2005). This enhancement/weakening of cooling may be caused by two processes (Jaimes et al., 2016). First, anticyclonic circulation is generally associated with downwelling and a deeper thermocline, while cyclonic circulation is generally associated with upwelling and a shallower thermocline. Second, TCs can induce near-inertial waves, and propagation of this signal to the thermocline occurs in anticyclonic eddies, while these waves are trapped within the mixed layer of cyclonic eddies; this may suppress the SST decrease within an anticyclonic eddy and enhance sea-surface cooling within a cyclonic eddy. However, the model results could not explain the observation of extreme cooling at the location of the wave glider.
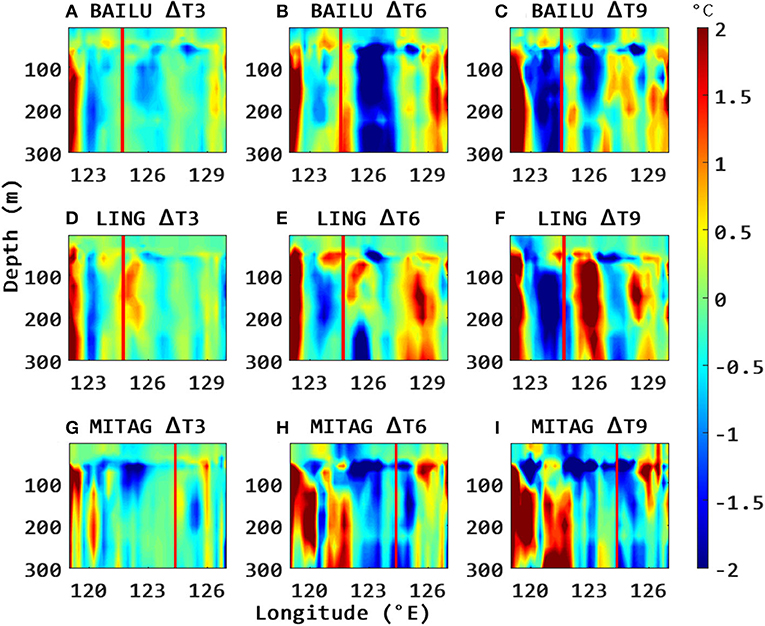
Figure 5. Temperature changes along 20°N during TCs (A–C) Bailu, (D–F) Lingling, and (G–I) Mitag. The left, middle, and right panels are on the 3, 6, and 9th days after TC forcing. The red lines are the positions of wave glider. TCs, tropical cyclones.
Thermocline uplift may be affected by the distance between the center of the TC and the oceanic eddy (Lu et al., 2020), because a TC will significantly perturb an eddy at a distance of <80 km; it will negligibly perturb an eddy at a distance of >200 km. The shortest distance between the TC center and the wave glider was <80 km for TC Bailu, whereas it was > 80 km for TCs Lingling and Mitag (not shown here). The short TC-eddy distance may be a reason for the observed extreme cooling during TC Bailu.
SST Tendency Induced by Eddy Advection
To quantify the processes responsible for temperature anomalies, the temporal variations of SST were expressed using the formula of Menkes et al. (2006),
where (u, v, and w) are components of the ocean current field, Q is the net heat flux term, h is the mixed layer depth, and kz is the vertical diffusion coefficient. Angled brackets 〈〉 denote a vertical average over the depth of the mixed layer. The terms on the right-hand side of Equation 3 are the advection, net heat flux, and vertical mixing terms. In accordance with the approach by Menkes et al. (2006), the mixed layer depth h is defined as the depth where density is up to 0.01 kg/m3 greater than surface density.
The contributions of each term to SST tendency are shown in Figure 6. Among the three observed TCs, TC-induced cooling was most significant during TC Bailu, in accordance with in situ observations. The temperature tendency induced by the advection term was −0.85°C/day, namely, the horizontal advection (−0.6°C/day) and the vertical advection (−0.25°C/day). It was larger than the net heat flux term (−0.35°C/day). The mean horizontal advection term was −0.6°C/day before TC Bailu. The entrainment and mixing terms were −0.05 and −0.10 °C/day, respectively. To manifest the contribution of eddy transport, we divided the horizontal and vertical advection terms into subterms as follows:
where , , , , and are the time-averaged zonal velocity, vertical velocity, and temperature from August 1st to October 31st, respectively. v′, w′, and T′ are the disturbances of zonal velocity, vertical velocity, and temperature, respectively. is the horizontal temperature gradient. is the vertical temperature gradient. The subterms on the right-hand side of Equation 4a are the mean flow-induced heat transport (MH), mean flow-induced eddy heat transport (MEH), eddy-induced heat transport (EH), and eddy-induced mean heat transport. The vertical advection term in Equation 4b is divided into vertical mean-flow transport, vertical mean flow-induced eddy heat transport, vertical eddy-induced heat transport, and vertical eddy-induced mean heat transport.
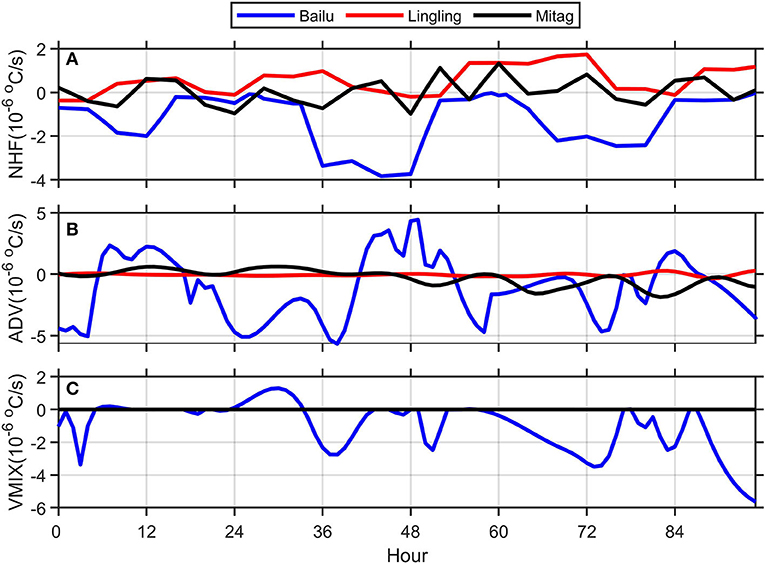
Figure 6. SST tendencies are induced by (A) net heat fluxes, (B) advection, and (C) vertical mixing after TCs. The blue, red, and black lines are during TCs Bailu, Lingling, and Mitag. Data are from numerical experiment 2. TCs, tropical cyclones; SST, sea surface temperature.
The vertical profiles of horizontal and vertical heat advection are shown in Figure 7. Horizontal EH reached −0.4°C/day in the upper 50 m, and the absolute values of EH were greatest among the four terms of Equation 4 during TC Bailu, explaining 60% of SST cooling. Below the mixed layer, EH was positive before TC Bailu (blue) and negative after TC Bailu (red). All horizontal advection terms were minor within the mixed layer during TC Lingling, but significant changes occurred within the subsurface. EH also had a small value during TC Mitag. The vertical heat advection terms were smaller than the horizontal advection terms.
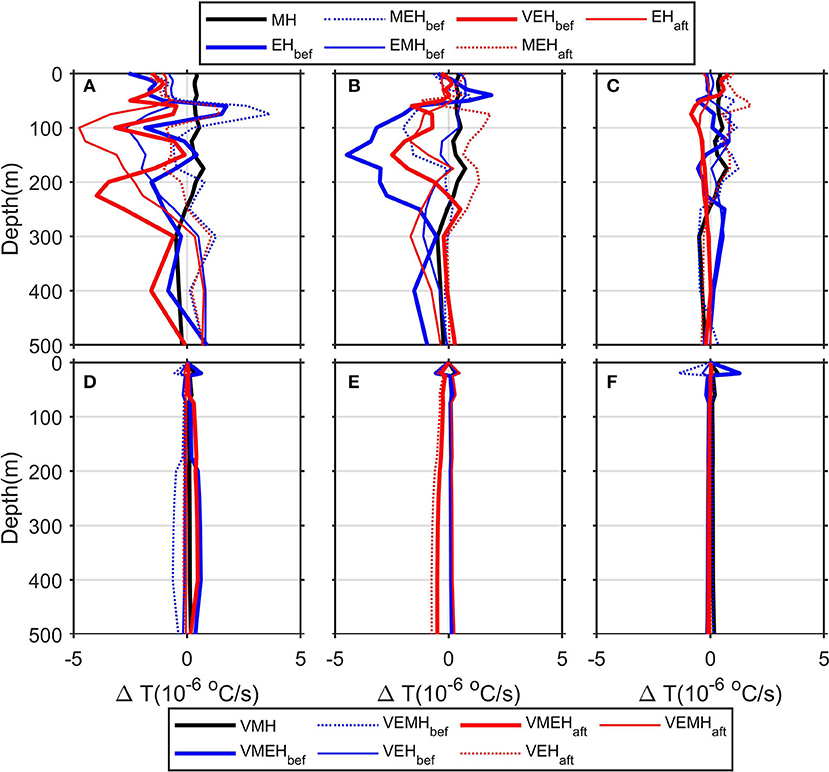
Figure 7. Heat transport during TCs (A) and (D) Bailu, (B) and (E) Lingling, and (C) and (F) Mitag. The black lines are the heat fluxes induced by mean flow. Thick blue and red lines are the eddy-advection-induced SST tendency before the tropical cyclone and after cyclone; dot blue and red lines are the mean-flow-induced eddy heat advection before and after TC; light blue and red lines are the eddy-flow-induced mean heat advection before and after tropical cyclones. TCs, tropical cyclones; SST, sea surface temperature.
Temporal variations in sea-level anomaly are shown in Figure 8. A low-sea-level anomaly signal (i.e., cold eddy) extended from 130°E to 123°E, then propagated westward at 5.2 cm/s (Figure 8B). SST at the location of the wave glider is presented in Figure 8A. SST decreased by −0.6°C at the cold eddy center during Bailu, decreased slightly during TC Lingling, and increased by 0.8°C during TC Mitag. The northwesterly velocity changed to southeasterly during Bailu (Figure 8C), which also confirmed the wave glider was at the interface of anticyclone and cyclone. MH was negative (~-0.2°C/day) during TC Bailu, which may be due to a westward-moving Rossby wave or depth-averaged flow. The phase speed of a long Rossby wave is , where LD is the internal Rossby radius determined from the mean density profile. The speed of a cold eddy (~5.2 cm/s) is comparable with the Rossby wave phase speed. This similarity indicates that MEH was mainly driven by a Rossby wave during TC Bailu. The non-linearity of a mesoscale feature can be characterized by the ratio of the rotational speed U2 to the translation speed of the feature c2. When U2/c2 > 1, the feature maintains an eddy-like shape as it propagates without dispersion. During Bailu, along the right side of the wave-glider track, indicating that the cold eddy was stable and unlikely to disperse.
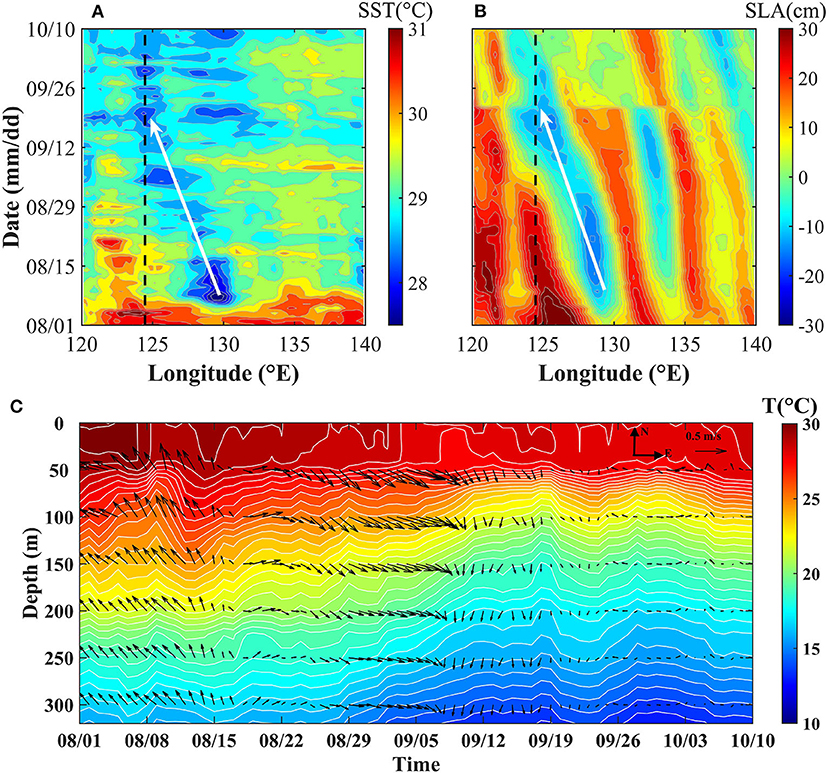
Figure 8. Time-longitude diagram of the (A) SST and (B) sea-level anomaly along 20°N; (C) vertical profiles of temperature and velocity at the wave-glider position. SST, sea surface temperature.
The four largest terms during TC Bailu are summarized in Figure 9. The observed SST tendency was −1.4°C/day. EH, net heat flux, and background westward propagation of a cold eddy resulted in extreme SST cooling during TC Bailu. After estimation, the SST tendency induced by the sum of EH and MEH was −0.6°C/day, while the SST tendencies induced by net heat flux and vertical mixing were −0.35 and −0.05°C/day, respectively. SST cooling within a cold eddy reached −1.0°C/day during TC Bailu, and this TC-eddy cooling then is advected to the position of wave glider, which observed the extreme cooling. Many previous studies have suggested TC-warm eddy interaction favors the enhancement of TC intensity, which enlarges the range of cold eddy (e.g., Prakash et al., 2021). The area of the neighbored cold eddy ranged from 1.3 to 1.6 × 10¹¹ m2 (Figure 10A), suggesting that the extreme cooling might be induced by TC-warm eddy interaction and the advection of cold eddy. During TC Lingling the size of cold eddies enlarged, but the large area only lasted 2 days (Figure 10B). During Mitag, the size of the cold eddy increased by 0.9 × 10¹¹ m2, however, the wave glider was at the cold eddy center during TC Mitag (Figure 10C), where had weak SST advection (Figure 6). Therefore, eddy heat transport induced by eddy disturbance and mean flow are the most important factors driving the observed extreme cooling during TC Bailu.
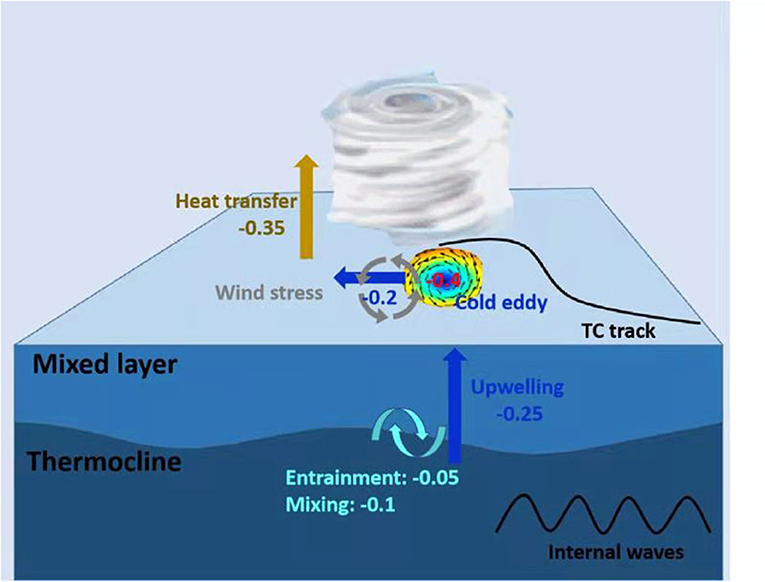
Figure 9. Schematic of physical processes of the extreme surface cooling during TC Bailu. TCs, tropical cyclones.
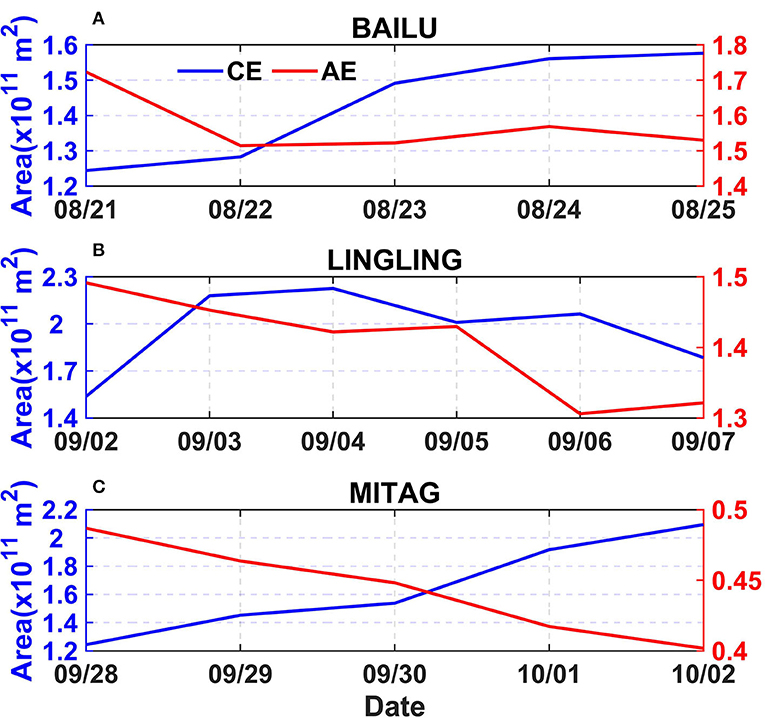
Figure 10. The change of eddies size near the wave glider during TCs (A) Bailu, (B) Lingling, and (C) Mitag. The red and blue lines are for the warm eddy and cold eddy, respectively. To elucidate the cold area more concisely, the size is calculated as the area where sea-level anomaly <0 cm and >0 cm for cold eddy and warm eddy, respectively. TCs, tropical cyclones.
Conclusions
In this study, we analyzed three cases of TC-induced sea-surface cooling in the northwest Pacific. Extreme cooling of 1.4°C was observed, which reached a depth of ~50 m. Using MITgcm, we examined the possible mechanism of surface cooling. Eddy-induced heat advection was identified as the major factor driving the case of extreme cooling. We suggested that TC Bailu led to SST decrease within the cold eddy and enlarge the size of the cold eddy, and then the cooled eddy was advected and extended to the neighbored position of wave glider, causing the extreme cooling. This study demonstrated that the wave glider was a useful tool for eddy and TC analysis. The findings of this study are useful for understanding the response of the upper ocean to TCs. To improve air-sea coupled modeling during TCs, EH should be included.
Data Availability Statement
The raw data supporting the conclusions of this article will be made available by the authors, without undue reservation.
Author Contributions
CQ: conceptualization. CQ and HL: model analysis. XS and HM: data curation. DW: supervision. ZY and AW: writing—review. All authors contributed to the article and approved the submitted version.
Funding
This study is supported by the National Natural Science Foundation of China (No. 41976002) and Innovation Group Project of Southern Marine Science and Engineering Guangdong Laboratory (Zhuhai). The CMEMS data are from http://marine.copernicus.eu/, tropical cyclone information is from http://www.jma.go.jp/, and ERA5 wind speed data are from the website https://www.ecmwf.int/. The wave glider and model data are available by request to the corresponding author.
Conflict of Interest
The authors declare that the research was conducted in the absence of any commercial or financial relationships that could be construed as a potential conflict of interest.
Publisher's Note
All claims expressed in this article are solely those of the authors and do not necessarily represent those of their affiliated organizations, or those of the publisher, the editors and the reviewers. Any product that may be evaluated in this article, or claim that may be made by its manufacturer, is not guaranteed or endorsed by the publisher.
References
Albergel, C., Dutra, E., Munier, S., Calvet, J.-C., Munoz-Sabater, J., de Rosnay, P., et al. (2018). ERA-5 and ERA-Interim driven ISBA land surface model simulations: which one performs better? Hydrol. Earth Syst. Sci. 22, 3515–3532. doi: 10.5194/hess-22-3515-2018
Black, P., D'Asaro, E., Drennan, W., French, J., Niiler, P., Sanford, T., et al. (2007). Air-sea exchange in hurricanes: synthesis of observations from the coupled boundary layer air-sea transfer experiment. Bull. Am. Meteorol. Soc. 88, 357–374, doi: 10.1175/BAMS-88-3-357
Cione, J., and Uhlhorn, E. (2003). Sea surface temperature variability in hurricanes: implications with respect to intensity change. Monthl. Weath. Rev. 131, 1783–1796. doi: 10.1175//2562.1
D'Asaro, E., Sanford, T., Niiler, P., and Terrill, E. (2007). Cold wake of hurricane Frances. Geophys. Res. Lett. 34. doi: 10.1029/2007GL030160
Donelan, M., Haus, B., Reul, N., Plant, W., Stiassnie, M., Graber, H., et al. (2004). On the limiting aerodynamic roughness of the ocean in very strong winds. Geophysic. Res. Lett. 31:L18306doi: 10.1029/2004GL019460
Emanuel, K. (2001). Contribution of tropical cyclones to meridional heat transport by the oceans. J. Geophysic. Res. 106, 771–14781. doi: 10.1029/2000JD900641
Fairall, C., Bradley, E., Hare, J., Grachev, A., and Edson, J. (2003). Bulk parameterization of air-sea fluxes: updates and verification for the COARE algorithm. J. Clim. 16, 571-591. doi: 10.1175/1520-0442(2003)016andlt;0571:BPOASFandgt;2.0.CO;2
Gordon, A., Shroyer, E., and Murty, V. (2017). An intrathermocline eddy and a tropical cyclone in the Bay of Bengal. Scientific Rep. 7:46218. doi: 10.1038/srep46218
Greatbatch, R. (1984). On the response of the ocean to a moving storm: parameters and scales. J. Physic. Oceanograph. 14, 59–78. doi: 10.1175/1520-0485(1984)014andlt;0059:OTROTOandgt;2.0.CO;2
Guan, S., Zhao, W., Sun, L., Zhou, C., Liu, Z., Hong, X., et al. (2021). Tropical cyclone-induced sea surface cooling over the yellow sea and Bohai sea in the 2019 Pacific typhoon season. J. Marine Syst. 217, 1–15. doi: 10.1016/j.jmarsys.2021.103509
Jaimes, B., Shay, L., and Brewster, J. (2016). Observed air-sea interactions in tropical cyclone Isaac over Loop current mesoscale eddy features. Dynam. Atmosph. Oceans. 76, 306–324. doi: 10.1016/j.dynatmoce.2016.03.001
Jaimes, B., Shay, L., and Halliwell, G. (2011). The response of quasigeostrophic oceanic vortices to tropical Cyclone forcing. J. Phys. Oceanogr. 41, 1965–1985. doi: 10.1175/JPO-D-11-06.1
Li, C., Sang, H., Sun, X., and Qi, Z. (2017). Hydrographic and meteorological observation demonstration with wave glider “black pearl”. Int. Conferen. Intell. Robot. Appl. 73, 790–800. doi: 10.1007/978-3-319-65289-4_73
Li, J., Sun, L., Yang, Y., and Cheng, H. (2020). Accurate evaluation of sea surface temperature cooling induced by typhoons based on satellite remote sensing observations. Water 12, 1–16. doi: 10.3390/w12051413
Lin, I., Black, P., Price, J., Yang, C., and Chen, S. (2013). An ocean coupling potential intensity index for tropical cyclones. Geophys. Res. Lett. 40, 1878–1882. doi: 10.1002/grl.50091
Lin, I., Wu, C., Emanuel, K., Lee, I., Wu, C., and Pun, I. (2005). The interaction of supertyphoon Maemi (2003) with a warm ocean eddy. Monthly Weath. Rev. 133, 2635–2649. doi: 10.1175/MWR3005.1
Lin, X., Dong, C., Chen, D., Liu, Y., Yang, J., Zou, B., et al. (2015). Three-dimensional properties of mesoscale eddies in the South China Sea based on eddy-resolving model output. Deep Sea Res. Part I: Oceanogrograph. Res. Papers 99, 46–64. doi: 10.1016/j.dsr.2015.01.007
Liu, S., Sun, L., Wu, Q., and Yang, Y. (2017). The responses of cyclonic and anticyclonic eddies to typhoon forcing: the vertical temperature-salinity structure changes associated with the horizontal convergence/divergence. J. Geophysic. Res. Oceans 122:12814. doi: 10.1002/2017JC012814
Liu, Y., Dong, C., Guan, Y., Chen, D., McWilliams, J., and Nencioli, F. (2012). Eddy analysis in the subtropical zonal band of the North Pacific Ocean. Deep Sea Res. Part I: Oceanogrograph. Res. Papers 68, 54–67. doi: 10.1016/j.dsr.2012.06.001
Lu, Z., Wang, G., and Shang, X. (2016). Response of a preexisting cyclonic ocean eddy to a typhoon. J. Phys. Oceanogr. 46, 2403–2410. doi: 10.1175/JPO-D-16-0040.1
Lu, Z., Wang, G., and Shang, X. (2020). Strength and spatial structure of the perturbation induced by a tropical cyclone to the underlying eddies. J. Geophysic. Res. Oceans 125:e2020JC016097. doi: 10.1029/2020JC016097
Mao, H., Sun, X., Qiu, C., Zhou, Y., Liang, H., Song, H., et al. (2021). Validation of NCEP and OAFlux air-sea heat fluxes using observations from a Black Pearl wave glider. Acta Oceanologica Sinica, in press.
Mei, W., Lien, C.-C., Lin, I., et al. (2015). Tropical cyclone-induced ocean response: a comparative study of the South China Sea and tropical northwest Pacific. J. Clim. 28, 5952–5968. doi: 10.1175/JCLI-D-14-00651.1
Mei, W., and Pasquero, C. (2013). Spatial and temporal characterization of sea surface temperature response to tropical cyclones. J. Clim. 26, 3745–3765. doi: 10.1175/JCLI-D-12-00125.1
Menkes, C., Vialard, J., Kennan, S., Boulanger, J., and Madec, G. (2006). Modeling study of the impact of tropical instability waves on the heat budget of the eastern equatorial Pacific. J. Phys. Oceanogr. 36, 847–865. doi: 10.1175/JPO2904.1
Mitarai, S., and Mcwilliams, J. C. (2016). Wave glider observations of surface winds and currents in the core of typhoon Danas. Geophysic. Res. Lett. 43, 11,312–11,319, doi: 10.1002/2016GL071115
Nencioli, F., Dong, C, Dickey, T., Washburn, L., and McWilliams, J. (2010). A vector geometry based eddy detection algorithm and its application to a high resolution numerical model product and high-frequency radar surface velocities in the Southern California Bight. J. Atmosph. Oceanic Technol. 27, 564–579. doi: 10.1175/2009JTECHO725.1
Potter, H., Drennan, W., and Graber, H. (2017). Upper ocean cooling and air-sea fluxes under typhoons: a case study. J. Geophysic. Res. Oceans 122, 7237–7252, doi: 10.1002/2017JC012954
Prakash, K., Nigam, T., and Pant, V. (2018). Estimation of oceanic subsurface mixing under a severe cyclonic storm using a coupled atmosphere–ocean–wave model. Ocean Sci. 14, 259–272, doi: 10.5194/os-14-259-2018
Prakash, K., Nigam, T., Pant, V., and Chandra, N. (2021). On the interaction of mesoscale eddies and a tropical cyclone in the Bay of Bengal. Nature Hazards 106, 1981–2001. doi: 10.1007/s11069-021-04524-z
Price, J. (1981). Upper ocean response to a hurricane. J. Physic. Oceanography. 11, 153–175. doi: 10.1175/1520-0485(1981)011andlt;0153:UORTAHandgt;2.0.CO;2
Price, J., Morzel, J., and Niiler, P. (2008). Warming of SST in the cool wake of a moving hurricane. J. Geophysic. Res. -Oceans 113:4393. doi: 10.1029/2007JC004393
Qiu, B. (1999). Seasonal eddy field modulation of the North Pacific Subtropical Countercurrent: TOPEX/POS. EIDON observations and theory. J. Physic. Oceanography 29, 2471–2486. doi: 10.1175/1520-0485(1999)029andlt;2471:SEFMOTandgt;2.0.CO;2
Qiu, B., and Chen, S. (2005). Eddy-induced heat transport in the subtropical North Pacific from Argo, TMI and altimetry measurements. J. Phys. Oceanogr. 35, 458–473. doi: 10.1175/JPO2696.1
Sanford, T., Price, J., and Girton, J. (2011). Upper-ocean response to hurricane Frances (2004) observed by profiling EM-APEX floats. J. Physic. Oceanography 41, 1041–56. doi: 10.1175/2010JPO4313.1
Shen, W., and Ginis, I. (2003). Effects of surface heat flux-induced sea surface temperature changes on tropical cyclone intensity. Geophysic. Res. Lett. 30:17878. doi: 10.1029/2003GL017878
Sun, J., Wang, G., Xiong, X., Hui, Z., Hu, X., Ling, Z., et al. (2020). Impact of warm mesoscale eddy on tropical cyclone intensity. Acta Oceanologica Sinica 39, 1–13. doi: 10.1007/s13131-020-1617-x
Sun, L., Zheng, Q., Wang, D., Hu, J., Tai, C., and Sun, Z. (2011). A case study of near-inertial oscillation in the South China Sea using mooring observations and satellite altimeter data. J. Oceanography 67, 677–687. doi: 10.1007/s10872-011-0081-9
Sun, X., Wang, L., and Sang, H. (2019). Application of wave glider “black pearl” to typhoon observation in South China Sea. J. Unmann. Undersea Syst. 27, 562–569. (in Chinese)
Tian, D., Zhang, H., Zhang, W., Zhou, F., Sun, X., Zhou, Y., et al. (2020). Wave Glider observations of surface waves during three tropical cyclones in the South China Sea. Water 12:1331; doi: 10.3390/w12051331
Walker, N., Leben, R., and Balasubramanian, S. (2005). Hurricane forced upwelling and chlorophylla enhancement within cold-core cyclones in the Gulf of Mexico. Geophysic. Res. Lett. 32:L18610. doi: 10.1029/2005GL023716
Wang, G., Wu, L., Johnson, N., and Zheng, L. (2016). Observed three-dimensional structure of ocean cooling induced by Pacific tropical cyclones. Geophys. Res. Lett. 43, 7632–7638. doi: 10.1002/2016GL069605
Keywords: wave-glider, eddy heat advection, sea surface cooling, tropical cyclone, Western north pacific (WNP)
Citation: Qiu C, Liang H, Sun X, Mao H, Wang D, Yi Z and Wirasatriya A (2021) Extreme Sea-Surface Cooling Induced by Eddy Heat Advection During Tropical Cyclone in the North Western Pacific Ocean. Front. Mar. Sci. 8:726306. doi: 10.3389/fmars.2021.726306
Received: 16 June 2021; Accepted: 06 September 2021;
Published: 04 October 2021.
Edited by:
Katrin Schroeder, Institute of Marine Science, National Research Council (CNR), ItalyReviewed by:
Naresh Vissa, National Institute of Technology Rourkela, IndiaKumar Ravi Prakash, Indian Institute of Technology Delhi, India
Copyright © 2021 Qiu, Liang, Sun, Mao, Wang, Yi and Wirasatriya. This is an open-access article distributed under the terms of the Creative Commons Attribution License (CC BY). The use, distribution or reproduction in other forums is permitted, provided the original author(s) and the copyright owner(s) are credited and that the original publication in this journal is cited, in accordance with accepted academic practice. No use, distribution or reproduction is permitted which does not comply with these terms.
*Correspondence: Dongxiao Wang, ZHh3YW5nQG1haWwuc3lzdS5lZHUuY24=
 Chunhua Qiu
 Hong Liang
 Xiujun Sun
 Huabin Mao
 Dongxiao Wang
 Zhenhui Yi1
 Anindya Wirasatriya