 Jorge. A. Kurczyn
 Rodrigo Duran
 Emilio Beier
 Alejandro J. Souza
- 1Instituto Epomex, Universidad Autónoma de Campeche, Campeche, Mexico
- 2National Energy Technology Laboratory, Albany, OR, United States
- 3Theiss Research, La Jolla, CA, United States
- 4Centro de Investigación Científica y de Educación Superior de Ensenada (CICESE), Unidad La Paz, Laboratorio de Macroecología Marina, La Paz, Mexico
- 5Recursos del Mar, Centro de Investigación y Estudios Avanzados del Instituto Politécnico Nacional (CINVESTAV), Mérida, Mexico
Upwelling events over the Yucatan Shelf are an important physical phenomenon to the region. They typically happen during spring and summer and had been studied for some time with a primary focus on the development on the eastern side of the shelf and later transport to the central part of the Peninsula. There has been very little effort looking at the impact of upwelling on the western shelf, on the Campeche side. Using a combination of observations and modeling from 2018, we show evidence for the first time, of the presence of upwelled water on the western side. Particle tracking, integrated back-in-time, was used to identify the origin of the upwelled water. Our results show that Caribbean Subtropical Underwater was brought from the northeast shelf, over 500 km away from the study area, by advection. This water took over a month (40 days) to arrive at the study region, traveling along-shelf with an average velocity of 14.5 cm/s. In the nearshore waters off the Campeche Coast, Caribbean Tropical Water was underlain by upwelling Caribbean Subtropical Underwater. Monthly averaged sea surface temperature (SST) anomalies from a 39-year time series suggest that upwelled water off Campeche is a regular phenomenon during summer, while the recurrence of westward advection is supported by climatological Lagrangian Coherent Structures. More studies are needed to explore the frequency of occurrence and impact of these events on the western shelf.
Introduction
The Yucatan Continental Shelf is located on the southeast Gulf of Mexico (GoM) (hereafter Yucatan Shelf), and it is an important economic area rich in fishing resources, gas, oil, and tourism (Figure 1). It is a wide shallow marine region distinguished by mean westward current speeds of 5–7 cm/s (Martínez-López and Pares-Sierra, 1998; Ruíz-Castillo et al., 2016), low significant wave heights (0.63 m on average) with periods of <5 s, and microtidal tides, mainly diurnal. Winds blow preferentially toward the west all year-round (also known as easterlies or trade winds), forcing the ocean to produce a persistent westward circulation (Martínez-López and Pares-Sierra, 1998; Zavala-Hidalgo et al., 2003). From September to June, atmospheric cold fronts, coming from continental North America (Kurczyn et al., 2020), dramatically shift the regional wind flow and interrupt the upwelling processes of the northeast (Merino, 1997).
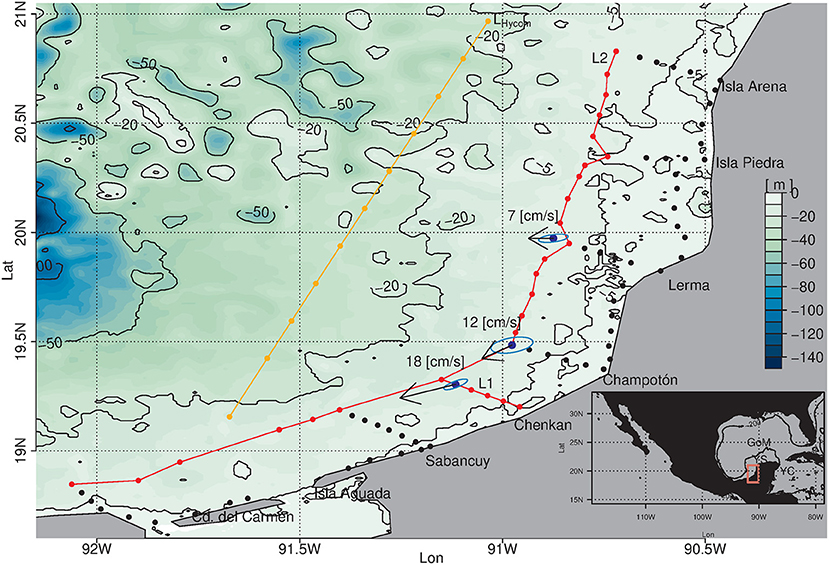
Figure 1. Oceanographic surveys (black dots) and location of the acoustic Doppler current profilers (ADCPs) (blue dots). Red dots show stations used to depict cross-shore (L1) and along-shore (L2) views of the hydrographic properties. Mean surface current vectors and variance ellipses (in blue) during July 2018 are also shown. Orange dots depict the spatial location chosen to display the vertical distribution of the HYCOM model observations (LHycom). The background color is the bathymetry. GoM, Gulf of Mexico; YS, Yucatan Shelf; YC, Yucatan Current.
Oceanographic surveys (black dots) and location of the acoustic Doppler current profilers (ADCPs) (blue dots). Red dots show stations used to depict cross-shore (L1) and along-shore (L2) views of the hydrographic properties. Mean surface current vectors and variance ellipses (in blue) during July 2018 are also shown. Orange dots depict the spatial location chosen to display the vertical distribution of the HYCOM model observations (LHycom). The background color is the bathymetry. GoM, Gulf of Mexico; YS, Yucatan Shelf; YC, Yucatan Current.
The Yucatan Shelf, also known as the Campeche Bank, is situated in a tropical region with an abundant amount of precipitation, where its karst nature absorbs all the rainwater and leaves no surface runoff. The freshwater inputs to the sea are through coastal lagoons and underground water holes scattered along the seabed on the northern coast (Herrera-Silveira et al., 2002; Valle-Levinson et al., 2011; Enríquez et al., 2013). High temperatures in the summer produce high levels of evaporation in the shallow lagoons, which become hyperhaline. The Yucatan Shelf has a strong oceanic influence from the Yucatan Current, a branch of the large North Atlantic Anticyclonic Ocean Gyre; although the exchange of properties is limited due to the shallowness of the region, some important processes occur on the northeastern flank of the shelf, such as the upwelling events (Ruiz-Renteria, 1979; Furnas and Smayda, 1987; Reyes-Mendoza et al., 2019), and some on the western side, where coastally trapped waves along the shelf break had been found to play an important role in the interchanging of nutrients between the shelf and the ocean (Estrada-Allis et al., 2020).
Upwelling onto the Yucatan shelf has been investigated by many authors (Belousov et al., 1966; Cochrane, 1966, 1968, 1969; Bogdanov et al., 1968; Bessonov et al., 1971; Bulanienkov and Garcia, 1973; Ruiz-Renteria, 1979). Multiple mechanisms driving upwelling have been proposed (Cochrane, 1966; Ruiz-Renteria, 1979; Furnas and Smayda, 1987; Merino, 1997; Reyes-Mendoza et al., 2016; Ruíz-Castillo et al., 2016; Jouanno et al., 2018); nevertheless, the subject is still a matter of investigation. Although the dominant winds are parallel to the coast, it appears that their strength is not enough to drive the typical upwelling. The most convincing hypothesis suggests that the Yucatan upwelling is driven by the interaction of the Yucatan Current and the Yucatan Shelf, driving bottom Ekman pumping in the shelf break (Furnas and Smayda, 1987; Merino, 1997; Jouanno et al., 2018), which at the east of the Peninsula presents a notch (Cabo Catoche) that manages to introduce subsurface waters from the Caribbean from ~250 m deep to the surface, which is then carried westwards on the shelf and redistributed it along the coast (Reyes-Mendoza et al., 2016; Ruíz-Castillo et al., 2016; Estrada-Allis et al., 2020).
The Yucatan upwelling has been studied for some time with a primary focus on its development on the eastern side and its later transport to the central part of the Peninsula. There has been very little effort looking at the impact of this upwelling on the western shelf, on the Campeche side. With evidence from hydrographic data, this study shows for the first time the presence of upwelling waters on the western shelf. These observations are supplemented with climatological Lagrangian integrations based on a 12-year HyCOM Gulf of Mexico simulation, which helped discern the origin of the observed phenomenon and how it was transported more than 500 km to the west of its source. Also, the climatological simulations suggested the recurrence of the westward advection toward the study region, which was corroborated using sea surface temperature (SST) images remotely sensed. This study aids to understand how primary productivity in the central and western Yucatan Shelf is driven.
Materials and Methods
In situ Data
Oceanographic Survey
Five oceanographic surveys from July 2017 to July 2018 were conducted on small boats covering the first ~30 km offshore of the western Yucatan Peninsula to observe the seasonal variation of the hydrography of the shelf. Each survey took about 1 week to be completed and was planned 3 months apart from each other. This study shows the result of the 5th campaign that occurred during summer 2018 (July 23–28). The vessels were equipped with a handheld, factory-calibrated Valeport miniCTD, to collect temperature, conductivity, and depth data, at all sampling stations (see Supplementary Table 1). These data were later transformed to observations of conservative temperature (CT) and absolute salinity (SA) using the thermodynamic equation of seawater TEOS-10 toolbox (McDougall and Barker, 2011). To show the surface distribution of SA and CT in the study region, surface samplings of these variables were optimum-interpolated using the Data-Interpolating Variational Analysis software (Troupin et al., 2012). All in situ data were processed using R software (R Core Team, 2014). The raw CTD data from this survey are publicly available at https://doi.org/10.6084/m9.figshare.15125214.v1
Acoustic Doppler Current Profiler Observations
Two acoustic Doppler current profilers (ADCPs) were moored on the western continental shelf of the Yucatan Peninsula. These were 1 MHz Nortek-acoustic wave and current profilers (AWACs) measuring bins starting at 1.4 m above the bottom until ~3 m below the surface, recording 6 s averages every 20 min. The ADCPs were used to measure three sites, two of these simultaneously (Table 1). Tides were removed from the ADCP observations using a Lanczos filter with a cutoff frequency of 24 h, leaving only the currents driven by wind stress and geostrophy, modified by the bottom friction. The raw ADCP data for June and July 2018 are publicly available at:
(1) Lerma: https://doi.org/10.6084/m9.figshare.15127434.v1
(2) Champoton: https://doi.org/10.6084/m9.figshare.15127470.v1
(3) Chenkan: https://doi.org/10.6084/m9.figshare.15127464.v1
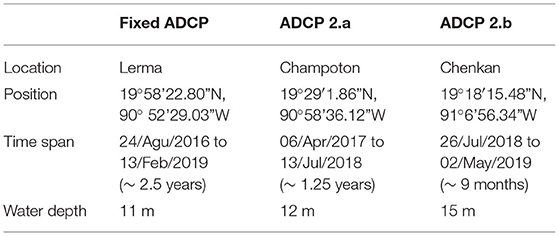
Table 1. Position, time span, and water depth of the deployed acoustic Doppler current profilers (ADCPs).
Satellite Data
For illustrative purposes, the regional distribution of the SST and winds was depicted during July 2018, where the following data sets were employed:
Optimum Interpolation Sea Surface Temperature
The National Oceanic and Atmospheric Administration (NOAA) 1/4° daily Optimum Interpolation Sea Surface Temperature (or daily OISST) is an analysis constructed by combining observations from different platforms (satellites, ships, and buoys) on a regular global grid. A spatially complete SST map is produced by interpolating to fill in gaps. The methodology includes bias adjustment of satellite and ship observations (referenced to buoys) to compensate for platform differences and sensor biases (Reynolds et al., 2002). These data were provided by the NOAA/OAR/ESRL PSD, Boulder, Colorado, USA, from their website at https://www.esrl.noaa.gov/psd/.
ASCAT
Daily wind and wind stress fields are estimated over global oceans from Metop/Advanced Scatterometer (ASCAT) retrievals using an objective method. The resulting fields have spatial resolutions of 0.25° in longitude and latitude. The calculation of daily estimates uses ascending and descending available and valid retrievals. Data and documentation are freely distributed on Cersat/Ifremer FTP site (ftp://ftp.ifremer.fr/ifremer/cersat/products/gridded/MWF/L3/ASCAT/Daily/).
Ocean Model
Model simulations come from the Hybrid Coordinate Ocean Model (HyCOM), and its coordinates are isopycnal in the open stratified ocean, terrain-following in shallow coastal regions (σ), and z-level near the surface mixed layer. It has a 1/25° spatial resolution and 27 layers in the vertical. Forcing for the ocean model comes from the National Centers for Environmental Prediction (NCEP) Climate Forecast System Reanalysis (CFSR). The open boundary conditions are provided by the global HYCOM reanalysis. The K-Profile Parameterization (KPP) turbulence closure scheme is employed. Model bathymetry is derived from the Naval Research Laboratory Digital Bathymetry Data Base 2-minute. It includes eight tidal constituents from topex inversion: M2, S2, K1, O1, N2, P1, K2, and Q1, and data assimilation from the Navy Coupled Ocean Data Assimilation (NCODA). These incorporate satellite altimeter observations (along-track data), satellite and in situ SST, and in situ vertical temperature and salinity profiles from XBTs, ARGO floats, and moorings. The version used was the HyCOM GOM10.04 expt. 32.5.
Trajectory Simulations
Trajectories were integrated back in time for 40 days, from July 19 to June 10, in one experiment using the 2018 velocities, and in another experiment using the 2003–2014 HyCOM climatological velocity described in Duran et al. (2018). The almost 7,000 trajectories in each experiment were computed using a fourth-order Runge-Kutta with cubic interpolation, a combination that is efficient and accurate when integrating discrete data (Nordam and Duran, 2020). The 2018 velocity was a two-dimensional field at 5 m depth, while the climatological velocity was a surface field.
Comparative Analysis Between Modeled Currents and ADCP Observations
To evaluate the agreement between HyCOM and ADCP data, we estimated the daily mean for the ADCP data and compared the 5 m depth observations of both data sets. Three comparative analyses were carried: complex correlation (corrcoef), Normalized Root Mean Square Error (NRMSE), and Skill Score (SS) (Willmott et al., 1985; Lorente et al., 2021). To estimate the NRMSE, we divided the RSME by the SD of the observations, whereas the SS is defined as a dimensionless number from 0 to 1 where the highest value (SS = 1) means a perfect agreement between the two data sets:
Climatological Lagrangian Coherent Structures
Climatological Lagrangian Coherent Structures (cLCSs) were developed in Duran et al. (2018) to identify persistent or recurrent Lagrangian transport patterns from large time series of Eulerian velocity. The instantaneous trajectories in this study are compared with the Gulf of Mexico cLCS computed in Duran et al. (2018). The code for cLCS is described and freely available (Duran et al., 2019); the climatological velocity (with which the results of Duran et al., 2018 can be replicated) is also available at that repository.
Climatological Lagrangian Coherent Structure differs from typical Lagrangian Coherent Structures (LCSs), and in that the Cauchy-Green tensor is averaged over different initial times, and that the time-dependent velocity is climatological. Regarding the climatological averaging, it is shown in the first section of the results in Duran et al. (2018) that the Eulerian climatological velocity preserves the main Lagrangian circulation in an ensemble-mean sense, where ensemble averaging of the instantaneous trajectories is over different initial times spanning several years. However, the averaging of the Cauchy-Green tensor formally destroys the transport-barrier property of LCS Haller (2015)). Thus, the interpretation of cLCS requires careful comparison with additional Eulerian and Lagrangian information, for example, described in Gouveia et al. (2021) where it is shown that cLCS may deform as chevrons. When cLCS deform as chevrons, they do not represent transport barriers, but instead, they identify a jet-like structure, as is the case in this study where cLCS identifies a coastal jet-like current. However, depending on the local circulation, cLCS may also indicate persistent and efficient transport barriers (Duran et al., 2018; Gough et al., 2019) or recurrent attractive pathways (Duran et al., 2018; Aljaz et al., 2020). The different interpretations for cLCS follow the fact that cLCS can be thought of as a superposition of 7-day LCS from the climatological velocity, with the integration initiating at different times (see, e.g., Appendix C of Duran et al., 2018). In the Supporting Information (Appendix A) of Duran et al. (2018), it is shown that the deformation due to along-path horizontal divergence is negligible, and therefore, the patterns identified by cLCS are due to large-scale two-dimensional flow (see also Supporting Information in Gouveia et al., 2021). This does not exclude the possibility of a vertical circulation due to superimposed upwelling, as an example.
Results
In situ and Remote Observations
The Yucatan Shelf is a shallow environment defined by a very smooth slope, 1 m/3,000 m off Campeche and 1 m/1,000 m off Yucatan, where the accessibility of the vessels is limited by draft restrictions. In this study, the sampling stations of the surveys fell on depths ranging between 2- and 20 m depth, capturing the thermohaline variations of the first ~30 km of the coast. Figure 2 depicts the T/S diagram of the campaign, where two water types were found: (1) Caribbean Tropical Surface Water (CTSW), also called Yucatan Seawater (off Yucatan, Enríquez et al., 2013), and (2) Caribbean Subtropical Under Water (CSUW), also called Gulf Common Water (off the west coast of the GoM, Vidal et al., 1994). The former occupied most of the study region, showing a modification of the CTSW having saltier values than those presented in previous reports (Table 2). Waters located in the first 5 m showed very warm temperatures (29.6 ± 1°C) with large salinity and density ranges, influenced mainly by evaporation processes and to a lesser extent by nearshore freshwater inputs from the Champoton river, coastal lagoons, and submarine groundwater discharges, and the latter particularly located near the coast in the northern part of the study area, between Lerma and Isla Arena (20–21°N, 91°W).
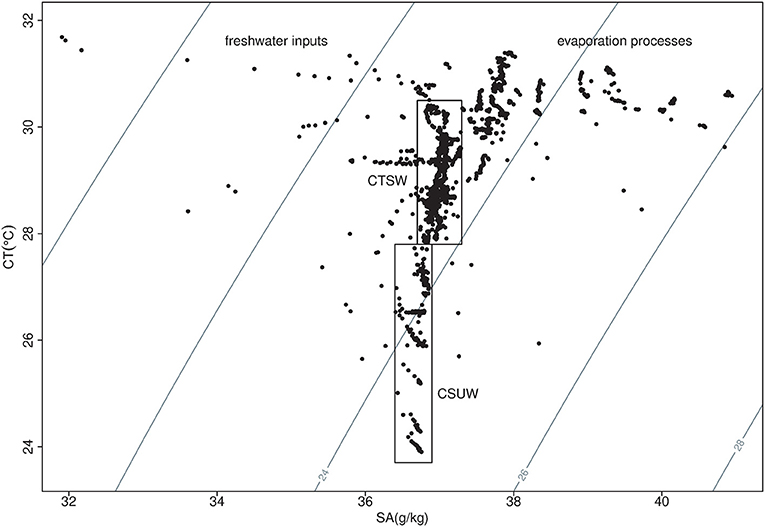
Figure 2. Temperature (conservative temperature) and salinity (absolute Salinity) diagram for July 2018. Water type signatures found during this survey are as follows: (1) The CTSW—Caribbean Tropical Surface Water, and (2) the CSUW—Caribbean Subtropical Under Water. Contours represent σθ values.
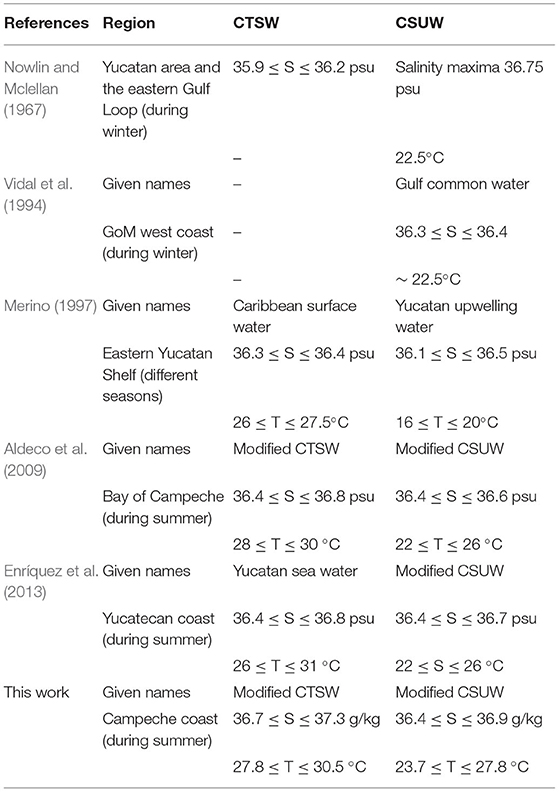
Table 2. Reported T and S intervals for CTSW and CSUW, for different seasons and regions within the GoM.
On the other hand, water temperatures below 26°C were seen between 7 and 16 m depth on the furthest sampling stations to the shore (particularly from Champton to Carmen), which correspond to the Caribbean Subtropical Under Water, modified with saltier values. Thermohaline distributions of the deepest parts of the study region illustrated the existence of two water types: CTSW above CSUW, locally modified by evaporation/freshwater inputs processes. During this survey, evaporation processes greatly exceeded precipitation (or freshwater inputs) as both water types showed saltier values, even though the survey was carried in the middle of the rainy season, defined from May to November. CSUW is commonly located in the Yucatan Channel at 250 m depth, and its presence over the Yucatan Shelf is attributed to upwelling processes occurring at the northeastern side of the Peninsula, triggered by the interaction of the Yucatan current with the continental shelf (Merino, 1997; Jouanno et al., 2018). On the west side of the shelf, ~500 km away, the existence of this water type can only be attributed to advection; in general, currents over the Yucatan Shelf present a smooth-westward flow forced mainly by the trade winds (Zavala-Hidalgo et al., 2003; Ruíz-Castillo et al., 2016). Off Campeche, ADCP observations depicted a markedly southwestward flow (Figure 3; Supplementary Figure 1), exhibiting the continuation of the shelf circulation on the western side, responsible for bringing Caribbean subsurface waters (CSUW) into the study area. Estrada-Allis et al. (2020) proposed a schematic diagram of the cross-shelf transport of nutrients all along the Yucatan Shelf. On the west shelf, their sketch is very similar to what we found with our ADCP observations corroborating this hypothesis (see the mean current vectors in Figure 1).
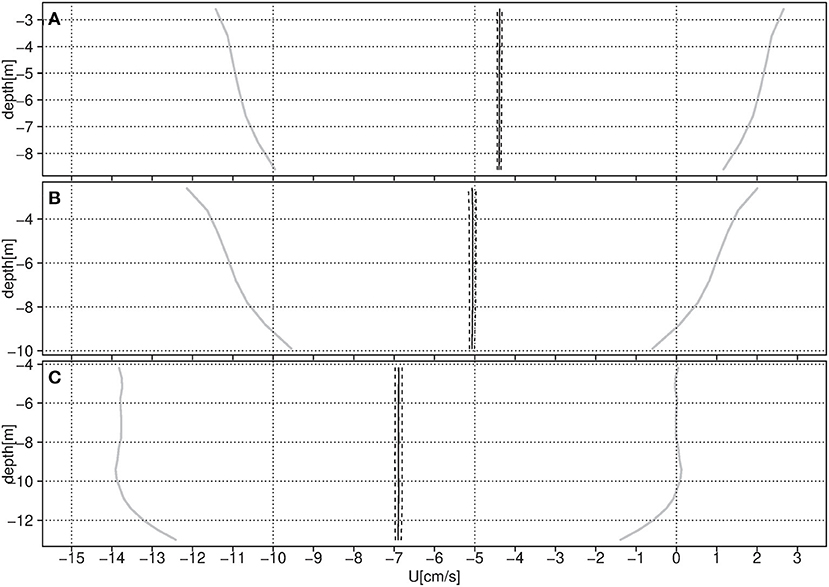
Figure 3. Mean zonal current profile (U in cm/s) for (A) Lerma, (B) Champoton, and (C) Chenkan. Solid line—mean profile, dash line-−95% CI, and gray solid line—one SD.
Figure 4 shows the surface salinity and temperature distribution during the days of the survey, which can be thought of as a 6-day composite of observations. At the northwestern edge of the sampling region (off Isla Arena), upwelled waters coming from the Yucatan coast entered the study area bringing colder temperatures and mild salinities (27°C and 37.2 g/Kg, respectively). From Isla Piedra to Lerma, salty and warm CTSW values were found, located over a very shallow depth (notice the −5 m contour in Figure 1), that prevented the upwelled waters from approaching the coast. From Champoton to the rest of the study area, upwelled waters were seen furthest to the coast. Off Terminos lagoon (at 92°W, 18.5°N), the flushing waters from this body of water expelled warm and less salty water (30°C, 36.2 g/Kg, respectively) through its southern mouth, Boca del Carmen, to the adjacent ocean.
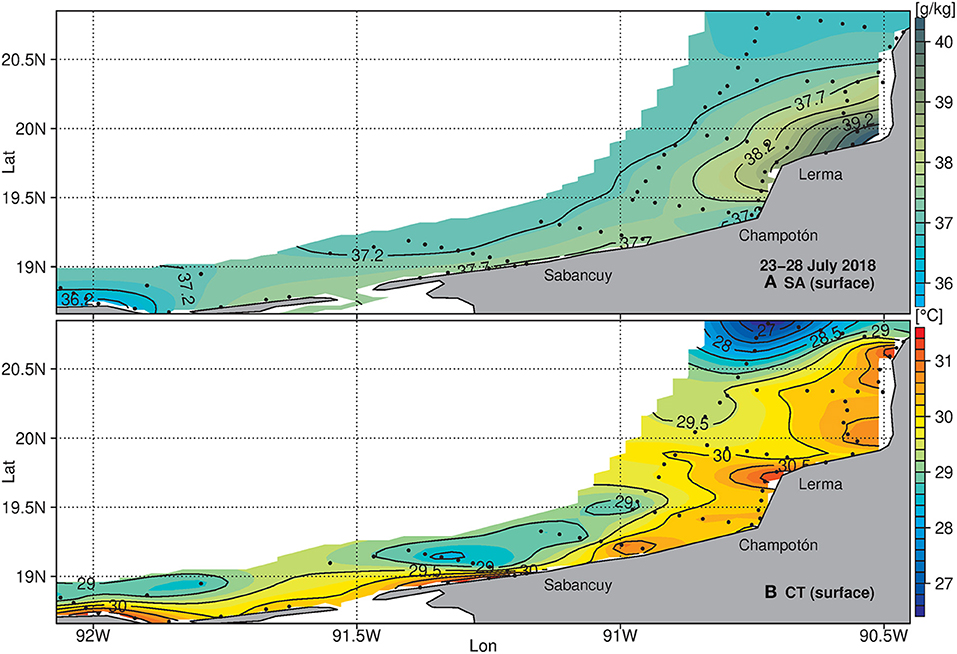
Figure 4. Surface distribution of (A) absolute salinity (g/Kg) and (B) conservative temperature (°C), optimum-interpolated. This figure synthesizes 6 days of observations, from July 23 to July 28, 2018.
During summer 2018, we decided to move the Champoton ADCP further south, off Chenkan (Table 1); while positioning it on its new location, during the diving maneuver we noticed that the water column was divided into what it seemed two different water types, a wide layer of warm and clear water above a narrow layer of greenish low-visibility cold water, located very next to the floor. We felt curious about this phenomenon, which was unnoticeable during the recovery of this ADCP some days before off Champoton. Figure 5 illustrates the cross-shore thermohaline distribution along the Chenkan section, where the saltier and warmer values of the CTSW were located above the fresher and colder values of the CSUW, found between 7 and 15 m depth in a narrow band extended on more than 15 km long, away from the coast. As mentioned before, CTSW salinity and temperature contours span from the surface until 7 m depth. Next to the shore, they occupied the whole water column exhibiting thermohaline contours vertically distributed, but in the region where both water types met, a small gradient was built and now the thermohaline contours were horizontally distributed.
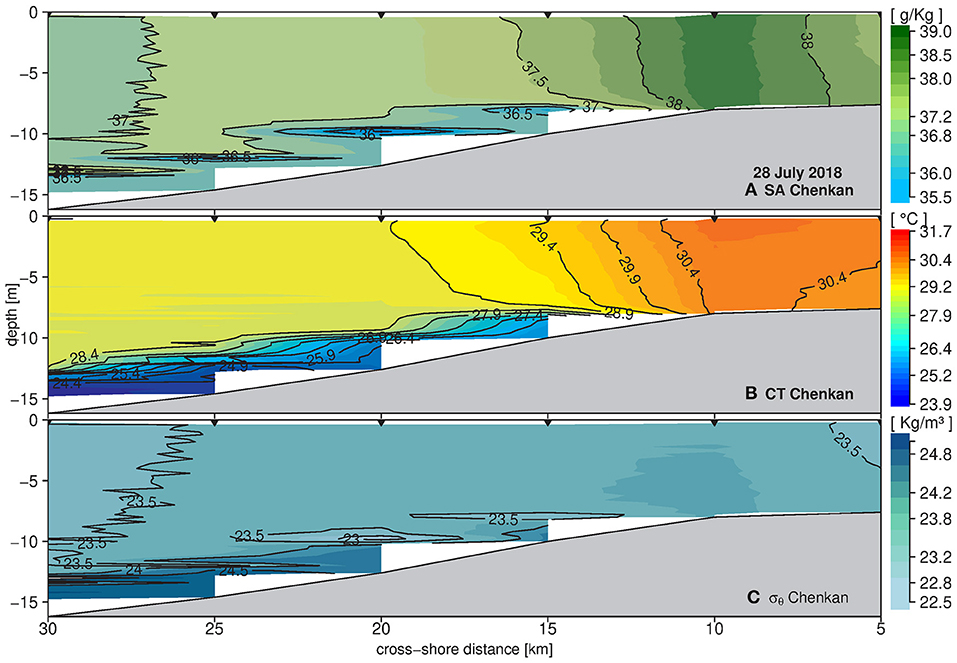
Figure 5. Cross-shore view of the vertical distribution of (A) absolute salinity (g/Kg), (B) conservative temperature (°C), and (C) density (σθ in kg/m3), off Chenkan locality (L1 on Figure 1). Black triangles on top depict sampling stations. This figure represents the observations taken during July 28, 2018.
Figure 6 shows the along-shore distribution of the thermohaline properties on the furthest stations to the shore. As with Figure 4, this is a 6-day combination of the CTD observations but of the depth allocation of both water types along the study area, it is a snapshot of thermohaline distribution along the western coast. As shown by the previous results, CSUW is seen entering the study region off Isla Arena, occupying the whole water column in the northern region, but when passing by Champoton it was restricted to a thin layer close to the bottom extended until Sabancuy. Off Terminos Lagoon, the upwelled water type signature is absent, at least inside the domain of the sampling region. To examine the hydrographic data further offshore, we used the hydrographic data for the Yucatan Peninsula provided by Hycom (Figure 7). We inspected this information along a transect located at the middle of the west shelf for the same dates as the survey. The upwelled water (CSUW) can be seen below the local CTSW, extended from Isla Arena (at the north) until Sabancuy (near Laguna de Terminos in the south), like what is seen in the survey (Figure 6) but further offshore.
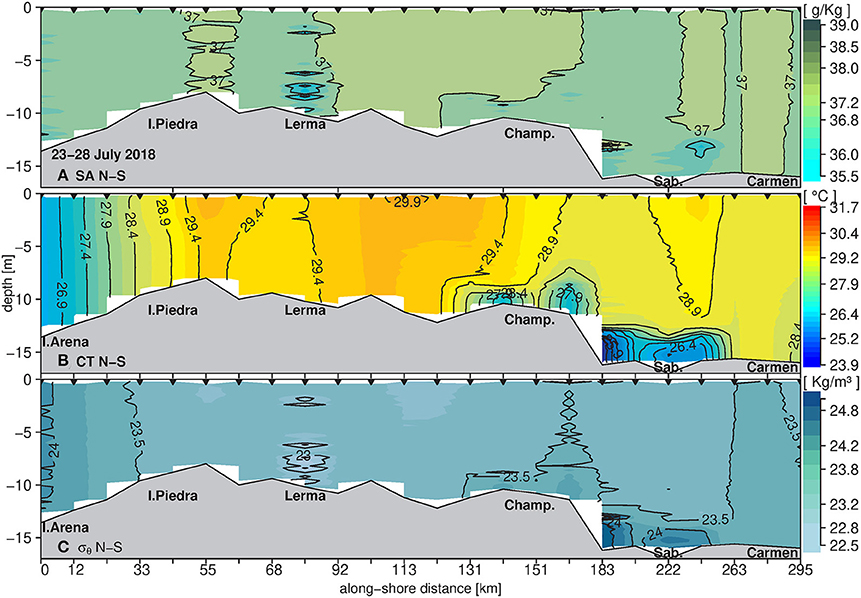
Figure 6. Along-shore view of the vertical distribution of (A) absolute salinity (g/kg), (B) conservative temperature (°C), and (C) density (σθ in kg/m3), for the sampling stations aligned from north to south (L2 on Figure 1). Black triangles on top depict sampling stations. This figure synthesizes 6 days of observations, from July 23 to July 28, 2018.
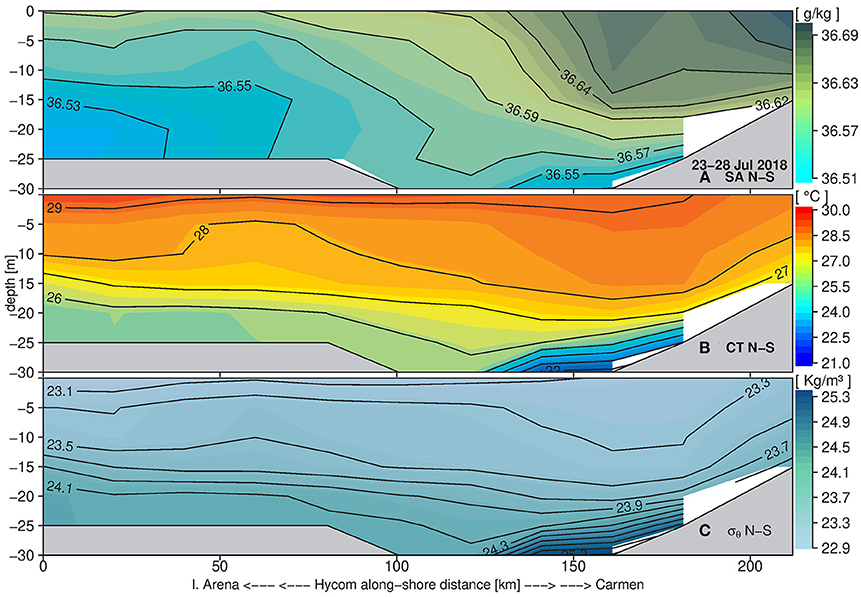
Figure 7. Along-shore view of the vertical distribution of (A) absolute salinity (g/kg), (B) conservative temperature (°C), and (C) density (σθ in kg/m3), from north to south, extracted from the Hycom modeled observations (LHycom on Figure 1).
Remotely sensed observations were used to supplement the spatial and temporal extent of the study and illustrate the behavior of SST and winds, during the dates of the upwelling event. SST anomalies exhibited a cold tongue of seawater extending from the north-eastern coast of the Yucatan Peninsula to Isla Aguada, in southern Campeche, reaching a minimum SSTa during July 19 (Figure 8a1). Near the coast, the bathymetric restriction off northern Campeche (20–21°N, 91°W) presented warmer anomalies in the period of the event, as shown in the CTD observations. During the time of the survey (Figure 8c1), this phenomenon was weakening and retracting, showing smoother SSTa with positive values off Campeche and low-negative values off Yucatan. This explains why in Figure 6 off Terminos Lagoon the influence of the upwelled water is absent, and it is not because the water does not reach up to there but rather than the event was already weakening, since in previous dates (Figure 8a1) the SSTa contours showed negative anomalies in this region. Winds were always easterlies during the time of the event (Figure 8, lower panels).
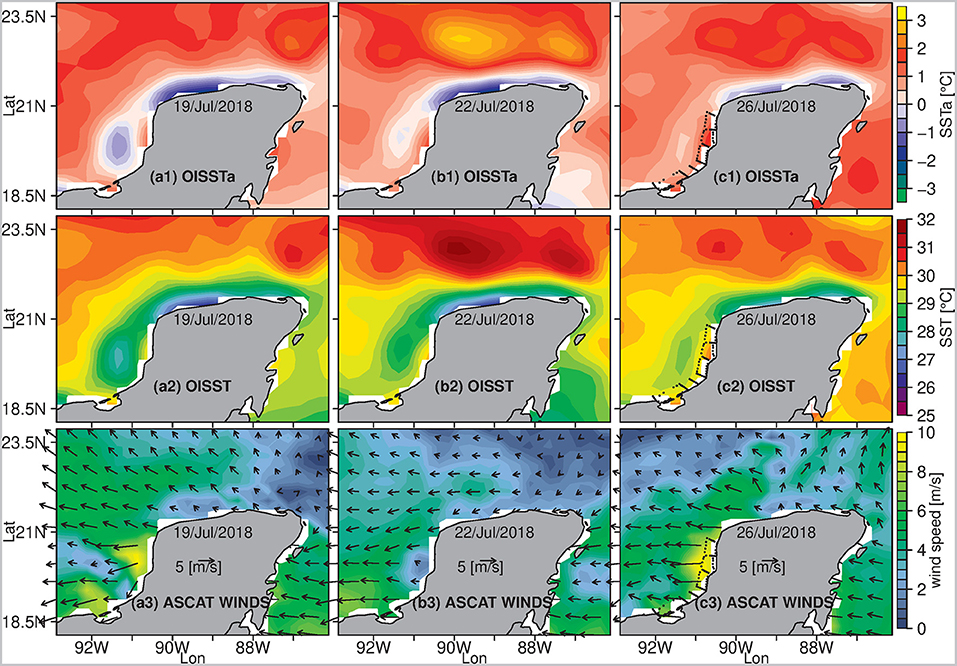
Figure 8. Satellite images of the end of July 2018, of the regional distribution of Sea Surface Temperature anomalies (a1,b1,c1), SST (a2,b2,c2), and surface winds (a3,b3,c3).
Using a Hövmuller diagram (Figure 9) of the along-shore SST anomaly distribution from the Caribbean Sea (87°W) until the Tabasco coast (>92°W), we explored the regularity of the advected upwelled waters over the western coast, where cooling events are related to negative anomalies (blue color values). From the eastern side of the shelf until the Campeche coast, cooling events are seen along-shore all year-round. Although SST is related to different surface heat budget processes and could be noisy to be attributed solely to the upwelling events, it showed an interesting resemblance to the findings of Merino (1997) and Ruíz-Castillo et al. (2016), exhibiting colder SST anomalies between July and August (in summer) off Campeche, and between April and August (spring and summer) off the Yucatecan coast. During winter (from January to March), surface cooling events encompassed all the region, from the Caribbean until Tabasco, although SST anomalies were low and are rather related to the synoptical effect of the northerly cold wind burst events that affect the GoM.
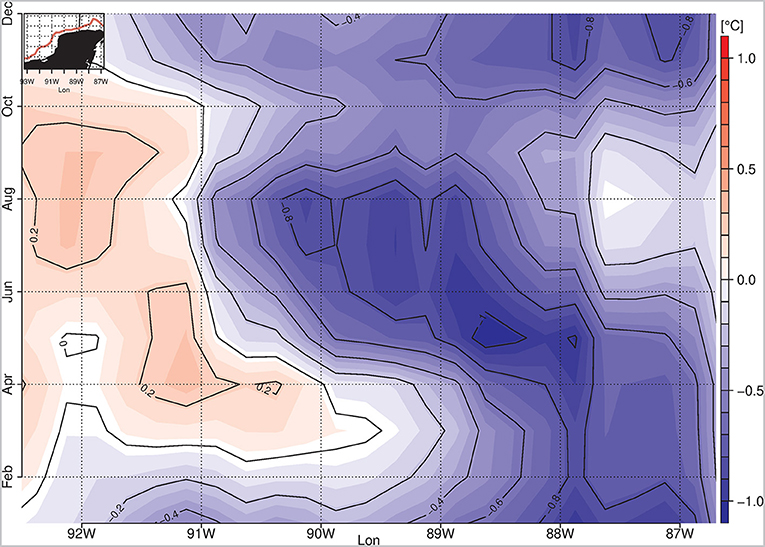
Figure 9. Hovmöller diagram of the monthly averaged remotely sensed SST anomalies. Red (blue) color shows warmer (colder) temperatures than the 39 years spatial-temporal mean (1981–2020). The transect used for the calculations is in the top left (in red).
Lagrangian Simulations
Trajectories were initiated from a regular grid of initial positions with a constant spacing of 0.01 degrees within a polygon encompassing the Campeche pool of cool water as determined from satellite SST on July 19, 2018 (Figure 10). Back-in-time trajectories indicate that the water within the polygon of initial positions mainly came from the northeast in the 2018 experiment and only from the northeast in the climatological experiment. Comparative analyses between the ADCP currents and HyCOM observations were carried at the three recording sites, and in general, the results showed a reasonable agreement between in situ and modeled observations (Table 3), with the best comparisons found at Chenkan.
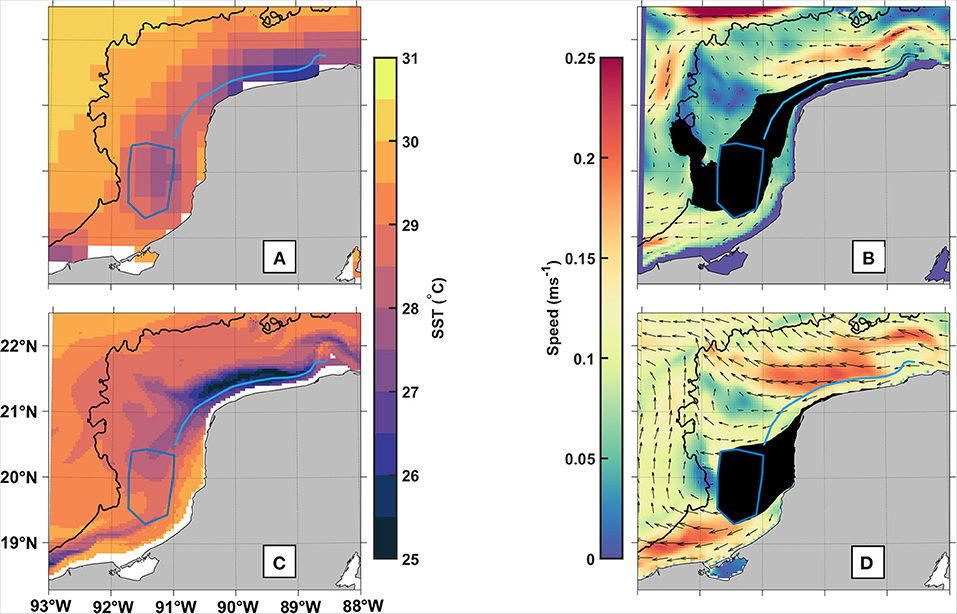
Figure 10. Sea surface temperature (°C) from satellite (A) and HyCOM GoM (C) on July 19, 2018. The blue polygon is used as initial conditions for back-in-time trajectories to investigate the cool water pool origin in the satellite data (A). Black dots in the right column are points from trajectories initiated within the blue polygon (July 19, 2018) and integrated back-in-time for 40 days (June 10, 2018) using HyCOM GoM velocity at 5 m depth (B), and a 1994–2014 climatological velocity at the surface (D). Color contours in the right column are the velocity magnitude (ms−1) used for the trajectories after time averaging, HyCOM GoM at 5 m depth is shown in (B), and the velocity climatology at the surface is shown in (D). The blue line is used as a path representative of most of the trajectories shown in (B) and is plotted as a reference in the other panels. The 50-m isobath is shown in black (Figure 10).
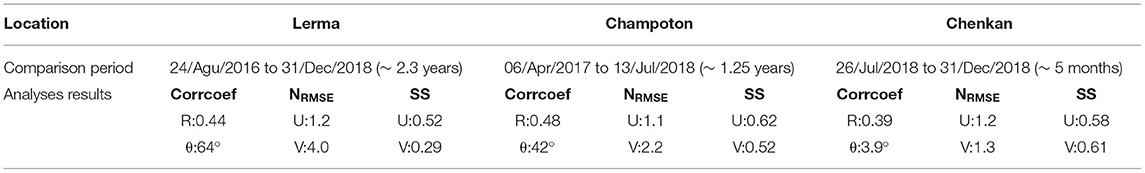
Table 3. Results of the comparative analyses between ADCP currents and modeled observations.
Using the 2018 velocity, about 18% of all trajectories had at least one point to the west of the westernmost point of the initial-position polygon, and 80% of all trajectories had at least one point to the east of the easternmost point of the initial-position polygon (Figure 10B). In the climatological experiment, in contrast, trajectories originate only from the Yucatan Shelf to the northeast (Figure 10). At the surface, advection of the ocean model SST also shows cool water moving along the same path as the trajectories (Figure 10C). Satellite and model SST are in good agreement, although the model has additional variability as should be expected from a higher resolution (Figures 10A,C).
Water parcels ending within the cool water polygon (initial-position for the back-in-time trajectories) traverse most of their path along a region of relatively intense upwelling of about 1–4 m per day that is present through the water column from the bottom to 5 m deep, in the 40 days leading to the observation of the cool satellite SST pool (Figure 11). The maxima in upward velocity along the representative horizontal trajectory coincide with the SST minima from satellite and HyCOM data (cf. Figures 10A,C, 11).
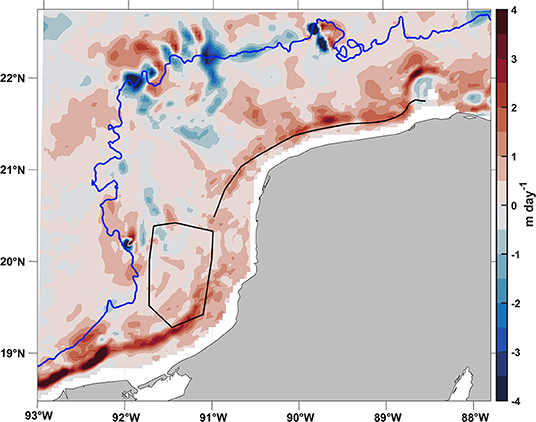
Figure 11. Vertical velocity (mday−1) from HyCOM GoM, time-averaged June 10, 2018, through July 19, 2018, and depth-averaged between 5 and 50 m, or bottom when <50 m. The 50 m isobath is shown in blue; the polygon used for initial trajectory positions, and a representative trajectory (see Figure 10) are shown in black.
There is good agreement between trajectories from the 2018 experiment computed here and cLCS from Duran et al. (2018). Trajectories from the east move across weak cLCS that are deformed as chevrons within the Yucatan Shelf, while trajectories from the northwest move along strong cLCS until they meet within the initial position polygon (Figure 12). The advection of cool SST coincides with most trajectories (Figure 10C), in crossing weak cLCS that deformed as chevrons and indicate the direction of weak transport, like in Gouveia et al. (2021), where along-slope SST advection happens through weak cLCS deformed as chevrons. cLCSs with relatively strong climatological attraction indicate transport barriers along which transport is often directed (see also Climatological Lagrangian Coherent Structures section for more details on interpreting cLCS).
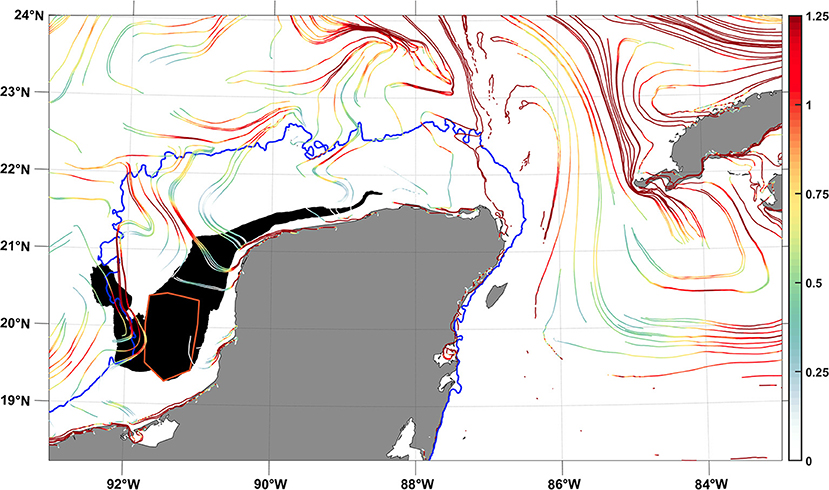
Figure 12. Climatological Lagrangian Coherent Structures (lines) colored according to their climatological strength of attraction (cρ, logarithmic scale) for July. The trajectories from Figure 10B are plotted in black, with the polygon used for their initial positions is plotted for reference in dark orange. The 50 m isobath is shown in blue.
Discussion
The hydrographic features and the numerical simulations described here confirm the existence of northeastern upwelled waters along the western Yucatan Shelf. They were brought from the northeast by advection. In their works of upwelling events over the northeastern Yucatecan coast, Ruiz-Renteria (1979), Merino (1997), and Jouanno et al. (2018) proposed that local wind acts indirectly in the upwelling intensity and variability by inducing high-frequency variations in the current magnitude over the platform. Once the upwelled water intrudes the shelf at the Cabo Catoche, the wind-forced currents spread this water along the north coast, particularly during spring and summer (Martínez-López and Pares-Sierra, 1998; Zavala-Hidalgo et al., 2003). The long time series average, of the water column velocities measured with the ADCPs (Figure 3), exhibited a southwestward flow of ~5 cm/s in Lerma and Champoton, and 7 cm/s in Chenkan. While in July 2018, mean surface velocities span from 7 to 18 cm/s (vectors in Figure 1), responsible for bringing Caribbean subsurface waters (CSUW) into the study area. If we consider the 500 km traveled by the upwelled waters in 40 days, as shown by the simulated trajectories, we found an average velocity of 14.5 cm/s, which agrees with the ADCP observations. At the northern shelf, off the Yucatecan coast, other studies have reported average westward velocities of 5–20 cm/s (Martínez-López and Pares-Sierra, 1998; Ruíz-Castillo et al., 2016).
An interesting feature promoted by the upwelling events is the suggestion of a two-layer water column distribution in such an open and shallow environment. Merino (1997) reported that during spring and summer the interaction between the upwelled and shelf waters (CSUW and CTSW, respectively) creates a two-layered water column with strong stratification that inhibits mixing between them. In some areas of our study, hints of a two-layer system are apparent, as reported by Merino (1997), and the bottom layer is water that rises to the platform (the CSUW), while the top layer is the water that was already on the Yucatan platform (modified CTSW). As the CSUW is advected westward, it mixes with the local waters and upwells in a more traditional wind-induced type of upwelling along its path. Thus, the cooler water can be seen as a bottom layer and a surface layer, although additional observations are needed to better define the stratification and mixing mechanisms of these two water types within the shelf.
Other authors had shown evidence of the large spatial coverage of these upwelling events in the northern Yucatan Shelf (Ruíz-Castillo et al., 2016) and its duration from spring to autumn (Merino, 1997), demonstrating its importance on the productivity of the region, as nitrate distributions of the upwelled water layer fertilize the shelf (Furnas and Smayda, 1987; Merino, 1997; Estrada-Allis et al., 2020). Although we did not present any nitrate, we believe that the upwelling events we report should enhance productivity off the coast of Campeche. Additional interdisciplinary data are needed to improve our understanding of the role that upwelling may play in the seasonal and interannual variability of nutrients and primary productivity, and their impact on regional fishing resources.
Studies on the seasonality of the upwelling events over the Yucatan Shelf (Molinari, 1980; Merino, 1997) attributed it to the Yucatan Current flow intensity, which strengthens during spring and summer and weakens in autumn-winter, implies bottom friction mechanisms. On the other hand, Ruíz-Castillo et al. (2016) explored the relationship between the along-shore wind stress over the shelf and the seasonality of the upwelling events, using a longitude-time (Hövmuller) diagram of the mean monthly upwelling index. They found upwelling events throughout the year with two strong periods: March–July and October–December, the former being stronger. As mentioned above, the monthly averaged SST anomalies (Figure 9) showed a resemblance to the findings of Merino (1997) and Ruíz-Castillo et al. (2016), exhibiting colder SST anomalies between July and August (in summer) off Campeche, and between April and August (spring and summer) off the Yucatecan coast. Also, the climatological Lagrangian Coherent Structures (Figure 12) support the recurrence of westward advection toward the study area, suggesting that the 2018 upwelling and advection event were not an isolatedone.
The climatological Lagrangian results presented here agree with the ensemble-mean Lagrangian circulation sustained by the instantaneous HyCOM-GOM10.04 velocity from 1994 through 2014, depicted, for example, in Figure 1 of Duran et al. (2018). In that figure, the ensemble-mean distribution of a passive tracer moves westward over the Yucatan Shelf. To obtain the ensemble-mean distribution of tracer in Duran et al. (2018), the ensemble averaging is taken over a series of different initial conditions spanning from 1994 to 2014, thus linking climatological Lagrangian transport and ensemble-averaged instantaneous Lagrangian transport. Blue tracer reaches the furthest toward the west at the location where cLCSs deform as chevrons toward the west and where the climatological attraction is weakest. This is in excellent agreement with the 2018 model SST advection and trajectory simulation presented here (Figure 10), where trajectories originating in the Yucatan Shelf move across cLCS where the climatological strength of attraction is weakest and deform as chevrons toward the west (Figure 12). Thus, the existence of a predominant pathway connecting the eastern Yucatan Shelf and the Bay of Campeche becomes clear. The different experiments supporting a persistent along-slope Lagrangian link from the Yucatan Shelf to the Campeche shelf include the 2018 trajectory simulation presented here (Figure 10), the ensemble-mean tracer distribution from an instantaneous velocity spanning from 1994 through 2014, and cLCS computed from 1994 to 2014 climatological velocity (Duran et al., 2018). Trajectories computed directly from the climatological velocity are also in good agreement with this pattern, although when initiated in the Campeche pool of cool water and integrated backward in time, trajectories move westward closer to the coast, where strongly attracting cLCSs align with the coastline, thus confirming the cLCS' strong attraction (Figures 10, 12). These simulated results are supported by observations of water masses as described above.
Conclusions
Upwelling events over the Yucatan Shelf are an important physical phenomenon to the region. There has been very little effort looking at the impact of upwellings on the western shelf, on the Campeche side. This study used a combination of observations and numerical modeling to show evidence for the first time, of the presence of upwelled waters on the western side. The 2018 velocity from HyCOM, along with the climatological Lagrangian Coherent Structures (cLCS) methodology, identifies recurrent pathways from Yucatan to Campeche. Lagrangian simulations, integrated back-in-time, identified the time and place of origin of the upwelled water. In agreement, our observational results show that Subtropical Caribbean Underwater (CSUW) was brought from the northeast shelf, over 500 km away from the study area, by ocean current advection. Numerical outputs demonstrated that these flows took over a month (40 days) to arrive at the study region, traveling along-shelf with an average velocity of 14.5 cm/s, comparable to the magnitude and direction of the ADCP observations off Campeche. Near the bottom, in the regions where the bathymetry allowed the upwelled water to approach the shore, the water column exhibited two different water types, evidencing Tropical Caribbean Waters (CTSW) on the surface, and CSUW extending near the ocean floor. A Hovmüller diagram of the monthly averaged SST anomalies from a 39-year time series suggested that upwelled waters off Campeche are a regular phenomenon during summer. The recurrence of westward advection toward the study area is also supported by climatological Lagrangian Coherent Structures and by the ensemble-mean Lagrangian simulations of Duran et al. (2018) spanning from 1994 to 2014.
More information is needed to address this interesting phenomenon and improve our understanding of their frequency of occurrence and the important implications that they must have on the marine biota over the west shelf, by bringing upwelled colder and nutrient-rich subsurface waters. The following are some questions that remain open and would be interesting to address in future work: (1) the role that upwelled waters play in the heat budget of the Yucatan Shelf that in spring and summer exhibits high atmospheric temperatures (>35°C). (2) Northerly cold wind burst phenomena are known to diminish upwelling events on the eastern Yucatan Shelf, but can they bring subsurface waters from the northwestern shelf? (3) To the west of the study region, off the Tabasco coast, trade winds produce upwelling events, is there any connection between them and the Campeche coast?
Data Availability Statement
The datasets presented in this study can be found in online repositories. The names of the repository/repositories and accession number(s) can be found below: https://doi.org/10.6084/m9.figshare.15125214.v1; https://doi.org/10.6084/m9.figshare.15127434.v1; https://doi.org/10.6084/m9.figshare.15127470.v1; https://doi.org/10.6084/m9.figshare.15127464.v1.
Author Contributions
JK: conceptualization, methodology, software, writing—original draft preparation, and funding acquisition. RD: conceptualization, methodology, software, and writing—original draft preparation. EB and AS: writing—reviewing and editing. All authors contributed to the article and approved the submitted version.
Funding
JK would like to thank the financial aid of CONACyT grants: Cátedras CONACyT (1912), Ciencia Básica (257075), and Apoyo al Fortalecimiento y Desarrollo de la Infraestructura Científica y Tecnológica (270455). AS was partially funded by the CONACYT Sabbatical visit (265894) and by the NOC core funding. RD wants to express that the funding for the development of HyCOM has been provided by the National Ocean Partnership Program and the Office of Naval Research. Data assimilative products using HyCOM are funded by the U.S. Navy. Computer time was made available by the DoD High-Performance Computing Modernization Program. The output is publicly available at https://hycom.org.
Conflict of Interest
The authors declare that the research was conducted in the absence of any commercial or financial relationships that could be construed as a potential conflict of interest.
Publisher's Note
All claims expressed in this article are solely those of the authors and do not necessarily represent those of their affiliated organizations, or those of the publisher, the editors and the reviewers. Any product that may be evaluated in this article, or claim that may be made by its manufacturer, is not guaranteed or endorsed by the publisher.
Acknowledgments
Special thanks to Gabriel May Uc, Julio Uc Medina, and Heber Uc González for their fieldwork support in the oceanic surveys and to the Instituto EPOMEX for all the facilities provided to carry out this work. We would like to thank the fruitful contributions of three reviewers.
Supplementary Material
The Supplementary Material for this article can be found online at: https://www.frontiersin.org/articles/10.3389/fmars.2021.723452/full#supplementary-material
Supplementary Table 1. Spatial location and dates of the CTD stations during the 2018 summer sampling.
Supplementary Figure 1. ADCP zonal currents (U in cm/s) for (A) Lerma, (B) Champoton, and (C) Chenkan. Blue (red) colors represent westward (eastward) velocities.
References
Aldeco, J., Monreal, M. A., Signoret, M., Salas de León, D. A., and Hernández, D. U. (2009). Occurrence of a subsurface anticyclonic eddy fronts, and Trichodesmium spp. Cienc. Mar. 35, 333–344. doi: 10.7773/cm.v35i4.1551
Aljaz M., Azevedo Correia de Souza J. M., Andrade-Canto F., and Rodríguez Outerelo J. (2020). Connectivity of deep waters in the Gulf of Mexico. J. Mar. Syst. 203:103267. doi: 10.1016/j.jmarsys.2019.103267
Belousov, I. M., Ivanov, Y. A., Pasternak, S. A., Rass, T. S., and Rossov, V. V. (1966). Oceanographic research by the Soviet-Cuban Marine Expedition. Oceanology 6, 312–320.
Bessonov, N., Gonzalez, O., and Elizarov, A. (1971). “Resultados de las investigaciones Cubano-Sovieticas en el Banco de Campeche,” in Coloquio Sobre Investigaciones y Recursos Del Mar Caribe y Regiones Adyacentes. UNESCO.
Bogdanov, D. V., Sokolov, V. A., and Khromov, N. S. (1968). Regions of high biological and commercial productivity in the Gulf of Mexico and Caribbean Sea. Oceanology 8, 371–381.
Bulanienkov, S. K., and Garcia, C. (1973). “Influencia de los procesos atmosfericos en el afloramiento del Banco de Campeche,” in Cuarta Reunión De Balance De Trabajo, Centro De Investigaciones Pesqueras/Instituto NacionaI De La Pesca, Cuba, Informe De Investigación, vol 2.
Cochrane, J. D. (1966). The Yucatan Current, upwelling off North-eastern Yucatan, and currents and waters of Western Equatorial Atlantic. Oceanography of the Gulf of Mexico. Progress Rep., TAMU, Ref No. 66-23T, 14–32.
Cochrane, J. D. (1968). Currents and Waters of the Eastern Gulf of Mexico and Western Caribbean, of the Western Tropical Atlantic Ocean, and of the Eastern tropical pacific ocean. Dep. Oceanogr. Meteorol. Texas: A&M Univ. 19–28. (Unpubl. Rep.)
Cochrane, J. D. (1969). Water and Circulation on Campeche Bank in May. Bull. Jpn. Soc. Fish. Oceanogr. Spec. No. (Prof. Uda's Commemorative Papers), 123–128.
Duran, R., Beron-Vera, F. J., and Olascoaga, M. J. (2018). Extracting quasi-steady Lagrangian transport patterns from the ocean circulation: an application to the Gulf of Mexico. Sci. Rep. 8, 1–10. doi: 10.1038/s41598-018-23121-y
Duran, R., Beron-Vera, F. J., and Olascoaga, M. J. (2019). CIAM Climatological Isolation and Attraction Model–Climatological Lagrangian Coherent Structures. Albany: National Energy Technology Laboratory-Energy Data eXchange; NETL. doi: 10.18141/1558781
Enríquez, C., Mariño-Tapia, I., Gilberto, J., and Capurro-Filograsso, L. (2013). Thermohaline processes in a tropical coastal zone. Continent. Shelf Res. 69, 101–109. doi: 10.1016/j.csr.2013.08.018
Estrada-Allis, S., Sheinbaum, J., Azevedo, J., Enriquez, C., Mariño-Tapia, I., and Herrera-Silveira, J. (2020). Dissolved inorganic nitrogen and particulate organic nitrogen budget in the Yucatán shelf: driving mechanisms through a physical–biogeochemical coupled model. Biogeosciences 17, 1087–1111. doi: 10.5194/bg-17-1087-2020
Furnas, M. J., and Smayda, T. J. (1987). Inputs of subthermocline waters and nitrate onto the Campeche Bank. Cont. Shelf Res. 7, 161–175. doi: 10.1016/0278-4343(87)90077-X
Gough, M. K., Beron-Vera, F. J., Olascoaga, M. J., Sheinbaum, J., Jouanno, J., and Duran, R. (2019) Persistent Lagrangian transport patterns in the northwestern Gulf of Mexico. J. Phys. Oceanogr. doi: 10.1175/JPO-D-17-0207.1
Gouveia, M. B., Duran, R., Lorenzzetti, J. A., Assireu, A. T., Toste, R., de, F., et al. (2021). Persistent meanders and eddies lead to quasi-steady Lagrangian transport patterns in a weak western boundary current. Sci. Rep. 11, 1–18. doi: 10.1038/s41598-020-79386-9
Haller, G. (2015) Langrangian coherent structures. Annu. Rev. Fluid Mech. 47:140906185740003. doi: 10.1146/annurev-fluid-010313-141322.
Herrera-Silveira, J. A., Medina-Gomez, I., and Colli, R. (2002). Trophic status based on nutrient concentration scales and primary producers community of tropical coastal lagoons influenced by groundwater discharges. Hydrobiologia 475, 91–98. doi: 10.1023/A:1020344721021
Jouanno, J., Pallàs-Sanz, E., and Sheinbaum, J. (2018). Variability and dynamics of the Yucatan upwelling: high-resolution simulations. J. Geophys. Res. Oceans 123, 1251–1262. doi: 10.1002/2017jc013535
Kurczyn, J. A., Appendini, C. M., Beier, E., Sosa-López, A., López-González, J., and Posada-Vanegas, G. (2020). Oceanic and atmospheric impact of central American cold surges (Nortes) in the Gulf of Mexico. Int. J. Climatol. 41, E1450–E1468. doi: 10.1002/joc.6779
Lorente, P., Lin-Ye, J., García-León, M., Reyes, E., Fernandes, M., Sotillo, M. G., et al. (2021). On the performance of high frequency radar in the western mediterranean during the record-breaking storm Gloria. Front. Mar. Sci. 8:645762. doi: 10.3389/fmars.2021.645762
Martínez-López, B., and Pares-Sierra, A. (1998). Circulation in the gulf of mexico induced by tides wind and the yucatan current. Cienc. Mar. 24, 65–93. doi: 10.7773/cm.v24i1.740
McDougall, T. J., and Barker, P. M. (2011). “Getting started with TEOS-10 and the Gibbs Seawater (GSW) oceanographic toolbox,” in SCOR/IAPSO WG127, 28.
Merino, M. (1997). Upwelling on the Yucatan Shelf: hydrographic evidence. J. Mar. Syst. 13, 101–121. doi: 10.1016/s0924-7963(96)00123-6
Molinari, R. L. (1980). Current variability and its relation to sea-surface topography in the Caribbean Sea and Gulf of Mexico. Mar. Geodesy 3, 409–436.
Nordam, T., and Duran, R. (2020). Numerical integrators for Lagrangian oceanography. Geosci. Model Dev. 13, 5935–5957. doi: 10.5194/gmd-13-5935-2020
Nowlin, W. D., and Mclellan, H. J. (1967). A Characterization of the Gulf of Mexico waters in winter. J. Mar. Res. 25, 29–59.
R Core Team (2014). R: A Language and Environment for Statistical Computing. Vienna: R Foundation for Statistical Computing.
Reyes-Mendoza, O., Herrera-Silveira, J., Mariño-Tapia, I., Enriquez, C., and Largier, J. L. (2019). Phytoplankton blooms associated with upwelling at Cabo Catoche. Continent. Shelf Res. 174, 118–131. doi: 10.1016/j.csr.2018.12.015
Reyes-Mendoza, O., Mariño-Tapia, I., Herrera-Silveira, J., Ruiz-Martínez, G., Enriquez, C., and Largier, J. L. (2016). The effects of wind on upwelling off Cabo Catoche. J. Coast. Res. 32, 638–650. 10.2112/JCOASTRES-D-15-00043.1
Reynolds, R. W., Rayner, N. A., Smith, T. M., Stokes, D. C., and Wang, W. (2002). An improved in situ and satellite SST analysis for climate. J. Clim. 15, 1609–1625. doi: 10.1175/1520-0442(2002)015<1609:AIISAS>2.0.CO;2
Ruíz-Castillo, E., Gomez-Valdés, J., Sheinbaum, J., and Rioja-Nieto, R. (2016). Wind-driven coastal upwelling and westward circulation in the Yucatan shelf. Continent. Shelf Res. 118, 63–76. doi: 10.1016/j.csr.2016.02.010
Ruiz-Renteria, F. (1979). Upwelling North of the Yucatan Peninsula (Master's thesis). Texas: Texas A&M University.
Troupin, C., Barth, A., Sirjacobs, D., Ouberdous, M., Brankart, J.M., Brasseur, P., et al. (2012). Generation of analysis and consistent error fields using the Data Interpolating Variational Analysis (DIVA). Ocean Model. 552–3, 90–101. doi: 10.1016/j.ocemod.2012.05.002
Valle-Levinson, A., Mariño-Tapia, I., Enriquez, C., and Waterhouse, A. M. (2011). Tidal variability of salinity and velocity fields related to intense point-source submarine groundwater discharges into the coastal ocean. Limnol. Oceanogr. 56, 1213–1224. doi: 10.4319/lo.2011.56.4.1213
Vidal, V. M. V., Vidal, F. V., Hernández, A. F., Meza, E., and Zambrano, L. (1994). Winter water mass distributions in the western Gulf of Mexico affected by a colliding anticyclonic ring. J. Oceanogr. 50, 559–588. doi: 10.1007/bf02235424
Willmott, C. J., Ackleson, S. G., Davis, R. E., Feddema, J. J., Klink, K. M., Legates, D. R., et al. (1985). Statistics for the evaluation and comparison of models. J. Geophys. Res. 90, 8995–9005.
Keywords: upwelling events, shelf processes, transport of upwelled waters, climatological Lagrangian Coherent Structures, Yucatan Peninsula
Citation: Kurczyn JA, Duran R, Beier E and Souza AJ (2021) On the Advection of Upwelled Water on the Western Yucatan Shelf. Front. Mar. Sci. 8:723452. doi: 10.3389/fmars.2021.723452
Received: 10 June 2021; Accepted: 16 September 2021;
Published: 26 October 2021.
Edited by:
William Savidge, University of Georgia, United StatesReviewed by:
Atsushi Kaneda, Fukui Prefectural University, JapanEmilio Hernandez-Garcia, Institute of Interdisciplinary Physics and Complex Systems (IFISC), Spain
Copyright © 2021 Kurczyn, Duran, Beier and Souza. This is an open-access article distributed under the terms of the Creative Commons Attribution License (CC BY). The use, distribution or reproduction in other forums is permitted, provided the original author(s) and the copyright owner(s) are credited and that the original publication in this journal is cited, in accordance with accepted academic practice. No use, distribution or reproduction is permitted which does not comply with these terms.
*Correspondence: Jorge. A. Kurczyn, amt1cmN6eW5yQGlpbmdlbi51bmFtLm14
†Present address: Jorge A. Kurczyn, Laboratorio de Ingeniería y Procesos Costeros, Instituto de Ingeniería, Universidad Nacional Autónoma de México, Sisal, Mexico