 Patrick R. Pata
 Aletta T. Yñiguez
94% of researchers rate our articles as excellent or good
Learn more about the work of our research integrity team to safeguard the quality of each article we publish.
Find out more
ORIGINAL RESEARCH article
Front. Mar. Sci., 06 October 2021
Sec. Marine Ecosystem Ecology
Volume 8 - 2021 | https://doi.org/10.3389/fmars.2021.719691
This article is part of the Research TopicThe Philippine Seas: Biodiversity and Ecological Impacts of Natural and Anthropogenic stressors in Tropical Reef SystemsView all 14 articles
The marine habitats of the Philippines are recognized to be some of the most biodiverse systems globally yet only 1.7% of its seas are designated as marine protected areas (MPAs) with varying levels of implementation. Many of these MPAs were established based on local-scale conservation and fisheries objectives without considering larger-scale ecological connections. The connectivity of reefs through larval dispersal is important in the regional-scale resilience against anthropogenic disturbances and is considered a significant criterion in planning for MPAs. In this study, we provide insights into the delineation of ecologically connected MPA networks using larval dispersal modeling and network analysis. We characterized the network properties of the Philippine coral reefs, organized as 252 reef nodes, based on the larval connectivity networks of a branching coral, sea urchin, and grouper. We then evaluated the distribution of the existing 1,060 MPAs relative to the connectivity patterns. All reef nodes were found to be highly interconnected with a mean shortest path ranging from 1.96 to 4.06. Reef nodes were then ranked according to their relative importance in regional connectivity based on five connectivity indices. Despite the between-organism and between-index variability in rankings, there were reefs nodes, mostly located offshore and at major straits, which consistently ranked high. We found that the distribution of existing MPAs partially capture some of the regional connectivity functions but there is a spatial mismatch between the primarily coastal MPAs and the high-ranking reef nodes. Furthermore, network partitioning identified subnetworks and dispersal barriers. The existing MPAs were found to be disproportionately distributed to a few subnetworks and that the largest subnetworks do not contain the greatest number of MPAs. Considering these gaps, we suggest expanding the coverage of protected areas especially in underrepresented reef networks to meaningfully capture national-scale connectivity and meet global conservation objectives.
Global biodiversity targets aim for the protection of at least 10% of coastal and marine areas particularly those providing important biodiversity and ecosystem services by the year 2020 (CTI-CFF [Coral Triangle Initiative on Coral reefs, Fisheries and Food Security], 2009; CBD [Convention on Biological Diversity], 2010). A key part of this is the establishment of marine protected areas (MPAs) which are actively managed areas at various levels of protection from extractive and destructive activities (TNC-WWF-CI-WCS [The Nature Conservancy, World Wildlife Fund, Conservation International and Wildlife Conservation Society], 2008). MPAs play an important role in ensuring ecological and social resilience with two general objectives of biodiversity conservation and increasing fisheries stocks (Almany et al., 2009; Harrison et al., 2012).
The Philippines house a large coral reef area (Spalding et al., 2001) that provides various ecosystem services (Burke et al., 2012; Ferrario et al., 2014). It is one of the most biodiverse systems globally (Carpenter and Springer, 2005; Gaither and Rocha, 2013; DeVantier and Turak, 2017) that can be reserves of coral reef resilience and functions (Briggs, 2005; McWilliam et al., 2018). Establishing MPAs has been a common approach in conservation and management of coral reefs in the Philippines to address declines in fish stocks (Horigue et al., 2012). In the past 30 years, over 1,800 MPAs have been designated (Cabral et al., 2014) although most of these were locally established, less than 1 km2 in area, and not designed to be part of regional-scale ecological networks (Weeks et al., 2010; Horigue et al., 2015). Only 1.7% of the exclusive economic zone and territorial seas of the Philippines are designated as MPAs (MPAtlas, 2021) and 2.7–3.4% of coral reefs are protected in MPAs (Weeks et al., 2010). The year 2020 has passed without reaching the 10% protection goal, which may actually still be insufficient (O’Leary et al., 2016). Expanding the coverage of protection is now more than ever an urgent endeavor considering the rapid decline in coral cover in the Philippines and its importance for global biodiversity (Licuanan et al., 2019). Importantly, determining which areas to protect should ideally be systematically guided by a set of ecological indicators in order to increase the likelihood of contributing to conservation objectives. These include habitat quality, habitat representativeness, biodiversity, special interest species, ecological connectivity, social connectivity, coastal resource usage, current and future threats, social acceptance, and potential ecosystem services (White et al., 2006; Kininmonth et al., 2011; Cabral et al., 2015, 2016; Horigue et al., 2015).
A key criterion in marine conservation is ecological connectivity (Parsons et al., 2014) through the dispersal of larval organisms between distant populations (Cowen and Sponaugle, 2009; Jones et al., 2009). Connectivity is especially important in promoting regional-scale resilience against anthropogenic disturbances (Hock et al., 2017; O’Leary et al., 2017). Despite this, connectivity is the least understood aspect and is seldom considered in designing MPAs in practice (Botsford et al., 2009). Such is the case for the Philippines where there is available regional information on habitat coverage and habitat quality to aid the siting of reserves (Cabral et al., 2015), but there is a knowledge gap regarding connectivity. Some studies have utilized connectivity information to provide insights on protection within subregions in the Philippines (Abesamis et al., 2016; Deauna et al., 2021) but a national-scale assessment is still needed.
The principal bottleneck in obtaining connectivity information is the difficulty in observing and estimating connectivity itself because eggs and larvae are microscopic and pre-recruitment mortality is high (Cowen and Sponaugle, 2009; Peck and Hufnagl, 2012). Empirical methods provide valuable observations of realized connectivity (Botsford et al., 2009; Cowen and Sponaugle, 2009) but these tend to span spatial and temporal scales that may not be sufficient for regional-scale reserve siting (Botsford et al., 2009; McCook et al., 2009; Berumen et al., 2012). Biophysical modeling of larval dispersal provides a complementary method (Werner et al., 2007; Botsford et al., 2009; Cowen and Sponaugle, 2009) through simulating the general dynamics of connectivity of large spatial domains for several different organisms.
A graph theoretical approach, i.e., network analysis, of connectivity model results has been useful in nominating potential areas for protection (Kininmonth et al., 2011; Holstein et al., 2014; Deauna et al., 2021). The regional benefits of connectivity are asymmetric (Munguia-Vega et al., 2014) and various indices derived from characteristics of connectivity networks help to quantify different ecological functions of connectivity (Betancur et al., 2011; Grorud-Colvert et al., 2014). Additionally, connectivity networks can be partitioned into subnetworks of more strongly ecologically interconnected reefs that more likely share the regional benefits of protection (Thomas et al., 2014). A network analysis of connectivity is appropriate for Philippine coral reefs which have a complex spatial distribution (Licuanan et al., 2019). These reefs are found in multiple basins separated by narrow straits and subjected to seasonally variable circulation patterns resulting in the asymmetric dispersal of larvae (Melbourne-Thomas et al., 2011; Pata and Yñiguez, 2019). In this study, we aimed to characterize the regional connectivity properties of the Philippine coral reef network and delineate interconnected subnetworks. Furthermore, we evaluated the distribution of currently designated MPAs with regards to regional ecological connectivity and identified potential areas where protection can be expanded.
The connectivity data used was derived from a biophysical dispersal model of the larger domain of the North Indo-West Pacific coral reefs (Pata and Yñiguez, 2019). The model was driven by the surface circulation of the global Hybrid Coordinate Modeling System (Chassignet et al., 2007). Three larval coral reef organisms were simulated: a broadcast-spawning branching coral (Acropora millepora), a reef-associated sea urchin (Tripneustes gratilla), and a predatory grouper (Epinephelus sp.). All three organisms vary in early life-history characteristics and are ecologically and economically important in Philippine coral reefs. The branching coral larva has a shorter pelagic larval duration (PLD) than the other organisms. The branching coral and sea urchin larva were simulated to be passive drifters. The grouper larva was simulated to have a swimming behavior directed toward reefs after reaching their flexion age. The connectivity data was validated to have dispersal kernels within the range of empirical estimates and have connectivity ranges concordant with inferred dispersal barriers from population genetic studies (Pata and Yñiguez, 2019).
The raw settlement probability matrices for this analysis represent averages across the spawning period of each organism and three simulation years (2011, 2013, 2015). The reef cells were further averaged based on the clustering of covarying regional spatiotemporal patterns (Pata and Yñiguez, 2019) resulting in 406 reef nodes within the North Indo-West Pacific. A subset of 252 reef nodes found inside the Philippine exclusive economic zone and territorial seas (Flanders Marine Institute, 2019) were used in this analysis (Figure 1). The 252 × 252-node settlement probability matrices were transformed to a network by dividing the rows of the matrix with the horizontal sum, i.e., the total settlement probability of each reef node. The network edges thus represent the proportion of successfully settling larvae from a source node arriving at a sink node. The previous analysis of this dataset has demonstrated that there is high seasonal and interannual variability in connectivity patterns but the relative spatial patterns are similar between closely located reefs within each node (Pata and Yñiguez, 2019). As this study used weighted network edges, this variability was reflected in the relative edge strength between nodes.
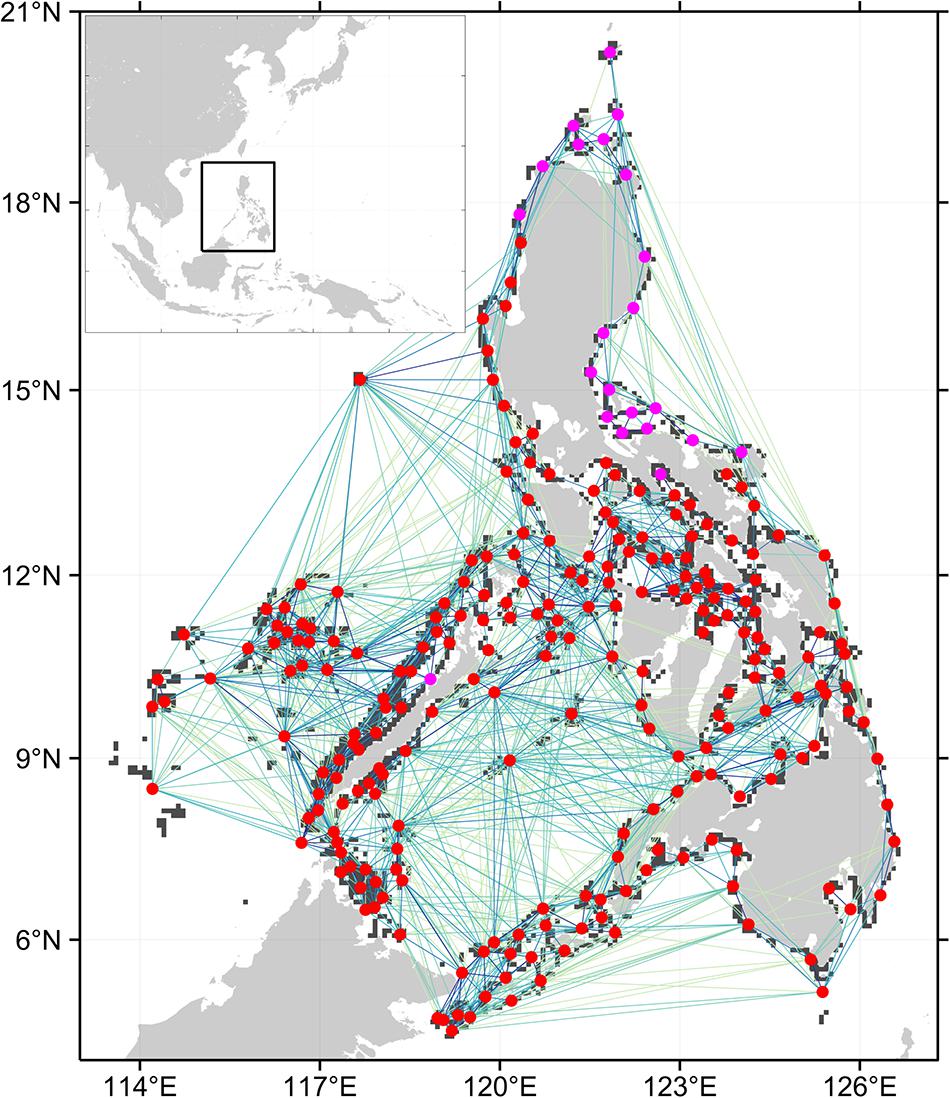
Figure 1. Connectivity network for branching coral. Only the top 50% of connections are shown, darker lines are stronger connections. Circles represent the centroids of the 252 reef nodes within the Philippine EEZ. Red circles are nodes that are part of the largest strongly connected component (SCC) when the weakest 50% of connections are removed. Purple circles are nodes that are unidirectionally connected to the main SCC.
MPA data was obtained from the MPA Support Network database (Cabral et al., 2014) in March 2017. Only MPAs with known geographic locations were included in the analysis. We also excluded MPAs around the Tañon Strait in the central Philippines because this area was not resolved in the connectivity model (Pata and Yñiguez, 2019). This resulted in 1,060 MPAs out of the 1,893 MPAs recorded in the database.
Descriptive network properties on strongly connected components (SCC), shortest paths, and network diameter were calculated for each of the organism networks. SCCs are the group of nodes in which there is a path to and from each node in the network (Holstein et al., 2014). A region in which all nodes are connected will have an SCC of 1. If more than 1 SCC is found, potential dispersal barriers may exist as the other SCCs may either be fully disconnected or unidirectionally connected to the main SCC containing the greatest number of nodes. Within an SCC, shortest paths are the minimum number of edges which connect two nodes. The longest shortest path is the diameter of an SCC. The shortest path represents the most efficient and probable path connecting a source node to a sink node. The diameter represents the minimum number of steps that can connect any two nodes in the network. Shorter mean shortest paths and diameters indicate a more interconnected network. We recalculated the network topology after retaining the top 75 and 50% of the strongest connections in each network as a sensitivity analysis on the connectedness of the nodes.
The connectivity indices calculated for the reef nodes within the network are betweenness centrality, source-sink index, source diversity, and sink diversity. This is a similar set of indices used in the analysis of a Caribbean coral reef network (Holstein et al., 2014). For comparison with the other indices, we also calculated the local retention, or the proportion of larvae spawned from each node that settled in the same node.
Betweenness centrality (BC) accounts for the number of shortest paths passing through each node (Treml et al., 2008). This quantifies the importance of the reef node in maintaining the integrity of the network (Kough and Paris, 2015). In this study, the edges were weighted by the strength of the connection and consequently, the shortest path was then transformed to the most reliable path (MRP). The MRP was identified as the highest value of the product notation of all weighted paths connecting two nodes (Hock and Mumby, 2015). The BC of a node i was calculated from,
in which σ(i) is the sum of all MRPs that pass through node i and σ is the total number of most reliable paths connecting all pairs of nodes (Holstein et al., 2014). Nodes which are central to the network are efficient stepping stones or corridors in larval dispersal (Munguia-Vega et al., 2014) making these ideal areas for protection to preserve network functioning (Kininmonth et al., 2011).
The source-sink index (SSI) of a node i was calculated from,
in which Pexp is the summation of all outgoing edge weights from node i and Pimp is the summation of all incoming edge weights to node i (Holstein et al., 2014). Thus, a positive SSI indicates that the node is a net source. Conversely, a negative SSI indicates that the node is a net sink. Areas which disproportionately act as strong sources could provide subsidies to other areas making them ideal candidates for protection (Almany et al., 2009) since protection benefits would likely extend beyond the local domain. Disproportionate sinks receive more larvae than it provides suggesting that population growth may be more of a function of external larval supply. In this analysis, we considered a positive SSI as more ideal. The SSI is not able to account for the range of the exports and imports of each node (e.g., a strong source node providing large subsidies to a single node). Thus, calculating source and sink diversity complements the source-sink index.
The source diversity (SoD) of a node accounts for the richness and evenness of its source nodes computed from a modified Shannon’s diversity index (Holstein et al., 2014). Thus, the SoD of the sink node si was calculated from,
in which so are all the source nodes connected to node si and pi is the weight of each incoming edge to node si normalized with the sum of all its incoming edges. Areas which have multiple larval sources, i.e., have high SoD, are more likely to be resilient due to the resulting high genetic diversity and thus is more likely to experience the rescue effect compared to areas with low SoD which are more likely sensitive to local population disruptions (Holstein et al., 2014; Dorman et al., 2016).
The sink diversity (SiD) was calculated using the inverse edge directions wherein,
in which pj is the weight of each outgoing edge from node so normalized with the sum of all its outgoing edges. The SiD index tries to identify sources that maximize the spread of successfully settling larvae to the greatest number of areas in terms of richness and evenness. Areas which subsidize more reefs likely contribute more to the network since connectivity benefits would be spread out.
The connectivity index scores were compared between the three organism networks using Pearson’s correlation to identify similarities in network importance across larval types. To identify associations in index scores, Pearson’s correlation was also used for pairwise comparisons between connectivity indices for each organism network. Reef nodes were then ranked for each organism network and connectivity index. The overall reef rankings were determined by calculating the mean and standard deviation of rankings.
Subnetworks which represent ecologically interconnected reefs were identified by applying the Leiden Algorithm (Traag et al., 2018) using the Constant Potts Model (CPM) (Traag et al., 2013). A multiplex approach that combines networks with similar nodes but with different layers of edges (Mucha et al., 2010; Traag et al., 2018) was used to determine the subnetworks that are consistent across the three organism networks. The advantage of using CPM is that it provides a natural interpretation where nodes within the same community or subnetwork have an average dispersal probability greater than a threshold resolution parameter, while nodes from different subnetworks are connected by less than that resolution parameter (Thomas et al., 2014). The resulting subnetworks represent ecologically separate reef communities, based on the likelihood of larval dispersal, which are more internally interconnected with each other than with reefs outside the subnetwork. The size of the subnetworks is dependent on the resolution parameter used to partition the network. The appropriate resolution parameter was determined using bisection profiles (Traag et al., 2013) in which plateaus in the proportion of connections between subnetworks indicate local optima in partitioning. A sensitivity analysis of the partitioning was done by deriving eight bisection profiles based on the multiplex network for each of the three organism networks, and when using unweighted and weighted network edges. Network topology properties were recalculated to characterize and compare the subnetworks.
The 1,060 MPAs were matched with reef nodes through a nearest neighbor search between the MPA longitude and latitude positions and the reef cell centroids. Many of the MPAs do not have information on the MPA area. Thus, MPAs were analyzed as individual sites and the relative sizes of the MPAs were not accounted for. We assumed that the spatial density of individual MPAs reflect management efforts for different areas. The distribution of the MPAs were then evaluated in relation to each connectivity index and network, and then to the overall ranking of reef nodes. The number of MPAs were also tallied for each of the subnetworks to determine the proportional distribution of the MPAs across subnetworks and discern if there are regional gaps in the distribution of MPAs.
The CPM was analyzed in Python 3.6 using the leidenalg package (Traag et al., 2018). All other numerical analyses were done in MATLAB 2019a.
The SCC of the full network for each organism is one (Table 1) which indicates that there is a path connecting all nodes in the network. The coral network has a longer mean shortest path and diameter compared to the other networks. This implies that it takes longer for coral larvae spawned at any node to reach farther nodes. The urchin and grouper networks have similar topologies with the grouper network having a slightly shorter mean shortest path. All three networks were robust to the removal of lower probability connections based on the sensitivity analysis. When only the top 75% of connections were analyzed, a single node was excluded in the main SCC of the coral network. This is similar to the SCC of the sea urchin and grouper networks when the top 50% of connections were analyzed. The coral network further excluded 21 nodes found at the northeastern Philippines at 50% connections (Figure 1). The mean shortest paths and the diameter values did not greatly increase when the weaker connections were excluded.
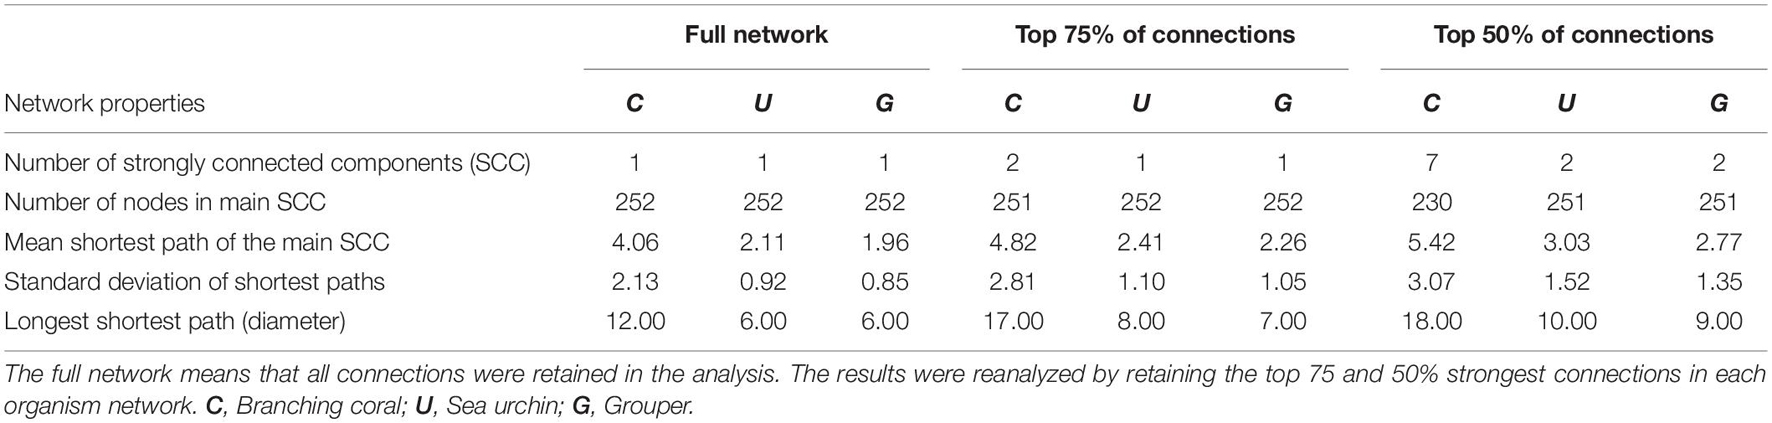
Table 1. Topology of the three organism-specific networks.
All the connectivity index scores significantly covary between organism networks. The urchin and grouper networks have the most similar index scores as indicated by the highest r2-values for each index (Table 2). Among the connectivity indices, betweenness centrality scores are weakly associated between the coral and urchin and the coral and grouper networks. Overall, the three organism networks have quite similar rankings for node importance, except for betweenness centrality.
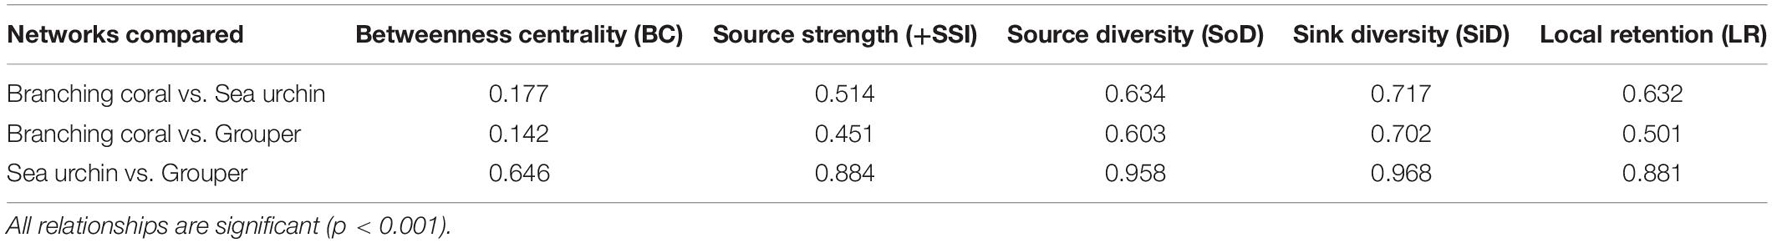
Table 2. Pearson coefficient of determination (r2) between pairs of organism networks for each index.
When connectivity indices were compared, most of the organism-specific pairwise correlations were either not significant or weak (Table 3) and the spread of the index scores were high (Supplementary Figure 1). Only source diversity and sink diversity had a strong positive correlation (r = 0.73–0.77). Local retention had a strong negative correlation with both sink diversity and source diversity (r = −0.59–−0.75) and moderate negative correlation with source strength (r = −0.29–−0.39). Because of the significant negative correlation of local retention with the other indices, local retention was excluded in calculating the overall reef node rankings across organism networks.
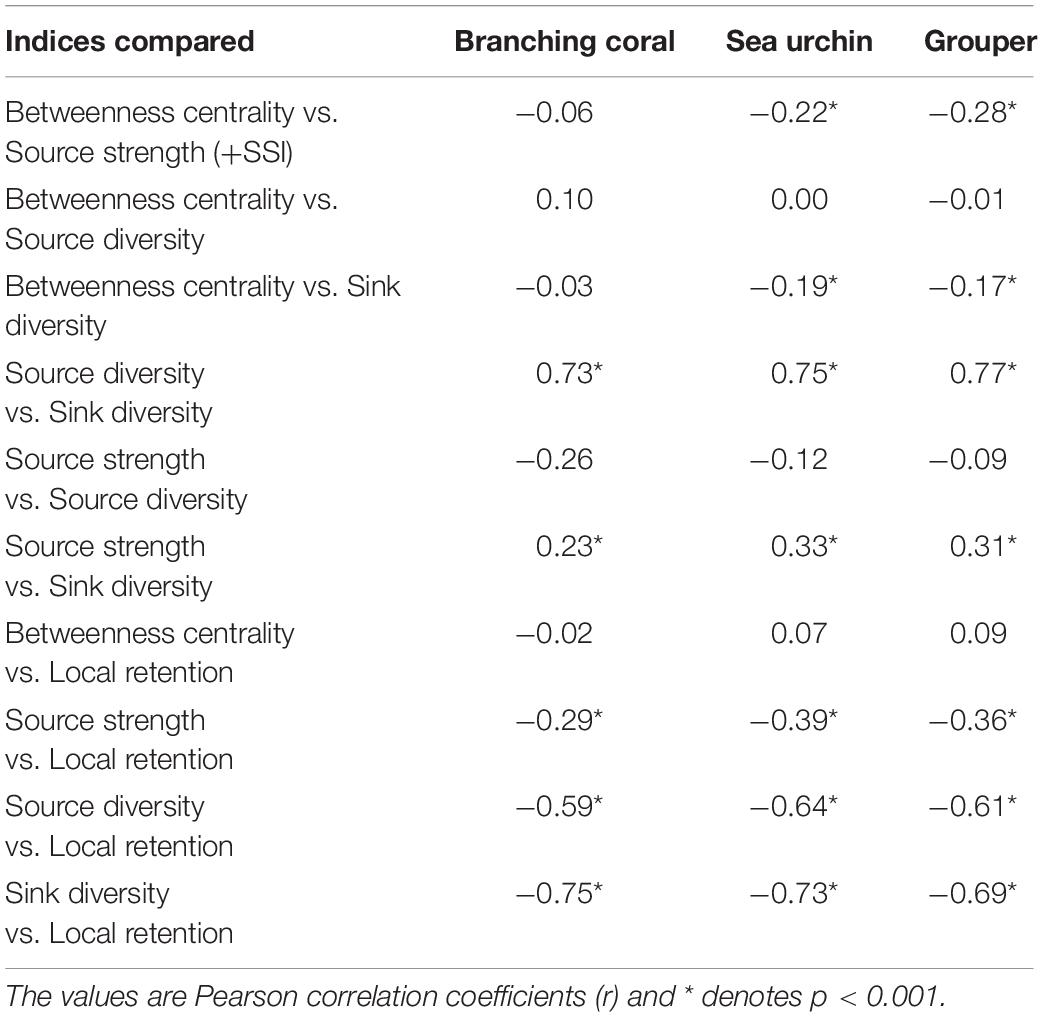
Table 3. Pairwise comparison between connectivity indices for each organism network.
Despite the between-organism and between-index variability in reef node rankings, there are reefs which consistently rank high in most connectivity indices (Figure 2). High ranking reef nodes tend to be located offshore or at major straits separating basins. The lowest ranking nodes indicate areas that are relatively isolated from the rest of the network. These were found at embayments and mostly at the eastern side of the Philippines. Furthermore, the overall top 10% mean ranking nodes have the lowest range of standard deviation rankings (Figure 3A). When inspecting the characteristics of the organism-specific index rankings of the top 25% of reef nodes (Figure 4A), these nodes consistently rank high in source diversity and sink diversity. The top nodes rank moderately high in betweenness centrality and source strength but most of the top nodes rank low in local retention.
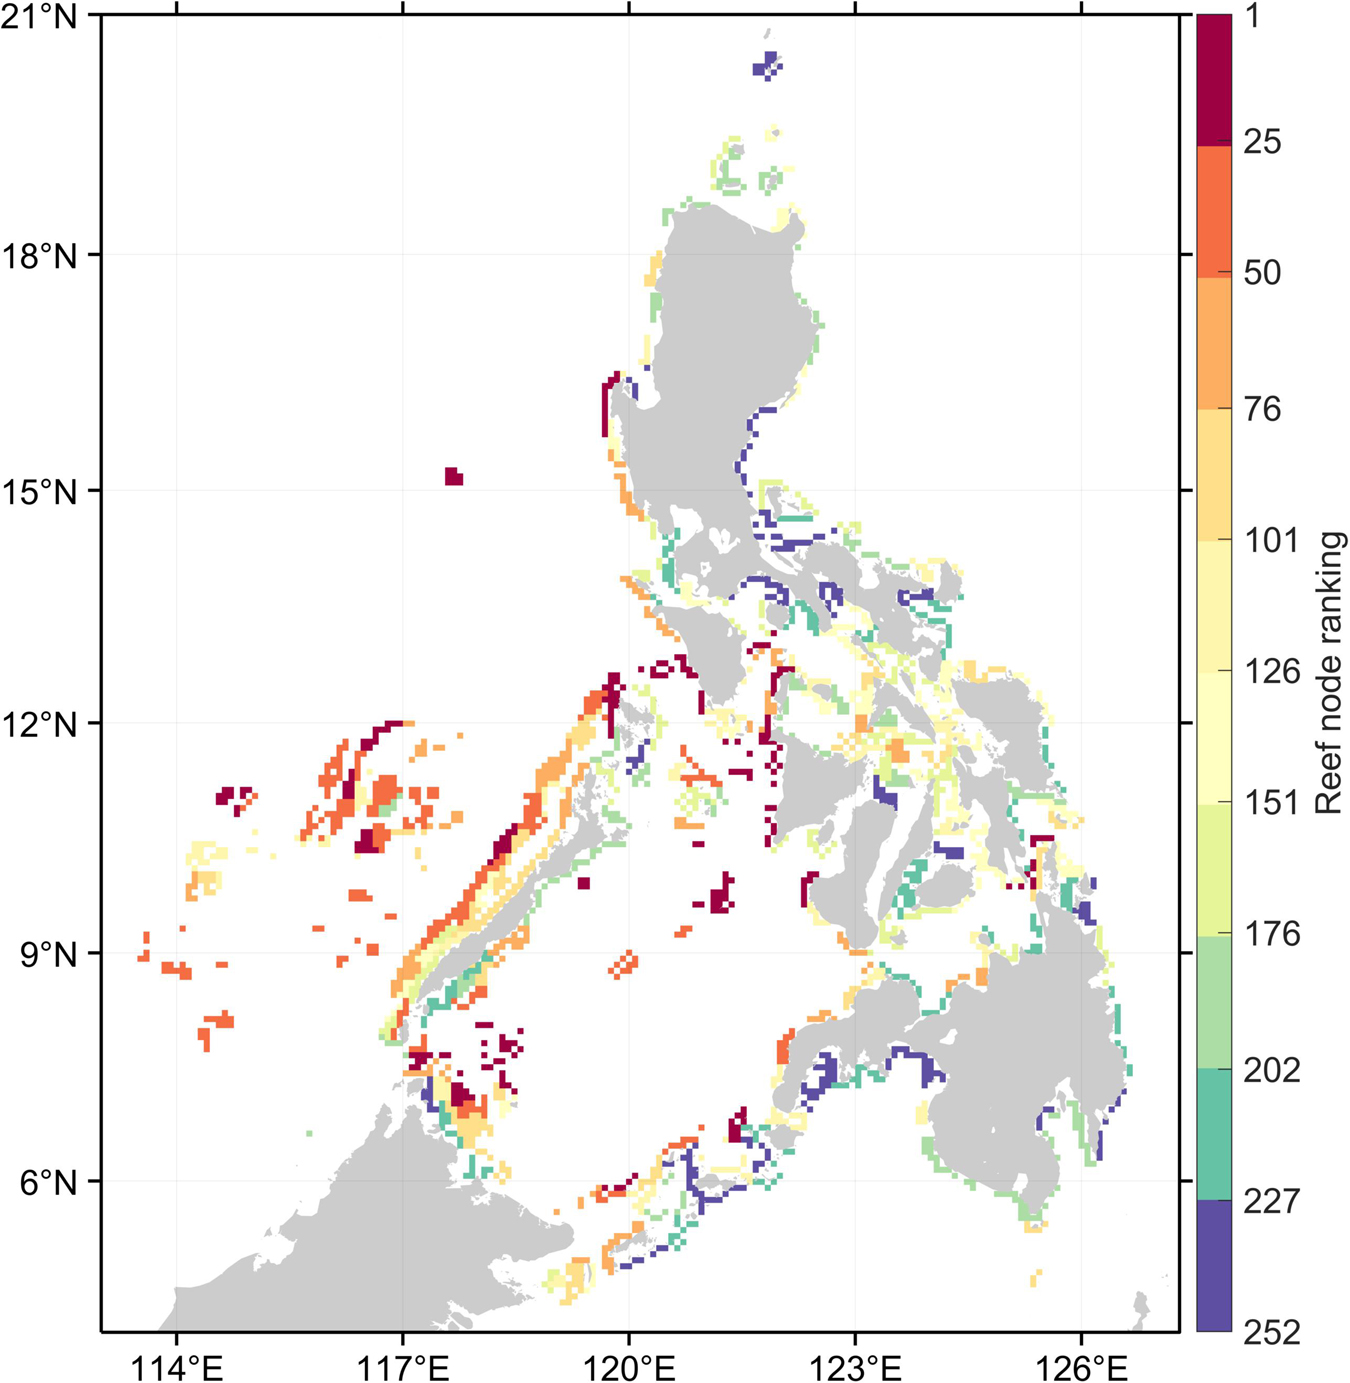
Figure 2. Overall ranking of reef nodes based on the average ranking across organisms and four connectivity indices. Warm colors represent the top reef nodes that generally ranked high in most connectivity indices. Reef nodes in red are the top 10% while in purple are the bottom 10%.
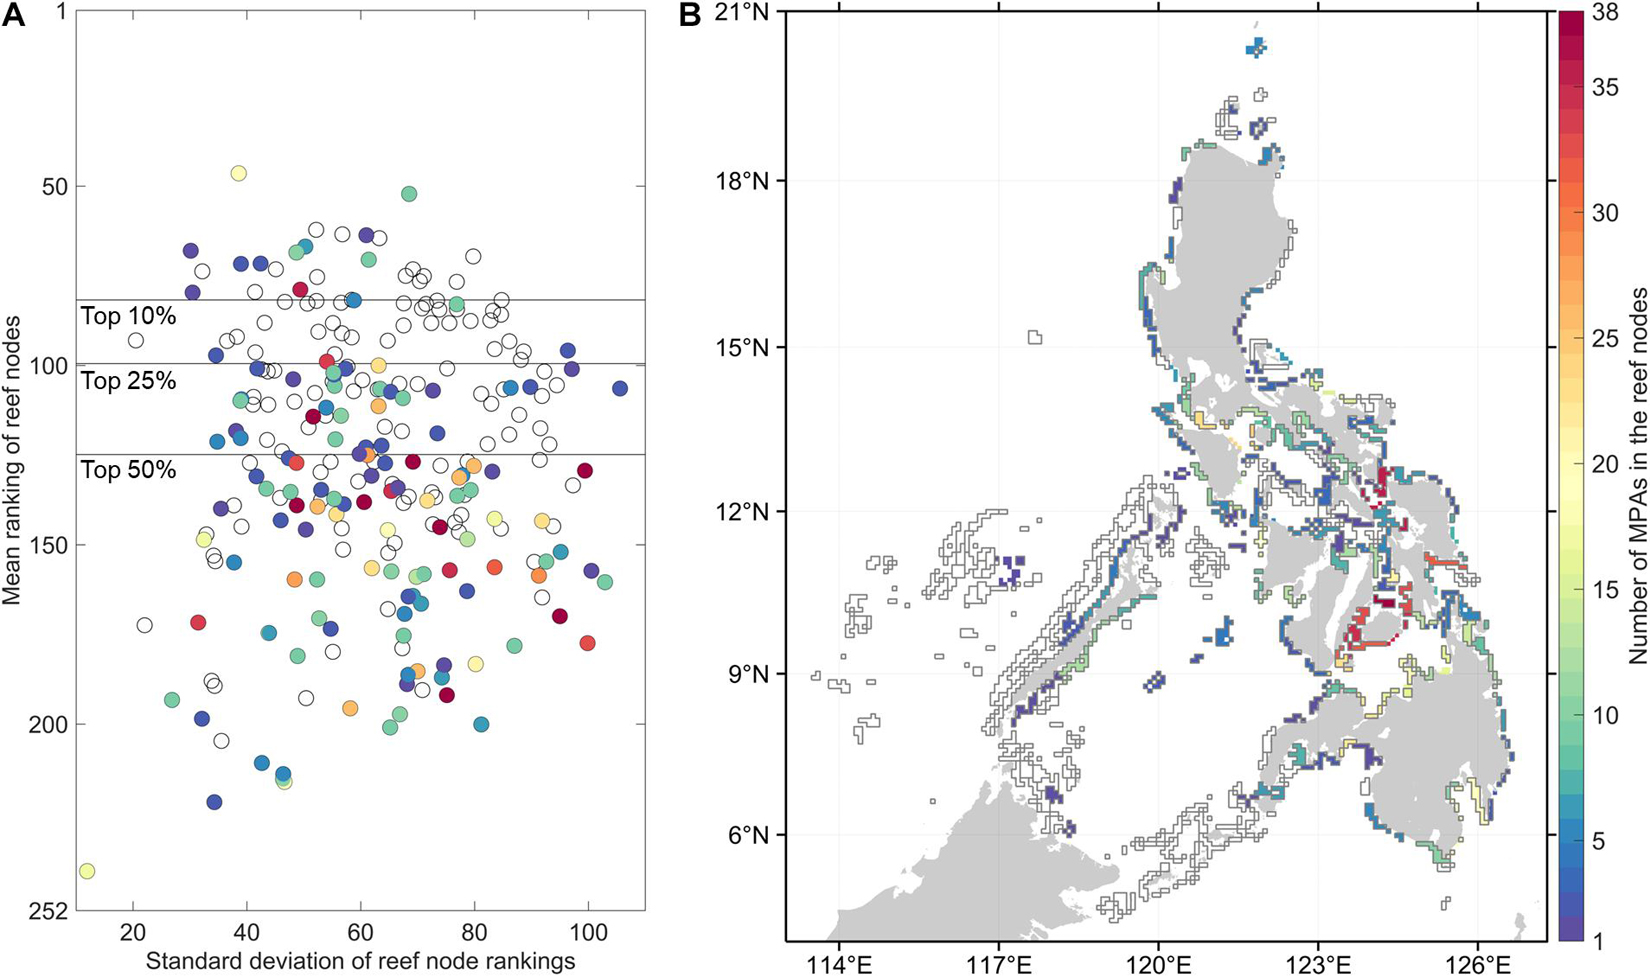
Figure 3. Characteristics of the reef nodes relative to the 1,060 marine protected areas (MPAs). (A) The distribution of the overall mean rankings and their standard deviations of each reef node across indices and organisms. The horizontal lines mark the top 10, 25, and 50% mean ranking nodes. (B) Map of the reef nodes as polygons in the connectivity model. The colors in both (A,B) indicate the number of MPAs located in the reef nodes. Empty polygons indicate that there is no MPA geographic coordinate information for these reef nodes.
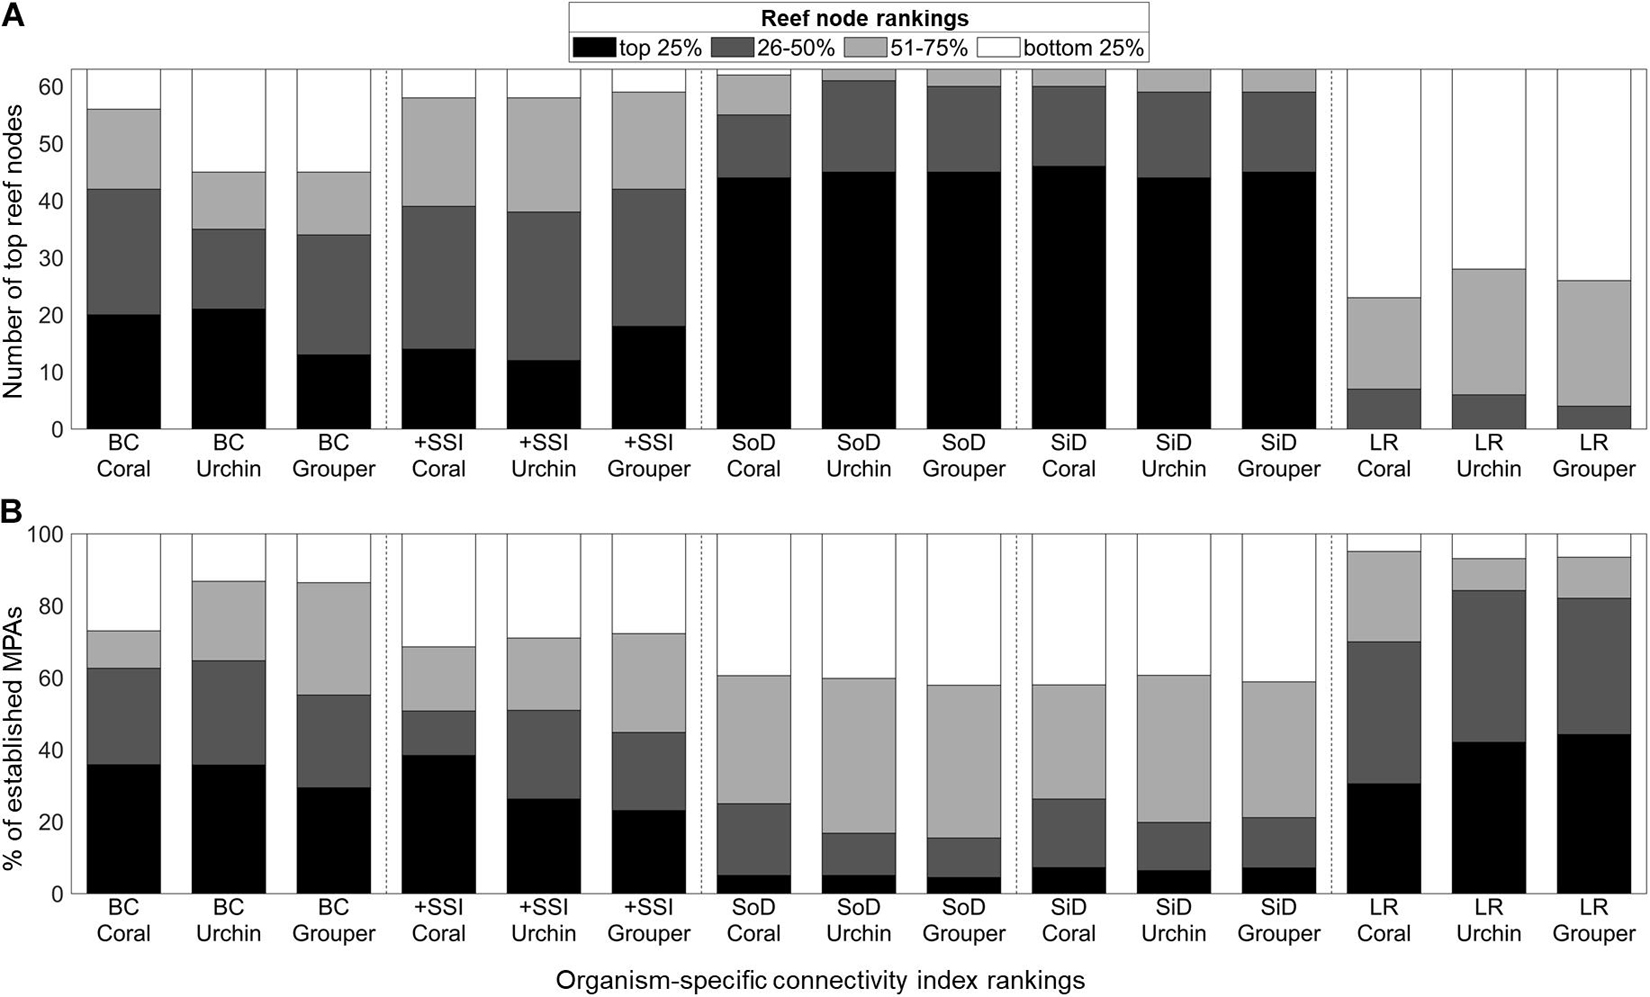
Figure 4. Distribution of the organism-specific connectivity index rankings of the (A) overall top 25% of reef nodes and (B) 1,060 established MPAs (B). The scale indicates the quartile ranking of the reef node or MPA. BC, Betweenness Centrality; +SSI, Source-Sink Index; SoD, Source Diversity; SiD, Sink Diversity; LR, Local Retention.
Half of the reef nodes (128 out of 252) had at least one associated MPA (Figure 3B). Most of the MPAs are concentrated in a few reef nodes in the central Philippines. Only 16 of the 63 overall top 25% reef nodes based on connectivity features have associated MPAs (Figure 3A). Of the 1,060 MPAs analyzed, around half are in nodes with high betweenness centrality and high source strength (Figure 4B). Majority of the established MPAs are found in nodes ranking the lowest in terms of source diversity and sink diversity and conversely, highest in local retention.
A sensitivity analysis of the multiplex partitioning of the three organism networks (Supplementary Figure 2) suggested that the local optimal resolution parameter values resulting in stable subnetworks are 0.0004 and 0.004. These represent the broad-scale and medium-scale subnetwork partitioning (Figure 5). The sensitivity analysis also demonstrated that the local optima are consistent, and the resolution parameters chosen were appropriate for the multiplex network and all the organism-specific networks. For the broad-scale subnetworks, subnetwork A consists of reefs from the West Philippine Sea, Sulu Sea, and Celebes Sea, while subnetwork B consists of reefs in the central Philippines (Figure 5A). Subnetwork C are reefs at the northeastern Philippines while subnetwork D are reefs at the southeastern Philippines.
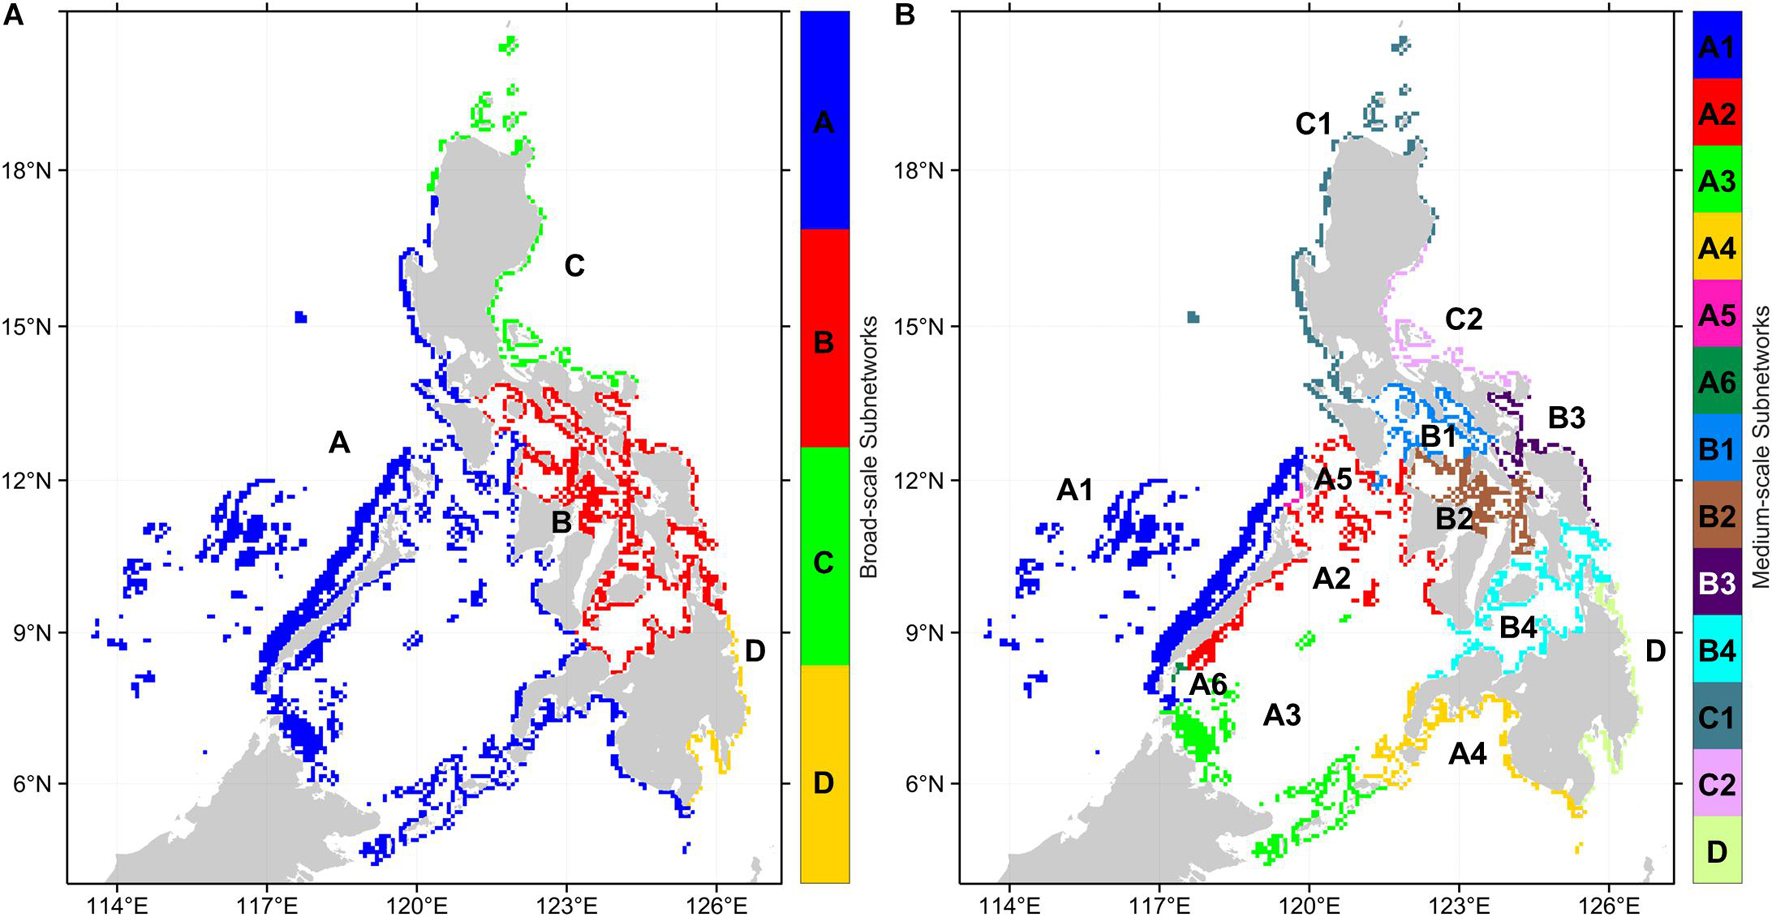
Figure 5. Regional subnetworks based on the multiplex partitioning of the three organism networks. (A) Broad-scale subnetworks were partitioned with a resolution parameter of 0.0004. (B) Medium-scale subnetworks were partitioned with a resolution parameter of 0.004.
The medium-scale subnetworks resulted in a partitioning that matches the major basins and reveals a latitudinal divide for the West Philippine Sea and Sulu Sea reefs (Figure 5B). Subnetwork A was divided into 6 medium-scale subnetworks while subnetwork B was divided into 4. Subnetwork C was divided into two medium-scale subnetworks, although subnetwork C1 representing reefs of the northern Philippines have nodes that are shared between networks A and C. At the medium-scale partitioning, subnetwork D remains the same. Within subnetwork A, two single-node subnetworks emerged (subnetwork A5 and A6) which suggests that these reefs are not as strongly interconnected to the nearby reefs despite being located at areas with high reef node density. This may be a limitation of the network partitioning method rather than an actual pattern given that these nodes are found between the opposite edges of the two largest subnetworks and that, at a higher resolution parameter value, these nodes would belong to a fine-scale subnetwork (Supplementary Figure 3). The fine-scale partitioning would double the number of subnetworks and show more local structures of interconnectivity.
Analysis of the network topology of each subnetwork resulted in almost all subnetworks being strongly interconnected with a single SCC and short mean shortest paths and diameters (Table 4). This excluded subnetwork D which has 3 SCCs. Enumerating the number of MPAs found in each subnetwork revealed a highly uneven distribution across subnetworks (Table 4). At the broad-scale, subnetwork B has twice as many MPAs compared to subnetwork A, which is more than three times larger in terms of the number of reef nodes and four times as large in terms of reef area. Subnetworks C and D have similar numbers of MPAs despite subnetwork C being larger. At the medium-scale subnetworks, the disproportionate distribution of MPAs is more apparent with around 40% of the MPAs in B4, which is the 4th largest subnetwork. The 1st and 3rd largest subnetworks (A1 and A3) hold 1.5 and 0.4%, respectively, of the MPAs.
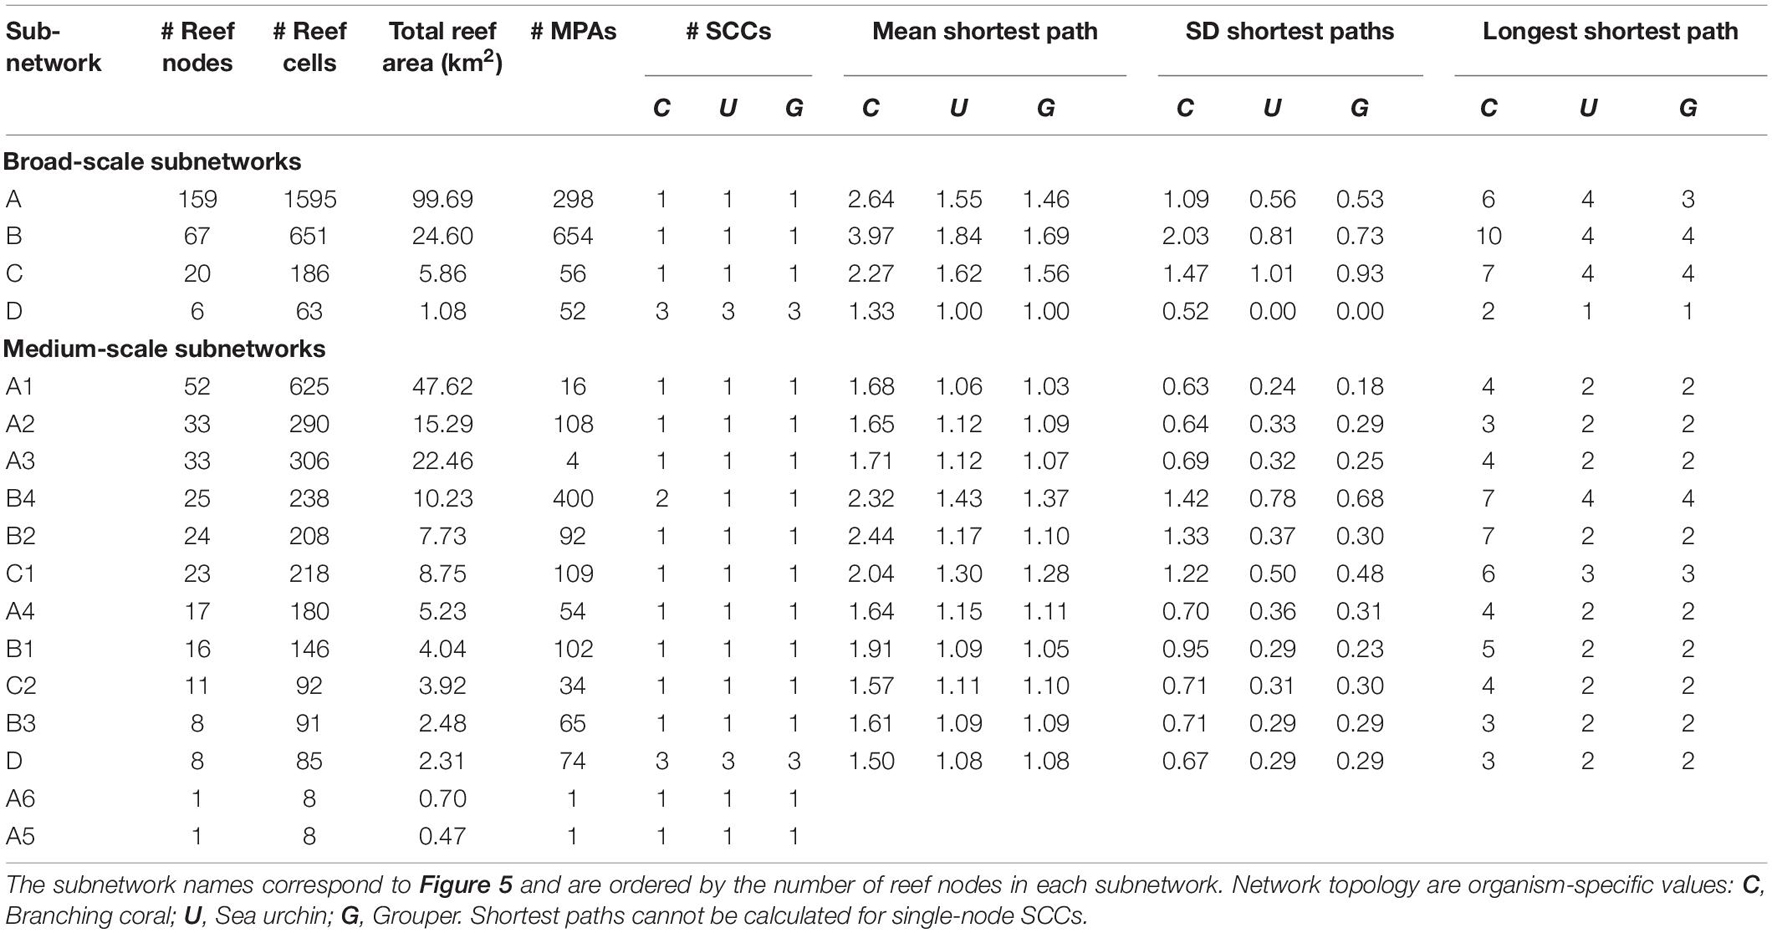
Table 4. Reef area, MPAs, and topology of the subnetworks.
The interconnectedness of all reef nodes suggests that there is a single Philippine coral reef network that is regionally linked through the multi-generational dispersal of larvae. In contrast, a network analysis of corals in the Tropical Pacific identified several SCCs, isolated islands, and much longer connection paths (Treml et al., 2008). The Tropical Pacific covers a wider area with reefs distributed in distant islands compared to the Philippine reefs. This points to distance as a determinant of interconnectedness. In comparison to the regional-scale network of Caribbean reefs (Holstein et al., 2014), the Philippine network similarly has an SCC of 1 but has a longer mean shortest path and diameter. This suggests that it takes longer to traverse the Philippine network despite it covering a smaller area than the Caribbean network. Thus, in addition to distance, the complexity of the geomorphology also contributes to interconnectedness given that the Philippine network is composed of multiple embayments and basins that are connected through narrow straits (Pata and Yñiguez, 2019). The subnetworks we identified are often bordered by the major straits which are considered biodiversity corridors (Ong et al., 2002). The bifurcation of the North Equatorial Current into the strong western boundary Kuroshio and Mindanao currents (Gordon et al., 2014) also pose a dispersal barrier. This manifested as the second SCC in the sensitivity analysis scenarios and the emergence of the subnetworks C and D in the broad-scale partitioning. The multiple pathways within the Philippine coral reef network provide encouragement that extensive and effective management efforts could potentially yield connectivity benefits which would resonate beyond the local scale.
Coral reefs are diverse and three-dimensional ecosystems but our analysis was limited to three representative species and did not consider the vertical connectivity in mesophotic reefs (Kool and Nichol, 2015; Holstein et al., 2016). Previous studies have shown that connectivity dynamics are species-specific and are sensitive to larval characteristics, spatial location, and the temporal spawning period (Treml et al., 2008; Holstein et al., 2014; Thomas et al., 2014; Pata and Yñiguez, 2019). Larval connectivity is very complex and variable that even congeneric species found at the same area have contrasting observed larval dispersal patterns (Becker et al., 2007). The projection of reserve performance based on Marxan optimization scenarios has found that MPA network designs that incorporate a variety of connectivity patterns would not improve the biomass for all species (White et al., 2014). The three representative species we modeled captured a wide range of larval characteristics and yet we found between-organism similarity in network topology, connectivity index rankings, and subnetwork partitioning. Nonetheless, expanding the representation of coral reef species would improve the robustness of future connectivity analysis. This could be achieved after synthesizing databases and independent guild-specific studies on larval traits (Fisher et al., 2005; Macpherson and Raventós, 2006; Luiz et al., 2013; Green et al., 2015; Gumanao et al., 2016; Madin et al., 2016; Baird et al., 2021) and contextualizing these to the species found in the Philippine coral reefs.
Connectivity studies typically consider larval sources as ideal sites for reserve selection (Green et al., 2014; Kininmonth et al., 2019). Ideal sources would be populations with high genetic diversity (Jones et al., 2009) and have a wide range of sink locations to spread out the connectivity benefits. Nodes with high source diversity on the other hand are suggested to more likely harbor resilient populations because of high population genetic diversity (Almany et al., 2009). Ensuring the persistence of populations across the network also involve intermediary sites that would connect the regional sources to the rest of the network nodes (Gaines et al., 2010). Additionally, protecting high local retention nodes would lead to faster population recovery (Hopf et al., 2016). Through considering various indices for the Philippine coral reef network, we found that the valuation of reef nodes is generally similar across different organisms given the covariation in index scores between networks. On the other hand, the limited strong correlations between indices indicate that each index captures different aspects of connectivity functioning. We did not identify any reef node which scored high in all indices but reefs which are important in most indices still emerged. Given the negative relationship between source strength and betweenness centrality, the top-ranking reef nodes are either (a) central reefs with diverse connections, or (b) important larval sources with diverse connections. The former includes reefs mostly located at straits and the latter are the exposed offshore reefs that can supply larvae at a long dispersal range. These reefs have previously been considered as national marine conservation priority areas (Ong et al., 2002). The negative correlation of the connectivity indices to local retention also suggests a trade-off that reflects how the relative exposure of shallow reefs and embayments affect dispersal and gene flow (Ackiss et al., 2018; Ravago-Gotanco and Kim, 2019; Torres et al., 2020). Further analysis should be done on balancing the representation of local retention and regional connectivity as these may address different management objectives (Krueck et al., 2017).
Many of the currently designated MPAs are found in moderate to high betweenness centrality, source strength, and local retention reefs. If these MPAs are well enforced and managed, they may partly account for regional connectivity benefits. Still, there is a need for MPAs located in reefs with more diverse connections. The presence of many MPAs in low-ranking reef nodes is explained by the primarily coastal distribution of MPAs resulting in the apparent mismatch between MPA distributions and the locations of the most important reefs for regional connectivity. This is especially relevant given that the MPAs are not evenly distributed among subnetworks and are concentrated in the central Philippines (Weeks et al., 2010). The subnetworks reveal the main barriers of larval dispersal and match the biogeographic regions identified for the Philippines (Aliño and Gomez, 1994; Nañola et al., 2011; Sutton et al., 2017). The strong interconnection within the subnetworks with shorter connection paths can be beneficial for systematically linking MPAs into fine-to-moderate scale governance networks (Horigue et al., 2015) which are likely to increase the size of protected area and improve the management of individual MPAs (Horigue et al., 2014). Additionally, spreading the potential benefits of MPAs also requires addressing the apparent geographic gap in distribution by expanding additional conservation efforts in underrepresented subnetworks.
Although connectivity is increasingly being considered in MPA design, there are of course other criteria that need to be considered in tandem with connectivity information (Balbar and Metaxas, 2019). Having a large area (>100 km2) and isolation are key physical features of effective MPAs (Edgar et al., 2014). These may be addressed by protecting offshore reefs of the Philippines that have high betweenness centrality in the coral reef network. Identifying reserves based on habitat extent and quality has been theorized to better fit fisheries objectives rather than connectivity (Cabral et al., 2016). Although this likely is the case for reef networks at the local scale, fisheries benefits may take decades to be noticeable (Abesamis and Russ, 2005; Hopf et al., 2016; McClanahan et al., 2016). Beyond the ecological characteristics, the allocation of funding, enforcement, and governance of MPAs determine the success of protection (Gill et al., 2017).
The effectiveness of an MPA is continuously threatened by marine pollution, sedimentation, thermal stress, coral bleaching, diseases, storms, destructive fishing, and overfishing (Arceo et al., 2001; Burke et al., 2012; Magdaong et al., 2014). Even a successful MPA which has seen recovery for three decades can be severely damaged by storms resulting in reduced fish densities (Abesamis et al., 2018). Furthermore, overfishing is the greatest threat in Philippine reefs (Burke et al., 2012) that a recent estimate quantified that reefs inside MPAs are greatly overfished, although not as bad as unprotected reefs (Muallil et al., 2019). In expanding the spatial extent of protection, the representation of different ecologically interconnected areas, replication of sites, and the consideration of less affected reefs would buffer the risks experienced in potential MPA networks (McLeod et al., 2009; Burke et al., 2012). Local threats can be addressed through integrated coastal management approaches (White et al., 2006). Active coral reef restoration tools like coral gardening and larval reseeding at the local level may also be beneficial (Abrina and Bennett, 2021). More importantly, the behavior of fishers should be considered in MPA establishment and MPA network simulations. A concurrent implementation of MPAs with fishing management strategies such as seasonal fishing closures were simulated to increase the effectiveness of reserves (Russo et al., 2019). Essentially, MPA networks are best deployed as part of a toolkit of management practices and broader frameworks that would respond to the variety of threats coral reefs face (McLeod et al., 2009).
In this study, we focused on the representation of connectivity to nominate potential areas for additional or expanded protection. Many of these potential areas for expansion have established MPAs, albeit with small coverage, and were also determined to be priority sites by other regional MPA assessment studies (Weeks et al., 2010; Beger et al., 2015; Horigue et al., 2015). This national-scale connectivity information can also help in the systematic planning of the timing of establishing MPAs (Kininmonth et al., 2019), and in using the level of connectivity between MPAs as an indicator of progress in marine protection (Roberts et al., 2018). Despite the potential benefits from MPAs as a management tool, it should be acknowledged that setting no-take reserves near coastal areas due to socioeconomic reasons (Crowder et al., 2000) may likely displace fisheries (Krueck et al., 2017) toward offshore areas which are regionally important based on many connectivity indices. We also stress that in addition to the empirical valuation and ranking of marine environments, connectivity and other biophysical criteria should fit into a systematic planning approach which takes into account local knowledge and stakeholder representation in establishing MPAs that would provide equitable benefits (Kockel et al., 2020).
The original connectivity data used in this study are openly available in Zenodo at https://doi.org/10.5281/zenodo.3236591. The subset connectivity data and MATLAB codes are available upon request from the corresponding author.
PRP conceptualization, data curation, formal analysis, visualization, and wrote the first draft. ATY conceptualization, formal analysis, project administration, and wrote sections of the manuscript. Both authors contributed to manuscript revision, read, and approved the submitted version.
PRP received an MSc scholarship through the Capturing Coral Reef and Related Ecosystem Services (CCRES) project (www.ccres.net), funded by the Global Environment Facility, the World Bank, and The University of Queensland. Additional funding was provided by the University of the Philippines, Office of the Vice Chancellor for Research & Development Outright Research Grant for the program “Enhancing coral reef management through tools assessing coral reef conditions and connections.” The University of the Philippines, The Marine Science Institute provided partial support for the publication fee through the project entitled “Upgrading capacity, infrastructure, and assets for marine scientific research in the Philippines.”
The authors declare that the research was conducted in the absence of any commercial or financial relationships that could be construed as a potential conflict of interest.
All claims expressed in this article are solely those of the authors and do not necessarily represent those of their affiliated organizations, or those of the publisher, the editors and the reviewers. Any product that may be evaluated in this article, or claim that may be made by its manufacturer, is not guaranteed or endorsed by the publisher.
We would like to thank Dr. Vera Horigue and Andrew Torres for constructive comments and suggestions during the early versions of this paper. We also thank the members of the Biological Oceanography and Modeling of Ecosystems (BiOME) Laboratory who assisted in running model simulations.
The Supplementary Material for this article can be found online at: https://www.frontiersin.org/articles/10.3389/fmars.2021.719691/full#supplementary-material
Abesamis, R. A., and Russ, G. R. (2005). Density-dependent spillover from a marine reserve: long-term evidence. Ecol. Appl. 15, 1798–1812. doi: 10.1890/05-0174
Abesamis, R. A., Langlois, T., Birt, M., Thillainath, E., Bucol, A. A., Arceo, H. O., et al. (2018). Benthic habitat and fish assemblage structure from shallow to mesophotic depths in a storm-impacted marine protected area. Coral Reefs 37, 81–97. doi: 10.1007/s00338-017-1635-0
Abesamis, R. A., Stockwell, B. L., Bernardo, L. P., Villanoy, C. L., and Russ, G. R. (2016). Predicting reef fish connectivity from biogeographic patterns and larval dispersal modelling to inform the development of marine reserve networks. Ecol. Indic. 66, 534–544. doi: 10.1016/j.ecolind.2016.02.032
Abrina, T. A. S., and Bennett, J. (2021). A benefit-cost comparison of varying scales and methods of coral reef restoration in the Philippines. Sci. Total Environ. 799:149325. doi: 10.1016/j.scitotenv.2021.149325
Ackiss, A. S., Bird, C. E., Akita, Y., Santos, M. D., Tachihara, K., and Carpenter, K. E. (2018). Genetic patterns in peripheral marine populations of the fusilier fish Caesio cuning within the Kuroshio Current. Ecol. Evol. 8, 11875–11886. doi: 10.1002/ece3.4644
Aliño, P. M., and Gomez, E. D. (1994). “Philippine coral reef conservation: its significance to the South China Sea,” in Proceedings of the Regional Conference of the Development and Conservation in the Asia-Pacific Region, eds K. Yamamoto, S. Ishijima, S. Sakihara, H. Taira, Z. Shimabukuro, F. Teruya, et al. (Honolulu, HI: East-West Center Association), 222–229.
Almany, G. R., Connolly, S. R., Heath, D. D., Hogan, J. D., Jones, G. P., McCook, L. J., et al. (2009). Connectivity, biodiversity conservation and the design of marine reserve networks for coral reefs. Coral Reefs 28, 339–351. doi: 10.1007/s00338-009-0484-x
Arceo, H. O., Quibilan, M. C., Aliño, P. M., Lim, G., and Licuanan, W. Y. (2001). Coral bleaching in Philippine reefs: coincident evidences with mesoscale thermal anomalies. Bull. Mar. Sci. 69, 579–593. doi: 10.1007/s00338-009-0502-z
Baird, A. H., Guest, J. R., Edwards, A. J., Bauman, A. G., Bouwmeester, J., Mera, H., et al. (2021). An Indo-Pacific coral spawning database. Sci. Data 8:35. doi: 10.1038/s41597-020-00793-8
Balbar, A. C., and Metaxas, A. (2019). The current application of ecological connectivity in the design of marine protected areas. Glob. Ecol. Conserv. 17:e00569. doi: 10.1016/j.gecco.2019.e00569
Becker, B. J., Levin, L. A., Fodrie, F. J., and McMillan, P. A. (2007). Complex larval connectivity patterns among marine invertebrate populations. Proc. Natl. Acad. Sci. U.S.A. 104, 3267–3272. doi: 10.1073/pnas.0611651104
Beger, M., McGowan, J., Treml, E. A., Green, A. L., White, A. T., Wolff, N. H., et al. (2015). Integrating regional conservation priorities for multiple objectives into national policy. Nat. Commun. 6, 1–8.
Berumen, M. L., Almany, G. R., Planes, S., Jones, G. P., Saenz-Agudelo, P., and Thorrold, S. R. (2012). Persistence of self-recruitment and patterns of larval connectivity in a marine protected area network. Ecol. Evol. 2, 444–452. doi: 10.1002/ece3.208
Betancur, R. R., Hines, A., Acero, P. A., Ortí, G., Wilbur, A. E., and Freshwater, D. W. (2011). Reconstructing the lionfish invasion: insights into Greater Caribbean biogeography: Reconstructing the lionfish invasion. J. Biogeogr. 38, 1281–1293. doi: 10.1111/j.1365-2699.2011.02496.x
Botsford, L. W., White, J. W., Coffroth, M.-A., Paris, C. B., Planes, S., Shearer, T. L., et al. (2009). Connectivity and resilience of coral reef metapopulations in marine protected areas: matching empirical efforts to predictive needs. Coral reefs 28, 327–337. doi: 10.1007/s00338-009-0466-z
Briggs, J. C. (2005). Coral reefs: conserving the evolutionary sources. Biol. Conserv. 126, 297–305. doi: 10.1016/j.biocon.2005.06.018
Burke, L., Reytar, K., Spalding, M., and Perry, A. (2012). Reefs At Risk Revisited In The Coral Triangle. Washington, DC: World Resources Institute.
Cabral, R. B., Aliño, P. M., Balingit, A. C. M., Alis, C. M., Arceo, H. O., Nañola, C. L. Jr., et al. (2014). The Philippine marine protected area (MPA) database. Philipp. Sci. Lett. 7, 300–308.
Cabral, R. B., Gaines, S. D., Lim, M. T., Atrigenio, M. P., Mamauag, S. S., Pedemonte, G. C., et al. (2016). Siting marine protected areas based on habitat quality and extent provides the greatest benefit to spatially structured metapopulations. Ecosphere 7:e01533.
Cabral, R. B., Mamauag, S. S., and Aliño, P. M. (2015). Designing a marine protected areas network in a data-limited situation. Mar. Policy 59, 64–76. doi: 10.1016/j.marpol.2015.04.013
Carpenter, K. E., and Springer, V. G. (2005). The center of the center of marine shore fish biodiversity: the Philippine Islands. Environ. Biol. Fish. 72, 467–480. doi: 10.1007/s10641-004-3154-4
CBD [Convention on Biological Diversity] (2010). Strategic Plan for Biodiversity 2011–2020–COP 10, Decision X/2. Montreal: Convention on Biological Diversity.
Chassignet, E. P., Hurlburt, H. E., Smedstad, O. M., Halliwell, G. R., Hogan, P. J., Wallcraft, A. J., et al. (2007). The HYCOM (hybrid coordinate ocean model) data assimilative system. J. Mar. Syst. 65, 60–83.
Cowen, R. K., and Sponaugle, S. (2009). Larval dispersal and marine population connectivity. Annu. Rev. Mar. Sci. 1, 443–466. doi: 10.1146/annurev.marine.010908.163757
Crowder, L. B., Lyman, S. J., Figueira, W. F., and Priddy, J. (2000). Source-sink population dynamics and the problem of siting marine reserves. Bull. Mar. Sci. 66, 799–820.
CTI-CFF [Coral Triangle Initiative on Coral reefs, Fisheries and Food Security] (2009). National Plan Of Action For The Coral Triangle Initiative On Coral Reefs, Fisheries And Food Security. Quezon City: Coral Triangle Initiative on Coral reefs, Fisheries and Food Security.
Deauna, J. D. L., Yatco, K. M. B., Villanoy, C. L., and Juinio-Meñez, M. A. (2021). Identification of priority sites to support management of commercially important sea cucumber species by applying infomap and habitat filters to larval dispersal data. Front. Mar. Sci. 7:571712. doi: 10.3389/fmars.2020.571712
DeVantier, L., and Turak, E. (2017). Species richness and relative abundance of reef-building corals in the indo-west pacific. Diversity 9:25. doi: 10.3390/d9030025
Dorman, J. G., Castruccio, F. S., Curchitser, E. N., Kleypas, J. A., and Powell, T. M. (2016). Modeled connectivity of Acropora millepora populations from reefs of the Spratly Islands and the greater South China Sea. Coral Reefs 35, 169–179. doi: 10.1007/s00338-015-1354-3
Edgar, G. J., Stuart-Smith, R. D., Willis, T. J., Kininmonth, S., Baker, S. C., Banks, S., et al. (2014). Global conservation outcomes depend on marine protected areas with five key features. Nature 506, 216–220. doi: 10.1038/nature13022
Ferrario, F., Beck, M. W., Storlazzi, C. D., Micheli, F., Shepard, C. C., and Airoldi, L. (2014). The effectiveness of coral reefs for coastal hazard risk reduction and adaptation. Nat. Commun. 5:3794.
Fisher, R., Leis, J. M., Clark, D. L., and Wilson, S. K. (2005). Critical swimming speeds of late-stage coral reef fish larvae: variation within species, among species and between locations. Mar. Biol. 147, 1201–1212. doi: 10.1007/s00227-005-0001-x
Flanders Marine Institute (2019). Maritime Boundaries Geodatabase, Version 11. Available online at: https://doi.org/10.14284/382 [Accessed May 9, 2021].
Gaines, S. D., White, C., Carr, M. H., and Palumbi, S. R. (2010). Designing marine reserve networks for both conservation and fisheries management. Proc. Natl. Acad. Sci. U.S.A. 107, 18286–18293. doi: 10.1073/pnas.0906473107
Gaither, M. R., and Rocha, L. A. (2013). Origins of species richness in the Indo-Malay-Philippine biodiversity hotspot: evidence for the centre of overlap hypothesis. J. Biogeogr. 40, 1638–1648. doi: 10.1111/jbi.12126
Gill, D. A., Mascia, M. B., Ahmadia, G. N., Glew, L., Lester, S. E., Barnes, M., et al. (2017). Capacity shortfalls hinder the performance of marine protected areas globally. Nature 543, 665–669. doi: 10.1038/nature21708
Gordon, A. L., Flament, P., Villanoy, C., and Centurioni, L. (2014). The nascent kuroshio of lamon bay. J. Geophys. Res. Oceans 119, 4251–4263. doi: 10.1002/2014jc009882
Green, A. L., Fernandes, L., Almany, G., Abesamis, R., McLeod, E., Aliño, P. M., et al. (2014). Designing marine reserves for fisheries management, biodiversity conservation, and climate change adaptation. Coast. Manag. 42, 143–159. doi: 10.1080/08920753.2014.877763
Green, A. L., Maypa, A. P., Almany, G. R., Rhodes, K. L., Weeks, R., Abesamis, R. A., et al. (2015). Larval dispersal and movement patterns of coral reef fishes, and implications for marine reserve network design. Biol. Rev. 90, 1215–1247. doi: 10.1111/brv.12155
Grorud-Colvert, K., Claudet, J., Tissot, B. N., Caselle, J. E., Carr, M. H., Day, J. C., et al. (2014). Marine protected area networks: assessing whether the whole is greater than the sum of its parts. PLoS One 9:e102298. doi: 10.1371/journal.pone.0102298
Gumanao, G. S., Saceda-Cardoza, M. M., Mueller, B., and Bos, A. R. (2016). Length–weight and length–length relationships of 139 Indo-Pacific fish species (Teleostei) from the Davao Gulf, Philippines. J. Appl. Ichthyol. 32, 377–385. doi: 10.1111/jai.12993
Harrison, H. B., Williamson, D. H., Evans, R. D., Almany, G. R., Thorrold, S. R., Russ, G. R., et al. (2012). Larval export from marine reserves and the recruitment benefit for fish and fisheries. Curr. Biol. 22, 1023–1028. doi: 10.1016/j.cub.2012.04.008
Hock, K., and Mumby, P. J. (2015). Quantifying the reliability of dispersal paths in connectivity networks. J. R. Soc. Interface 12:20150013. doi: 10.1098/rsif.2015.0013
Hock, K., Wolff, N. H., Ortiz, J. C., Condie, S. A., Anthony, K. R. N., Blackwell, P. G., et al. (2017). Connectivity and systemic resilience of the Great Barrier Reef. PLoS Biol. 15:e2003355. doi: 10.1371/journal.pbio.2003355
Holstein, D. M., Paris, C. B., and Mumby, P. J. (2014). Consistency and inconsistency in multispecies population network dynamics of coral reef ecosystems. Mar. Ecol. Prog. Ser. 499, 1–18. doi: 10.3354/meps10647
Holstein, D. M., Paris, C. B., Vaz, A. C., and Smith, T. B. (2016). Modeling vertical coral connectivity and mesophotic refugia. Coral Reefs 35, 23–37. doi: 10.1007/s00338-015-1339-2
Hopf, J. K., Jones, G. P., Williamson, D. H., and Connolly, S. R. (2016). Fishery consequences of marine reserves: short-term pain for longer-term gain. Ecol. Appl. 26, 818–829. doi: 10.1890/15-0348
Horigue, V., Aliño, P. M., and Pressey, R. L. (2014). Evaluating management performance of marine protected area networks in the Philippines. Ocean Coast. Manag. 95, 11–25. doi: 10.1016/j.ocecoaman.2014.03.023
Horigue, V., Aliño, P. M., White, A. T., and Pressey, R. L. (2012). Marine protected area networks in the Philippines: trends and challenges for establishment and governance. Ocean Coast. Manag. 64, 15–26. doi: 10.1016/j.ocecoaman.2012.04.012
Horigue, V., Pressey, R. L., Mills, M., Brotánková, J., Cabral, R., and Andréfouët, S. (2015). Benefits and challenges of scaling up expansion of marine protected area networks in the Verde Island Passage, Central Philippines. PLoS One 10:e0135789. doi: 10.1371/journal.pone.0135789
Jones, G. P., Almany, G. R., Russ, G. R., Sale, P. F., Steneck, R. S., Van Oppen, M. J. H., et al. (2009). Larval retention and connectivity among populations of corals and reef fishes: history, advances and challenges. Coral Reefs 28, 307–325. doi: 10.1007/s00338-009-0469-9
Kininmonth, S., Beger, M., Bode, M., Peterson, E., Adams, V. M., Dorfman, D., et al. (2011). Dispersal connectivity and reserve selection for marine conservation. Ecol. Model. 222, 1272–1282. doi: 10.1016/j.ecolmodel.2011.01.012
Kininmonth, S., Weeks, R., Abesamis, R. A., Bernardo, L. P. C., Beger, M., Treml, E. A., et al. (2019). Strategies in scheduling marine protected area establishment in a network system. Ecol. Appl. 29:e01820. doi: 10.1002/eap.1820
Kockel, A., Ban, N. C., Costa, M., and Dearden, P. (2020). Evaluating approaches for scaling-up community-based marine-protected areas into socially equitable and ecologically representative networks. Conserv. Biol. 34, 137–147. doi: 10.1111/cobi.13368
Kool, J. T., and Nichol, S. L. (2015). Four-dimensional connectivity modelling with application to Australia’s north and northwest marine environments. Environ. Model. Softw. 65, 67–78. doi: 10.1016/j.envsoft.2014.11.022
Kough, A. S., and Paris, C. B. (2015). The influence of spawning periodicity on population connectivity. Coral Reefs 34, 753–757. doi: 10.1007/s00338-015-1311-1
Krueck, N. C., Ahmadia, G. N., Green, A., Jones, G. P., Possingham, H. P., Riginos, C., et al. (2017). Incorporating larval dispersal into MPA design for both conservation and fisheries. Ecol. Appl. 27, 925–941. doi: 10.1002/eap.1495
Licuanan, W. Y., Robles, R., and Reyes, M. (2019). Status and recent trends in coral reefs of the Philippines. Mar. Pollut. Bull. 142, 544–550. doi: 10.1016/j.marpolbul.2019.04.013
Luiz, O. J., Allen, A. P., Robertson, D. R., Floeter, S. R., Kulbicki, M., Vigliola, L., et al. (2013). Adult and larval traits as determinants of geographic range size among tropical reef fishes. Proc. Natl. Acad. Sci. U.S.A. 110, 16498–16502. doi: 10.1073/pnas.1304074110
Macpherson, E., and Raventós, N. (2006). Relationship between pelagic larval duration and geographic distribution of Mediterranean littoral fishes. Mar. Ecol. Prog. Ser. 327, 257–265. doi: 10.3354/meps327257
Madin, J. S., Anderson, K. D., Andreasen, M. H., Bridge, T. C., Cairns, S. D., Connolly, S. R., et al. (2016). The coral trait database, a curated database of trait information for coral species from the global oceans. Sci. Data 3, 1–22.
Magdaong, E. T., Yamano, H., and Fujii, M. (2014). “Development of a large-scale, long-term coral cover and disturbance database in the Philippines,” in Integrative Observations and Assessments, eds S. Nakano, T. Yahara, and T. Nakashizuka (Cham: Springer), 83–109. doi: 10.1007/978-4-431-54783-9_5
McClanahan, T. R., Maina, J. M., Graham, N. A., and Jones, K. R. (2016). Modeling reef fish biomass, recovery potential, and management priorities in the Western Indian Ocean. PLoS One 11:e0154585. doi: 10.1371/journal.pone.0154585
McCook, L. J., Almany, G. R., Berumen, M. L., Day, J. C., Green, A. L., Jones, G. P., et al. (2009). Management under uncertainty: guide-lines for incorporating connectivity into the protection of coral reefs. Coral Reefs 28, 353–366. doi: 10.1007/s00338-008-0463-7
McLeod, E., Salm, R., Green, A., and Almany, J. (2009). Designing marine protected area networks to address the impacts of climate change. Front. Ecol. Environ. 7:362–370. doi: 10.1890/070211
McWilliam, M., Hoogenboom, M. O., Baird, A. H., Kuo, C.-Y., Madin, J. S., and Hughes, T. P. (2018). Biogeographical disparity in the functional diversity and redundancy of corals. Proc. Natl. Acad. Sci. U.S.A. 115, 3084–3089. doi: 10.1073/pnas.1716643115
Melbourne-Thomas, J., Johnson, C. R., Fung, T., Seymour, R. M., Chérubin, L. M., Arias-González, J. E., et al. (2011). Regional-scale scenario modeling for coral reefs: a decision support tool to inform management of a complex system. Ecol. Appl. 21, 1380–1398. doi: 10.1890/09-1564.1
MPAtlas (2021). Global Marine Protection. Available online at: https://mpatlas.org/ [Accessed May 9, 2021].
Muallil, R. N., Deocadez, M. R., Martinez, R. J. S., Campos, W. L., Mamauag, S. S., Nañola, C. L. Jr., et al. (2019). Effectiveness of small locally-managed marine protected areas for coral reef fisheries management in the Philippines. Ocean Coast. Manag. 179:104831. doi: 10.1016/j.ocecoaman.2019.104831
Mucha, P. J., Richardson, T., Macon, K., Porter, M. A., and Onnela, J.-P. (2010). Community structure in time-dependent, multiscale, and multiplex networks. Science 328, 876–878. doi: 10.1126/science.1184819
Munguia-Vega, A., Jackson, A., Marinone, S. G., Erisman, B., Moreno-Baez, M., Girón-Nava, A., et al. (2014). Asymmetric connectivity of spawning aggregations of a commercially important marine fish using a multidisciplinary approach. PeerJ 2:e511. doi: 10.7717/peerj.511
Nañola, C. L., Aliño, P. M., and Carpenter, K. E. (2011). Exploitation-related reef fish species richness depletion in the epicenter of marine biodiversity. Environ. Biol. Fish 90, 405–420. doi: 10.1007/s10641-010-9750-6
O’Leary, B. C., Winther-Janson, M., Bainbridge, J. M., Aitken, J., Hawkins, J. P., and Roberts, C. M. (2016). Effective coverage targets for ocean protection. Conserv. Lett. 9, 398–404. doi: 10.1111/conl.12247
O’Leary, J. K., Micheli, F., Airoldi, L., Boch, C., De Leo, G., Elahi, R., et al. (2017). The resilience of marine ecosystems to climatic disturbances. BioScience 67, 208–220. doi: 10.1093/biosci/biw161
Ong, P. S., Afuang, L. E., and Rosell-Ambal, R. G. (2002). Philippine Biodiversity Conservation Priorities: A Second Iteration of the National Biodiversity and Action Plan. Quezon City: DENR–PAWB, CI Philippines, UP CIDS, and FPE.
Parsons, E. C. M., Favaro, B., Aguirre, A. A., Bauer, A. L., Blight, L. K., Cigliano, J. A., et al. (2014). Seventy-one important questions for the conservation of marine biodiversity. Conserv. Biol. 28, 1206–1214. doi: 10.1111/cobi.12303
Pata, P. R., and Yñiguez, A. T. (2019). Larval connectivity patterns of the North Indo-West Pacific coral reefs. PLoS One 14:e0219913. doi: 10.1371/journal.pone.0219913
Peck, M. A., and Hufnagl, M. (2012). Can IBMs tell us why most larvae die in the sea? Model sensitivities and scenarios reveal research needs. J. Mar. Syst. 93, 77–93. doi: 10.1016/j.jmarsys.2011.08.005
Ravago-Gotanco, R., and Kim, K. M. (2019). Regional genetic structure of sandfish Holothuria (Metriatyla) scabra populations across the Philippine archipelago. Fish. Res. 209, 143–155. doi: 10.1016/j.fishres.2018.09.021
Roberts, K. E., Valkan, R. S., and Cook, C. N. (2018). Measuring progress in marine protection: a new set of metrics to evaluate the strength of marine protected area networks. Biol. Conserv. 219, 20–27. doi: 10.1016/j.biocon.2018.01.004
Russo, T., D’Andrea, L., Franceschini, S., Accadia, P., Cucco, A., Garofalo, G., et al. (2019). Simulating the effects of alternative management measures of trawl fisheries in the central Mediterranean Sea: application of a multi-species bio-economic modeling approach. Front. Mar. Sci. 6:542.
Spalding, M., Spalding, M. D., Ravilious, C., and Green, E. P. (2001). World Atlas Of Coral Reefs. Berkeley, CA: Univ of California Press.
Sutton, T. T., Clark, M. R., Dunn, D. C., Halpin, P. N., Rogers, A. D., Guinotte, J., et al. (2017). A global biogeographic classification of the mesopelagic zone. Deep Sea Res. Part I 126, 85–102. doi: 10.1016/j.dsr.2017.05.006
Thomas, C. J., Lambrechts, J., Wolanski, E., Traag, V. A., Blondel, V. D., Deleersnijder, E., et al. (2014). Numerical modelling and graph theory tools to study ecological connectivity in the Great Barrier Reef. Ecol. Model. 272, 160–174. doi: 10.1016/j.ecolmodel.2013.10.002
TNC-WWF-CI-WCS [The Nature Conservancy, World Wildlife Fund, Conservation International and Wildlife Conservation Society] (2008). Marine Protected Area Networks In The Coral Triangle: Development And Lessons. Cebu City: TNC, WWF, CI, WCS and the United States Agency for International Development.
Torres, A. F., Forsman, Z. H., and Ravago-Gotanco, R. (2020). Shifts in coral clonality along a gradient of disturbance: insights on reproduction and dispersal of Pocillopora acuta. Mar. Biol. 167:161. doi: 10.1007/s00227-020-03777-9
Traag, V. A., Krings, G., and Van Dooren, P. (2013). Significant scales in community structure. Sci. Rep. 3:2930. doi: 10.1038/srep02930
Traag, V., Waltman, L., and van Eck, N. J. (2018). From Louvain to Leiden: Guaranteeing Well-Connected Communities. arXiv:1810.08473 [Physics]. Available online at: http://arxiv.org/abs/1810.08473 [Accessed February 28, 2019].
Treml, E. A., Halpin, P. N., Urban, D. L., and Pratson, L. F. (2008). Modeling population connectivity by ocean currents, a graph-theoretic approach for marine conservation. Landsc. Ecol. 23, 19–36. doi: 10.1007/s10980-007-9138-y
Weeks, R., Russ, G. R., Alcala, A. C., and White, A. T. (2010). Effectiveness of marine protected areas in the Philippines for biodiversity conservation. Conserv. Biol. 24, 531–540. doi: 10.1111/j.1523-1739.2009.01340.x
Werner, F. E., Cowen, R. K., and Paris, C. B. (2007). Coupled biological and physical models: present capabilities and necessary developments for future studies of population connectivity. Oceanography 20, 54–69. doi: 10.5670/oceanog.2007.29
White, A. T., Aliño, P. M., and Meneses, A. B. T. (2006). Creating and Managing Marine Protected Areas In The Philippines. Cebu City: Fisheries Improved for Sustainable Harvest Project, Coastal Conservation and Education Foundation, Inc. and University of the Philippines Marine Science Institute.
Keywords: connectivity, MPA network, coral reefs, conservation, graph theory
Citation: Pata PR and Yñiguez AT (2021) Spatial Planning Insights for Philippine Coral Reef Conservation Using Larval Connectivity Networks. Front. Mar. Sci. 8:719691. doi: 10.3389/fmars.2021.719691
Received: 02 June 2021; Accepted: 08 September 2021;
Published: 06 October 2021.
Edited by:
Yehuda Benayahu, Tel Aviv University, IsraelReviewed by:
Jorge MS. Gonçalves, University of Algarve, PortugalCopyright © 2021 Pata and Yñiguez. This is an open-access article distributed under the terms of the Creative Commons Attribution License (CC BY). The use, distribution or reproduction in other forums is permitted, provided the original author(s) and the copyright owner(s) are credited and that the original publication in this journal is cited, in accordance with accepted academic practice. No use, distribution or reproduction is permitted which does not comply with these terms.
*Correspondence: Patrick R. Pata, cC5wYXRhQG9jZWFucy51YmMuY2E=
Disclaimer: All claims expressed in this article are solely those of the authors and do not necessarily represent those of their affiliated organizations, or those of the publisher, the editors and the reviewers. Any product that may be evaluated in this article or claim that may be made by its manufacturer is not guaranteed or endorsed by the publisher.
Research integrity at Frontiers
Learn more about the work of our research integrity team to safeguard the quality of each article we publish.