 Theresa Barthelmeß
 Florian Schütte
 Anja Engel
- GEOMAR Helmholtz Centre for Ocean Research Kiel, Kiel, Germany
Major uncertainties in air-sea gas flux parameterizations may arise from a yet unpredictable sea surface microlayer (SML). Its influence on gas exchange is twofold as organic matter, in particular surfactants, on one side and organisms enriched in the SML on the other can alter air-sea gas fluxes. However, spatial heterogeneity of the SML and its potential consequences for gas exchange are not well understood. This study examines the SML’s surfactant pool and the dynamics of microbial enrichment across the sharp hydrological front of a newly upwelled filament off Mauritania. The front was marked by a distinct decrease in temperature and salinity compared to the stratified water column outside the filament. Distinct chemical and microbial SML properties were observed and associated with the filament. Overall, organic matter in the SML was significantly higher concentrated inside the filament and in equivalence to the underlying water. Degradation indices derived from total amino acids (TAA) composition indicated production of fresh organic matter inside and increased degradation outside the filament. Moreover, a shift in the microbial community was observed, for instance Synechococcus spp. prevailed outside the filament. Autotrophic and heterotrophic microorganisms preferably colonized the SML outside the filament. Organic matter enrichment in the SML depended largely on the chemical nature of biomolecules. Total organic carbon (TOC), total nitrogen and total combined carbohydrates were only slightly enriched while glucose, TAA and surfactants were considerably enriched in the SML. Surfactant concentration was positively correlated to TAA, in particular to arginine and glutamic acid, indicating that fresh organic matter components enhanced surface activity. Further, TOC and surfactant concentration correlated significantly (r2 = 0.47, p-value < 0.001). The lower limit of this linear correlation hits approximately the lowest TOC concentration expected within the global surface ocean. This suggests that surfactants are primarily derived from autochthonous production and most refractory components are excluded. Using a previously established relationship between surfactants and CO2 gas exchange (Pereira et al., 2018), we estimated that surfactants suppressed gas exchange by 12% inside the filament. This could be of relevance for freshly upwelled filaments, which are often supersaturated in greenhouse gases.
Introduction
Accurate estimations of carbon dioxide (CO2) fluxes across the ocean-atmosphere interface are crucial to better constrain the ocean’s role in carbon cycling. While global CO2 flux estimates express high levels of confidence, seasonal or regional scaled estimations are afflicted by a larger degree of uncertainty (Woolf et al., 2019). This is related to the parametrization of the gas transfer velocity k as an empirical function of wind speed. It is well recognized that factors apart from wind speed control air-sea gas exchange. In this respect, the sea surface microlayer (SML), i.e., the uppermost 1000 μm of the ocean, has received much attention during the past decades (e.g., Goldman et al., 1988; Frew et al., 1990; Upstill-Goddard et al., 2003; Wurl et al., 2011; Cunliffe et al., 2013; Engel et al., 2017; Sabbaghzadeh et al., 2017).
The SML may interfere with air-sea gas exchange in two ways. Firstly, organic matter in the SML can hamper gas exchange. Within the pool of organic matter, some molecules are amphiphilic and accumulate at the air-sea interface. These molecules are referred to as surfactants. Surfactants can block molecular diffusion by forming a static barrier or dampen surface roughness, i.e., reducing the available area for gas exchange (Frew, 1997; Jenkinson et al., 2018). Several biochemicals such as lipids, amino acids and carbohydrates may contribute to the oceanic surfactant pool (Gašparović and Ćosović, 2003; Cunliffe et al., 2013). Surface activity is the result of dynamic and competitive adsorption: An excess of highly surface-active agents will prevent less active surfactants to adsorb, while a deficiency will favor the contribution of the latter (Pogorzelski et al., 2006; Frka et al., 2012). However, comprehensive research is necessary to understand the chemical specification and variability of naturally occurring surfactants (Pereira et al., 2018). In the open ocean, phytoplankton-derived organic matter is the main source of marine surfactants (Ẑutić et al., 1981; Frew et al., 1990; Croot et al., 2007). Therefore, surfactant concentrations are expected to be higher in regions where primary production is elevated (Wurl et al., 2011) although it was shown recently that chlorophyll a (Chl a), as a proxy for primary production, cannot predict surfactants occurrence adequately (Sabbaghzadeh et al., 2017). Moreover, certain strains of heterotrophic bacteria produce surfactants (Satpute et al., 2010) and were associated with a surfactant-covered ocean surface (Kurata et al., 2016). Surfactants in seawater have also been linked to anthropogenic and terrestrial sources including river run-off (Cuscov and Muller, 2015; Wurl et al., 2017; Shaharom et al., 2018). Secondly, organisms inhabiting the SML may directly influence air-sea gas fluxes by altering trace gas concentrations. The microbial inhabitants of the SML are referred to as neuston. Neuston production and respiration in the SML can either accelerate or reduce CO2 uptake (Calleja et al., 2005, 2013; Obernosterer et al., 2008; Reinthaler et al., 2008). The neuston community may further influence the exchange of other trace gases such as methane and dimethyl sulfide (Upstill-Goddard et al., 2003; Sun et al., 2020). Nevertheless, the effect of the neuston community on oxygen profiles and air-sea exchange rates has been found negligible (Rahlff et al., 2019). In general, autotrophic and heterotrophic neuston colonization was found to differ substantially among studies and patterns remain enigmatic (Agogué et al., 2005; Joux et al., 2006; Cunliffe et al., 2011; Engel and Galgani, 2016; Rahlff et al., 2017; Zäncker et al., 2017).
Only limited studies are available investigating SML organic matter and neuston variability across diverse oceanic regimes (Reinthaler et al., 2008; Zäncker et al., 2017). When considering global scales, the influence of a heterogeneous SML on CO2 gas exchange is likely averaged over an increasing number of air-sea gas transfer parameterizations. However, it is highly unlikely that a single parameterization based on wind speed can be sufficient to estimate gas exchange on smaller scales, i.e., for different oceanic regions (Broecker et al., 1978; Mustaffa et al., 2020; Yang et al., 2021).
Sites of particularly strong CO2 air-sea flux densities with relevance to the global oceanic carbon budget are Eastern Boundary Upwelling Systems (EBUS) (Gruber, 2015; Köhn et al., 2017; Brady et al., 2019). Here, upwelling of deep water drives outgassing of CO2 and other potent greenhouse gases such as nitrous oxide and methane (Kock et al., 2008, 2012; Takahashi et al., 2009; Köhn et al., 2017) but also supports high primary productivity in the sunlit surface ocean and the subsequent uptake of atmospheric CO2. One of the four major EBUS is located alongshore North West Africa in the Tropical North Atlantic Ocean and its southern extension is recognized as the Mauritanian upwelling region. Upwelling is induced by Ekman transport: Seasonally fluctuating southward Trade Winds force surface waters to be transported offshore, while bringing deeper water masses upwards to counterbalance this effect (Speth et al., 1978; Stramma et al., 2005). The upwelled waters induce dynamic sub-mesoscale and mesoscale features such as filaments and eddies, which are driven by wind forcing or instabilities of the boundary currents, and thereby expand the narrow upwelling front along the coast offshore (Gruber et al., 2011; Schütte et al., 2016; Hosegood et al., 2017). The upwelled, colder water is characterized by high nutrient loads and maintains one of the most productive marine ecosystems in the world (Pauly and Christensen, 1995; Carr and Kearns, 2003). It originates in the South Atlantic Central Waters (SACW), while the ambient stratified water masses are a mixture of North Atlantic Central Water (NACW) and the tropical surface waters. Although nutrients are quickly used up during transport offshore, multiple mixing features in EBUS are recognized to fertilize the adjacent waters (Nagai et al., 2015). The complex hydrology in the Mauritanian EBUS controls plankton distribution as well as primary and secondary production at sub-mesoscales (Hernández-Hernández et al., 2020). Since organic matter composition and the microbial neuston colonization of the SML are hypothesized to be tightly linked to the underlying water (ULW) (Cunliffe et al., 2013), spatial variability in the surface ocean productivity regime is expected to leave an imprint on the biogenic composition of the SML and thus potentially on air-sea gas exchange processes.
This study addresses the effect of spatial variability in water column biochemistry and ecology on SML characteristics. It profits from the unique conditions of an EBUS in which water masses of different hydrological origin are separated on the sub-mesoscale. The variability of biogenic components in the SML and ULW was investigated across the front of a recently upwelled filament. Our study combines hydrographic remote and discrete observations with compound-specific biochemical and microbial abundance measurements. In combination with surfactant measurements, it also aims at providing a link between SML properties and their potential impact on ocean-atmosphere gas exchange.
Materials and Methods
Survey and Sampling
All data were acquired on board the RV Poseidon in the upwelling region off Mauritania in January and February 2018 (Figure 1A). The progressing filament was centered at a mean location of 16.833°N and 17.000°W. Meteorological measurements were obtained from the ship’s weather station. The anemometer was mounted at a height of 27 m. Mean wind speed at a height of 10 m was calculated after Large and Pond (1981) and is indicated by ‘U10.’ Underway measurements including water temperature and salinity were logged from the thermosalinograph (SeaBird 21) at the ship’s inlet (at 2 m depth). The temperature sensor and the conductivity sensors were calibrated against the 2 dbar values from the 45 Conductivity-Temperature-Depth (CTD) profiles taken during the cruise and resulted in a conservative accuracy of about twice the GO-SHIP standard, which is ±0.002°C for temperature and ±0.004 on the Practical Salinity scale. Incident solar radiation was measured using a spherical underwater quantum sensor (model LI-193) also applicable to measure the range of photo-active solar radiation (PAR) in air. The maximum deviation of the measurements is 1% as indicated by the manufacturers. Analog solar radiation measurements were logged before and after the sampling period from an approximate height of 10 m above sea level. All atmospheric and oceanic measurements were averaged over SML sampling time.
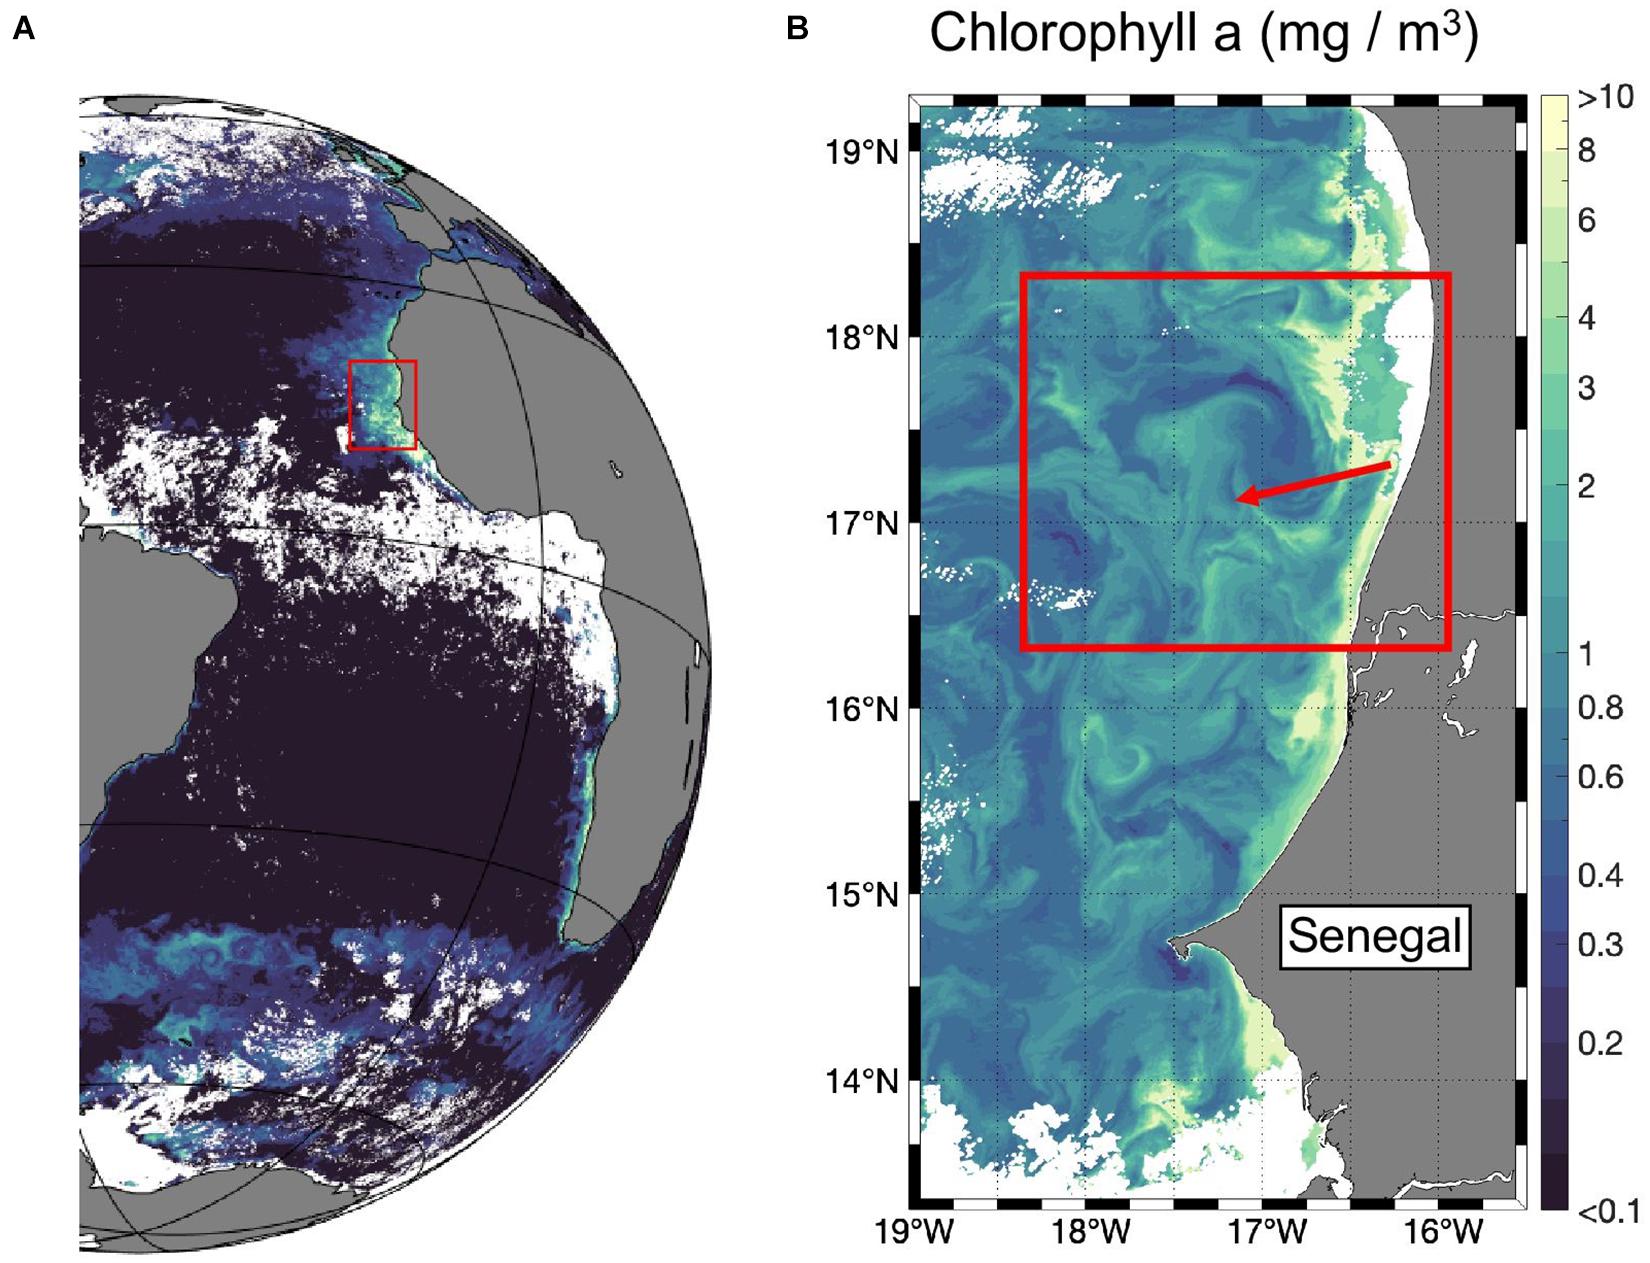
Figure 1. Surface Chl a measured from satellite (A) in February 2018 (monthly mean) and (B) on the 2nd of February 2018. The red box marks the working area including the upwelling filament.
The Filaments Survey
Via satellite imaging of sea surface temperature (SST), Chl a and sea surface altimetry, a filament of newly upwelled water was identified and marked by a drifter (deployment location: 16.768°W, 16.755°N, deployment date: 27.01.2018). The adaptive sampling strategy guided by real-time satellite images allowed us to study the small-scale upwelling filament (Figure 1B), which is naturally challenging due to the inherent intermittency of multi-scale physical and biogeochemical processes on short timescales in upwelling regions. The used along-the-track SST and Chl a data exhibited a spatial resolution of 1 km and were measured from the Moderate Resolution Imaging Spectroradiometer (MODIS-Aqua). This data was produced by the NASA Ocean Biology Processing Group and is freely available from the NASA website1 (date of access: Chl a: 10.2020; SST: 03.2020; Figures 2A,B). During the research campaign, an intense front (most clearly visible in sea surface temperature) characterized the filament (Figure 2B) and allowed us to distinguish 12 stations inside and 7 outside the filament (Figure 2C). To investigate the filament front in more detail, a hydrographic section (with 31 vertical profiles) was conducted with an MSS90-D Microstructure profiler (Sea and Sun Technology) (Figure 2D and Supplementary Figure S2). The water temperature data were calibrated against the CTD data acquired during the cruise resulting in a conservative accuracy of less than ±0.01°C.
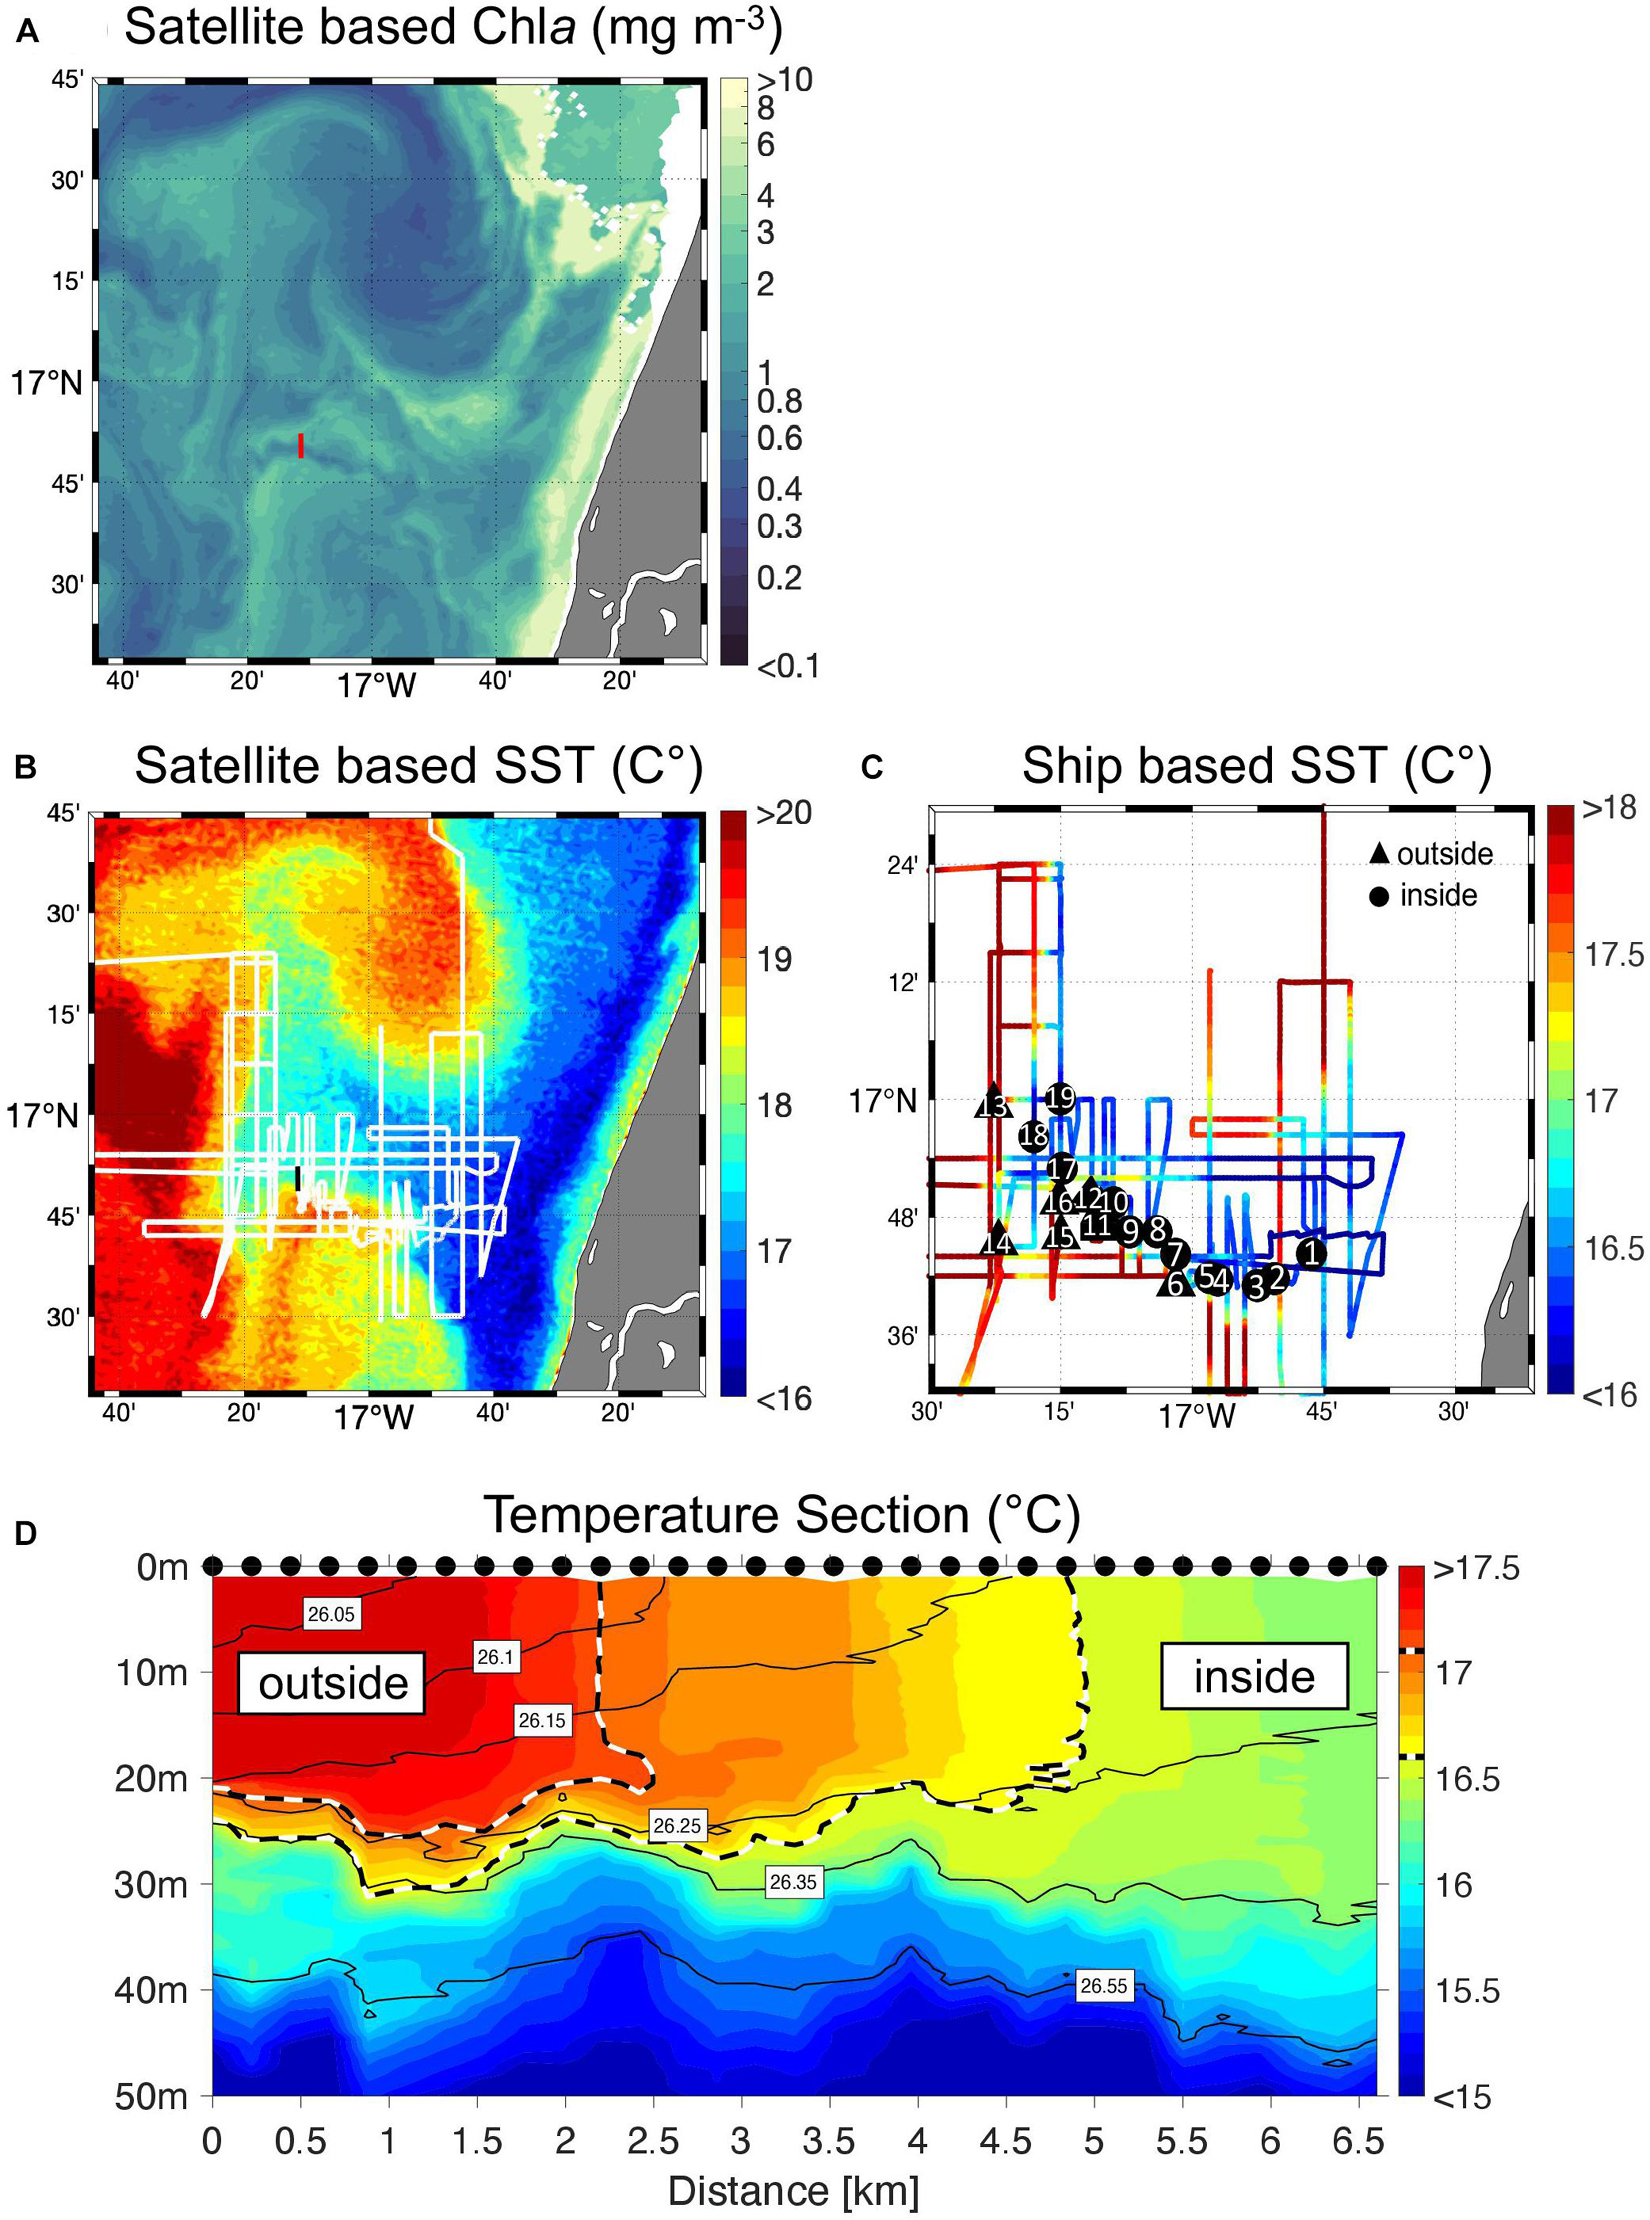
Figure 2. Filament survey. Satellite image (25 January 2018) showing (A) Chl a concentration of the filament as provided by NASA and (B) sea surface temperature of the identified filament. The white line indicates the cruise track of RV Poseidon during sampling in January/February 2018. The red and black lines indicate the position of the vertical temperature section shown in (D). (C) Cruise track depicted in surface water temperature as measured from the ship at 2 m depth. Sampling stations along the filaments edge are marked either as black circles inside or as triangles outside the filament. Note that (C) is different in scaling than (A,B). (D) The temperature cross-section against depth, as performed on 2 February 2018, reveals a clear separation between cold, upwelling water masses inside (≤16.5°C) and warmer, stratified waters (≥17.1°C) outside the filament (the boundaries are marked by the dashed black/white lines). The grey lines indicate potential density layers. Black dots mark the actual position where the microstructure measurements were conducted.
Surface Microlayer Sampling
Sampling was conducted twice per day, in the morning and the lateafternoon. Detailed information regarding station characteristics isprovided in Table 1. SML sampling wasconducted from the upwind side of the RV Poseidon using ascreen-sampler (Garrett-Screen, stainless steel, mesh size 1.2 mm) following applied practice (Garrett, 1965; Salter et al., 2011; Laß et al., 2013; Sabbaghzadeh et al., 2017; Drozdowska et al., 2018; Pereira et al., 2018). The Garrett-Screen takes advantage of the naturally high surface tension of water as it retains the SML samples between the meshes. Despite yielding a larger apparent, i.e., sampling thickness of the SML, the Garrett-Screen has been often used and recommended for field sampling. It allows sampling the SML under higher wind conditions and at moderate sea states in a reasonable time (Falkowska, 1999). These advantages are often not met by other sampling devices. While the change in physicochemical properties that can be determined under laboratory conditions indicates that the true SML is much thinner (Zhang et al., 1998, 2003), it is impossible to resolve such a thin layer under open ocean conditions with the Garrett Screen. The sampling procedure during this study followed the instructions given by Cunliffe and Wurl (2014, p. 19–31). The screen was attached to a three-point stainless steel chain and extended by a rope to reach the sea surface. Before sampling, the screen was conditioned by several dippings in seawater. Sampling bottles were rinsed with the sample before collection. Samples were collected in MilliQ washed brown borosilicate bottles and were constantly cooled. After sampling, the screen-sampler was cleaned thoroughly with a jet of clean water derived from the ship’s reverse osmosis processing plant. The reference sample (ULW) was taken from the continuous underway system from a depth of approximately 2 m and during the time of SML sampling. The apparent sampling thickness (d) of the collected SML was calculated according to Cunliffe and Wurl (2014) by taking into account the number of dips (n), the effective sampling area of the Garrett-Screen (At) and the volume of the collected sample (v) as described in equation 1.
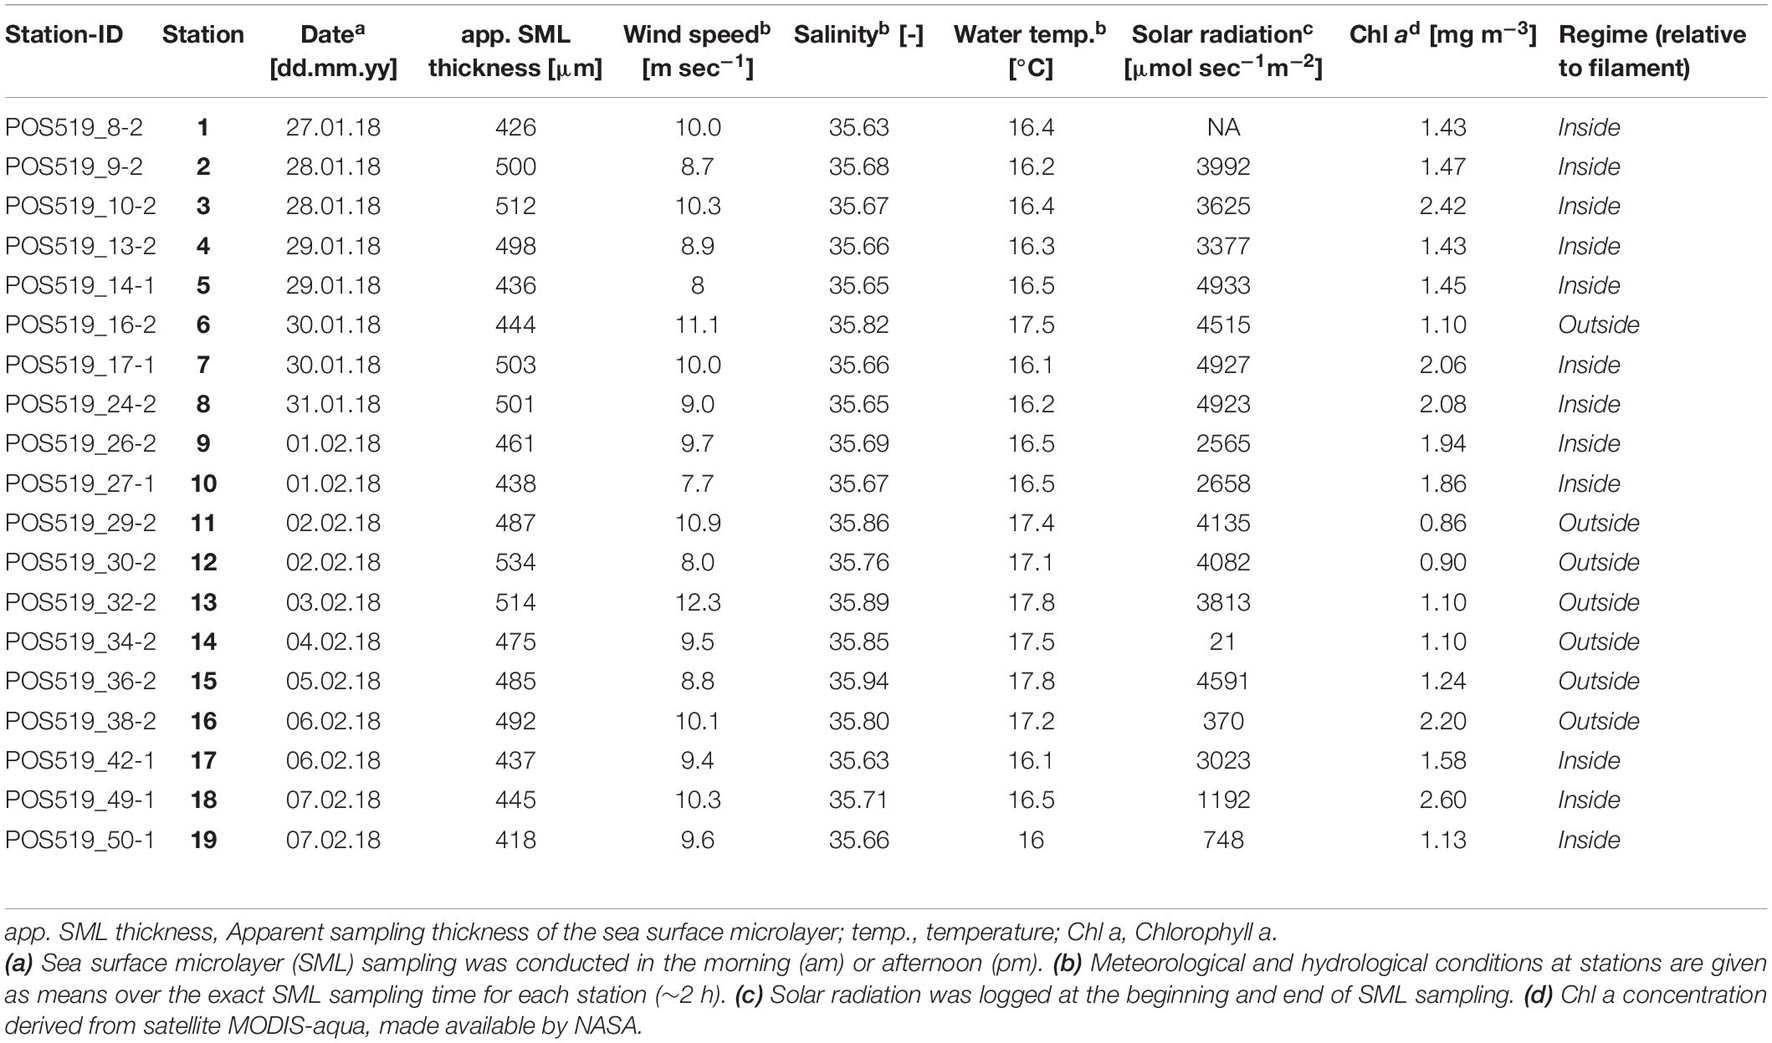
Table 1. Overview of hydrological and meteorological conditions.
Characterization of Organic Matter
Total Nitrogen and Organic Carbon
Samples for total organic carbon (TOC) and total nitrogen (TN) were taken in duplicates of 20 mL, filled into combusted glass ampoules and conserved with 20 μL of 32% hydrochloric acid. Acidifying samples is a necessary condition to remove inorganic carbon from the samples. This can cause minor losses of very labile organic carbon species (Sharp, 2002). Ampoules were sealed and stored at 4°C for 4 months. Concentrations of TOC and TN were measured by high-temperature catalytic oxidation (TOC-VCSH, Shimadzu). The TOC analyzer is calibrated at least every 10 days with a standard solution (potassium hydrogen phthalate and potassium nitrate standard). The precision was estimated as the standard deviation between analytical replicates and divided by the mean concentration. It was always < 2% and <4% for TOC and TN, respectively. Procedures followed the standard protocols (e.g., Engel and Galgani, 2016; Zäncker et al., 2017).
Total Amino Acids and Combined Carbohydrates
Samples were filled into combusted glass vials in duplicates of 20 mL and stored until analysis at –20°C for 5 months. Total hydrolysable amino acids (TAA) were determined by high-performance liquid chromatography (HPLC) (1260HPLC System equipped with a fluorescence detector, Agilent). Before analysis, TAA were hydrolyzed with hydrochloric acid and subsequently neutralized under a low-pressure nitrogen atmosphere and subsequently resuspended in water. Precise in-line derivatization of TAA with o-phthaldialdehyde and mercaptoethanol ensured the achievement of qualitative comparability. The solvent for the HPLC run was formed of acetonitrile and the buffer sodium-dihydrogen-phosphate on a C18 column (Phenomenex, United States). For calibration, standard concentrations of the different amino acids were used. The following thirteen amino acids were analyzed: aspartic acid (Asp), glutamic acid (Glu), serine (Ser), glycine (Gly), threonine (Thr), arginine (Arg), alanine (Ala), tyrosine (Tyr), valine (Val), isoleucine (Ile), phenylalanine (Phe), and leucine (Leu). The precision was on average 3% and always < 9% and calculated as the standard deviation of replicates divided by the mean concentration. Analysis was performed after the modified protocol of Lindroth and Mopper (1979) and Dittmar et al. (2009).
Total combined carbohydrates (TCHO) were determined by high-performance anion-exchange chromatography (HPAEC) in combination with pulsed amperometric detection (PAD) by a Dionex ICS 3000. Due to interference of salt anions with the column run, samples were dialyzed before measurements (dialysis membrane: MWCO Spectra Por, pore size 1 kDa). Combined carbohydrates were cleaved by acidic hydrolysis. For the HPAEC run, carbohydrates were washed out of the column with a gradient course of sodium hydroxide and sodium acetate. The following sugars were assessed: glucose (Glc), mannose and xylose (Man/Xyl), galactose (Gal), arabinose (Ara), fucose (Fuc) and rhamnose (Rha), the acidic sugars galacturonic acid (GalX) and glucuronic acid (GlcX) and the amino sugars galactosamine (GalN) and glucosamine (GlcN). The precision was on average 2% and always < 7%, calculated as the standard deviation between replicates divided by the mean concentration. All procedures followed standard protocols (Engel and Händel, 2011).
Surface Activity
Samples were filled into 15 mL acid rinsed (10% hydrochloric acid) falcon tubes in duplicates directly after sampling and stored at –80°C for 3 months. While surface activity is commonly quantified directly after sampling, the storage of samples at –20 or –80°C has been implemented by several studies before (Salter et al., 2011; Schneider-Zapp et al., 2013; Rickard et al., 2019; see also the Supplementary Information Section 1). Glass vials in which surface activity was measured were rinsed with 10% hydrochloric acid and MilliQ and combusted at 500°C for 8 h prior to the analysis. Replicates were measured in the same glass vials after rinsing them three times with MilliQ. Two replicates of 10 mL volume were assessed. All samples were adjusted to equal ionic strength since conductivity affects the measurement. Ion concentrations of samples were adjusted to 0.55 Mol (35 on the Practical Salinity scale). Samples, including blanks and standards, were measured at room temperature.
Surface activity was measured by phase-sensitive alternating current voltammetry (Ćosović and Vojvodić, 1982, 1998) (Polarograph type: 797 VA Computrace Control, Metrohm, Switzerland). This method makes use of the competitive adsorption effect of substances on the polar to non-polar interface as represented by the hanging mercury drop and the electrolyte solution. For the analysis, only the initial point of the derived current-potential curves was taken into account (at a potential of –0.6 V). The mercury drop size of the working electrode was set to four (an internal scale) at 1.08 bar pressure and thus an equal surface area of the drop was maintained through measurements. The accumulation time during measurements was always set to 60 s. Five scans were conducted for each measurement. The mean of the three closest scans was further processed to evaluate surfactant concentrations. Surface-activity of samples was determined by calculating the difference between the capacity current of blanks (IB) and samples (IS).
Following Equation 2, ΔI reflects the decrease of capacity current of a sample relative to the baseline of the pure electrolyte solution. Samples were calibrated against the artificial soluble surfactant Triton X-100 (TX-100, Sigma-Aldrich, Germany, molecular weight 625 g mol–1). In total, three calibration curves were derived of concentrations ranging from 0.02 to 0.7 mg TX-100. Only the linear rise of the slope was included in the calibration line (Supplementary Table S1). The lower and upper detection limit was 0.04 and 0.52 mg TX-100 equiv. L–1, respectively. To calculate the precision of the measurement, blanks and a limited number of standards were run together with the samples. Based on these daily standards, the analytical precision was calculated. For a mean surfactant concentration of 0.23 mg TX-100 equiv. L–1, analytical precision was on average 6% and always < 10%. In comparison, the relative SD of true replicates from the sample mean was on average 11 ± 8% (this range includes 84% of all samples) and is slightly higher than in previous studies (<10% in Sabbaghzadeh et al., 2017; Rickard et al., 2019). This may be explained by a smaller number of replicates in this study or by the minor effect of cell lysis upon freezing and thawing of samples (Rickard et al., 2019). Taking into account that the subsequent tests for differences and correlations relyed on 38 data points in total, we consider the uncertainty related to our surfactant measurements acceptable.
Microbial Community
Samples were collected in triplicates of 1.7 mL, fixed with 85 μL glutardialdehyde (GDA, 25%) (final concentration 1.2%) and stored at –80°C for 4 months. Abundance and size classes of bacterial and phytoplankton cells were determined by flow cytometry (Flow Cytometer: Becton and Dickinson FACScalibur; Software: BD Bioscience Cell Quest Pro). The Flow Cytometer was calibrated with simultaneously measured yellow-green latex beads of a diameter of 0.5 and 1 μm. Heterotrophic prokaryotes (‘bacteria’) were detected after staining with SYBRGreen I. Based on their high or low cellular content of nucleic acid (HNA and LNA), bacterial cells were accordingly categorized. Phytoplankton cells including autotrophic prokaryotes and eukaryotes were enumerated by applying a higher flow rate (∼40 μL min–1) and were grouped into four classes based on their autofluorescence signal. Cells containing the pigment phycoerythrin were referred to as cyanobacteria-like (CBL). These cells, however, did not necessarily represent cyanobacteria. For instance, cryptophyta were found to constitute a major fraction of nano-CBL cells (Marie et al., 2010). Phytoplankton cells containing solely Chl a were referred to as non-cyanobacteria-like (NCBL). Within the pigment groups, phytoplankton cells < 2 μm were categorized as pico-sized while cells > 2 μm were categorized as nano-sized. Pico-CBL cells corresponded to a range that has been previously calibrated against Synechococcus cultures. Procedures followed the standard protocol as applied by e.g., Engel and Galgani (2016) and Zäncker et al. (2017).
Data Analysis and Statistics
For statistical testing, sample sizes are indicated by a capital ‘N’ when all samples were included (e.g., SML and ULW, sample size N = 38), while a minor ‘n’ indicates that only a subgroup was tested, e.g., the SML (n = 19) or the stations outside the filament (n = 14). Mean values are given together with the standard deviation (M ± SD) if not indicated differently. A non-parametric correlation statistic (Spearman Rank Correlation) was performed to evaluate the a priori assumption of interdependence between the SML and ULW, which was verified, i.e., depths were highly correlated (Table 2). Subsequently, SML and ULW comparisons were analyzed as ‘paired’. Differences in absolute and relative concentrations and abundance between depths and regimes were evaluated by applying the non-parametric Mann–Whitney U-test since homogeneity of variances and normality was not always given (Levene test and Shapiro–Wilk test). To account for multiple comparisons when correlating surface activity (SA) to organic matter components, test statistics were corrected by a Bonferroni Correction. Therefore, the significance level α was divided by the number of comparisons (k) and defined a new threshold value (αi) (Equation 3). This is annotated in asterisks and given as additional information in compliance with the original calculated significance values in Table 3.
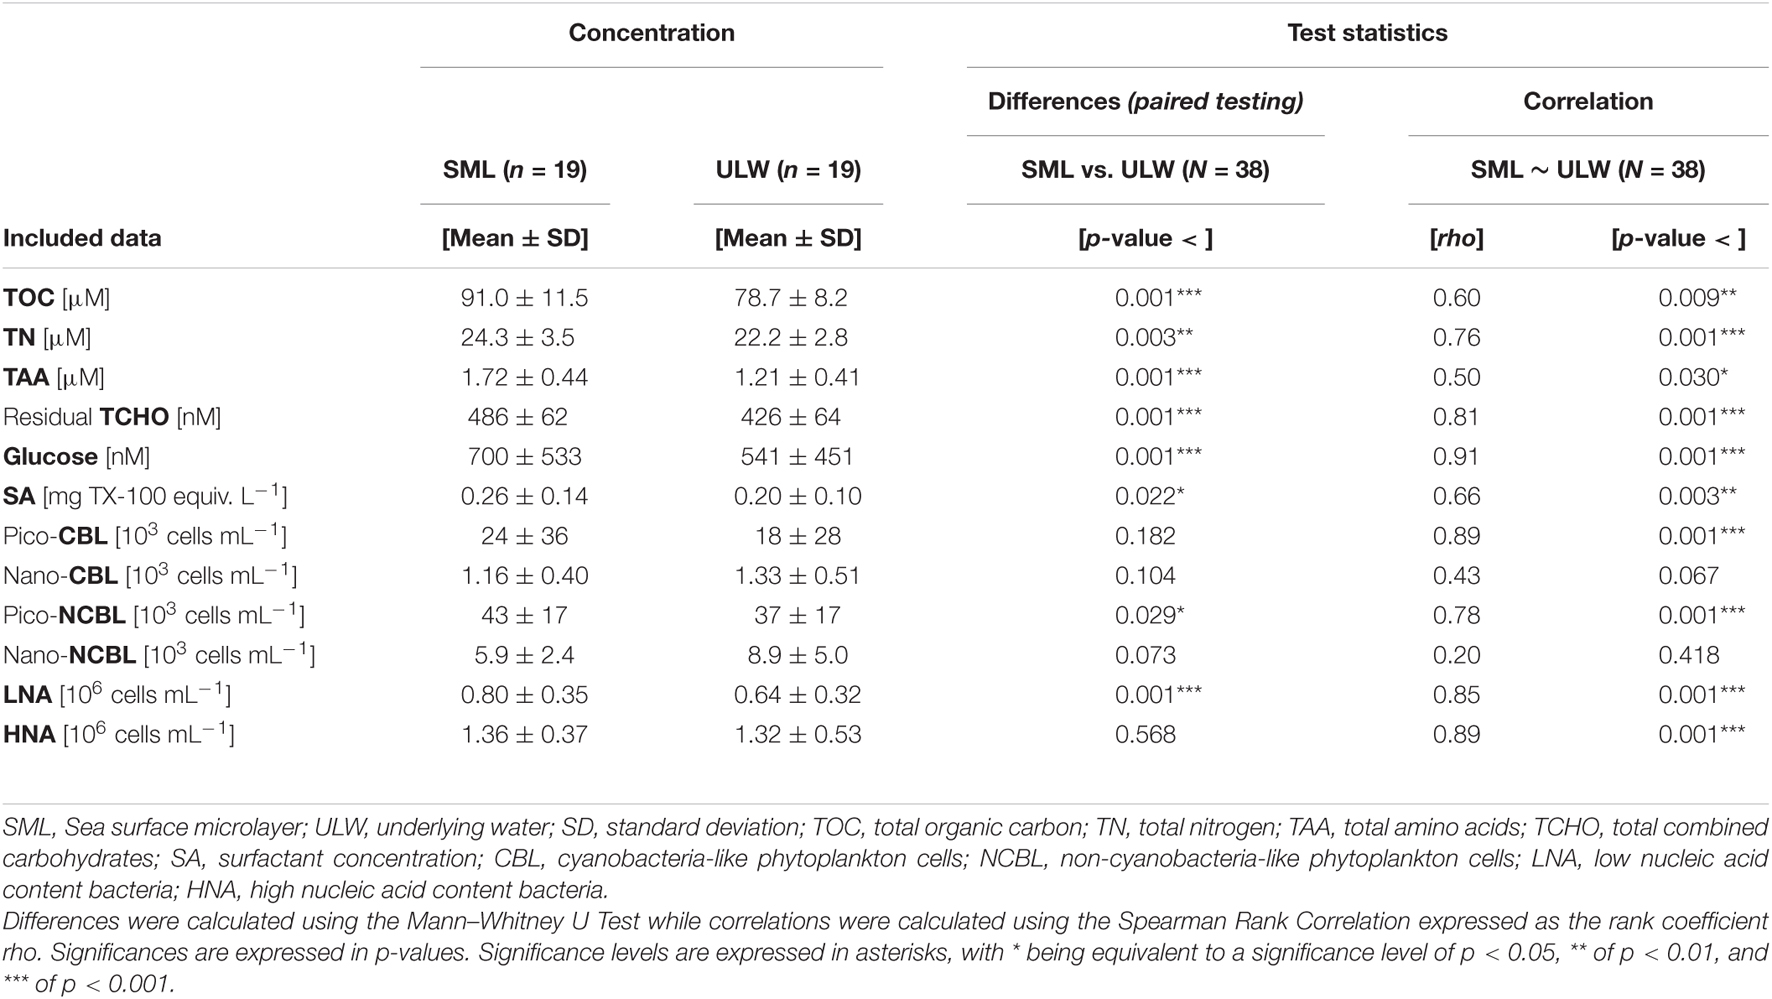
Table 2. SML and ULW mean concentrations, standard deviations, and comparative statistics.
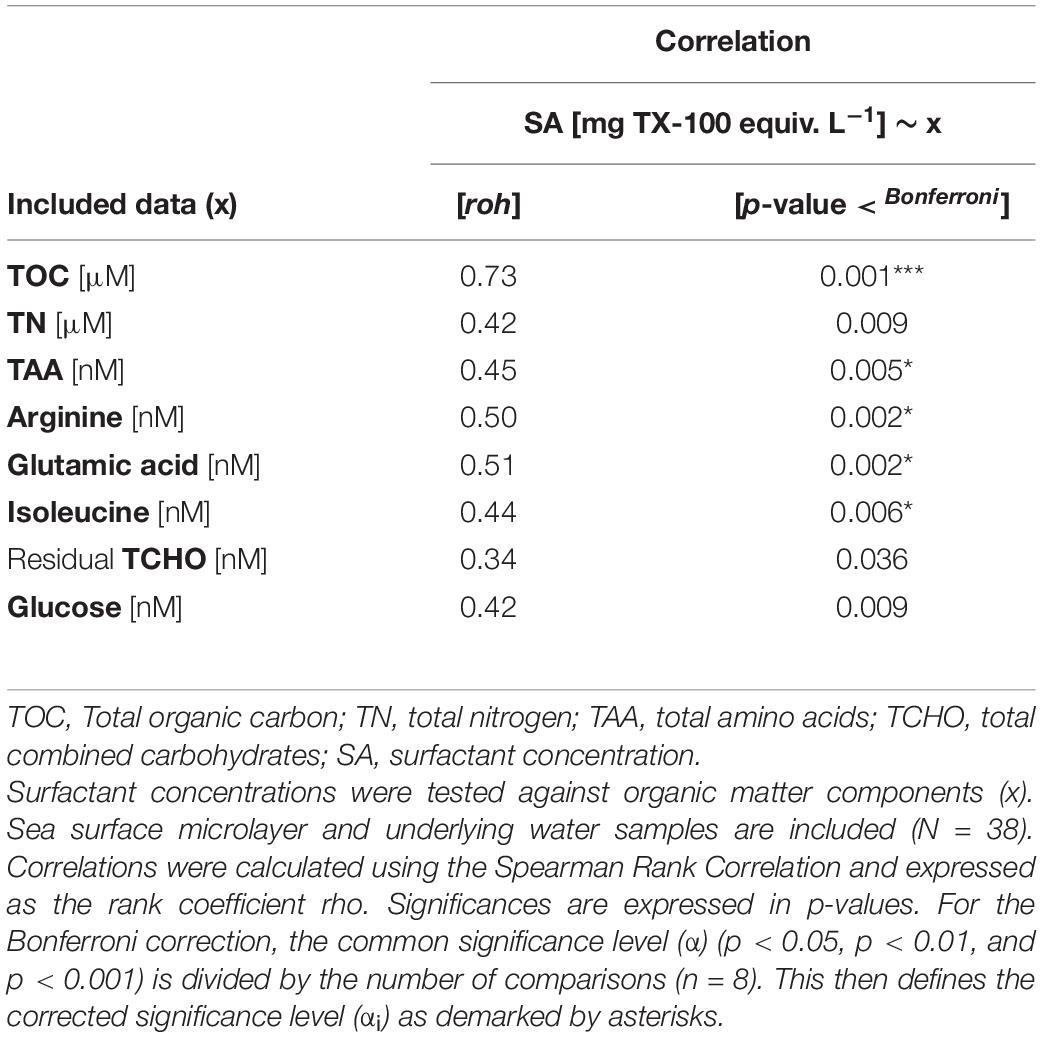
Table 3. Correlation between surfactant and organic matter components.
To evaluate the relative concentration differences between the SML and the ULW, the enrichment factor (EF) was calculated by dividing a substance’s concentration in the SML by the concentration measured in the ULW (Equation 4). An EF > 1 indicates enrichment of a substance, while an EF < 1 implies a depletion in the SML.
To estimate the potential suppression effect of surfactants on the water-side gas transfer velocity coefficient (kw) for CO2, the empirical equation by Pereira et al. (2018) was applied (Equation 5). This equation has been derived during a meridional transect across the Atlantic Ocean in on-board gas exchange tank experiments and converts surface activity into the expected suppression of kw recorded in percent. Values are adjusted to the ratio of kinematic viscosity of sea water at 20°C and the diffusivity of the gas CO2, resulting in the Schmidt number (Sc) Sc = 660.
It should be noted that equation 5 was derived under laboratory conditions and that turbulence was not created by wind forcing but mechanically by a baffle. Introduced estimates on gas exchange suppression should thus be interpreted with caution.
Differences in the molecular composition of TCHO and TAA are described using a principal component analysis (PCA). For the PCA, two-dimensional scores were extracted from multivariate data sets (Davis et al., 2009). Glucose was analyzed separately and excluded from the PCA of TCHO due to its high variability between stations and its dominance in TCHO concentrations. The remaining fraction of TCHO is addressed as ‘residual’. First Principal Components (PC1) reflect major compositional trends in TAA and degradation indices (DI) were derived following the approach of Dauwe and Middelburg (1998) and Dauwe et al. (1999) (Equation 6). Vari described the molar contribution of an individual amino acid in percent [%Mol] while AVG vari, SD vari and fac.coef represent the mean, the standard deviation and the factor coefficient of all amino acids, respectively, and based on the PCA profile. The more negative DI are, the more degraded is the organic matter.
Results
Hydrology of the Filament and Meteorological Conditions
With the help of satellite observations and the hydrological data acquired during the cruise, the filament’s extent and characteristics were identified. The filament was visible for around 30 days and exhibited during the largest expansion a length of 70 km and a width of 40 km. Stations were separated according to hydrological regimes: Inside the upwelling filament (surface temperature ≤ 16.5°C, salinity ≤ 35.71) and outside the filament (surface temperature ≥ 17.1°C, salinity ≥ 35.76). Satellite-derived Chl a concentration confirmed the observed hydrological differences between regimes as the average concentration inside was 1.79 ± 0.45 mg m–3 while 1.21 ± 0.45 mg m–3 outside and thus significantly lower than within the filament (Whitney-U Test, p-value < 0.010, N = 19) (Figures 2A,B). Twelve stations were sampled inside (stations 1–10 excluding station 6 and stations 17–19), while seven stations were sampled outside the filament (stations 6 and 11–16) (Figure 2C). The first and last station was sampled 46 and 102 km away from the coast, respectively. A temperature section against depth visualizes the frontal gradient from adjacent and already stratified to well mixed, upwelled waters inside the filament, which is also evident from the outcropping of density layers towards the center of the filament (Figure 2D). The complementary salinity section is presented in the supplementary information (Supplementary Figure S2). Meteorological conditions stayed rather constant throughout the cruise. A mean incoming irradiance of 3.2 ± 1.6 mmol sec–1 m–2 was recorded. Wind speed was on average high (9.6 ± 1.3 m sec–1 corresponding to a U10 mean wind speed of 8.7 m sec–1) in comparison to an average oceanic wind speed of 6.6 m sec–1 (Archer and Jacobson, 2005). It was also tested whether differences in meteorological conditions occurred across the filament’s sides, which could potentially influence SML dynamics. Solar radiation (inside: 3.3 ± 1.46 mmol sec–1 m–2, n = 11; outside: 3.6 ± 1.6 mmol sec–1 m–2, Mann–Whitney U-test, p-value > 0.05, n = 6, station 14 was excluded as it was sampled in the evening) and wind speed (inside: 9.3 ± 0.9 m sec–1, n = 12; outside: 10.1 ± 1.5 m sec–1, Mann–Whitney U-test, p-value > 0.05, n = 7) did not differ between the filament’s sides. The SML was therefore subjected to a rather similar set of environmental conditions across the filament’s front. Detailed information on meteorological and hydrological conditions is provided in Table 1.
The Sea Surface Microlayer
The apparent sampling thickness of the SML (inside the filament: 465 ± 34 μm, outside: 490 ± 27 μm) was statistically insensitive to regimes (Mann–Whitney U-test, p-value > 0.05, N = 19) and corresponds to the thickness range listed in previous studies (Cunliffe and Wurl, 2014). Abiotic parameters such as temperature and wind speed or organic matter enrichment can affect the apparent sampling thickness of the SML (Falkowska, 1999; Engel and Galgani, 2016). An apparent SML sampling thickness, and as determined with the Garrett-Screen in this study, is operational only, i.e., depends on the sampling device in use. The true thickness of the SML has been estimated to range around 50 ± 10 μm under laboratory conditions and by considering changes in physicochemical properties (Zhang et al., 1998, 2003). This suggests that sampling the SML in the field inevitably leads to a dilution of the SML with simultaneously collected underlying water (Cunliffe and Wurl, 2014). Consequently, the enrichment of organic substances and organisms within SML samples is likely to be underestimated.
In general, concentrations of organic matter exhibited significant correlations between the SML and ULW. Overall, abundance of bacteria and phytoplankton cells in the SML was closely correlated to the respective abundance in the ULW, except for nano-CBL and nano-NCBL cells. Mean concentrations and details of the test statistics are presented in Table 2. Absolute concentrations of TOC and TN were significantly elevated in the SML (for example for TOC: SML: 91.0 ± 11.5 μM; ULW: 78.7 ± 8.2 μM; Mann–Whitney U-test, p-value < 0.001, N = 38). Moreover, the concentration of TAA differed significantly between the SML and ULW with concentrations of 1.72 ± 0.44 μM and 1.21 ± 0.41 μM, respectively (Mann–Whitney U-test, p-value < 0.001, N = 38). Residual TCHO and Glc exhibited also significant differences across depths (Table 2). The total concentration of surfactants varied strongly across all stations, with a minimum of 0.08 mg TX-100 equiv. L–1 in the ULW at station 15, a maximum concentration of 0.49 mg TX-100 equiv. L–1 in the SML at station 14, and an overall mean concentration of 0.23 ± 0.12 mg TX-100 equiv. L–1. Significant differences in surfactant concentration were found between the SML and ULW (SML: 0.26 ± 0.14 mg TX-100 equiv. L–1, ULW: 0.20 ± 0.10 mg TX-100 equiv. L–1; Mann–Whitney U-test, p-value < 0.022, N = 38). Total mean phytoplankton cell abundance exhibited slightly higher numbers in the SML (73 ± 44 × 103 cells mL–1) than in the ULW (66 ± 37 × 103 cells mL–1). Averaged bacterial counts were slightly more abundant in the SML (2.16 ± 0.61 × 10⁶ cells mL–1) than in the ULW (1.96 ± 0.76 × 10⁶ cells mL–1). A significant difference between depths was observed for pico-NCBL cell abundance only (SML: 43 ± 17 × 103 cells mL–1, ULW: 37 ± 17 × 103 cells mL–1; Mann–Whitney U-test, p-value < 0.029, N = 38). No difference was observed between the SML and ULW for nano-phytoplankton groups. LNA cell numbers were significantly elevated in the SML (SML: 0.80 ± 0.35 × 10⁶ cells mL–1, ULW: 0.64 ± 0.32 × 10⁶ cells mL–1; Mann–Whitney U-test, p-value < 0.001, N = 38). However, no significant difference in absolute HNA abundance could be derived regarding depths.
Differences Across the Filament’s Front
Across the filament front, organic matter concentrations and the abundance of organisms changed consistently. The main differences occurring across the filament’s front are summarized in Figure 3. A general overview of concentrations and test statistics is further provided in the Supplementary Table S2 for the SML and ULW, respectively. TOC concentration was higher inside the filament and changed significantly for the SML and ULW across the front (for example in the SML: inside: 93.9 ± 13.2 μM; outside: 86.0 ± 5.4 μM; Mann–Whitney U-test p-value < 0.045, n = 19; Figure 3A). TN concentrations yielded also significant differences between regimes for both depths (for example for the SML: inside: 25.9 ± 3.3 μM; outside: 21.6 ± 2.0 μM; Mann–Whitney U-test p-value < 0.013, n = 19; Figure 3B). Higher surfactant concentrations were detected inside than outside the filament, with an average SML concentration of 0.28 ± 0.11 and 0.22 ± 0.18 mg TX-100 equiv. L–1 and an average ULW concentration of 0.22 ± 0.12 and 0.16 ± 0.07 mg TX-100 equiv. L–1, respectively (Figure 3C). Nonetheless, differences were statistically insignificant for both depths. TAA concentrations differed significantly between regimes for the ULW only (Figure 3D). ULW TAA concentrations ranged around 1.39 ± 0.42 μM inside in comparison to 0.91 ± 0.14 μM outside the filament (Mann–Whitney U-test, p-value < 0.006, n = 19). Glc concentration dominated TCHO by contributing a molar fraction of 50.2 ± 17.3% (621 ± 494 nM) but exhibited a large variability across all stations. In comparison, the concentration of residual TCHO stayed rather constant throughout regimes (456 ± 69 nM) although a tendency toward slightly lower concentrations was apparent for the ULW outside (Supplementary Table S2). Stations outside of the filament exhibited a remarkable characteristic in phytoplankton distribution. Significant higher abundance of pico-CBL cells (Synechococcus spp.) was observed outside (49 ± 39 × 103 cells mL–1) in comparison to inside the filament where cell numbers declined by one order of magnitude (4.7 ± 2.2 × 10³ cells mL–1). Pico-CBL cells proved to be significantly different across the filament’s front for the SML (Mann–Whitney U-test, p-value < 0.001, n = 19) and ULW (Mann–Whitney U-test, p-value < 0.003, n = 19) (Figure 3G). Nano-CBL cells were slightly higher concentrated outside than inside the filament, with a total average of 1.45 ± 0.58 × 10³ cells mL–1 and 1.13 ± 0.34 × 10³ cells mL–1, respectively. Across the front, nano-CBL abundance differed significantly for the SML (Mann–Whitney U-test, p-value < 0.010, n = 19). Pico-NCBL cells dominated the phytoplanktonic community in numbers and occurred in concentrations of 37 ± 17 × 103 cells mL–1 inside in comparison to 44 ± 16 × 103 cells mL–1 outside the filament. Nano-NCBL abundance displayed higher numbers inside (8.3 ± 4.7 × 10³ cells mL–1) than outside the filament (4.6 ± 2.5 × 10³ cells mL–1). Between regimes, nano-NCBL abundance differed significantly for the ULW (Mann–Whitney U-test, p-value < 0.029, n = 19) (Figure 3H). Bacterial abundance reached a total concentration of 2.00 ± 0.75 × 10⁶ cells mL–1 inside and 2.16 ± 0.59 × 10⁶ cells mL–1 outside the filament. Bacteria were in general dominated by HNA cells (HNA: 65.9 ± 8.6%). For the SML, increased absolute LNA cell numbers were tested to be significantly higher concentrated outside the filament and their abundance in the ULW followed the same trend. Inversely, higher absolute HNA cell numbers were observed inside the filament (Supplementary Table S2). This led to a relative contribution of LNA cells by 28.7 ± 3.6% inside the filament, while outside they contributed on average 43.3 ± 6.6% to overall bacterial abundance (Mann–Whitney U-test, p-value < 0.001; N = 38).
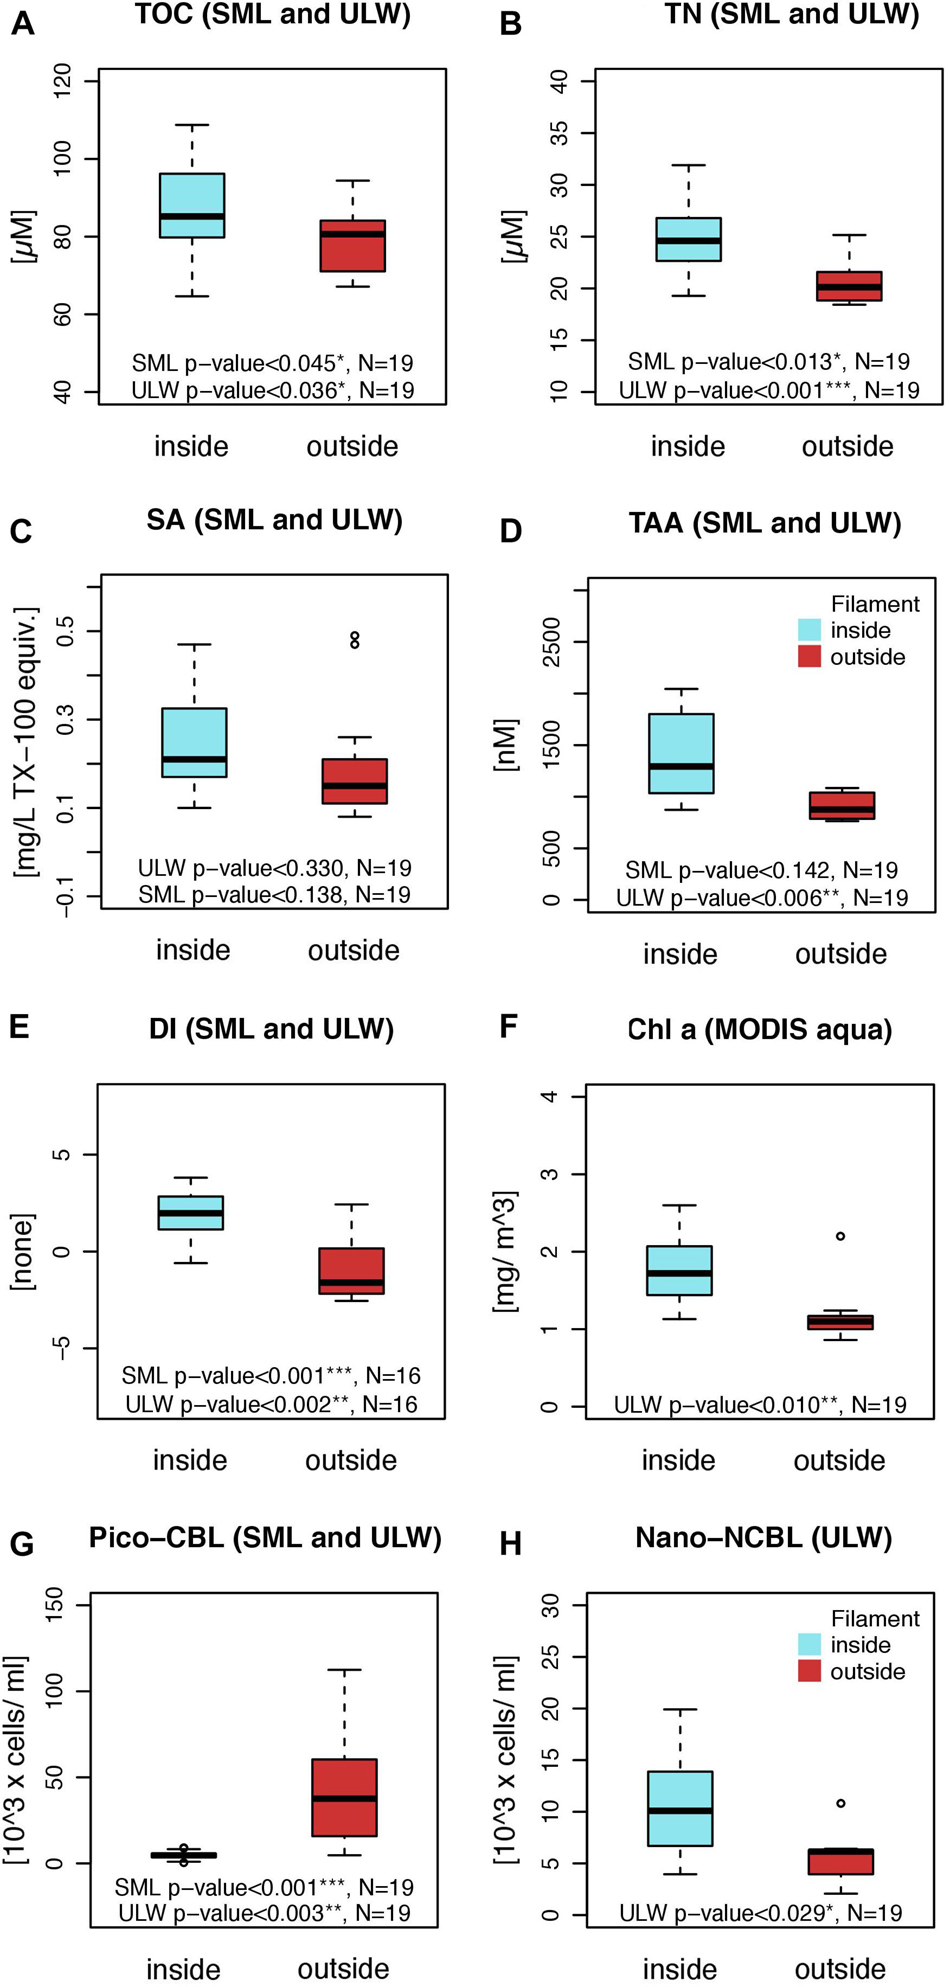
Figure 3. Organic matter concentration difference across the filament’s front in the SML and ULW. Average concentration of (A) total organic carbon (TOC) and (B) total nitrogen (TN), (C) surface activity (SA), (D) total amino acids (TAA), and (E) degradation indices (DI), which were derived from the relative contribution of molecular amino acid concentrations. Differences across the filaments front of (F) bulk Chlorophyll a derived from the satellite MODIS aqua by NASA and of certain phytoplankton groups: (G) Averaged abundance of pico-CBL cells (Synechococcus spp.) in the SML and ULW and (H) nano-NCBL (eukaryotic, Non-Cyanobacteria-Like cells) in the ULW. Differences were tested independently for the SML and ULW and significances of the Mann–Whitney U-test are indicated below the boxplots. Supplementary Information is provided in Supplementary Table S2.
Enrichment in the SML was generally more pronounced outside the filament (Figure 4). However, only EFs of the microbial community exhibited statistically significant differences between regimes with an exception for LNA bacteria. All test statistics provided below address the comparison of EFs across the filament’s front. Mean enrichment of TOC and TN was statistically indifferent between regimes (EFTOC 1.2 ± 0.1 and EFTN 1.1 ± 0.1). In comparison to all other organic matter compounds, TAA exhibited generally the highest enrichment, with a tendency toward even higher enrichment outside the filament (EFTAA inside: 1.4 ± 0.3, outside: 1.7 ± 0.4). The difference in enrichment pattern of residual TCHO was negligible across the filaments front (EFTCHO inside: 1.1 ± 0.1, outside: 1.2 ± 0.1). The enrichment of Glc was considerably higher than for residual TCHO and by trend elevated outside the filament (EFGlc inside: 1.3 ± 0.4, outside: 1.6 ± 0.4). Surfactant concentration exhibited an enrichment of EFSurf 1.5 ± 0.7 and 1.3 ± 0.6 inside and outside the filament, respectively. Pico-CBL cells were enriched outside the filament, yielding an EFPico–CBL of 1.7 ± 0.8 in comparison to 1.0 ± 0.5 (Mann–Whitney U-test, p < 0.045, N = 19). Nano-CBL cells exhibited also a strong difference between regimes. They were depleted in the SML inside while enriched outside the filament with an EFNano–CBL of 0.8 ± 0.3 and 1.3 ± 0.6, respectively (Mann–Whitney U-test, p-value < 0.017, N = 19). A comparable pattern was observed for nano-NCBL cells which showed a depletion inside (EFNano–NCBL 0.7 ± 0.4) and enrichment of 1.2 ± 0.6 outside the filament (Mann–Whitney U-test, p-value < 0.028, N = 19). Pico-NCBL cells showed a pronounced enrichment outside the filament (EFPico–NCBL 1.5 ± 0.4), while inside their abundance in the SML and ULW was nearly balanced (EFPico–NCBL 1.1 ± 0.2) (Mann–Whitney U-test, p-value < 0.017, N = 19). Moreover, HNA cell enrichment differed between regimes as the abundance was similar in the SML and ULW inside, while significantly enriched outside (EFHNA inside: 1.0 ± 0.2, outside: 1.2 ± 0.2, Mann–Whitney U-test, p-value < 0.045, N = 19). For LNA cells, moderate enrichment occurred inside the filament (EFLNA 1.2 ± 0.3) and pronounced enrichment outside (EFLNA 1.5 ± 0.4).
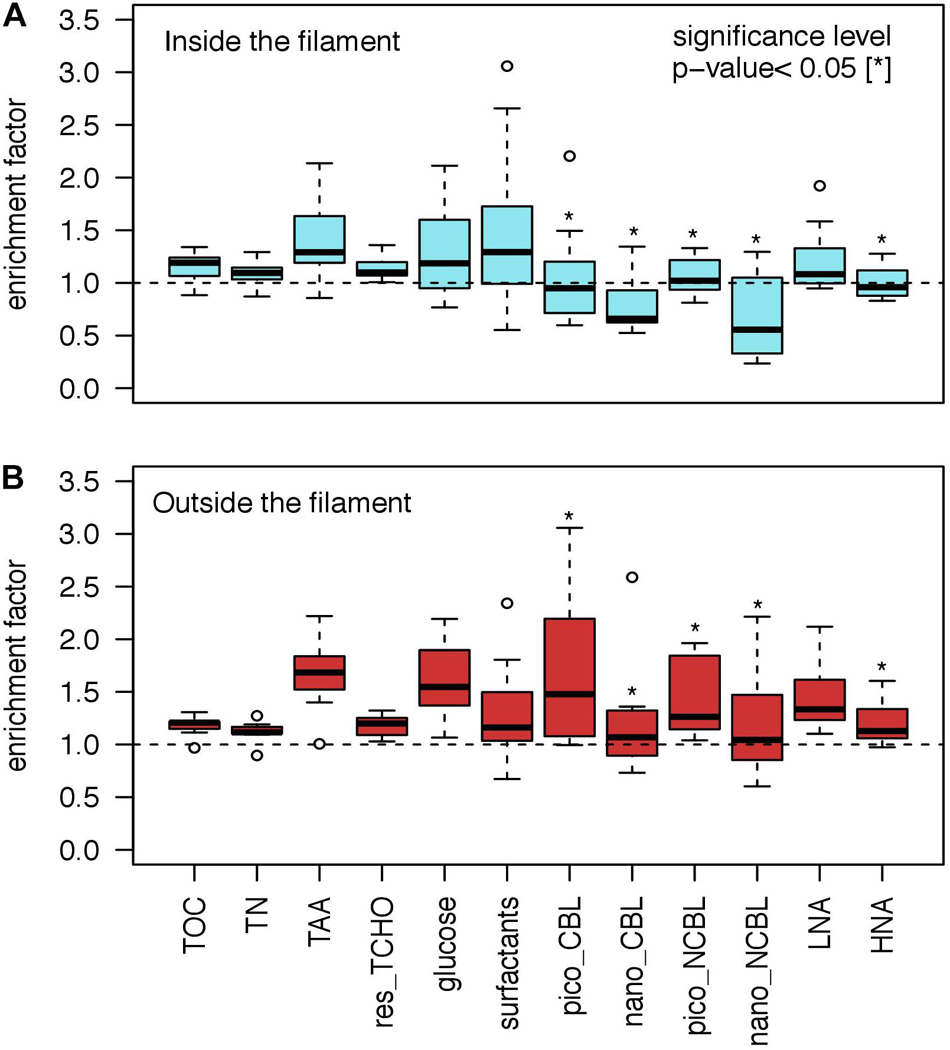
Figure 4. Enrichment factors (EF) for biogenic substances and organisms comparing (A) inside and (B) outside the filament. For the comparison of differences in EFs between regimes the Mann–Whitney U-test was applied yielding significances (p-value < 0.05) for all phytoplankton groups and HNA bacteria as marked by asterisks. Total organic carbon (TOC); total nitrogen (TN), total amino acids (TAA); total combined carbohydrates excluding glucose (res_TCHO); cyanobacteria like phytoplankton cells (CBL); non-cyanobacteria like phytoplankton cells (NCBL); pico (<2 μm); nano (>2 μm); low nucleic acid content bacteria (LNA); high nucleic acid content bacteria (HNA).
In summary, it was shown that SML characteristics differed clearly across the filament’s front. As differences in sampling time and date inside and outside the filament were unavoidable due to logistic reasons, results may have been biased, which is discussed in detail in the Supplementary Information Section 4. In brief, abiotic factors and potential diurnal variability did not compromise the main findings.
Molecular Composition
To assess the variability in the molar composition of TAA and TCHO across stations, two PCAs were conducted. The relative molar composition of TAA was dominated by Gly, which contributed on average 21.2%Mol over all stations and depths and was followed by Glu (16.7%Mol), Asp (14.5%Mol), and Ala (10.9%Mol). Arg contributed an averaged fraction of 4.0%Mol and Ile of 3.2%Mol. The first and second principal components (PC1 and PC2) of the conducted PCA explained in total 69.4% of the observed variance in TAA composition. Negative PC1 scores were strongly governed by a bundle of amino acids which included Phe, Asp, Leu, and Val, while the opposing positive scores were exclusively defined by Gly and Ser. This variance, appearing along the PC1 axis, will be discussed in a subsequent chapter as it is indicative of organic matter degradation. Samples exhibited clear SML and ULW clusters along the PC2 axis (variance explained 24.8%). In general, positive PC2 scores characterized the SML and negative scores the ULW (Figure 5A). The composition of TAA in the SML was governed by Glu, Ile, and Arg while the ULW was mostly influenced by Ala and Thr. (Supplementary Information of the variance occurring along the PC3 axis is provided in Supplementary Figure S3A.)
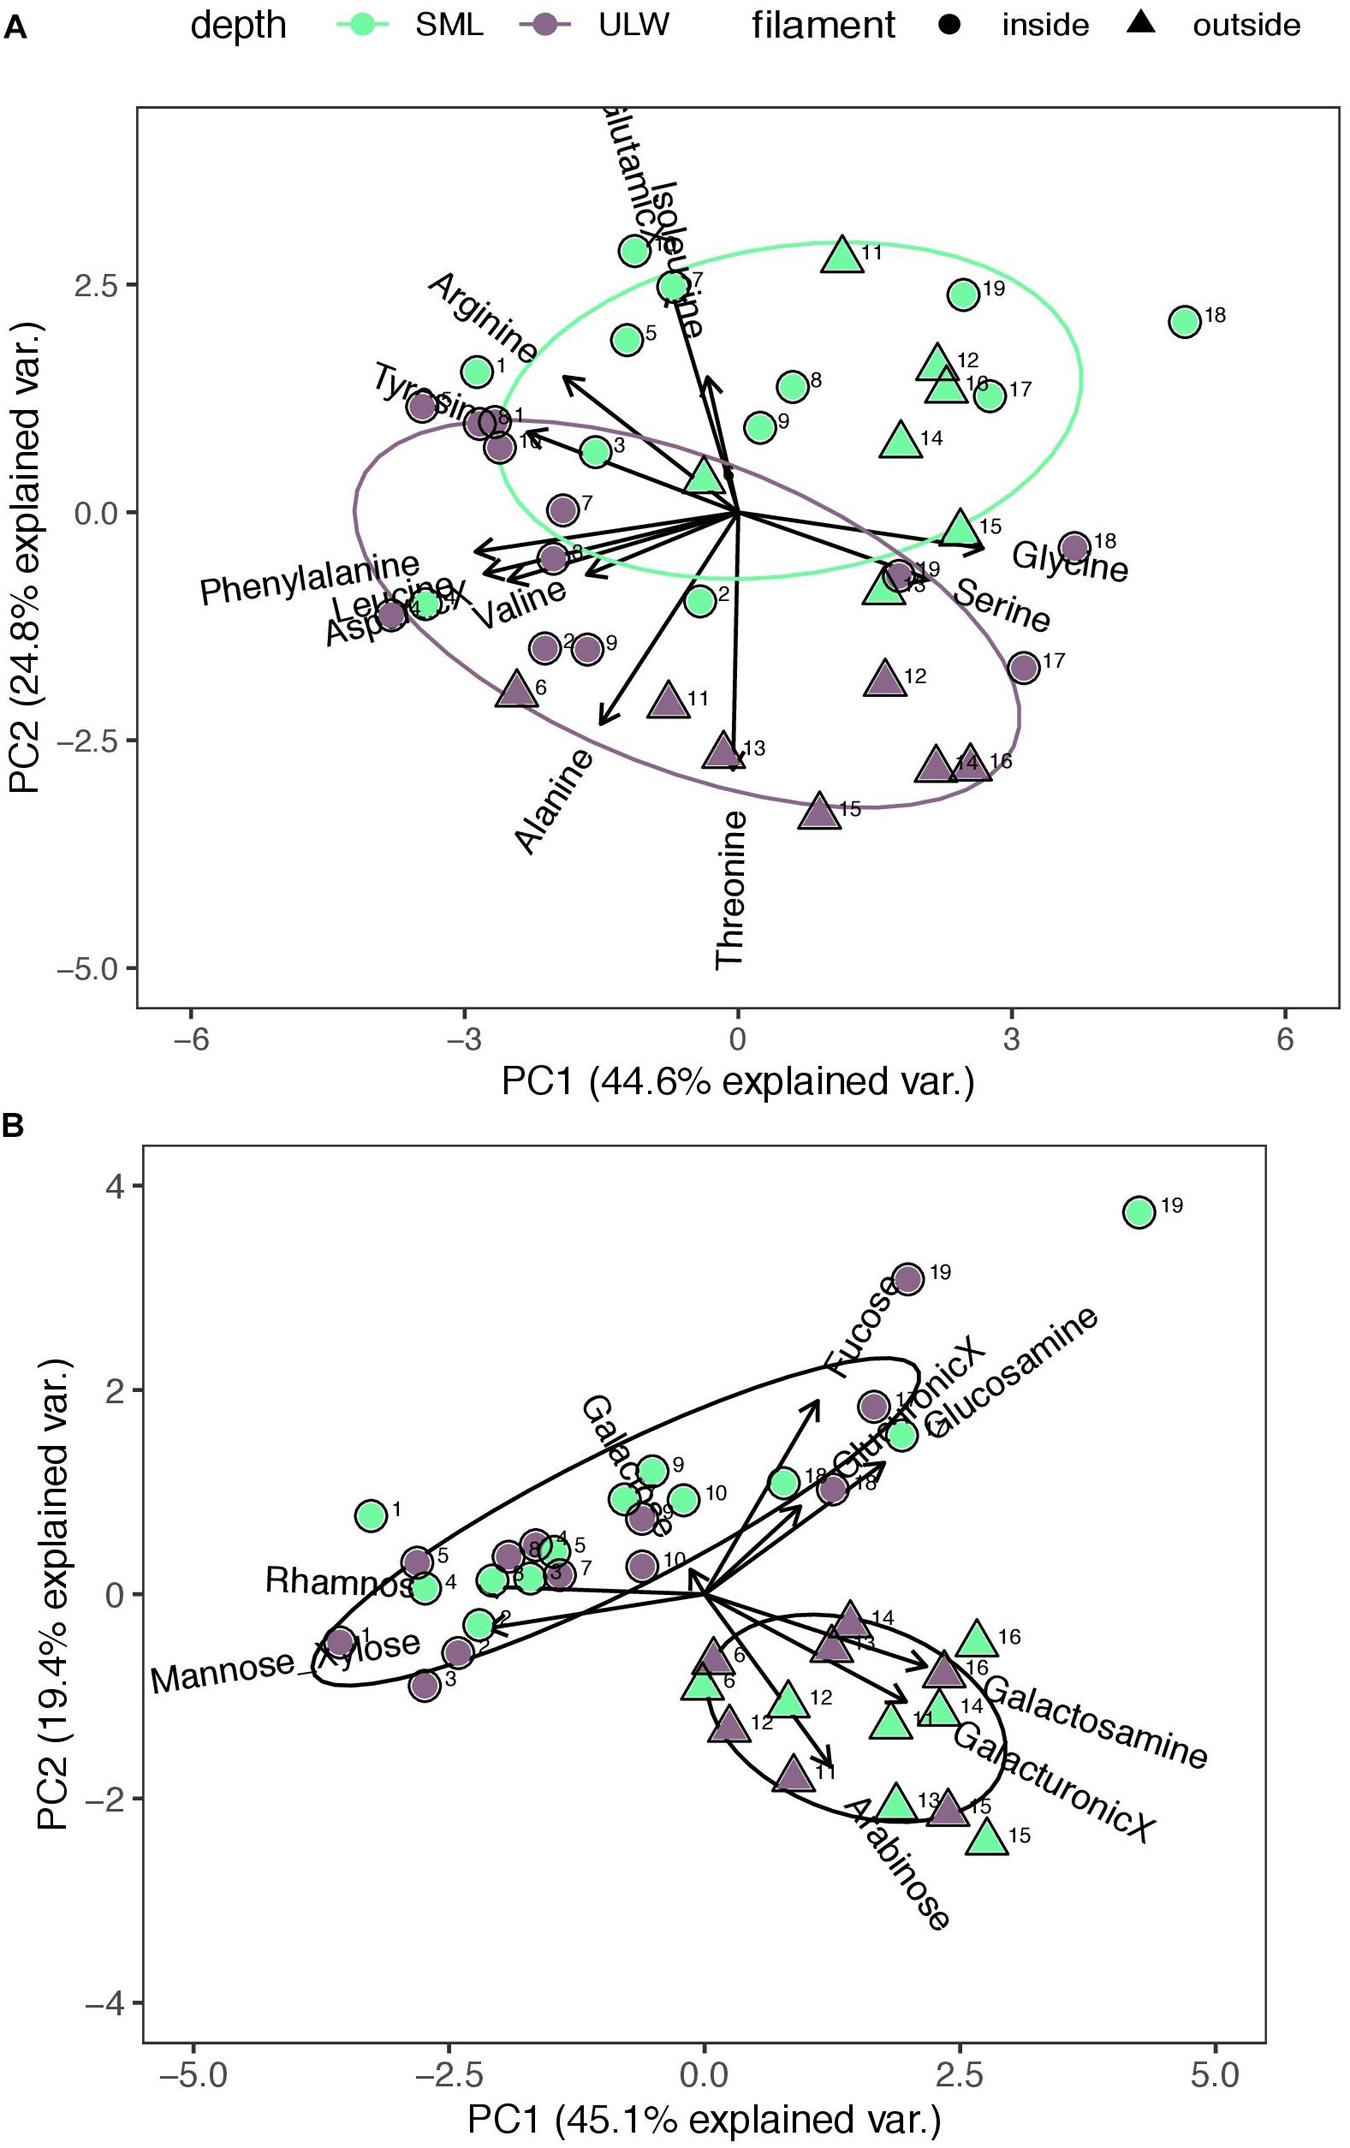
Figure 5. Principal Component Analysis (PCA) of (A) total hydrolysable amino acid (TAA) and (B) total combined carbohydrate (TCHO) composition (N = 38). Arrows indicate the relative molar contribution of TAA and TCHO. SML and ULW are represented by the colors green and gray, respectively. Circles and triangles represent the hydrological regime, i.e., inside and outside the filament.
Amino acids, in particular Arg and Glu, will be of further interest with regards to surface activity and thus are described in greater detail. Overall, TAA contributions to TOC ranged between 3.9 to 10.5%. Inside the filament, the molar fraction of Glu was elevated in the SML in comparison to the ULW (SML: 17.5 ± 1.8%Mol; ULW: 16.8 ± 2.1%Mol). This trend was manifested outside the filament, where Glu contributed 17.9 ± 2.6%Mol in the SML and only 13.7 ± 0.7%Mol in the ULW (Mann–Whitney U-test, p-value < 0.007, n = 14). Compositional changes in Arg occurred mainly across the filaments front as the SML TAA pool was composed of 4.1 ± 0.5%Mol inside in comparison to 3.8 ± 0.4%Mol outside. This trend was manifested in the ULW in which Arg contributed 4.2 ± 0.4%Mol inside and 3.6 ± 0.3%Mol outside the filament (Mann–Whitney U-test p-value < 0.004, n = 19).
The relative molar contributions of residual TCHO were dominated by Man/Xyl (37.5%Mol), followed by Gal (20.9%Mol) and Ara (1.37%Mol). Acidic sugars (GlcX and GalX) contributed a molar fraction of on average 9.6%Mol, while amino sugars (GlcN and GalN) contributed 12.2%Mol to residual TCHO concentration. The PCA of residual TCHO composition explained in total 64.5% of the observed variance. A clear separation into regimes became apparent in residual TCHO composition and was reflected on both PCA axes, i.e., PC1 and PC2 (Figure 5B). Stations were divided by the opposing sugars of Gal and Ara, characterizing the clusters of stations sampled inside and outside the filament, respectively. Between the SML and ULW, the composition of residual TCHO did not differ within the first two PCs but became perceptible in PC3 (Supplementary Figure S3B).
Degradation Index
Degradation indices were derived from the PCA of TAA. The PC1 reflects always the greatest variance in TAA composition and can be assumed as an imprint of organic matter degradation. DI are suggested to serve as the best indicator of intermediate degradation stages (Davis et al., 2009). Negative numbers indicate advanced degradation, while positive numbers refer to a fresher state of production. DI differed significantly across regimes in both depths as the degradation state inside and outside the filament was characterized by DI of on average + 1.87 ± 1.26 and –1.07 ± 1.48, respectively (Mann–Whitney U-test, SML: p-value < 0.002, n = 16; ULW: p-value < 0.001, n = 16) (Figure 3E). The last three stations inside the filament were considered outliers and thus excluded from the comparison. Degradation indices are analyzed and discussed in greater detail in the Supplementary Infromation Section 6.
Surface Activity and Potential Suppression of Gas Exchange
We examined surfactant concentration for correlations with biogenic compounds (Table 3). A positive correlation between TOC and surfactant concentration proved to be highly significant (Figure 6). The applied linear regression yielded significant results for the slope (Pearson Correlation r2 = 0.47, p-value < 0.001, SE ± 0.001, 36 DF, N = 38) and intercept (p-value < 0.002, SE ± 0.109) of the following model equation:
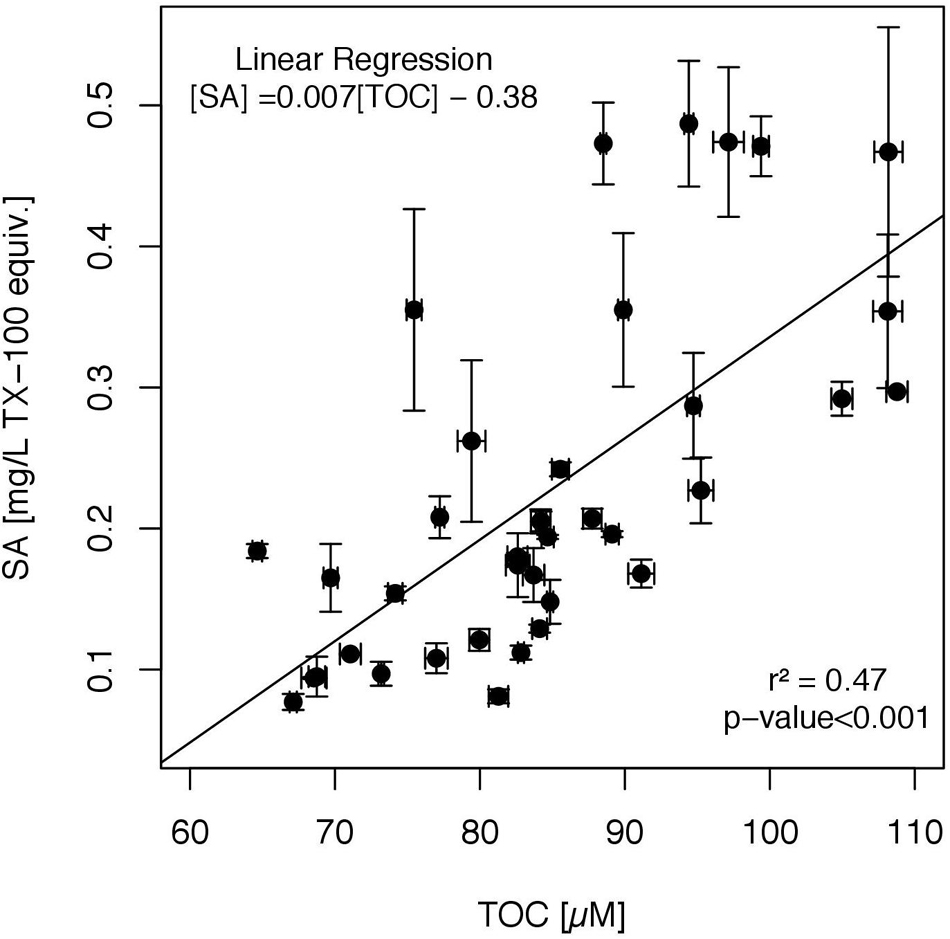
Figure 6. Linear regression model applied for the relation of surface activity (SA) to total organic carbon (TOC), including SML and ULW samples (N = 38). Whiskers represent the standard errors for SA and TOC.
A significant positive correlation of surfactant concentration was further observed for TAA, absolute Arg, Ile, and Glu concentrations (Table 3). The selective comparison of Arg, Glu and Ile was based upon their tendency to become enriched in the SML as indicated by the PCA. Neither residual TN nor residual TCHO and Glc exhibited significant correlations to surface activity (Table 3). Also, neither surfactant concentration nor TOC exhibited a correlation to satellite-derived Chl a concentration (data not shown).
The potential suppression of kw was estimated based on surfactant concentration in the SML. The empirical equation for surfactants suppression on kw has been derived by Pereira et al. (2018) (equation 5). SML surfactant concentration yielded a mean suppression of kw by 11.5% (±SE 1.0) inside and a mean suppression of 9.8% (±SE 2.2) outside the filament (Figure 7). As a regional comparison, we have calculated the potential suppression of kw using surface TOC concentrations measured along the trajectory of a permanent filament off Cape Juby and as published by Arístegui et al. (2004). TOC concentrations were measured at a depth of 5 m. To compensate for a pronounced TOC enrichment in the SML, an EFTOC of 1.2 was applied to correct TOC concentrations. Gas exchange could thus be dampened by approximately 17.2% (±SE 4.3), corresponding to an average estimated SML TOC concentration of 119 ± 38 μM within the permanent filament off Cape Juby.
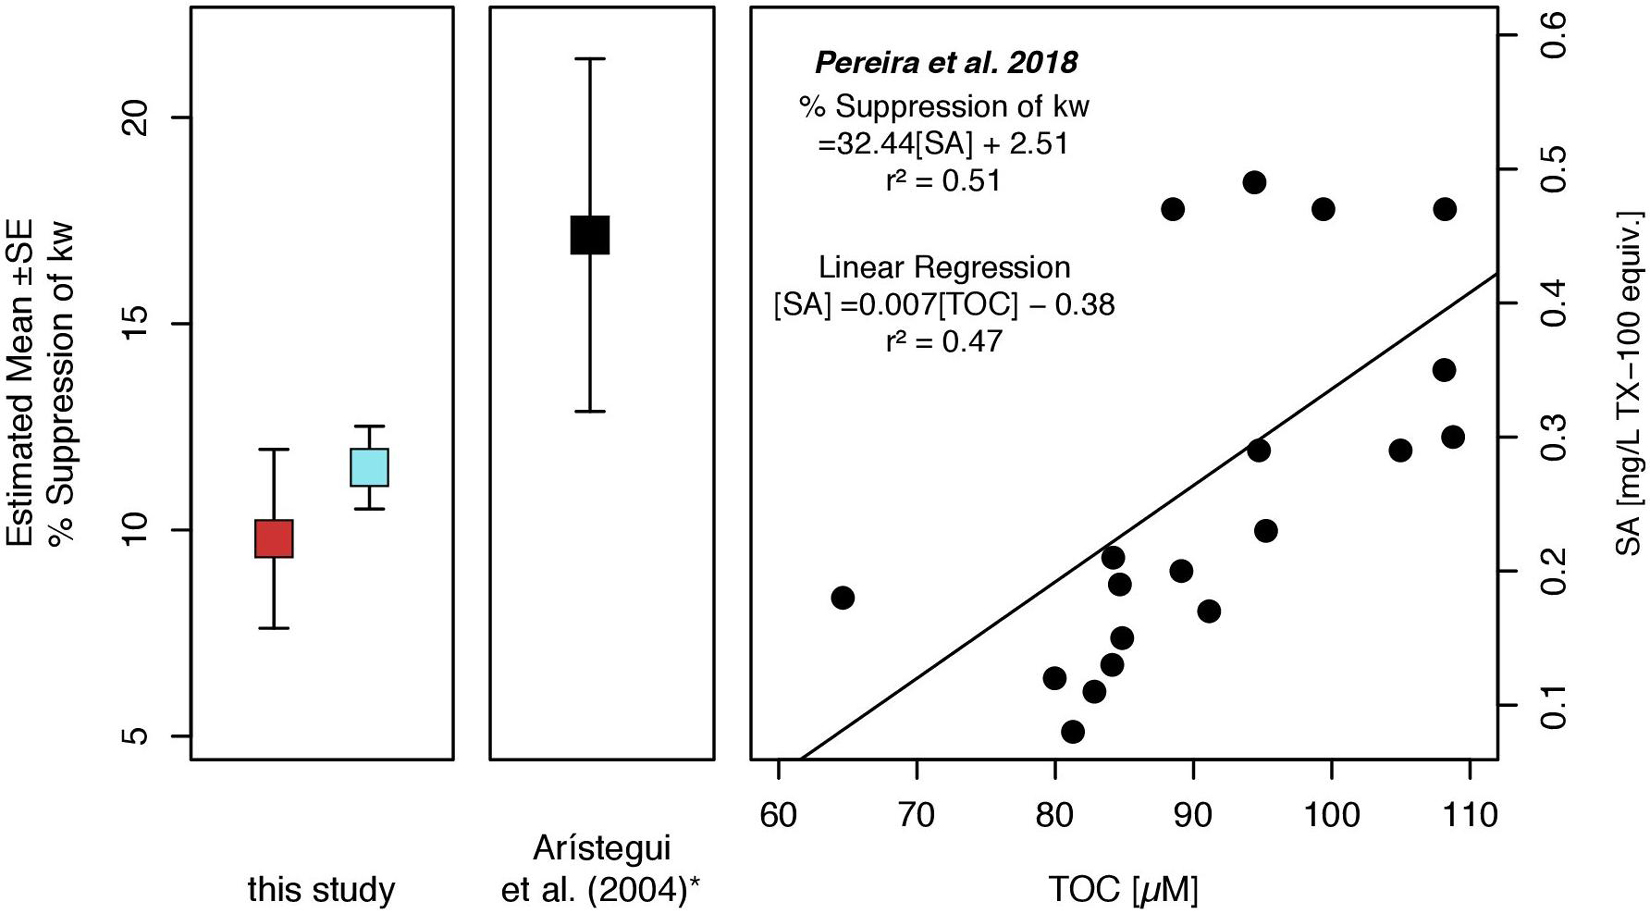
Figure 7. Suppression of the CO2 gas transfer coefficient (kW) as estimated for SML surfactant concentrations (SA). Suppression of kW was calculated by using the equation of Pereira et al. (2018). The linear regression model enables to predict the suppression of kW, if TOC surface measurements are available. (*) We included an estimation of kW suppression based on TOC concentrations measured in surface waters (5 m) along a zonal transect near Cape Juby (NW Africa) and within the trajectory of a permanent filament as an example (Arístegui et al., 2004). Squares indicate mean estimated suppression of kW for inside (blue) and outside (red) the filament and for the zonal transect (black). Whiskers represent the standard error of estimates.
Discussion
The Biogenic Signature of the Filament’s Edge
The temperature section across the filament edge revealed a sharp hydrological front within a few kilometer distances (Figure 2D). Temperature and salinity of surface waters can be considered as sensitive indicators of recently upwelled waters (Arístegui et al., 2004; Pelegrí et al., 2005; Zhang et al., 2015; Köhn et al., 2017). Across the filament’s front, DI indicate two successive stages of primary and secondary production (Davis et al., 2009): While inside the filament most recent and fresh organic matter production occurred, the organic matter outside the filament was more degraded. This was also reflected in relative carbohydrate composition. The PCA revealed two distinct clusters in which Gal and Ara directly opposed each other and thus marked the hydrological front also on a molecular level (Figure 5B). Organic matter rich in Gal was found to be rather fresh while the relative contribution of Ara has been shown to increase in the course of organic matter degradation (Hanamachi et al., 2008; Goldberg et al., 2009, 2010; Engel et al., 2012). Complementary, molecular carbohydrate composition could be the product of the observed shifts in the plankton community. The strongest difference between regimes occurred in the abundance of pico-CBL. Outside the filament, pico-CBL cell numbers increased by one order of magnitude in comparison to the inside of the filament. Pico-CBL cells enumerated here belonged to the genus Synechococcus spp., which is one of the most ubiquitous phytoplankton clades encountered in the world’s ocean and also in the Subtropical Atlantic Ocean (Zubkov et al., 2000; Marañón et al., 2001; Alonso-Laita and Agustí, 2006). Elevated Chl a concentration, however, proposed increased phytoplankton abundance inside the filament. Following the trend of higher abundance of nano-NCBL cells it is likely that micro-phytoplankton cells (>20 μm) could explain elevated Chl a concentration inside the filament. Micro-phytoplankton were not detected by flow cytometry but comprise fast-growing clades such as diatoms. This is in agreement with the observation that in proximity to the Canary Islands larger bloom-forming phytoplankton cells dominated in freshly upwelled waters, while being replaced by smaller phytoplankton cells further offshore (Arístegui et al., 2004). The difference in hydrological regimes was consolidated by the heterotrophic bacteria community. HNA bacteria contributed as much as 71.3% to total community counts inside the filament compared to 56.7% outside. Several studies have investigated the physiological and ecological value of discriminating between bacterial HNA and LNA cells. Most widely, HNA cells are considered to represent the active, growing fraction of bacterial communities, while LNA cells are thought to be stagnant in growth and rather inactive (Gasol and Del Giorgio, 2000; Lebaron et al., 2001; Servais et al., 2003). In the western Tropical Atlantic (Guanabana Bay), bacterial community structure was depending on locally available primary products. This was indicated by the tight linking between HNA bacterial abundance and productivity with Chl a concentration, which in turn was controlled by tidal upwelling events entraining nutrients (Andrade et al., 2003). Relative abundance of LNA cells, in contrast, shifted from lower toward higher contributions when approaching the open and oligotrophic ocean (Andrade et al., 2003; Arístegui et al., 2004). Bacterial abundance suggests therefore that active HNA bacteria dominated the community inside the filament, probably proliferating due to higher substrate availability. As filaments transport freshly entrained nutrients offshore (Nagai et al., 2015; Hosegood et al., 2017), the observed pattern can be interpreted as a direct response to underlying sub-mesoscale hydrology.
Organic Matter Components Enrich Differently in the Sea Surface Microlayer
High correlations of most of the parameters suggested a tight coupling between the SML and ULW. This implies that organic matter enrichment in the SML was generally relying on passive scavenging from the bulk by bubble or particle mediated transport (Cunliffe et al., 2013). Enrichment factors were considerably low with regards to TOC, TN and residual TCHO. In comparison, TAA, surfactants and Glc concentrations were particularly enriched in the SML. This must be either attributed to the chemical specification of molecules causing a preferable attachment onto rising bubbles or particles and/or related to processes that directly shape the molecular composition of the SML, i.e., without involving any bypass of the ULW. For surfactants, accumulation at the ocean’s surface lies in their chemical nature. The preferential enrichment of surfactants and amino acids will be discussed in greater detail in the section “Surface Activity Defined by Total OrganicCarbon and Total Amino Acids.” Glc enrichment could potentially arise from the unattenuated solar radiation autotrophic cells are exposed to within the SML as high levels of solar radiation may cause phytoneuston to shunt excess energy into producing storage compounds such as Glc (Hama and Handa, 1992; Biersmith and Benner, 1998; Subramanian et al., 2012; Becker et al., 2018). The considerable enrichment of TAA and Glc indicates further that organic matter in the SML was generally fresher (Biersmith and Benner, 1998; Amon et al., 2001; Davis et al., 2009). A tendency toward fresher material accumulating in the SML has been observed before (Kuznetsova and Lee, 2001; Zäncker et al., 2017; Engel et al., 2018). In this study, SML enrichment of organic matter was statistically insensitive to the encountered hydrological regimes. However, a trend toward higher enrichment outside the filament was apparent for most components of the organic matter pool. The observed trend agrees well with earlier observations showing that the enrichment of organic matter in the SML became more pronounced in the oligotrophic open ocean (Wurl et al., 2011; Zäncker et al., 2017). Zäncker et al. (2017) concluded that divergent enrichment factors across regimes arose from differences in SML organic matter concentration. We found that the trend toward higher enrichment outside the filament was manifested by differences in the ULW and was not merely caused by differences in SML concentrations.
Neuston Colonized Preferably the Sea Surface Microlayer Outside the Filament
The main resource of heterotrophic bacteria is fresh organic matter derived from phytoplankton production (Shen and Benner, 2019). The SML was enriched in fresh organic matter components as represented by Glc and TAA on both sides of the filament. However, bacterial neuston colonization only partly reflected these favorable conditions as HNA cells were just enriched in the SML outside the filament. This could be caused by a trade-off between substrate availability on one side and intense solar radiation, as received in the SML, on the other side: The reduced availability of substrate in the ULW outside the filament caused relatively higher enrichment of HNA cells in the SML despite the negative effects of solar radiation on bacteria (Aas et al., 1996; Herndl et al., 1997). The relative SML depletion of HNA cell inside the filament could thus have reflected a replenished pool of substrate in the ULW. Other factors could have resulted in HNA enrichment as well. For instance, simultaneous aggregate enrichment in the SML could have protected bacterial cells from UV radiation (Zäncker et al., 2017). In contrast to HNA cells, LNA cells were persistently enriched in the SML on both sides of the filament’s front. In general, solar radiation negatively affects bacterial activity (Aas et al., 1996; Herndl et al., 1997). Ramseier et al. (2011) investigated cell membrane damage of aquatic HNA and LNA bacteria by exposing them to specific oxidants and found that LNA cells were more resistant against damage. Therefore, solar radiation could have harmed active HNA cells rather than inactive LNA cells. This interpretation is in line with previous studies, suggesting that bacterioneuston community better withstands the influence of solar radiation (Santos et al., 2012a, b).
The high correlation between the SML and ULW indicates for most of the neuston organisms, including pico-phytoplankton and bacteria, that they were resupplied from the ULW. This is in accordance with the established hypothesis of recruitment which suggests that bubbles and particles, such as loosely entangled and buoyant gel matrices, serve as transport vehicles (Carlucci and Bezdek, 1972; Stefan and Szeri, 1999; Cunliffe et al., 2011; Mari et al., 2017). Contrastingly, the absence of a correlation for nano-phytoplankton cell abundance between depths suggests that they were rather unaffected by passive scavenging. The independent distribution of nano-phytoplankton between the SML and ULW is an established phenomenon (Joux et al., 2006; Montes-Hugo and Alvarez-Borrego, 2007). Nano-flagellates are known to contribute substantially to nano-phytoneuston (Hardy and Apts, 1984; Joux et al., 2006). Explanations vary, suggesting for example enhanced proliferation in or active migration to the SML due to favorable nutrient or grazing conditions (Lion and Leckie, 1981; Joux et al., 2006; Cunliffe et al., 2011). Certain flagellated taxa could thus benefit from an enriched SML. Notably, motile phytoplankton species exhibit divergent trends upon UV-light exposure reaching from no harm to avoidance and immobilization (Richter et al., 2007). Moreover, mixotrophy is common among previously thought obligate autotrophs. For instance, cryptophyta were identified as the major bacterivores among flagellates in a freshwater system (Grujcic et al., 2018) and are here summarized in the category of nano-CBL cells (Marie et al., 2010). Mixotrophic organisms have been shown to selectively graze on active and proliferating bacteria, as represented by HNA cells (Gasol et al., 1999). The SML enrichment of HNA cells outside the filament coincided thus with a pronounced enrichment of potentially bacterivorous nano-phytoneuston.
Surface Activity Defined by Total Organic Carbon and Total Amino Acids
This data set provides the first measurements of surface activity in the upwelling region off Mauritania. Significant differences in surfactant concentrations between the SML and ULW were established and concentrations were elevated inside the filament. In general, increased surface activity in the SML has been shown by several authors (Wurl et al., 2011; Pereira et al., 2016; Sabbaghzadeh et al., 2017; Pereira et al., 2018; Van Pinxteren et al., 2020). The mean surfactant concentration observed in this study (0.23 ± 0.12 mg TX-100 equiv. L–1) is within the range given by Sabbaghzadeh et al. (2017) for the Atlantic Ocean. In an oligotrophic region in proximity to the Cape Verde Islands, surface activity was considerably lower and ranged around 0.07 to 0.05 mg TX-100 equiv. L–1 for the SML and ULW, respectively, but only the dissolved fraction was assessed (Van Pinxteren et al., 2020). Wurl et al. (2011) reported SML surfactant concentration of 0.50 ± 0.33 mg TX-100 equiv. L–1 for wind speeds between 5 and 10 m sec–1(in comparison to a mean wind speed of 8.7 m sec–1 U10 in this study). During low wind regimes the authors observed even higher surfactant concentrations (Wurl et al., 2011).
Our results suggest that TAA controlled surface activity. SML-related amino acids were potentially uncoupled from the underlying hydrological regime as the SML and ULW maintained their molecular characteristics across the filaments front. The enrichment of amino acids in contrast to TCHO has been widely recognized and is explained by their intrinsic amphiphilic behavior, i.e., their preferable attachment onto surfaces (Gašparović and Ćosović, 2003; Kuznetsova et al., 2004). Within the pool of SML-related amino acids (namely Ile, Glu, and Arg as identified by the PCA) especially the basic amino acid Arg and the acidic amino acid Glu exhibited significant correlations to surface activity. Arg and Glu have previously been observed to selectively enrich the SML and sea foam (Kuznetsova and Lee, 2002; Momzikoff et al., 2004; Van Pinxteren et al., 2012; Engel et al., 2018). They are well-suited building blocks of biogenic surfactants and constitute the water-soluble head group of amphiphilic molecules (Infante et al., 2004; Bordes and Holmberg, 2015). Surfactants based on Glu are even more surface-active in the presence of divalent cations (Ca2+ and Mg2+). The required concentration range to increase surface activity matches precisely with the concentrations of divalent cations encountered in natural sea water (Bordes and Holmberg, 2015). Divalent cations presumably enable the formation of intermolecular chelates based on the exclusive three-carbon-long spacer between the carboxyl groups of Glu (Bordes and Holmberg, 2015). While Glu is non-essential, Arg is an essential amino acid, i.e., needs to be provided to the heterotrophic community by autotrophic production. Surfactants composed of Arg are most sensitive to microbial degradation (Infante et al., 2004). During our campaign, higher absolute concentrations and also a higher molar fraction of Arg were encountered inside the upwelling regime but Arg was only enriched in the SML outside. We attribute this to the divergent states of SML colonization. LNA bacteria were the only organisms that stood out from unity and thus heterotrophic consumption could have dominated in the SML inside the filament. Glu was persistently attracted to the air-sea interface as apparent from its relatively higher molar contribution. As a non-essential amino acid Glu was potentially unaffected by consumption inside and outside the filament likewise.
The surfactant pool was most significantly correlated to TOC concentration. Surface activity may be caused by dissolved and/or particulate molecules. In the Adriatic Sea, the particulate organic carbon (POC) fraction contributed generally less than 10% to surface activity. But during bloom conditions it increased and accounted for up to 20–55% of surface activity (Gašparović and Ćosović, 2003). Plavšić et al. (1990) reported that POC contributed on average 13% to surface activity. It is therefore likely that TOC predicts surface activity better than dissolved organic carbon (DOC) alone and in particular across regimes of different production stages. Our results suggest that within the oceanic TOC pool additional unidentified molecules exist which contributed to surface activity when leaving the identified fraction of amino acids aside. The most hydrophobic components of the TOC pool are lipids. Lipids were shown to contribute only ∼5% to the SML’s DOC pool, while they account for 10–30% of the SML POC (Cunliffe et al., 2013). This agrees well with the surface ocean reservoir of particulate lipids which contributed ∼20% to POC in the Equatorial Pacific (Benner and Amon, 2015). In comparison to amino acids and carbohydrates, lipids are more persistent to heterotrophic degradation (Benner and Amon, 2015) and therefore potentially accumulate also within the SML. Additionally, lipids could be constantly and selectively resupplied from the ULW due to their advantage in competitive absorption (Pogorzelski et al., 2006; Frka et al., 2012). Both processes are in agreement with results presented by Van Pinxteren et al. (2020) as lipid degradation products were enriched in the SML in the oligotrophic Atlantic Ocean. Lipids could have therefore stabilized apparent surface activity in particular outside the filament where the supply from fresher production has been limited.
The partitioning between DOC and POC to the TOC pool varies according to oceanic regimes and depths. In the Canary EBUS, Santana-Falcón et al. (2016) reported that POC substitutes ∼15%Mol to TOC in summer and integrated over the whole water column. Under oligotrophic conditions and in deeper waters, this ratio is likely to fall below ∼2%Mol (Kaiser and Benner, 2009). Lower absolute TOC concentrations along with declining POC/DOC ratios are signs of low primary production and advanced decay (Benner and Amon, 2015). Upwelled waters are the most pristine with regards to the imprint of previous biological activity as they are microbially depleted in organic matter and enriched in inorganic nutrients. DOC concentration of most recently upwelled waters thus corresponds to DOC concentrations encountered normally at greater depths. In the Mauritanian EBUS region deep water carried along DOC concentrations ranging from 50 to 60 μM only (Thomsen et al., 2019). Interestingly, the linear model suggests that when surface activity approaches zero the corresponding TOC concentration would be close to 54 μM. This hits also approximately the lower limit of TOC concentrations expected for the global surface ocean (Ogawa and Tanoue, 2003; Hansell and Carlson, 2015; Roshan and DeVries, 2017). The DOC fraction below this limit can be characterized as particularly resistant to microbial degradation, i.e., as most refractory (Benner and Amon, 2015). An increase in the surface ocean TOC pool and its variability must therefore reflect fresh production and the subsequent lowest and intermediate stages of organic matter degradation. Consequently, the correlation of surface activity to TOC excludes most refractory sources as surfactant components. Fresh production likely caused apparent surface activity to increase inside the recently upwelled filament and, by trend, even outpaced the surfactant pool of intermediate degradation products present outside. The role of fresh TAA on surface activity might thus be pronounced or precluded depending on the sub-mesoscale regime and following the hypothesis of competitive adsorption. Concomitantly, a more resistant lipid fraction could substitute the apparent surfactant pool, especially outside the filament.
We were able to derive a conversion factor for TOC to surfactant concentration and thus present a key to predict surface activity in oceanic waters and across different hydrological regimes. It should be emphasized that the conversion to TOC potentially contributes to a more robust and conservative estimation of the suppression of kw as SML surfactant concentrations exhibited large variation, explicitly outside the filament (relative SD around the sample mean: 79%, n = 7). In comparison and for the same subgroup, TOC exhibited a relative SD of only 6%. Large variation in surface activity could be caused by specific labile components that exhibit only a transient and local effect on surface activity (e.g., certain amino-acid-based surfactants as discussed above). This would lead to only small shifts in overall TOC concentration. It should be kept in mind that cell lysis upon freezing and thawing of samples and oxidation of most labile components could affect apparent surfactant and TOC concentrations, respectively. The linear relationship was derived from open ocean samples where surfactants and TOC likely originated from primary production. Most certainly, it does not hold in coastal environments as coastal seas are greatly affected by terrestrial run-off and anthropogenic activity, which can alter the surfactant pool (Cuscov and Muller, 2015; Wurl et al., 2017; Shaharom et al., 2018).
Potential Suppression of Gas Exchange
To estimate the suppression of gas exchange, we applied the empirical equation provided by Pereira et al. (2018). Surfactant concentrations, on which the respective equation was based, ranged between 0.15 and 0.77 mg TX-100 equiv. L–1 and thus corresponded well to the range of surfactants measured in this study. Surfactants concentration differed across the front by trend but this difference was manifested in significantly different TOC concentrations. It should be noted that the here presented estimates on gas exchange suppression were based on tank experiments and do not represent natural oceanic conditions. The suppression of kw was calculated to be slightly higher inside (11.5%) than outside the filament (9.8%) (Figure 7). For the filament off Cape Juby, a mean suppression of kw of 17.2% was calculated, which reflects the impact of surface ocean productivity on the spatial variability of kw in the Mauritanian EBUS. TOC and surfactant concentration could also be expected to co-vary with filament progression. Starting as a freshly upwelled parcel, filaments are ultimately subject to decay, which is marked by increased cross-frontal mixing with adjacent waters (Zhang et al., 2015; Hosegood et al., 2017). This consideration adds an interesting temporal dimension as it suggests that during filament evolution and concomitant biological activity surfactant concentration successively increases and only declines when adjusting to ambient conditions. Our data therewith indicate that surfactants can potentially reduce the outgassing of CO2 and other greenhouse gases from freshly upwelled water parcels.
Our estimates agree well with previously published data. In the coastal waters of the North Sea, CO2 exchange was suppressed by 15–24% (Pereira et al., 2016). Yang et al. (2021) reported most recently that CO2 gas transfer velocity and its dependence on wind speed varied by 30% in the Southern Ocean. They related this to surface ocean turbulence which was modulated by surfactants. Pereira et al. (2018) suggested that surfactants suppress CO2 gas exchange by 2 up to 32% in the Atlantic Ocean. Tsai and Liu (2003) proposed a modeled reduction of 20 to 50% for the global annual CO2 net flux and based on Chl a as a proxy for surfactant coverage. In a wind-wave tank experiment Ribas-Ribas et al. (2018) measured a considerable suppression of CO2 flux velocity ranging from 46 to 63% and up to a wind speed of 8.5 m sec–1. At higher wind speeds the correlation between surfactant concentration and a reduction in flux velocity weakened. Suppression was caused by natural surfactants, however, much higher concentrated than in our study. Our lower estimates on suppression of gas exchange seem thus reasonable as we encountered only moderate amounts of surfactants in comparison to other studies and sampled at a rather high mean ambient wind speed of 8.7 m sec–1 (U10).
The impact of surfactants on gas exchange is particularly relevant for EBUS. Kock et al. (2012) calculated that surfactants are responsible for the common overestimation of nitrous oxide gas efflux in the Mauritanian upwelling region. In line with this, Köhn et al. (2017) observed that outgassing from a cold and recently upwelled front rapidly declined. While outgassing was negatively correlated to temperature in the first hours, this correlation weakened likely due to the strengthening of counteracting biological activity. For various oceanic regimes, Calleja et al. (2009) recorded that TOC concentration explained the discrepancy in measured and calculated CO2 gas flux velocities across the air-sea interface and concluded that surfactants within the TOC pool must have dampened surface turbulence. They further observed that TOC concentrations co-vary with marine primary production, which is in accordance with our study. This further underlines that the here derived relationship is of major importance and may help to predict the influence of surfactants on air-sea gas exchange not only in EBUS but also in other oceanic regimes.
Conclusion
Differences in organic matter concentration and molecular composition in the SML can exist on the sub-mesoscale, as demonstrated here for an upwelling filament. The enrichment of organic matter in the SML is particularly influenced by the specificity of the organic matter classes, e.g., a pronounced enrichment of the SML was observed for surfactant and TAA concentrations. Surface activity depends on TAA and TOC concentrations and is enhanced by biological production and accumulation of semi-labile substances, while refractory components of the TOC pool are rather of minor importance. The empirical relationship between TOC and surfactant concentrations found here can thus help to estimate surface activity in different oceanic regimes. In the future, the validity of this model needs to be tested for other oceanic provinces. The estimated suppression of gas exchange by surfactants in upwelling filaments is particularly relevant for EBUS as upwelled deep water is supersaturated with greenhouse gases.
Data Availability Statement
The datasets presented in this study can be found in online repositories. The names of the repository/repositories and accession number(s) can be found below: PANGAEA, https://doi.pangaea.de/10.1594/PANGAEA.918275.
Author Contributions
TB conducted the writing, collections of samples, and data analysis of all biogenic parameters. FS provided the discrete and remote hydrological data of the filament and the analysis of such. AE supervised. FS and AE edited the manuscript. All the authors contributed to the article and approved the submitted version.
Funding
This work was supported by the Helmholtz Association, the cluster of future ocean Kiel Marine Sciences 2017 and by the Bundesministerium für Bildung und Forschung as part of the NextG-Climate Science-EUREC4A-OA project.
Conflict of Interest
The authors declare that the research was conducted in the absence of any commercial or financial relationships that could be construed as a potential conflict of interest.
Publisher’s Note
All claims expressed in this article are solely those of the authors and do not necessarily represent those of their affiliated organizations, or those of the publisher, the editors and the reviewers. Any product that may be evaluated in this article, or claim that may be made by its manufacturer, is not guaranteed or endorsed by the publisher.
Acknowledgments
We are very thankful to the chief scientist Tobias Steinhoff who encouraged us to join the POS519 cruise and made an extensive sampling plan of the SML possible. Melf Paulsen invested several hours a day in assisting by lowering and recovering the screen sampler from the bow of the RV Poseidon. Further, we would like to thank the crew of the RVPoseidon for their commitment. We would like to thank Tania Klüver, Jon Roa, and Ruth Flerus, who analyzed a considerable part of the samples presented here. We also thank Javier Arístegui for the kind provision of TOC data from his campaign in 2004. The study contributes to the international SOLAS program. Measurements of all biogeochemical parameters were executed at Geomar Helmholtz Centre for Ocean Research, Kiel.
Supplementary Material
The Supplementary Material for this article can be found online at: https://www.frontiersin.org/articles/10.3389/fmars.2021.718384/full#supplementary-material
Footnotes
References
Aas, P., Lyons, M. M., Pledger, R., Mitchell, D. L., and Jeffrey, W. H. (1996). Inhibition of Bacterial Activities by Solar Radiation in Nearshore Waters and the Gulf of Mexico. Aquatic Microb. Ecol. 11, 229–238. doi: 10.3354/ame011229
Agogué, H., Casamayor, E. O., Bourrain, M., Obernosterer, I., Joux, F., Herndl, G. J., et al. (2005). A Survey on Bacteria Inhabiting the Sea Surface Microlayer of Coastal Ecosystems. FEMS Microb. Ecol. 54, 269–280. doi: 10.1016/j.femsec.2005.04.002
Alonso-Laita, P., and Agustí, S. (2006). Contrasting Patterns of Phytoplankton Viability in the Subtropical NE Atlantic Ocean. Aquat. Microb. Ecol. 43, 67–78. doi: 10.3354/ame043067
Amon, R. M. W., Fitznar, H. P., and Benner, R. (2001). Linkages among the Bioreactivity, Chemical Composition, and Diagenetic State of Marine Dissolved Organic Matter. Limnol. Oceanogr. 46, 287–297. doi: 10.4319/lo.2001.46.2.0287
Andrade, L., Gonzalez, A. M., Araujo, F. V., and Paranhos, R. (2003). Flow Cytometry Assessment of Bacterioplankton in Tropical Marine Environments. J. Microbiol. Methods 55, 841–850. doi: 10.1016/j.mimet.2003.08.002
Archer, C. L., and Jacobson, M. Z. (2005). Evaluation of Global Wind Power. J. Geophys. Res. D 110, 1–20. doi: 10.1029/2004JD005462
Arístegui, J., Barton, E. D., Tett, P., Montero, M. F., García-Muñoz, M., Basterretxea, G., et al. (2004). Variability in Plankton Community Structure, Metabolism, and Vertical Carbon Fluxes along an Upwelling Filament (Cape Juby, NW Africa). Progr. Oceanogr. 62, 95–113. doi: 10.1016/j.pocean.2004.07.004
Becker, K. W., Collins, J. R., Durham, B. P., Groussman, R. D., White, A. E., Fredricks, H. F., et al. (2018). Daily Changes in Phytoplankton Lipidomes Reveal Mechanisms of Energy Storage in the Open Ocean. Nat. Comm. 9:1. doi: 10.1038/s41467-018-07346-z
Benner, R., and Amon, R. M. W. (2015). The Size-Reactivity Continuum of Major Bioelements in the Ocean. Ann. Rev Mar. Sci. 7, 185–205. doi: 10.1146/annurev-marine-010213-135126
Biersmith, A., and Benner, R. (1998). Carbohydrates in Phytoplankton and Freshly Produced Dissolved Organic Matter. Mar. Chem. 63, 131–144. doi: 10.1016/S0304-420300057-7
Bordes, R., and Holmberg, K. (2015). Amino Acid-Based Surfactants - Do They Deserve More Attention? Adv. Coll. Interf. Sci. 222, 79–91. doi: 10.1016/j.cis.2014.10.013
Brady, R. X., Lovenduski, N. S., Alexander, M. A., Jacox, M., and Gruber, N. (2019). On the Role of Climate Modes in Modulating the Air-Sea CO2 Fluxes in Eastern Boundary Upwelling Systems. Biogeosciences 16, 329–346. doi: 10.5194/bg-16-329-2019
Broecker, H. C., Petermann, J., and Siems, W. (1978). Influence of Wind on CO2-Exchange in a Wind-Wave Tunnel, Including Effects of Monolayers. J. Mar. Res. 36, 595–610.
Calleja, M. Ll, Duarte, C. M., Álvarez, M., Vaquer-Sunyer, R., Agustí, S., and Herndl, G. J. (2013). Prevalence of Strong Vertical CO2 and O2 Variability in the Top Meters of the Ocean. Glob. Biogeochem. Cycles 27, 941–949. doi: 10.1002/gbc.20081
Calleja, M. Ll, Duarte, C. M., Navarro, N., and Agustí, S. (2005). Control of Air-Sea CO2 Disequilibria in the Subtropical NE Atlantic by Planktonic Metabolism under the Ocean Skin. Geophys. Res. Lett. 32, 1–4. doi: 10.1029/2004GL022120
Calleja, M. Ll, Duarte, C. M., Prairie, Y. T., Agustí, S., and Herndl, G. J. (2009). Evidence for Surface Organic Matter Modulation of Air-Sea CO2 Gas Exchange. Biogeosci. Dis. 6, 1105–1114. doi: 10.5194/bgd-5-4209-2008
Carlucci, A. F., and Bezdek, H. F. (1972). On the Effectiveness of a Bubble for Scavenging Bacteria from Sea Water. J. Geophys. Res. 77, 6608–6610. doi: 10.1029/jc077i033p06608
Carr, M. E., and Kearns, E. J. (2003). Production Regimes in Four Eastern Boundary Current Systems. Deep-Sea Res. Part II 50, 3199–3221. doi: 10.1016/j.dsr2.2003.07.015
Ćosović, B., and Vojvodić, V. (1982). The Application of Ac Polarography to the Determination of Surface−active Substances in Seawater. Limnol Oceanogr. 27, 361–369. doi: 10.4319/lo.1982.27.2.0361
Ćosović, B., and Vojvodić, V. (1998). Voltammetric Analysis of Surface Active Substances in Natural Seawater. Electroanalysis 10, 429–434. doi: 10.1002/(SICI)1521-4109(199805)10:6<429::AID-ELAN429<3.0.CO;2-7
Croot, P. L., Passow, U., Assmy, P., Jansen, S., and Strass, V. H. (2007). Surface Active Substances in the Upper Water Column during a Southern Ocean Iron Fertilization Experiment (EIFEX). Geophys. Res. Lett. 34, 1–5. doi: 10.1029/2006GL028080
Cunliffe, M., Engel, A., Frka, S., Gašparović, B. Ž, Guitart, C., Murrell, J. C., et al. (2013). Sea Surface Microlayers: A Unified Physicochemical and Biological Perspective of the Air-Ocean Interface. Prog. Oceanogr. 109, 104–116. doi: 10.1016/j.pocean.2012.08.004
Cunliffe, M., Upstill-Goddard, R. C., and Murrell, J. C. (2011). Microbiology of Aquatic Surface Microlayers. FEMS Microb. Rev. 35, 233–246. doi: 10.1111/j.1574-6976.2010.00246.x
Cunliffe, M., and Wurl, O. (2014). Guide to Best Practices to Study the Ocean’s Surface. Occas. Publicat. Mar. Biol. Assoc. UK 2014:1512. doi: 10.25607/OBP-1512
Cuscov, M., and Muller, F. L. L. (2015). Differentiating Humic and Algal Surface Active Substances in Coastal Waters by Their PH-Dependent Adsorption Behaviour. Mar. Chem. 174, 35–45. doi: 10.1016/j.marchem.2015.05.002
Dauwe, B., and Middelburg, J. J. (1998). Amino Acids and Hexosamines as Indicators of Organic Matter Degradation State in North Sea Sediments. Limnol. Oceanogr. 43, 782–798. doi: 10.4319/lo.1998.43.5.0782
Dauwe, B., Middelburg, J. J., Herman, P. M. J., and Heip, C. H. R. (1999). Linking Diagenetic Alteration of Amino Acids and Bulk Organic Matter Reactivity. Limnol. Oceanogr. 44, 1809–1814. doi: 10.4319/lo.1999.44.7.1809
Davis, J., Kaiser, K., and Benner, R. (2009). Amino Acid and Amino Sugar Yields and Compositions as Indicators of Dissolved Organic Matter Diagenesis. Org. Geochem. 40, 343–352. doi: 10.1016/j.orggeochem.2008.12.003
Dittmar, T., Paeng, J., and Ludwichowski, K.-U. (2009). “The Analysis of Amino Acids in Seawater,” in Practical Guidelines for the Analysis of Seawater, ed. O. Wurl (Clermont: CRC Press).
Drozdowska, V., Kowalczuk, P., Konik, M., and Dzierzbicka-Glowacka, L. (2018). Study on Different Fractions of Organic Molecules in the Baltic Sea Surface Microlayer by Spectrophoto- and Spectrofluorimetric Methods. Front. Mar. Sci. 5, 1–12. doi: 10.3389/fmars.2018.00456
Engel, A., Bange, H. W., Cunliffe, M., Burrows, S. M., Friedrichs, G., Galgani, L., et al. (2017). The Ocean’s Vital Skin: Toward an Integrated Understanding of the Sea Surface Microlayer. Front. Mar. Sci. 4, 1–14. doi: 10.3389/fmars.2017.00165
Engel, A., and Galgani, L. (2016). The Organic Sea-Surface Microlayer in the Upwelling Region off the Coast of Peru and Potential Implications for Air–Sea Exchange Processes. Biogeosciences 13, 989–1007. doi: 10.5194/bg-13-989-2016
Engel, A., and Händel, N. (2011). A Novel Protocol for Determining the Concentration and Composition of Sugars in Particulate and in High Molecular Weight Dissolved Organic Matter (HMW-DOM) in Seawater. Mar. Chem. 127, 180–191. doi: 10.1016/j.marchem.2011.09.004
Engel, A., Piontek, J., and Chou, L. (2012). Contribution of Combined Carbohydrates to Dissolved and Particulate Organic Carbon after the Spring Bloom in the Northern Bay of Biscay (North-Eastern Atlantic Ocean). Bibliogr. Inform. 45, 42–53. doi: 10.1016/j.csr.2012.05.016
Engel, A., Sperling, M., Sun, C., Grosse, J., and Friedrichs, G. (2018). Organic Matter in the Surface Microlayer: Insights from a Wind Wave Channel Experiment. Front. Mar. Sci. 5:182. doi: 10.3389/fmars.2018.00182
Falkowska, L. (1999). Sea Surface Microlayer: A Field Evaluation of Teflon Plate, Glass Plate and Screen Sampling Techniques. Part 1. Thickness of Microlayer Samples and Relation to Wind Speed. Oceanologia 41, 211–221.
Frew, N. M. (1997). “The Role of Organic Films in Air-Sea Gas Exchange,” in The Sea Surface and Global Change, eds P. Liss and R. Duce (New York, NY: Cambridge Univ. Press), 121–172.
Frew, N. M., Goldman, J. C., Dennett, M. R., and Sherwood Johnson, A. (1990). Impact of Phytoplankton-Generated Surfactants on Air-Sea Gas Exchange. J. Geophys. Res. 95:3337. doi: 10.1029/jc095ic03p03337
Frka, S., Pogorzelski, S., Kozarac, Z., and Ćosović, B. (2012). Physicochemical Signatures of Natural Sea Films from Middle Adriatic Stations. J. Phys. Chem. A 116, 6552–6559. doi: 10.1021/jp212430a
Garrett, W. D. (1965). Collection of Slick-Forming Materials from the Sea Surface Microlayer. Limnol. Oceanogr. 10, 602–605. doi: 10.4319/lo.1965.10.4.0602
Gasol, J. M., and Del Giorgio, P. A. (2000). Using Flow Cytometry for Counting Natural Planktonic Bacteria and Understanding the Structure of Planktonic Bacterial Communities. Sci. Mar. 64, 197–224. doi: 10.3989/scimar.2000.64n2197
Gasol, J. M., Zweifel, U. L., Peters, F., Fuhrman, J. A., and Hagström, A. (1999). Significance of Size and Nucleic Acid Content Heterogeneity as Measured by Flow Cytometry in Natural Planktonic Bacteria. Appl Env. Microb. 65, 4475–4483. doi: 10.1128/aem.65.10.4475-4483.1999
Gašparović, B., and Ćosović, B. (2003). Surface-Active Properties of Organic Matter in the North Adriatic Sea. Est. Coast. Shelf Sci. 58, 555–566. doi: 10.1016/S0272-771400133-1
Goldberg, S. J., Carlson, C. A., Bock, B., Nelson, N. B., and Siegel, D. A. (2010). Meridional Variability in Dissolved Organic Matter Stocks and Diagenetic State within the Euphotic and Mesopelagic Zone of the North Atlantic Subtropical Gyre. Mar. Chem. 119, 9–21. doi: 10.1016/j.marchem.2009.12.002
Goldberg, S. J., Carlson, C. A., Hansell, D. A., Nelson, N. B., and Siegel, D. A. (2009). Temporal Dynamics of Dissolved Combined Neutral Sugars and the Quality of Dissolved Organic Matter in the Northwestern Sargasso Sea. Deep-Sea Res. I 56, 672–685. doi: 10.1016/j.dsr.2008.12.013
Goldman, J. C., Dennett, M. R., and Frew, N. M. (1988). Surfactant Effects on Air-Sea Gas Exchange under Turbulent Conditions. Deep Sea Res. Part A, Oceanogr. Res. Papers 35, 1953–1970. doi: 10.1016/0198-014990119-7
Gruber, N. (2015). Ocean Biogeochemistry: Carbon at the Coastal Interface. Nature 517, 148–149. doi: 10.1038/nature14082
Gruber, N., Lachkar, Z., Frenzel, H., Marchesiello, P., Münnich, M., McWilliams, J. C., et al. (2011). Eddy-Induced Reduction of Biological Production in Eastern Boundary Upwelling Systems. Nature Geoscience 4, 787–792. doi: 10.1038/ngeo1273
Grujcic, V., Nuy, J. K., Salcher, M. M., Shabarova, T., Kasalicky, V., Boenigk, J., et al. (2018). Cryptophyta as Major Bacterivores in Freshwater Summer Plankton. ISME J. 12, 1668–1681. doi: 10.1038/s41396-018-0057-5
Hama, J., and Handa, N. (1992). Diel Variation of Water-Extractable Carbohydrate Composition of Natural Phytoplankton Populations in Kinu-Ura Bay. J. Exp. Mar. Biol. Ecol. 162, 159–176. doi: 10.1016/0022-098190199-K
Hanamachi, Y., Hama, T., and Yanai, T. (2008). Decomposition Process of Organic Matter Derived from Freshwater Phytoplankton. Limnology 9, 57–69. doi: 10.1007/s10201-007-0232-2
Hansell, D. A., and Carlson, C. A. (2015). Dissolved Organic Matter in the Ocean Carbon Cycle. Eos 96, 8–12. doi: 10.1029/2015eo033011
Hardy, J. T., and Apts, C. W. (1984). The Sea-Surface Microlayer: Phytoneuston Productivity and Effects of Atmospheric Particulate Matter. Mar. Biol. 82, 293–300. doi: 10.1007/BF00392409
Hernández-Hernández, N., Arístegui, J., Montero, M. F., Velasco-Senovilla, E., Baltar, F., Marrero-Díaz, A., et al. (2020). Drivers of Plankton Distribution Across Mesoscale Eddies at Submesoscale Range. Front. Mar. Sci. 7, 1–13. doi: 10.3389/fmars.2020.00667
Herndl, G. J., Brugger, A., Hager, S., Kaiser, E., Obernosterer, I., Reitner, B., et al. (1997). Role of Ultraviolet-B Radiation on Bacterioplankton and the Availability of Dissolved Organic Matter. Plant Ecol. 128, 43–51. doi: 10.1007/978-94-011-5718-6_4
Hosegood, P. J., Nightingale, P. D., Rees, A. P., Widdicombe, C. E., Woodward, E. M. S., Clark, D. R., et al. (2017). Nutrient Pumping by Submesoscale Circulations in the Mauritanian Upwelling System. Progr. Oceanogr. 159, 223–236. doi: 10.1016/j.pocean.2017.10.004
Infante, M. R., Pérez, L., Pinazo, A., Clapés, P., Morán, M. C., Angelet, M., et al. (2004). Amino Acid-Based Surfactants. Comptes Rendus Chimie 7, 583–592. doi: 10.1016/j.crci.2004.02.009
Jenkinson, I. R., Seuront, L., Ding, H., and Elias, F. (2018). Biological Modification of Mechanical Properties of the Sea Surface Microlayer, Influencing Waves, Ripples, Foam and Air-Sea Fluxes. Elementa 6:26. doi: 10.1525/elementa.283
Joux, F., Agogué, H., Obernosterer, I., Dupuy, C., Reinthaler, T., Herndl, G. J., et al. (2006). Microbial Community Structure in the Sea Surface Microlayer at Two Contrasting Coastal Sites in the Northwestern Mediterranean Sea. Aquat. Microb. Ecol. 42, 91–104. doi: 10.3354/ame042091
Kaiser, K., and Benner, R. (2009). Biochemical Composition and Size Distribution of Organic Matter at the Pacific and Atlantic Time-Series Stations. Mar. Chem. 113, 63–77. doi: 10.1016/j.marchem.2008.12.004
Kock, A., Gebhardt, S., and Bange, H. W. (2008). Methane Emissions from the Upwelling Area off Mauritania (NW Africa). Geophys. Res. Lett. 5, 1119–1125. doi: 10.1029/2010GL042442
Kock, A., Schafstall, J., Dengler, M., Brandt, P., and Bange, H. W. (2012). Sea-to-Air and Diapycnal Nitrous Oxide Fluxes in the Eastern Tropical North Atlantic Ocean. Biogeosciences 9, 957–964. doi: 10.5194/bg-9-957-2012
Köhn, E. E., Thomsen, S., Arévalo-Martínez, D. L., and Kanzow, T. (2017). Submesoscale CO2 Variability across an Upwelling Front off Peru. Ocean Sci. 13, 1017–1033. doi: 10.5194/os-13-1017-2017
Kurata, N., Vella, K., Hamilton, B., Shivji, M., Soloviev, A., Matt, S., et al. (2016). Surfactant-Associated Bacteria in the near-Surface Layer of the Ocean. Sci. Rep. 6:19123. doi: 10.1038/srep19123
Kuznetsova, M., and Lee, C. (2001). Enhanced Extracellular Enzymatic Peptide Hydrolysis in the Sea-Surface Microlayer. Mar. Chem. 73, 319–332. doi: 10.1016/S0304-420300116-X
Kuznetsova, M., and Lee, C. (2002). Dissolved Free and Combined Amino Acids in Nearshore Seawater, Sea Surface Microlayers and Foams: Influence of Extracellular Hydrolysis. Aqu. Sci. 64, 252–268. doi: 10.1007/s00027-002-8070-0
Kuznetsova, M., Lee, C., Aller, J., and Frew, N. (2004). Enrichment of Amino Acids in the Sea Surface Microlayer at Coastal and Open Ocean Sites in the North Atlantic Ocean. Limnol. Oceanogr. 49, 1605–1619. doi: 10.4319/lo.2004.49.5.1605
Large, W. G., and Pond, S. (1981). Open Ocean Momentum Flux Measure- Ments in Moderate to Strong Winds. J. Phys. Oceanogr. 10, 709–726.
Laß, K., Bange, H. W., and Friedrichs, G. (2013). Seasonal Signatures in SFG Vibrational Spectra of the Sea Surface Nanolayer at Boknis Eck Time Series Station (SW Baltic Sea). Biogeosciences 10, 5325–5334. doi: 10.5194/bg-10-5325-2013
Lebaron, P., Servais, P., Agogué, H., Courties, C., and Joux, F. (2001). Does the High Nucleic Acid Content of Individual Bacterial Cells Allow Us to Discriminate between Active Cells and Inactive Cells in Aquatic Systems? Appl. Env. Microb. 67, 1775–1782. doi: 10.1128/AEM.67.4.1775-1782.2001
Lindroth, P., and Mopper, K. (1979). High Performance Liquid Chromatographic Determination of Subpicomole Amounts of Amino Acids by Precolumn Fluorescence Derivatization with O-Phthaldialdehyde. Anal. Chem. 51, 1667–1674. doi: 10.1021/ac50047a019
Lion, L. W., and Leckie, J. O. (1981). The Biogeochemistry of the Air-Sea Interface. Ann. Rev. Earth Planet. Sci. 9, 449–486. doi: 10.1146/annurev.ea.09.050181.002313
Marañón, E., Holligan, P. M., Barciela, R., González, N., Mouriño, B., Pazó, M. J., et al. (2001). Patterns of Phytoplankton Size Structure and Productivity in Contrasting Open-Ocean Environments. Mar. Ecol. Progr. Series 216, 43–56. doi: 10.3354/meps216043
Mari, X., Passow, U., Migon, C., Burd, A. B., and Legendre, L. (2017). Transparent Exopolymer Particles: Effects on Carbon Cycling in the Ocean. Prog. Oceanogr. 151, 13–37. doi: 10.1016/j.pocean.2016.11.002
Marie, D., Shi, X. L., Rigaut-Jalabert, F., and Vaulot, D. (2010). Use of Flow Cytometric Sorting to Better Assess the Diversity of Small Photosynthetic Eukaryotes in the English Channel. FEMS Microb. Ecol. 72, 165–178. doi: 10.1111/j.1574-6941.2010.00842.x
Momzikoff, A., Brinis, A., Dallot, S., Gondry, G., Saliot, A., and Lebaron, P. (2004). Field Study of the Chemical Characterization of the Upper Ocean Surface Using Various Samplers. Limnol. Oceanogr. 2, 374–386. doi: 10.4319/lom.2004.2.374
Montes-Hugo, M. A., and Alvarez-Borrego, S. (2007). Differences in Photosynthetic Pigment Signatures between Phytoneuston and Phytoplankton Communities in a Coastal Lagoon of Baja California. Mar. Biol. 151, 1225–1236. doi: 10.1007/s00227-006-0546-3
Mustaffa, N. I. H., Ribas-Ribas, M., Banko-Kubis, H. M., and Wurl, O. (2020). Global Reduction of in Situ CO2 Transfer Velocity by Natural Surfactants in the Sea-Surface Microlayer. Proc. R. Soc. A 476:20190763. doi: 10.1098/rspa.2019.0763
Nagai, T., Gruber, N., Frenzel, H., Lachkar, Z., McWilliams, J. C., and Plattner, G. K. (2015). Dominant Role of Eddies and Filaments in the Offshore Transport of Carbon and Nutrients in the California Current System. J. Geophys. Res. 120, 5318–5341. doi: 10.1002/2015JC010889
Obernosterer, I., Christaki, U., Lefèvre, D., Catala, P., Van Wambeke, F., and Lebaron, P. (2008). Rapid Bacterial Mineralization of Organic Carbon Produced during a Phytoplankton Bloom Induced by Natural Iron Fertilization in the Southern Ocean. Deep-Sea Res. Part II 55, 777–789. doi: 10.1016/j.dsr2.2007.12.005
Ogawa, H., and Tanoue, E. (2003). Dissolved Organic Matter InOceanic Waters. Treat. Geochem. 5–9, 273–318. doi: 10.1016/B0-08-043751-6/05080-5
Pauly, D., and Christensen, V. (1995). Primary Production Required to Sustain Global Fisheries. Nature 374, 255–257. doi: 10.1038/374255a0
Pelegrí, J. L., Arístegui, J., Cana, L., González-Dávila, M., Hernández-Guerra, A., Hernández-León, S., et al. (2005). Coupling between the Open Ocean and the Coastal Upwelling Region off Northwest Africa: Water Recirculation and Offshore Pumping of Organic Matter. J. Mar. Syst. 54, 3–37. doi: 10.1016/j.jmarsys.2004.07.003
Pereira, R., Ashton, I., Sabbaghzadeh, B., Shutler, J. D., and Upstill-Goddard, R. C. (2018). Reduced Air-Sea CO2 Exchange in the Atlantic Ocean Due to Biological Surfactants. Nat. Geosci. 11, 492–496. doi: 10.1038/s41561-018-0136-2
Pereira, R., Schneider-Zapp, K., and Upstill-Goddard, R. C. (2016). Surfactant Control of Gas Transfer Velocity along an Offshore Coastal Transect: Results from a Laboratory Gas Exchange Tank. Biogeosciences 13, 3981–3989. doi: 10.5194/bg-13-3981-2016
Plavšić, M., Vojvodić, V., and Ćosović, B. (1990). Characterization of Surface-Active Substances during a Semi-Field Experiment on a Phytoplankton Bloom. Anal. Chim. Acta 232, 131–140. doi: 10.1016/S0003-267081229-5
Pogorzelski, S. J., Kogut, A. D., and Mazurek, A. Z. (2006). Surface Rheology Parameters of Source-Specific Surfactant Films as Indicators of Organic Matter Dynamics. Hydrobiologia 554, 67–81. doi: 10.1007/s10750-005-1007-6
Rahlff, J., Stolle, C., Giebel, H. A., Brinkhoff, T., Ribas-Ribas, M., Hodapp, D., et al. (2017). High Wind Speeds Prevent Formation of a Distinct Bacterioneuston Community in the Sea-Surface Microlayer. FEMS Microb. Ecol. 93, 1–14. doi: 10.1093/femsec/fix041
Rahlff, J., Stolle, C., Giebel, H. A., Ribas-Ribas, M., Damgaard, L. R., and Wurl, O. (2019). Oxygen Profiles across the Sea-Surface Microlayer-Effects of Diffusion and Biological Activity. Front. Mar. Sci. 6:11. doi: 10.3389/fmars.2019.00011
Ramseier, M. K., von Gunten, U., Freihofer, P., and Hammes, F. (2011). Kinetics of Membrane Damage to High (HNA) and Low (LNA) Nucleic Acid Bacterial Clusters in Drinking Water by Ozone, Chlorine, Chlorine Dioxide, Monochloramine, Ferrate(VI), and Permanganate. Water Res. 45, 1490–1500. doi: 10.1016/j.watres.2010.11.016
Reinthaler, T., Sintes, E., and Herndl, G. J. (2008). Dissolved Organic Matter and Bacterial Production and Respiration in the Sea-Surface Microlayer of the Open Atlantic and the Western Mediterranean Sea. Limnol. Oceanogr. 53, 122–136. doi: 10.4319/lo.2008.53.1.0122
Ribas-Ribas, M., Helleis, F., Rahlff, J., and Wurl, O. (2018). Air-Sea CO2-Exchange in a Large Annular Wind-Wave Tank and the Effects of Surfactants. Front. Mar. Sci. 5, 1–16. doi: 10.3389/fmars.2018.00457
Richter, P. R., Häder, D. P., Gonçalves, R. J., Marcoval, M. A., Villafañe, V. E., and Helbling, E. W. (2007). Vertical Migration and Motility Responses in Three Marine Phytoplankton Species Exposed to Solar Radiation. Photochem. Photobiol. 83, 810–817. doi: 10.1111/j.1751-1097.2007.00076.x
Rickard, P. C., Uher, G., Upstill-Goddard, R. C., Frka, S., Mustaffa, N. I. H., Banko-Kubis, H. M., et al. (2019). Reconsideration of Seawater Surfactant Activity Analysis Based on an Inter-Laboratory Comparison Study. Marine Chemistry 208, 103–111. doi: 10.1016/j.marchem.2018.11.012
Roshan, S., and DeVries, T. (2017). Efficient Dissolved Organic Carbon Production and Export in the Oligotrophic Ocean. Nat. Comm. 8:1. doi: 10.1038/s41467-017-02227-3
Sabbaghzadeh, B., Upstill-Goddard, R. C., Beale, R., Pereira, R., and Nightingale, P. D. (2017). The Atlantic Ocean Surface Microlayer from 50°N to 50°S Is Ubiquitously Enriched in Surfactants at Wind Speeds up to 13 m S-1. Geophys. Res. Lett. 44, 2852–2858. doi: 10.1002/2017GL072988
Salter, M. E., Upstill-Goddard, R. C., Nightingale, P. D., Archer, S. D., Blomquist, B., Ho, D. T., et al. (2011). Impact of an Artificial Surfactant Release on Air-Sea Gas Fluxes during Deep Ocean Gas Exchange Experiment II. J. Geophys. Res. 116, 1–9. doi: 10.1029/2011JC007023
Santana-Falcón, Y., Benavides, M., Sangrà, P., Mason, E., Barton, E. D., Orbi, A., et al. (2016). Coastal-Offshore Exchange of Organic Matter across the Cape Ghir Filament (NW Africa) during Moderate Upwelling. J. Mar. Syst. 154, 233–242. doi: 10.1016/j.jmarsys.2015.10.008
Santos, A. L., Baptista, I., Lopes, S., Henriques, I., Ne, C. M., Gomes, A., et al. (2012a). The UV Responses of Bacterioneuston and Bacterioplankton Isolates Depend on the Physiological Condition and Involve a Metabolic Shift. FEMS Microb. Ecol. 80, 646–658. doi: 10.1111/j.1574-6941.2012.01336.x
Santos, A. L., Vanessa, O., Baptista, I., Henriques, I., Gomes, N. C. M., Almeida, A., et al. (2012b). Effects of UV-B Radiation on the Structural and Physiological Diversity of Bacterioneuston and Bacterioplankton. Appl. Env. Microbiol. 78, 2066–2069. doi: 10.1128/AEM.06344-11
Satpute, S. K. I, Banat, M., Dhakephalkar, P. K., Banpurkar, A. G., and Chopade, B. A. (2010). Biosurfactants, Bioemulsi Fi Ers and Exopolysaccharides from Marine Microorganisms. Biotechnol. Adv. 28, 436–450. doi: 10.1016/j.biotechadv.2010.02.006
Schneider-Zapp, K., Salter, M. E., Mann, P. J., and Upstill-Goddard, R. C. (2013). Technical Note: Comparison of Storage Strategies of Sea Surface Microlayer Samples. Biogeosciences 10, 4927–4936. doi: 10.5194/bg-10-4927-2013
Schütte, F., Brandt, P., and Karstensen, J. (2016). Occurrence and Characteristics of Mesoscale Eddies in the Tropical Northeastern Atlantic Ocean. Ocean Sci. 12, 663–685. doi: 10.5194/os-12-663-2016
Servais, P., Casamayor, E. O., Courties, C., Catala, P., Parthuisot, N., and Lebaron, P. (2003). Activity and Diversity of Bacterial Cells with High and Low Nucleic Acid Content. Aquat. Microb. Ecol. 2003:33041. doi: 10.3354/ame033041
Shaharom, S., Latif, M. T., Khan, M. F., Yusof, S. N. M., Sulong, N. A., Wahid, N. B. A., et al. (2018). Surfactants in the Sea Surface Microlayer, Subsurface Water and Fine Marine Aerosols in Different Background Coastal Areas. Env. Sci. Pollut. Res. 25, 27074–27089. doi: 10.1007/s11356-018-2745-0
Sharp, J. H. (2002). “Chapter 2 - Analytical Methods for Total DOM Pools,” in Biogeochemistry of Marine Dissolved Organic Matter, eds D. A. Hansell and C. Carlosn (San Diego: Academic Press.), 35–58. doi: 10.1016/B978-012323841-2/50004-X
Shen, Y., and Benner, R. (2019). Molecular Properties Are a Primary Control on the Microbial Utilization of Dissolved Organic Matter in the Ocean. Limnol. Oceanogr. 1968, 1–11. doi: 10.1002/lno.11369
Speth, P., Detlefsen, H., and Sierts, H. W. (1978). Meteorological Influence on Upwelling off Northwest Africa. Deutsche Hydrogr. Zeitschrift 31, 95–104. doi: 10.1007/BF02227007
Stefan, R. L., and Szeri, A. J. (1999). Surfactant Scavenging and Surface Deposition by Rising Bubbles. J. Coll. Interface Sci. 212, 1–13. doi: 10.1006/jcis.1998.6037
Stramma, L., Hüttl, S., and Schafstall, J. (2005). Water Masses and Currents in the Upper Tropical Northeast Atlantic off Northwest Africa. J. Geophys. Res. 110, 1–18. doi: 10.1029/2005JC002939
Subramanian, V., Dubini, A., and Seibert, M. (2012). “Metabolic Pathways in Green Algae with Potential Value for Biofuel Production,” in The Science of Algal Fuels. Cellular Origin, Life in Extreme Habitats and Astrobiology, eds R. Gordon and J. Seckbach (Dordrecht: Springer), 399–422. doi: 10.1007/978-94-007-5110-1_22
Sun, H., Zhang, Y., Tan, S., Zheng, Y., Zhou, S., Ma, Q.-Y., et al. (2020). DMSP-Producing Bacteria Are More Abundant in the Surface Microlayer than Subsurface Seawater of the East China Sea. Microb. Ecol. 2020:8. doi: 10.1007/s00248-020-01507-8
Takahashi, T., Sutherland, S. C., Wanninkhof, R., Sweeney, C., Feely, R. A., Chipman, D. W., et al. (2009). Climatological Mean and Decadal Change in Surface Ocean pCO2, and Net Sea-Air CO2 Flux over the Global Oceans. Deep-Sea Res. Part II 56, 554–577. doi: 10.1016/j.dsr2.2008.12.009
Thomsen, S., Karstensen, J., Kiko, R., Krahmann, G., Dengler, M., and Engel, A. (2019). Remote and Local Drivers of Oxygen and Nitrate Variability in the Shallow Oxygen Minimum Zone off Mauritania in June 2014. Biogeosciences 16, 979–998. doi: 10.5194/bg-16-979-2019
Tsai, W.-T., and Liu, K.-K. (2003). An Assessment of the Effect of Sea Surface Surfactant on Global Atmosphere-Ocean CO2 Flux. J. Geophys. Res. C 108, 24–21. doi: 10.1029/2000jc000740
Upstill-Goddard, R. C., Frost, T., Henry, G. R., Franklin, M., Murrell, J. C., and Owens, N. J. P. (2003). Bacterioneuston Control of Air-Water Methane Exchange Determined with a Laboratory Gas Exchange Tank. Glob. Biogeochem. Cycles 17:4. doi: 10.1029/2003gb002043
Van Pinxteren, M., Fomba, K. W., Triesch, N., Stolle, C., Wurl, O., Bahlmann, E., et al. (2020). Marine Organic Matter in the Remote Environment of the Cape Verde Islands – an Introduction and Overview to the MarParCloud Campaign. Atmosph. Chem. Phys. 20, 6921–6951. doi: 10.5194/acp-20-6921-2020
Van Pinxteren, M., Müller, C., Iinuma, Y., Stolle, C., and Herrmann, H. (2012). Chemical Characterization of Dissolved Organic Compounds from Coastal Sea Surface Microlayers (Baltic Sea, Germany). Env. Sci. Technol. 46, 10455–10462. doi: 10.1021/es204492b
Woolf, D. K., Shutler, J. D., Goddijn-Murphy, L., Watson, A. J., Chapron, B., Nightingale, P. D., et al. (2019). Key Uncertainties in the Recent Air-Sea Flux of CO2. Glob. Biogeochem. Cycles 33, 1548–1563. doi: 10.1029/2018GB006041
Wurl, O., Ekau, W., Landing, W. M., and Zappa, C. J. (2017). Sea Surface Microlayer in a Changing Ocean - A Perspective. Elementa 2017:228. doi: 10.1525/elementa.228
Wurl, O., Wurl, E., Miller, L., Johnson, K., and Vagle, S. (2011). Formation and Global Distribution of Sea-Surface Microlayers. Biogeosciences 2011:121. doi: 10.5194/bg-8-121-2011
Yang, M., Smyth, T. J., Kitidis, V. I, Brown, J., Wohl, C., Yelland, M. J., et al. (2021). Natural Variability in Air–Sea Gas Transfer Efficiency of CO2. Sci. Rep. 11, 1–9. doi: 10.1038/s41598-021-92947-w
Zäncker, B., Bracher, A., Röttgers, R., and Engel, A. (2017). “Variations of the Organic Matter Composition in the Sea Surface Microlayer: A Comparison between Open Ocean, Coastal, and Upwelling Sites Off the Peruvian Coast. Front. Microbiol. 8, 1–17. doi: 10.3389/fmicb.2017.02369
Zhang, Y., Bellingham, J. G., Ryan, J. P., and Godin, M. A. (2015). Evolution of a Physical and Biological Front from Upwelling to Relaxation. Contin. Shelf Res. 108, 55–64. doi: 10.1016/j.csr.2015.08.005
Zhang, Z., Liu, L., Liu, C., and Cai, W. (2003). Studies on the Sea Surface Microlayer: II. The Layer of Sudden Change of Physical and Chemical Properties. J. Coll. Interf. Sci. 264, 148–159. doi: 10.1016/S0021-979700390-4
Zhang, Z., Liu, L., Zhijian, W., Jun, L., and Haibing, D. (1998). Physicochemical Studies of the Sea Surface Microlayer I. Thickness of the Sea Surface Microlayer and Its Experimental Determination. J. Colloid Interface Sci. 204, 294–299. doi: 10.1006/jcis.1998.5538
Zubkov, M. V., Sleigh, M. A., Burkill, P. H., and Leakey, R. J. G. (2000). Picoplankton Community Structure on the Atlantic Meridional Transect: A Comparison between Seasons. Prog. Oceanogr. 45, 369–386. doi: 10.1016/S0079-661100008-2
Keywords: sea surface microlayer (SML), total organic carbon (TOC), total amino acids (TAA), neuston community, filament, eastern boundary upwelling systems (EBUS), air-sea gas exchange, surface activity
Citation: Barthelmeß T, Schütte F and Engel A (2021) Variability of the Sea Surface Microlayer Across a Filament’s Edge and Potential Influences on Gas Exchange. Front. Mar. Sci. 8:718384. doi: 10.3389/fmars.2021.718384
Received: 31 May 2021; Accepted: 21 September 2021;
Published: 29 October 2021.
Edited by:
Johan Schijf, University of Maryland Center for Environmental Science (UMCES), United StatesReviewed by:
Violetta Drozdowska, Institute of Oceanology, Polish Academy of Sciences (PAN), PolandMingxi Yang, Plymouth Marine Laboratory, United Kingdom
Ryan Pereira, The Lyell Centre, United Kingdom
Copyright © 2021 Barthelmeß, Schütte and Engel. This is an open-access article distributed under the terms of the Creative Commons Attribution License (CC BY). The use, distribution or reproduction in other forums is permitted, provided the original author(s) and the copyright owner(s) are credited and that the original publication in this journal is cited, in accordance with accepted academic practice. No use, distribution or reproduction is permitted which does not comply with these terms.
*Correspondence: Theresa Barthelmeß, dGJhcnRoZWxtZXNzQGdlb21hci5kZQ==