 Beyah Meissa
 Mamadou Dia
 Braham C. Baye
 Moustapha Bouzouma1
 Rubén H. Roa-Ureta
- 1Laboratoire Evaluation des Ressources Vivantes Aquatiques, Institut Mauritanien de Recherches Océanographiques et des Pêches, Nouadhibou, Mauritania
- 2Centre of Marine Science (CCMAR), University of Algarve, Faro, Portugal
Several data-poor stock assessment methods have recently been proposed and applied to data-poor fisheries around the world. The Mauritanian pink spiny lobster fishery has a long history of boom and bust dynamics, with large landings, stock collapse, and years-long fishery closures, all happening several times. In this study, we have used catch, fishing efforts, and length-frequency data (LFD) obtained from the fishery in its most recent period of activity, 2015–2019, and historical annual catch records starting in 2006 to fit three data-poor stock assessment methods. These were the length-based Bayesian (LBB) method, which uses LFD exclusively, the Catch-only MSY (CMSY) method, using annual catch data and assumptions about stock resilience, and generalised depletion models in the R package CatDyn combined with Pella-Tomlinson biomass dynamics in a hierarchical inference framework. All three methods presented the stock as overfished. The LBB method produced results that were very pessimistic about stock status but whose reliability was affected by non-constant recruitment. The CMSY method and the hierarchical combination of depletion and Pella-Tomlinson biomass dynamics produced more comparable results, such as similar sustainable harvest rates, but both were affected by large statistical uncertainty. Pella-Tomlinson dynamics in particular demonstrated stock experiencing wide fluctuations in abundance. In spite of uncertain estimates, a clear understanding of the status of the stock as overfished and in need of a biomass rebuilding program emerged as management-useful guidance to steer exploitation of this economically significant resource into sustainability.
Introduction
The resilience of exploited marine species depends largely on their intrinsic capacity to react to increasing fishing pressure. In general, large slow-growing species with a high age at first maturity are more vulnerable to fishing, exhibiting a larger decrease in abundance for a given fishing pressure (Gislason, 2003; Reynolds et al., 2005; Meissa and Gascuel, 2014). Their exploitation can lead to a sudden collapse of the fishery as it has happened more than once in the pink spiny lobster fishery in Mauritania during its 50 years of exploitation. After 20 years of closure, a new active exploitation phase started in 2015 with a fleet that targeted the stock, and yet formal stock assessment has not been implemented to ensure sustainability, leading to high risks of repeating the errors of the past. This is a data-poor fishery and the time series of information available for stock assessment is short, thus, it provides a challenging opportunity to examine the advantages of several stock assessment methods for data-poor fisheries that have been proposed in recent years (Roa-Ureta et al., 2015, 2019; Froese et al., 2017, 2018).
The species occur at depths of 50–400 m and reproduce all year round with a peak between August and December (Dia et al., 2021). Reproduction and growth are linked to the moulting cycle. Lobsters periodically shed their exoskeleton to allow their body size to increase and for mating to occur. Males copulate with newly moulted females and the sperm is then stored internally until egg extrusion, which can be delayed for up to 2 years. When extruded, the eggs are fertilised and attached to the underside of the female, where they are carried for 9–11 months before hatching. The pink spiny lobster of Mauritania is vulnerable to exploitation due to its biological characteristics, among these attaining sexual maturity at a relatively large size (140–160 mm total length) and low fertility (in the order of 105 eggs). Its high commercial value has led, however, to a rush for its exploitation by vessels previously targeting octopus (Octopus vulgaris) that transformed into lobster boats and by newly chartered vessels. As a result, the number of fishing vessels increased rapidly from 5 in 2014 to over 22 vessels in January 2015. Fishing for this species was initiated by the French boats in 1956, following the decline of the green lobster fishery (Maigret, 1978), which until that year was the main target species for French, Spanish, and Portuguese fishers. The high market value of the pink spiny lobster caused its exploitation to increase rapidly. Its fishery went through three phases: a phase of excessive yields and collapse of landings between 1963 and 1970, a phase of reconstruction between 1971 and 1987, and the second phase of collapse between 1987 and 1988 (Diop and Kojemiakine, 1990). This second phase was a result of fishing agreements with the EEC (EU), which led to the intensification of fishing effort, with vessel numbers rising from 10 to 25. A concurrent escalation of poaching rapidly led to a new collapse of the fishery, and French boats left in 1990. Since 1995, the pink spiny lobster has been a by-catch of boats targeting demersal fish and cephalopods in Mauritanian waters (Goñi and Latrouite, 2005).
In 2006, improvement of the abundance index was noted in data from regular scientific surveys. However, the sampling protocols and gear used in these surveys were not adequate for the assessment of the abundance of the pink lobster. Despite the positive turn of the survey abundance index, the stock was not exploited again until 2013 when initially only two boats were active in the area. In November 2013, a craze for this species started with certain operators transforming their cephalopod vessels into lobster boats and others bringing newly chartered vessels into the area. The lack of knowledge about the potential of the stock in 2015 led authorities to commission an experimental fishery. Unfortunately, the high number of vessels authorised for the experimental fishery (22 vessels) in the first year caused a severe deterioration in the condition of the stock. In 2016, management introduced a closed period of 6 months, from July to December. As a result, very few berried females have been encountered in samples from the commercial catch, unlike in 2015 when fishing continued throughout the year.
A large majority of data-poor and small-scale fisheries remain un-assessed and these comprise a substantial part of total fisheries catch (Costello et al., 2012) and employment in the fishing sector worldwide (The World Bank, 2012). This has led to the development of new stock assessment methods that use less data and seek to provide results useful for management leading to sustainability (Froese et al., 2017, 2018; articles in Thorson et al., 2015). These methods differ in the data they use: the rationale they are based on, the assumptions they make, and the results they produce. A recent example of comparative application of data-poor methods is in the study of Maynou et al. (2021), where authors compared two methods to estimate the Pella-Tomlinson surplus production model. In this work, we aimed at examining the potential of three data-poor stock assessment methods, the length-based Bayesian model (LBB, Froese et al., 2017), the Catch-only MSY model (CMSY, Froese et al., 2018), and generalised depletion models combined with Pella-Tomlinson surplus production models (Roa-Ureta et al., 2015, 2019) to determine the exploitation status of the pink lobster stock in Mauritania. The data collected on the fishing activity over the period 2015–2019, which allows application of the three methods, are used to estimate the exploitation status and productivity of this lobster fishery. Our results provide useful insights into their applicability in the vast realm of the stock assessment of data-poor and small-scale fisheries.
Materials and Methods
Description of the Fishery
The fishery is conducted on four fishing grounds off the coast of Mauritania, West Africa (Figure 1) by licenced boats that operate under an agreement with the national research institute (IMROP) to collect fisheries and biological data. At the start of the experimental pink lobster fishery in 2015, the number of lobster boats operating in Mauritanian waters was 22, ranging in length from 14 to 26 m and with a power rating of between 150 and 500 hp. This number increased from 20 to 25 units from 2016 to 2017 before dropping significantly in 2018 and 2019 to 14 and 12 vessels, respectively, following the withdrawal of the majority of chartered units.
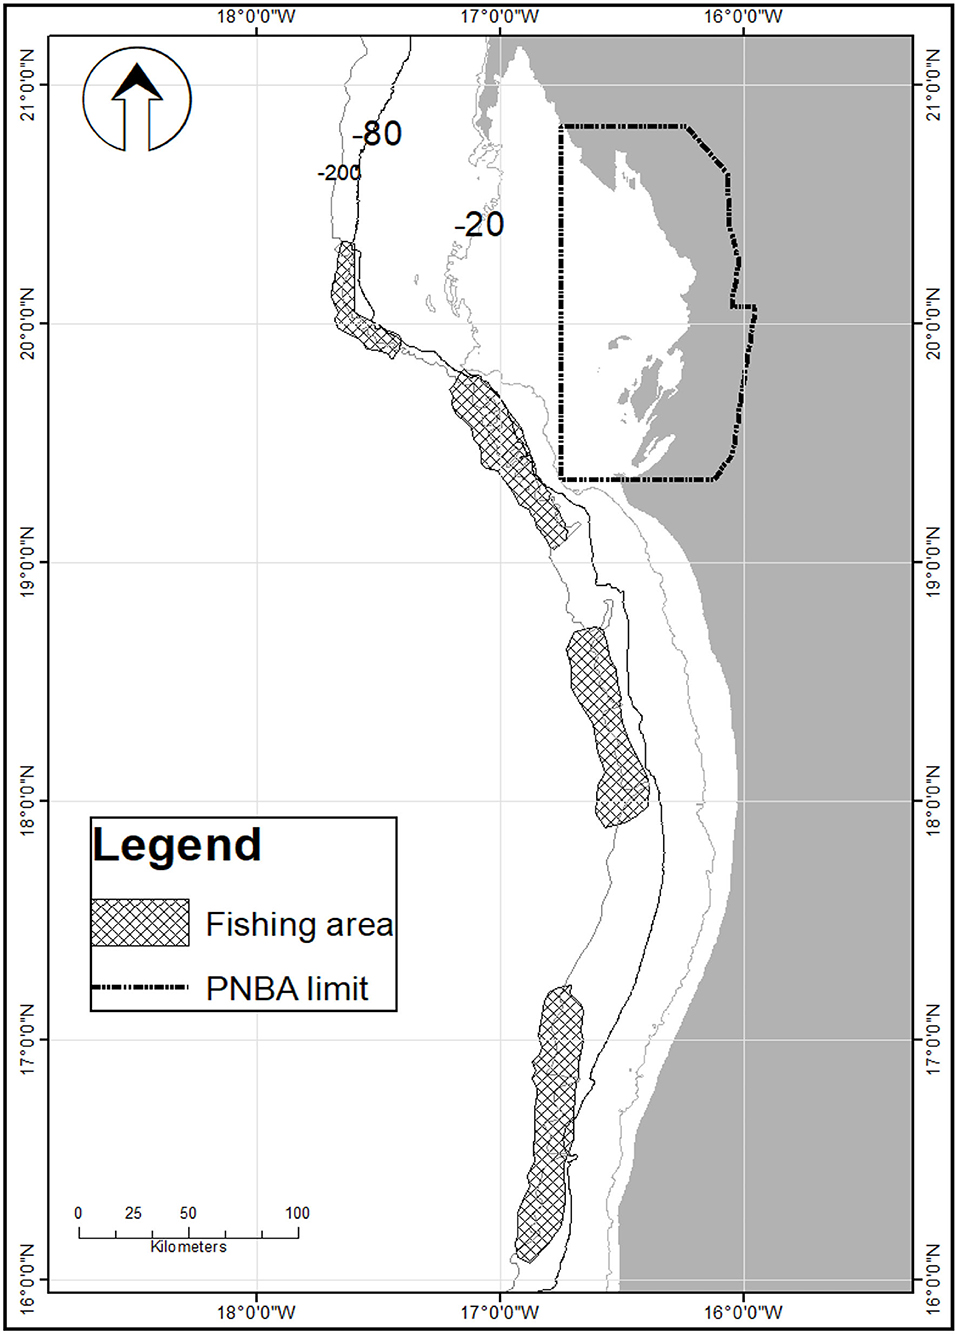
Figure 1. Pink spiny lobster fishing areas off the coast of Mauritania. The National Park of Banc d'Arguin (PNBA) is a protected area where all fishing is banned.
At the beginning of the monitoring of the experimental fishery, the pink lobster fishery was carried out by coastal and offshore vessels using bottom-set, drop gillnets, with 180 mm stretched mesh size, 2 m high, and 25–40 m long. Vessels carried 10–18 sets of 400 nets. At the end of the first monitoring year, some effort control measures were introduced. The maximum length of each net was set at 40 m, the length of the whole set of nets deployed was set at a maximum of 1,600 m, and the maximum number of nets was set at 800. The gear used in the pink lobster fishery resulted in significant bycatch dominated by various demersal fish, scorpion fish, and crabs. Thus, for 1 kg of lobster caught, the by-catch varied from 1.04 to 14.5 kg. The pink spiny lobster is caught exclusively by vessels targeting this species and possessing a specific lobster-fishing licence, with little or no by-catch of pink spiny lobster in other fisheries. The pink lobster has been reported off Spain, Portugal, and Morocco, and it is also found in Senegal and Cabo Verde. In Mauritania, where this species was discovered and the only area where it is fished commercially, this species is found from north to south of the coastline (Figure 1).
Mauritanian regulations prohibit the capture and retention of gravid females and the retention of spiny lobsters whose total length is <23 cm. In addition, since 2016 a fishing ban extending from June to December each year was introduced to protect the main spawning seasons and to further restrict the magnitude of annual fishing effort. Catches at the start of the experimental fishery in 2015 were in the order of 704 tonnes and subsequently declined from 242 tonnes in 2016 to <200 tonnes in 2019.
Description of the Data
The data used in this study were collected during regular monitoring of fishing activities by scientific observers. These data consisted of total annual catch from 2006 to 2019, while from 2015 to 2019, the data included length composition of the annual catch (Figure 2), total monthly catch, total monthly fishing effort in days at sea, and mean monthly weight. Sampling was carried out by a cluster random method with ports, factories, and vessels as the three clusters in the population of fishing trips. The biological analyses were based on samples large enough (Figure 2) to secure a good representation of all size classes in the length range. Total length, measured from the origin of the inter-orbital spine to the end of the telson, and length of the cephalothorax, taken from the tip of the rostrum to the posterior border of the cephalothorax, were measured for each individual to the nearest millimetre. At the same time, all individuals were also weighed, their sex was noted, and the degree of sexual maturity of the females was recorded using the scale of macroscopic maturity proposed by Weinborn (1977) modified by Briones-Fourzan et al. (1997).
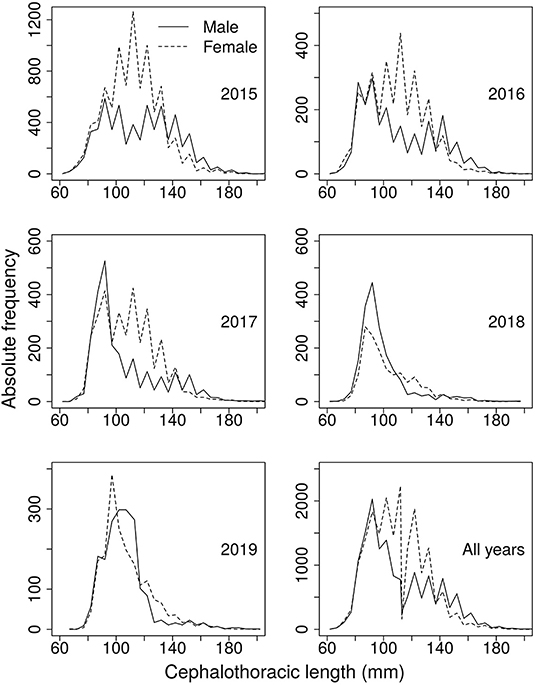
Figure 2. Length frequency data collected over 5 years of fishing operations on the pink spiny lobster fishery in Mauritania.
Data-Poor Stock Assessment Methods
Three data-poor stock assessment methods were implemented. The first method was the LBB method (Froese et al., 2018). The LBB method works with length-frequency data (LFD) in the catch. It makes the assumptions that recruitment is constant along with the time series and that growth follows von Bertalanffy's equation to analyse the descending slope of the LFD (Wang et al., 2020). It produces estimates of length at first capture that would maximise catch (LC), the ratio of natural mortality to the rate parameter in von Bertalanffy's equation (M/k), and the ratio of fishing mortality to the growth rate parameter (F/k), while the value of the asymptotic length in von Bertalanffy's growth model is fixed at a value obtained from a separate biological analysis based on LFD in FISAT II (Dia et al., 2021).
In LBB, it is assumed that the growth in length follows Von Bertalanffy (1938) growth equation in the form given to it by Beverton and Holt (1957), i.e.,
where Lt is the length at age t, L∞ is the asymptotic length, K is the rate at which Linf is approached, and t0 is the age at zero-length (Froese et al., 2018). When the fish are fully selected by the gear, the curvature of the right side of catch samples is a function of total mortality (Z = M + F) relative to K. This curve is expressed by the equation
where NL is the number of survivors to length L, NLstart is the number at length Lstart with full selection, and Z/K is the ratio of the total mortality rate Z to the somatic growth rate (Froese et al., 2018). The lengths affected by partial selection are a function of the fishing gear (in this study assumed to be a trawl or another gear with a trawl-like selection curve), as given by the ogive described by Equation (3):
where SL is the fraction of individuals that are retained by the gear at length L, and α describes the steepness of the ogive (Froese et al., 2018). The parameters of the selection ogive are estimated at the same time as Lc, α, M/K, and F/K by fitting
and
where Li is the number of individuals at length i, Li−1 is the number at the previous length, C refers to the number of individuals vulnerable to the gear, and all other parameters are as described above (Froese et al., 2018). Finally, the following equation describes the framework for approximating stock status from L∞, M/K, F/K, and Lc (Froese et al., 2017). First, given the estimates of L∞ and M/K, Lopt, i.e., the size at which cohort biomass is at maximum, can be obtained from Equation (6):
Based on Equation (6) and given fishing pressure (F/M), the mean length at first capture, which maximises catch and biomass (Lc_opt), can be obtained from
Estimates of Lc_opt are used below to calculate a proxy for the relative biomass that can produce MSY (Froese et al., 2018). The relative biomass and the length at first capture estimated by LBB can then be used directly for management of data-poor stocks: if relative stock size B/B0 is smaller than BMSY/B0, catches should be reduced; if, on the other hand, the mean length at first capture Lc is smaller than Lc_opt, fishing should start at larger sizes. The method was implemented within the Bayesian Gibbs sampler software JAGS (Plummer, 2003) and executed using the statistical language R (R Core Team, 2020) to fit observed proportions-at-length. This method was also used to generate current biomass priors as input to implement the second method, the catch-only CMSY method (Froese et al., 2017).
The CMSY method uses annual catch time series and previous knowledge of resilience to estimate parameters of Schafer's surplus production model, namely, the intrinsic rate of population growth r and the carrying capacity of the environment K. The basic biomass dynamics are governed by Equation (8):
It assumes that r, the initial relative biomass (B0/K), and the final relative biomass (Bcurrent/K) are known in qualitative terms (high, intermediate, or low) and that the value of K varies between (maximum catch)/r and 4*(maximum catch)/r or between 2*(maximum catch)/r and 12*(maximum catch)/r depending on the level of biomass in the last year. Because the CMSY method can only be applied with Schaefer's model, it also assumes a symmetric production function, i.e., that the biomass that produces the MSY is K/2 and the MSY is rK/4. In Equation (8), By+1 is the exploited biomass in the subsequent year y + 1, By is the current biomass, and Cy is the catch in year y. To account for depensation or reduced recruitment at severely depleted stock sizes, such as predicted by all common stock-recruitment functions (Beverton and Holt, 1957; Ricker, 1975; Barrowman and Myers, 2000), a linear decline of surplus production, which is a function of recruitment, somatic growth, and natural mortality (Schnute and Kronlund, 1996), is incorporated if biomass falls below ¼ k (Equation 9).
The term (4*Bt/k) assumes a linear decline of recruitment below half of the biomass that is capable of producing MSY. The CMSY method is coded as an R script (CMSY_2019_5.R) and the version used here is a newer version than the one used in the original paper (Froese et al., 2017). The main differences are faster execution because of parallel processing and more emphasis on management, e.g., by adding an optional Kobe plot.
The third method was an implementation of the non-Bayesian hierarchical inference framework that combines a first stage of fitting generalised depletion models and a second stage of fitting the Pella-Tomlinson-generalised surplus production model (Roa-Ureta et al., 2015, 2019). This method employs catch, effort, and mean weight data at monthly time steps to fit open-population depletion models in the R package CatDyn (Roa-Ureta, 2019) and then uses annual biomass estimates from these depletion models as input to fit the Pella-Tomlinson surplus production model using a marginal-estimated likelihood function in Automatic Differentiation Model Builder (Fournier et al., 2011). The open-population nature of generalised depletion models consists of allowing for multiple exogenous inputs of abundance that occur during the fishing in multi-annual, monthly time series of data. This in turn allows consideration and estimation of the annual recruitment pulses that enter the vulnerable stock. Specifically, at the first stage of fitting the 72 months of catch and effort with a generalised depletion model, the model was a single-fleet process of the form:
where t is the month (from January 2015 to December 2019), C is the predicted catch, k is the scaling (akin to catchability but for non-linear catch rate and abundance models), E is the observed fishing effort (in the number of days fishing per month), N0 is the initial abundance (at the end of December 2014), M is the natural mortality rate per month, and Rj is the magnitude of the recruitment pulse in year j (j = 1–5) due to growth of lobsters into the size retained by fishers. In this model, k, α, β, N0, M, and the five Rj (totaling 10 parameters) are estimated by maximum likelihood by assuming that the observed catch χt has a normal distribution, with mean given by Equation (10) and variance estimated in the model from the data. Further details can be found in the study of Roa-Ureta (2015). The model is implemented in the R package CatDyn, currently on version 1.1-1 (Roa-Ureta, 2019). After estimation, it is possible to predict further results such as the time series of fishing mortality Ft for all months in the data by numerical solving for F at each time step using the Baranov catch equation. Furthermore, CatDyn also produces estimated time series of abundance Nt and biomass Bt for all months in the time series of data.
These biomass estimates can then be used, along with a longer time series of annual landings, to estimate a surplus production model much like absolute biomass estimates from surveys can be used to fit a surplus production model (Mueter and Megrey, 2006). Thus, in this third method for data-poor fisheries, we use 1 of the 12 monthly biomass estimates per year from the fit of the depletion model, particularly the monthly biomass estimate with the smallest average standard error, to fit a Pella-Tomlinson surplus production model. The Pella-Tomlinson model is the general case to which the Schaefer model is a particular case. We fitted a Pella-Tomlinson model of the form:
where y is the year (from 2006 to 2019), B is the biomass predicted by the model, r is the intrinsic rate of population growth, K is the carrying capacity of the environment, p is the symmetry of the production function, and χ is the observed annual catch. This model was fitted to biomass estimates from the depletion model for years 2015–2019 using a hierarchical inference method based on maximising a marginal likelihood function (Roa-Ureta et al., 2015).
The combined depletion and surplus production model does not make any assumption about population dynamics or life history, except for the mathematical forms in Equations (10) and (11). This method is not exclusively a data-poor method; it can be applied to long-time series of efforts and catch and samples of the mean weight in the catch at weekly or monthly time steps (Roa-Ureta et al. 2015, 2019). In this application, however, it is applied to just 5 years of data (2015–2019) to fit the depletion models at the first stage. At the second stage, the 5 years of data were supplemented with a longer time series of annual catch (2006–2019). So in this instance, the non-Bayesian hierarchical inference was implemented at the boundary of low information for the Pella-Tomlinson model.
At the first stage, when fitting open-population depletion models, this method needs to estimate the month of annual recruitment of each of the 5 years of monthly catch, effort, and mean weight data. We fitted 10 model variants by setting the 5 recruitment months at varying locations for each year along with the time series. These 10 variants were defined by examining, for each year, the few months with higher catch without a proportionate rise in fishing effort. The higher catch without concomitant raise in effort could be the result of recruitment to the size retained by fishers so that these months are good candidates. Each of the 10 variants was fitted with two likelihood functions, one was the full normal likelihood and the other was its adjusted profile approximation (Roa-Ureta, 2015), for a total of 20 model variants. We tried four numerical methods for optimization to maximise the likelihood function, namely, we used the spectral projected gradient (SPG), Conjugate-Gradient (CG), Broyden-Fletcher-Goldfarb-Shanno (BFGS), and the Nelder-Mead methods, which give a grand total of 80 model variant-optimization method combinations. The best variant-method combination was determined as the one with the least AIC and more conservative biomass estimate. A full description of this method can be found in the study of Roa-Ureta et al. (2019) and references therein.
Results
LBB Method
According to this method, the relative fishing mortality F/M for the male individuals is 4.4 in the most current year, biomass in the same year is just 8% of initial biomass, and 21% of biomass at MSY (Figure 3). These indicators represent a stock that is severely overfished and still experiencing overfishing. Equivalent results were obtained when using aggregated length frequency (LF) data or males LF data.
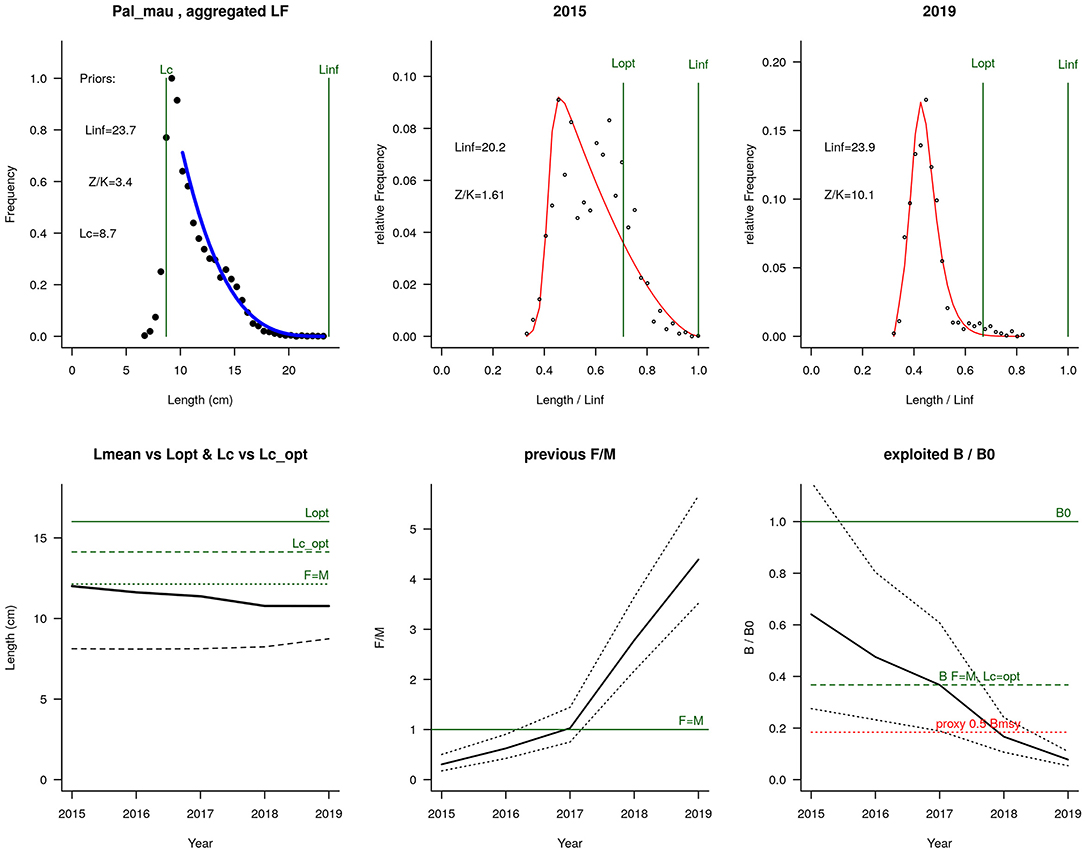
Figure 3. Top-left: aggregated length frequency (LF) data and priors for Lc, Linf, and Z/k. Top-mid and top-right: dots are the LF data for the first and last years, and the red line is the fit of the data to the LBB master equation. Bottom-left: mean length (Lmean, bold black curve) relative to Lopt, and Lc (dashed black curve) relative to Lc_opt. Bottom mid: relative fishing mortality F/M (black curve), with approximate 95% credibility limits (dotted lines), and reference level (F = M, green horizontal line). Bottom right: relative biomass B/B0 (black curve) with approximate 95% credibility limits (dotted black curves), and a proxy for BMSY (green dashed line), and a proxy for Bpa or 0.5 BMSY (red dotted line).
Catch-Only MSY Method
Assumptions about the range of values for r determined a range of 95% credibility interval estimates for MSY, from a minimum of 71 tonnes to a maximum of 402 tonnes (Table 1). The largest spread of estimates occurs with r, four times higher when assuming r between 1 and 1.5 than when assuming r between 0.1 and 0.5. Interestingly, biomass in the last year is at about the same percentage of BMSY under the three scenarios of r, i.e., around 40–50%.
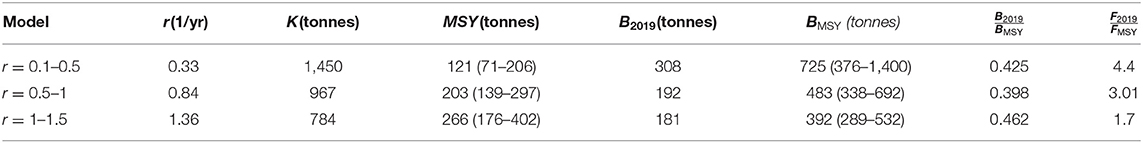
Table 1. Estimates and 95% credibility intervals (in parentheses) from a Schaeffer surplus production model fitted to annual catch data (14 years) of the pink spiny lobster of Mauritania with the CMSY method, under three assumptions about the range where the true r should lie.
Under the CMSY method, there is no objective manner to discern among results obtained from different assumptions of the range where the true r should lie, as is the case in the present study. However, here we present further results from the assumption that the true r should lie between 1 and 1.5 because the third stock assessment method employed, which does not make any assumption about the values of its parameters, estimated r between 1 and 1.5 (see below). Under this assumption, the stock was under fished until 2013, it experienced severe overfishing in 2015, and then removals have been closed to the MSY until 2019 (Figure 4, top left). The stock is still overfished, with biomass at just 50% of the BMSY (Figure 4, top right), and still experiencing overfishing, with fishing mortality above FMSY (Figure 4, bottom).
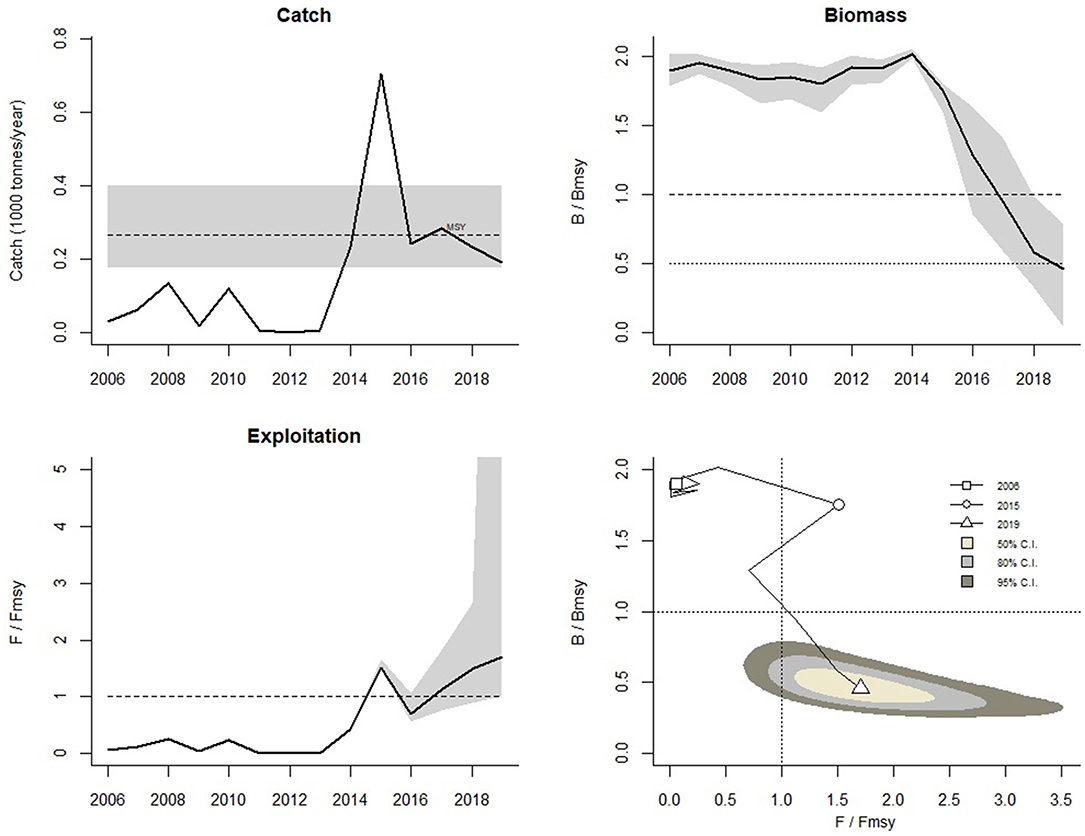
Figure 4. The upper left panel shows catch relative to the 95% confidence interval of MSY, with an indication of 95% credibility limits in grey. The upper right panel shows the development of relative total biomass (B/BMSY), with the grey area indicating uncertainty. The lower left graph shows relative exploitation (F/FMSY), with FMSY corrected for reduced recruitment below 0.5 BMSY. The lower right panel shows the trajectory of relative stock size (B/BMSY) as a function of fishing pressure (F/FMSY).
Hierarchical CatDyn and Pella-Tomlinson
Sixteen of 80 generalised depletion models fitted to the 60-month-long time series of catch and effort data achieved successful numerical convergence. These models differed in the timing of annual recruitment, the likelihood model, and the numerical optimization method. The lowest AIC model among those fitted with the full normal likelihood had recruitment pulses happening in November in all years (2015–2019), with 4 AIC units less than the next best normal-likelihood variant. Among those fitted with the adjusted profile normal likelihood, two were tied with the lowest AIC, with 2 AIC units less than the next best variant, and 1 of these 2 units had all recruitment pulses happening in October in all years, while the other had recruitment pulses on various other months. Considering that both the normal and adjusted profile normal variants had the best models with recruitment pulses in October each year and that the model with the normal likelihood (fitted with the SPG numerical optimization method) was also the most conservative model (i.e., it estimated lower stock biomass) and had good numerical properties (all numerical gradients < 1), we selected the latter as the best working model.
The selected model fitted the observed monthly catch data well, with good residual diagnostics that include a symmetrical empirical distribution, a shapeless cloud, and a quantile-quantile plot falling on the 45° diagonal (Figure 5). Nevertheless, the short-time series resulted in the inability of the numerical method to calculate standard errors for most of the 11 parameters in the model, such as natural mortality and abundance parameters (Table 2).
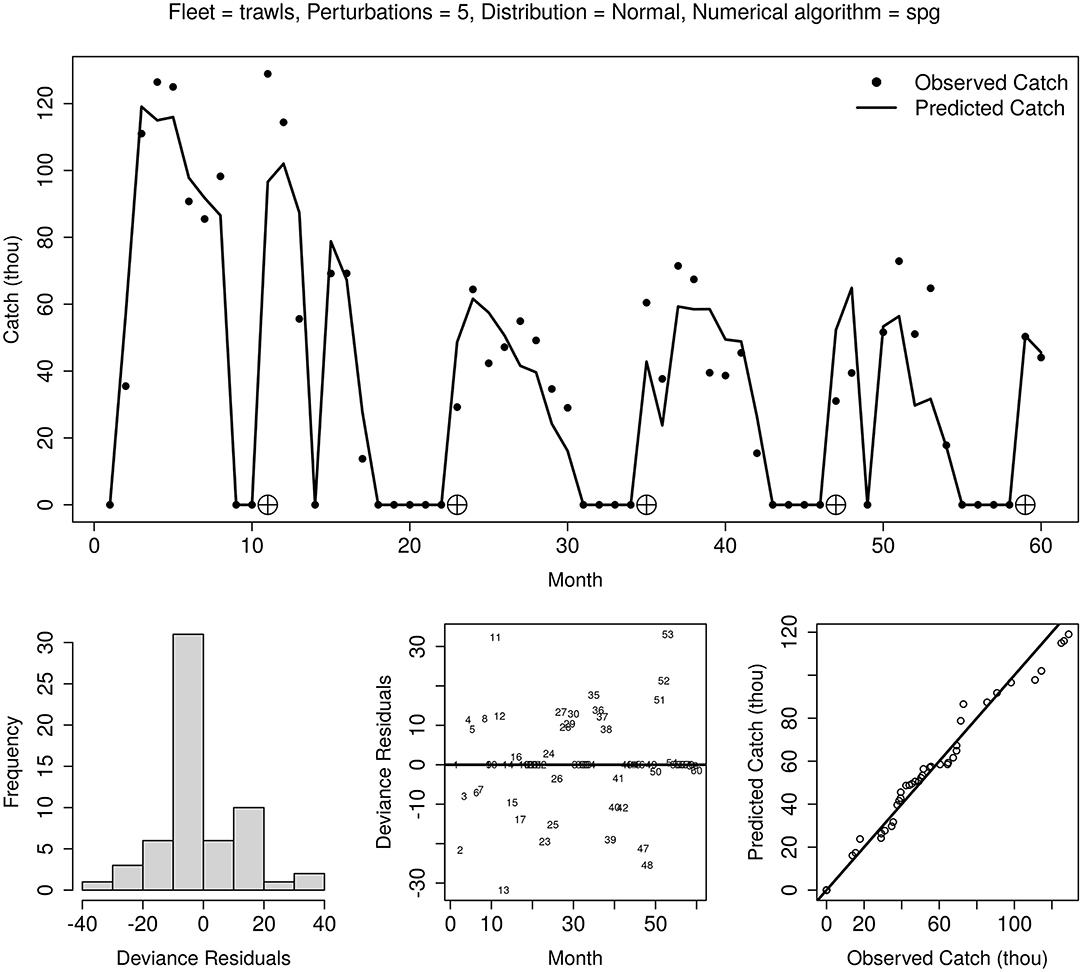
Figure 5. The fit of the best variant of generalised depletion models to 60 months of catch and effort (2015–2019) of the Mauritanian pink spiny lobster fishery. Top panel: observed and predicted catch; lower panels, left to right: residual distribution, residual cloud, and q-q plot.
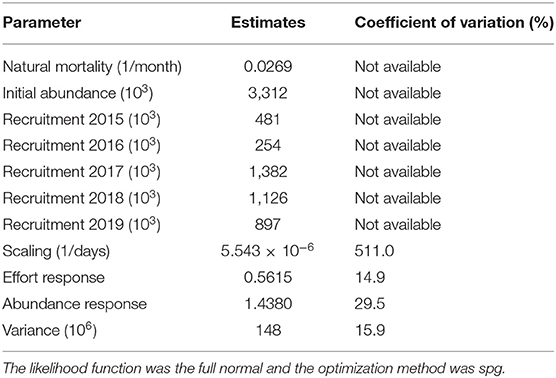
Table 2. Maximum likelihood estimates of 11 parameters of the generalised depletion model with recruitment happening in October each year, fitted to catch and effort data of the pink spiny lobster fishery in Mauritania, in CatDyn R package.
The estimated monthly natural mortality rate implies an annual rate of 0.3228, which in turn implies longevity of 14 years according to Hoening's empirical relationship (Hoening, 2005). This agrees well with the previous results from Sow et al. (2019) which reported observing individual lobsters reaching 18 years and with Maigret (1978) where it is found that the pink lobster may live up to 21 years. Recruitment varies 5-fold and has an increasing trend towards the present while effort response and abundance response parameters correspond to fishing that is saturable (effort response < 1) and mildly over depleted (abundance response > 1; Table 2).
The monthly instantaneous exploitation rate has been decreasing slightly in 2019 but it has been high during the whole period, starting at 60% in 2015 and dropping to around 50% in 2019 (Figure 6, top panel). There appears to be an increase in recruitment following a year when the number of months without fishing increases (Figure 6, bottom panel).
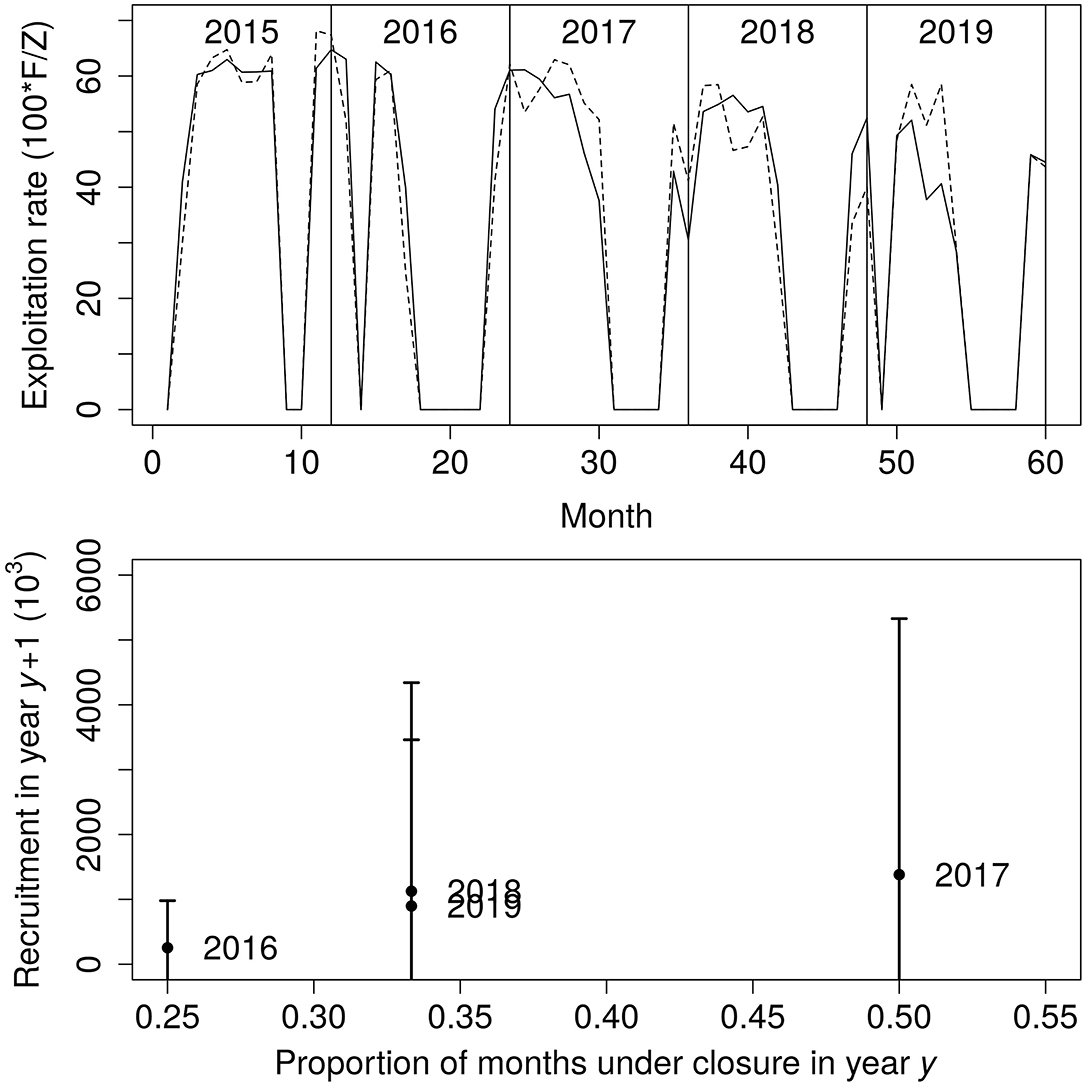
Figure 6. Monthly instantaneous exploitation rate (top panel) and the relationship between months without fishing in a year and recruitment next year with estimated fishing mortality, total mortality, and recruitment from generalised depletion applied to the Mauritanian pink spiny lobster fishery.
Monthly pink spiny lobster biomass estimates from generalised depletion models are shown in Figure 7 (green line). Among these, October estimates (green dots) had the lowest standard errors so these estimates were used to fit the Pella-Tomlinson annual biomass dynamics.
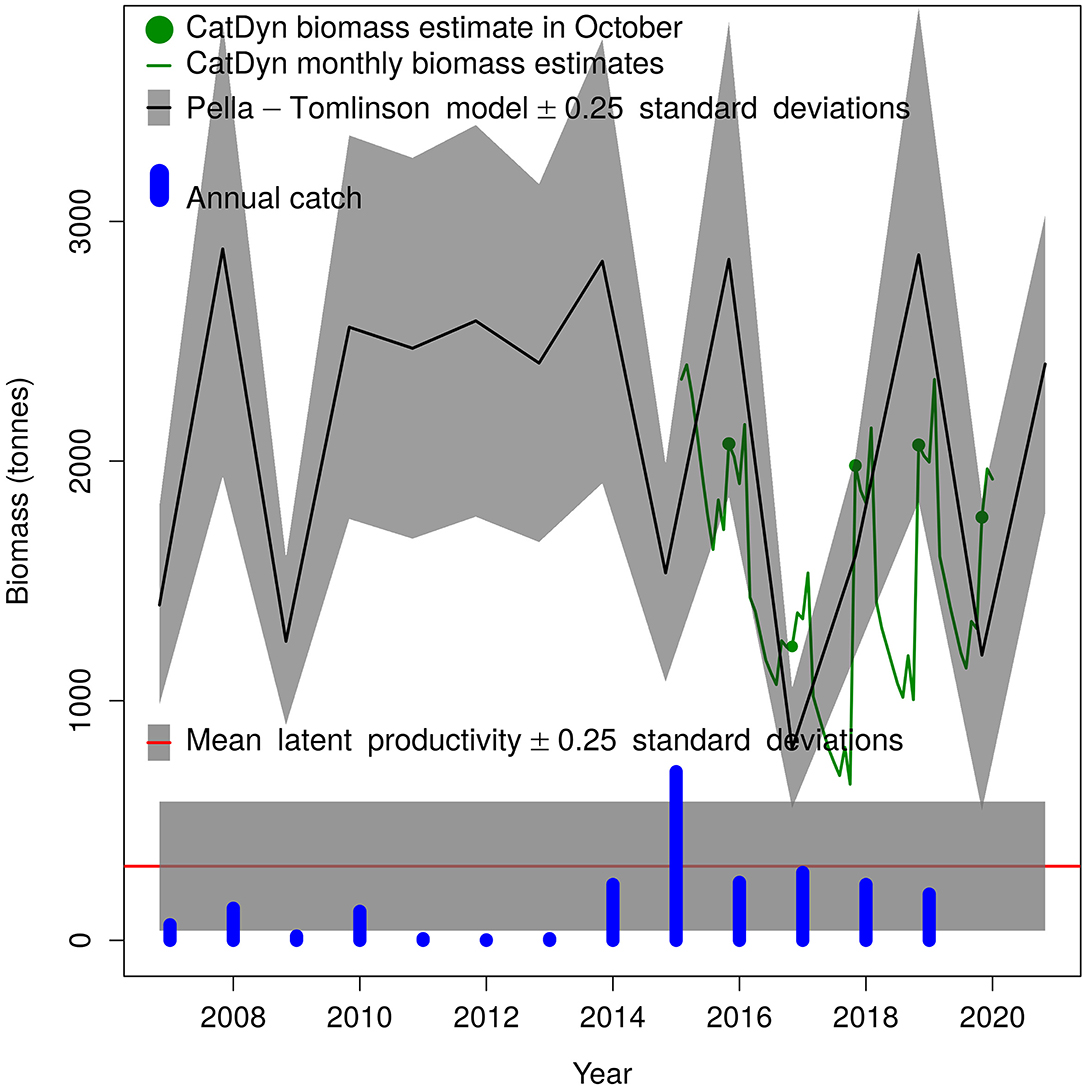
Figure 7. Annual population dynamics of the pink spiny lobster stock in Mauritania according to the Pella-Tomlinson surplus production model. Note that CatDyn and Pella-Tomlinson biomass values are located in October of each year (10/12 fraction of a year) whole the catch bars are located in January.
The annual population dynamics as represented by the Pella-Tomlinson surplus production model has a tendency to strong fluctuations in abundance under fishing pressure (Figure 7). During periods of low annual landings, such as 2010–2013, the stock maintains a fairly stable size at ~2,500 tonnes, but when landings increase as it happened from 2014 to 2019 the stock fluctuates widely.
The high value of the symmetry parameter p (Table 3) causes that the stock biomass maximising the growth rate is high biomass, much higher than K/2, and therefore stock productivity is low compared to stock biomass. This is reflected in a modest sustainable annual harvest rate, the mean latent productivity, amounting to just over 300 tonnes (Table 3). This sustainable annual harvest rate was substantially exceeded in 2015.
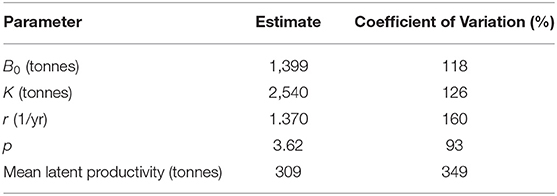
Table 3. Maximum likelihood estimates of four free parameters of the Pella-Tomlinson surplus production model and derived estimate of mean latent productivity as a sustainable annual harvest rate.
Although biomass fluctuations seem stable, with no increasing or decreasing trend in annually averaged biomass, they had a very wide amplitude in recent years. In fact, the lowest biomass was obtained in 2017, and it was close to the recorded catch. These wide fluctuations mean that despite annual catches close to the sustainable annual harvest since 2016, the stock still is overfished and needs to rebuild biomass to a level that produces narrower oscillations when the sustainable harvest rate is applied. All estimates from this model have poor precision, an expected outcome given the few years available to fit depletion models and then to inform Pella-Tomlinson population dynamics.
Discussion
The three methods found the stock overfished but they differed substantially in important aspects. The LBB method presented the stock in the worst condition. This method however assumes that recruitment is constant for all years in the time series of LFD. This is unlikely to be true considering the large catch spike of 2015, about three times higher than in any other year. Such a large spike in removals should have affected the spawning biomass. The depletion model does not make assumptions about recruitment, and it estimates a recruitment time series with a 55% coefficient of variation, the highest recruitment being five times the lowest recruitment and a trend of increasing recruitment from 2015 to 2019. Therefore, we consider that estimates from the LBB method are unreliable in this application.
The Catch-only MSY is a Bayesian model, so it is very important to present the independent knowledge about the stock (the history of the fishery) and derive from it the priors for relative biomass. In this case, that applies mostly to the start and intermediate biomass. The range of 0.9–1.0 for start biomass says the stock was practically unexploited in 2006. The range of 0.5–0.9 in 2015 indicates the start of the full fishery, probably already overexploiting the stock. The low biomass prior to 0.01–0.4 in 2019 is supported by the disappearance of larger lobsters and by the length-frequency analysis by LBB. The latter delivered the end biomass prior to CMSY.
The CMSY and the hierarchical CatDyn and Pella-Tomlinson fits resembled each other more in the diagnostics of stock status. Both methods found that catches of the last 4 years have been close to sustainable annual catches. They also produced close estimates of r (when the CMSY method assumed r between 1 and 1.5) and the sustainable annual harvest. The fact that MSY and latent productivity estimates were close is relevant because those estimates have direct management utility. The two methods differed in other important respects. The CMSY method projected a still decreasing biomass and rising exploitation (F/FMSY), while the hierarchical Pella-Tomlinson showed a stock experiencing stable biomass fluctuations with wide amplitude and slowly decreasing exploitation rate (F/Z). It should be noted that the CMSY has a tendency to overestimate fishing mortality and underestimate biomass when its results are tested against estimates from data-rich studies when depletion priors are not reliable (Bouch et al., 2020). Another aspect that resulted in similar results of these methods is statistical precision. Both CMSY and the hierarchical combination of CatDyn and Pella-Tomlinson yielded very imprecise estimates. On the one hand, the sustainable harvest rate from the CMSY method fell within a range of credibility intervals where the upper bound was nearly six times higher than the lower bound, considering all three assumptions for the range of r. The hierarchical combination of CatDyn and Pella-Tomlinson, on the other hand, yielded a sustainable harvest rate with a coefficient of variation close to 350%. These results confirm previous mythological studies with data-poor fisheries, which concluded that statistical precision of estimates will be a major shortcoming in the expansion of stock assessment techniques to data-poor fisheries (Maynou et al., 2021). One encouraging result though for the particular case studies in this work is that the CMSY method and the hierarchical combination of CatDyn and Pella-Tomlinson produced close estimates, albeit imprecise, of the sustainable harvest rate, 266 tonnes from the former and 309 tonnes from the latter. This coincidence notwithstanding, it appears that in general, the stock assessment of data-poor fisheries will require not just methods suited to fewer data but also, more efforts to collect data.
A biological reference point obtained for pelagic fish sets 40% as the maximum instantaneous exploitation rate (F/Z) that maintains spawning biomass at safe levels (Patterson, 1992). Generalised depletion models showed that the instantaneous exploitation rate has been decreasing since 2015 but this reduction is very gradual and slow, still well over Patterson's 40% empirical boundary. Since this biological reference point was developed for species that grow and reproduce rapidly, in just a few years, it is safe to assume that the bound is even lower for the long-lived pink spiny lobster stock. Thus, from the point of view of the instantaneous exploitation rate, the stock is most likely still overfished. The overfished status is also apparent in both, the dropping biomass presented by the CMSY method and the widely fluctuating biomass presented by the Pella-Tomlinson model. Therefore, in spite of the large statistical uncertainty in all estimates from CMSY and the hierarchical combination of CatDyn and Pella-Tomlinson, on account of the scarcity of data, it seems safe to conclude that the stock is overfished and there in need of a biomass rebuilding program.
Although the LBB method returned an apparently excessively pessimistic outlook for the status of the stock probably because it was affected by varying recruitment during the period of study, its estimate of the optimum size at first capture deserves consideration as a separate and potentially useful estimate. Regulations in Mauritania establish a minimum landing size of 83 mm of cephalothorax length, which is based on the smallest mature female observed. This is much lower than the estimated optimal size at first capture, which amounted to 140-mm cephalothorax length. Examination of the length-frequency data in Figure 2 shows that establishing a 140 mm minimum landing size would leave most of the stock inaccessible to fishers, and it is probably also an overestimate of the true optimal entry size. Nevertheless, the large difference between the current regulation and the estimate of optimal entry size by the LBB method suggests that the current regulation could be too permissive. Rising entry size could also be considered along with other management measures that would seek to rebuild stock biomass. For instance, instead of the size of the smallest mature female, regulations may establish the female size at 50% maturity as the minimum landing size.
In 1958, the fishing effort was moderate, presumably around 1,800 fishing days per year. The total annual catch was then about 800 tonnes, giving a catch per day and per boat of almost 450 kg, more than enough to ensure the economic viability of the fishery. A development plan for the fishery was then set up in 1962, with the support of substantial international funding. The fishing effort was multiplied by seven (more than 12,000 boat days) and production reached 3,500 tonnes. In the following years (1963–1966) and following overexploitation of the stock, the catch-per-unit effort (CPUE), which had already been declining since 1959, was halved and then reduced to a quarter between 1967 and 1970 to reach 100 kg per boat per day, and total production fell to <200 tonnes. It was then necessary to wait about 10 years with a low fishing effort to allow the stock to recover and return to its original state. The quantities declared from 1968 to 1988 varied from 200 to 943 tonnes (in 1987). In 1988, the stock experienced its second overexploitation, and vessels targeting this species were converted to fish for other species. From 1992 to 2013, the reported catches were low or zero and originated from the by-catch of vessels targeting other species. Considering that the data from the last few years (2015–2019) and both the CMSY and the hierarchical method estimate around 300 tonnes as the sustainable harvest, it is apparent that the stock has become much less productive or that the exploitation has nearly always been either excessive or nil, a boom and bust dynamics. Indeed the CMSY showed a reduction by four of the biomass of the lobster over the last years. We hypothesise that it is possible to achieve a stable and sustainable fishery for the pink spiny lobster in Mauritania after rebuilding its biomass and then setting provisional catch limits that accord with the findings in this work while continuing the collection of catch, effort, and length-frequency data to reduce statistical uncertainty in stock assessment estimates.
Data Availability Statement
The original contributions presented in the study are included in the article/supplementary material, further inquiries can be directed to the corresponding author/s.
Author Contributions
BM designed and planned the study. BM, MD, and RR-U drafted the manuscript. BM and RR-U analysed the data. BB, MB, and EB did field work. All authors contributed to the article and approved the submitted version.
Conflict of Interest
The authors declare that the research was conducted in the absence of any commercial or financial relationships that could be construed as a potential conflict of interest.
Publisher's Note
All claims expressed in this article are solely those of the authors and do not necessarily represent those of their affiliated organizations, or those of the publisher, the editors and the reviewers. Any product that may be evaluated in this article, or claim that may be made by its manufacturer, is not guaranteed or endorsed by the publisher.
Acknowledgments
The authors thank their colleagues Seyidna Moussa, Ba Samba, and Sow Harouna for the data collection, Yeslem El Vally for the map, and Gianpaolo Coro, Nazli Dimerel, and Rainer Froese for assistance in improving this article. BM also thanks Ad Corten, Myriam Khalfallah, MLD Palomares, and two reviewers, who helped improve the writing of this study and thanks IMROP for supporting the data collection.
References
Barrowman, N. J., and Myers, R. A. (2000). Still more spawner–recruitment curves: the hockey stick and its generalizations. Cana. J. Fish. Aquat. Sci. 57, 665–676. doi: 10.1139/f99-282
Beverton, R. J. H., and Holt, S. J. (1957). On the dynamics of exploited fish populations. Fish. Investig. 19, 1–533.
Bouch, P., Minto, C., and Reid, D. G. (2020). Comparative performance of data-poor CMSY and data-moderate SPiCT stock assessment methods when applied to data-rich, real-world stocks. ICES J. Mar. Sci. 78, 264–276. doi: 10.1093/icesjms/fsaa220
Briones-Fourzan, P., Lozano-Cabrera, E. M., and Arceo, P. (1997). “Biologia y ecologia de las langostas (crustacea:decapoda: Palinuridae),” in Analisis y Diagnostico de los Recursos Pesqueros Criticos del Golfo de Mexico, eds D. Flores-Harnandez, P. Sanchez-Gil, J. C. Seijo, F. Arreguin-Sandez (Universitad Autonoma de Campech. EPOMEX Serie Cientifica), 81–99
Costello, C., Ovando, D., Hilborn, R., Gaines, S. D., Deschenes, O., and Lester, S. E. (2012). Status and solutions for the worlds unassessed fisheries. Science 338, 517–520. doi: 10.1126/science.1223389
Dia, M., Meissa, B., Harouna, S. A., Alassane, B. S., Moustapha, B., Baye, B. C., et al. (2021). Pink lobster, Palinurus mauritanicus (Gruvel, 1911), from the Mauritanian Coast: elements of biology and exploitation. Pakistan J. Zool. 52, 1–11. doi: 10.17582/journal.pjz/20200722160708
Diop, M., and Kojemiakine, A. (1990). La langouste rose (Panulirus mauritanicus) de Mauritanie: Biologie, pêche et état de stock. Bulletin scientifique du CNROP 21, 15–21.
Fournier, D. A., Skaug, H. J., Ancheta, J., Ianelli, J., Magnusson, A., and Maunder, M. N. (2011): AD Model Builder: usingautomatic differentiation for statistical inference of highly parameterized complex nonlinearmodels. Optim. Methods Softw. 27, 233–249. doi: 10.1080/10556788.2011.597854
Froese, R., Demirel, N., Coro, G., Kleisner, K. M., and Winker, H. (2017). Estimating fisheries reference points from catch and resilience. Fish Fish. 18, 506–526. doi: 10.1111/faf.12190
Froese, R., Winker, H., Coro, G., Demirel, N., Tsikliras, A. C., Dimarchopoulou, D., et al. (2018). A new approach for estimating stock status from length frequency data. ICES J. Mar. Sci. 76, 350–351 doi: 10.1093/icesjms/fsy139
Gislason, H. (2003). The Effects of Fishing on Non-Target Species and Ecosystem Structure and Function. Rome: Food & Agricultural Organization of the United Nations.
Goñi, R., and Latrouite, D. (2005). Biology, ecology and fisheries of Palinurus spp. species of European waters : Palinurus elephas (Fabricius, 1787) and Palinurus mauritanicus (Gruvel, 1911). Cahiers de Biologie Marine 46, 127–142.
Hoening, J. M. (2005). Empirical Use of Longevity Data to Estimate Mortality Rates. North Charleston, SC: SEDAR33-RD17. SEDAR, 8 p.
Maigret, J. (1978). Contribution à l'étude des langoustes de la côte occidentale d'Afrique. (Thèse de doctorat és Sciences Naturelles), Université d'Aix-Marseille, 264p.
Maynou, F., Demestre, M., Martín, P., and Sánchez, P. (2021). Application of a multi-annual generalized depletion model to the Mediterranean sandeel fishery in Catalonia. Fish. Res. 234:105814. doi: 10.1016/j.fishres.2020.105814
Meissa, B., and Gascuel, D. (2014). Overfishing of marine resources: some lessons from the assessment of demersal stocks off Mauritania. ICES J. Mar. Sci. 72, 414–427. doi: 10.1093/icesjms/fsu144
Mueter, F. J., and Megrey, B. A. (2006). Using multi-species surplus production models to estimate ecosystem-level maximum sustainable yields. Fish. Res. 81, 189–201. doi: 10.1016/j.fishres.2006.07.010
Patterson, K. (1992). Fisheries for small pelagic species: an empirical approach to management targets. Rev. Fish Biol. Fish. 2, 321–338. doi: 10.1007/BF00043521
Plummer, M. (2003). “JAGS: a program for analysis of Bayesian graphical models using Gibbs sampling,” in Proceedings of the 3rd International Workshop on Distributed Statistical Computing (DSC 2003), March 20-22, Vienna, eds K. Hornik, F. Leisch, A. Zeileis (Vienna: Vienna Technical University), 20–22.
R Core Team (2020). R: A Language and Environment for Statistical Computing. R Foundation for Statistical Computing, Vienna, Austria. Available online at: http://www.R-project.org/ (accessed September 23, 2021).
Reynolds, J. D., Dulvy, N. K., Goodwin, N. B., and Hutchings, J. A. (2005). Biology of extinction risk in marine fishes. Proc. R. Soc. Lond. Series B 272, 2337–2344. doi: 10.1098/rspb.2005.3281
Ricker, W. E. (1975). Computation and Interpretation of Biological Statistics of Fish Populations. Ottawa, Canada: Bulletin of the Fisheries Research Board of Canada 191, 382p.
Roa-Ureta, R. H. (2015). Stock assessment of the Spanish mackerel (Scomberomorus commerson) in Saudi waters of the Arabian Gulf with generalized depletion models under data-limited conditions. Fish. Res. 171, 68–77. doi: 10.1016/j.fishres.2014.08.014
Roa-Ureta, R. H. (2019). CatDyn: Fishery Stock Assessment by Catch Dynamics Models. Available online at: https://CRAN.R-project.org/package=CatDyn (accessed September 23, 2021).
Roa-Ureta, R. H., Molinet, C., Bahamonde, N., and Araya, P. (2015). Hierarchical statistical framework to combine generalized depletion models and biomass dynamic models in the stock assessment of the Chilean sea urchin (Loxechinus albus) fishery. Fish. Res. 171, 59–67. doi: 10.1016/j.fishres.2014.12.006
Roa-Ureta, R. H., Santos, M. N., and Leitão, F. (2019). Modelling long-term fisheries data to resolve the attraction versus production dilemma of artificial reefs. Ecol. Model. 407:108727. doi: 10.1016/j.ecolmodel.2019.108727
Schnute, J. T., and Kronlund, A. R. (1996). A management oriented approach to stock recruitement analysis. Can. J. Fish. Aquat. Sci. 53, 1281–1293. doi: 10.1139/f96-069
Sow, A., Zongo, B., and Kabre, T. J. (2019). Growth patterns and exploitation status of the spiny lobster species Palinurus mauritanicus (Gruvel 1911) in Mauritanian coasts. Int. J. Agric. Policy Res. 7, 17–31. doi: 10.15739/IJAPR.19.003
The World Bank (2012). Hidden Harvest. The Global Contribution of Capture Fisheries. Report N0. 66469-GLB. Available online at: https://openknowledge.worldbank.org/handle/10986/11873 (accessed June 11, 2021).
Thorson, J. T., Hicks, A. C., and Methot, R. D. (2015). Random effect estimation of time-varying factors in stock synthesis. ICES J. Mar. Sci. 72, 178–185. doi: 10.1093/icesjms/fst211
Von Bertalanffy, L. (1938). A quantitative theory of organic growth (inquiries on growth laws. ii). Hum. Biol. 10, 181–213.
Keywords: stock assessment, data-poor, LBB, CMSY, CatDyn, pink lobster, Mauritania
Citation: Meissa B, Dia M, Baye BC, Bouzouma M, Beibou E and Roa-Ureta RH (2021) A Comparison of Three Data-Poor Stock Assessment Methods for the Pink Spiny Lobster Fishery in Mauritania. Front. Mar. Sci. 8:714250. doi: 10.3389/fmars.2021.714250
Received: 24 May 2021; Accepted: 07 September 2021;
Published: 12 October 2021.
Edited by:
Simone Libralato, Istituto Nazionale di Oceanografia e di Geofisica Sperimentale, ItalyReviewed by:
Amy Schueller, Southeast Fisheries Science Center (NOAA), United StatesJin Gao, Memorial University of Newfoundland, Canada
Copyright © 2021 Meissa, Dia, Baye, Bouzouma, Beibou and Roa-Ureta. This is an open-access article distributed under the terms of the Creative Commons Attribution License (CC BY). The use, distribution or reproduction in other forums is permitted, provided the original author(s) and the copyright owner(s) are credited and that the original publication in this journal is cited, in accordance with accepted academic practice. No use, distribution or reproduction is permitted which does not comply with these terms.
*Correspondence: Beyah Meissa, Ym1vdWxkaGFiaWJAZ21haWwuY29t