 Joshua Himmelstein
 Orencio Duran Vinent1,3*
 Stijn Temmerman
- 1Virginia Institute of Marine Science, College of William and Mary, Williamsburg, VA, United States
- 2Institute of Marine Sciences, The University of North Carolina at Chapel Hill, Morehead City, NC, United States
- 3Department of Ocean Engineering, Texas A&M University, College Station, TX, United States
- 4Ecosystem Management Research Group, Department of Biology, University of Antwerp, Antwerp, Belgium
The development and expansion of ponds within otherwise vegetated coastal marshes is a primary driver of marsh loss throughout the world. Previous studies propose that large ponds expand through a wind wave-driven positive feedback, where pond edge erosion rates increase with pond size, whereas biochemical processes control the formation and expansion of smaller ponds. However, it remains unclear which mechanisms dominate at a given scale, and thus how, and how fast, ponds increase their size. Here, we use historical photographs and field measurements in a rapidly submerging microtidal marsh to quantify pond development and identify the processes involved. We find that as small ponds emerge on the marsh platform, they quickly coalesce and merge, increasing the number of larger ponds. Pond expansion rates are maximized for intermediate size ponds and decrease for larger ponds, where the contribution of wave-driven erosion is negligible. Vegetation biomass, soil shear strength, and porewater biogeochemical indices of marsh health are higher in marshes adjacent to stable ponds than in those adjacent to unstable ponds, suggesting that pond growth rates are negatively related to the health of the surrounding marsh. We find that the model of Vinent et al. (2021) correctly predicts measured pond growth rates and size distribution, which suggest the different mechanisms driving pond growth are a result of marsh drowning due to sea level rise (SLR) and can be estimated by simplified physical models. Finally, we show that all relevant processes increasing pond size can be summarized by an empirical power-law equation for pond growth which predicts the temporal change of the maximum pond size as a lower bound for the total pond area in the system. This gives a timescale for the growth of ponds by merging and thus the critical time window for interventions to prevent the irreversible pond expansion associated with large scale pond merging.
Introduction
Marshes buffer coasts from storms, sequester carbon, improve water quality, and provide rich habitats for fish and wildlife (Shriver et al., 2004; Barbier et al., 2011; Möller et al., 2014; Nahlik and Fennessy, 2016; Zhu et al., 2020). Sea level rise (SLR) and reduced sediment supply threaten the sustainability of marshes (Reed et al., 1999; Kirwan and Megonigal, 2013; Weston, 2014). While marshes have some ability to survive SLR by migrating into adjacent uplands and accreting soil vertically (Pethick, 1992; Temmerman et al., 2003; Kirwan et al., 2016; Fagherazzi et al., 2019), in many regions of the world they are eroding laterally, accreting less than the local rate of SLR, and converting to open water through the development of unvegetated ponds in the marsh interior (Stevenson et al., 1985; Day et al., 2000; Carniello et al., 2009).
Ponding is a primary driver of marsh loss in submerging marshes, and as such is considered an important indicator of marsh health (Kearney et al., 1988; Nyman et al., 1994; Mariotti and Fagherazzi, 2013; Mariotti, 2016; Schepers et al., 2017; Wang et al., 2021). While salt marsh vegetation enhances sediment deposition through flow baffling and resists soil erosion through root material (Allen, 1990; Pethick, 1992; Mudd et al., 2010; Vandenbruwaene et al., 2011), loss of vegetation can lead to sediment export and irreversible marsh collapse (DeLaune et al., 1994; van Huissteden and van de Plassche, 1998; Day et al., 2011; Temmerman et al., 2012) such that vegetated marshes and unvegetated ponds may be viewed as alternative stable states (Wang and Temmerman, 2013; Belzen et al., 2017; Schepers et al., 2020a). Indeed, marshes with large proportions of unvegetated area tend to export more sediment than those with large proportions of vegetated area (Ganju et al., 2013; Ganju et al., 2020), suggesting a positive feedback where pond development leads to sediment export, and potentially runaway marsh loss.
Ponds form through a variety of mechanisms, though the process usually begins in the interior marsh with a local loss or dieback of vegetation (DeLaune et al., 1994; Hartig et al., 2002). Physical mechanisms include disturbance events such as herbivory, bioturbation, ice scour, and wrack deposition (Pethick, 1974; Wilson et al., 2014). Ponds may also initiate through vegetation mortality associated with waterlogging stress affecting soil biogeochemistry and implying toxicity to vegetation, whereby root zone degradation leads to erosion and subsidence of otherwise cohesive marsh soils (Kearney et al., 1988; Nyman et al., 1993; Johnston et al., 2003; Spivak et al., 2017). These processes depend on the hydrologic properties of a marsh, especially its hydroperiod, elevation relative to tidal datums, and connectivity to channels. For example, ponds typically form and are most prevalent in the marsh interior, far from the tidal channels that deliver sediment and drain waterlogged soils (Redfield, 1972; Kearney et al., 1988; Schepers et al., 2017; Vinent et al., 2021). These processes are expected to accelerate with SLR, especially in marshes with limited sediment supply and low tidal range (Millette et al., 2010; Wilson et al., 2009; Schepers et al., 2017; Vinent et al., 2021; Wang et al., 2021).
Ponds tend to grow until they intersect tidal channels which may promote vegetation recovery under favorable sediment balances (Wilson et al., 2014; Mariotti, 2016), or else accelerate pond erosion (Schepers et al., 2020a; Wang et al., 2021). For large ponds, wave-driven erosion depends on ponds exceeding a critical width necessary for the development of wind waves, thought to be in the range 200–1,000 m (which corresponds to areas in the range 3 × 10⁴–8 × 10⁵ m2, assuming circular ponds) in US Atlantic and Gulf Coast marshes (Mariotti and Fagherazzi, 2013; Ortiz et al., 2017). However, the processes by which ponds smaller than this critical width expand remain poorly understood. Peat collapse, rotational slumping, and current-induced sediment transport have been identified as potential contributors (Kearney et al., 1988; Day et al., 2011; Spivak et al., 2017; Schepers et al., 2020a). A recent model (Mariotti et al., 2020) simulates pond formation, expansion and merging in Barnstable, MA, with a particular focus on processes driving marsh edge erosion. In contrast, the model of Vinent et al. (2021) simulates pond dynamics simply as a result of marsh drowning due to SLR. The multiplicity of model assumptions and parameters can benefit from calibration and validation through empirical information.
Here we define and measure different rates of pond growth to show that both the rates and mechanisms of pond expansion depend on pond size and that the expansion of small ponds is driven largely by the coalescence of individual ponds and the health of surrounding marsh. By comparing our results with predictions of Vinent et al. (2021)’s model, we show that measured rates of pond formation, biochemical expansion and the initial stages of merging are consistent with marsh drowning due to SLR.
Materials and Methods
Study Area
We studied the distribution of ponds in a portion of the Blackwater National Wildlife Refuge, near the headwaters of the Blackwater River, a tributary of the Chesapeake Bay (Maryland, United States) (Figure 1). This area is part of the mid-Atlantic SLR hotspot (Sallenger et al., 2012), with rates of relative SLR that are more than twice the global average (Ezer et al., 2013). Twentieth century relative SLR rates (3.83 mm yr–1 at Cambridge, MD; NOAA Station 8571892) generally exceed local accretion rates of 1.7–3.6 mm yr–1 (Stevenson et al., 1985). Marshes in the study area are microtidal, low in elevation, sediment deficient, and heavily ponded (Stevenson et al., 1985; Ganju et al., 2013).
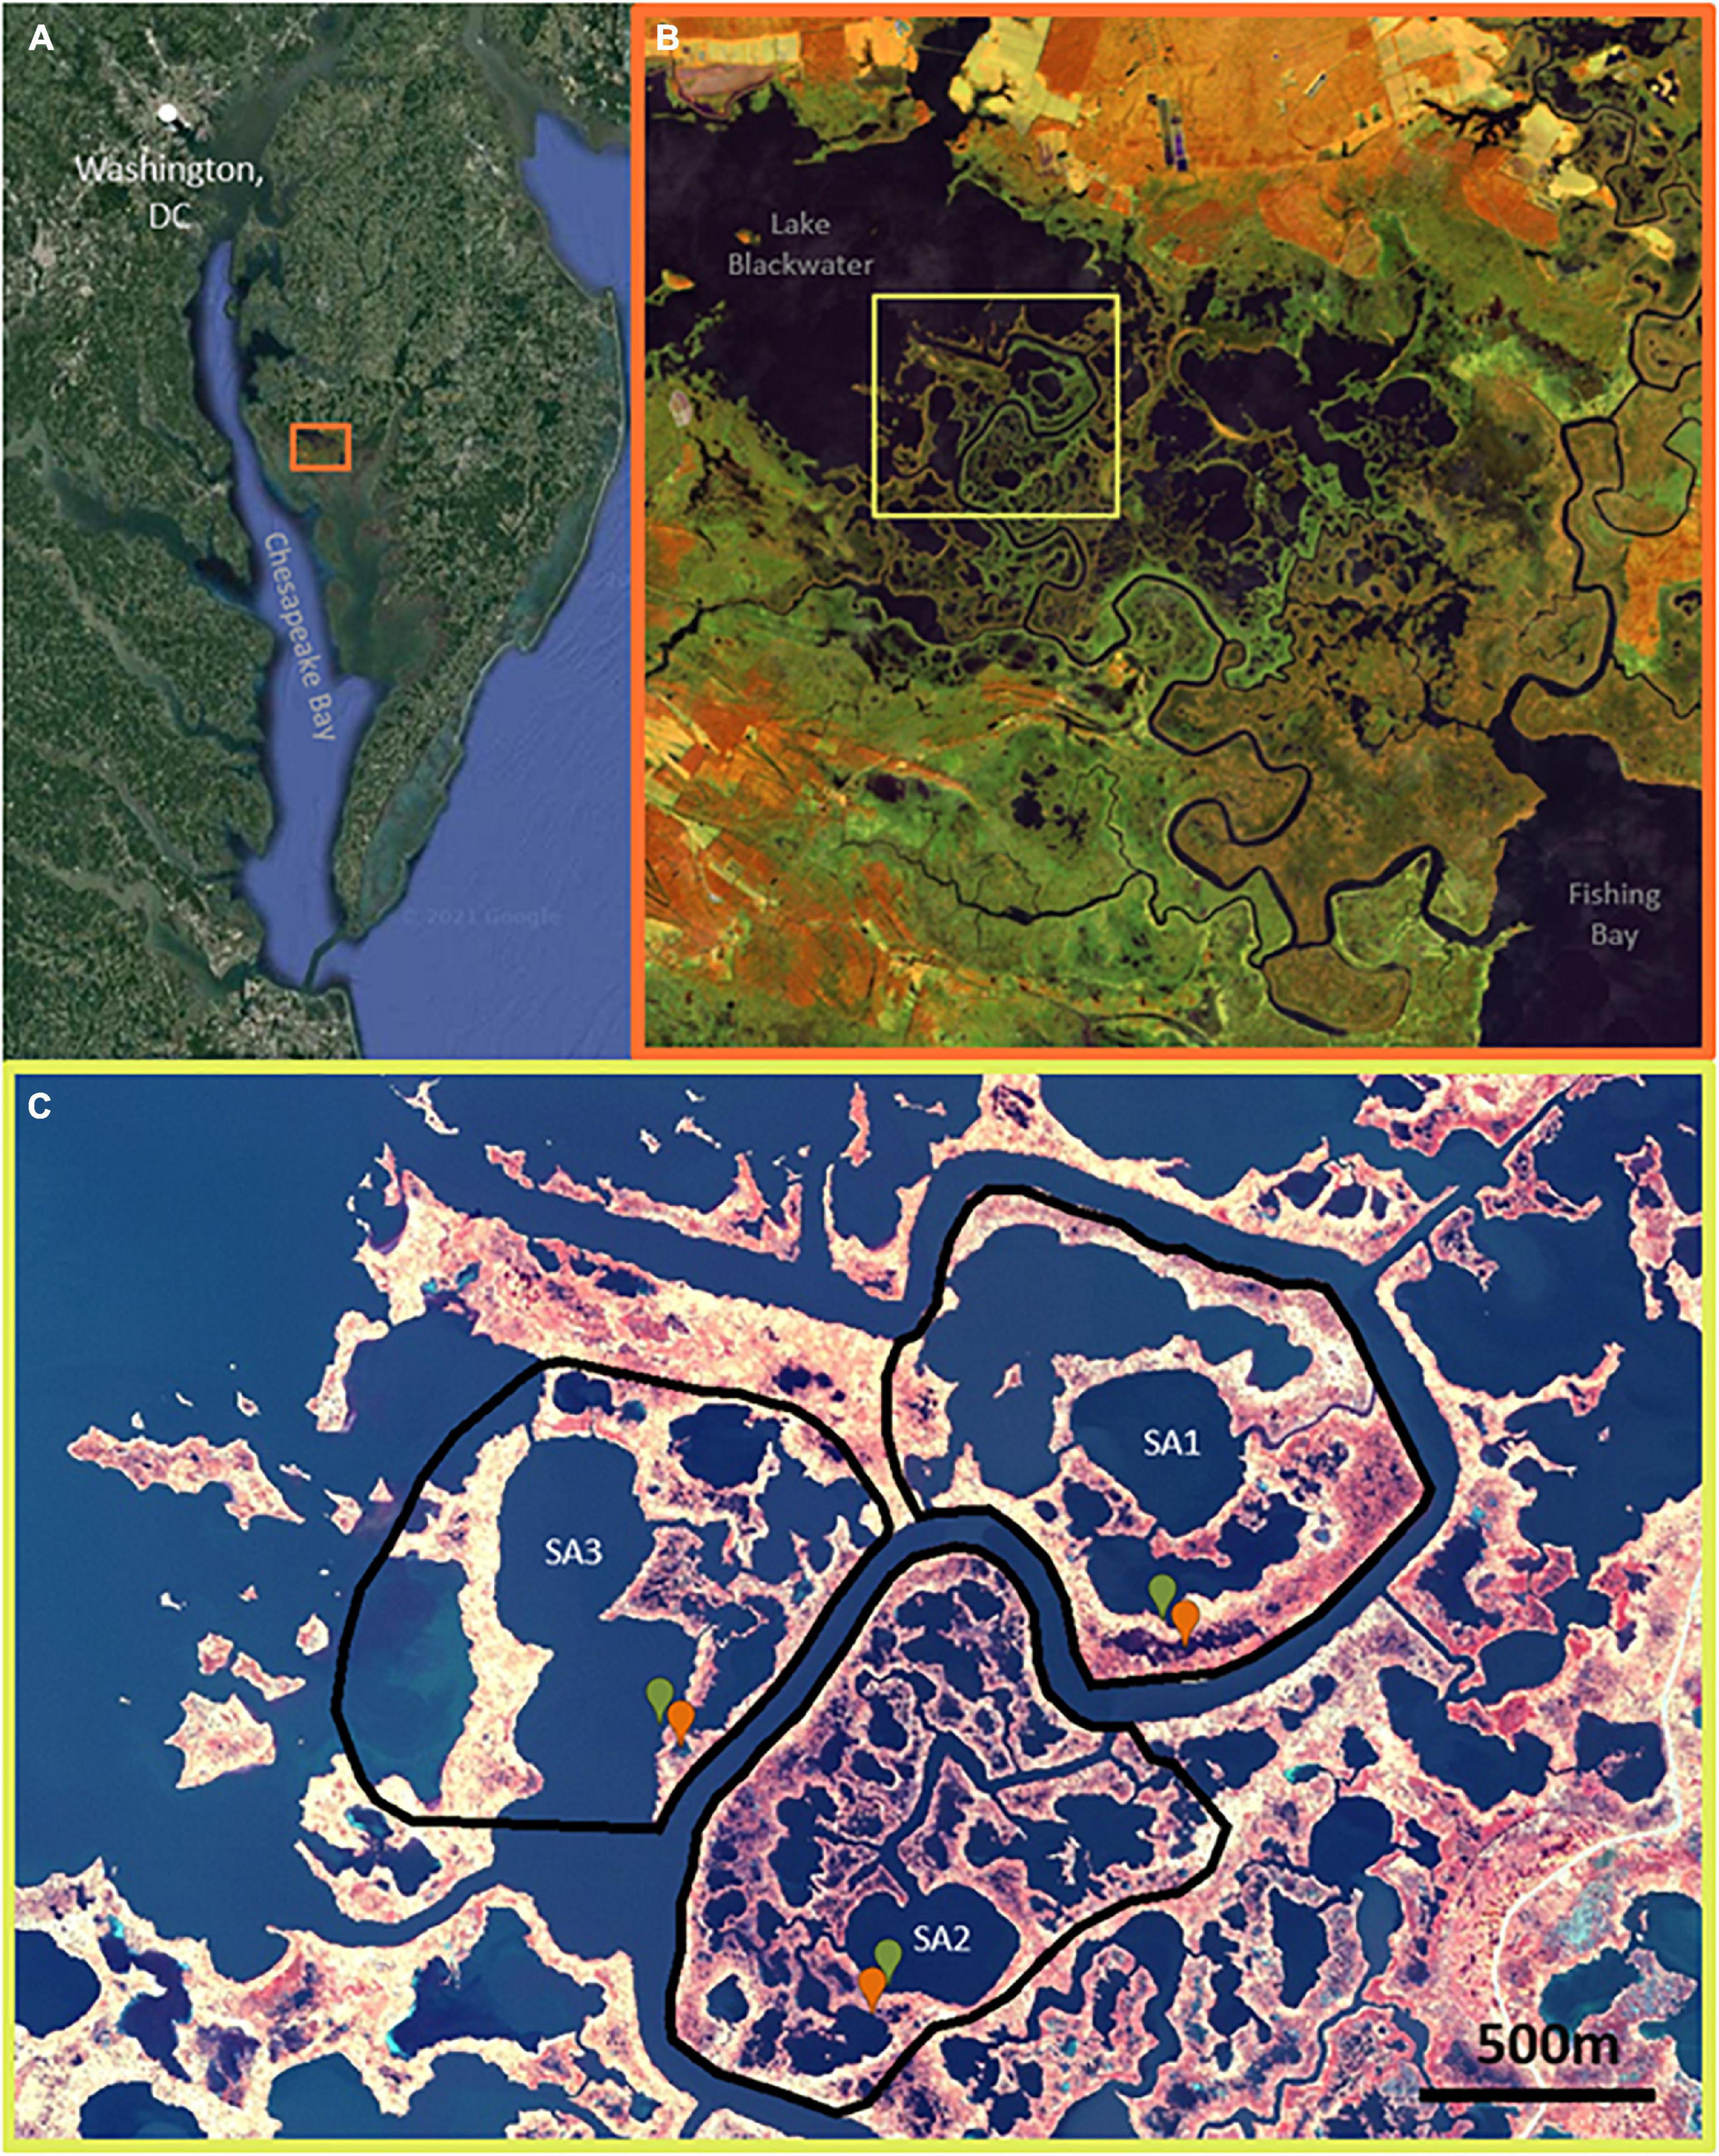
Figure 1. (A) Location of Blackwater Wildlife Refuge (38.4220° N, 76.0624° W) outlined by orange square on the Eastern edge of Chesapeake Bay. (B) Overview of the 28,000-acre refuge, evidencing vegetation die-off and marsh loss following a gradient from low die-off near southeastern Fishing Bay to high die-off near Lake Blackwater at the northwest reaches of Blackwater River; false-color (NIR, SWIR, R) Sentinel-2 imagery 2020-11. (C) The three study areas used for remote sensing analyses with the field-sampled ponds (green is stable, red is unstable) indicated within; false-color (NIR, G, B) NAIP 2018-11-04.
Approximately half of the marshes in the Blackwater National Wildlife refuge have been lost to ponding since 1938 (Scott et al., 2009; Schepers et al., 2017). Marsh ponding increases with distance from the river mouth at Fishing Bay (Figure 1), following gradients in elevation, sediment supply, and tidal range (Schepers et al., 2017). The upper reaches of the Blackwater River, where this study is focused, are characterized by strong sediment export especially during northwesterly winds, when winds are oriented parallel to the long-axis of Lake Blackwater and other large ponds, resulting in wave erosion and sediment resuspension (Ganju et al., 2013). Tidal range decreases from ∼1.0 m at Fishing Bay to <0.2 m at Lake Blackwater (Wang and Elliott, 1978; Schepers et al., 2020a). Marshes consist of mesohaline vegetation, with Schoenoplectus americanus and Spartina alterniflora occupying the lowest elevation marshes, Distichlis spicata and Spartina patens occupying intermediate elevations, and Spartina cynusuroides and Phragmites australis occupying the highest elevations (Kirwan and Guntenspergen, 2012). Marsh elevations decrease with distance from Fishing Bay (Schepers et al., 2020b), and more than 80% of marshes near the headwaters of the Blackwater River have elevations that are lower than the optimum elevation for S. americanus root growth and organic matter accretion (Kirwan and Guntenspergen, 2012, 2015). Extensive, permanent marsh loss has been observed through the past century, with vegetation loss increasing with distance from Fishing Bay toward our study areas (Stevenson et al., 1985; Schepers et al., 2017).
Historical Pond Growth
We examined patterns of historical pond growth in the upper Blackwater River marshes using historical photographs from 1938, 1960, 1981, and 2010 (Table 1). Imagery was resampled to the coarsest image resolution (1.55 m per pixel edge) to avoid resolution bias, and georeferenced to a common datum (Maryland State Plane—Lambert Conformal Conic NAD 1983). Three study areas (∼106 m2 each) were chosen adjacent to the upper reaches of the Blackwater River, where ponding is most extensive (Figure 1).
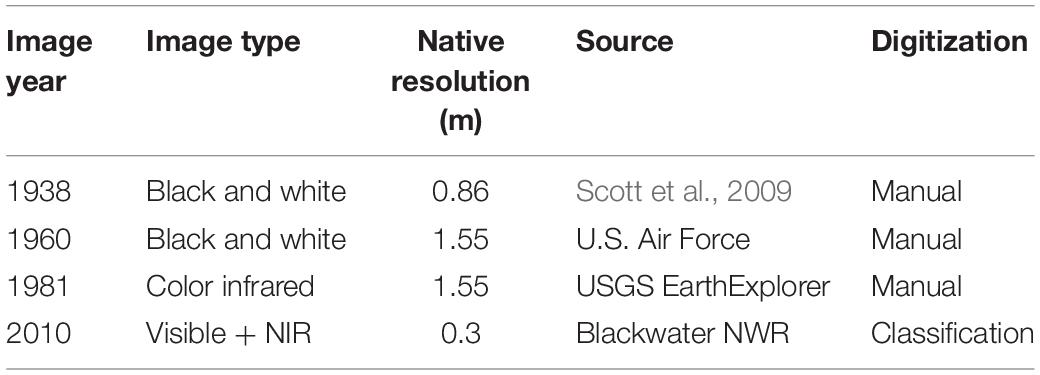
Table 1. Aerial photography summary, native resolutions were resampled before analysis to 1.55 m as described in text.
We delineated individual polygons to track pond growth through time and to explore differences between study areas. Each study area includes a large, central pond connected to the Blackwater River in the 1938 imagery. We recorded water patches ≥50 m2 as individual ponds through extraction of existing digitized polygons (Schepers et al., 2017) and manual digitization and rectification in ArcGIS. Due to the small astronomical tidal range at this reach of Blackwater River (∼0.25 m), and evidenced by water presence across all available imagery, depressions are consistently submerged and as such are defined as ponds. These ponds were considered to be merged with one another when connection widths were at least 25% that of the smaller pond’s intermediate axis. Maximum likelihood classification of 2010 ponds in the study area had a 97% accuracy based on ground verification points in the most recently analyzed imagery (Schepers et al., 2017). All polygons were visually inspected for consistency with ponds in the historic imagery and amended when erroneous. The number of ponds, areal extent, and growth patterns (merging of multiple ponds vs. expansion of individual ponds) were recorded separately in each study area and at each timestep for use in the expansion and merging calculations described below. Each pond polygon was assigned a unique identifier, while ponds composed of previously individual ponds contained past identities appended to their own unique identifier.
We consider three possibilities for pond formation and growth (Figure 2): new ponds, when a pond appears where none existed before; single pond growth, when individual ponds overlap in consecutive images; and merged ponds, when an individual pond overlaps several ponds from a previous image.
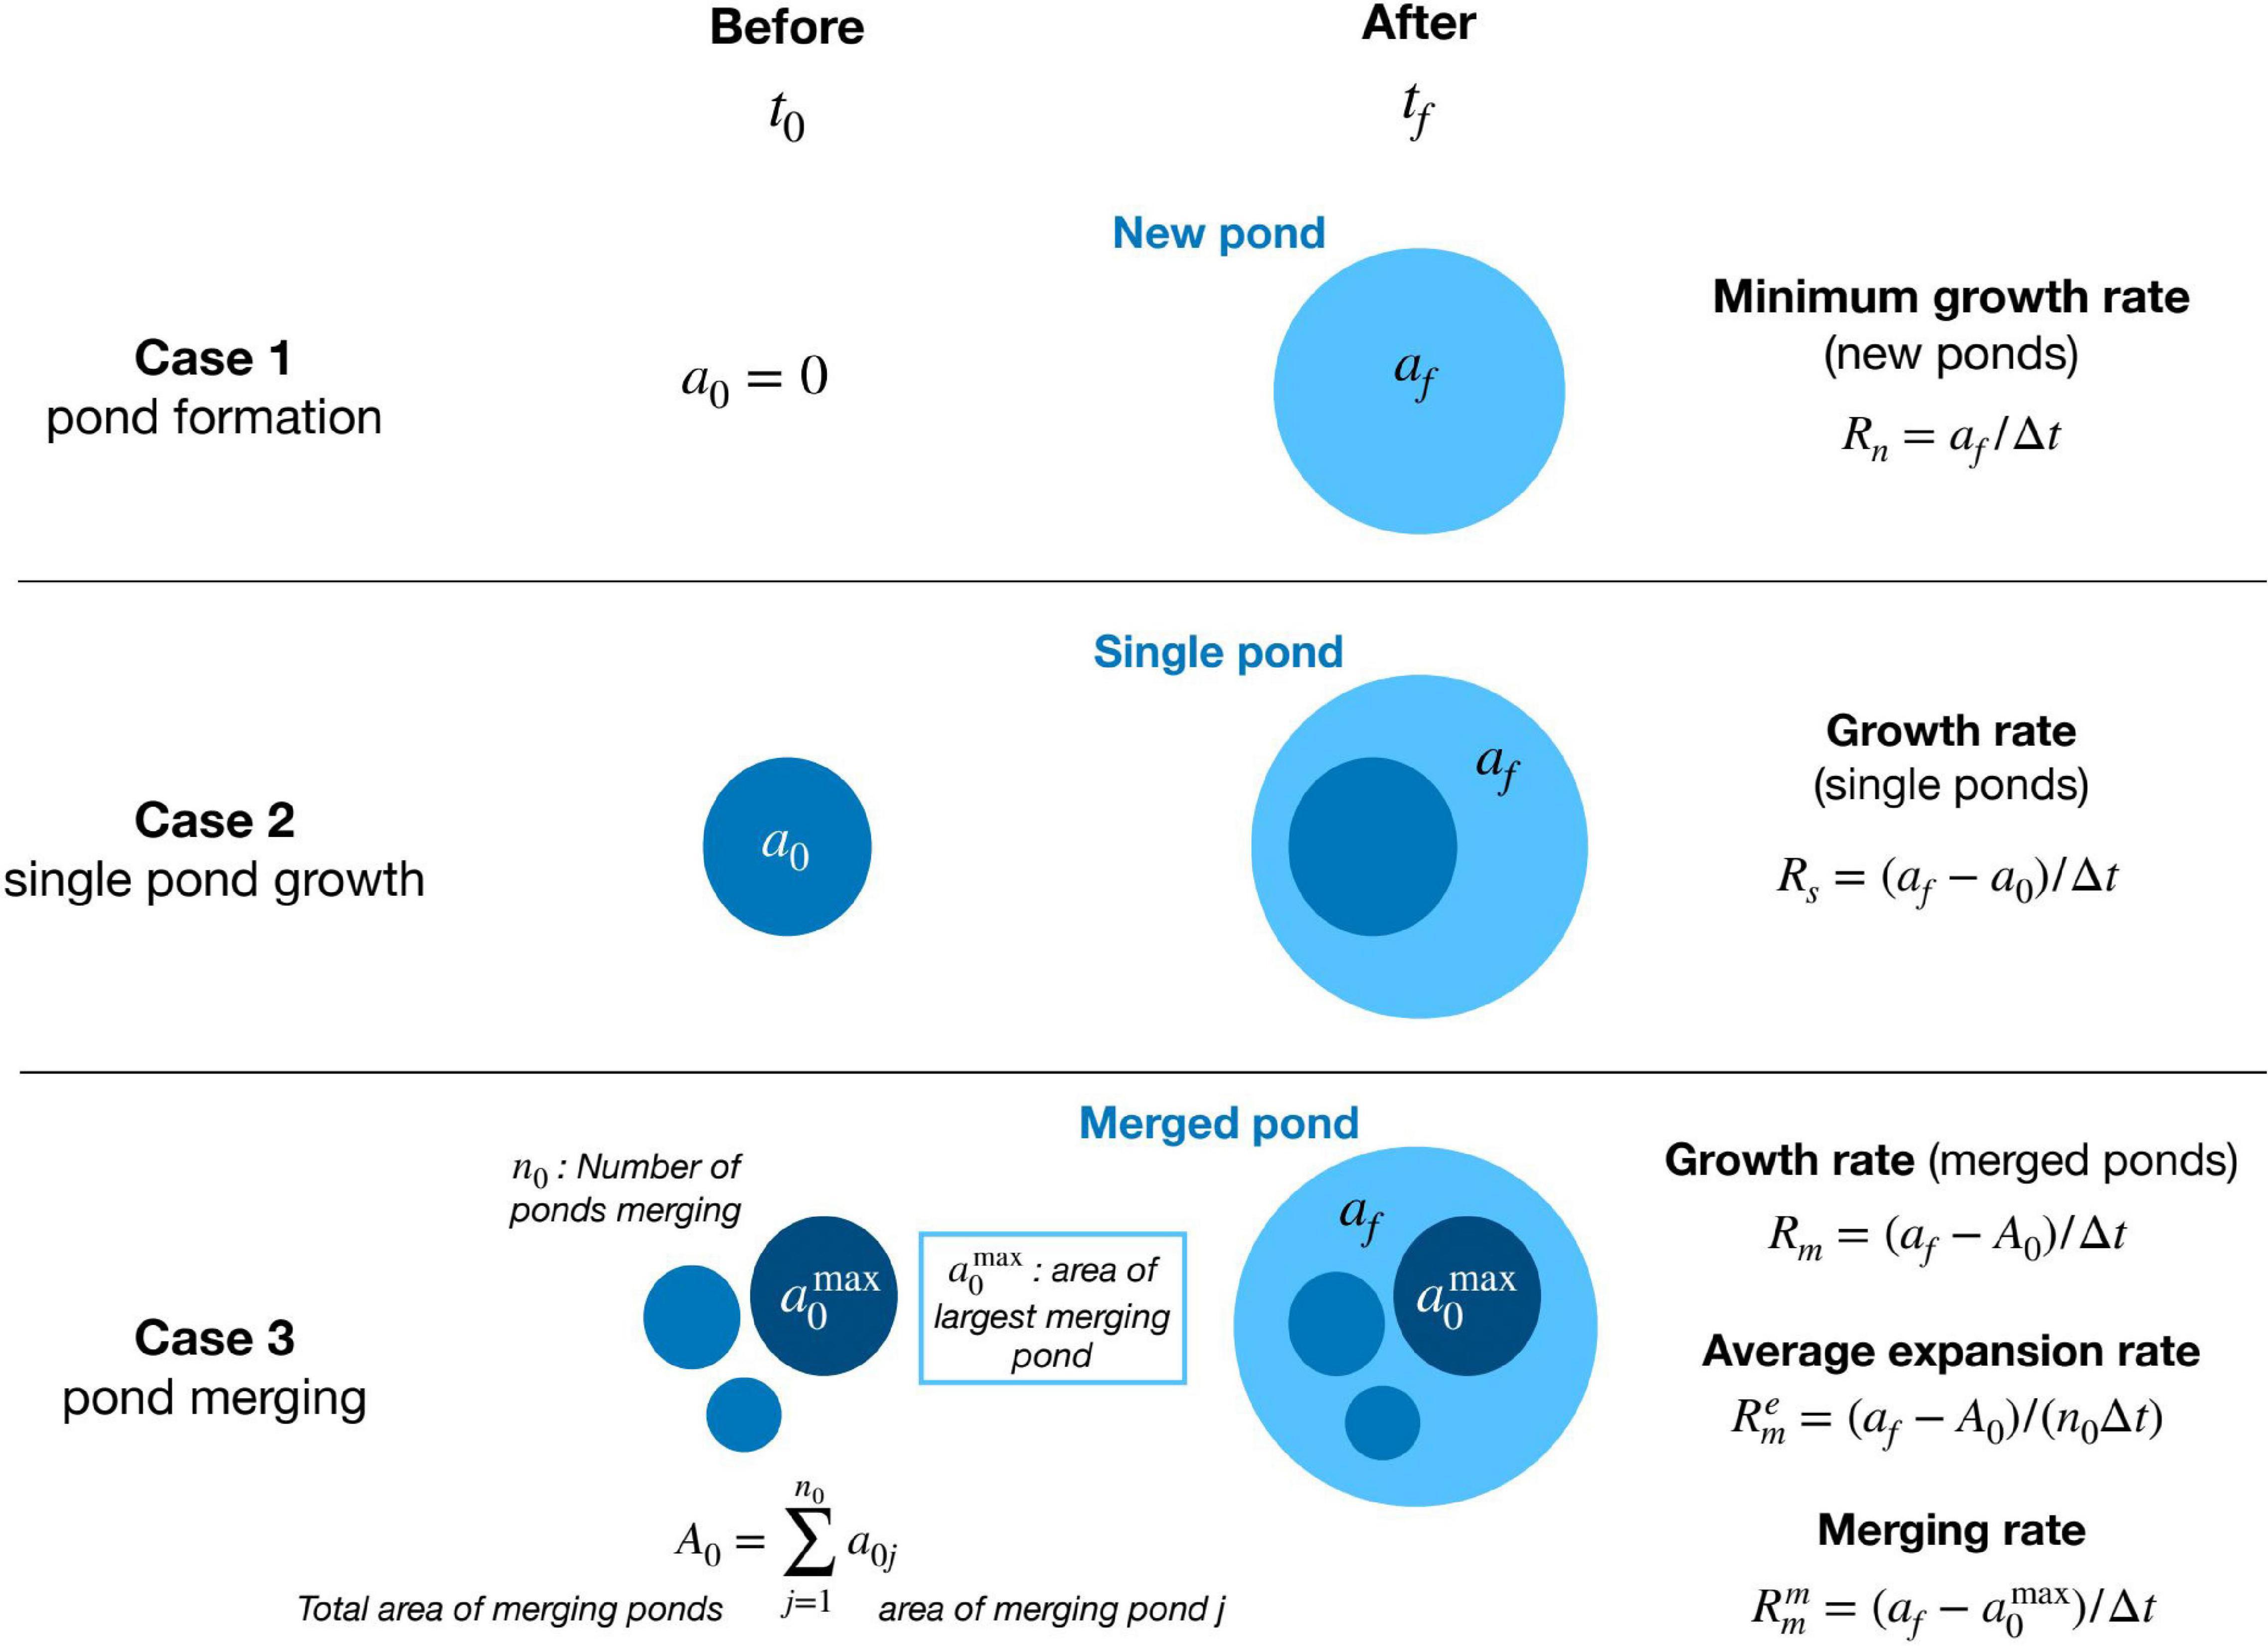
Figure 2. Contrasting cases of pond growth, from two consecutive images at times t0 and t1 = t0 + Δt, and the respective area growth rates (see text for explanation of formulas).
Single Ponds
The areal growth rate of single ponds is defined as
where a0 and afare the initial and final pond areas and Δt = tf−t0 is the time between consecutive images. For single ponds, we also define a lateral (linear) growth rate (G) assuming circular shape, as:
which yields a first order estimate of the erosion rate at the pond’s edge.
New Ponds
In the case of new ponds, we lack information regarding the exact time of pond formation because, by definition, the initial area is 0. Therefore, we can only estimate a lower bound for the rate of pond growth:
Merged Ponds
Similarly, for merged ponds the initial pond area is not unique (composed of several ponds) and the individual pond growth rate is not well-defined. Nevertheless, we can still define three relevant growth rates: a total growth rate of the merged pond (Rm), an average expansion rate () characterizing each pond’s expansion during merging, and a merging rate () characterizing the net growth of the largest pond as merging takes place (Figure 2).
The growth rate (Rm) of the merged pond is defined as:
where afis the area of the merged pond and A0 is the total area of the n0 initial merging ponds (Figure 2). This rate represents the total change in water area during merging.
The average expansion rate () is defined by dividing the total growth rate by the number n0 of merging ponds (Figure 2):
and represents the growth rate of the average merged pond with initial area A0/n0 and final area af/n0.
Finally, we define the merging rate () of the largest merging pond as:
where is the area of the largest merging pond and af is the area of the final merged pond (Figure 2). By construction, the merging rate includes all relevant processes increasing the area of the largest pond during the time interval between consecutive images. This includes individual pond expansion and the formation and merging of new ponds.
As expected, if only one initial pond is present, n0=1 and , and all rates for merged ponds are equal and equivalent to the single pond case. On the contrary, when the number of ponds merging is large, the expansion rate becomes negligible while the merging rate increases following the jump in pond size after merging.
Furthermore, to account for the potential effect of pond size on the growth rate, we also consider the relative change in pond area per unit time defined as the ratio (af/a0) between final and initial pond area divided by the time interval △t. For merged ponds the initial pond area corresponds to that of the largest merging pond . The relative change in pond area is undefined for new ponds as a0=0.
These different rates help distinguish patterns of pond growth through space and time, and quantify the relative contributions of new pond formation, growth of individual ponds, and pond merging as drivers of changes in pond size.
Contribution of Wind-Driven Wave Erosion to Edge Retreat
We used the formulation in Mariotti and Fagherazzi (2013) to estimate wave power density from linear wave theory and quantify the contribution of wave-driven erosion to edge retreat for the different pond sizes tracked here. We set the erodibility coefficient to 0.1 m2 yr–1 W–1 to reproduce the range of erosion rates measured at Lake Blackwater using an average wind velocity of 6 m s−1 and water depths of 0.3 and 0.5 m, which are typical of the large ponds in our study areas (Schepers et al., 2020b). In the calculation of the wave power, we approximate the pond fetch by the diameter of a circle with the same measured pond area.
Characteristics of Stable and Unstable Ponds
To explore potential biological drivers of pond growth observed in the imagery, we measured several indicators of marsh health adjacent to a set of stable and unstable ponds. Within each of the three study areas we selected one stable pond (defined as annual areal growth rate < 1%; 0.54, 0.22, and 0.17 for SA 1, 2, 3, respectively) and one unstable pond (annual areal growth rate > 1%; 1.78, 1.79, and 6.39 for SA 1, 2, 3, respectively). At each of these six total ponds, we measured soil shear strength, above-ground biomass, and porewater chemistry in the surrounding marsh in August 2017. Three replicate measurements were made 1 m inland from the marsh-pond edge and compared to three replicate measurements from a reference marsh located 10 m inland from the marsh-pond edge, resulting in a total of 36 measurements of each indicator of marsh health.
Soil shear strength was measured using a Humboldt H-4227 Shear Vane to infer a relative measure for the erodibility of marsh soils surrounding ponds (Jafari et al., 2019). We measured shear strength at four depths below the soil surface (10, 25, 35, and 55 cm) to capture a profile of soil strength above and below the vegetation rooting depth (approximately 30 cm in the study area) (Schepers, 2017). Plant productivity was measured as end of season live aboveground biomass (Squiers and Good, 1974) using destructive harvest techniques in characteristic 0.25 m × 0.25 m plots.
Porewater was collected from the marsh soil at a depth of 15 cm using a syringe attached to a bottom-perforated metal rod then passed through a 45-micron filter to remove organic particulates. Porewater samples were analyzed in the lab to determine the concentration of Hydrogen sulfide (H2S) and Ammonium (NH4+), which are potential indicators of anaerobic soils, inhibited nitrogen uptake for plants, and reduced plant growth (Mendelssohn and McKee, 1988; Burdick and Mendelssohn, 1990; van Huissteden and van de Plassche, 1998; Spivak et al., 2017). We determined concentrations of H2S and NH4+ via spectrophotometry using the Lachat QuikChem FIA (Method adapted from Cline, 1969).
Results
Historical Pond Growth
Total ponded area continuously increased with time in each study area at an average rate of (3.5 ± 2.2) × 103 m2 yr–1 (mean and standard deviation). It increased the most in Study Area 1, where pond area approximately quadrupled from 100,732 m2 in 1938 to 402,588 m2 in 2010. During the same time, ponded area almost tripled in Study Area 2 (from 133,709 to 354,430 m2) and more than doubled in Study Area 3 (from 254,817 to 528,370 m2) (Figures 3A–C). By 2010, most ponds that existed in 1938 had visually merged to form larger ones, except for the large central pond already present in each study area.
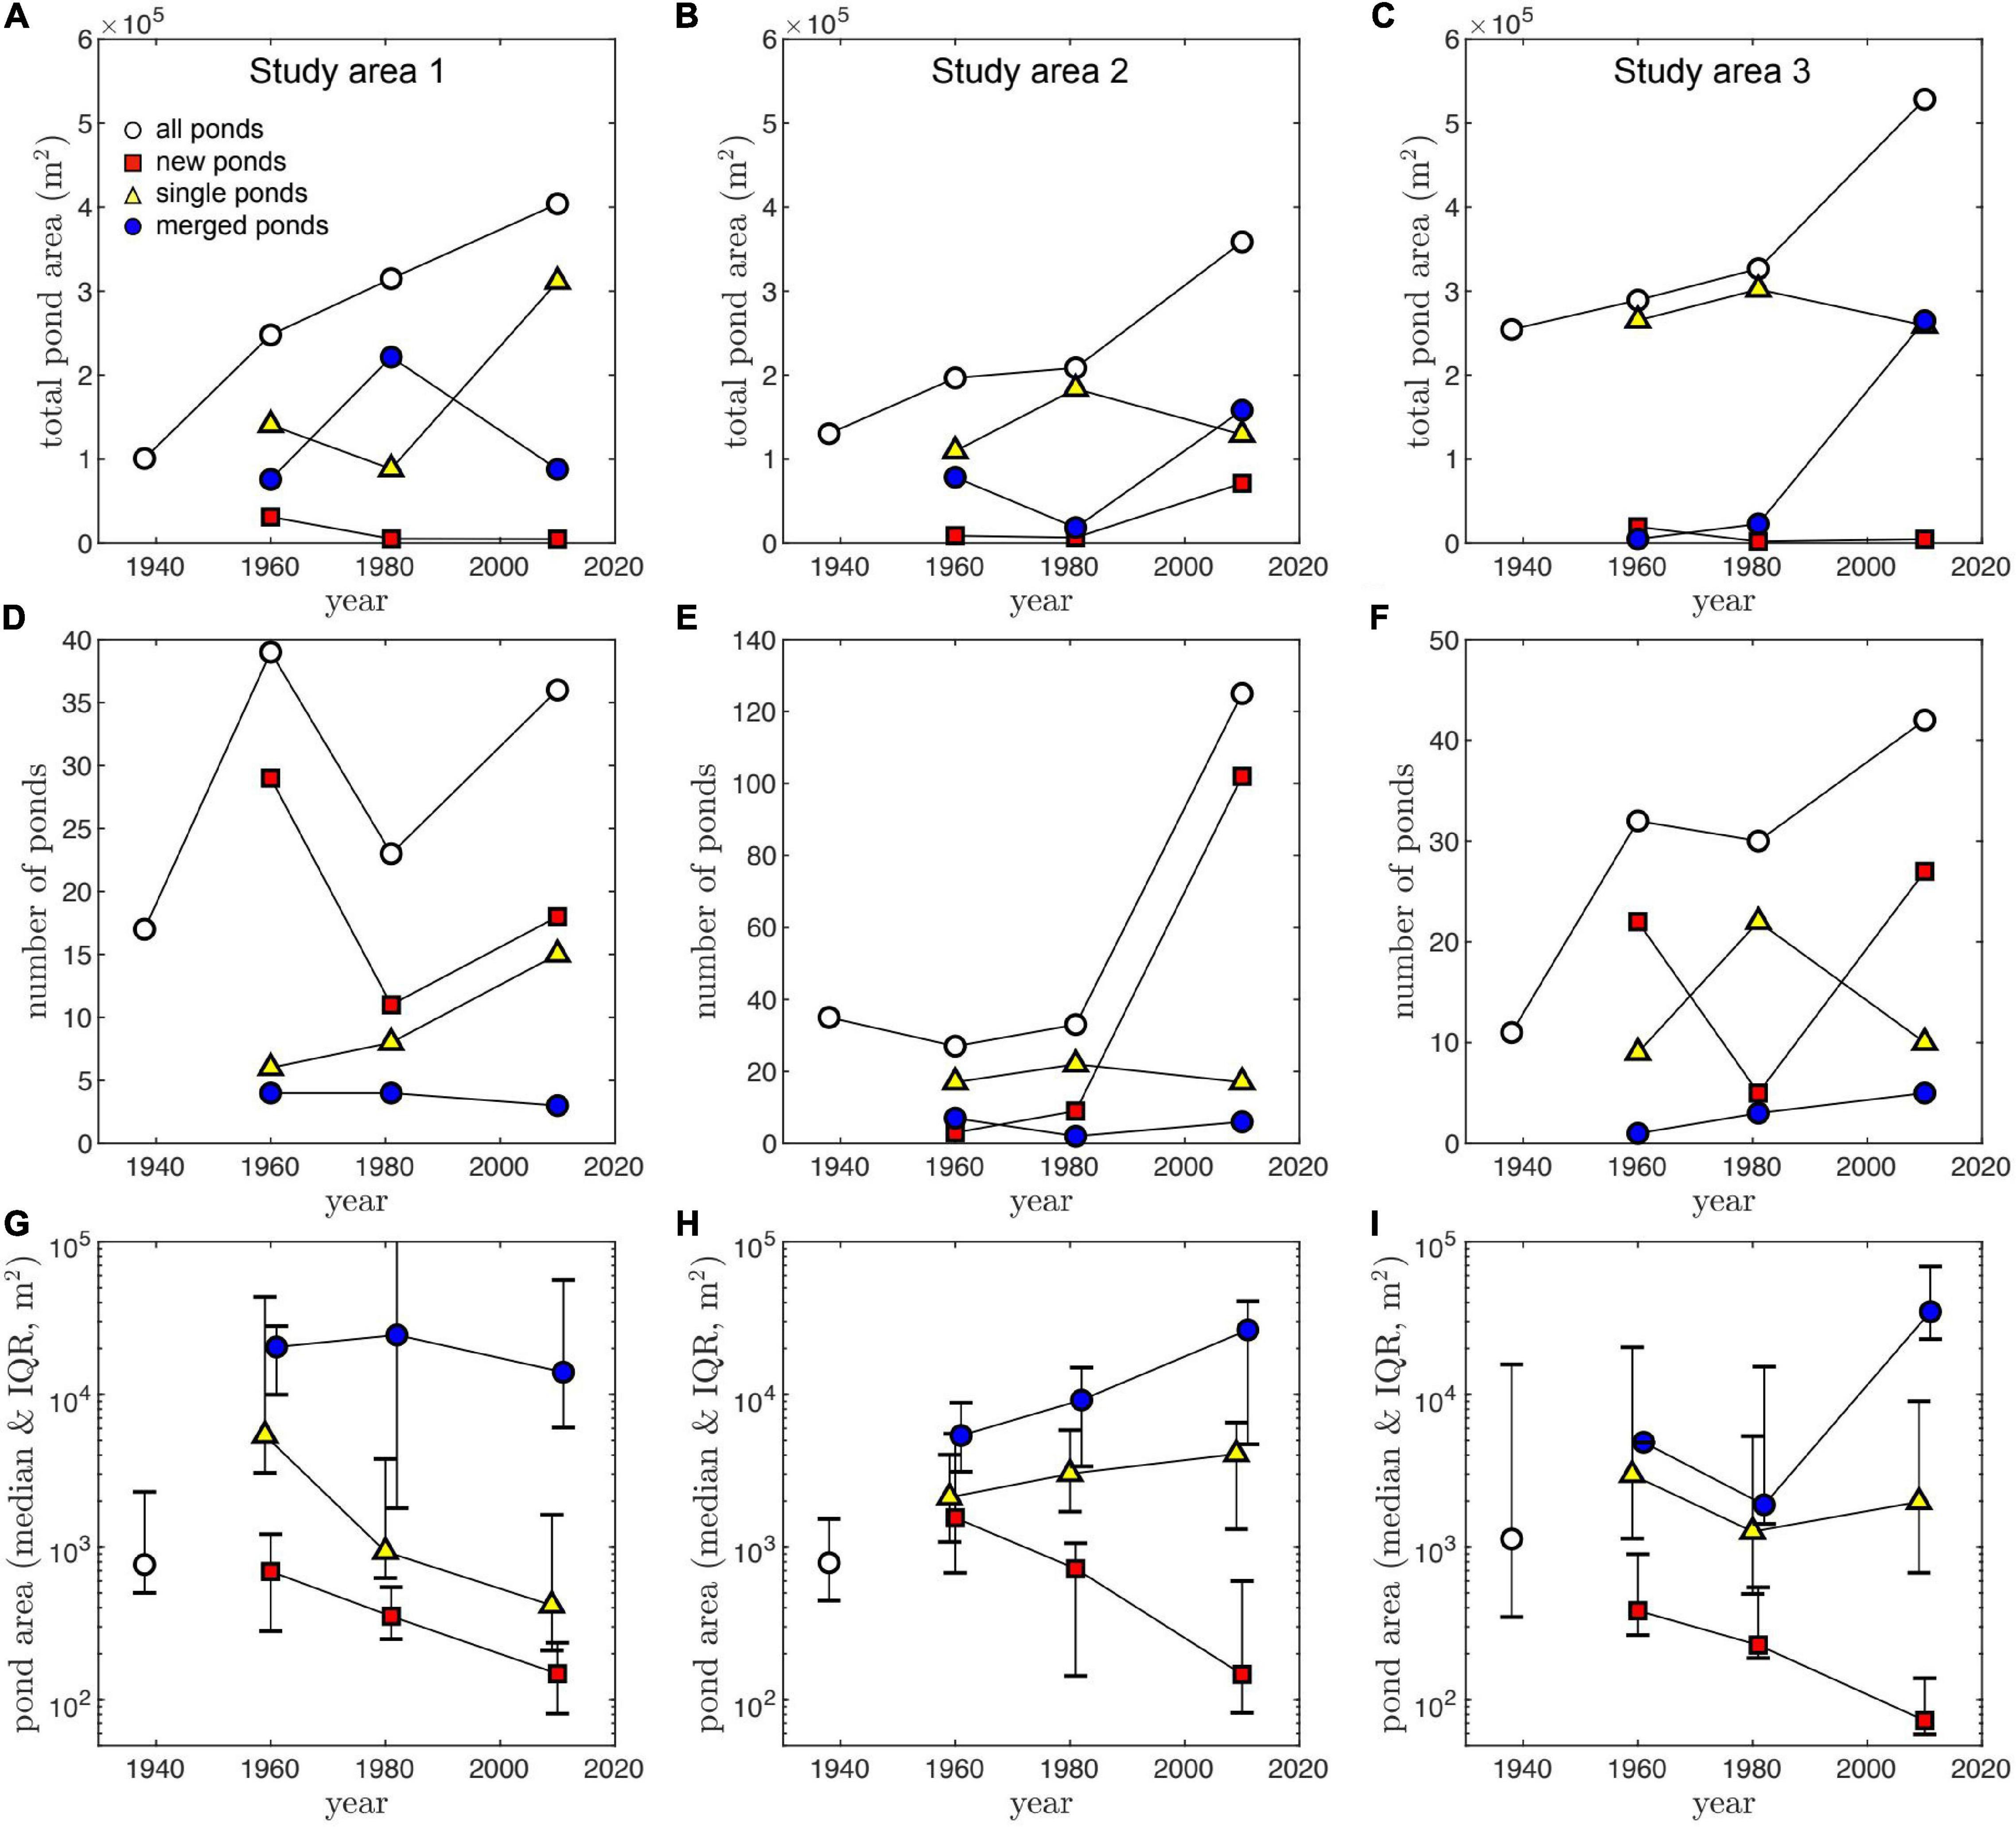
Figure 3. Total pond area (A–C), number of ponds greater than 50 m2 (D–F), and individual pond area (G–I), as function of time and pond type, for the three study areas (columns). Due to the skewed distribution of individual pond areas, data points represent the median value, and error bars represent the Interquartile range (IQR), defined as the difference between the 75th and the 25th percentiles.
At each timestep where new as well as existing ponds could be classified (1960, 1981, and 2010), the majority tended to be new (i.e., did not exist in the previous image). These numerous ponds, however, represent only a small fraction of the total ponded area (Figures 3A–C). The continuous formation of new ponds explains the increase in the total number of ponds from 1938 to 2010 in each study area (Figures 3D–F). Two exceptions are observed between 1960 and 1981 in Study Areas 1 and 3 where the number of ponds decreased, likely due to frequent pond merging. Study Area 2 began with a high number of ponds (n = 36) in 1938, but we detected relatively few new ponds occurring during the first two time-steps (notice y-axis differences in Figures 3D–F).
In general, smaller ponds are more common than large ponds; the median area of all ponds (n = 450) is 720 m2, and only 40 ponds were >104 m2. In all study areas, the largest ponds tend to be merged ponds, particularly after 1960, while new ponds are consistently the smallest ones (Figures 3G–I). These trends seem to increase in magnitude with time, with new ponds getting smaller and the scale separation between the area of merged ponds and single or new ponds increasing up to a maximum in 2010 (Figures 3G–I).
Merging pond rates (, Eq. 6) are consistently higher than the growth rates of both new and existing single ponds, and also higher than the average expansion rates of merged ponds , Eq. 5) (Figures 4A–C). Furthermore, average expansion rates () are generally similar to the growth rates of single ponds (Rs), justifying our interpretation of as a measure of pond expansion distinct from pond merging, characterized by the merging rate (Figures 4A–C). Interestingly, in the Study Area 2, the scale separation between the size of new and existing single ponds (Figure 3H) is not reflected in their growth rate, as new ponds tend to grow at similar rates as single ponds (Figure 4B).
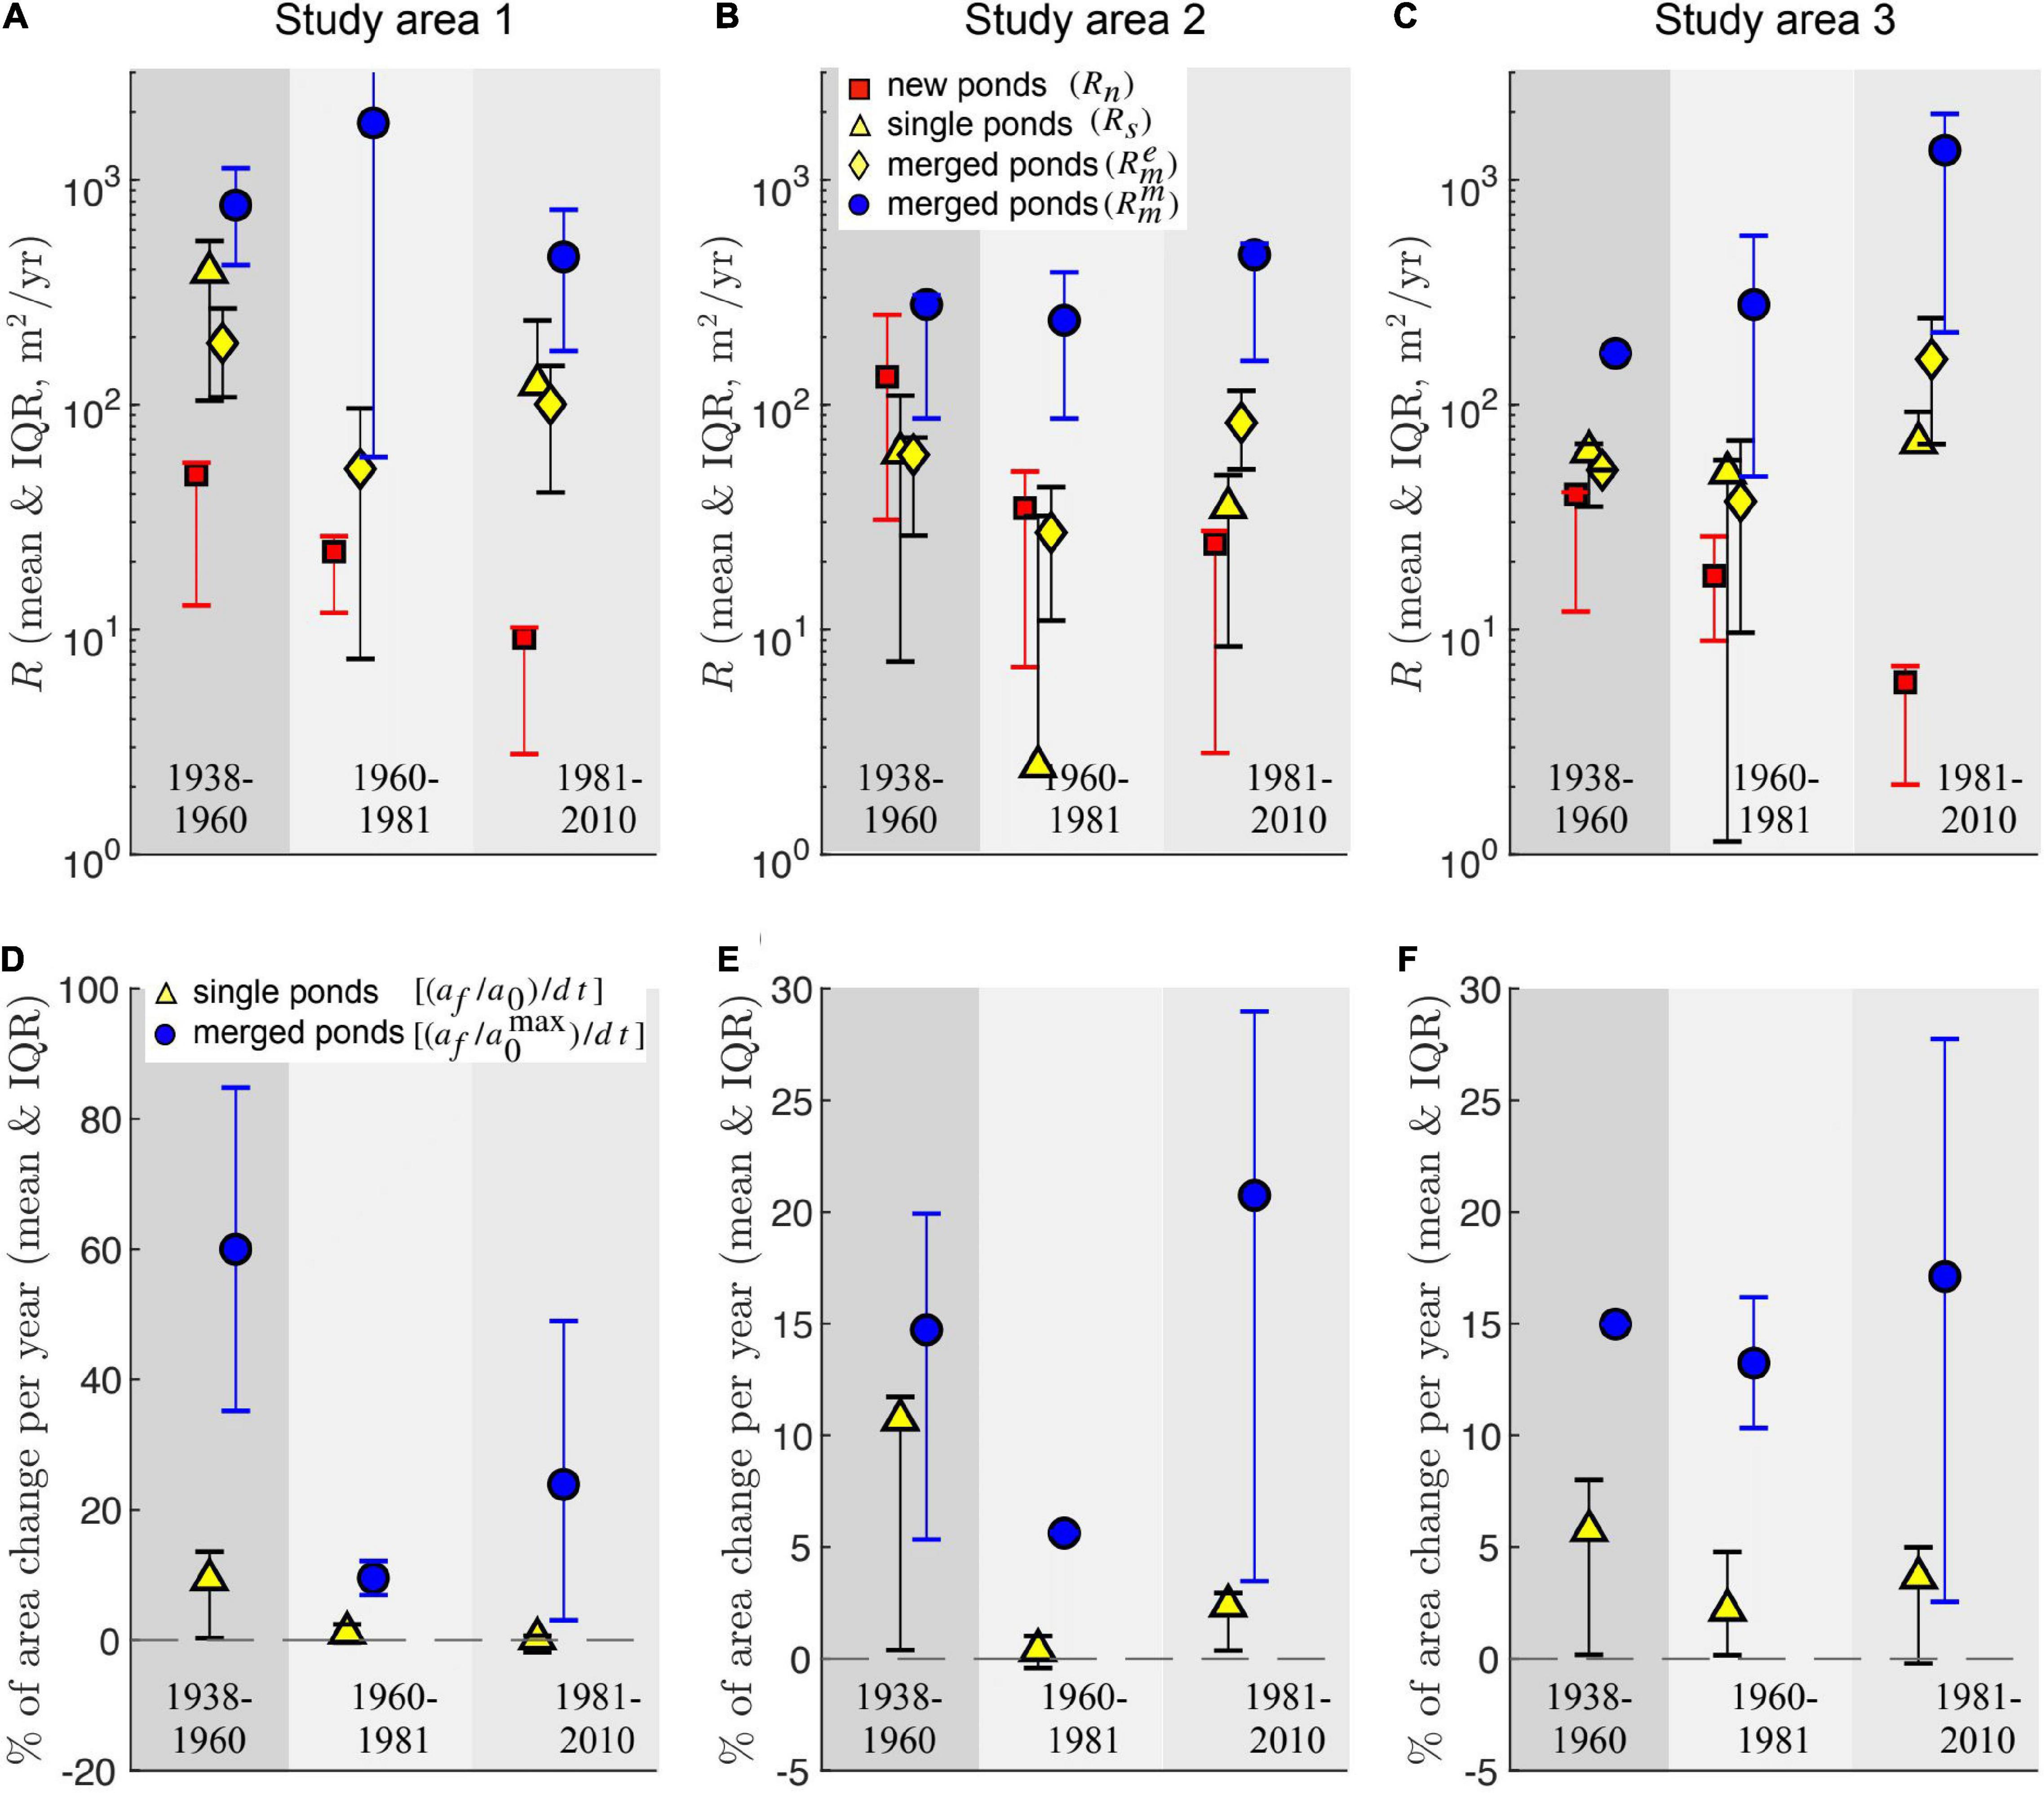
Figure 4. Different area growth rates quantifying pond change (A–C) and relative change in pond area per year (D–F) area for the three time intervals and study areas. Symbols are error bars represents the mean and Interquartile range (IQR), respectively. IQR is defined as the difference between the 75th and the 25th percentiles. The relative change in pond area is defined as the ratio (af/a0) between final and initial pond area divided by the time interval △t. For merged ponds the initial pond area corresponds to the largest merging pond. The relative change in pond area is undefined for new ponds.
The dominant contribution of merging to the increase of pond size is also apparent when comparing the relative change in pond area per unit time between pond merging and single pond expansion (Figures 4D–F). Merging increases the area of the largest merging pond by more than 10% per year for almost every time interval in all study areas, and by about 20% per year during the last 30 years of data (1981–2010). In contrast, single ponds expand in average by less than 5% per year, except during the first period (1938–1960).
Mechanisms of Pond Growth
Lateral growth rates—a first order estimate of edge retreat, G—exhibit no clear trend with pond size in ponds that grow singularly between timesteps (Figure 5). Peak values are, however, observed for small-to-intermediate sized ponds (around 103 m2), reaching up to 0.8–1.2 m yr–1 and decreasing for larger ponds. This decrease is consistent with a constant area growth rate R = 150 m2 yr–1 (see Figure 6), assuming circular ponds: . Maximum lateral growth rates are similar to those of Lake Blackwater (0.6–1.2 m yr–1), a much larger (1.8 × 10⁷ m2) open water area adjacent to our study area (Figure 1). Lateral growth rates seem to be larger during the 1938–1960 time period. Despite the dominance of pond expansion for all analyzed timesteps, pond contraction was relatively common across measured pond areas (102 m2–105 m2) particularly after 1960.
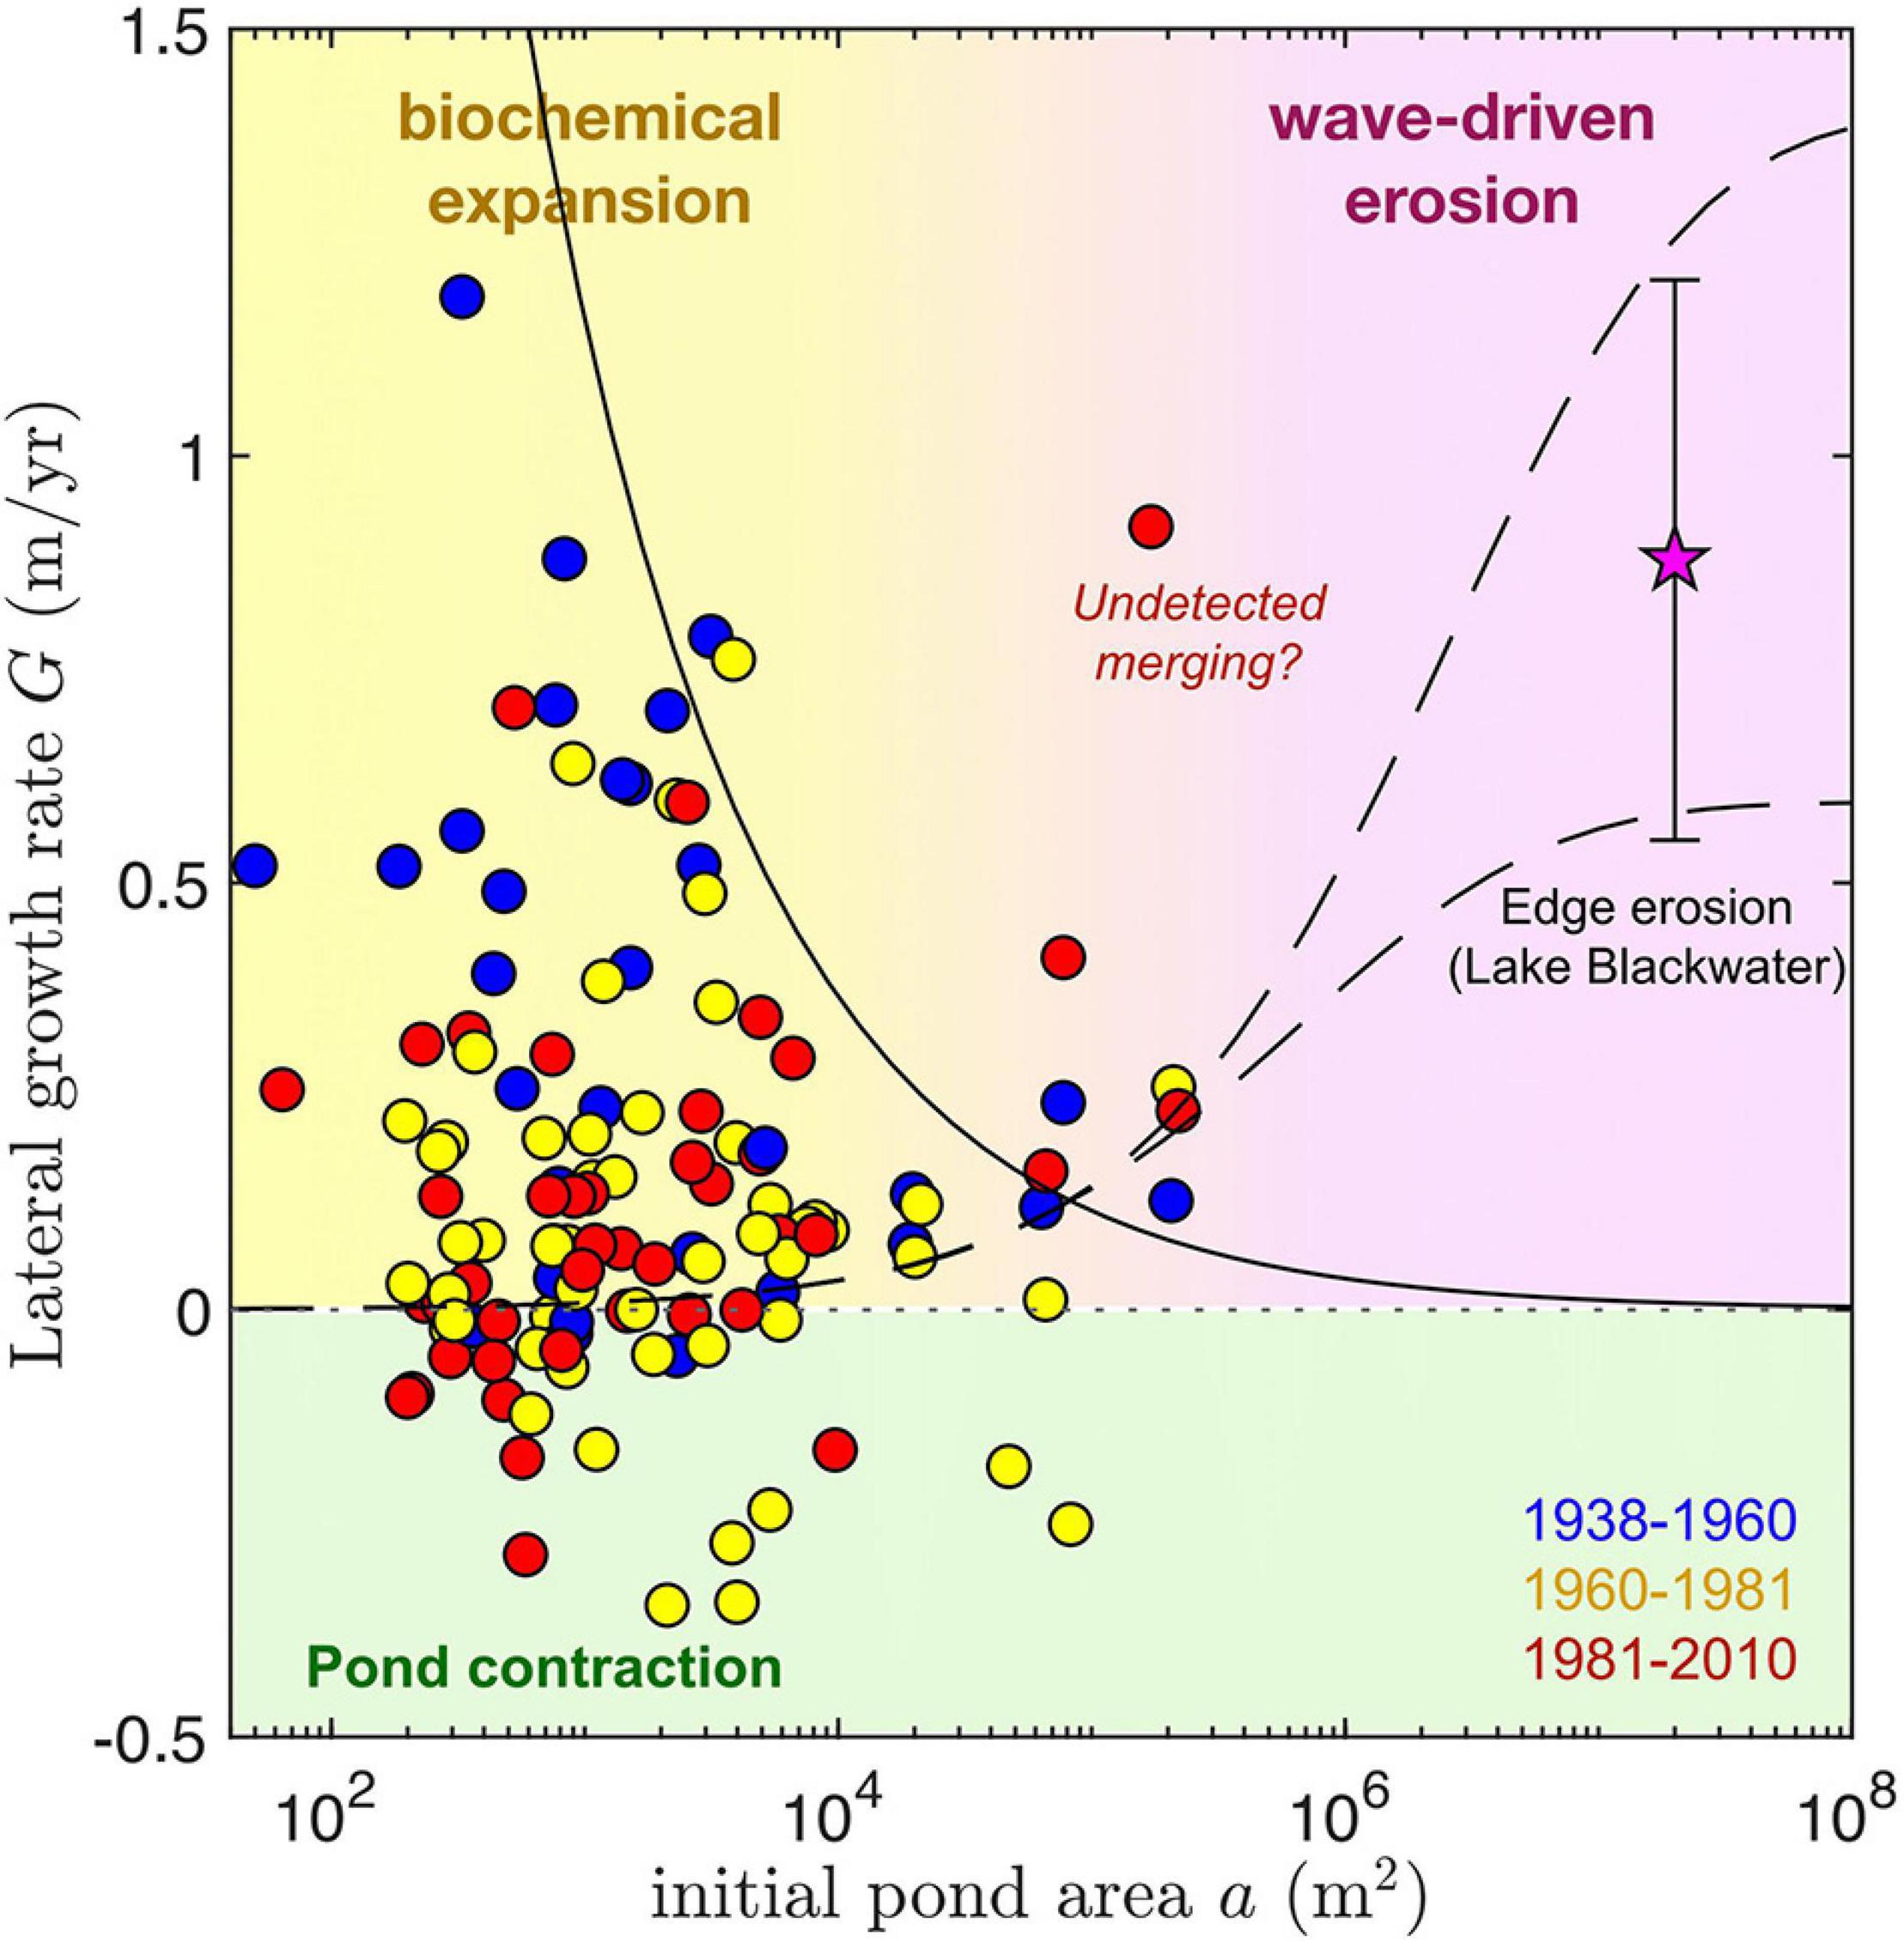
Figure 5. Lateral growth rate G of single (non-merging) ponds as function of initial pond area a (circles) for the time intervals analyzed. The mean and standard deviation of the erosion rate of one edge of Lake Blackwater, along its longest axis, is also shown for comparison (star). Dashed lines correspond to a semi-empirical equation for wave-driven marsh edge erosion (Mariotti and Fagherazzi, 2013) evaluated at two characteristic pond depths, 0.3 m (lower) and 0.5 m (higher). The solid line shows the scaling of lateral growth rates corresponding to a constant area growth rate R = 150 m2 yr–1 (see Figure 6), assuming circular ponds: . We suggest isolated pond growth is controlled by biochemical mechanisms below ∼105 m2, and by wave-driven erosion above it. Negative growth rates denoting pond contraction are highlighted in green. Given the large time spans between measurements, the central outlier could correspond to an undetected merged pond (see Figure 6).
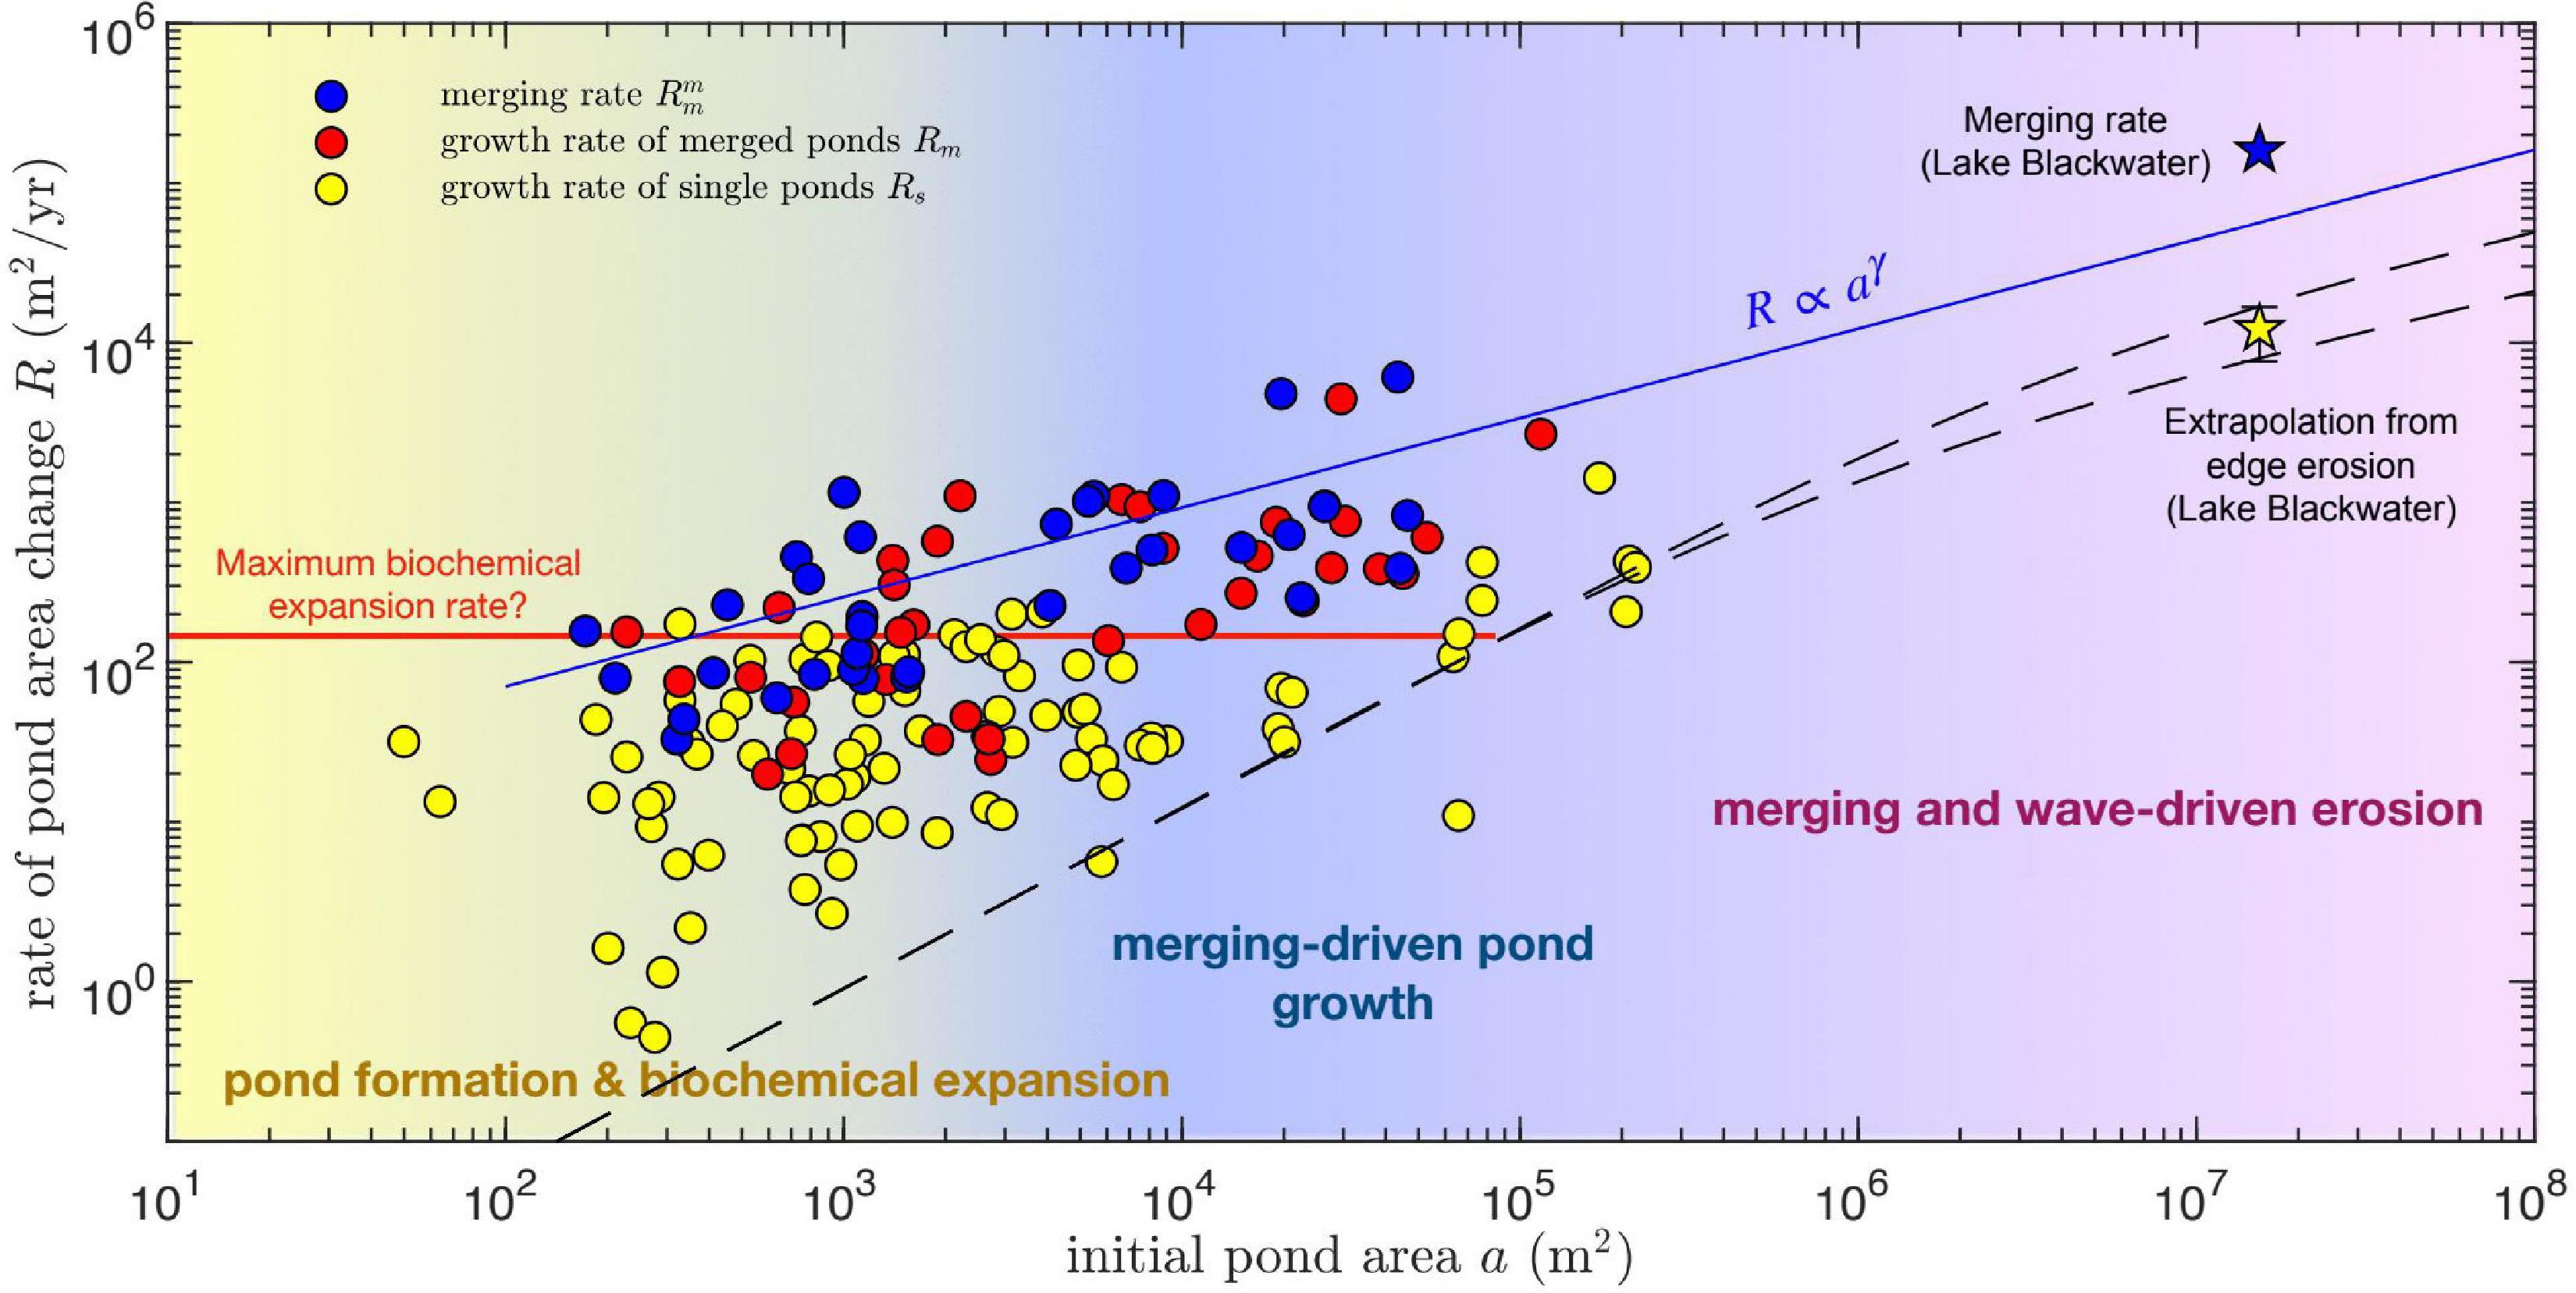
Figure 6. Pond area growth rate R as function of initial pond area a, for single (yellow circles) and merging ponds (blue and red circles). The initial pond area for the growth rate of merged ponds is defined by the combined area of all merging ponds, whereas it corresponds to the size of the largest merging pond for merging rates. Dashed lines correspond to predictions of wave-driven marsh edge erosion rates G (see Figure 5) extrapolated to area rates assuming circular ponds: . Stars represent two measures of the area growth rate of Lake Blackwater, the rate of area change itself (defined as the area difference divided by the time period and denoted as a merging rate because it involves merging with neighboring ponds) and an extrapolation from the measured edge erosion rate G (Figure 5), assuming a circular lake of area a : . Pond growth seems to be dominated by biochemical expansion, with a minor contribution from merging, at relatively small pond areas, and by pond merging for intermediate and large pond areas. Wave-driven erosion seems to play a minor role in pond growth even at the scale of Lake Blackwater. Merging growth rates (blue circles) can be fitted by a power-law relation (solid blue line). Single pond growth has a maximum rate of about 150 m2 yr–1 that changes little with pond area (solid red line).
Lateral growth rates are in general much larger than those predicted by a semi-empirical formulation of wave-driven marsh edge erosion (Figure 5, dashed lines), which nevertheless captures the relatively small expansion rates of the largest measured ponds. When considering the dependence of areal growth rates on the initial pond area for both single and merged ponds, three scale-dependent regimes for pond growth in our study areas emerge (Figure 6). For pond areas smaller than about 103 m2, pond growth seems to be dominated by what we define as biogeochemical processes. Measurements suggest that biogeochemical driven growth has a maximum area growth rate of about 150 m2 yr–1 which changes little with pond size (Figure 6, red line). Second, for pond areas above 103 m2, pond merging is by far the most important mechanism for pond growth, as suggested by both the total growth rate of merged ponds (Rm) and the merging rate () of the largest merging pond (Figure 6). Often both measures of pond growth rate due to merging are similar because one of the merging ponds is much larger than the others. Finally, for ponds with areas similar to or >105 m2 the contribution of wave-driven erosion becomes relevant. However, we find that even at the scale of Lake Blackwater merging patterns seem to contribute heavily to growth. Indeed, the measured area growth rate of Lake Blackwater (calculated as the difference in measured lake area divided by the time interval between 1981 and 2010) is about 10 times larger than the rate [ where a is the Lake Blackwater area in 1981] estimated from the measured wave-driven edge erosion (G = 0.9 m yr–1, Figure 5) assuming a circular shape. Notice that the area growth rate of Lake Blackwater is a merging rate following our definition, as the growing lake is continuously merging with nearby ponds. The causes for these size-dependent growth rates are proposed in several prior studies and are further explored in the discussion.
We quantified the dependence of the pond merging rate () on the size of the largest merging pond by fitting a power law function of the type (Figure 6, blue line):
with fitting parameters R0 = 70 ± 35 m2 yr–1 and γ = 0.56 ± 0.09 and where for convenience we introduce the area scale a0 = 100 m2. This equation can then be used to estimate the time evolution of the size of the largest pond in the system (see Eq. 8 below). This provides a lower bound for the growth of total pond area, which is always larger than any single pond area.
Comparison With a 1D Marsh Fragmentation Model and Other Pond Data
We compared our measurements of pond growth rates and pond size distribution to the predictions of a simplified one-dimensional model of cross-platform sediment transport and SLR-driven marsh drowning (Vinent et al., 2021). We ran the model for the parameters characterizing our study area: tidal range 0.35 m, average suspended sediment concentration 40 g m–3 (Ganju et al., 2017) and rate of relative SLR 3.8 mm yr–1 and kept the other model parameters unchanged (see details in Vinent et al., 2021). Starting with a marsh platform with uniform elevation and tidal channels or mud flats at both sides (Figure 7A), the model predicts the formation of a large central pond after about 100 years and the subsequent runaway fragmentation of the marsh platform until complete drowning in about 150 years (Figure 7A).
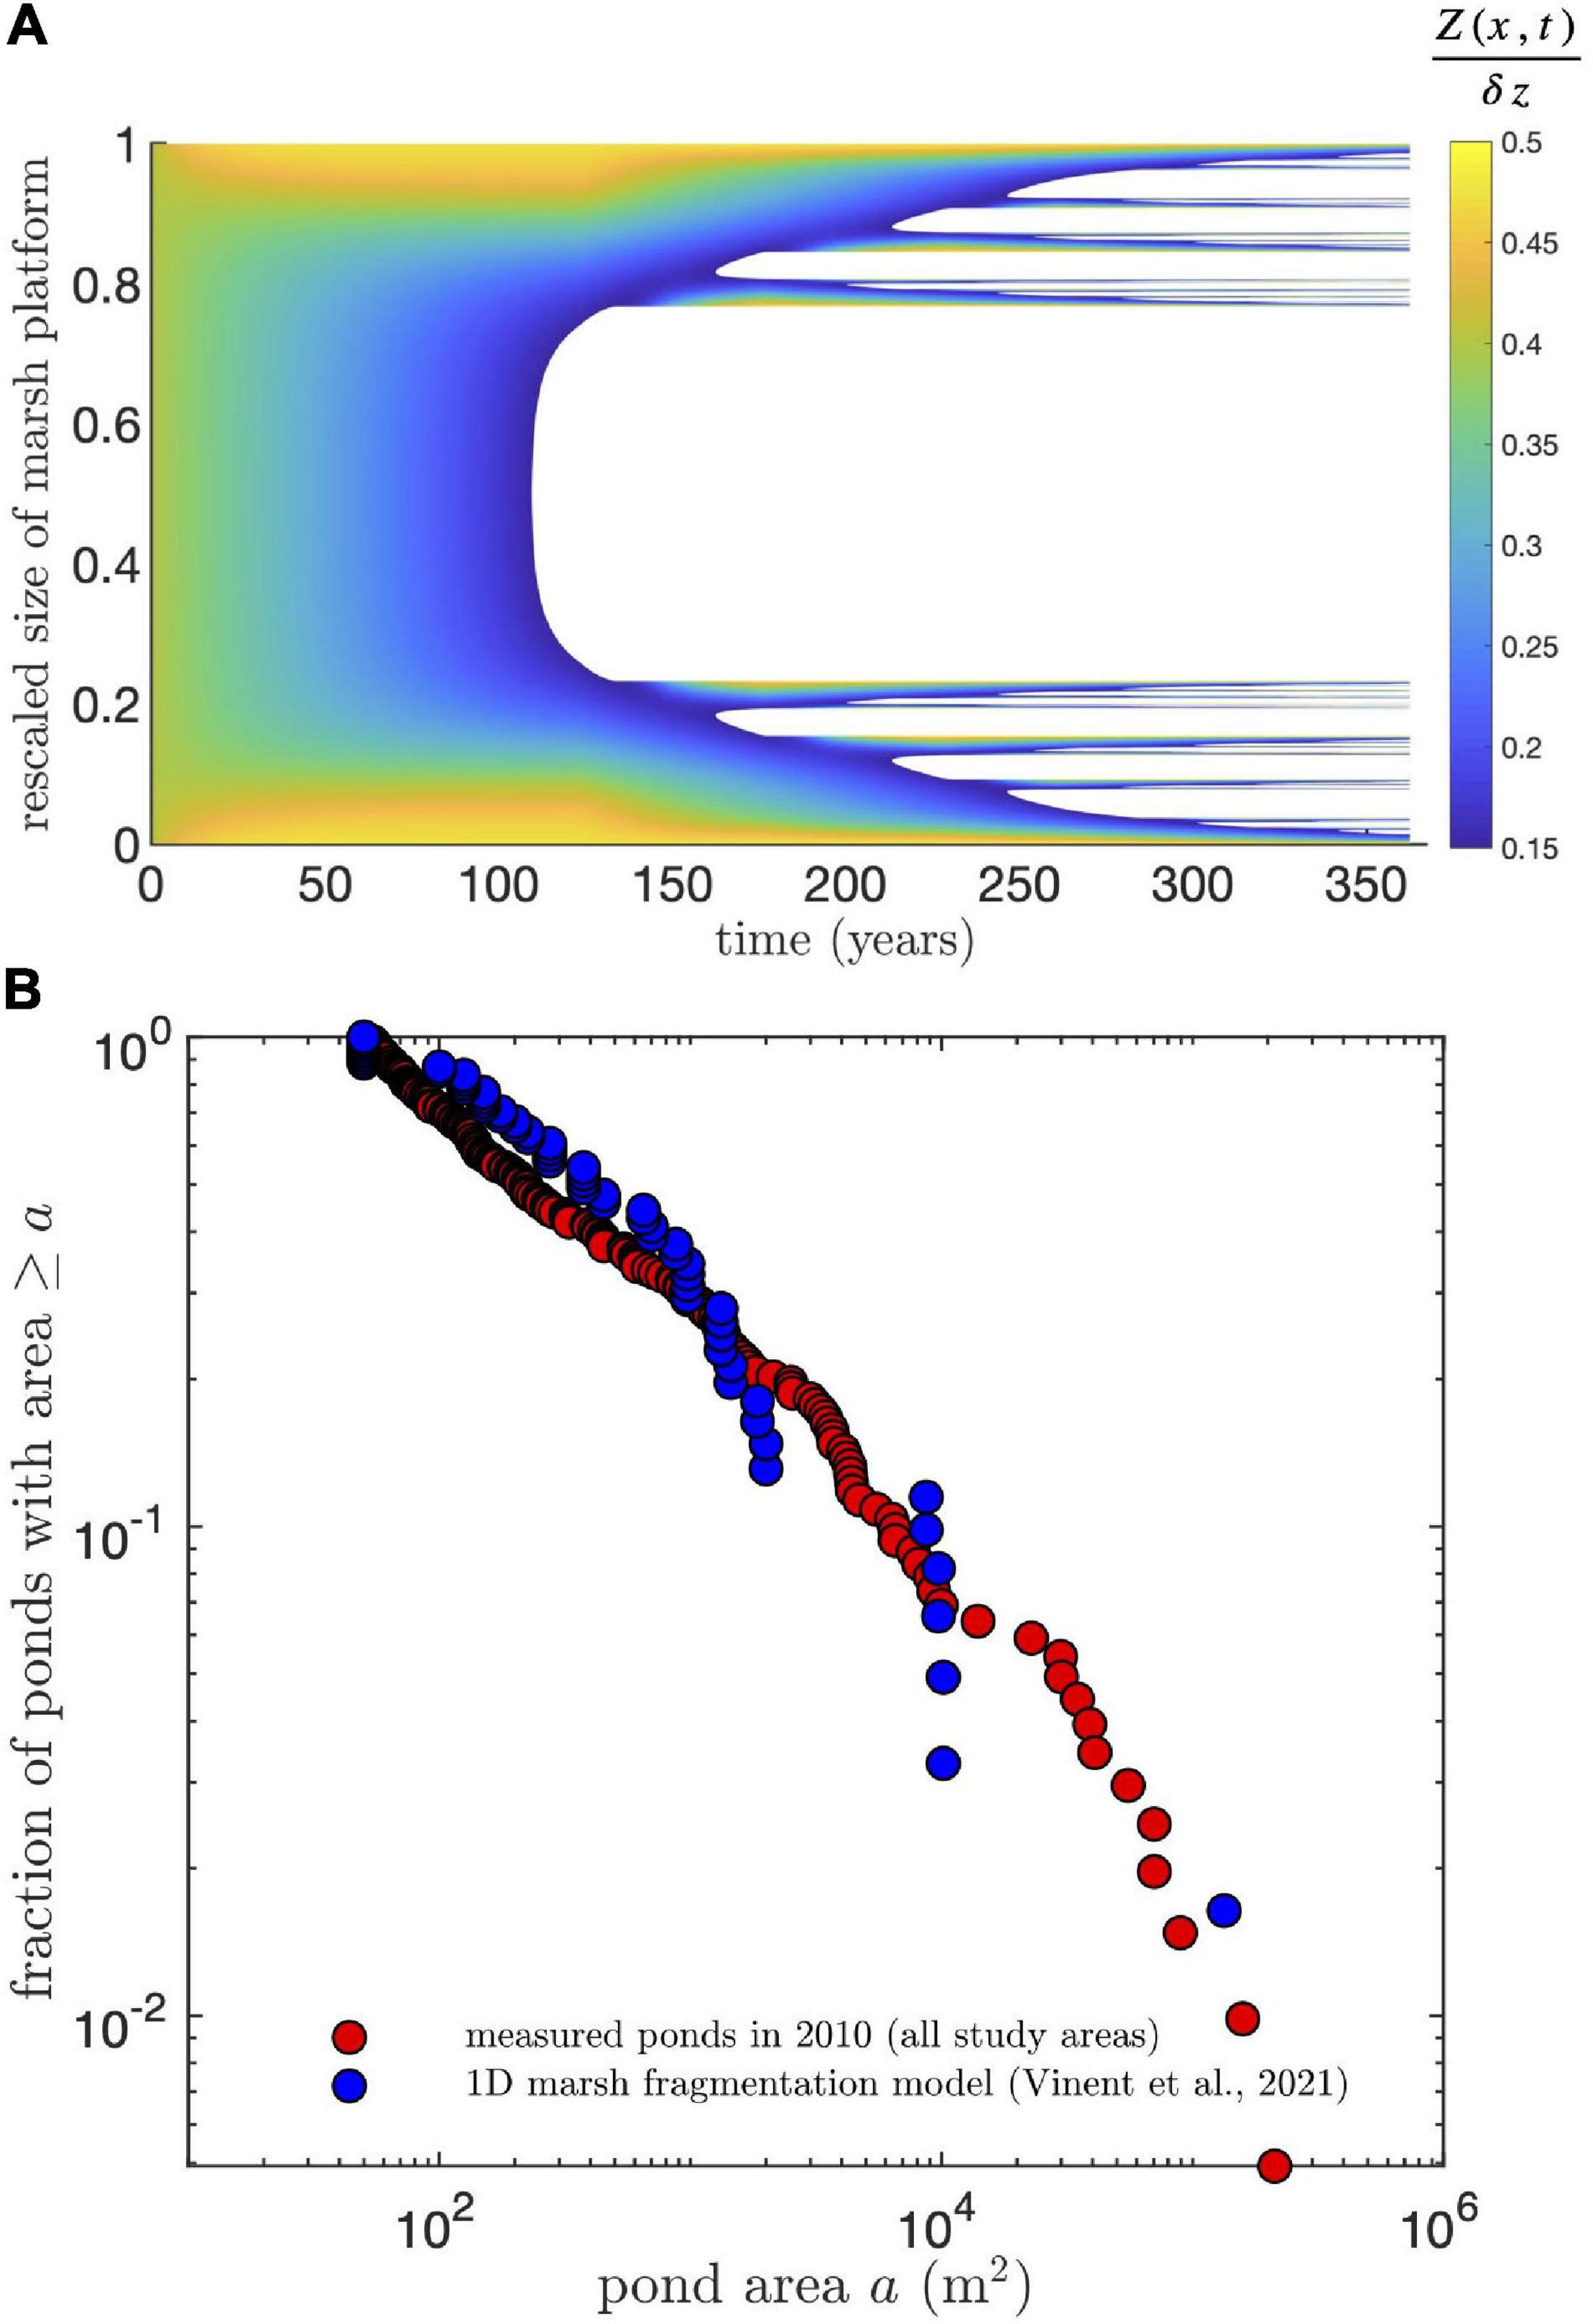
Figure 7. Predictions from a simplified one-dimensional marsh drowning model (Vinent et al., 2021) applied to the conditions in our study areas. (A) Spatiotemporal diagram of predicted marsh fragmentation starting with a uniform marsh platform with tidal channels or mud flats at both sides. Marsh elevation Z is rescaled by tidal range dz. White areas indicate open water. (B) Comparison of simulated and measured exceedance probability of pond areas. Since the model is 1D, the simulated pond area is calculated by multiplying the simulated pond length by a constant pond width obtained from the condition that the smallest simulated pond has an area of 50 m2 (the smallest area resolved in the measurements). Measured ponds correspond to ponds in all study areas in 2010.
This model reproduces both the frequency distribution of pond sizes measured in 2010 (Figure 7B) and pond growth rates (Figure 8). Given the model is 1D, the simulated pond area is calculated by multiplying the simulated pond length by a constant pond width obtained from the condition that the smallest simulated pond has an area of 50 m2 (the smallest area resolved in the remote sensing measurements). Since the size distribution follows a power law (Figure 7B, Vinent et al., 2021), this multiplicative factor does not affect the shape of the distribution. Interestingly, the simulated growth rates change little with pond size for small ponds, while they decay relatively fast for large ponds (Figure 8) due to the stabilization of pond growth once it connects to the channel network (a condition implemented in the model based on pond depth, see Vinent et al., 2021 for details).

Figure 8. Comparison of measured and simulated pond area growth rates as function of the initial pond size. For the growth rate of merged ponds, the initial area is defined as the combined area of all merging ponds. For the one-dimensional model, the simulated pond area is calculated by multiplying the simulated pond length by a constant pond width obtained from the condition that the smallest simulated pond has an area of 50 m2 (the smallest area resolved in the measurements). Data reported by Ortiz et al. (2017) in the Mississippi delta was selected by the condition that the final pond area is no larger than four times the initial area, to conserve a meaningful correlation between both. Star symbols and dashed and solid lines as in Figure 6.
To compare our results to observations in other microtidal saltmarshes, the growth rates of merged and single ponds reported by Ortiz et al. (2017) in the Mississippi delta (filtered by the condition that the final pond area is no larger than four times the initial area, to conserve a correlation between both) were included directly in Figure 8. The two datasets follow similar trends and in particular the merging rates from both are consistent with our empirical power-law growth relation (Figure 8).
Temporal Evolution of Total Pond (Water) Area
We can constrain the future expansion of total pond area in our study areas using the power-law relation for the merging rate (Eq. 7). Integrating Eq. 7 and assuming an initial pond area a(0) = 5 × 10³ m2, which corresponds to the largest of the small merging ponds found in our study area in 1938, we find:
where τ = a0/R0 = 1.43 yr is a characteristic time scale. This equation reproduces the temporal evolution of the largest merging pond (Figure 9) and predicts that our study areas, all of similar size ∼106 m2, will become a single large pond in about 150 years from the start of our measurements (1938). This is about 80 years sooner than an estimation based on the average growth rate of the total pond area (Figure 9, dashed line).
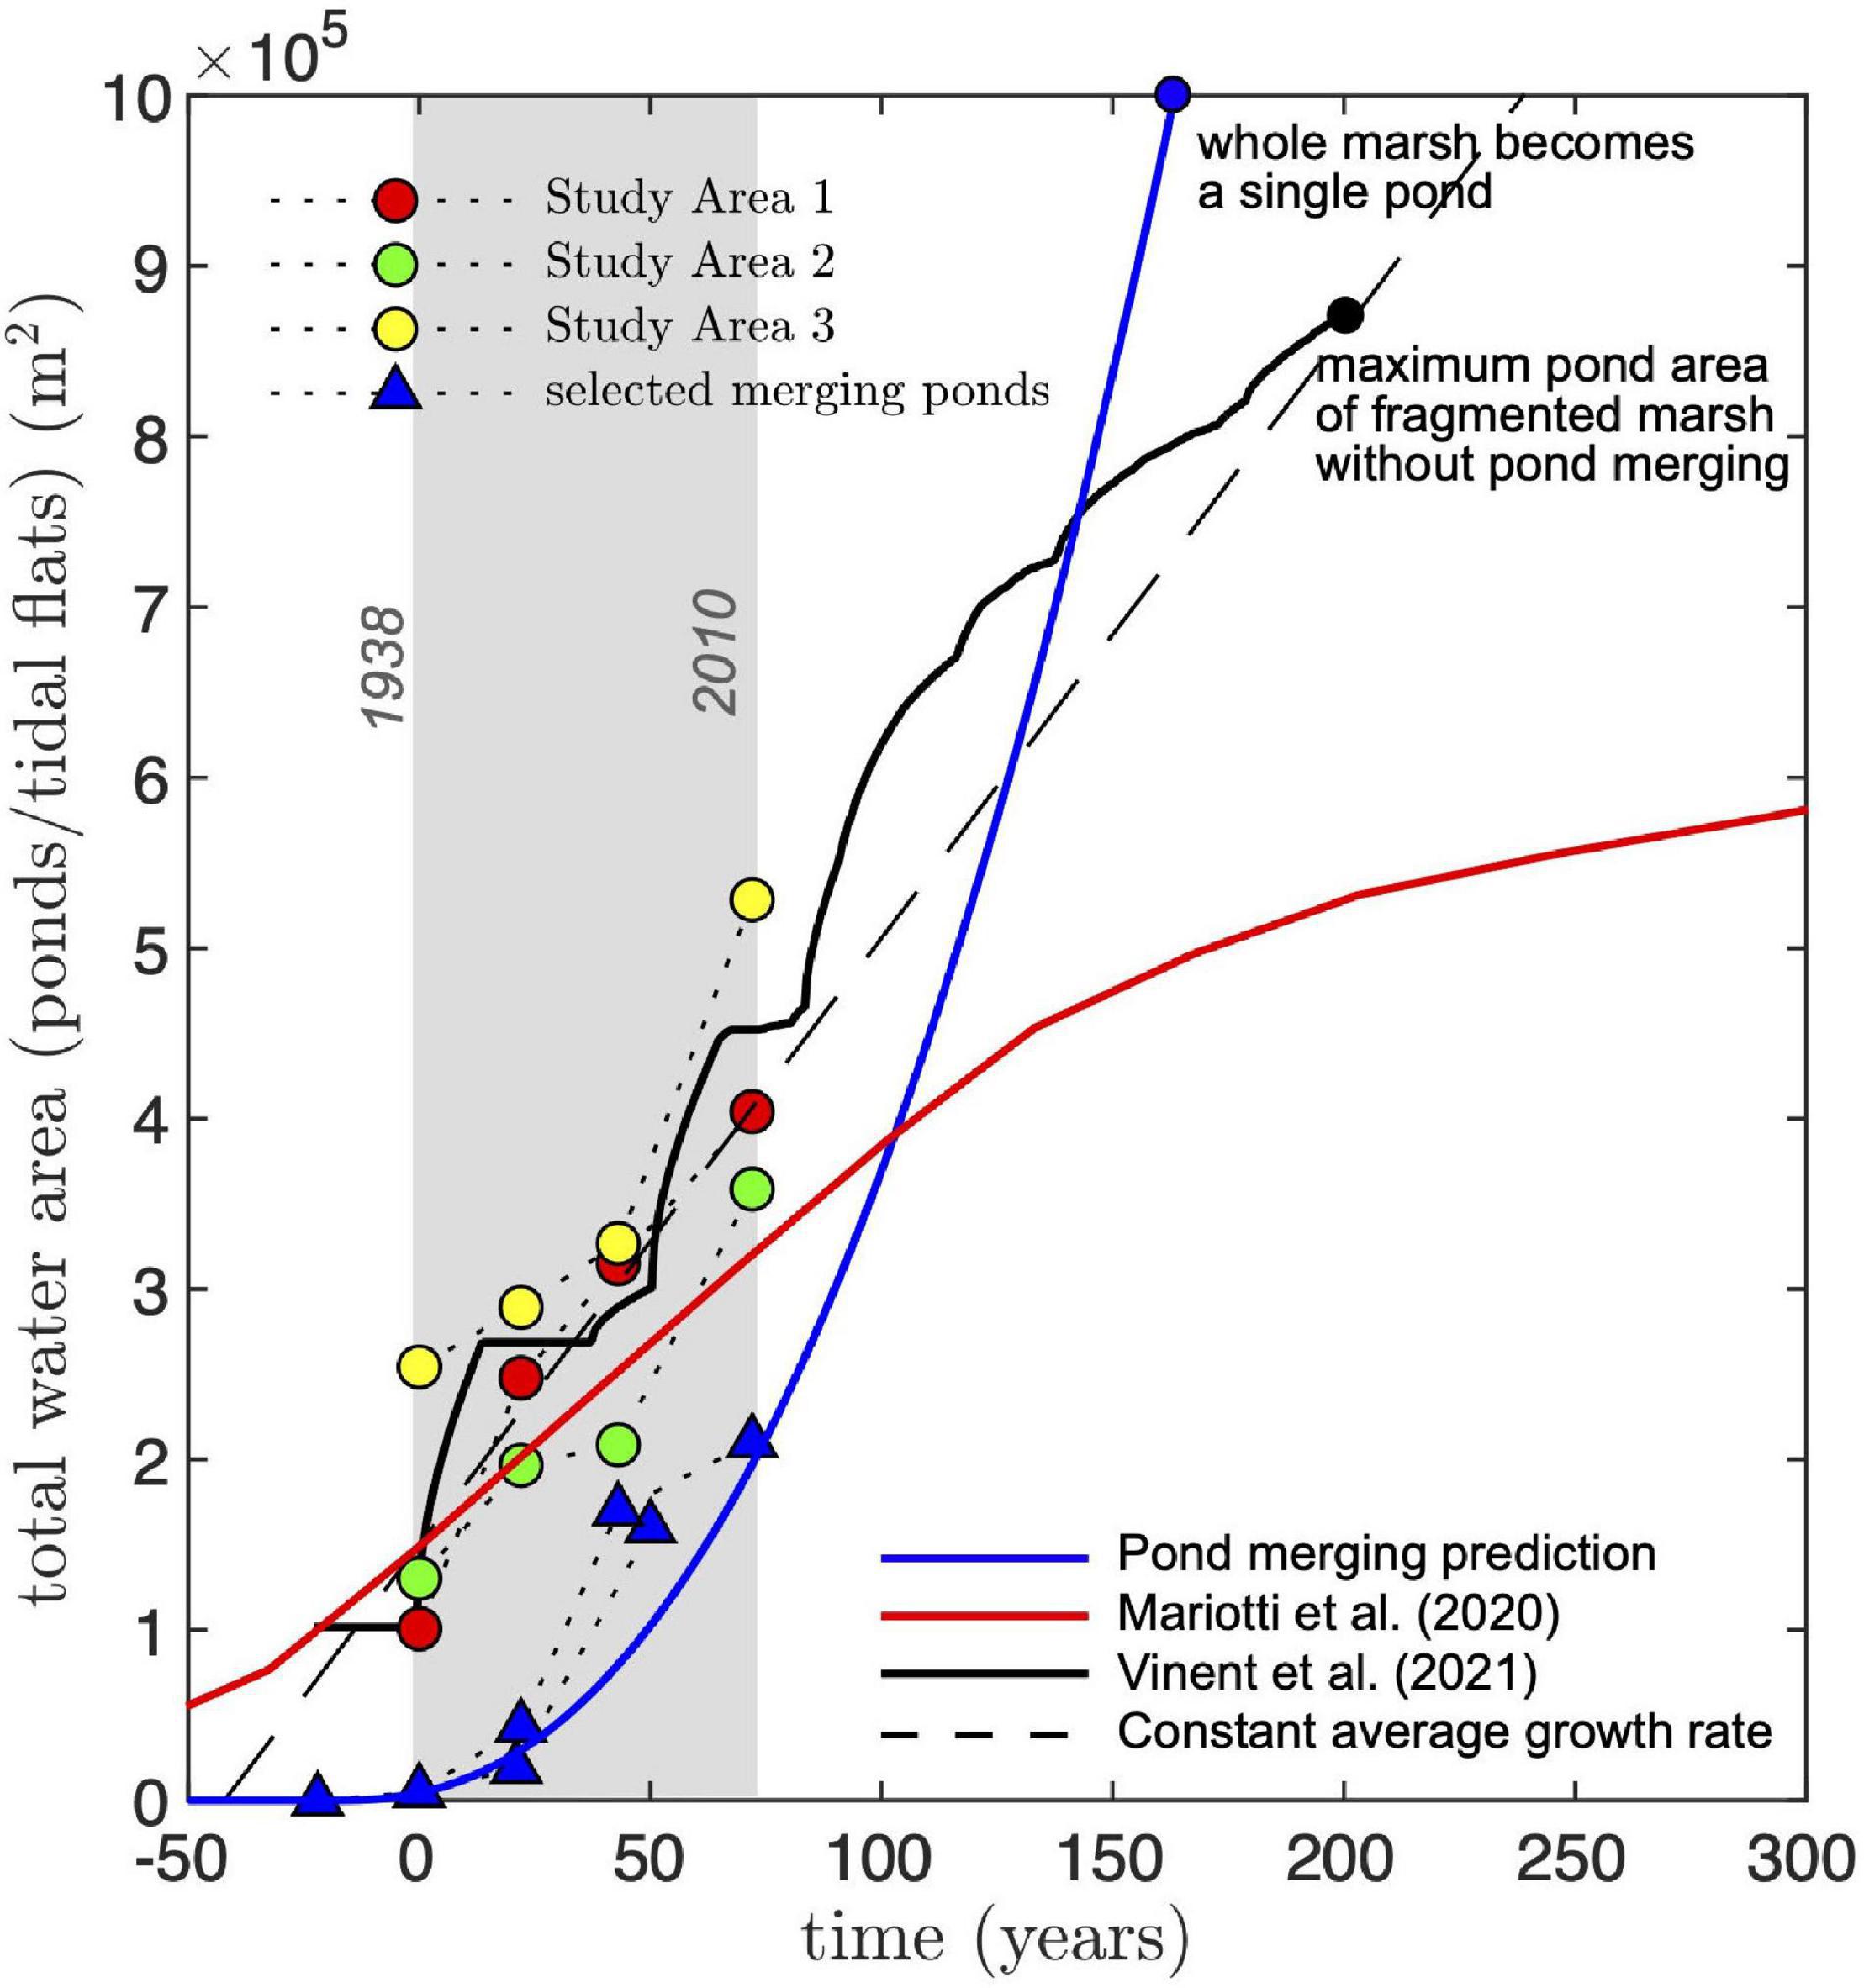
Figure 9. Comparison of measured and predicted time evolution of total water area (ponds). Circles represent total pond area measured in our study areas. Triangles are selected merging ponds tracked through time (we selected the largest merging pond during different merging stages). Merging ponds are shifted in time such that they have a similar size [a(0)≈ 5 × 10³ m2] at the reference time (t = 0, representing the initial year 1938). All predicted curves are shifted in time such that water area (total pond area) at t = 0 is 1.5 × 10⁵ m2. The dashed line represents a constant growth rate equal to the average growth rate of all study areas (3.5 × 10³ m2 yr–1). The blue line is the prediction for the largest pond area at a given time using the merging rate approximation (Eq. 8). By definition, Eq. 7 represents a lower bound for the total pond area. The black solid line is the prediction using the model of Vinent et al. (2021; Figure 7A). To compare the model prediction to the measurements, we replaced the size of the central pond in the simulations by the one already present in some of the study areas (∼105 m2) and then rescaled the size of the marsh platform to 106 m2. The red line is the prediction by the model of Mariotti et al. (2020) for similar marsh conditions (see text for details). To convert from water area fraction to actual water area, we multiplied by the area of their simulated domain (1.44 × 10⁶ m2).
The predicted change in total pond area from the marsh fragmentation model introduced in the previous section (Vinent et al., 2021) closely follows the measured increase from 1938 to 2010 and predicts that 80% of marshes in our study areas will disappear after 150 years (from 1938, see Figure 9), which agrees in general with the prediction from the merging rate equation (Eq. 8). Note that to properly compare model predictions to the measurements, we substituted the size of the central pond in with one that was characteristic of central ponds in our study areas (∼105 m2). We then rescaled the size of the marsh platform to 106 m2, an adjustment that does not change the physical interpretation of the results due to the model’s scale invariance (see Vinent et al., 2021).
The runaway ponding predicted by the 1D model of our study areas is not captured by the model of Mariotti et al. (2020). Using published results for a marsh complex that most resembles ours, with tidal range 0.7 m, rate of RSLR 4 mm yr–1 and SSC 5 g m–3 (Figure 9), Mariotti et al. (2020) predict a saturation of marsh loss area (either by ponds or tidal flats, as tidally connected ponds are defined in that study) at about 6 × 10⁵ m2 after more than 300 years.
Characteristics of Stable and Unstable Ponds
Analyzing data from our field campaign, we found that in-situ indicators of marsh health were greater near stable ponds than near unstable ponds. Average live aboveground biomass was higher adjacent to stable ponds (841 ± 98 g m–2) than unstable ponds (607 ± 110 g m–2), both immediately adjacent to the ponds and at interior reference marshes 10 m from the edge (Figure 10A). Soil shear strength decreased with increasing depth within the rooting zone regardless of pond type and location (Himmelstein, 2018). Average soil strength at a depth of 10 cm was higher at the edge of stable ponds (2.70 ± 0.60 kPa) than unstable ponds (1.40 ± 0.50 kPa), with similar trends found in the interior reference marshes (Figure 10B). Hydrogen sulfide concentrations were twice as high in marsh soil porewater adjacent to unstable ponds than concentrations adjacent to stable ponds (μunstable = 6.4 ± 0.8 mM, μstable = 3.2 ± 0.5 mM) (Figure 10C). Similarly, porewater ammonium was higher in soils adjacent to unstable ponds than soils adjacent to stable ponds (μunstable = 161 ± 29 μM, μstable = 97 ± 38 μM; Figure 10D). Hydrogen sulfide and ammonium porewater in the interior marsh near unstable ponds followed the same trend; respectively μunstable = 6.7 ± 0.5 mM vs. μstable = 2.1 ± 0.8 mM and μunstable = 150.4 ± 37.8 μM vs. μstable = 76.9 ± 29.7 μM.
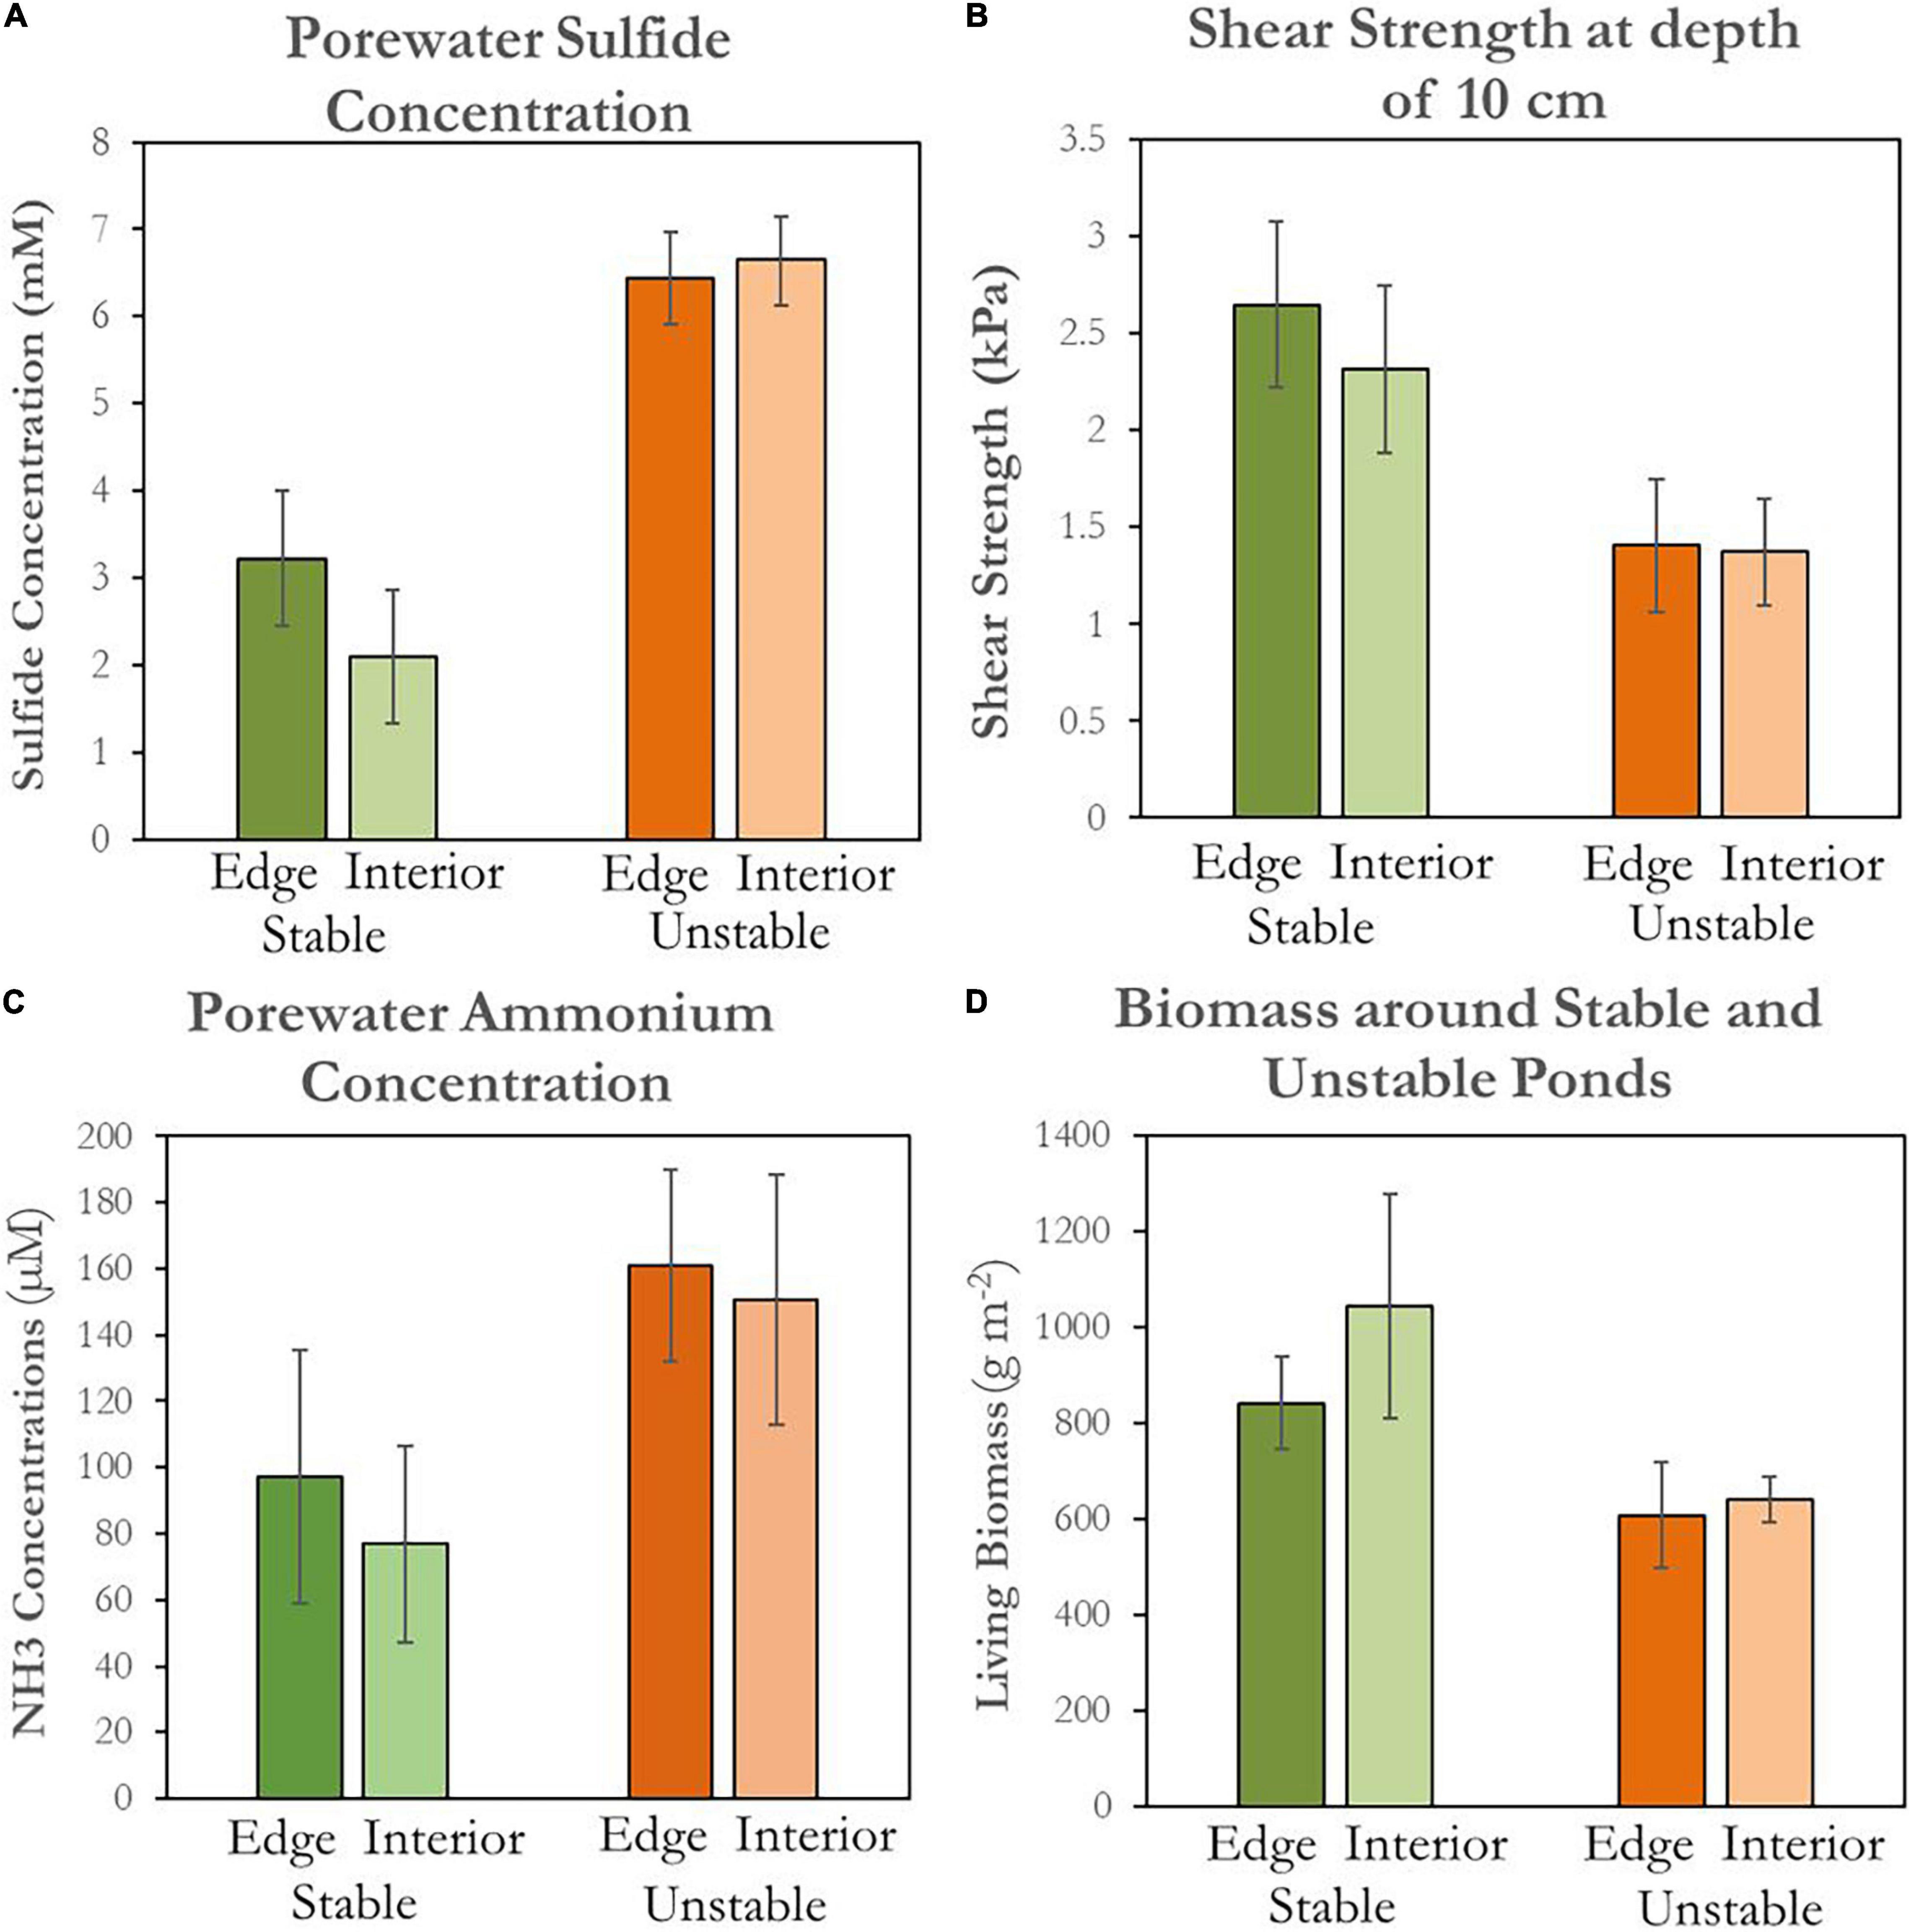
Figure 10. Soil porewater chemistry surrounding stable and unstable ponds. Each bar represents the average of all measurements (n = 9) collected at a certain pond type and location. Error bars represent ± standard error. Green bars represent conditions around stable ponds and orange bars represents conditions around unstable ponds. Darker shades represent conditions at 1m from the pond edge and lighter shades represent conditions 10 m away in the marsh. (A) Concentrations for sulfide in millimolar. (B) Shear vane soil shear strength in rooting zone (10 cm soil depth) measured in kPa. (C) Concentrations for ammonium in micromolar. (D) Living biomass in g m−2.
Discussion
Patterns of Pond Growth as a Result of Marsh Drowning Due to Sea Level Rise
The formation, expansion, and potential recovery of tidal marsh ponds is proposed to depend on interacting processes, both within our study region and more generally (Kearney et al., 1988; Wilson et al., 2009; Mariotti, 2016; Ortiz et al., 2017; Spivak et al., 2017). Pond formation often begins with vegetation stress associated with poor drainage and waterlogged soils (Johnston et al., 2003; Spivak et al., 2017), as evidenced by ponds that originate at drainage divides far from channels (Schepers et al., 2017; Vinent et al., 2021). Once formed, initially small ponds tend to expand through a combination of poorly understood processes, until they intersect tidal channels (Mariotti, 2016; Mariotti et al., 2020). After intersecting channels, ponds either expand (Schepers et al., 2020a) or contract (Wilson et al., 2014) depending on the elevation of the pond bottom and the sediment balance between the channel and pond (Mariotti, 2016; Schepers et al., 2020a).
In the stable ponds studied here, channelized connections to the Blackwater River likely exchange metabolites and nutrients despite only partial water exchange (Spivak et al., 2017). For microtidally influenced marshes elsewhere, tidal channel connections have been found to export unconsolidated material from the bottom of ponds, potentially counteracting the expected vegetation growth benefits afforded by frequent water exchange (Stevenson et al., 1985; Wilson et al., 2010). Schepers et al. (2017), showed that as tidal channel connections in Blackwater widened, pond bottom depth increased. If net basal sediment export deepens ponds and increases pond edge slope, processes like soil creep or bank slumping might in turn widen ponds (Stevenson et al., 1985). To determine the impact of connectivity in a specific marsh complex, biogeochemical health indicators as well as accretion/erosion rates should be monitored before and after pond connection—a sampling process requiring return field campaigns. Such efforts will help chronicle the emergence of large open-water bodies like Lake Blackwater.
Despite the complexity of the processes leading to pond formation and expansion, as reflected by recent numerical models (Mariotti et al., 2020) and summarized above, our results suggest two surprisingly simple conclusions. First, the complex growth of pond size, initiated with the formation of new ponds and then furthered by biochemical expansion and subsequent pond merging, can be approximated by a power-law equation for the temporal evolution of the size of the largest pond (Eqs. 7 and 8). This represents a lower bound for the total water area as total pond size is equal to or larger than the size of the largest pond, and can be used for simple predictions of future changes in marsh area.
The consistency of the Vinent et al. (2021) model with our measurements suggests that pond formation, biochemical expansion, and initial merging can be explained as manifestations of a marsh drowning due to SLR. Both model simulations (Figure 7A) and our data show that ponds tend to initiate in the marsh interior in our study area and expand toward channels (also reported in Schepers, 2017), potentially due to more waterlogged soil conditions. The interior marsh experiences infrequent tidal flushing and low sediment supply (Vinent et al., 2021) both of which promote plant die-off (DeLaune et al., 1994). Qualitatively similar spatial patterns of ponds are found in other marsh areas such as in the Mississippi delta (Louisiana) (Morton et al., 2003), and Venice lagoon (Italy) and Scheldt estuary (Netherlands) (Wang et al., 2021), where ponds are preferentially found in marsh interiors while vegetation prevails closer to channels.
Marsh drowning in response to SLR could also explain the small expansion rates of isolated ponds in the remotely sensed, mesotidal Barnstable, MA, where ponds with 1 to ∼10 m diameter expanded at an average of 1.5 cm yr–1 (Mariotti et al., 2020; Figure 3). Ponds of this size were inscrutable through the resampled resolutions used in this study thus direct comparisons are limited. Still, these rates, measured in a relatively stable marsh, are an order of magnitude lower than observed in the microtidal Blackwater marshes, where runaway marsh expansion is already occurring. This may, in part, be related to the lower tidal range found in the BNWR relative to Barnstable, MA.
Biogeochemical Feedbacks
A manifestation of marsh drowning due to SLR is the biogeochemical conditions that correspond with the early stages of pond growth. For example, high levels of hydrogen sulfide and salinity as well as low dissolved oxygen in stagnant pond water can inhibit vegetation growth, and decomposition of the existing substrate may deepen and enlarge ponds (Nyman et al., 1994; Spivak et al., 2017). This process is partially facilitated through the anaerobic decomposition of plant matter by sulfate reducing bacteria (van Huissteden and van de Plassche, 1998). Relatively high expansion rates (up to 1 m yr–1) in ponds far too small to erode from waves are consistent with a biogeochemical explanation for early stages of pond growth (Figure 5). We find that marsh adjacent to rapidly expanding ponds has consistently lower vegetation biomass, lower soil strength, and higher porewater sulfide and ammonium concentrations than marsh adjacent to stable ponds (Figure 10). This finding indicates that biogeochemical processes are the expected drivers of unstable pond expansion. High sulfide and ammonium concentrations—byproducts of anaerobic decomposition—increase stress on vegetation growth. This results in reduced above-ground vegetation biomass, which implies reduced below-ground root biomass and therefore lower contribution of roots to substrate cohesion and in-situ organic accretion. Elevated concentrations of hydrogen sulfide and ammonium are also associated with plant stress and reduced nitrogen uptake, which may trigger vegetation die-off and peat collapse, hence resulting in new pond formation (van Huissteden and van de Plassche, 1998; Swarzenski et al., 2008; Lamers et al., 2013).
Biogeochemical mechanisms for the expansion of small ponds could also explain the observed trend of decreasing pond growth rate with increasing pond size for intermediate sized ponds (Figure 5). In this phase of pond growth, we hypothesize that larger ponds are more likely to intersect the channel network, which could in turn improve soil water drainage and hence relieve the biogeochemical stressors shown to be important at our study site (Figure 10). An alternative explanation is that as a pond grows as a result of marsh drowning, it gets closer to the channel network and thus sediment sources, which increases inorganic accretion. This in turn slows the relative drowning rate and thus the lateral expansion rate of that pond, as observed in a previous model (Vinent et al., 2021). When considering areal growth rates rather than lateral growth rates for single ponds, a constant maximum growth rate exists around 150 m2 yr–1. This is observed in single ponds of all sizes with widths below the threshold for the onset of wave-driven erosion (Figure 6, yellow markers). A constant maximum area growth rate (R) would lead to an upper bound for the lateral growth rate (G) decreasing with pond area (a) as (solid line in Figure 5).
Potential Interventions to Slow Down Pond Growth
In the marshes of Blackwater, the capacity for revegetation and total pond recovery is low. Instead, efforts like “thin-layering” of dredged sediment have been and should continue being employed to preserve existing vegetated platforms through by raising elevations relative to sea-level and allowing the oxygenation of subsequently formed root networks. Our results suggest these efforts are optimal during the pond formation/single pond expansion phase before large-scale pond merging takes place. Once large, merged ponds connect to the channel network, sediment export and subsequent pond deepening makes their recovery costly and difficult (Schepers et al., 2020a). The pond merging equation we propose (Eq. 8) provides a useful timescale for the merging process which could help in establishing the critical time window, and related pond sizes, for interventions intended to slow down pond expansion.
Conclusion
Our observations from a rapidly submerging marsh in the Chesapeake Bay, United States suggest that the mechanisms and rates of pond expansion change with pond size. Historical photographs indicate that linear growth rates are maximized for intermediate size ponds (103–104 m2), where wave driven erosion is negligible. Field measurements suggest that pond stability is related to the health of the surrounding marsh, implying a biogeochemical driver for early stages of pond expansion. We find that the formation and progressive merging of ponds, rather than the isolated expansion of existing ponds, dominates the growth of small-intermediate size ponds. These processes are summarized in an empirical power-law equation for pond growth that predicts the maximum pond size at a given time and thus constitutes a lower bound for total pond area in a given system. Comparison with the model of Vinent et al. (2021) suggests the mechanisms of pond growth, including initial merging, are a result of marsh drowning due to SLR. Our findings help establish the time and length scale for optimal interventions designed to slow down pond growth in the system, with a particular focus in preventing or reducing large-scale pond merging.
Data Availability Statement
The original contributions presented in the study are included in the article/Supplementary Material, further inquiries can be directed to the corresponding author/s.
Author Contributions
JH, OV, and MK jointly conceived this research. JH executed the data (remote and field) collection, processing, and analysis. OV formulated the rate of change equations. JH and OV produced the figures. ST contributed extensive edits to the manuscript. MK connected researchers, guided the project, and secured funding. All authors jointly wrote and edited the manuscript.
Funding
This work was supported by grants from the National Science Foundation (award #1832221, 1426981, and 1654374) and its Research Experiences for Undergraduates Program (#1659656). ST acknowledges support from the Research Foundation Flanders (FWO Grant Nos. G060018N and G031620N). OV acknowledges the support of the Texas A&M Engineering Experiment Station (TEES).
Conflict of Interest
The authors declare that the research was conducted in the absence of any commercial or financial relationships that could be construed as a potential conflict of interest.
Publisher’s Note
All claims expressed in this article are solely those of the authors and do not necessarily represent those of their affiliated organizations, or those of the publisher, the editors and the reviewers. Any product that may be evaluated in this article, or claim that may be made by its manufacturer, is not guaranteed or endorsed by the publisher.
Acknowledgments
We acknowledge Lennert Schepers who provided data to kick-start the project. We appreciate assistance from Ellen Herbert, Iris Anderson, Ken Czapla, and David Walters and appreciate helpful manuscript reviews from Giulio Mariotti and Mark Schuerch. This article is dedicated to the late David Nicks, our lab-mate and friend. This is contribution no. 4047 from the Virginia Institute of Marine Science, College of William & Mary.
Supplementary Material
The Supplementary Material for this article can be found online at: https://www.frontiersin.org/articles/10.3389/fmars.2021.704768/full#supplementary-material
References
Allen, J. R. L. (1990). Salt-marsh growth and stratification: a numerical model with special reference to the severn estuary, Southwest Britain. Mar. Geol. 95, 77–96. doi: 10.1016/0025-3227(90)90042-I
Barbier, E. B., Hacker, S. D., Kennedy, C., Koch, E. W., Stier, A. C., and Silliman, B. R. (2011). The value of estuarine and coastal ecosystem services. Ecol. Monogr. 81, 169–193. doi: 10.1890/10-1510.1
Belzen, J. V., van de Koppel, J., Kirwan, M. L., van der Wal, D., Herman, P. M. J., Dakos, V., et al. (2017). Vegetation recovery in tidal marshes reveals critical slowing down under increased inundation. Nat. Commun. 8:15811. doi: 10.1038/ncomms15811
Burdick, D. M., and Mendelssohn, I. A. (1990). Relationship between anatomical and metabolic responses to soil waterlogging in the Coastal grass Spartina Patens. J. Exp. Bot. 41, 223–228. doi: 10.1093/jxb/41.2.223
Carniello, L., Defina, A., and D’Alpaos, L. (2009). Morphological evolution of the venice lagoon: evidence from the past and trend for the future. J. Geophys. Res. 114:F04002. doi: 10.1029/2008JF001157
Cline, J. D. (1969). Spectrophotometric determination of hydrogen sulfide in natural waters1. Limnol. Oceanogr. 14, 454–458. doi: 10.4319/lo.1969.14.3.0454
Day, J. W., Britsch, L. D., Hawes, S. R., Shaffer, G. P., Reed, D. J., and Cahoon, D. (2000). Pattern and process of land loss in the Mississippi delta: a spatial and temporal analysis of Wetland habitat change. Estuaries 23, 425–438. doi: 10.2307/1353136
Day, J. W., Paul Kemp, G., Reed, D. J., Cahoon, D. R., Boumans, R. M., Suhayda, J. M., et al. (2011). Vegetation death and rapid loss of surface elevation in two contrasting mississippi delta salt marshes: the role of sedimentation, autocompaction and sea-level rise. Ecol. Eng. 37, 229–240. doi: 10.1016/j.ecoleng.2010.11.021
DeLaune, R. D., Nyman, J. A., and Patrick, W. H. Jr. (1994). Peat collapse, ponding and wetland loss in a rapidly submerging coastal marsh. J. Coast. Res. 10, 1021–1030.
Ezer, T., Atkinson, L. P., Corlett, W. B., and Blanco, J. L. (2013). Gulf stream’s induced sea level rise and variability along the U.S. Mid-Atlantic coast: gulf stream induces coastal sea level rise. J. Geophys. Res. 118, 685–697. doi: 10.1002/jgrc.20091
Fagherazzi, S., Anisfeld, S. C., Blum, L. K., Long, E. V., Feagin, R. A., Fernandes, A., et al. (2019). Sea level rise and the dynamics of the marsh-upland boundary. Front. Environ. Sci. 7:25. doi: 10.3389/fenvs.2019.00025
Ganju, N. K., Defne, Z., and Fagherazzi, S. (2020). Are elevation and open-water conversion of salt marshes connected? Geophys. Res. Lett. 47:e2019GL086703. doi: 10.1029/2019GL086703
Ganju, N. K., Defne, Z., Kirwan, M. L., Fagherazzi, S., D’Alpaos, A., and Carniello, L. (2017). Spatially integrative metrics reveal hidden vulnerability of microtidal salt marshes. Nat. Commun. 8:14156. doi: 10.1038/ncomms14156
Ganju, N. K., Nidzieko, N. J., and Kirwan, M. L. (2013). Inferring tidal wetland stability from channel sediment fluxes: observations and a conceptual model: inferring stability from sediment fluxes. J. Geophys. Res. 118, 2045–2058. doi: 10.1002/jgrf.20143
Hartig, E. K., Gornitz, V., Kolker, A., Mushacke, F., and Fallon, D. (2002). Anthropogenic and climate-change impacts on salt marshes of Jamaica Bay, New York City. Wetlands 22, 71–89.
Himmelstein, J. (2018). The Mechanisms of Pond Expansion in the Marshes of Blackwater National Wildlife Refuge, Maryland. William and Mary Honors Theses. Williamsburg, VA: William & Mary.
Jafari, N. H., Harris, B. D., Cadigan, J. A., Day, J. W., Sasser, C. E., Paul Kemp, G., et al. (2019). Wetland shear strength with emphasis on the impact of nutrients, sediments, and sea level rise. Estuar. Coast. Shelf Sci. 229:106394. doi: 10.1016/j.ecss.2019.106394
Johnston, M. E., Cavatorta, J. R., Hopkinson, C. S., and Valentine, V. (2003). Importance of metabolism in the development of salt marsh ponds. Biol. Bull. 205, 248–249. doi: 10.2307/1543278
Kearney, M. S., Grace, R. E., and Stevenson, J. C. (1988). Marsh loss in nanticoke estuary, Chesapeake Bay. Geogr. Rev. 78:205. doi: 10.2307/214178
Kirwan, M. L., and Guntenspergen, G. R. (2012). Feedbacks between inundation, root production, and shoot growth in a rapidly submerging brackish marsh: marsh root growth under sea level rise. J. Ecol. 100, 764–770. doi: 10.1111/j.1365-2745.2012.01957.x
Kirwan, M. L., and Guntenspergen, G. R. (2015). Response of plant productivity to experimental flooding in a stable and a submerging marsh. Ecosystems 18, 903–913. doi: 10.1007/s10021-015-9870-0
Kirwan, M. L., and Megonigal, J. P. (2013). Tidal wetland stability in the face of human impacts and sea-level rise. Nature 504, 53–60. doi: 10.1038/nature12856
Kirwan, M. L., Walters, D. C., Reay, W. G., and Carr, J. A. (2016). Sea level driven marsh expansion in a coupled model of marsh erosion and migration: sea level driven marsh expansion. Geophys. Res. Lett. 43, 4366–4373. doi: 10.1002/2016GL068507
Lamers, L. P. M., Govers, L. L. I, Janssen, C. J. M., Geurts, J. J. M., Van der Welle, M. E. W., Van Katwijk, M. M., et al. (2013). Sulfide as a soil phytotoxin—a review. Front. Plant Sci. 4:268. doi: 10.3389/fpls.2013.00268
Mariotti, G. (2016). Revisiting salt marsh resilience to sea level rise: are ponds responsible for permanent land loss? Salt marsh ponds. J. Geophys. Res. 121, 1391–1407. doi: 10.1002/2016JF003900
Mariotti, G., and Fagherazzi, S. (2013). Critical width of tidal flats triggers marsh collapse in the absence of sea-level rise. Proc. Natl. Acad. Sci. 110, 5353–5356. doi: 10.1073/pnas.1219600110
Mariotti, G., Spivak, A. C., Luk, S. Y., Ceccherini, G., Tyrrell, M., and Eagle Gonneea, M. (2020). Modeling the spatial dynamics of marsh ponds in New England salt marshes. Geomorphology 365:107262. doi: 10.1016/j.geomorph.2020.107262
Mendelssohn, I. A., and McKee, K. L. (1988). Spartina alterniflora die-back in louisiana: time-course investigation of soil waterlogging effects. J. Ecol. 76:509. doi: 10.2307/2260609
Millette, T. L., Argow, B. A., Marcano, E., Hayward, C., Hopkinson, C. S., and Valentine, V. (2010). Salt marsh geomorphological analyses via integration of multitemporal multispectral remote sensing with LIDAR and GIS. J. Coast. Res. 265, 809–816. doi: 10.2112/JCOASTRES-D-09-00101.1
Möller, I., Kudella, M., Rupprecht, F., Spencer, T., Paul, M., van Wesenbeeck, B. K., et al. (2014). Wave attenuation over coastal salt marshes under storm surge conditions. Nat. Geosci. 7, 727–731. doi: 10.1038/ngeo2251
Morton, R. A., Tiling, G., and Ferina, N. F. (2003). Causes of hot-spot Wetland loss in the Mississippi delta plain. Environ. Geosci. 10, 71–80. doi: 10.1306/eg100202007
Mudd, S. M., D’Alpaos, A., and Morris, J. T. (2010). How does vegetation affect sedimentation on tidal marshes? Investigating particle capture and hydrodynamic controls on biologically mediated sedimentation. J. Geophys. Res. 115:F03029. doi: 10.1029/2009JF001566
Nahlik, A. M., and Fennessy, M. S. (2016). Carbon storage in US wetlands. Nat. Commun. 7:13835. doi: 10.1038/ncomms13835
Nyman, J. A., Carloss, M., Delaune, R. D., and Patrick, W. H. (1994). Erosion rather than plant dieback as the mechanism of marsh loss in an estuarine marsh. Earth Surf. Process. Landf. 19, 69–84. doi: 10.1002/esp.3290190106
Nyman, J. A., DeLaune, R. D., Roberts, H. H., and Patrick, W. H. (1993). Relationship between vegetation and soil formation in a rapidly submerging coastal marsh. Mar. Ecol. Prog. Ser. 96, 269–279. doi: 10.3354/meps096269
Ortiz, A. C., Roy, S., and Edmonds, D. A. (2017). Land loss by pond expansion on the Mississippi river delta plain: pond expansion on mississippi marshes. Geophys. Res. Lett. 44, 3635–3642. doi: 10.1002/2017GL073079
Pethick, J. S. (1974). The distribution of salt pans on tidal salt marshes. J. Biogeogr. 1:57. doi: 10.2307/3038068
Pethick, J. S. (1992). “Saltmarsh geomorphology,” in Saltmarshes: Morphodynamics, Conservation and Engineering Significance, eds J. R. L. Allen and K. Pye (Cambridge: Cambridge University Press), 41–62.
Redfield, A. C. (1972). Development of a New England salt marsh. Ecol. Monogr. 42, 201–237. doi: 10.2307/1942263
Reed, D. J., Spencer, T., Murray, A. L., French, J. R., and Leonard, L. (1999). Marsh surface sediment deposition and the role of tidal creeks: implications for created and managed coastal marshes. J. Coast. Conserv. 5, 81–90. doi: 10.1007/BF02802742
Sallenger, A. H., Doran, K. S., and Howd, P. A. (2012). Hotspot of accelerated sea-level rise on the Atlantic Coast of North America. Nat. Clim. Chang. 2, 884–888. doi: 10.1038/nclimate1597
Schepers, L. (2017). Spatial Patterns and Bio-Geomorphological Effects of Vegetation Loss in a Submerging Coastal Marsh. Belgium: Antwerpen University.
Schepers, L., Brennand, P., Kirwan, M. L., Guntenspergen, G. R., and Temmerman, S. (2020a). Coastal marsh degradation into ponds induces irreversible elevation loss relative to sea level in a microtidal system. Geophys. Res. Lett. 47:e2020GL089121. doi: 10.1029/2020GL089121
Schepers, L., Kirwan, M., Guntenspergen, G., and Temmerman, S. (2017). Spatio-temporal development of vegetation die-off in a submerging coastal marsh. Limnol. Oceanogr. 62, 137–150. doi: 10.1002/lno.10381
Schepers, L., Van Braeckel, A., Bouma, T. J., and Temmerman, S. (2020b). How progressive vegetation die-off in a tidal marsh would affect flow and sedimentation patterns: a field demonstration. Limnol. Oceanogr. 65, 401–412. doi: 10.1002/lno.11308
Scott, M., McDermott, L., Silva, E., and Watson, E. (2009). Project report: Digital Spatial Data Capture of Marsh Extent in Blackwater National Wildlife Refuge, 1938 and 2006. Eastern Shore Regional GIS Cooperative, Salisbury University.
Shriver, G., Hodgman, T. P., Gibbs, J. P., and Vickery, P. D. (2004). Landscape context influences salt marsh bird diversity and area requirements in New England. Biol. Conserv. 119, 545–553. doi: 10.1016/j.biocon.2004.01.016
Spivak, A. C., Gosselin, K., Howard, E., Mariotti, G., Forbrich, I., Stanley, R., et al. (2017). Shallow ponds are heterogeneous habitats within a temperate salt marsh ecosystem: shallow ponds are heterogeneous habitats. J. Geophys. Res. 122, 1371–1384. doi: 10.1002/2017JG003780
Squiers, E. R., and Good, R. E. (1974). Seasonal changes in the productivity, caloric content, and chemical composition of a population of salt-marsh cord-grass (Spartina alterniflora). Chesapeake Sci. 15:63. doi: 10.2307/1351263
Stevenson, J. C., Kearney, M. S., and Pendleton, E. C. (1985). Sedimentation and erosion in a Chesapeake Bay brackish marsh system. Mar. Geol. 67, 213–235. doi: 10.1016/0025-3227(85)90093-3
Swarzenski, C. M., Doyle, T. W., Fry, B., and Hargis, T. G. (2008). Biogeochemical response of organic-rich freshwater marshes in the Louisiana delta plain to chronic river water influx. Biogeochemistry 90, 49–63. doi: 10.1007/s10533-008-9230-7
Temmerman, S., Govers, G., Meire, P., and Wartel, S. (2003). Modelling long-term tidal marsh growth under changing tidal conditions and suspended sediment concentrations, Scheldt Estuary, Belgium. Mar. Geol. 193, 151–169. doi: 10.1016/S0025-3227(02)00642-4
Temmerman, S., Moonen, P., Schoelynck, J., Govers, G., and Bouma, T. J. (2012). Impact of vegetation die-off on spatial flow patterns over a tidal marsh: tidal marsh die-off and flow patterns. Geophys. Res. Lett. 39:L03406. doi: 10.1029/2011GL050502
Vandenbruwaene, W., Temmerman, S., Bouma, T. J., Klaassen, P. C., de Vries, M. B., Callaghan, D. P., et al. (2011). Flow interaction with dynamic vegetation patches: implications for biogeomorphic evolution of a tidal landscape: flow interaction with dynamic patches. J. Geophys. Res. Earth Surf. 116:F01008. doi: 10.1029/2010JF001788
van Huissteden, J., and van de Plassche, O. (1998). Sulphate reduction as a geomorphological agent in tidal marshes (‘Great Marshes’ at Barnstable, Cape Cod, USA). Earth Surf. Process. Landf. 23, 223–236.
Vinent, O. D., Herbert, E. R., Coleman, D. J., Himmelstein, J. D., and Kirwan, M. L. (2021). Onset of runaway fragmentation of salt marshes. One Earth 4, 506–516. doi: 10.1016/j.oneear.2021.02.013
Wang, C., Schepers, L., Kirwan, M. L., Belluco, E., D’Alpaos, A., Wang, Q., et al. (2021). Different coastal marsh sites reflect similar topographic conditions under which bare patches and vegetation recovery occur. Earth Surf. Dyn. 9, 71–88. doi: 10.5194/esurf-9-71-2021
Wang, C., and Temmerman, S. (2013). Does biogeomorphic feedback lead to abrupt shifts between alternative landscape states?: An empirical study on intertidal flats and marshes: shifts between intertidal flat and marsh. J. Geophys. Res. Earth Surf. 118, 229–240. doi: 10.1029/2012JF002474
Wang, D.-P., and Elliott, A. J. (1978). Non-tidal variability in the Chesapeake Bay and Potomac River: evidence for non-local forcing. J. Phys. Oceanogr. 8, 225–232. doi: 10.1175/1520-0485(1978)008<0225:NTVITC>2.0.CO;2
Weston, N. B. (2014). Declining sediments and rising seas: an unfortunate convergence for tidal wetlands. Estuaries Coast. 37, 1–23. doi: 10.1007/s12237-013-9654-8
Wilson, C. A., Hughes, Z. J., FitzGerald, D. M., Hopkinson, C. S., Valentine, V., and Kolker, A. S. (2014). Saltmarsh pool and tidal creek morphodynamics: dynamic equilibrium of northern latitude saltmarshes? Geomorphology 213, 99–115. doi: 10.1016/j.geomorph.2014.01.002
Wilson, K. R., Kelley, J. T., Croitoru, A., Dionne, M., Belknap, D. F., and Steneck, R. (2009). Stratigraphic and ecophysical characterizations of salt pools: dynamic landforms of the Webhannet salt marsh, Wells, ME, USA. Estuaries Coast. 32, 855–870. doi: 10.1007/s12237-009-9203-7
Wilson, K. R., Kelley, J. T., Tanner, B. R., and Belknap, D. F. (2010). Probing the origins and stratigraphic signature of salt pools from north-temperate marshes in Maine, U.S.A. J. Coast. Res. 26, 1007–1026. doi: 10.2112/JCOASTRES-D-10-00007.1
Keywords: microtidal, saltmarsh, merging, biogeochemical, geomorphology, pond, pool, hydrology
Citation: Himmelstein J, Vinent OD, Temmerman S and Kirwan ML (2021) Mechanisms of Pond Expansion in a Rapidly Submerging Marsh. Front. Mar. Sci. 8:704768. doi: 10.3389/fmars.2021.704768
Received: 03 May 2021; Accepted: 09 August 2021;
Published: 29 September 2021.
Edited by:
Zeng Zhou, Hohai University, ChinaReviewed by:
Giulio Mariotti, Louisiana State University, United StatesMark Schuerch, University of Lincoln, United Kingdom
Copyright © 2021 Himmelstein, Vinent, Temmerman and Kirwan. This is an open-access article distributed under the terms of the Creative Commons Attribution License (CC BY). The use, distribution or reproduction in other forums is permitted, provided the original author(s) and the copyright owner(s) are credited and that the original publication in this journal is cited, in accordance with accepted academic practice. No use, distribution or reproduction is permitted which does not comply with these terms.
*Correspondence: Joshua Himmelstein, amhpbW1lbEBlbWFpbC51bmMuZWR1; Orencio Duran Vinent, b2R1cmFudmluZW50QHRhbXUuZWR1