
94% of researchers rate our articles as excellent or good
Learn more about the work of our research integrity team to safeguard the quality of each article we publish.
Find out more
TECHNOLOGY AND CODE article
Front. Mar. Sci., 19 August 2021
Sec. Ocean Observation
Volume 8 - 2021 | https://doi.org/10.3389/fmars.2021.703650
This article is part of the Research TopicInnovation and Discoveries in Marine Soundscape ResearchView all 20 articles
 Jennifer L. Miksis-Olds1*
 Peter J. Dugan2
 S. Bruce Martin3
 Holger Klinck2,4
 David K. Mellinger5
 David A. Mann6
 Dimitri W. Ponirakis2
 Olaf Boebel7
Making Ambient Noise Trends Accessible (MANTA) software is a tool for the community to enable comparisons between soundscapes and identification of ambient ocean sound trends required by ocean stakeholders. MANTA enhances the value of individual datasets by assisting users in creating thorough calibration metadata and internationally recommended products comparable over time and space to ultimately assess ocean sound at any desired scale up to a global level. The software package combines of two applications: MANTA Metadata App, which allows users to specify information about their recordings, and MANTA Data Mining App, which applies that information to acoustic recordings to produce consistently processed, calibrated time series products of sound pressure levels in hybrid millidecade bands. The main outputs of MANTA are daily.csv and NetCDF files containing 60-s spectral energy calculations in hybrid millidecade bands and daily statistics images. MANTA data product size and formats enable easy and compact transfer and archiving among researchers and programs, allowing data to be further averaged and explored to address user-specified questions.
Sound permeates the ocean and travels to the deepest ocean depths relatively uninhibited compared to light. Because of its efficient propagation in water, sound has become the dominant modality for sensing the underwater environment for marine life and humans alike (Howe et al., 2019). Marine animals rely on sound for communicating, foraging, and navigating; the reliance on sound for vital life functions also puts marine animals at risk for adverse impacts from human activities that produce sound (Boyd et al., 2011; Duarte et al., 2021). Similarly, humans use sound for a wide variety of underwater applications, including observation of ocean dynamics, military reconnaissance and surveillance, oceanographic and geophysical research, monitoring abundance and distribution of marine life associated with fisheries and biodiversity, and marine hazard warning.
Whether purposefully for communication or sensing, or incidentally as a by-product of activity such as marine construction, shipping, or iceberg calving, most ocean processes, inhabitants, and users produce sounds that propagate varying distances. The distance the sounds propagate depends on the signal frequency and environmental conditions. Consequently, there is an incredible amount of information captured in the ocean soundscape. The applied uses of information present in passive acoustic recordings of ocean soundscapes continues to grow as (1) the cost and commercial availability of passive acoustic recorders makes this technology widely accessible (Mellinger et al., 2007; Sousa-Lima et al., 2013; Gibb et al., 2019), (2) storage and battery capacity support longer autonomous deployments, (3) advances in signal processing related to machine learning and artificial intelligence make harvesting valuable information from the large volume of soundscape data tractable (Caruso et al., 2020; Shiu et al., 2020), and (4) national/international policy and regulation recognize ocean sound as an ocean parameter to be managed due to the potential negative impacts on the marine environment (Tasker et al., 2010; Duarte et al., 2021). Innovative ocean sound applications associated with policy and economy now include soundscapes being used as a functional management tool (Van Parijs et al., 2009) and as an indicator of global economy and trade (Frisk, 2012; Thomson and Barclay, 2020).
Ocean sound is now an essential ocean variable (EOV) of the Biology and Ecosystem component of Global Ocean Observing System (GOOS) (Ocean Sound EOV, 2018) creating the opportunity to make the recording of soundscapes routine within the structured framework of the GOOS data acquisition and public access plan. In addition to the incorporation of passive acoustic sensors into formal ocean observation and monitoring systems like GOOS and the International Monitoring System (IMS) of the Comprehensive Nuclear-Test-Ban Treaty Organization (CTBTO), there are hundreds of hydrophone systems deployed throughout the world’s oceans by independent organizations and individuals (Haralabus et al., 2017; Tyack et al., 2021). The International Quiet Ocean Experiment (IQOE) Program has recognized the unique opportunity to coordinate the analysis of local and regional ocean soundscape projects and recordings in an effort to gain a better understanding of global patterns and trends and how observed changes might impact marine life (Boyd et al., 2011; Tyack et al., 2021). To make the IQOE vision a reality and to enable accurate comparison of ocean sound levels and soundscape characteristics among different projects and regions over time, standard guidelines for data processing and reporting are necessary.
A critical first step toward standardizing the ocean soundscape community occurred in 2017 when the International Organization for Standardization (ISO) developed ISO Standard 18405 on Underwater Acoustics-Terminology to facilitate a common language and definitions of soundscape measurements and products across projects (International Organization for Standardization (ISO), 2017). Individual programs are advancing the effort to communicate and share specific project guidelines for processing and reporting soundscape metrics to enable direct comparisons between project results [e.g., Atlantic Deepwater Ecosystem Observatory Network (ADEON) – Ainslie et al., 2018; Programme for Ambient Noise North Sea (JOMOPANS) – Merchant et al., 2018]. Likewise, multiple national and international entities have recognized the need for standardizing soundscape analysis and reporting which has led to the convening of cross-sector workshops of ocean stakeholders to develop protocols and guidelines for producing and using soundscape data to identify salient patterns and trends in ocean sound levels (Martin et al., 2021). Ocean sound measurements and modeling workshops convened over the past 7 years (Table 1) took the second step of recommending consensus methods for the analysis of underwater acoustic data and reporting of ocean sound levels to ensure accurate comparisons between studies utilizing different recording hardware, measurement protocols, and signal processing methods. The 2018 Consortium for Ocean Leadership (COL) Ocean Sound Workshop strongly recommended the development of a standardized, publicly available, user-friendly software package that would create data products consistent with the consensus specifications identified for the processing and reporting of ocean sound (Consortium for Ocean Leadership (COL), 2018).
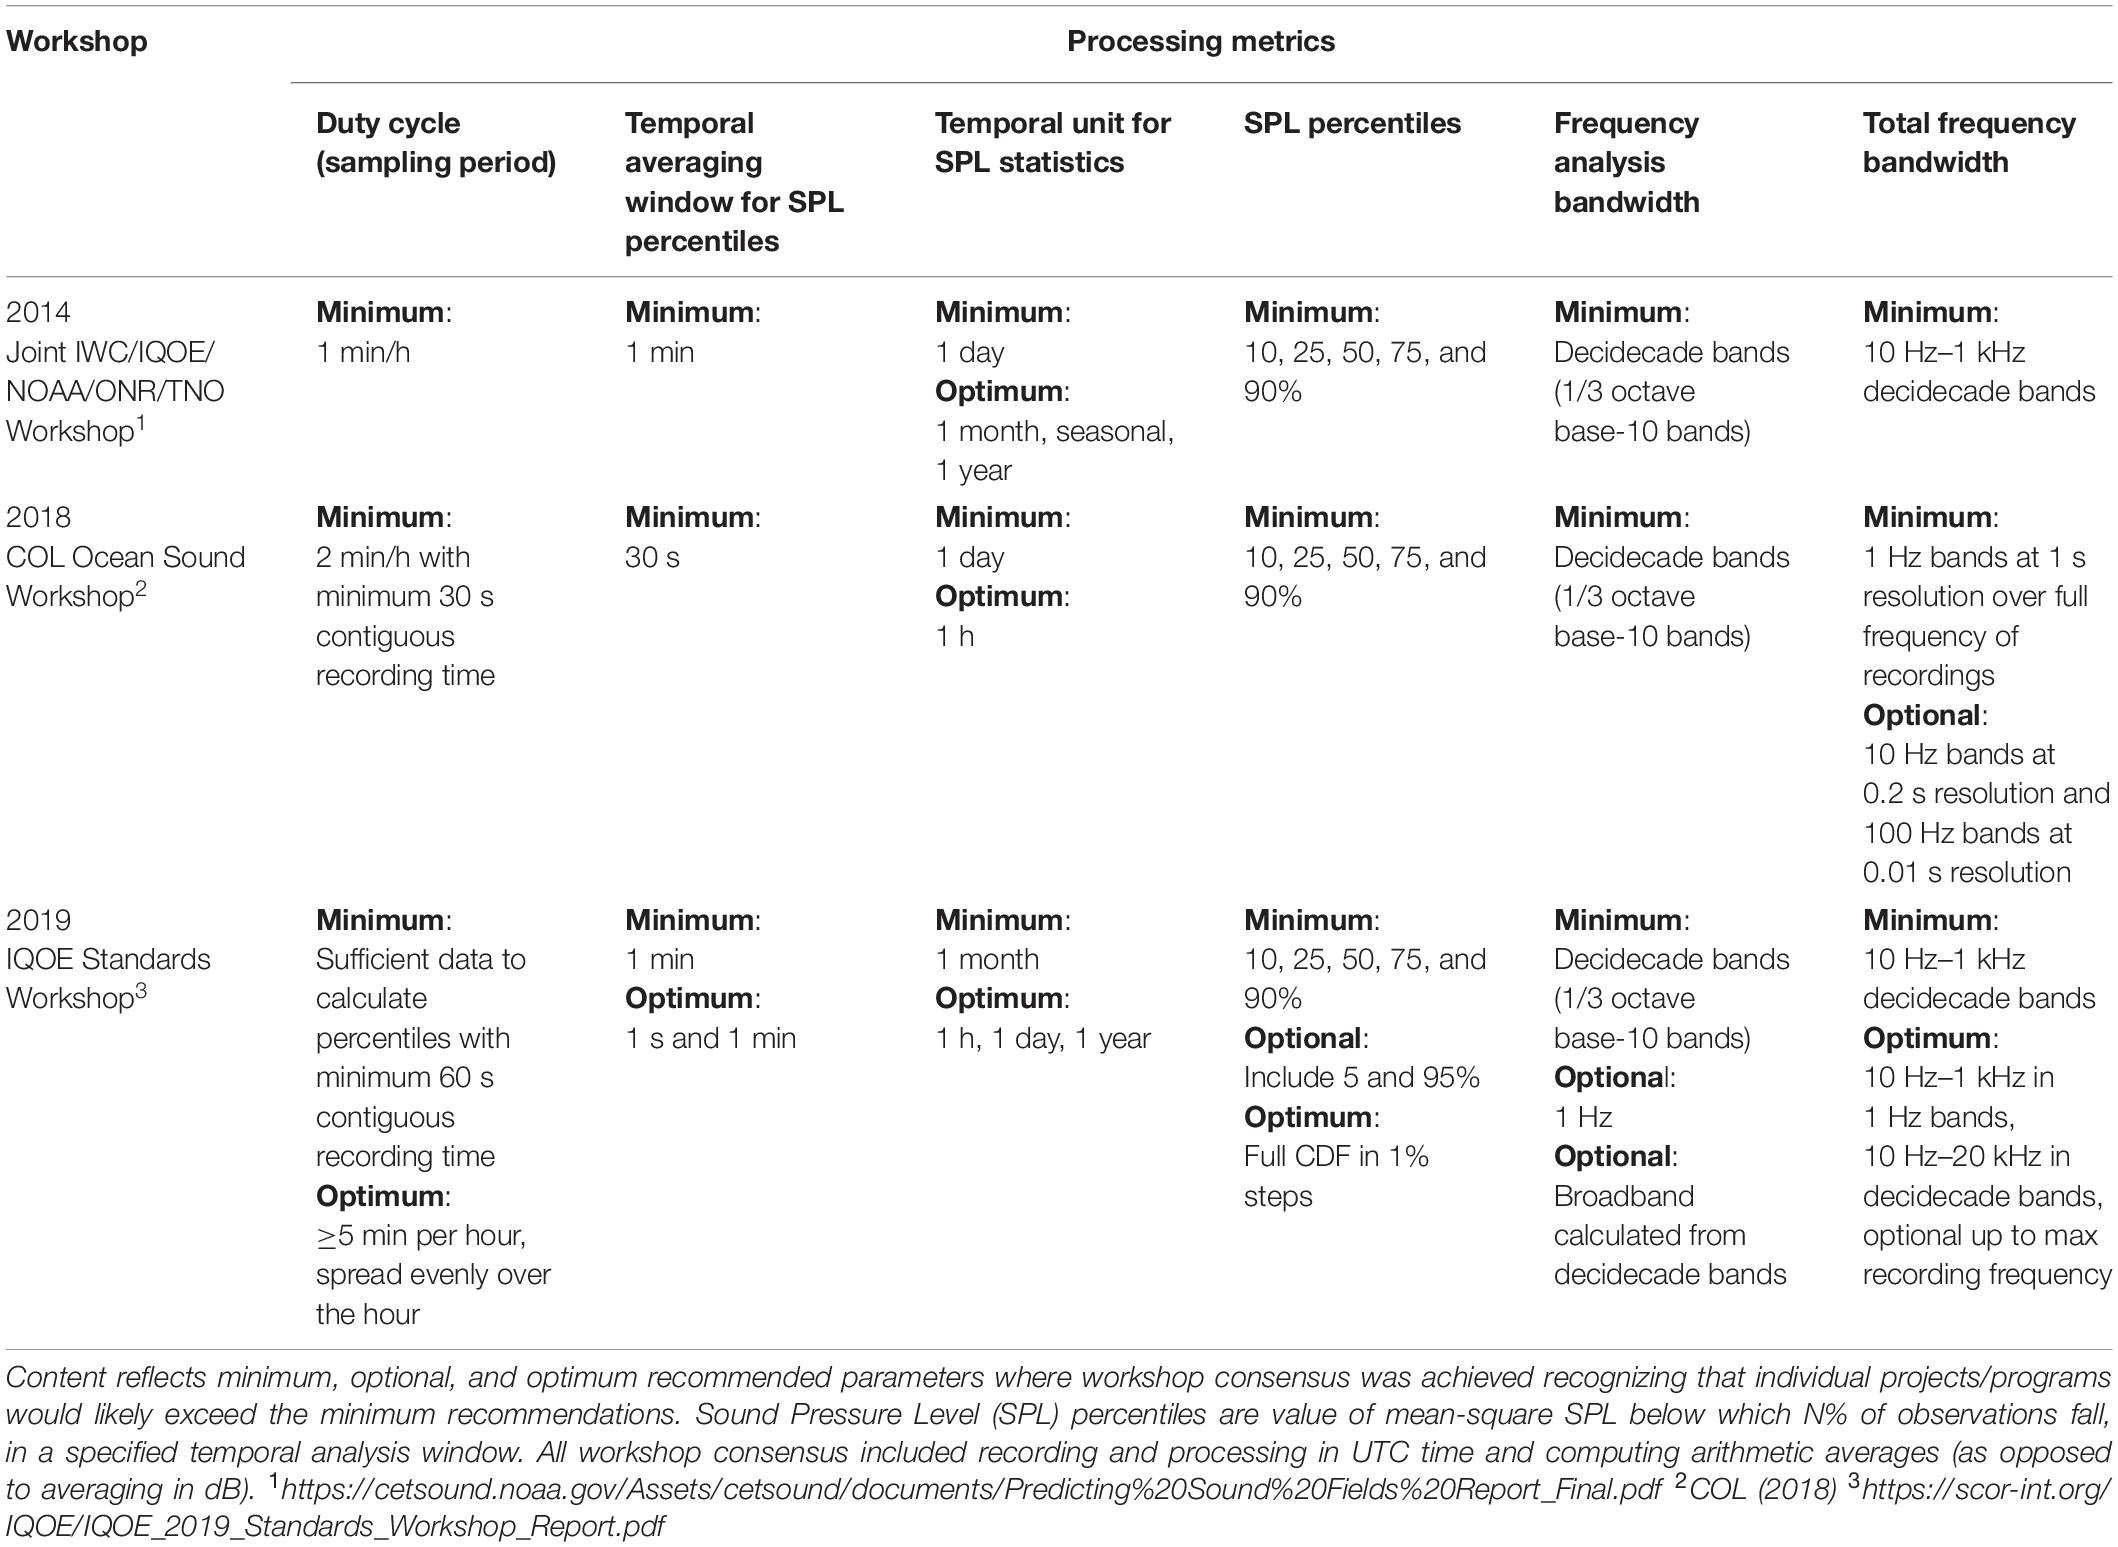
Table 1. Recommendations from international workshops focused on soundscapes and trends in ocean sound.
A team of international acousticians from academia, industry, and government came together to accept the challenge of developing such a user-friendly software package that incorporates user-specified calibration information to produce calibrated sound level products with associated metadata for both underwater and in-air recordings. The goal was to develop a software package that would allow acousticians as well as those with minimal signal processing experience to transform raw acoustic recordings and their associated calibration information into calibrated sound level products without the need to develop software themselves. The details of producing a simple time series of sound pressure levels (SPLs) can be difficult due to the different decisions that need to be made related to the processing details of temporal averaging window size, frequency bandwidth, and metric (e.g., SPL root-mean-square vs. SPL peak level) (Table 1). The Making Ambient Noise Trends Accessible (MANTA) software provides a tool to the community that implements the technical recommendations of the workshops and enables calibrated comparisons between soundscapes and identification of ambient ocean sound trends needed by ocean stakeholders, researchers, and managers.
Making Ambient Noise Trends Accessible is provided for download in two forms that currently run on Windows operating systems1 (a macOS version is currently under development): (1) as a bundled set of MATLAB scripts (i.e., m-files) executed under MATLAB (version 2020b2), and (2) as a stand-alone, fully compiled executable that does not require the user to obtain a MATLAB license (i.e., it is completely free and anyone with a suitable Windows machine can install it). MANTA is licensed under a General Public License (GPL) 3.0 license that is made available to users under the Terms of Use portion of the MANTA Wiki at https://bitbucket.org/CLO-BRP/manta-wiki/wiki/MANTA%20Software. The tool is based on the Raven-X software application (Dugan et al., 2015) which scales data processing from small laptops to large computer clusters. Raven-X is designed as a fault-tolerant application (e.g., skipping over corrupted files) optimized to run without interruptions for long periods. Data scaling is based on a technology referred to as acoustic data acceleration, or ADA (Dugan et al., 2014, 2015), which is specifically designed to handle large archives of sound files. The ADA process analyses the entire collection, keeping track of breaks or duty cycle periods, and creates a series of header files that describe the data. Any corrupt sound files are also detected during this phase, are noted, and skipped. Header files are organized into packets of equal length, or hour-blocks, and evenly distributed across computer resources, where the hybrid millidecade algorithm and metadata calibration are applied. Hour results are gathered and merged into output records. If using the MATLAB desktop version of MANTA, the following toolboxes are required: Signal Processing, Image Processing, Deep Learning, Statistics, and optionally Parallel Processing. The MATLAB application or app performs a system check on the user’s MATLAB upon installation and identifies any missing toolboxes. The MATLAB app can run without the Parallel Processing toolbox, but this results in longer run times. With the standalone executable version of MANTA, any needed toolboxes are automatically provided.
The MANTA software package, in either the MATLAB script form or the standalone executable form, contains two apps. The main application is the MANTA Data Mining App. Within the MANTA Data Mining App, there is an embedded MANTA Metadata App for generating the calibration and metadata file needed for running the MANTA Data Mining App. The MANTA Metadata App is accessed from under the Tools tab and must be run before running any data through the MANTA Data Mining App.
Metadata capture information on the data project, deployment, recording parameters, data quality, calibration information, and data owner point of contact (Figure 1). The MANTA Metadata App was developed to address the complexity and challenges associated with both calibrating recording systems and correctly applying calibration information to the signal processing of ocean sound levels. The MANTA Metadata App queries the user to enter calibration information related to the recorder and/or system in required entry cells which the Data Mining App subsequently applies to the processing of the audio recordings (Figure 2).
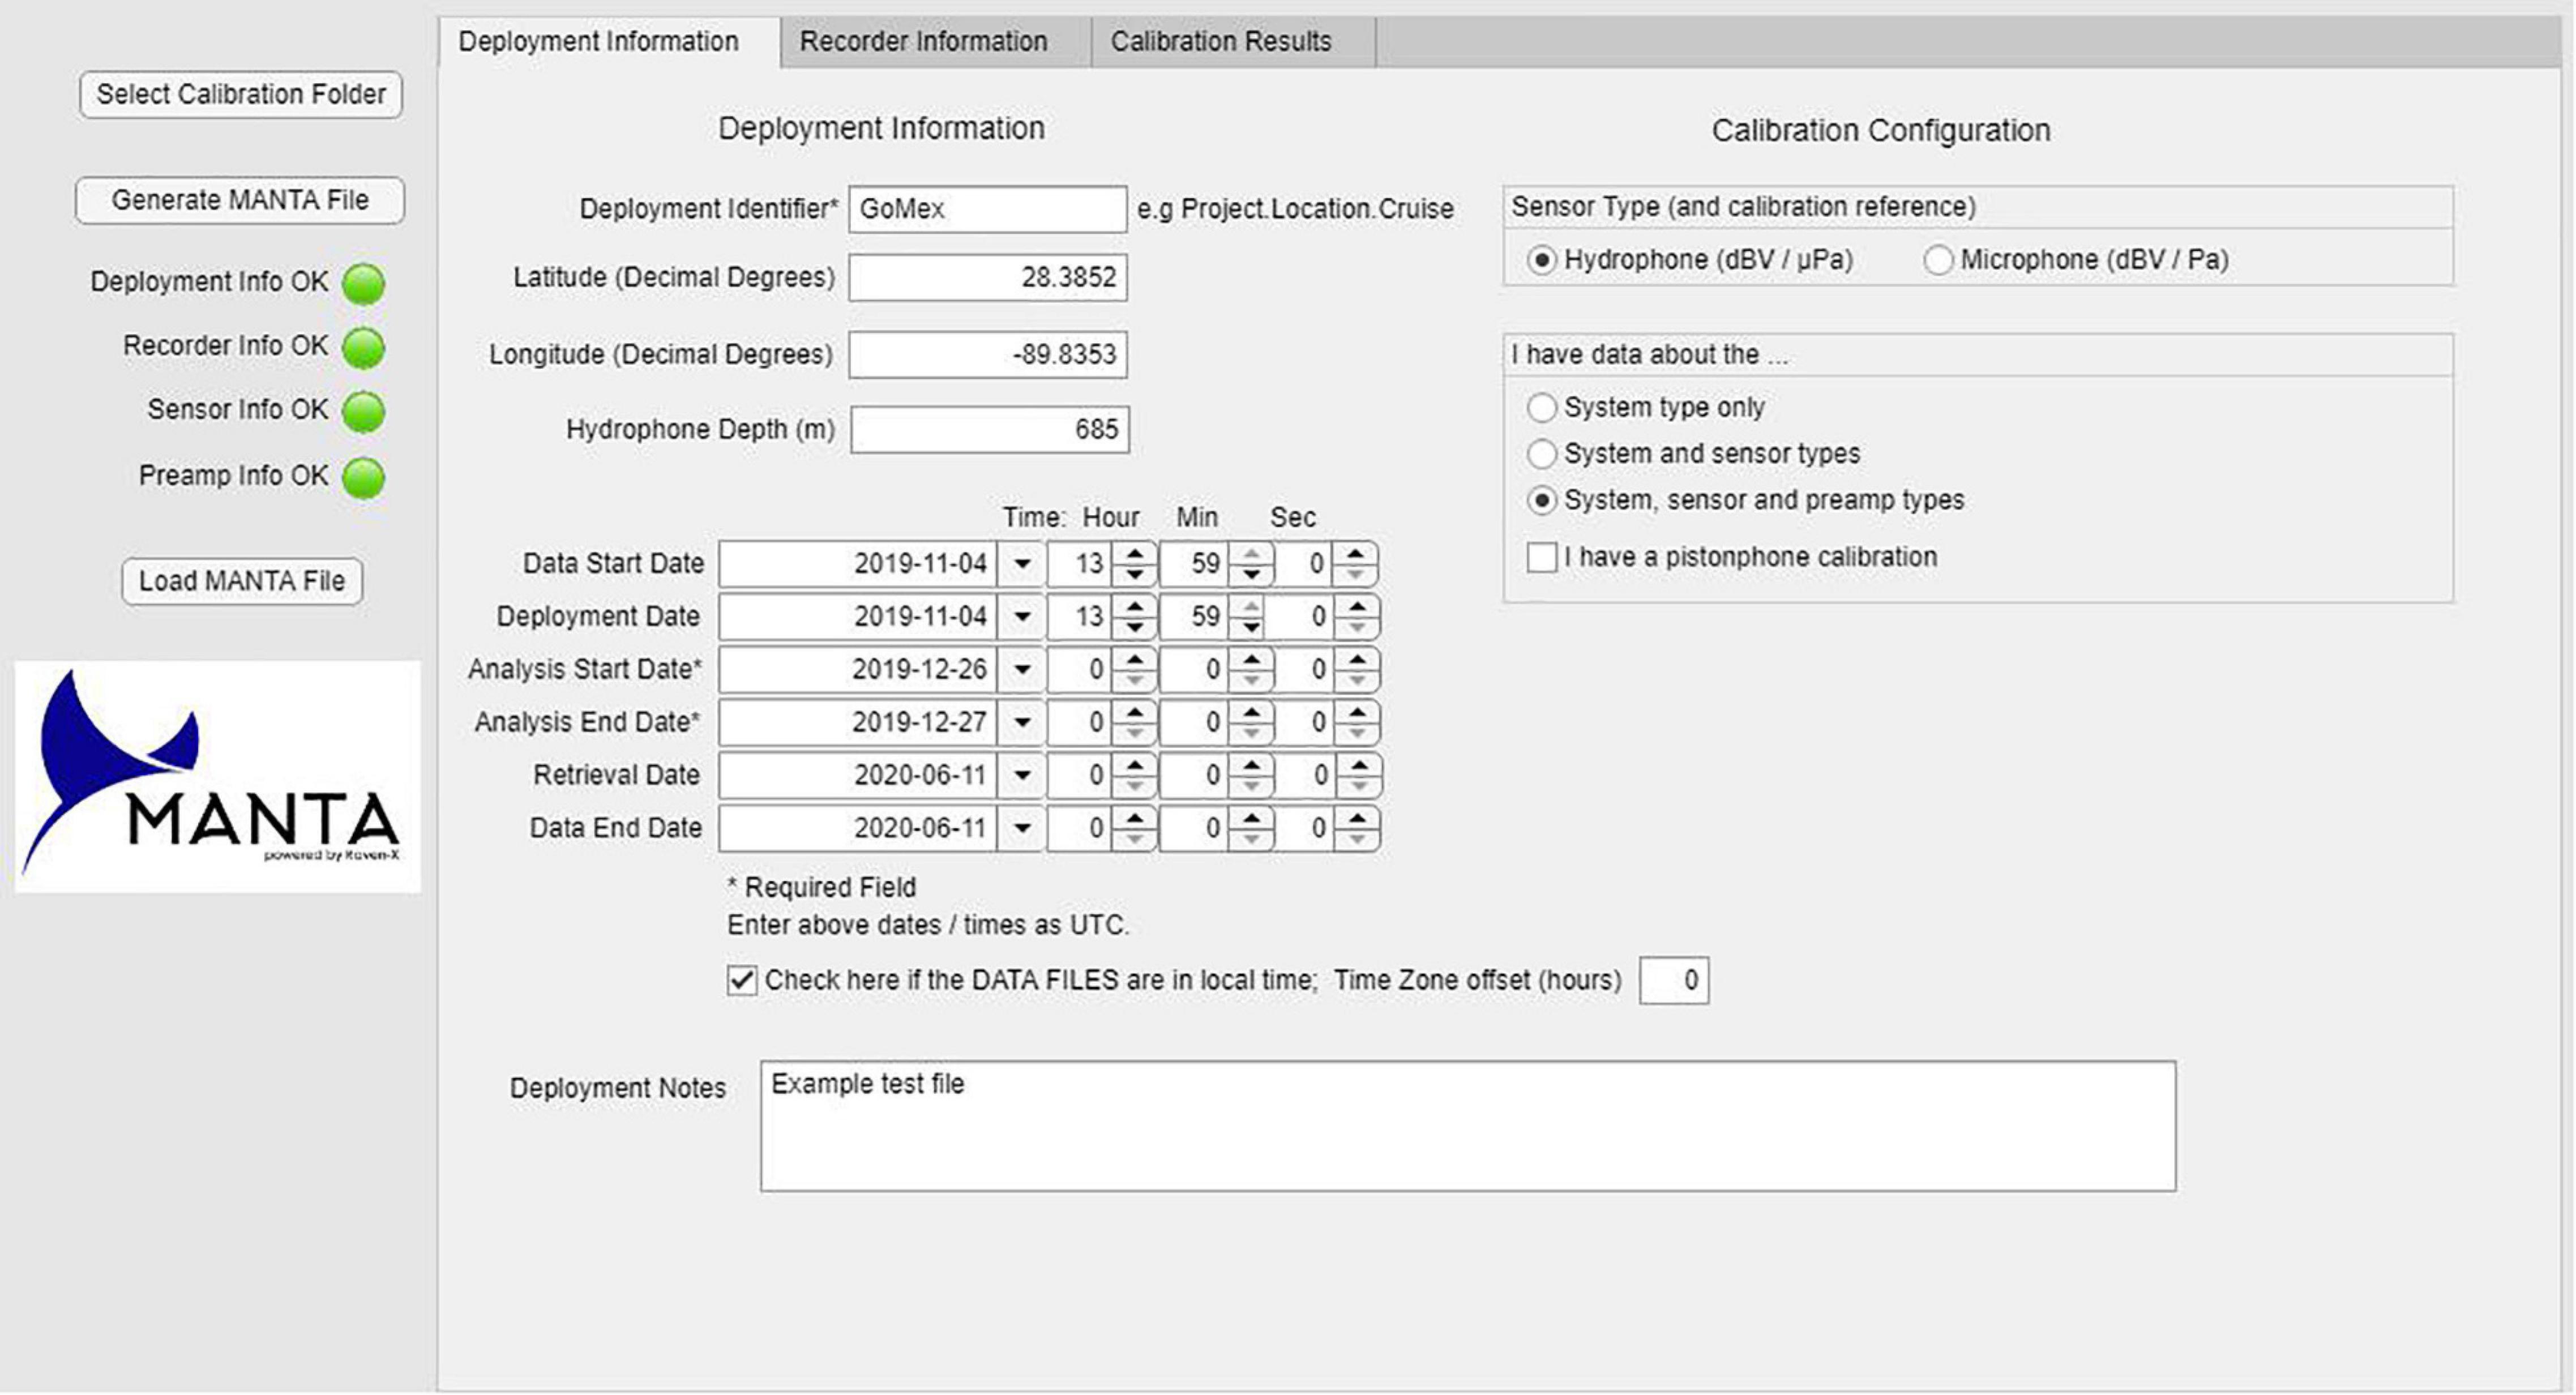
Figure 1. MANTA Metadata App Deployment Information graphical user interface (GUI) for deployment information. When the deployment information is fully entered and correct, the Deployment Info OK button on the left side bar turns green. Either hydrophone and microphone can be specified on the Sensor Type. Note that selecting “hydrophone” implicitly assumes depth below sea surface, whereas microphone assumes height above sea level. Note: users can specify different instrument start, deployment, and analysis dates. The MANTA Data Mining App will only process data within the analysis dates. This function allows for users to specify the analysis period that does not include any potentially contaminated data at the beginning and end of deployments.
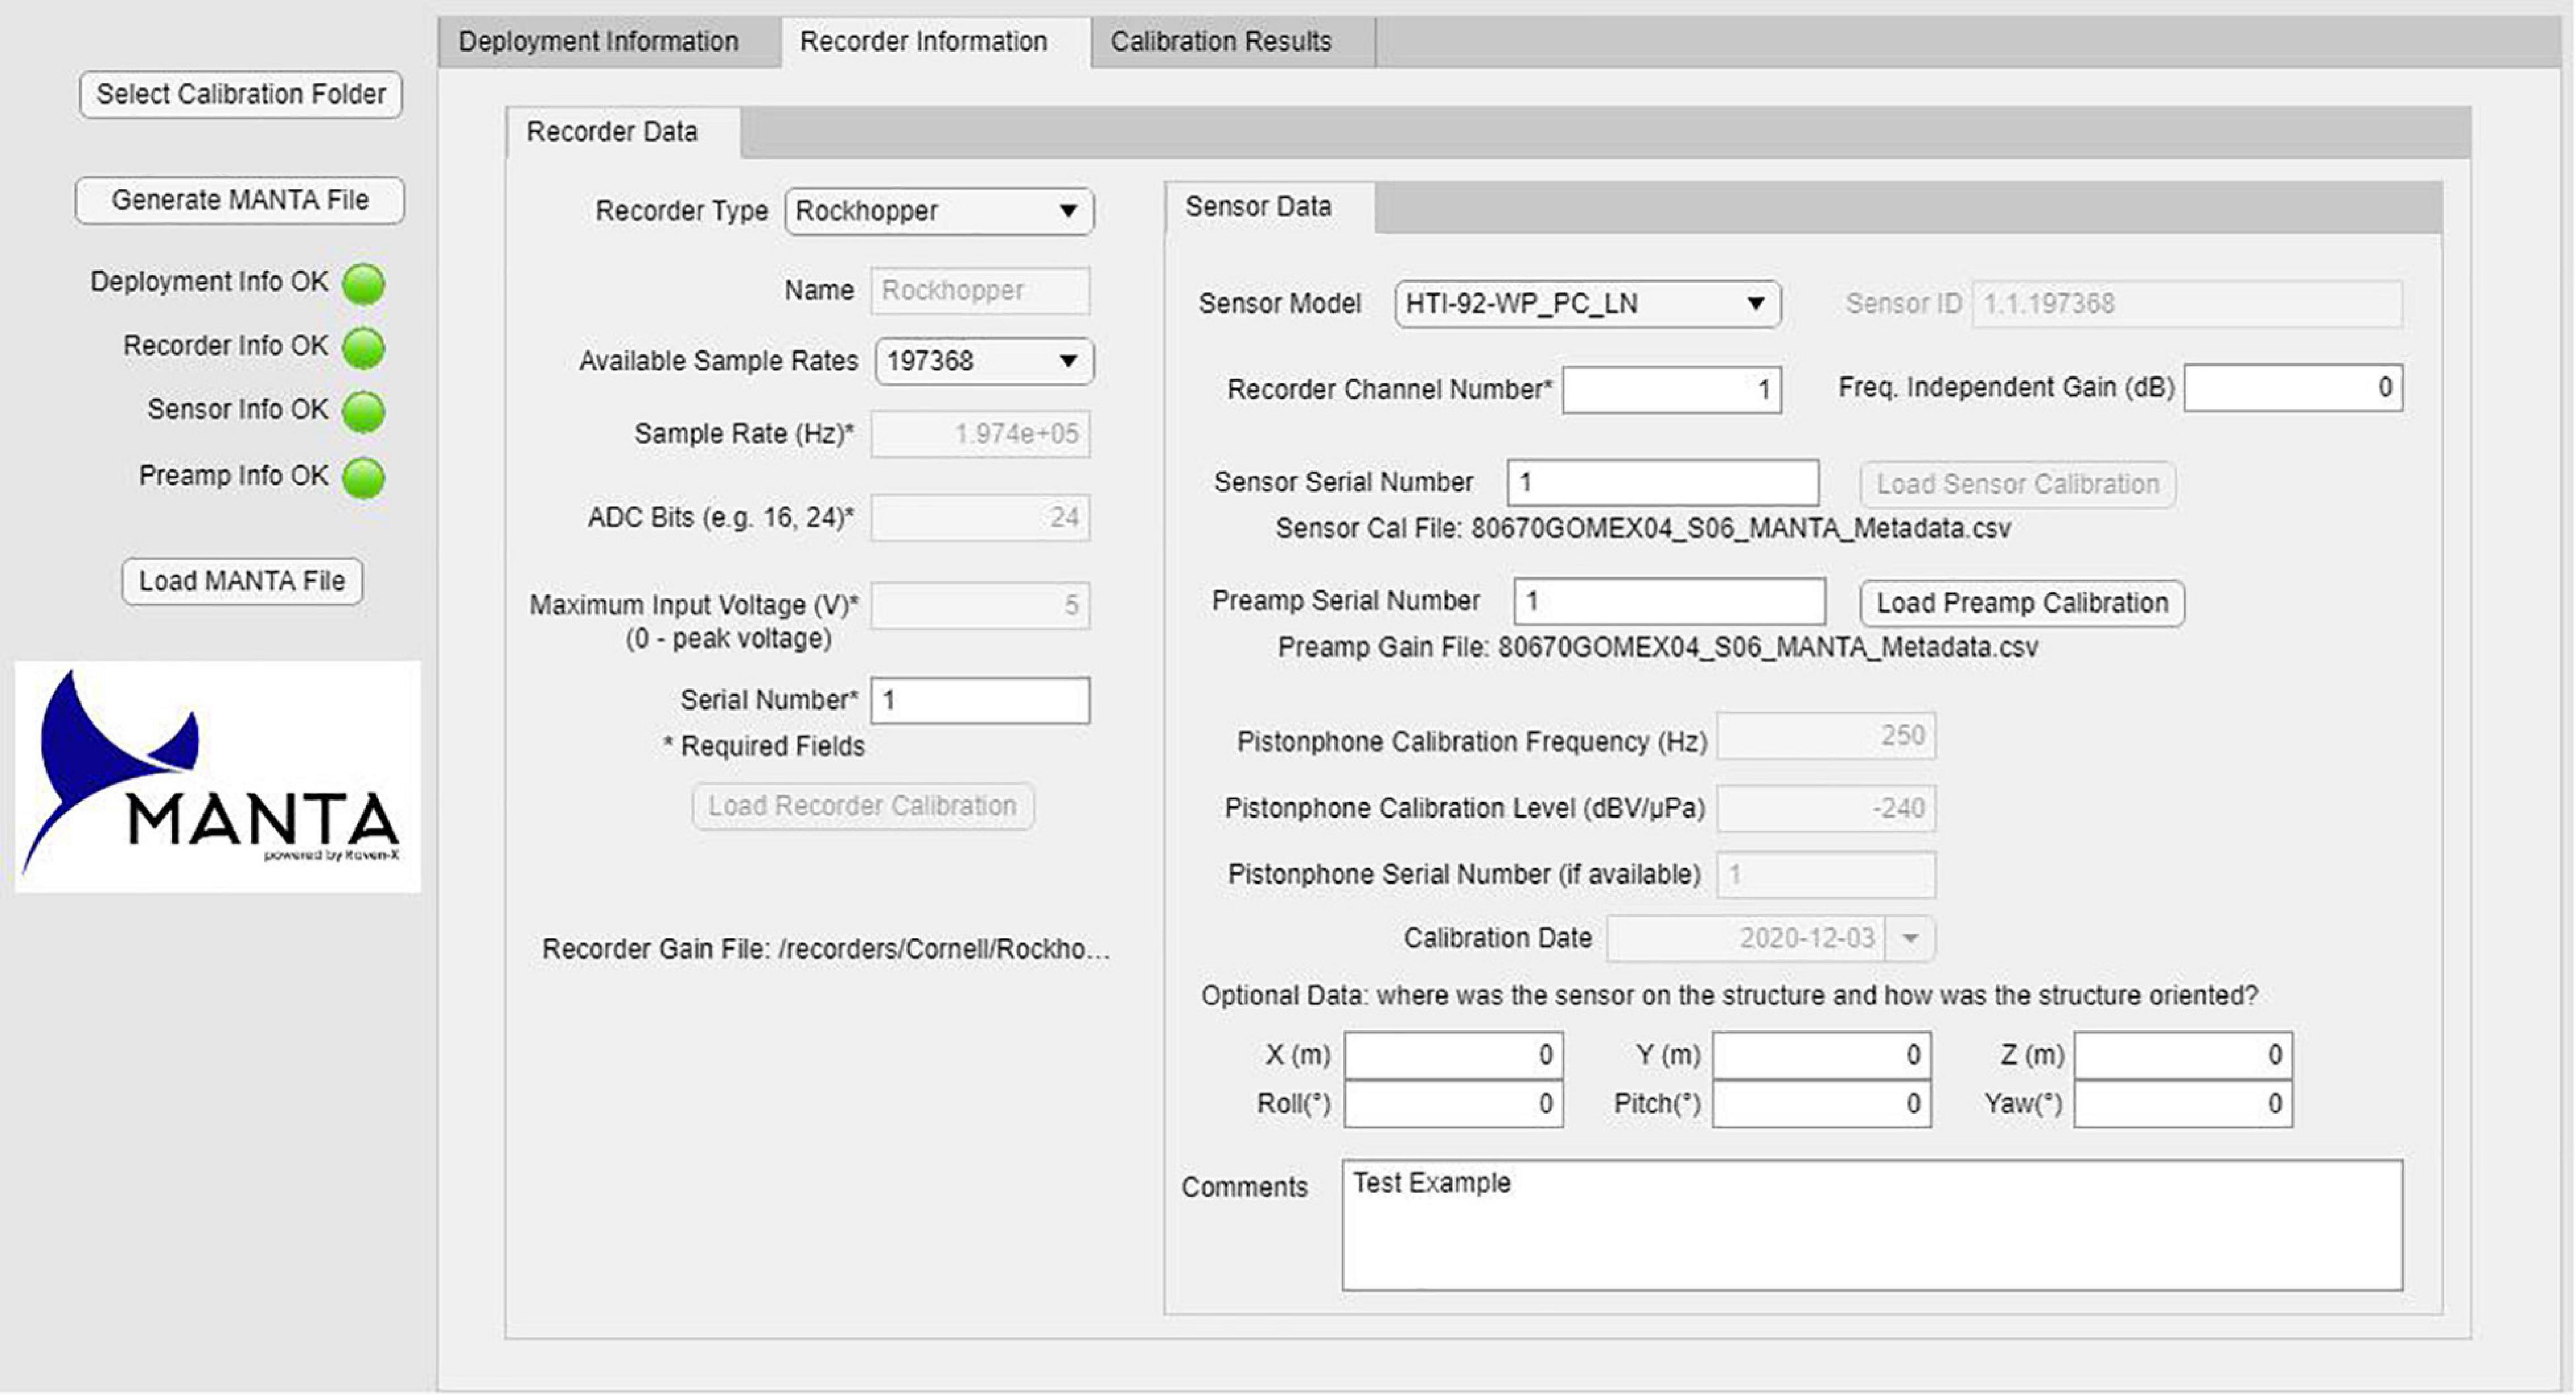
Figure 2. MANTA Metadata App GUI for recorder information. When the recorder and sensor information is fully entered and correct, the Recorder and Sensor Info OK buttons on the left side bar turn green. The drop-down menus for Recorder Type and Sensor Model allows a user to select from a variety of commonly used commercial recorders/sensors or enter details for a custom system.
To transform a digital audio recording from its binary code back into values of micro-Pascals (μPa) or Pascals (Pa) that were measured requires knowledge of the system employed to make the recordings. Systems normally include the sensor (hydrophone or microphone), different stages of preamplification (or gain), and an analog-to-digital converter (ADC). The ADC in turn has numerous parameters that affect the digitized signal including anti-aliasing filters, the maximum input voltage, the ADC bit depth, and the sampling rate. Many of these components or parameters have a frequency dependence that must be compensated when transforming the digital audio into underwater sound levels in dB units.
The MANTA Metadata App provides a user interface that gathers this information and generates a structured information file that provides the calibration information to the MANTA Data Mining App (Figure 3). The MANTA Metadata App output is a Microsoft Excel-compatible XLSX spreadsheet file with two worksheets – one for the deployment and basic calibration information, and one for the frequency-dependent calibration curves. The analog sensitivity is the sum of all of these values and is the curve used by the MANTA Data Mining App. Working in decibels (dB), the analog sensitivity (LA) in dBV/μPa is:
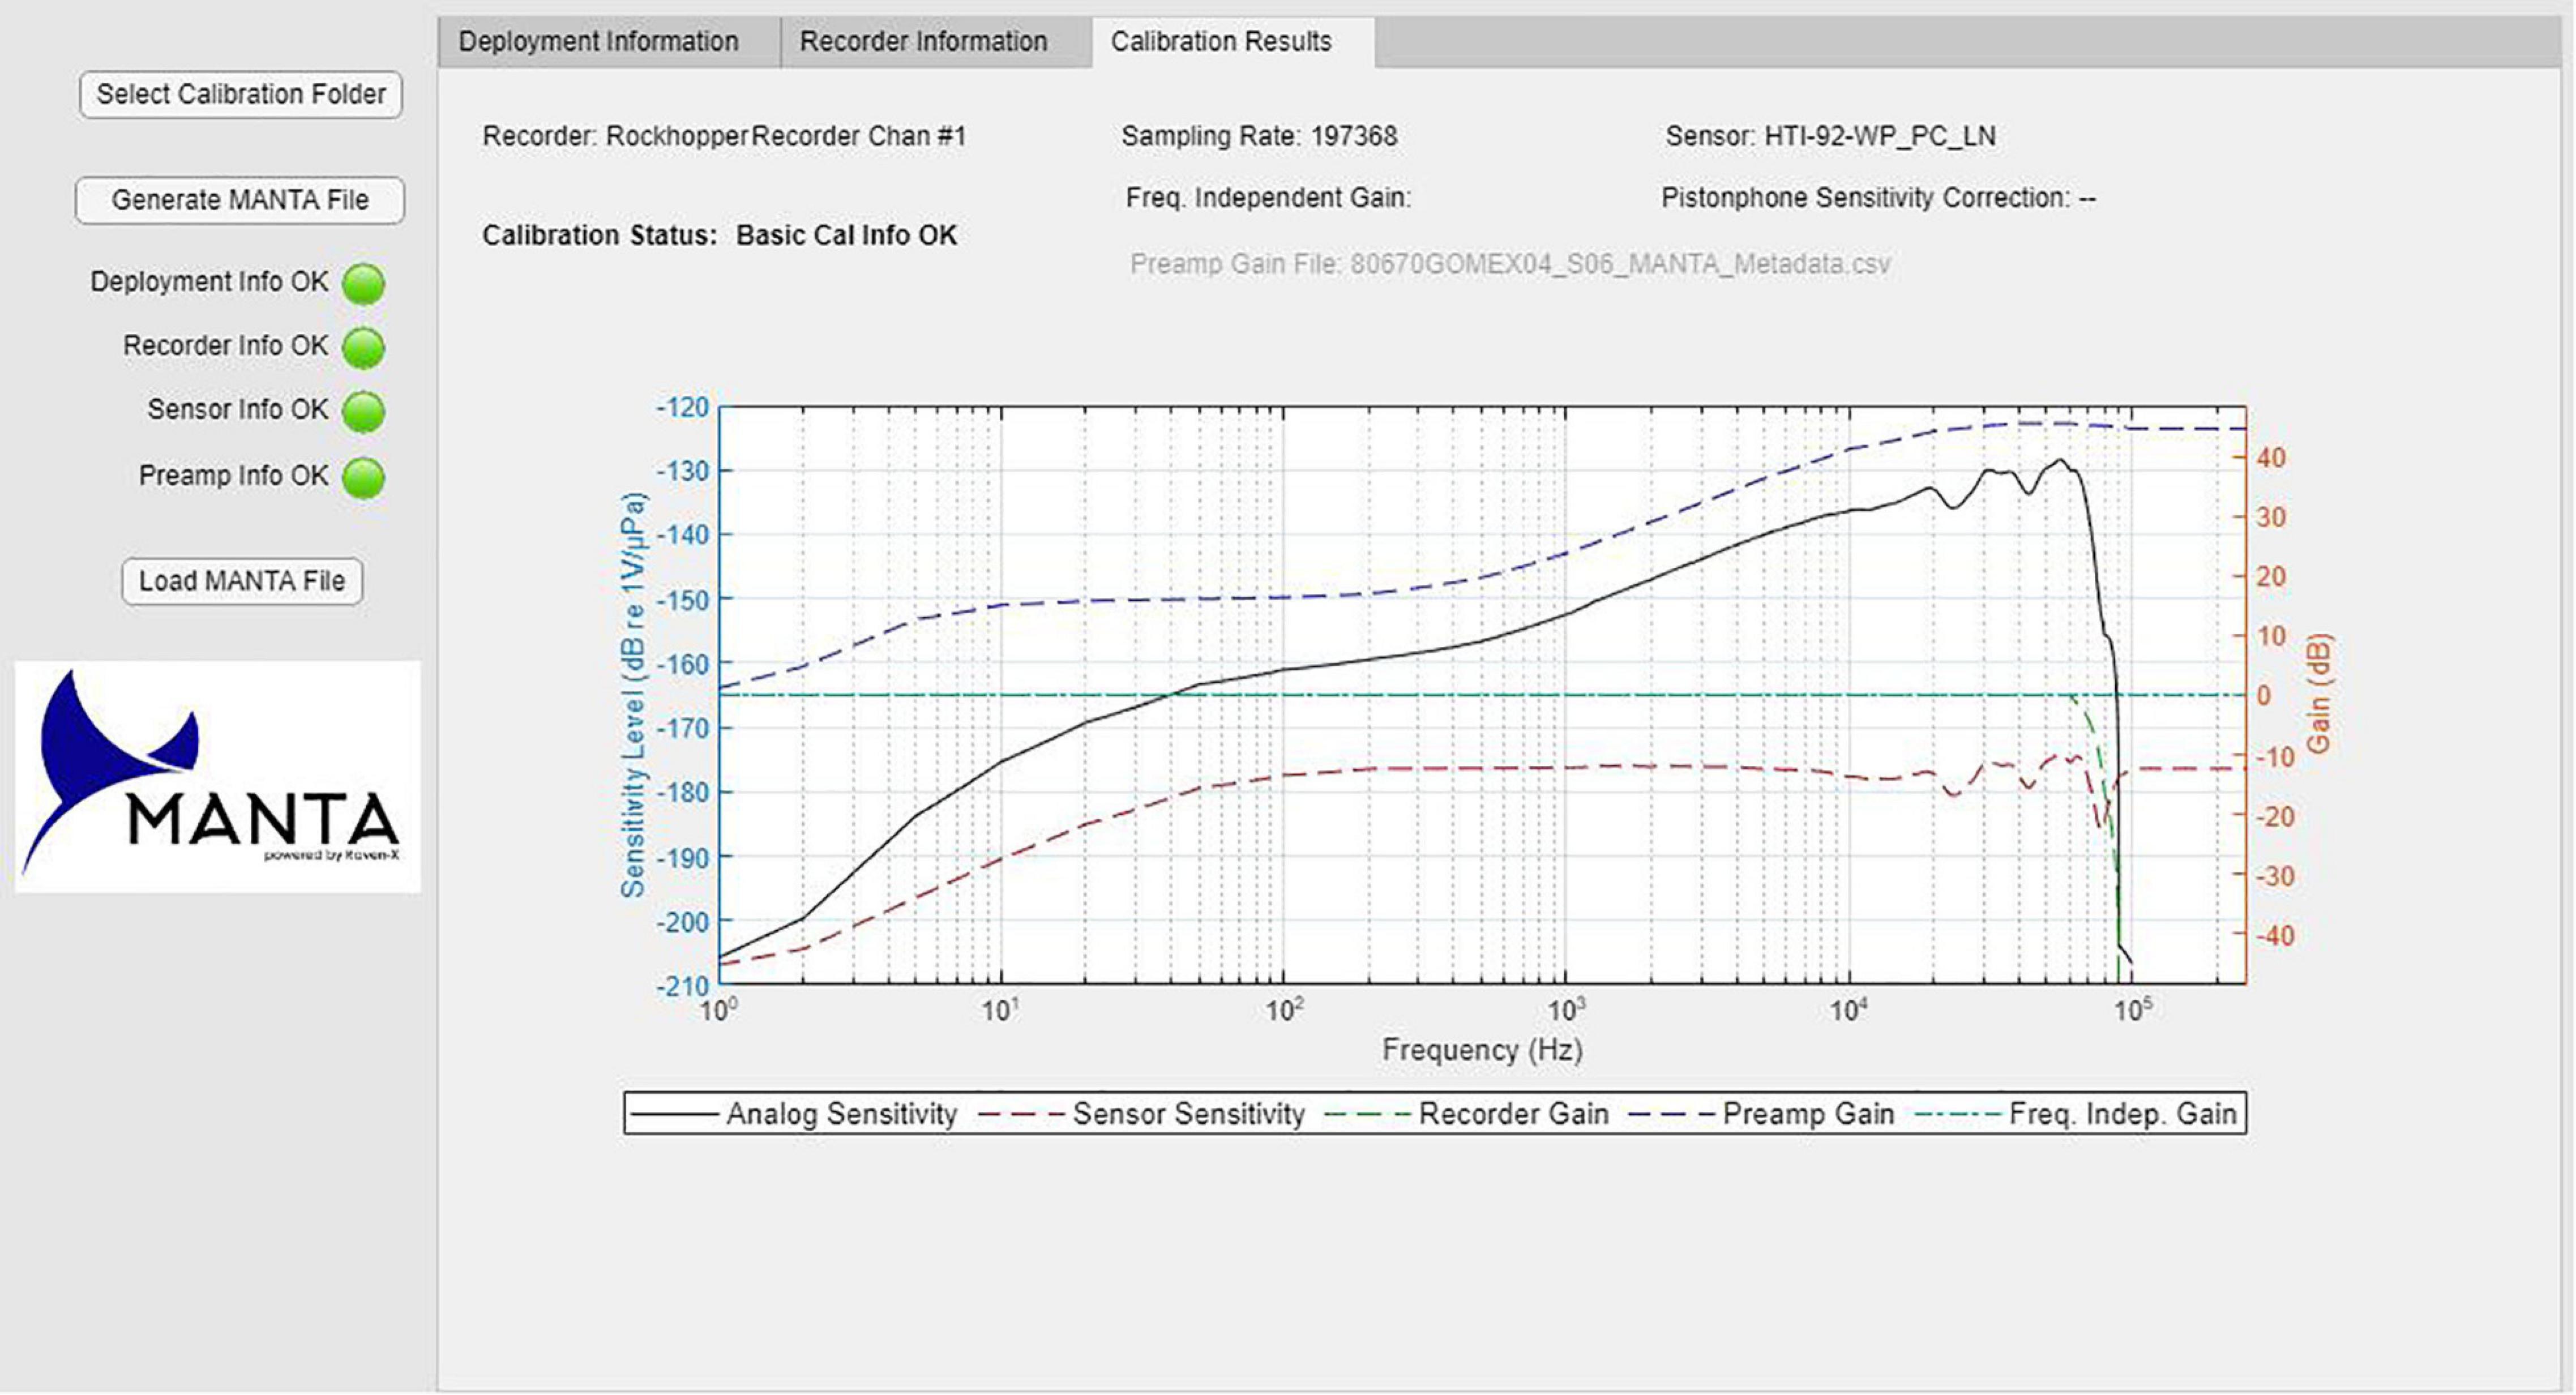
Figure 3. MANTA Metadata Calibration Results. When the deployment, recorder, sensor, and calibration/pre-amp information is fully entered and correct, the four buttons on the left side bar turn green. The calibration output figure is a combination of the user specified calibration including the analog sensitivity, sensor sensitivity, recorder gain, pre-amp gain, and frequency independent gain.
where the contributing values are:
(1) LS is the sensor sensitivity level, either a nominal value for the sensor model, or a specific sensitivity file that the user may load. Units for sensitivity level are dBV/μPa for hydrophones and dBV/Pa for microphones.
(2) GR is the frequency-dependent recorder gain in dB, which is either the nominal gain for the recorder (perhaps as a function of the sampling rate) or the specific gain file the user may load. For integrated recorder/sensor combinations, GR is zero, and the combined sensor sensitivity and gain are specified in LS.
(3) GPA is the frequency-dependent preamplifier gain in dB which the user may enter.
(4) GFI is the frequency-independent gain in dB that is entered by the user. This gain is commonly applied by a variable gain preamplifier at the front end of the analog to digital conversion system.
(5) GSFC is the gain correction in dB for the single frequency calibration. GSFC is the difference between the sensor sensitivity level (LS) and the level measured during a single frequency calibration, for instance, measured using a pistonphone calibrator.
The MANTA application uses the maximum input voltage, ADC bit depth, and analog sensitivity to convert the recorded digital data to the pressure spectral density [P(f)] in Pa/Hz1/2.
where D(f) is the 1-Hz spectrum of the digital data, Vmax is the maximum input voltage, and X = 120 for hydrophones (0 for microphones) to convert μPa to Pa. Note that the units of D(f) are bits/Hz1/2.
To simplify data input, the MANTA Metadata App provides nominal calibration information for common acoustic recorders, sensors, and preamplifiers. This information is contained in a file structure with two .xlsx index files [recorderTypes.xlsx (e.g., AMARs3, SoundTraps4, icListens5, Rockhoppers6) and sensorTypes.xlsx (e.g., HTI hydrophones7, GTI hydrophones8)] and four subfolders (hydrophones, microphones, preamps, and recorders). The index files contain metadata about the recorders and sensors as well as references to calibration files in the subfolders. The calibration files are .csv files with two columns, one for the calibration frequency and one for the sensitivity level. MANTA uses a piecewise cubic interpolation (see Fritsch and Carlson, 1980) to determine the sensitivity level between calibration frequencies, and simply replicates the calibration values for analysis frequencies above the maximum provided or below the minimum provided frequencies. The MANTA Metadata App allows the user to direct the app to the location of this file structure on their local computer or network drive. The MANTA Metadata App also allows users to provide their own calibration information for the recorder, sensors and preamps using the two-column .csv file format. Guidance on generating these files is provided in the Metadata App User Guide. Users can update the file structure and files manually at any time by selecting the MANTA Metadata App under the Tools tab of the MANTA Data Mining App and then selecting “Refresh (calibration information).”
Inputs to MANTA are in two forms: (1) acoustic data, and (2) metadata and calibration information. Acoustic data is accepted in the following formats - .WAV, .AIF, .AIFF, .AIFC, .FLAC, and .AU. The naming convention of the acoustic data files is critical to MANTA software and requires date and time information in the file name. The preferred time/date format in the filename is yyyymmdd_HHMMSS or yyyymmddTHHMMSS (HHMMSS.FFF is also acceptable for either one), with the letter “T” separating the date from the time. Times should be referenced to UTC rather than local time. The date/time information can be located at any position within the filename. To aid users in renaming their acoustic data files to be compatible with MANTA software, a file renaming tool (Sox-o-matic) is available from the K. Lisa Yang Center for Conservation Bioacoustics at the Cornell Lab of Ornithology:
Sox-o-matic Wiki: https://bitbucket.org/CLO-BRP/sox-o-matic/wiki/Home
Sox-o-matic Software download: https://www.birds.cornell.edu/ccb/sox-o-matic/
Within the MANTA Data Mining App, each set of analyses requires its own unique project Sound Folder. For systems with multiple channels, it is recommended a unique project Sound Folder be created for each channel. It is also recommended that the MANTA Metadata output file related to each analysis also be placed within the identified project Sound Folder. The MANTA Data Mining App requires three input parameters to direct the software to the audio data files (Sound Folder), Meta Data File, and Output that designates the folder for output products analysis reports. These are as follows:
Sound Folder: The Sound Folder is a unique project folder containing the sound files to be processed as described in the next section (MANTA Inputs). It is also recommended to place the MANTA Metadata output file in this folder. MANTA is capable of reading sound files from a local computer or a network drive.
Meta Data File: This input directs the software to the unique MANTA Metadata file to be used for the analysis.
Output Folder: This folder contains two performance files generated by the MANTA Data Mining app for all files processed from the Sound Folder input folder: the processing quality assurance/quality control file (performance.xlsx), and the effort report (SoundPlan_soundfolder.mat). For users without a licensed version of MATLAB, the .mat file can be read with freely available R functions (e.g., https://www.rdocumentation.org/packages/rmatio/versions/0.14.0/topics/read.mat). The information in the .mat file is also contained in the NetCDF file in the Output Folder; NetCDF is a standard data file format widely used in the earth sciences, including ocean observation systems worldwide.
The MantaMin data Output Folder contains two files and a data products folder. A calibration.png and filelist.txt file report the calibration parameters and files that were successfully processed in the data analysis. The data products folder contains a series of four daily products: (1) daily series of 1-min sound level averages in comma-separated value (.csv) format, (2), a daily long-term spectral average image in .png format (Figure 4), (3) a daily image with spectral probability density and sound level percentiles in .png format (Merchant et al., 2013) (Table 2 and Figure 5), and (4) daily.NetCDF that contains a compressed bundle of items 1–3. All files adhere to the unique file naming identifier for the data project followed by the sample rate and date.
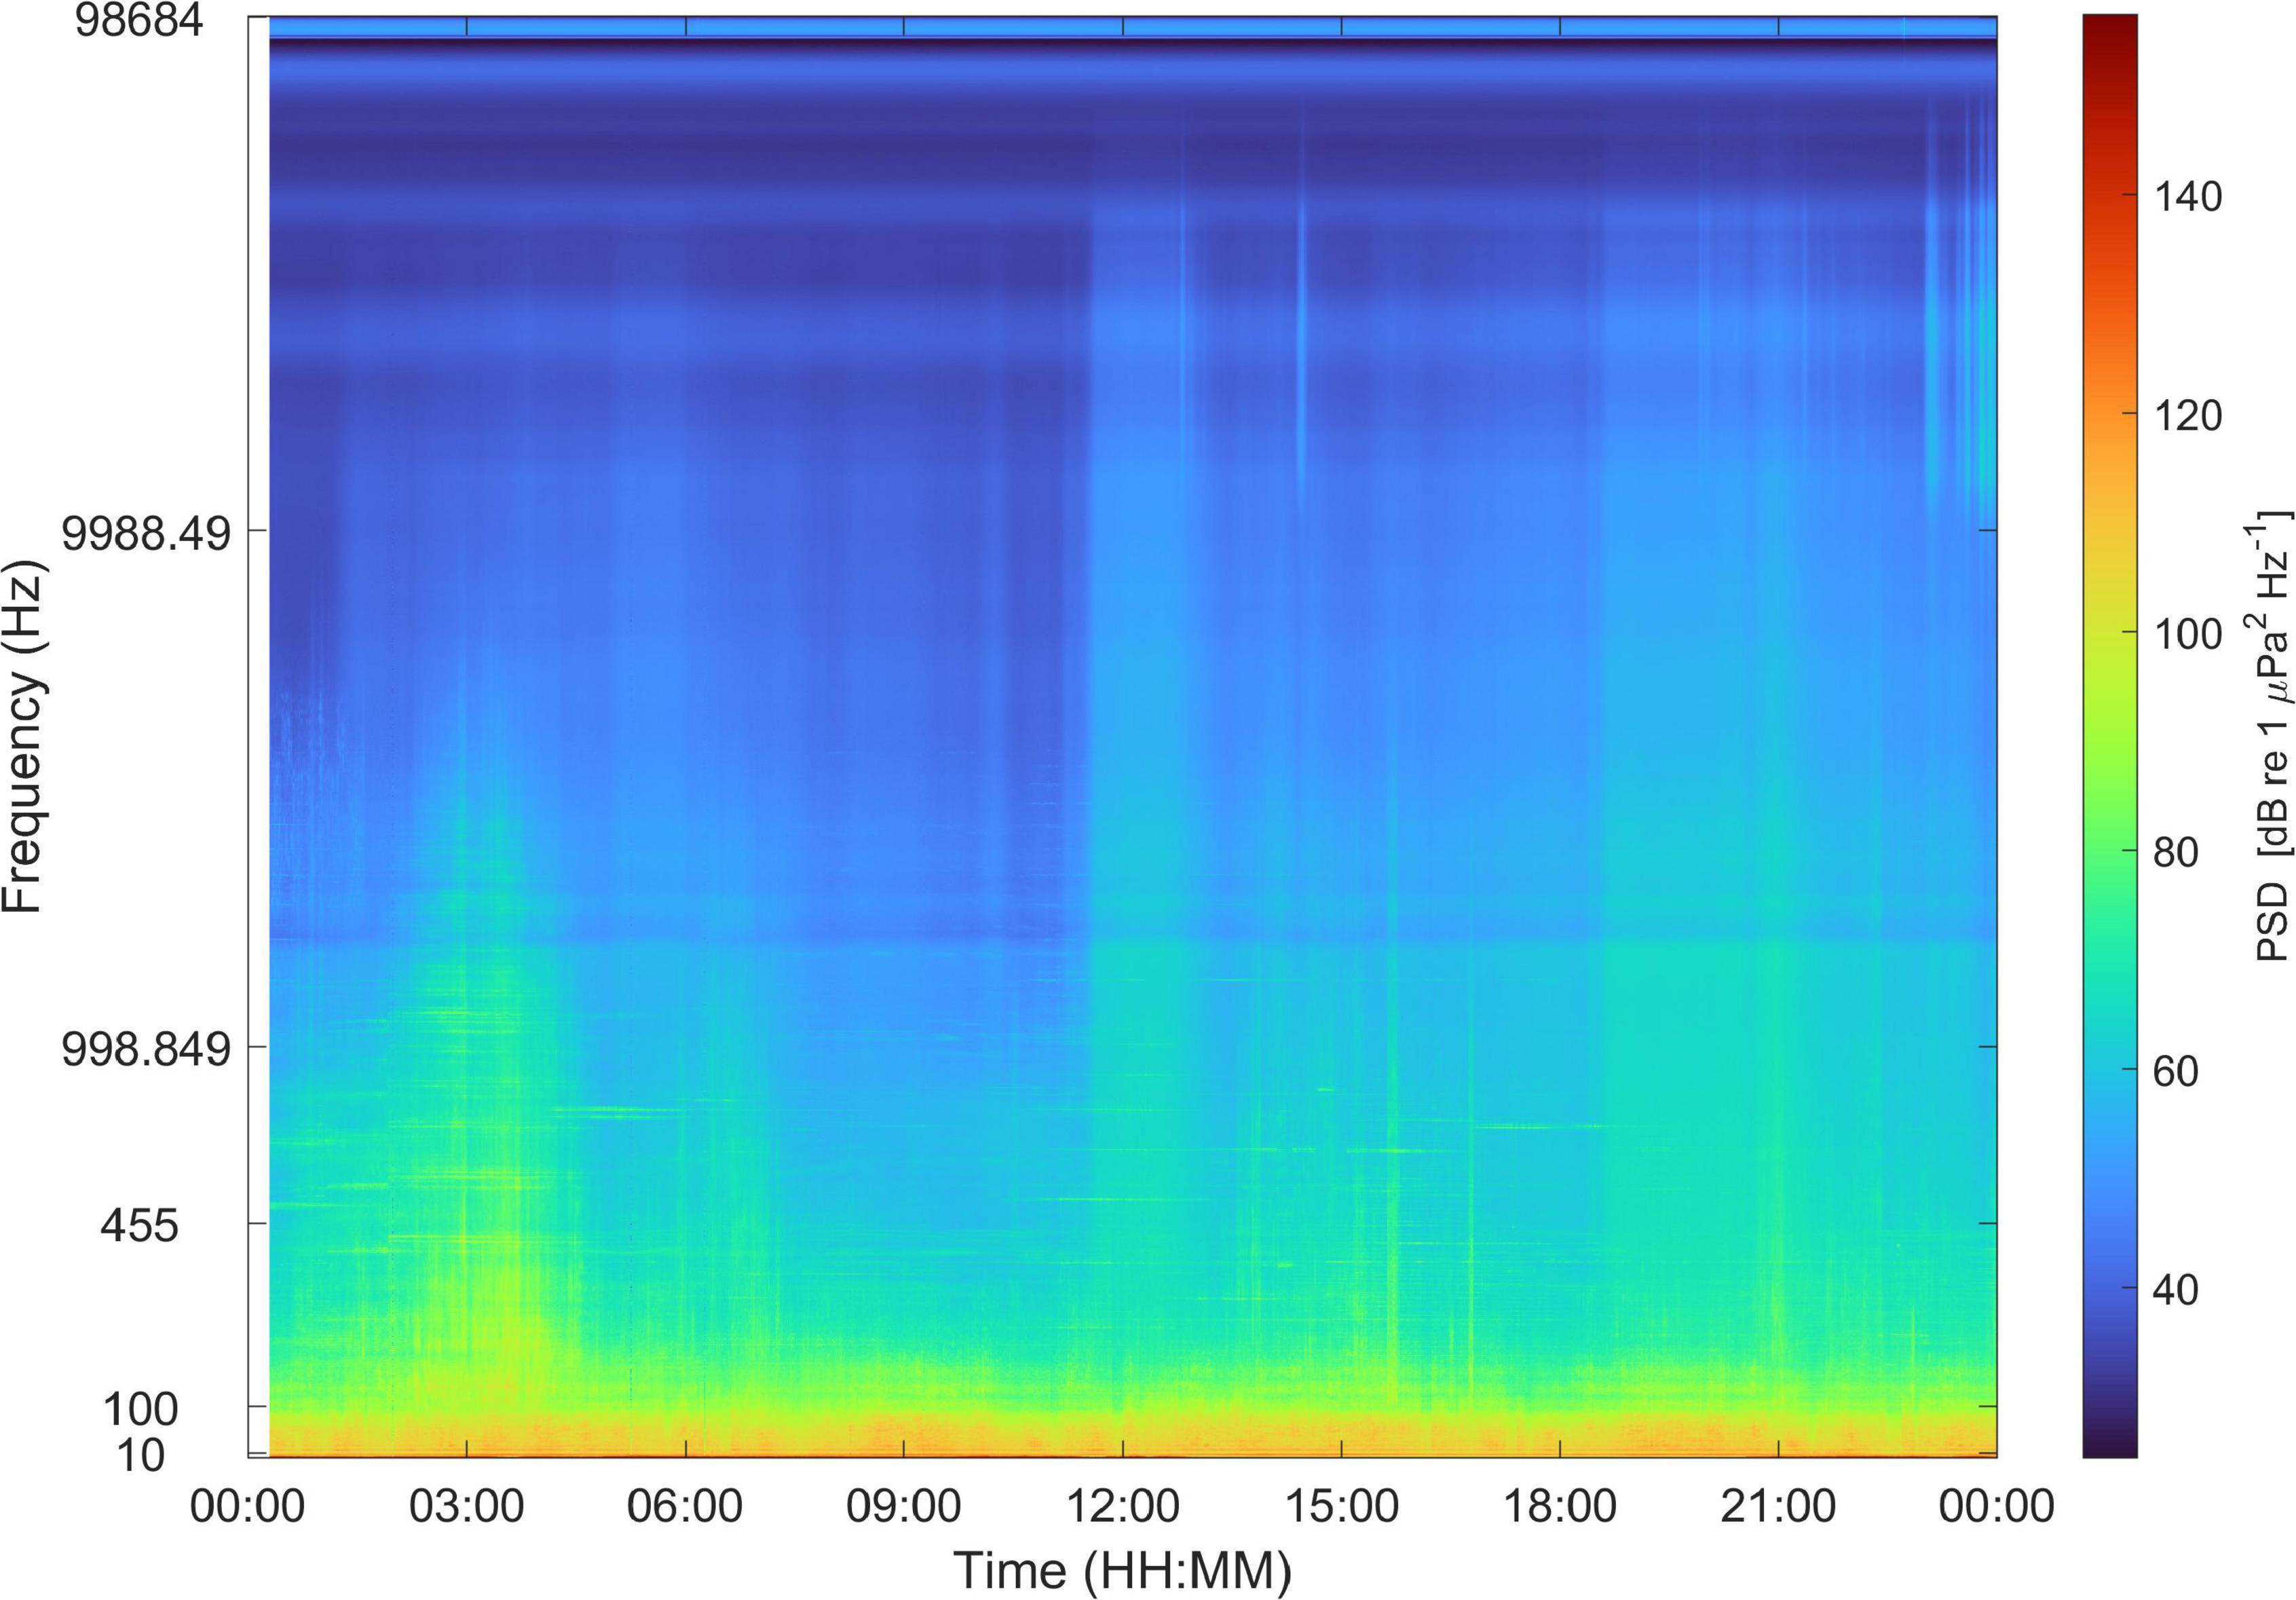
Figure 4. MANTA output image of daily long term spectral average based on 1-min millidecades for January 1, 2021. This data was collected by Cornell University in the northern Gulf of Mexico. Funding for this project was provided by the U.S. Department of the Interior, Bureau of Ocean Energy Management, Environmental Studies Program, Washington, DC, United States, under Contract Task Order Number M17PC00001_17PD00011 (contract managed by HDR, Inc).
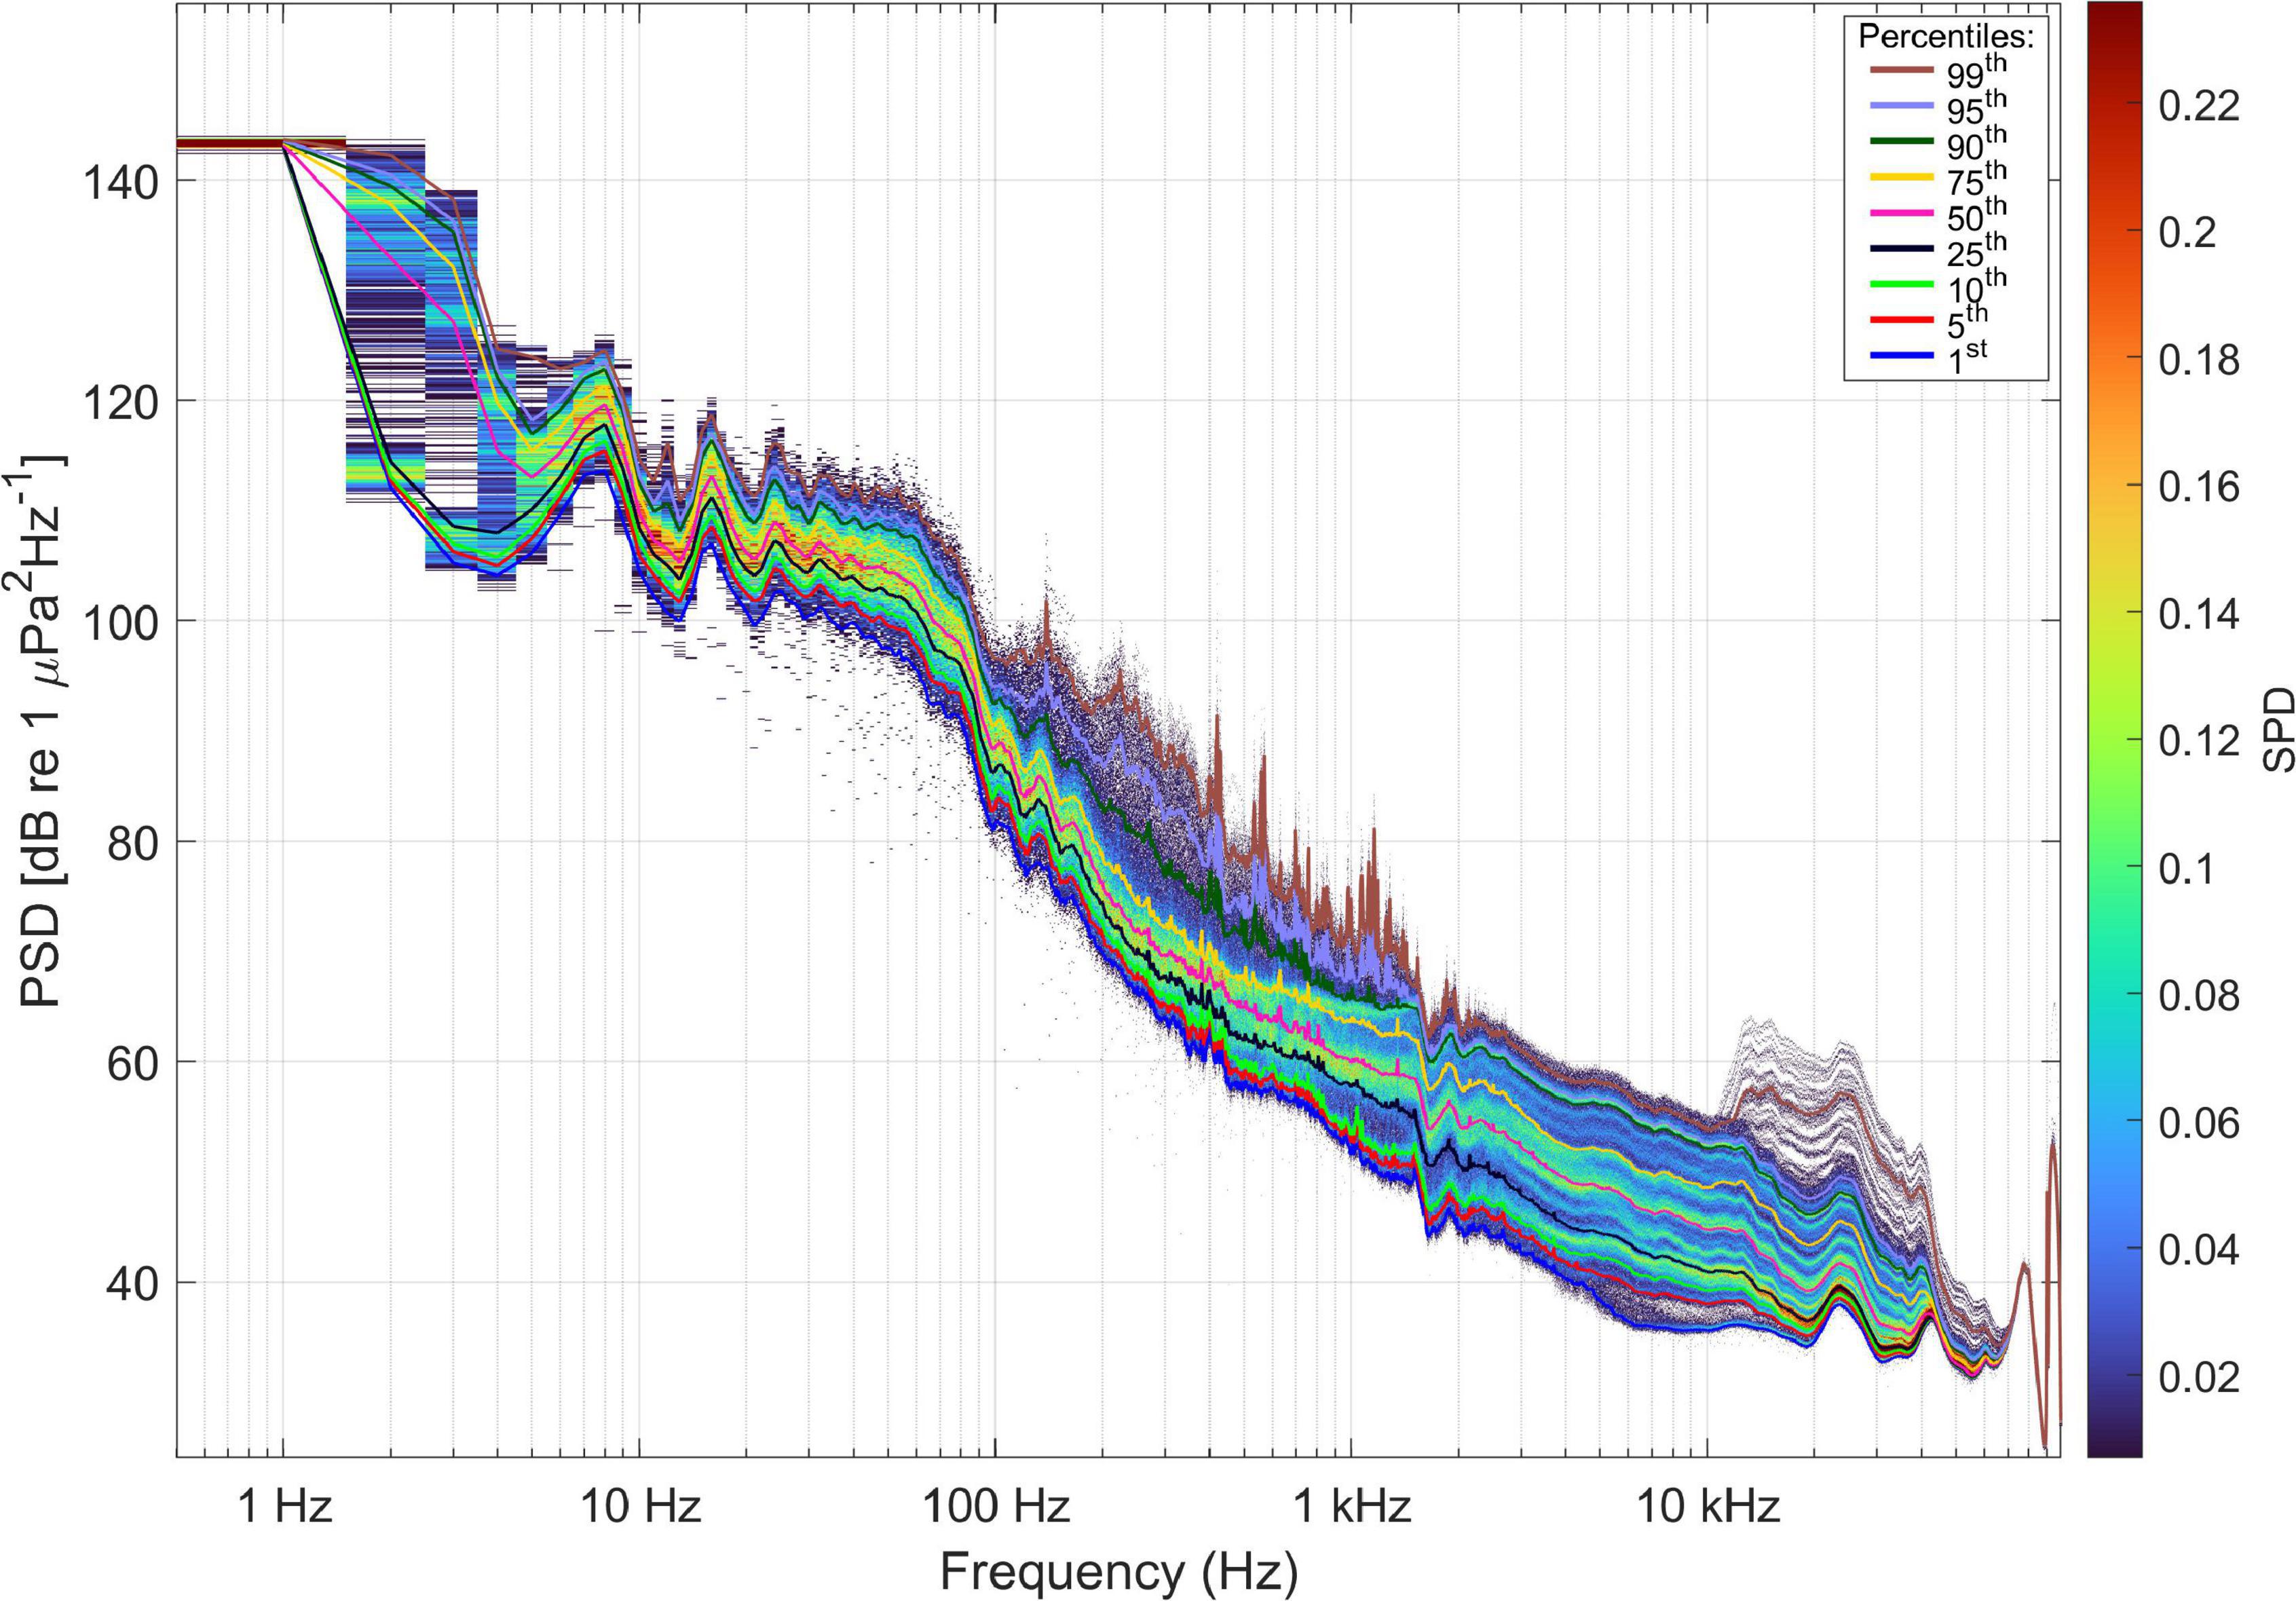
Figure 5. MANTA output image of daily spectral probability density plot with percentiles from January 1, 2020. This data was collected by Cornell University in the northern Gulf of Mexico. Funding for this project was provided by the U.S. Department of the Interior, Bureau of Ocean Energy Management, Environmental Studies Program, Washington, DC, United States, under Contract Task Order Number M17PC00001_17PD00011 (contract managed by HDR, Inc).
The Data Mining app processes sound data by calculating discrete Fourier transforms that result in 1 Hz resolution power spectral densities (spectra), then averages successive spectra over 1 min to achieve 1-Hz, 1-min resolution. These spectra at 1 Hz resolution are then converted to hybrid millidecade resolution (Martin et al., 2021). Millidecades are similar to decidecades except the decade frequency range is divided into 1000 logarithmically spaced bins instead of 10. Because millidecades from 1 to 10, 10 to 100, and 100 to 1000 Hz are generally smaller than 1 Hz wide, the format is a hybrid that uses 1 Hz bins from 1.0 Hz up until the millidecades are 1 Hz wide, and then millidecades above this frequency. A further minor adjustment is made so that the edges of the millidecades align with the edges of the standard decidecades (International Electrotechnical Commission (IEC), 2014), which results in a transition frequency of 435 Hz, below which bins are 1 Hz wide and above which bins are 1 millidecade wide.
Above the transition frequency, the 1 Hz bands within each millidecade band are summed to obtain millidecade band levels. The 1 Hz bands at the edges of the millidecade bands are proportionally divided between the two millidecade bands. For example, consider the millidecade bands with center frequencies of 890.22 and 892.28. These bands share an edge frequency of 891.25 Hz (which is also the edge frequency between decidecade bands). This edge frequency is contained in the 891 Hz 1-Hz band, which spans from 890.5 to 891.5 Hz. The 890.22 Hz millidecade band is assigned 75% of the power spectral density from the 891 Hz 1-Hz band, with the remaining 25% going to the 892.28 Hz millidecade band. MATLAB software to implement the proportional division of the 1 Hz bands is provided in the supplementary material to Martin et al. (2021).
The hybrid millidecade format is a compromise that provides a smaller data size than pure millidecades but retains sufficient spectral resolution for analyses, including detecting sources contributing to soundscapes and regulatory applications like computing weighted sound exposure levels. Hybrid millidecade files are compressed compared to the 1 Hz equivalent such that one research center could feasibly store data from hundreds of projects for sharing among researchers globally. The 1-min, hybrid millidecade spectra are the primary output of MANTA and are stored in .csv format with one file per day.
Four types of daily, single-channel data products are generated with the MANTA software as described above. Comprehensive images (long-term spectral averages, annual percentile plots, etc.) depicting datasets spanning 1 year or the full duration of a deployment (when the deployment is <1 year) can be generated from the series of daily .csv and NetCDF file. A final data processing performance figure is generated by the MANTA Data Mining app under the Job Status tab but not saved in the Output folder (Figure 6). This color-coded performance report indicates the successful processing of the dataset indicating any missing data or processing errors. Examples of processing errors would be corrupted audio files or exceeding the threshold of local computer processing resources.
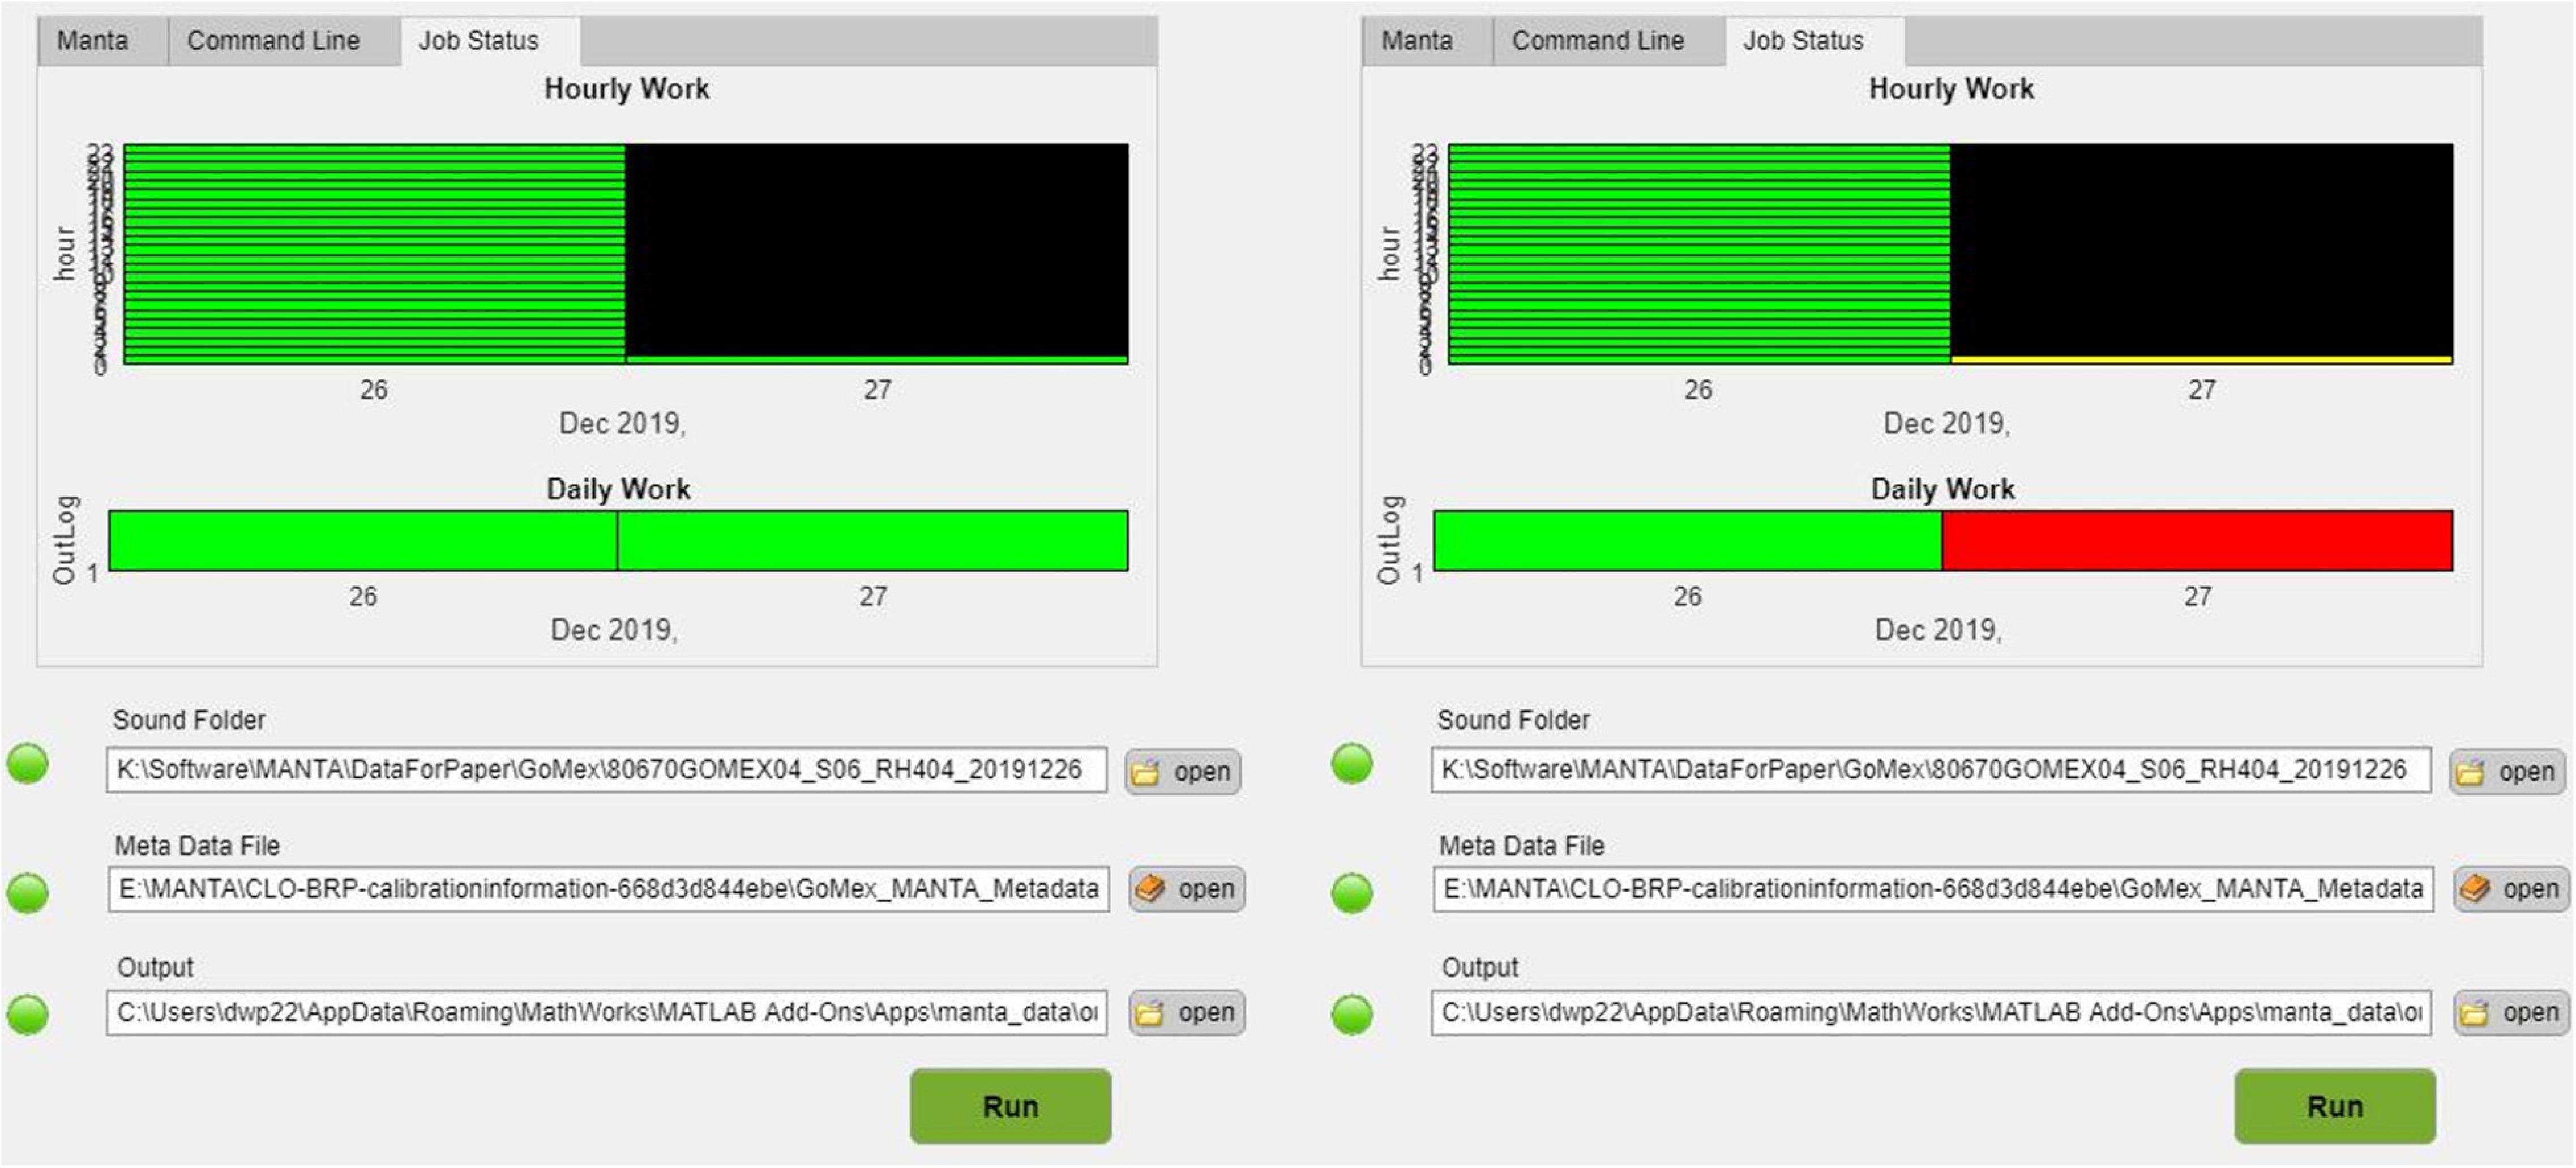
Figure 6. Color-coded performance report of the audio processing. (Left) Reports with all green indicate no missing data or processing errors upon completion of processing. Black sections indicate time periods with no data. (Right) Report of mid-processing job status. Yellow indicates data that is currently being processed, and red indicates data in the queue.
The MANTA software was initially launched online in April 2021. The most recent version, as well as older archived versions, can be downloaded from the link provided at https://bitbucket.org/CLO-BRP/manta-wiki/wiki/Home. User feedback has identified isolated coding bugs that have resulted in new versions of the MANTA software downloads that are tracked by date and version number. New commercially available sensors and recorders are expected to be developed over time, and recorder and sensor manufacturers are encouraged to provide product information to the MANTA team for incorporation into future versions of the MANTA Metadata App. The MANTA team continues to support programming improvements with the overall goal of a user-friendly software product that generates time series of sound pressure levels to support long-term analysis of patterns and trends.
The MANTA hybrid millidecade band processing provides the appropriate resolution for generating long-term spectral average images in support of visual comparison of soundscapes across time and geographical space (Martin et al., 2021). Hybrid millidecade band processing was adopted because it provides data products of a tractable size for exchanging, transferring, and archiving sound pressure level products between different researchers and programs. The MANTA vision is that standardized data products will ultimately enhance the value of the individual datasets by streamlining and inspiring larger region and global comparisons. The hybrid millidecade band processing is not likely adequate for detailed analysis of specific signals contained in the audio files, so raw data files will be necessary for detailed source characteristic studies.
The MANTA development team recognized the value of past, present, and future datasets and designed software that will process all forms of historical, pre-existing datasets, provided that the required calibration, metadata, and file formats are adhered to. Users of MANTA are encouraged to make their outputs available to the Open Portal to Underwater Sound (OPUS) at the Alfred Wegener Institute (AWI) in Germany (Thomisch et al., 2021). OPUS will offer, inter alia, browsable multi-scale spectrogram displays of processed MANTA outputs, along with synchronized audio playback, to globally render acoustic recordings findable, accessible, interoperable and reusable (FAIR principles), catering to stakeholders ranging from artists to the marine industries. The OPUS team aims to be ready to receive external MANTA-processed data by the end of 2021.
Publicly available datasets were analyzed in this study. This data can be found here: https://bitbucket.org/CLO-BRP/manta-wiki/wiki/Home.
All authors listed have made a substantial, direct and intellectual contribution to the work, and approved it for publication.
MANTA was created through generous support from the Richard Lounsbery Foundation.
The authors declare that the research was conducted in the absence of any commercial or financial relationships that could be construed as a potential conflict of interest.
All claims expressed in this article are solely those of the authors and do not necessarily represent those of their affiliated organizations, or those of the publisher, the editors and the reviewers. Any product that may be evaluated in this article, or claim that may be made by its manufacturer, is not guaranteed or endorsed by the publisher.
We thank Jesse Ausubel (Rockefeller University) and the International Quiet Ocean Experiment (IQOE) Program for their motivation to take on this task and promote the final MANTA product through the IQOE website. We also thank John Zollweg for his contributions to the Raven-X software.
Ainslie, M. A., Miksis-Olds, J. L., Martin, B., Heaney, K., de Jong, C. A. F., von Benda-Beckmann, A. M., et al. (2018). Underwater Soundscape and Modeling Metadata Standard. Version 1.0. Canada: JASCO Applied Sciences.
Boyd, I. L., Frisk, G., Urban, E., Tyack, P., Ausubel, J., Seeyave, S., et al. (2011). An International Quiet Ocean Experiment. Oceanography 24, 174- -181.
Caruso, F., Dong, L., Lin, M., Liu, M., Gong, Z., Xu, W., et al. (2020). Monitoring of a nearshore small dolphin species using passive acoustic platforms and supervised machine learning techniques. Front. Mar. Sci. 7:267. doi: 10.3389/fmars.2020.00267
Consortium for Ocean Leadership (COL). (2018). Report of the Workshop on Recommendations Related to Passive Ocean Acoustic Data Standards. Available online at: https://oceanleadership.org/wp-content/uploads/2018/10/Ocean-Sound-Workshop-Report.pdf (Accessed April 29, 2021).
Duarte, C. M., Chapuis, L., Collin, S. P., Costa, D. P., Devassy, R. P., Eguiluz, V. M., et al. (2021). The soundscape of the Anthropocene ocean. Science 371: 6529.
Dugan, P. J., Klinck, H., Zollweg, J. A., and Clark, C. W. (2015). “Data mining sound archives: a new scalable algorithm for parallel-distributing processing”, in 2015 IEEE International Conference on Data Mining Workshop (ICDMW) (Piscataway:IEEE) 768–772.
Dugan, P., Zollweg, J., Popescu, M., Risch, D., Glotin, H., LeCun, Y., et al. (2014). “High Performance Computer Acoustic Data Accelerator: A New System for Exploring Marine Mammal Acoustics for Big Data Applications,” in International Conference Machine Learning (Beijing: Workshop uLearnBio).
Frisk, G. V. (2012). Noisenomics: the relationship between ambient noise levels in the ocean andglobal economic trends. Sci. Rep0 2:437.
Fritsch, F. N., and Carlson, R. E. (1980). Monotone Piecewise Cubic Interpolation. SIAM J. Numer. Anal. 17, 238–246. doi: 10.1137/0717021
Gibb, R., Browning, E., Glover-Kapfer, P., and Jones, K. E. (2019). Emerging opportunities and challenges for passive acoustics in ecological assessment and monitoring. Methods Ecol. Evol. 10, 169–185. doi: 10.1111/2041-210x.13101
Haralabus, G., Zampolli, M., Grenard, P., Prior, M., and Pautet, L. (2017). “Underwater acoustics in nuclear-test-ban treaty monitoring,” in Applied Underwater Acoustics: Leif Bjørnø, eds T. Neighbors and D. Bradley (Chicago: Elsevier Science).
Howe, B. M., Miksis-Olds, J. L., Rehm, E., Sagen, H., Worcester, P. F., and Haralabus, G. (2019). Observing the oceans Acoustically. Front. Mar. Sci. 6:426. doi: 10.3389/fmars.2019.00426
International Electrotechnical Commission (IEC) (2014). IEC 61260-1:2014 Electroacoustics - Octave-band and fractional-octave-band filters - Part 1: Specifications. Geneva: International Electrotechnical Commission.
International Organization for Standardization (ISO) (2017). Underwater acoustics—Terminology. ISO/DIS 18405.2:2017. Available online at: https://www.iso.org/standard/62406.html (Accessed April 28, 2021)
Martin, S. B., Gaudet, B. J., Klinck, H., Dugan, P. J., Miksis-Olds, J. L., Mellinger, D. K., et al. (2021). Hybrid millidecade spectra: a practical format for exchange of long-term ambient sound data. JASA Express Lett. 1:011203. doi: 10.1121/10.0003324
Mellinger, D. K., Stafford, K. M., Moore, S. E., Dziak, R. P., and Matsumoto, H. (2007). An overview of fixed passive acoustic observation methods for cetaceans. Oceanography 20, 36–45. doi: 10.5670/oceanog.2007.03
Merchant, N. D., Barton, T. R., Thompson, P. M., Pirotta, E., Dakin, D. T., and Dorocicz, J. (2013). Spectral probability density as a tool for marine ambient noise analysis. Proc. Meet. Acoust 19:010049. doi: 10.1121/1.4799210
Merchant, N., Farcas, A., and Powell, C. (2018). Acoustic metric specification. Report of the EU INTERREG Joint Monitoring Programme for Ambient Noise North Sea (JOMOPANS). Available online at: https://northsearegion.eu/jomopans/output-library/ (Accessed June 21, 2020).
Ocean Sound EOV (2018). Ocean Sound EOV. Available online at: http://www.goosocean.org/index.php? option=com_oe&task=viewDocumentRecord&docID=22567 (Accessed July11, 2019)
Shiu, Y., Palmer, K. J., Roch, M. A., Fleishman, E., Liu, X., Nosal, E. M., et al. (2020). Deep neural networks for automated detection of marine mammal species. Sci. Rep. 10:607.
Sousa-Lima, R. S., Norris, T. F., Oswald, J. N., and Fernandes, D. P. (2013). A review and inventory of fixed autonomous recorders for passive acoustic monitoring of marine mammals. Aquat. Mamm. 39, 23–53. doi: 10.1578/am.39.1.2013.23
Tasker, M.L., Amundin, M., Andre, M., Hawkins, A., Lang, W., Merck, T., et al. (2010). Marine Strategy Framework Directive: Task Group 11 Underwater noise and other forms of energy. Ispra: Joint Research Centre
Thomisch, K., Flau, M., Heß, R., Traumueller, A., and Boebel, O. (2021). “OPUS - An Open Portal to Underwater Soundscapes to explore and study sound in the global ocean,” in 5th Data Science Symposium, virtual meeting.
Thomson, D. J. M., and Barclay, D. R. (2020). Real-time observations of the impact of COVID-19 on underwater noise. J. Acoust. Soc. Am. 147, 390–393. doi: 10.1121/10.0001271
Tyack, P. L., Miksis-Olds, J., Ausubel, J., and Urban, E. R. Jr. (2021). Measuring ambient ocean sound during the COVID-19 pandemic. Eos 102:155447. doi: 10.1029/2021EO155447
Keywords: ocean sound, ambient sound, soundscape, noise, standards
Citation: Miksis-Olds JL, Dugan PJ, Martin SB, Klinck H, Mellinger DK, Mann DA, Ponirakis DW and Boebel O (2021) Ocean Sound Analysis Software for Making Ambient Noise Trends Accessible (MANTA). Front. Mar. Sci. 8:703650. doi: 10.3389/fmars.2021.703650
Received: 30 April 2021; Accepted: 26 July 2021;
Published: 19 August 2021.
Edited by:
Ana Sirovic, Texas A&M University at Galveston, United StatesReviewed by:
Tetyana Margolina, Naval Postgraduate School, United StatesCopyright © 2021 Miksis-Olds, Dugan, Martin, Klinck, Mellinger, Mann, Ponirakis and Boebel. This is an open-access article distributed under the terms of the Creative Commons Attribution License (CC BY). The use, distribution or reproduction in other forums is permitted, provided the original author(s) and the copyright owner(s) are credited and that the original publication in this journal is cited, in accordance with accepted academic practice. No use, distribution or reproduction is permitted which does not comply with these terms.
*Correspondence: Jennifer L. Miksis-Olds, ai5taWtzaXNvbGRzQHVuaC5lZHU=
Disclaimer: All claims expressed in this article are solely those of the authors and do not necessarily represent those of their affiliated organizations, or those of the publisher, the editors and the reviewers. Any product that may be evaluated in this article or claim that may be made by its manufacturer is not guaranteed or endorsed by the publisher.
Research integrity at Frontiers

Learn more about the work of our research integrity team to safeguard the quality of each article we publish.