 Mitsuyo Miyagawa
 Momoko Ichinokawa
 Seiji Ohshimo
95% of researchers rate our articles as excellent or good
Learn more about the work of our research integrity team to safeguard the quality of each article we publish.
Find out more
GENERAL COMMENTARY article
Front. Mar. Sci. , 16 July 2021
Sec. Marine Fisheries, Aquaculture and Living Resources
Volume 8 - 2021 | https://doi.org/10.3389/fmars.2021.703039
by Wang, Y., Liang, C., Wang, Y., Xian, W., and Palomares, M. L. (2020). Front. Mar. Sci. 7:640. doi: 10.3389/fmars.2020.00640
Although East Asia is a major contributor to worldwide marine food production, the stock status of fisheries resources in the region is not well-known partly because of limited data availability for stock assessment. To fill this gap, articles in the Research Topic “The Status of Marine Fisheries in East Asia” (hereafter called “SMFEA”) applied several data-limited stock assessment methods such as CMSY and Bayesian state-space implementation of the Schaefer model (BSM) (Froese et al., 2017), to the fisheries resources in East Asia. These methods facilitate stock status estimation relevant to the maximum sustainable yield (MSY) even when sufficient data are not available for the conventional stock assessment models. Such a comprehensive review is a valuable trial for East Asian countries, as the beginning toward modern fisheries stock assessment and management. We also agree with one of the main conclusions drawn by Wang et al. (2020b) (hereafter “WA2020”), emphasizing the importance of close cooperation among East Asian countries for stock assessment and management.
However, the reliability of stock status estimation based on such data-limited methods is a topic of ongoing discussion (Dowling et al., 2019). We are concerned that the articles in SMFEA do not sufficiently discuss the potential biases and uncertainties of data-limited methods. Moreover, for some stocks analyzed, WA2020 appeared to use relative abundance index data arbitrarily chosen from the referred literature without any explanation. In this commentary, we show the inappropriate data use by WA2020, which resulted in misunderstanding historical trends of the stocks, and discuss the potential bias of data-limited methods.
WA2020 analyzed nine stocks using BSM and three stocks using CMSY. All data used by WA2020 were obtained from the annual stock assessment report compiled by the Fisheries Agency of Japan and the Japan Fisheries Research and Education Agency. Among the nine stocks analyzed by BSM, only part of the entire time series of relative abundance data was used for seven stocks (Sardinops melanostictus, Trachurus japonicus, Todarodes pacificus, Scomber australasicus, Etrumeus micropus, Engraulis japonicus, and Scomberomorus niphonius) without indicating the reason. For example, 1973–2017 data is available for T. japonicus in the referred Japanese report (Yoda et al., 2019), whereas WA2020 only used the 1996–2017 data. The arbitral data usage resulted in misunderstanding of historical trends of the six stocks as shown in Figure 1. Correct understanding of fishery history is important particularly when setting empirical management reference points and exploring effective management actions on the stock because we can learn from the past to see how the population responded to past management actions (Hilborn et al., 2020; Melnychuk et al., 2021). The naïve exclusion of past data has the potential risk to the future management failure through misunderstanding fishery history of the stocks.
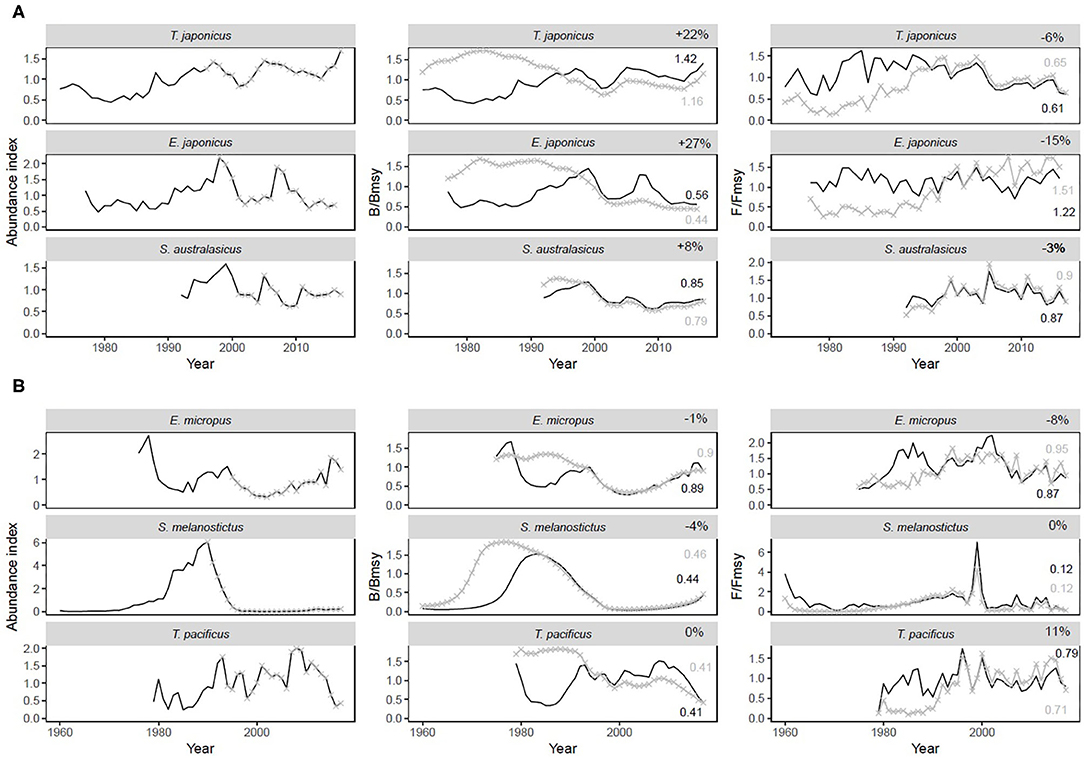
Figure 1. Comparison of abundance indices and estimates of B/Bmsy and F/Fmsy for T. japonicus, E. japonicus, S. australasicus, E. micropus, S. melanostictus, and T. pacificus. Wang et al. (2020b) used only part of the available abundance indices (shown in gray cross marks in the figures on the left) from the referred literature (shown by the black solid line in the figures on the left). The gray crossed lines show the estimate of B/Bmsy (figures in the middle) and F/Fmsy (figures on the right) by Wang et al. (2020b) and the black solid lines show the estimates when the same method was applied to all available abundance indices. The numbers shown are the estimates of B/Bmsy and F/Fmsy for the most recent year available. The percentage shown are the percentage difference between Wang et al. (2020b) and this study using extended timeseries. (A) shows stocks which the selection of abundance indices leads to misunderstanding of current stock status, and (B) shows stocks which the selection of abundance indices does not affect the current stock status estimation, but still leads to different view of past trajectories. We found such insufficient use of abundance indices in seven stocks by Wang et al. (2020b), but could re-produce the same results for only six stocks as shown above.
In addition, the elimination of past relative abundance data led to changes of estimates of the recent stock status (B/Bmsy), and the changes resulted in misclassification of current stock status of the three stocks shown in Figure 1A. Although WA2020 did not specify the definition of fish stock status, we presumed that the fish stock status is defined as in Liang et al. (2020). Liang et al. (2020) defines stock status based on B/Bmsy as follows: “healthy” if B/Bmsy≧1, “slightly overfished” if 0.8≦B/Bmsy <1, “overfished” if 0.5≦B/Bmsy <0.8, “grossly overfished” if 0.2≦B/Bmsy <0.5 and “collapsed” if B/Bmsy <0.2. E. japonicus was evaluated as grossly overfished (B/Bmsy = 0.44) in WA2020, but overfished (0.56) when using the full time series. S. australasicus was evaluated as overfished (B/Bmsy = 0.79) in WA2020, but slightly overfished (0.85) in the revised analysis. Also, although the category has not been changed, 22% underestimation of current stock biomass status in T. japonicus would be large enough to mislead management implication on the stock. In general, using the extended timeseries leads to positive increase in current stock status and a decrease in exploitation rate (F/Fmsy).
The “relative abundance data” in eight stocks used for the BSM by WA2020 are taken from the estimates of spawning biomass (SB) by an age-structured stock assessment model of Virtual Population Analysis (VPA) (Gulland, 1965) as shown in their Table 1. The abundance indices (i.e., SB) used by BSM could not be obtained without estimates from VPA. This means that the eight stocks are not actually in a data-limited situation, because these stocks have already been assessed using sufficient data (Fisheries Agency of Japan Fisheries Research Agency, 2020). It is thus misleading to regard these stocks as data-limited and applying data-limited methods to such stocks is of little value.
Further, WA2020 treated the total biomass estimated by VPA as “true values” to be compared with the estimates by BSM (Figure 3 of WA2020). We are concerned that such a comparison would overestimate the reliability of BSM, because BSM uses the “true” data (estimated as SB) from VPA estimates. If the purpose of WA2020 is to evaluate the reliability of estimated MSY reference points, the MSY reference points estimated by BSM without using the “true” data from VPA should be compared with those based on age-structured models, as described by Ichinokawa et al. (2017).
The authors of WA2020 state that “The CMSY and BSM method performed good overall in this study and presented reliable results…” However, as mentioned above, for the estimates produced using BSM, priors for relative abundance estimates and time series of abundance indices were taken from the SB calculated by VPA and so, the reliability of BSM performance must have been overestimated. Further, since the “true values” are not known for the 3 stocks to which CMSY was applied, it is difficult to judge whether the result of CMSY is reliable or not. However, there are extensive simulation studies (e.g., Pons et al., 2020) which gives valuable insights on the potential bias. Free et al. (2020) and Anderson et al. (2017) have reported that the B/Bmsy estimates produced using CMSY tend to be negatively biased and have an accuracy of 40–50%. In general, caution must be exercised when assessing the stock status using this method (Dowling et al., 2019). However, the papers in SMFEA, including those by Liang et al. (2020), Ren and Liu (2020), Wang et al. (2020a), Zhang et al. (2020), and WA2020, have all applied CMSY to assess the stock status, without discussing the potential bias. A discussion related to bias based on previous studies is thus necessary. Further, applying different methods, for instance, ensemble methods that have higher accuracy and less bias (Free et al., 2020), and conducting sensitivity runs on key assumptions is important to demonstrate the uncertainties associated with the obtained estimates.
All authors listed have made a substantial, direct and intellectual contribution to the work, and approved it for publication.
The authors declare that the research was conducted in the absence of any commercial or financial relationships that could be construed as a potential conflict of interest.
We would like to thank the reviewer and the editor for their constructive comments.
Anderson, S. C., Cooper, A. B., Jensen, O. P., Minto, C., Thorson, J. T., Walsh, J. C., et al. (2017). Improving estimates of population status and trend with superensemble models. Fish Fish 18, 732–741. doi: 10.1111/faf.12200
Dowling, N. A., Smith, A. D. M., Smith, D. C., Parma, A. M., Dichmont, C. M., Sainsbury, K., et al. (2019). Generic solutions for data-limited fishery assessments are not so simple. Fish Fish 20, 174–188. doi: 10.1111/faf.12329
Fisheries Agency of Japan Fisheries Research Agency (2020). Japan fisheries Research and Education Agency. Available online at: http://abchan.fra.go.jp/digests2018/index.html (accessed December 15, 2020).
Free, C. M., Jensen, O. P., Anderson, S. C., Gutierrez, N. L., Kleisner, K. M., Longo, C., et al. (2020). Blood from a stone: performance of catch-only methods in estimating stock biomass status. Fish. Res. 223:105452. doi: 10.1016/j.fishres.2019.105452
Froese, R., Demirel, N., Coro, G., Kleisner, K. M., and Winker, H. (2017). Estimating fisheries reference points from catch and resilience. Fish Fish 18, 506–526. doi: 10.1111/faf.12190
Gulland, J. A. (1965). “Estimation of mortality rates,” in Annex to Arctic Fisheries Working Group Report (meeting in Hamburg, January 1965). ICES, Doc. No. 3 (mimeographed).
Hilborn, R., Amoroso, R. O., Anderson, C. M., Baum, J. K., Branch, T. A., Costello, C., et al. (2020). Effective fisheries management instrumental in improving fish stock status. Proc. Natl. Acad. Sci. U. S. A. 117, 2218–2224. doi: 10.1073/pnas.1909726116
Ichinokawa, M., Okamura, H., and Kurota, H. (2017). The status of Japanese fisheries relative to fisheries around the world. ICES J. Mar. Sci. 74, 1277–1287. doi: 10.1093/icesjms/fsx002
Liang, C., Xian, W., and Pauly, D. (2020). Assessments of 15 exploited fish stocks in Chinese, South Korean and Japanese waters using the CMSY and BSM methods. Front. Mar. Sci. 7, 1–11. doi: 10.3389/fmars.2020.00623
Melnychuk, M. C., Kurota, M. H., Mace, P. M., Pons, M., Minto, C., Osio, C. C., et al. (2021). Identifying management actions that promote sustainable fisheries. Nat. Sustainabil. 20:668. doi: 10.1038/s41893-020-00668-1
Pons, M., Cope, J. M., and Kell, L. T. (2020). Comparing performance of catch-based and length-based stock assessment methods in data-limited fisheries. Can. J. Fish. Aquatic Sci. 77, 1026–1037. doi: 10.1139/cjfas-2019-0276
Ren, Q. Q., and Liu, M. (2020). Assessing northwest Pacific fishery stocks using two new methods: the Monte Carlo catch-MSY (CMSY) and the Bayesian Schaefer model (BSM). Front. Mar. Sci. 7, 1–9. doi: 10.3389/fmars.2020.00430
Wang, Y., Liang, C., Wang, Y., Xian, W., and Palomares, M. L. (2020b). Stock status assessments for 12 exploited fishery species in the Tsushima warm current region, Southwest Japan and East China, using the CMSY and BSM methods. Front. Mar. Sci. 7:640. doi: 10.3389/fmars.2020.00640
Wang, Y., Wang, Y., Liang, C., Zhang, H., and Xian, W. (2020a). Assessment of 12 fish species in the northwest Pacific using the CMSY and BSM methods. Front. Mar. Sci. 7, 1–11. doi: 10.3389/fmars.2020.00616
Yoda, M., Kurota, H., Sassa, C., and Takahashi, M. (2019). Stock Assessment and Evaluation for Japanese Jack Mackerel Trachurus japonicus (fiscal year 2018) in Marine fisheries Stock Assessment and Evaluation for Japanese waters (fiscal year 2018/2019). Kanagawa: Fisheries Agency and Fisheries Research and Education Agency of Japan, 131–162.
Keywords: stock assessment, stock status, data-limited, CMSY, BSM
Citation: Miyagawa M, Ichinokawa M, Yoda M, Kurota H, Ohshimo S and Nishida H (2021) Commentary: Stock Status Assessments for 12 Exploited Fishery Species in the Tsushima Warm Current Region, Southwest Japan and East China, Using the CMSY and BSM Methods. Front. Mar. Sci. 8:703039. doi: 10.3389/fmars.2021.703039
Received: 30 April 2021; Accepted: 23 June 2021;
Published: 16 July 2021.
Edited by:
Jie Cao, North Carolina State University, United StatesReviewed by:
Donna Dimarchopoulou, University of Rhode Island, United StatesCopyright © 2021 Miyagawa, Ichinokawa, Yoda, Kurota, Ohshimo and Nishida. This is an open-access article distributed under the terms of the Creative Commons Attribution License (CC BY). The use, distribution or reproduction in other forums is permitted, provided the original author(s) and the copyright owner(s) are credited and that the original publication in this journal is cited, in accordance with accepted academic practice. No use, distribution or reproduction is permitted which does not comply with these terms.
*Correspondence: Mitsuyo Miyagawa, bW1peWFnYXdhQGFmZnJjLmdvLmpw
Disclaimer: All claims expressed in this article are solely those of the authors and do not necessarily represent those of their affiliated organizations, or those of the publisher, the editors and the reviewers. Any product that may be evaluated in this article or claim that may be made by its manufacturer is not guaranteed or endorsed by the publisher.
Research integrity at Frontiers
Learn more about the work of our research integrity team to safeguard the quality of each article we publish.