 Gotje von Leesen1*†
 Hlynur Bardarson2
 Sæmundur Ari Halldórsson3
 Martin J. Whitehouse4
 Steven E. Campana1
- 1Faculty of Life and Environmental Sciences, University of Iceland, Reykjavik, Iceland
- 2Marine and Freshwater Research Institute, Reykjavik, Iceland
- 3Institute of Earth Sciences, University of Iceland, Reykjavik, Iceland
- 4Department of Geosciences, Swedish Museum of Natural History, Stockholm, Sweden
Global warming is increasing ocean temperatures, forcing marine organisms to respond to a suite of changing environmental conditions. The stable oxygen isotopic composition of otoliths is often used as an index of temperature exposure, but the accuracy of the resulting temperature reconstructions in wild, free-swimming Atlantic cod (Gadus morhua) has never been groundtruthed. Based on temperatures from data storage tags (DST) and corresponding salinity values, the stable oxygen isotope (δ18O) value was predicted for each month of tagging and compared with δ18Ootolith values measured in situ with secondary ion mass spectrometry (SIMS). Paired-sample Wilcoxon tests were applied to compare measured and predicted δ18O values. The difference between measured and predicted mean and maximum δ18Ootolith values was not significant, suggesting a good correspondence between SIMS-measured and DST-predicted δ18Ootolith values. However, SIMS-measured and predicted minimum δ18Ootolith values were significantly different (all samples: p < 0.01, coastal and frontal cod: p < 0.05), resulting in overestimation of maximum temperatures. Our results confirm that otoliths are well-suited as proxies for mean ambient temperature reconstructions. A possible matrix effect and the absence of a reliable aragonite standard for SIMS measurements appeared to cause a small divergence between measured and predicted δ18Ootolith values, which affected the estimation accuracy of absolute temperature. However, relative temperature changes were accurately estimated by SIMS-analyzed δ18Ootolith values.
Introduction
Global warming is increasing ocean temperatures, forcing marine organisms to respond to a suite of changing environmental conditions (IPCC, 2013). Mobile species like fish have two options on how to react to changing environmental conditions; they can either stay and be exposed to increasing water temperatures, or they can migrate (often poleward) to remain in their preferred temperature range (Drinkwater et al., 2010; Ottersen et al., 2010). Environmental temperatures measured at a fixed station may not reflect the ambient temperature exposure of the organism. Data storage tags (DST) and natural temperature proxies in bioarchives record the ambient environment of organisms, and thus provide more accurate temperature exposures than do environmental temperatures (Pálsson and Thorsteinsson, 2003; Pampoulie et al., 2008). DST tags which record temperature and depth have allowed increased insight into the migration, distribution, feeding and spawning behavior, vertical and horizontal movement, and geographic location of many marine animals (Righton and Mills, 2008; Thorsteinsson et al., 2012; Darnaude et al., 2014; Bardarson et al., 2017). The disadvantage of DST tags is that they are costly, the recapture rate is low, and they cannot be used to reconstruct historical ambient temperatures before their widespread adoption in the late 1980s. Biological and geochemical archives of otoliths and other calcified structures indirectly record the ambient conditions experienced by marine organisms, and thus are valuable in reconstructing long-term ecological time series (Campana, 1999).
The otoliths of fish (ear stones) are metabolically inert, paired calcified (aragonitic) structures used for balance and/or hearing (Campana, 1999). Their stable oxygen isotope composition provides a direct means of reconstructing the temperature exposure of the fish (Campana and Thorrold, 2001; Høie et al., 2004b). The oxygen isotope ratio of otoliths reflects that of the water from which the oxygen is sourced but with a temperature-dependent offset (fractionation) (Campana, 1999). Changes in δ18O of otolith aragonite are negatively correlated to water temperature; the higher the water temperature, the lower the δ18Ootolith value (Kim and O’Neil, 1997). Kinetic, metabolic, or physiological effects are generally not considered to impact the otolith δ18O (Thorrold et al., 1997; Høie et al., 2003). Cod-specific temperature-dependent fractionation and the precision and accuracy of stable oxygen isotope signals of lab-reared cod have previously been demonstrated (Høie et al., 2004a,b). However, a disequilibrium for oxygen isotope fractionation has been observed for some species, e.g., North Sea plaice (Geffen, 2012; Darnaude et al., 2014), especially at temperature extremes. The stable oxygen isotope composition of the ambient seawater (δ18Oseawater) is needed to reconstruct the ambient temperature of fish, but direct measurements of δ18Oseawater are rarely available; thus, an area-specific salinity mixing line is often used. However, salinity fluctuations can be pronounced in temperate and polar latitudes due to freshwater inflow/melting, sea-ice formation and thermohaline circulation, thus complicating the development of the salinity mixing line.
Otoliths form annual growth bands continuously throughout their lifetime, which also record the complete exposure history of environmental conditions in their acellular calcified structure. Coupling stable oxygen isotope values with age or date of catch, δ18Ootolith can be used to provide chronological records of the ambient temperature of the fish, in some cases back to the early 1900s through the use of otolith archives. Otoliths are also found in archeological sites, which allows the investigation of temperature exposure in past times. Thus, the isotopic composition of oxygen in otoliths has not just been applied by ecologists (Jones and Campana, 2009; von Leesen et al., 2020) but also by paleontologists (West et al., 2012; Wang et al., 2013).
Due to its high commercial value and broad geographical distribution in the North Atlantic Ocean, Atlantic cod (Gadus morhua) has been extensively studied. In the large Icelandic cod stock, two ecotypes with distinct seasonal patterns of temperature exposure and depth distribution have been reported (Pampoulie et al., 2012; Thorsteinsson et al., 2012). Frontal cod migrate between spawning and feeding areas and are found in waters up to 600 m depth (Thorsteinsson et al., 2012; Bardarson et al., 2017). In contrast, coastal cod occur in shallower waters and are characterized by a more uniform temperature exposure with steadily increasing temperatures during summer months and a decrease again toward the winter months. The most distinct difference between both ecotypes is the temperature fluctuation seen in frontal cod due to their feeding migrations across thermal fronts. Both ecotypes show spawning site fidelity. They are usually found at different depths, and it seems that the ecotypes select different spawning sites, but the possibility of mixing of frontal and coastal cannot be excluded (Grabowski et al., 2011). The main spawning ground for cod is off southwest Iceland, but smaller spawning sites are found all around Iceland (Marteinsdottir et al., 2000). The main migration routes are from the spawning ground in southwest Iceland to the feeding areas in the north, either along the south and southeast coast to the northeast or along the (south-)west to northwest Iceland (Jónsson, 1996; Neuenfeldt et al., 2013). The spawning migration of frontal cod off northeastern Iceland is less strongly pronounced than of cod from southwestern Iceland. Frontal cod off northeastern Iceland migrate to northwest Iceland for spawning (Jónsson, 1996; Pampoulie et al., 2012).
The accuracy of the isotopic record of otoliths as an index of temperature exposure in wild, free-swimming cod has not previously been established. In this study, we used secondary ion mass spectrometry (SIMS) to provide high-resolution (monthly or weekly resolution depending on otolith growth rate) to quantify the accuracy of the isotopic record in the otolith and confirm that stable oxygen isotope values are a reliable temperature proxy in wild, free-swimming cod.
Materials and Methods
Sampling
Otolith sections from 38 wild, DST-tagged cod were selected for stable oxygen isotope analyses (Supplementary Table 1). The majority (n = 25) of the tagged cod were classified as coastal cod, while 12 were frontal cod, and one individual could not be clearly identified. The ecotypes were previously determined by temperature and depth profiles recorded by the DST-tags. Cod were tagged between April 2002 and April 2004 around Iceland in four different areas (west, southwest, southeast, and northeast; Figure 1), with 22 cod being tagged in southeast Iceland. In most cases, tags were attached to the fish for about 1 year. Pampoulie et al. (2008) described the DST, DSTmilli and DSTcenti-ex tags (manufactured by Star Oddi) in detail. Temperature and depth were usually recorded in 10-min intervals with a depth range of 0–700 m, a resolution of 0.21 m, and an accuracy of depth records of ±0.70%. These tags are capable of recording temperatures ranging from −2 to 39°C with a precision of 0.01°C, and accuracy of ±0.20°C. In 7 out of 38 cases, the recording time of water temperature and depth was shorter than the tagging time because the recording did not start directly after tagging or the DST battery ran out of power before recapture. The tagging procedure is described in detail on the following website: https://www.hafogvatn.is/static/files/enska/merkingar_thorskur.pdf.
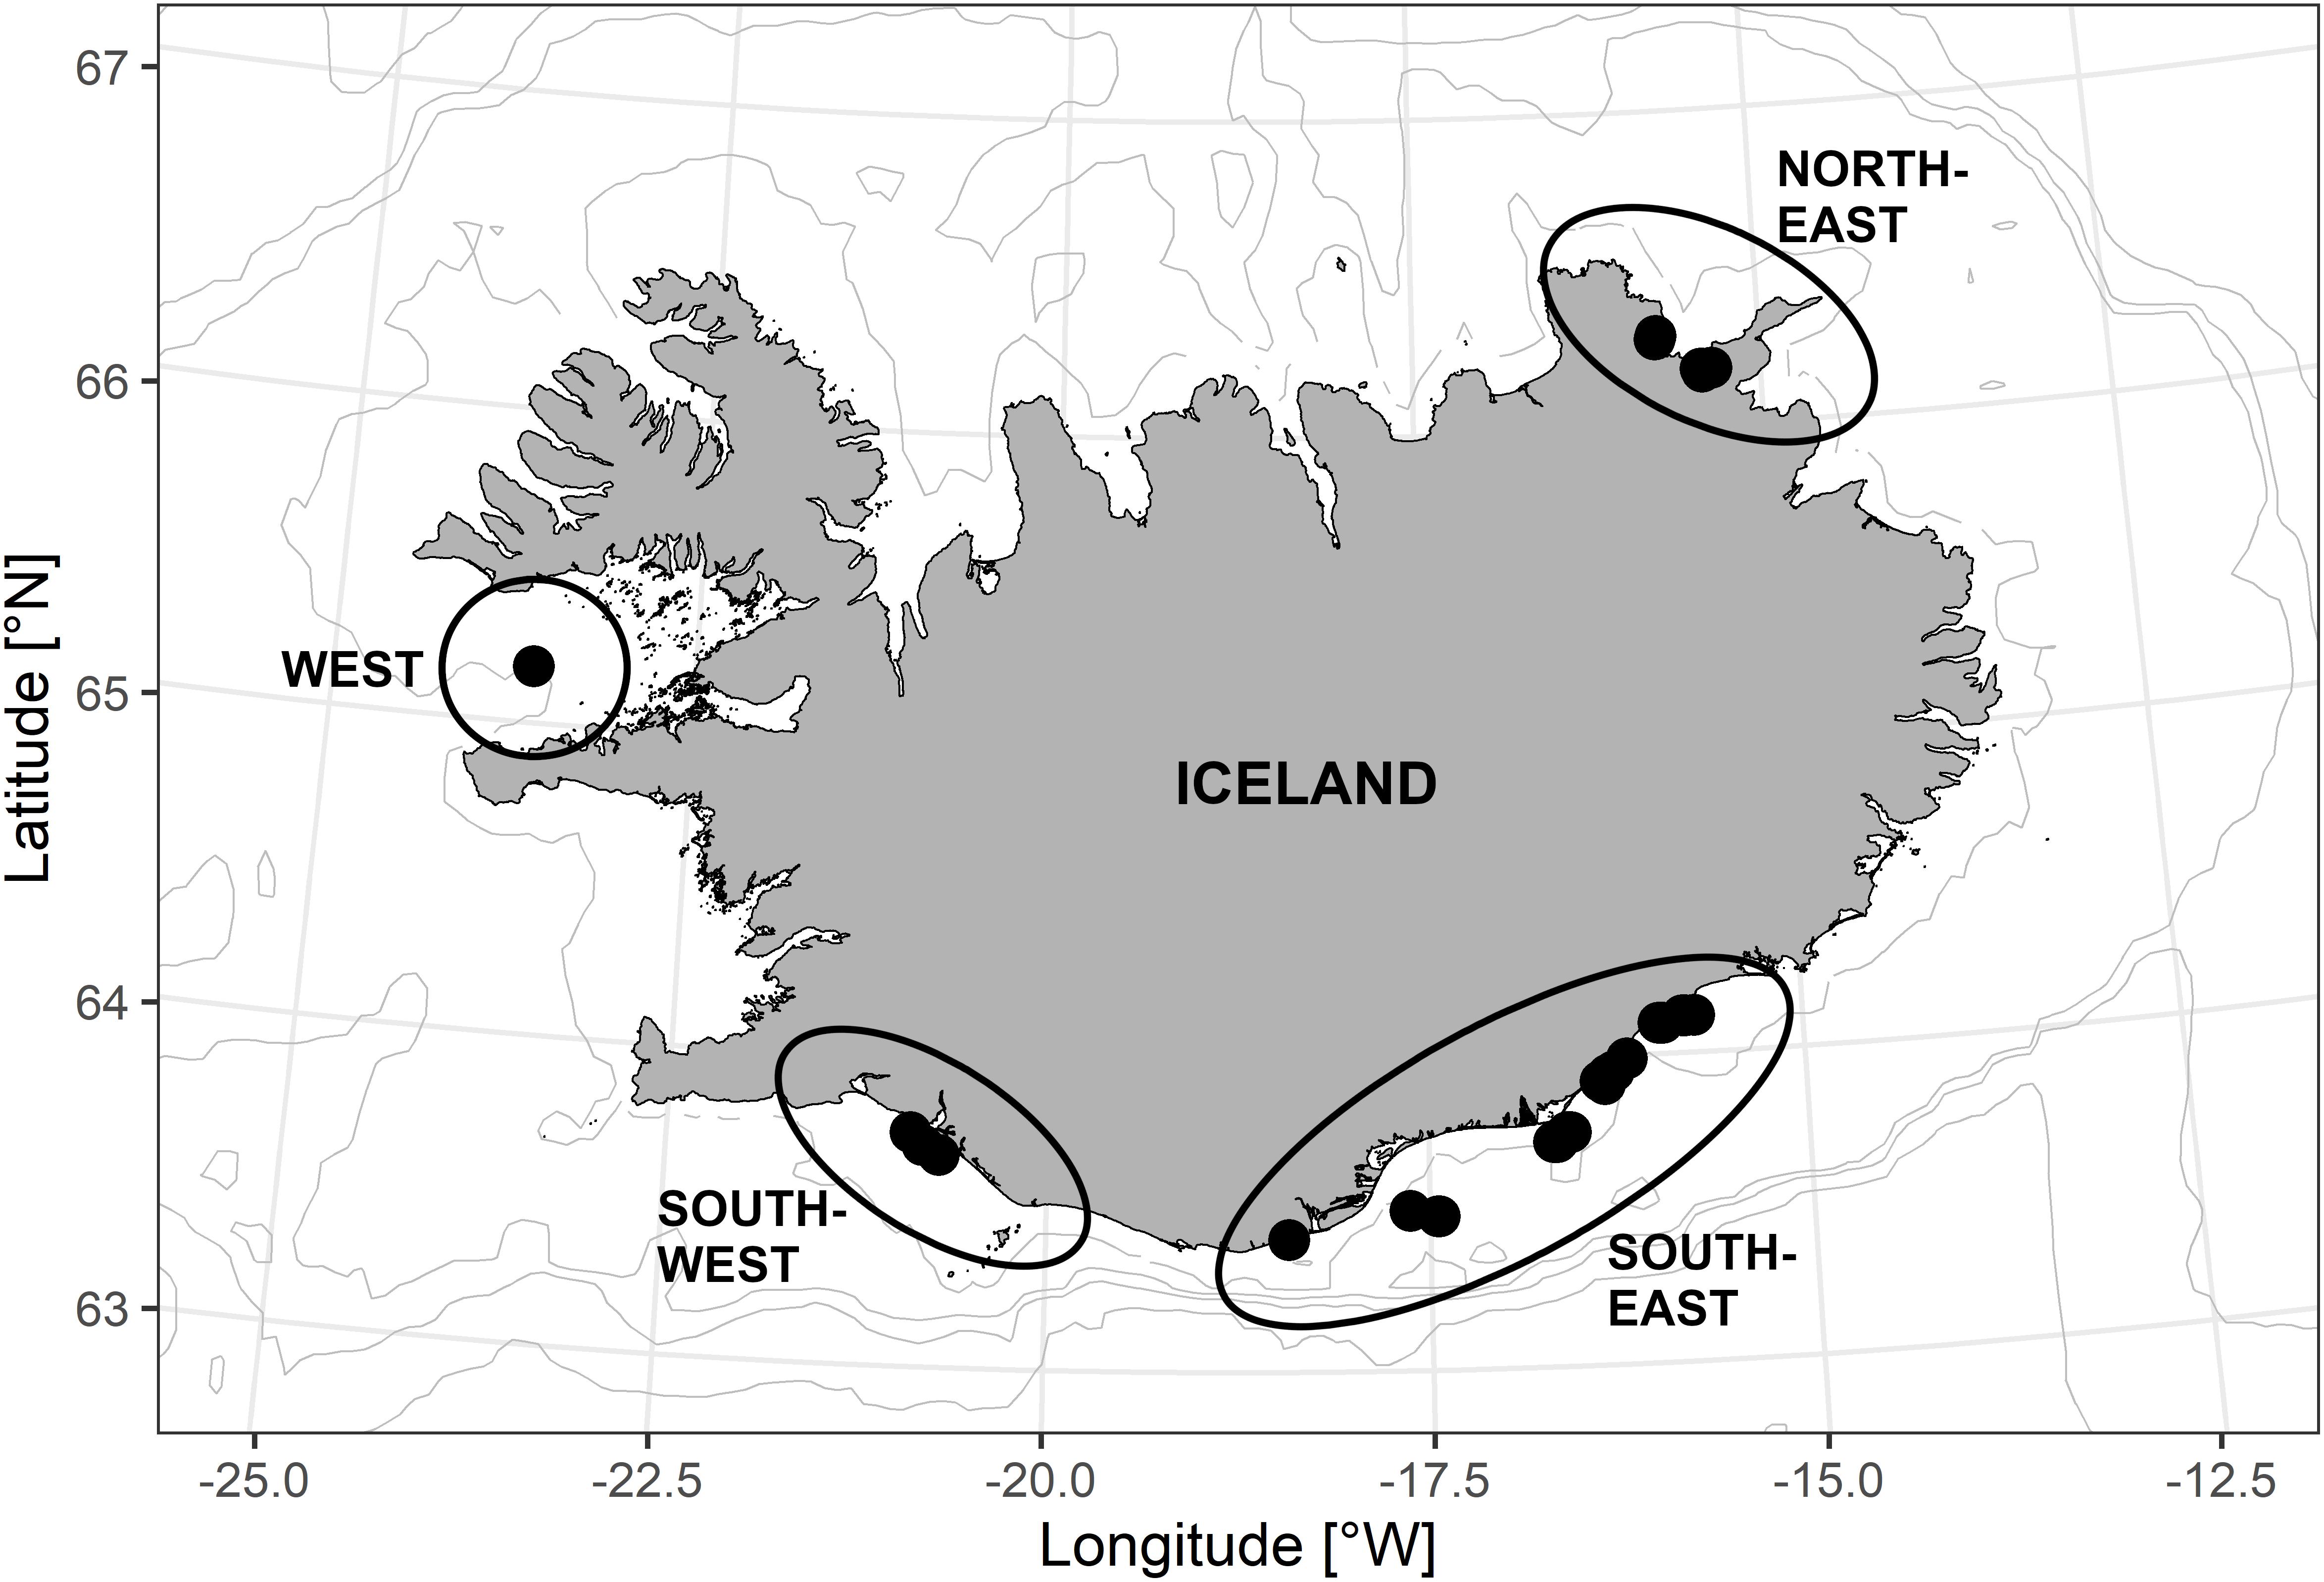
Figure 1. Release position of data storage tags (DST)-tagged cod on spawning grounds around Iceland between 2002 and 2004. In total, 38 fish were tagged: 1 in the west (W), 3 in southwest (SW), 22 in southeast (SE), and 12 northeast (NE) off Iceland.
Otolith Preparation
Stable oxygen isotopes ratios were analyzed with SIMS, which is a high-spatial resolution method for determining the elemental and isotopic composition of solid materials (Campana, 1999). The otolith sections (∼200 μm) were cut out of glass slides using a Buehler IsoMet 1000 Precision Saw (ITW Test & Measurement GmbH, Esslingen, Germany) equipped with a 15LC IsoMet Diamond Wafering blade. Sample mounts were prepared following the standard procedure for stable isotopes at NordSIMS. Five to six otoliths and three to four pieces of a calcite reference material were embedded in each epoxy mount, which dried overnight in a pressure pot. The surface of the sample mounts was ground with lapping film (2000 microns) and polished using diamond or aluminum paste of 3 and 1 micron(s) to remove residual epoxy and resin. The sample mounts were cleaned in ethanol using an ultrasonic bath to remove any residue of polishing pastes.
The mounted otolith sections were imaged with an Olympus DP74 high resolution [5760 × 3600 pixel (3CMOS)] camera attached to a Leica S8AP0 stereomicroscope (Leica Microsystems GmbH, Wetzlar, Germany) using CellSens Standard software (Olympus Europe SE & Co., KG, Hamburg, Germany). Fish age was previously determined by experienced age readers, and growth was measured along the dorsal axis. The otolith material formed during the tagging period was determined by measuring the distance from the edge of the otolith (date of catch) back to the growth increment assumed to have been formed in the year of tagging. The increment width was measured (in μm/year) and then the tagging location on the otolith section was interpolated based on the tagging date.
Secondary Ion Mass Spectrometry
Sub-annual otolith δ18O values were measured by SIMS at the NordSIMS laboratory, Department of Geosciences at the Swedish Museum of Natural History in Stockholm, Sweden (Supplementary Table 2). SIMS is a probe-based method for determining the elemental and isotopic composition of solid materials (in otoliths: e.g., Darnaude et al., 2014; Helser et al., 2018; Willmes et al., 2019). Polished mounts were gold-coated, and the stable oxygen isotopes were measured using a CAMECA ims1280 ion microprobe, an advanced high-sensitivity mass spectrometer that uses a focused beam of ions to sample in situ selected micrometer-sized areas of a sample for measurement of isotopic composition.
A critically focused Cs+ (caesium) primary beam with 20 keV impact was used to sputter the sample, and a low-energy electron flooding gun was used for charge compensation. The primary beam current was ca. 2.5–3 nA, which yielded ca. 15 μm analytical spots, including a 10 μm raster to homogenize the beam. Each analysis consisted of an initial pre-sputter over a rastered 20 μm area to remove the gold coating, followed by centering the secondary beam in the field aperture (field of view on the sample of 30 μm with 90× magnification transmission ion optics). For oxygen, the 16O (ca. 3 × 10⁹) and 18O ion beams were mass filtered at a mass resolution of ca. 2500 (M/ΔM) and analyzed simultaneously using two Faraday detectors with amplifiers housed in an evacuated, temperature-stabilized chamber. The secondary magnet field was locked at high stability using an NMR field sensor operating in regulation mode. All pre-sputter, beam centering, and data acquisition steps were automated in the run definition. Fully automated sequences comprised regular measurements of the reference materials, bracketing measurements of unknown targets. A homogeneous calcite reference material was used largely to monitor instrument drift throughout the session and assess the external reproducibility, since there are no comparably homogeneous aragonite reference materials available and little prospect of obtaining one given the nature of biogenic mineral growth. Instrumental mass fractionation (IMF) was also calibrated in each session using the calcite reference material S0161, which comes from a granulite facies marble in the Adirondack Mountains (kindly provided by R. A. Stern, University of Alberta). The δ18O value of S0161 used for the calcite-based IMF correction was determined by conventional stable isotope ratio mass spectrometry at the Department of Geosciences, Stockholm University, using a Thermo Finnigan GasBench II and CTC PAL autosampler coupled to a MAT253 mass spectrometer. Dried and homogenized S0161 (0.2 mg) was put into a vial with phosphoric acid, without the two touching; the vial was then flushed with helium (He) before allowing the acid to contact and react with the carbonate. The long term (>10 years) standard deviation (SD) on the IAEA-CO-1, IAEA-CO-8 and NBS18 calcite standard is 0.15‰. Ten separate aliquots of the S0161 calcite yielded δ18O = −5.62 ± 0.11‰ V-PDB (1 std. dev.).
Prediction of Otolith δ18O Values During Data Storage Tags Recording Time
Calculation of Predicted δ18Ootolith
Monthly otolith δ18O values between release and recapture were predicted using the tag-recorded temperatures and geo-referenced water δ18O values, and then compared with the SIMS-analyzed δ18Ootolith. Before comparing measured and predicted otolith δ18O values, images with growth measurements and SIMS measurement spots were overlayed to verify that the SIMS samples were measured in the correct part of the otolith. Oxygen isotope ratios of the ambient seawater at the time and place of prediction were back-calculated using salinity measurements (derived from the Marine and Freshwater Research Institute1) matching the predicted geolocations and the salinity mixing line for the Icelandic shelf (von Leesen et al., 2020):
where δ18Oseawater is the oxygen isotope value of seawater [‰ on the standard mean ocean water (SMOV) scale], and S is the salinity. Salinity values were matched according to known migration patterns of the respective ecotype (Pampoulie et al., 2012; Thorsteinsson et al., 2012), tagging and recapture location, and the DST-recorded depth. All isotope values for δ18O otolith carbonate are reported in ‰ on the VPDB scale. Seawater values were corrected from SMOW by subtracting 0.27‰ (Bemis et al., 1998; Grossman, 2012; Marchitto et al., 2014). Finally, δ18Ootolith values were predicted using either the equation of Jones and Campana (2009) [adapted from Kim and O’Neil (1997)] incorporating the corresponding temperatures recorded by the DST tag:
or the temperature fractionation equation by Høie et al. (2004b), respectively:
Offset Factor to Correct Measured δ18Ootolith
Atlantic cod otoliths are aragonitic, but the stable oxygen isotope concentration was measured against a calcite standard as no reliable aragonite standard is available for SIMS measurements. The bias between aragonite and calcite was corrected using an offset factor which was estimated in this study using four different approaches (Table 1), and then added to all measured δ18O values. The approaches used for calculating the offset were:
(1) The last SIMS measurement of each otolith was subtracted from the last predicted δ18Ootolith value. Since the known recapture position near the edge of the otolith enabled a close to reality temperature and salinity estimation, the predicted δ18Ootolith should have been relatively accurate.
(2) The offset between measured and predicted otolith δ18O values for coastal cod (only) was calculated. Coastal cod have a less pronounced feeding migration than frontal cod, and thus, the estimation of the geolocation and the corresponding salinity should have been more accurate.
(3) Analogous to (2), the offset of all but seven samples (including both coastal and frontal cod) was calculated. The water temperature and depth recordings of the seven excluded samples stopped at least 100 days before the fish was recaptured which makes the date-matching of measured and predicted δ18Ootolith values more challenging.
(4) Analogous to (3), but all 38 samples were included in calculating the offset factor.
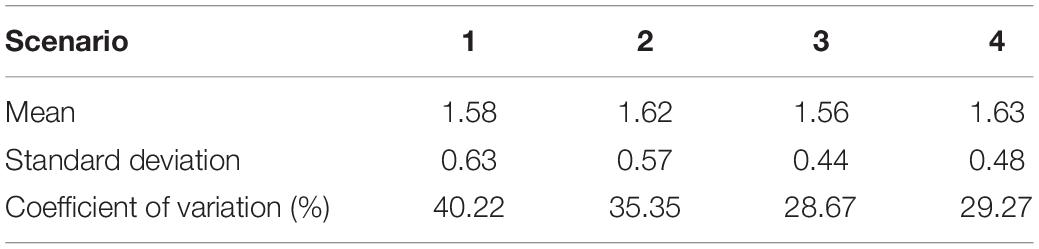
Table 1. Mean, standard deviation and coefficient of variation (%) of the different offset calculations to correct the aragonite-calcite bias (see section “Salinity Sensitivity Analysis” for details of the 4 different scenarios).
Measured and predicted otolith δ18O values were statistically compared using a paired-samples Wilcoxon Test. Outliers were excluded from the statistical analysis (i.e., DSTid 1C0426). Values above Q3 + 1.5xIQR or Q1–1.5IQR were considered outliers (Q3, third quartile; Q1, first quartile; and IQR, interquartile range). All statistical analyses were performed in R (R Core Team, 2019).
Salinity Sensitivity Analysis
Predicted δ18O values were based on known DST-temperature records and salinity-derived δ18Oseawater values. A sensitivity analysis was performed to test the effect of incorrect salinity estimations on the predicted δ18Ootolith values [using the temperature fractionation equation by Jones and Campana (2009)]. In total, five different salinity scenarios were tested in the sensitivity analysis:
(1) Most probable salinity: salinity values were matched with DST-recorded temperatures based on depth distribution, tagging and recapture position, and the known migration pattern of the ecotype.
(2) Minimum salinity: salinity measurements of the years 2002–2005 were used to calculate the lowest possible salinities in the geolocation area over a year (see Supplementary Table 3).
(3) Maximum salinity: analogous to (3), the highest possible salinities in the area were determined (see Supplementary Table 3).
(4) Salinity 34.5: a fixed salinity value of 34.5 was assumed, which is the lowest salinity value in fully marine water around Iceland.
(5) Salinity 35.2: analogous to (4), a fixed salinity of 35.2 was assumed for all samples, which is the highest salinity measured around Iceland.
Otolith Growth Scenarios
Secondary ion mass spectrometry-analyzed and predicted δ18Ootolith timeseries of individual otoliths were aligned using QAnalySeries to achieve the best match in the position of inflection points (Kotov and Paelike, 2018).
Since water temperatures may influence the accretion rate of otolith growth, two different scenarios for otolith annual growth were tested.
• SC 1: otolith growth is constant throughout the year, i.e., linear otolith growth (equal weighting of 100% given to all months).
• SC 2: 90% of the otolith growth occurred in the 6 months of summer (May–October) and the remaining 10% of the otolith was formed during the 6 months of winter, i.e., non-linear otolith growth [see Pilling et al. (2007)].
Results
Data Storage Tags-Recorded Temperatures
Cod tagged off south(western) Iceland were exposed to warmer temperatures than cod off northeastern Iceland (the mean difference between SE/SW and NE coastal cod was 3.4°C; for frontal cod 1.4°C; Table 2). A Two-Way ANOVA showed that DST-recorded temperatures varied significantly by region (F = 235.73, p < 0.001, df = 1) and ecotype (F = 7.96, p < 0.01, df = 1) with a significant interaction of both factors (F = 39.70, p < 0.001, df = 1). The temperature amplitude across the year was highest in west Iceland and lowest in the northeast (Figure 2). Frontal cod off south-eastern Iceland were exposed to fluctuating temperatures with the highest temperatures during the spawning season in April and May. The ambient temperature varied with depth (Supplementary Figure 1) with colder temperatures in deeper waters, tagging/recapture area, and ecotype (Table 3).
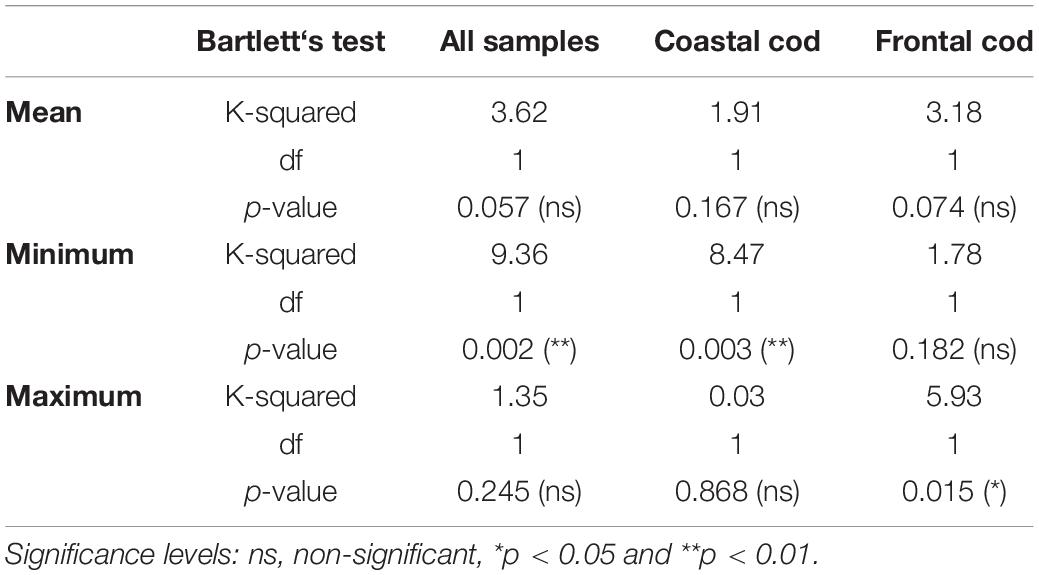
Table 2. Bartlett’s test of equality of variance for both ecotypes, coastal and frontal cod, respectively.
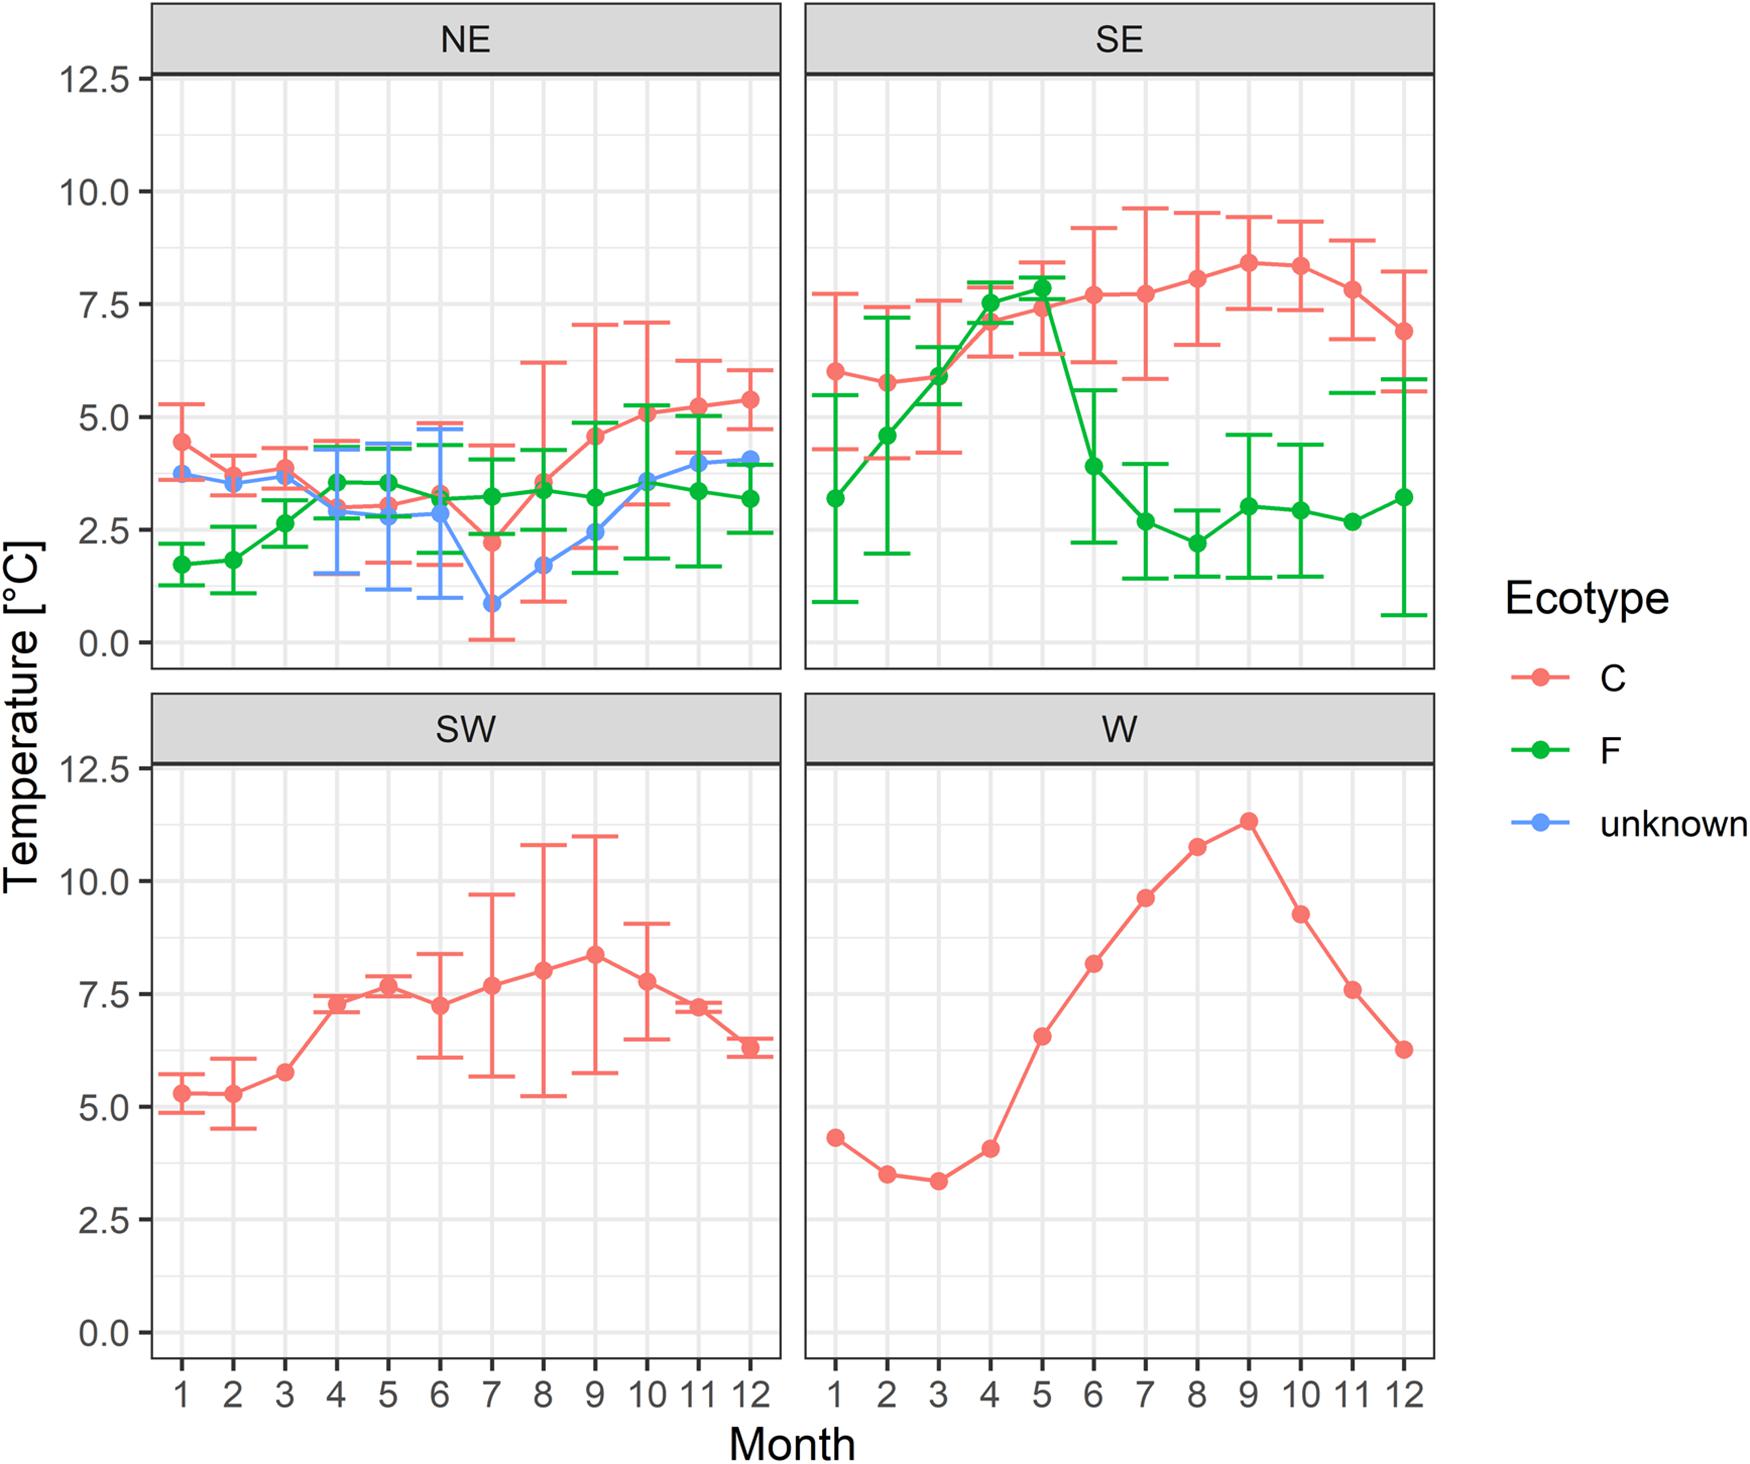
Figure 2. Mean monthly temperatures (averaged for all years) and standard deviation for each tagging area (W, west; SW, southwest; SE, southeast and NE, northeast off Iceland) and ecotype (C, coastal; F, frontal) recorded by DST tags.
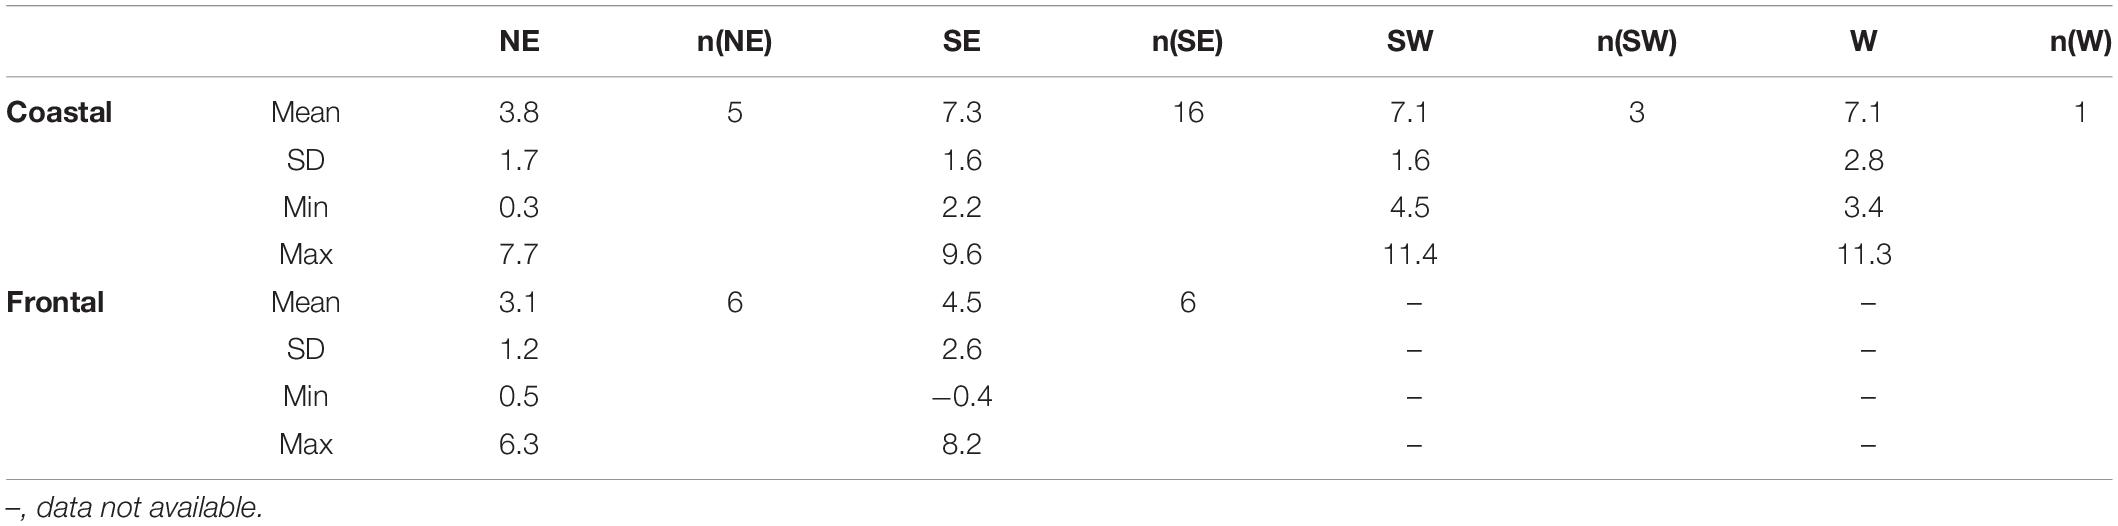
Table 3. Mean (± SD), minimum and maximum temperature recorded with data storage tags (DST) tags by both ecotypes in the different tagging areas (W, west; SW, southwest; SE, southeast, and NE, northeast off Iceland) and the sample size (n).
Comparison of Secondary Ion Mass Spectrometry-Measured and Predicted δ18Ootolith
The offset factor between SIMS-measured and predicted δ18Ootolith was not sensitive to the method of calculation, with all four methods producing similar values (Table 1). A Kruskal–Wallis test showed that the four offset factors were not statistically different. Therefore, SIMS-measured δ18Ootolith values were corrected applying the offset-factor of 1.62 which had the best correspondence between measured and predicted δ18Ootolith values (approach 2).
Predicted and measured δ18Ootolith values were relatively similar after the offset factor was applied to the SIMS measurements, although predicted values tended to be slightly higher. In contrast, the range of measured δ18Ootolith values was broader than for predicted δ18Ootolith (Supplementary Figure 2): mean ± SD predicted δ18Ootolith 2.48 ± 0.47‰, mean measured δ18Ootolith 2.32 ± 0.60‰. The δ18Ootolith values were predicted based on DST-recorded temperatures instead of the ambient temperature calculation based on SIMS-analyzed δ18Ootolith values because the possible mismatch of δ18Ootolith values and dates would add a potential error. The temporal resolution of SIMS measurements varied depending on sample resolution, the age of the fish, and the individual growth rate but was usually about 1 month based on the spot size (ca. 15 μm) and growth rate. Hence, monthly DST-recorded temperatures were calculated to predict δ18Ootolith.
Both measured and predicted otolith δ18O values of frontal cod were higher than those of coastal cod, resulting in colder ambient temperatures of frontal cod than coastal cod (Figures 3, 4). Coastal cod had a measured δ18Ootolith mean of 2.12 ± 0.55‰ and a predicted mean of 2.26 ± 0.41‰; frontal cod had a measured δ18Ootolith mean of 2.74 ± 0.45‰ and a predicted mean of 2.82 ± 0.35‰. Otolith δ18Ootolith values varied significantly between ecotype (F = 76.79, p < 0.001, df = 1), regions (F = 107.02, p < 0.001, df = 1; including just SE and NE Iceland where both ecotypes were present) and the interaction of both (F = 20.85, p < 0.001, df = 1). Statistical comparisons by paired-samples Wilcoxon test, which tests whether the median of the paired differences differs from 0, showed that the measured and predicted mean and maximum values did not vary significantly (Figure 3). However, minimum δ18Ootolith values differed significantly among all samples (p < 0.01), and when restricted to ecotype (p < 0.05). The results were also supported by Bartlett’s test of equality of variance, which found no significant difference in variance between mean and maximum measured and predicted δ18Ootolith values among all samples, but for minimum δ18Ovalues (Table 2).
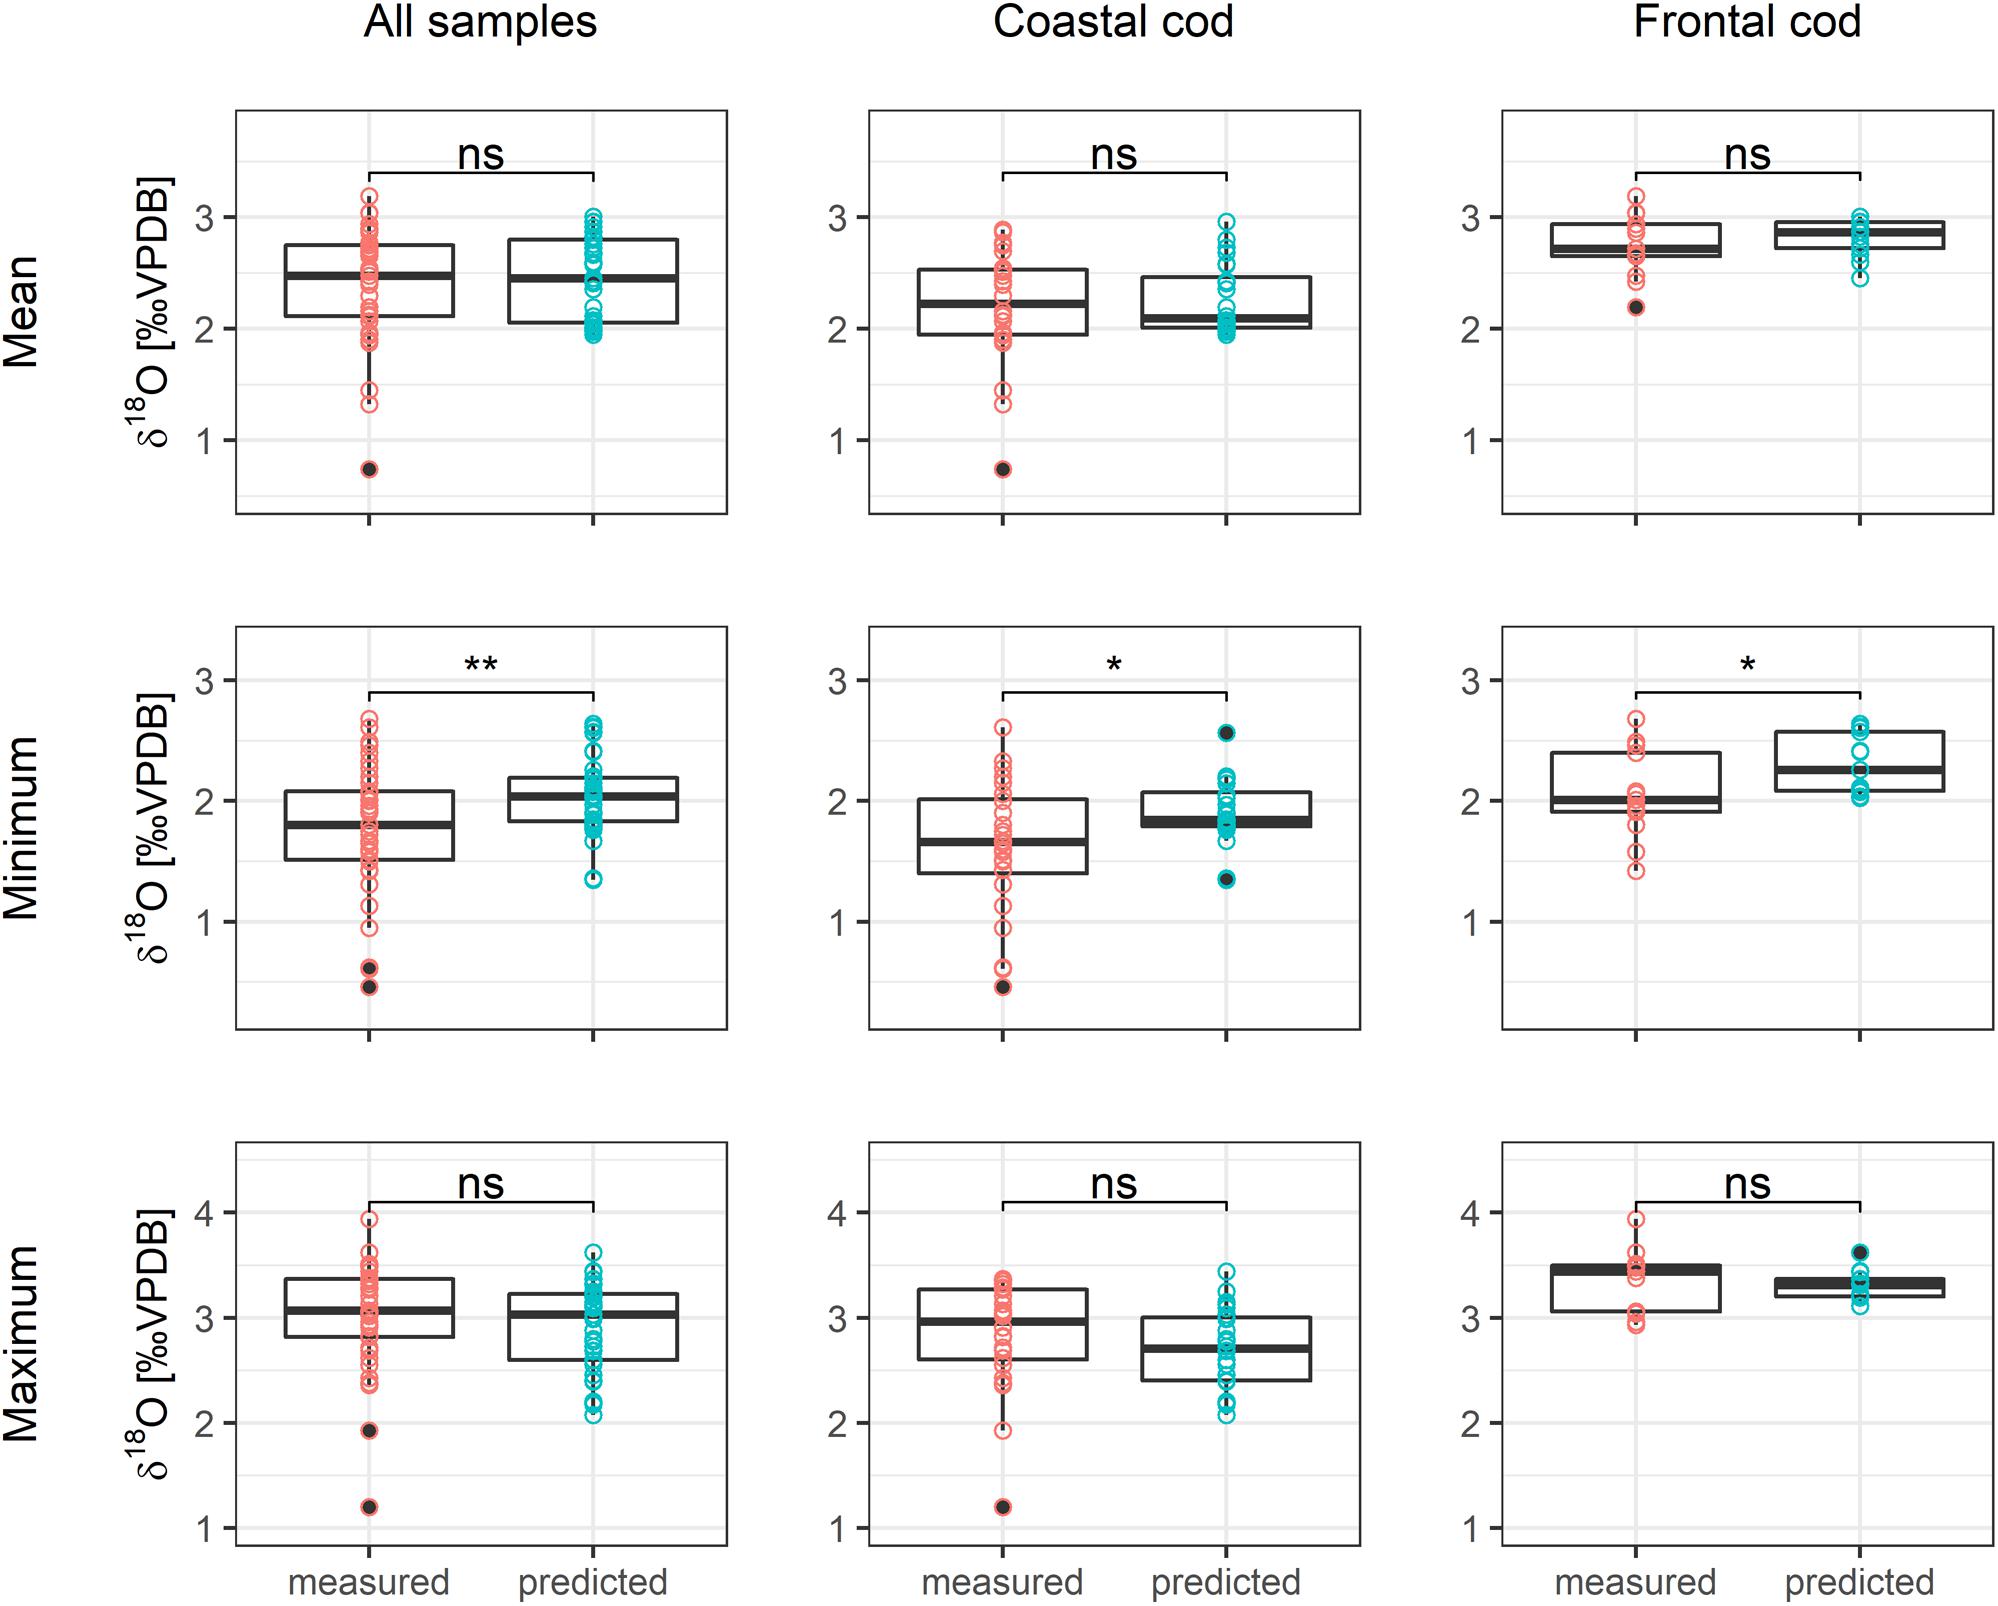
Figure 3. Differences between Secondary ion mass spectrometry (SIMS)-measurements and predicted mean, minimum, and maximum δ18Ootolith values of all samples and distinguished between coastal and frontal cod. Significant differences, based on paired-samples Wilcoxon test, are shown at **p < 0.01, *p < 0.05 and ns for non-significant differences.
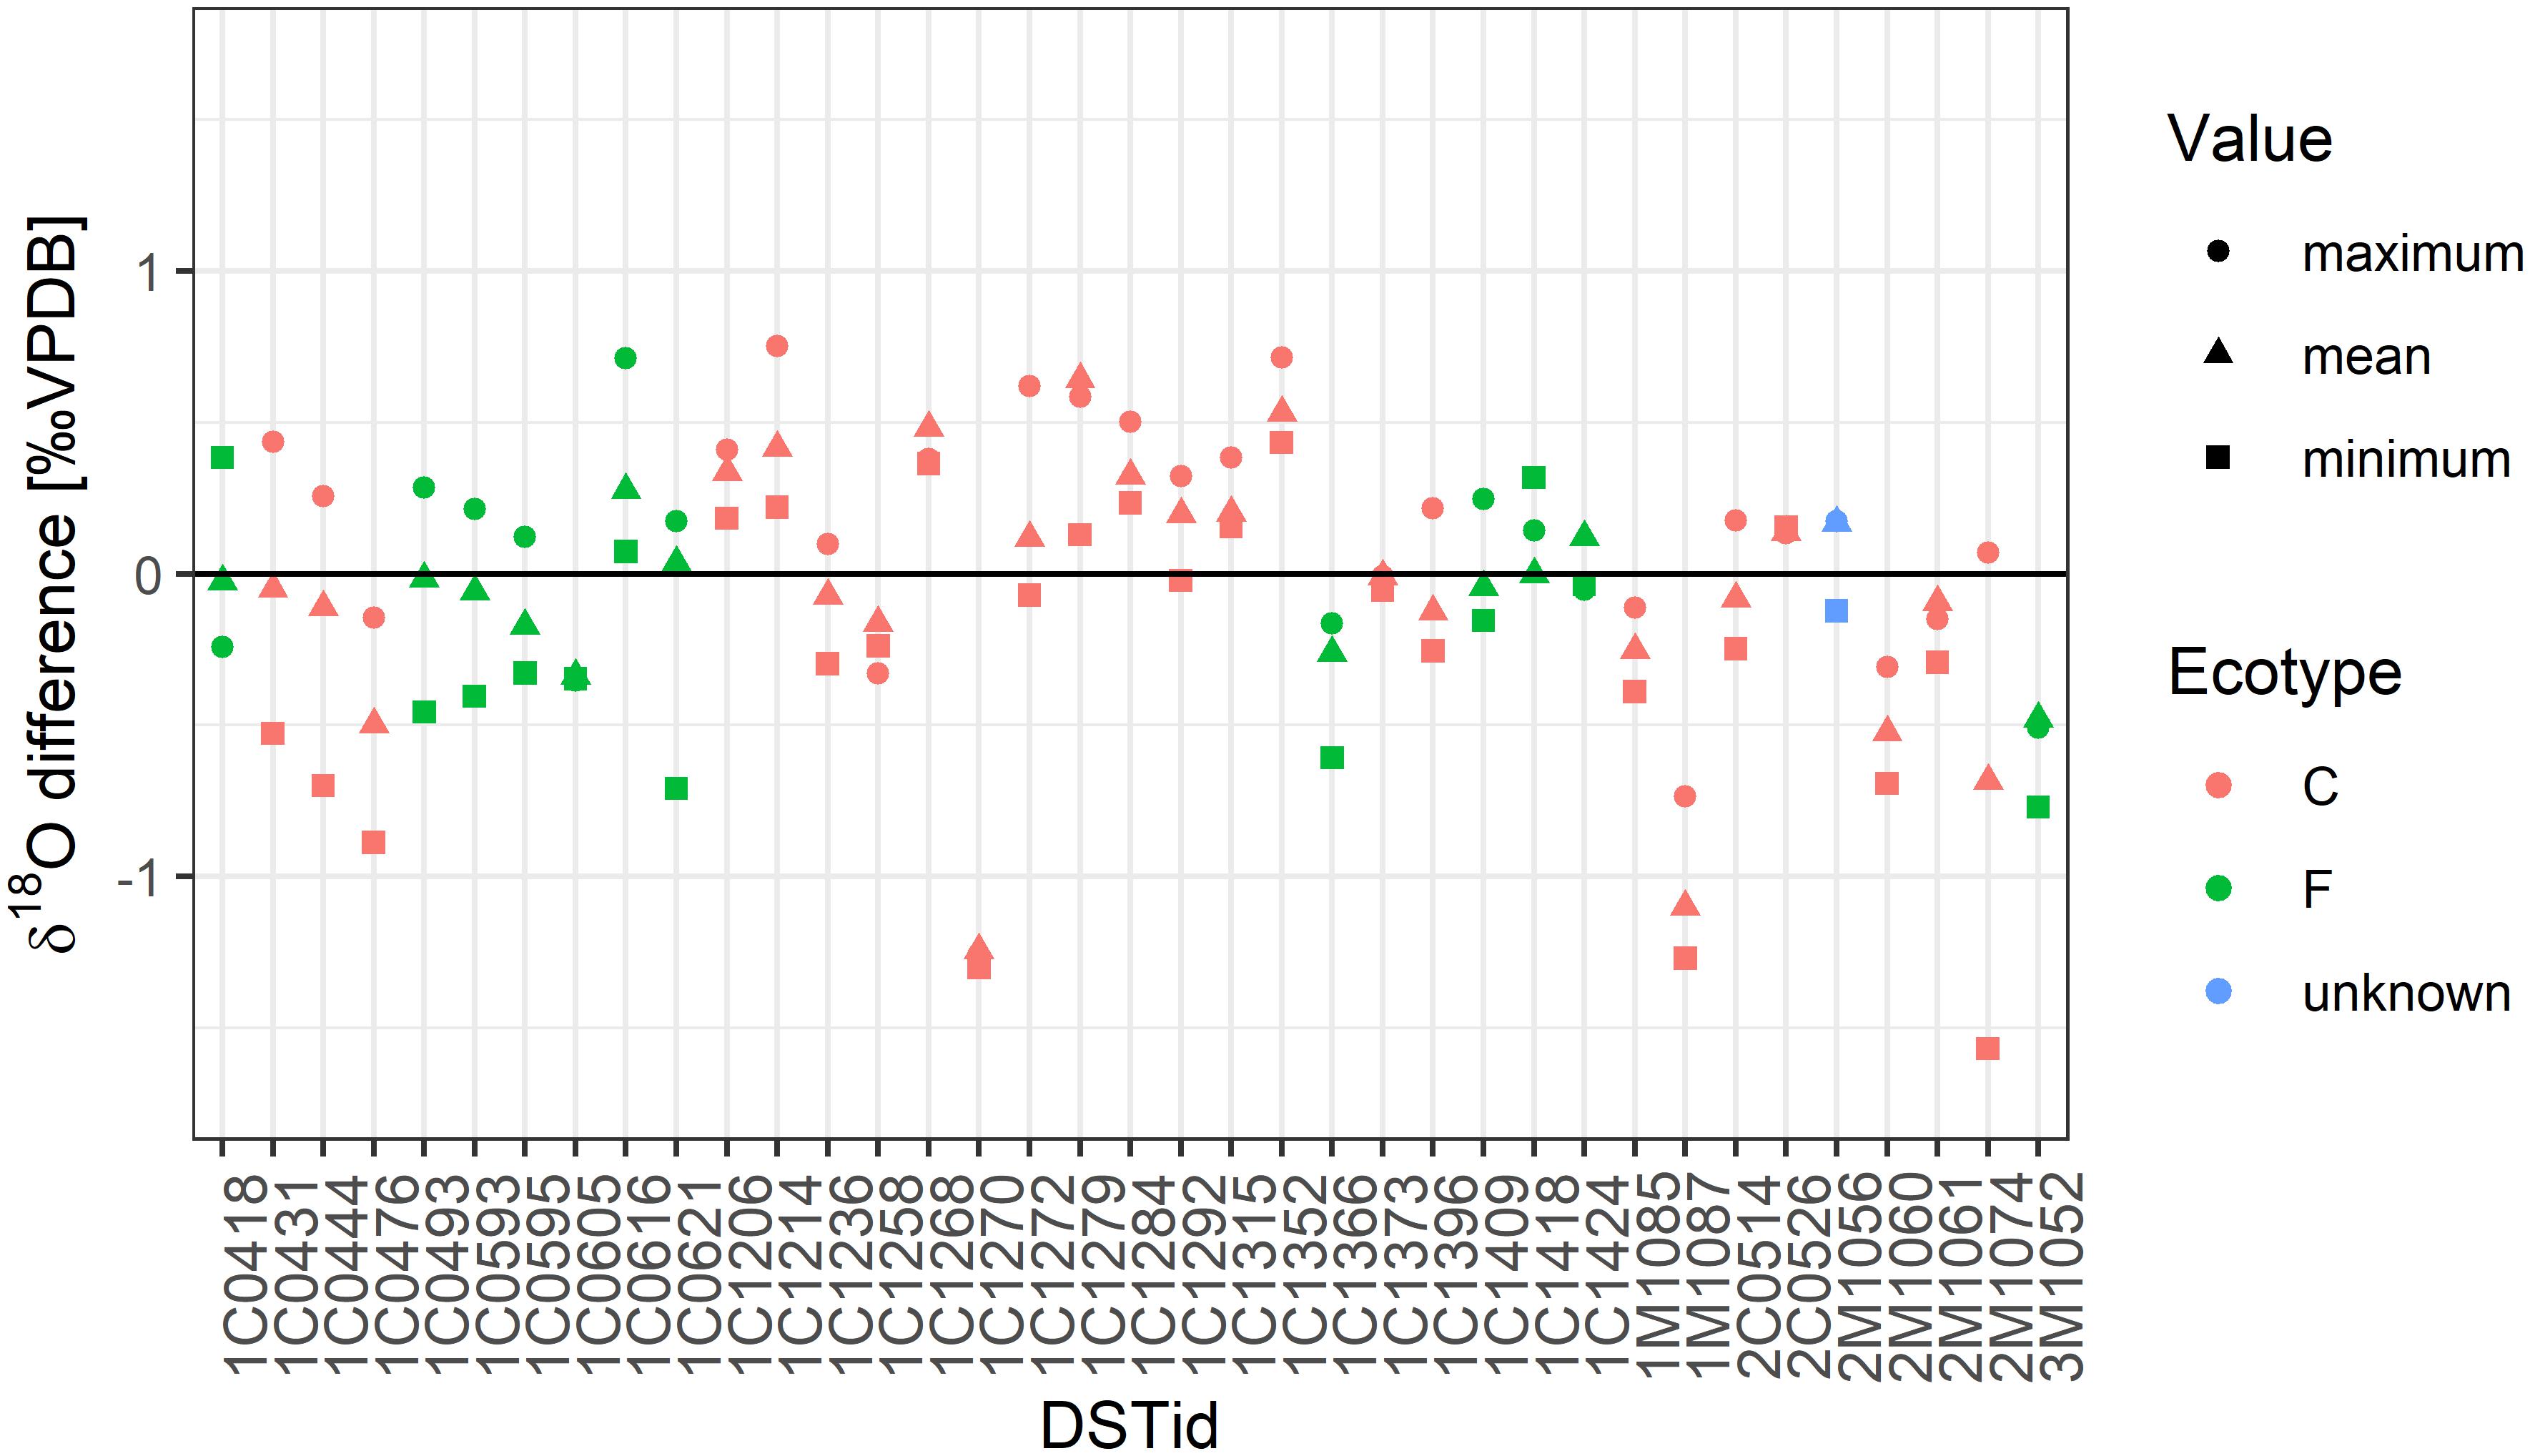
Figure 4. Difference between measured and predicted mean, minimum and maximum δ18Ootolith value by ecotype. Calculations are based on the most probable salinity scenario.
The two different temperature fractionation equations produced predicted δ18Ootolith which differed by about 0.22‰ which is equivalent to a temperature difference of 1.1°C (Tables 4, 5). The difference between measured and predicted δ18Ootolith was smaller when using the equation by Jones and Campana (2009) and thus, provided a more accurate prediction of the δ18Ootolith values.
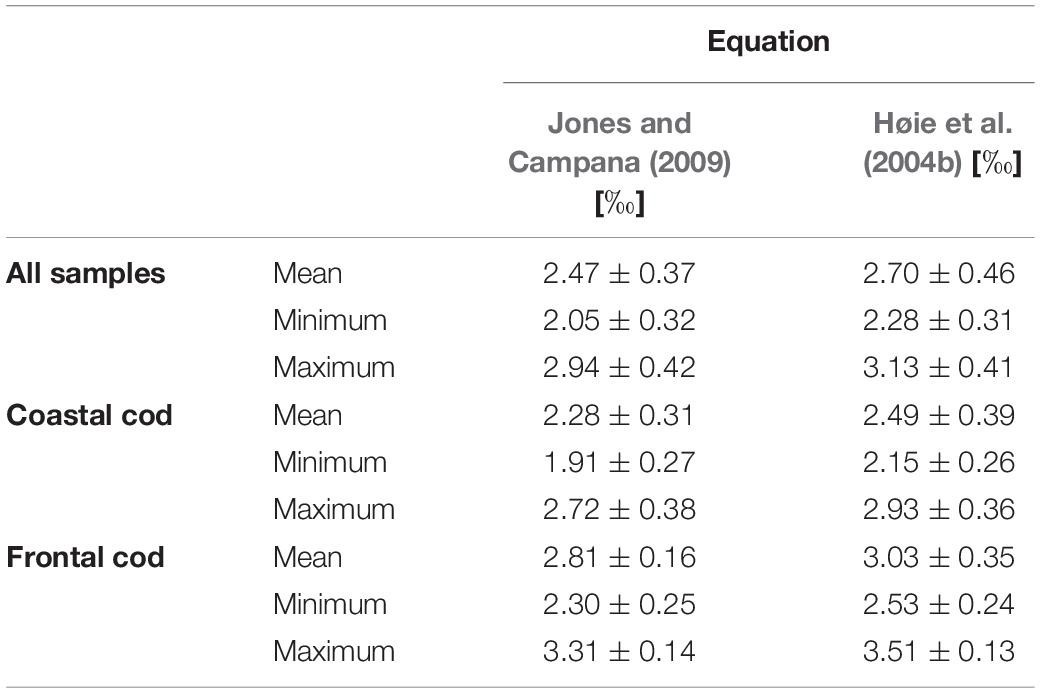
Table 4. Mean (± SD) predicted δ18Ootolith values using the temperature fractionation equations by Jones and Campana (2009) and Høie et al. (2004b).
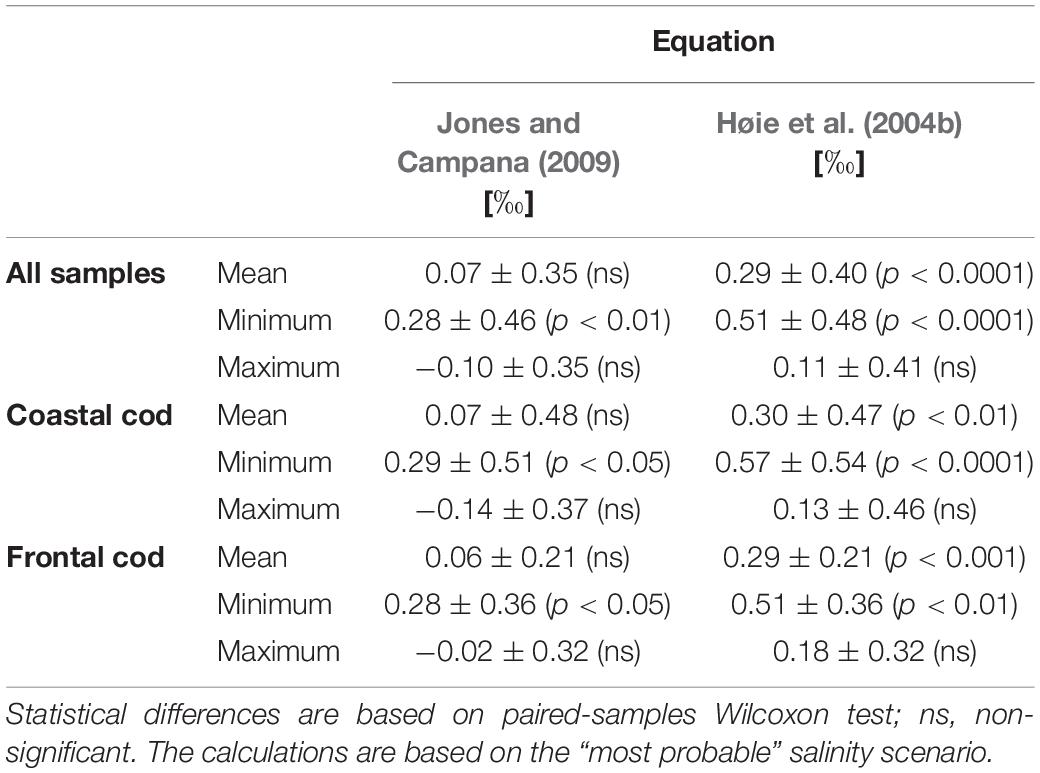
Table 5. Differences between predicted and measured means and extremes (minimum/maximum) δ18Ootolith values obtained for the DST-tagged cod when using either the temperature fractionation equation by Jones and Campana (2009) or the temperature fractionation equation for lab-reared Norwegian cod by Høie et al. (2004b).
The range of possible salinity environments for the tagged cod resulted in an overall uncertainty of 0.41‰ in the predicted δ18Ootolith values (Figure 5). Measured and predicted δ18Ootolith values were most similar under the “most probable salinity” and “minimum salinity” scenarios. The correspondence between measured and predicted δ18Ootolith was lower when applying the other salinity scenarios (difference between mean (± SD) predicted and measured δ18Ootolith for the different salinity scenarios (Figure 5); most probable salinity: 0.07 ± 0.35‰, minimum salinity: −0.03 ± 0.35‰, maximum salinity: 0.17 ± 0.35‰, salinity of 34.5: −0.19 ± 0.39‰, and salinity of 35.2: 0.21 ± 0.39‰).
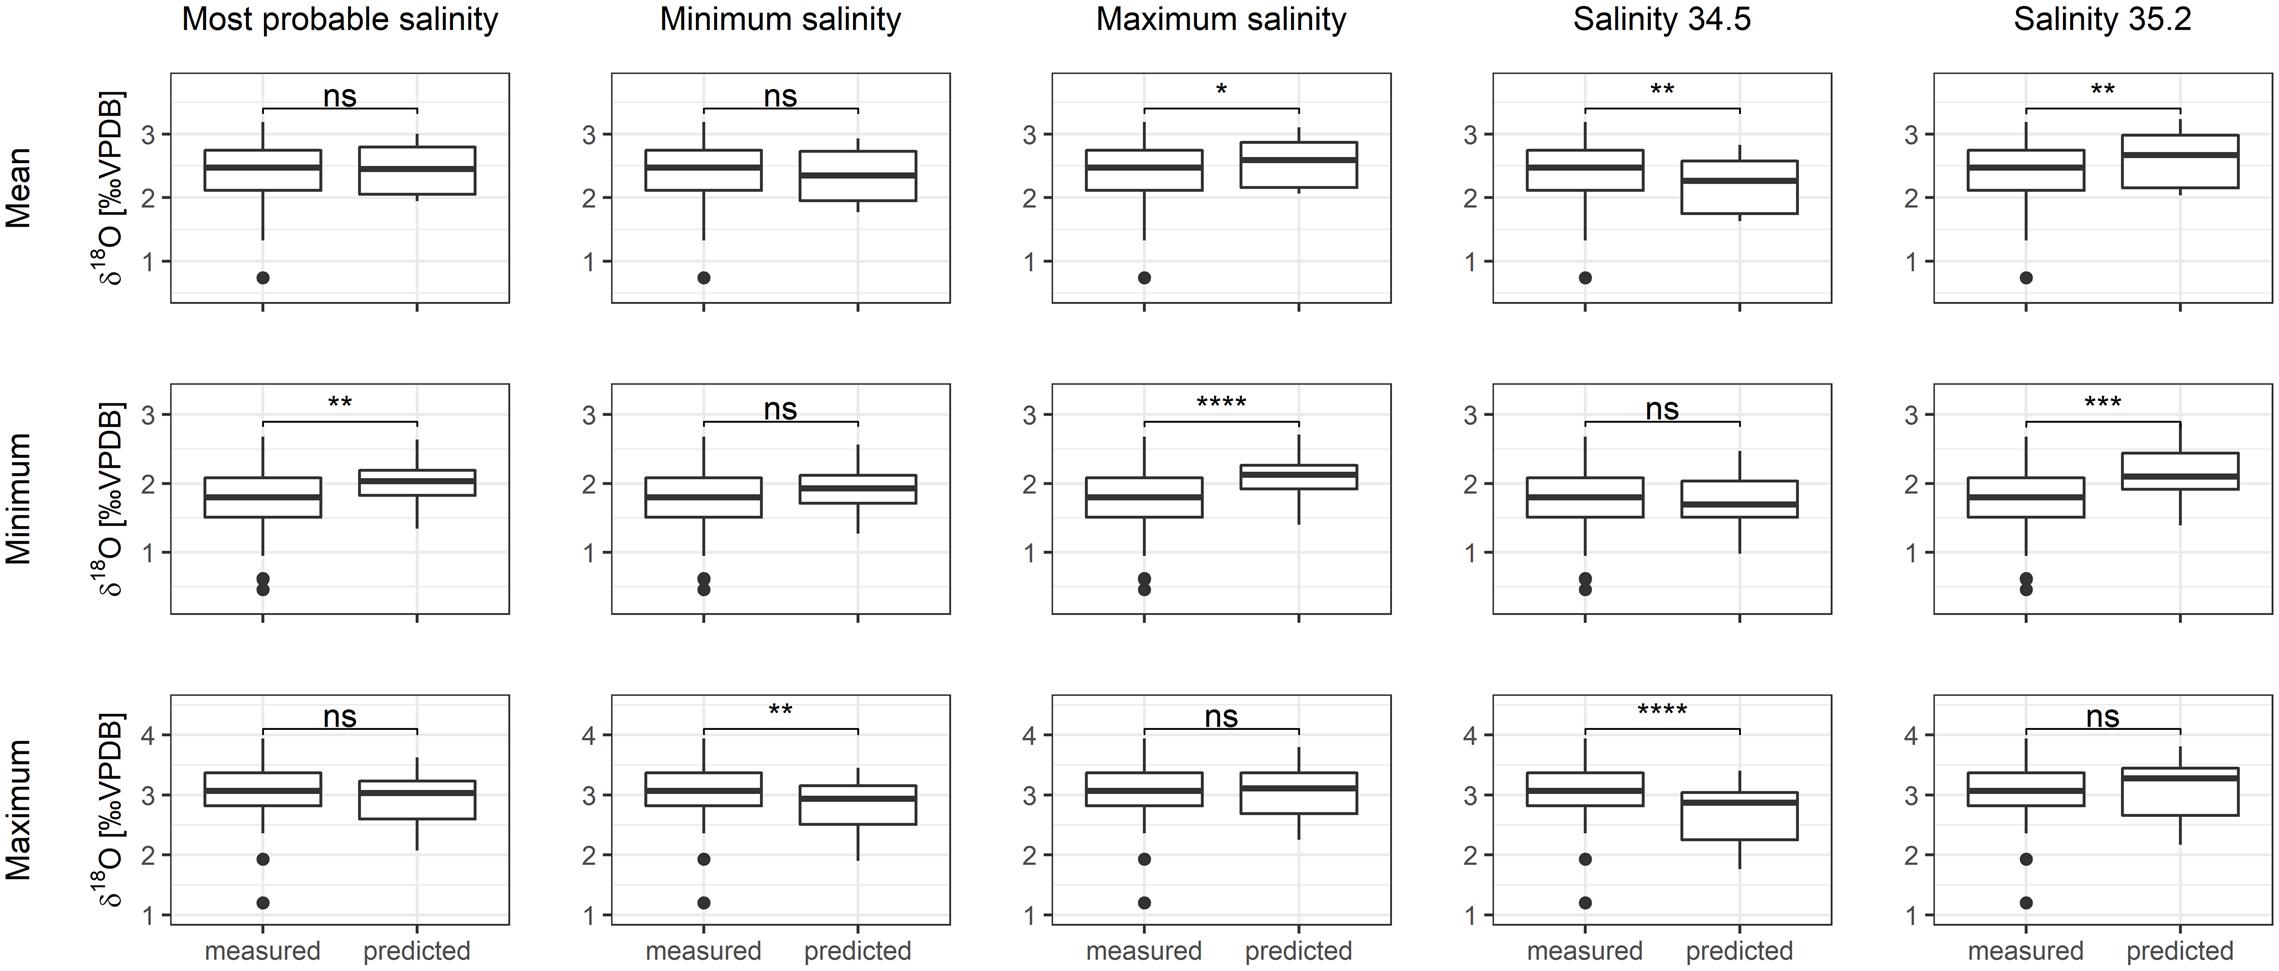
Figure 5. Measured and predicted δ18Ovalues in all DST-tagged cod otoliths assuming different salinity scenarios. Significance levels: ns, non-significant, *p < 0.05, **p < 0.01, ***p < 0.001 and ****p < 0.0001.
Secondary ion mass spectrometry-measured and predicted mean and extremes (minimum and maximum) were generally correlated (Figure 6 and Supplementary Figure 3). However, differences exceeded the SIMS measurement error for several tagged fish, irrespective of the ecotype. In the poorly correlated cases, the measured δ18Ootolith values were lower than the predicted δ18Ootolith values by a mean of 0.99‰. However, these measurements seemed to be implausible outliers as the required salinities (based on DST-recorded temperatures) have not previously been reported in fully marine water around Iceland. All of the outliers are from the (south)east and largely restricted to coastal cod.
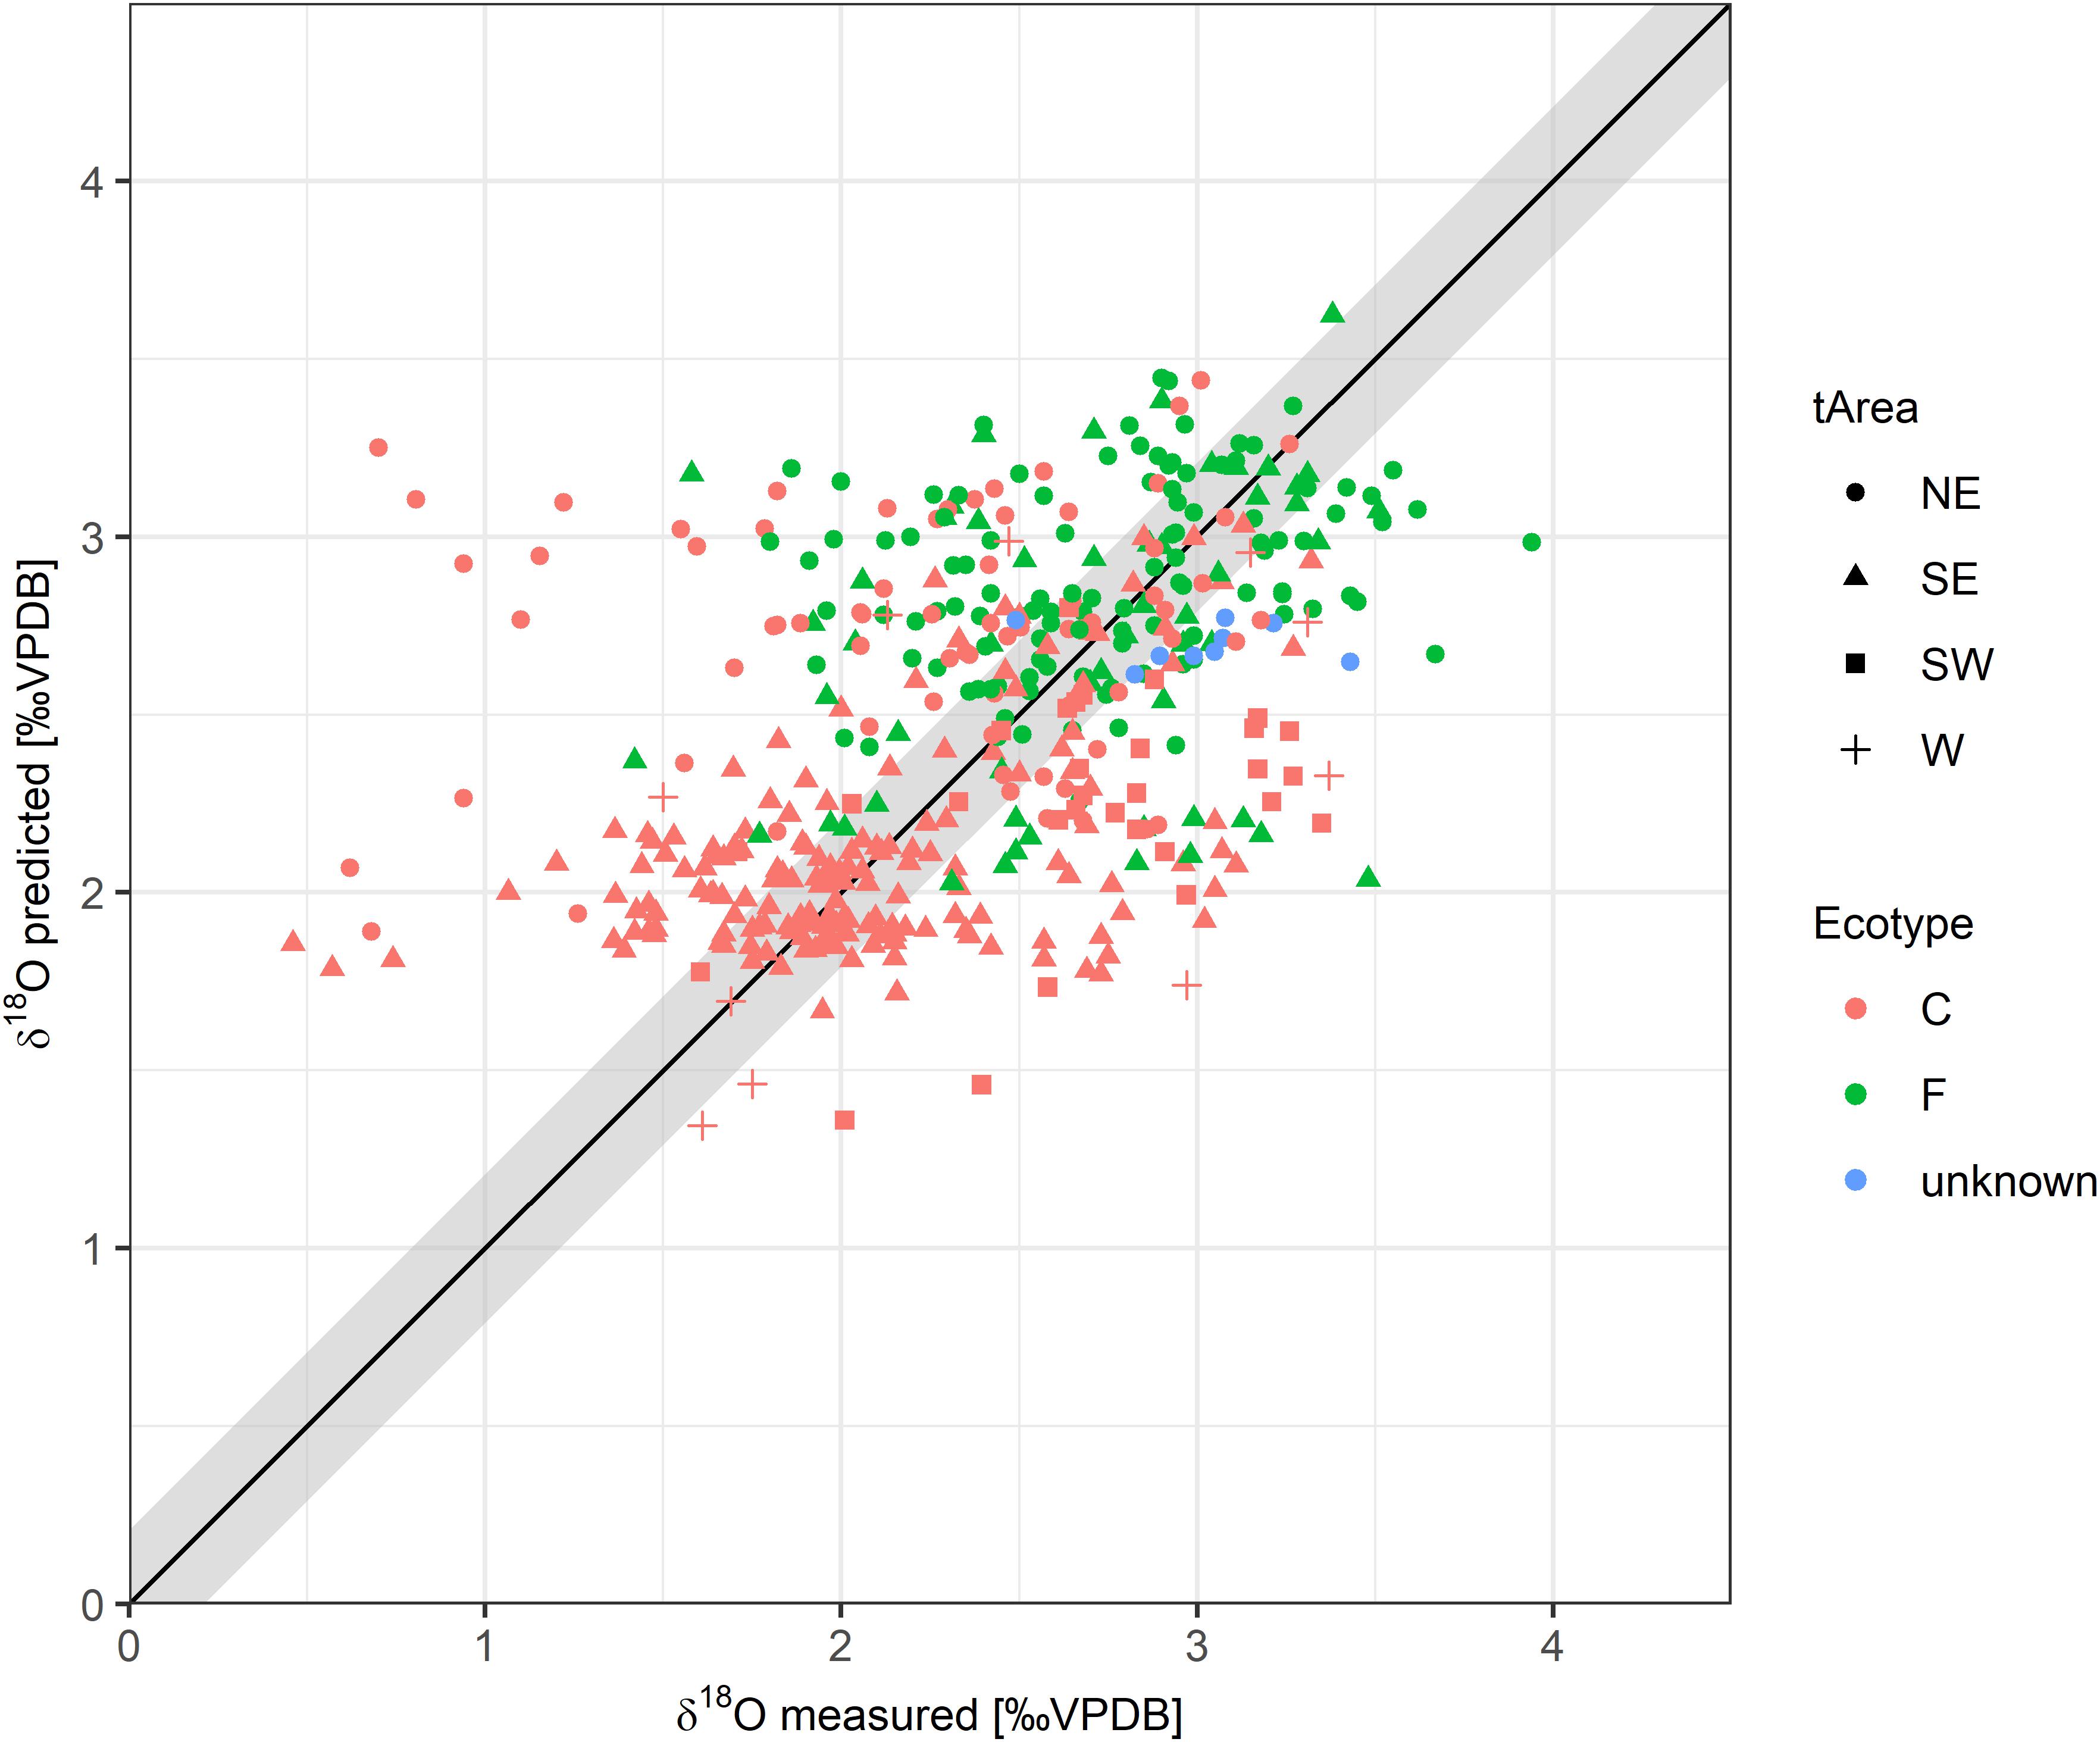
Figure 6. Predicted vs. measured δ18Ootolith values for all DST-tagged cod assuming linear otolith growth by tagging area (tArea) and ecotype (C, coastal; F, frontal). The gray area around the 1:1 line represents the approximate analytical error (0.2‰) of the SIMS measurement.
At maximum spatial resolution, measured and predicted δ18Ootolith values corresponded well and showed similar fluctuations (Figure 7). However, the predicted δ18Ootolith time series appeared more smoothed due to a limited temporal resolution of salinity data relative to the measured δ18Ootolith.
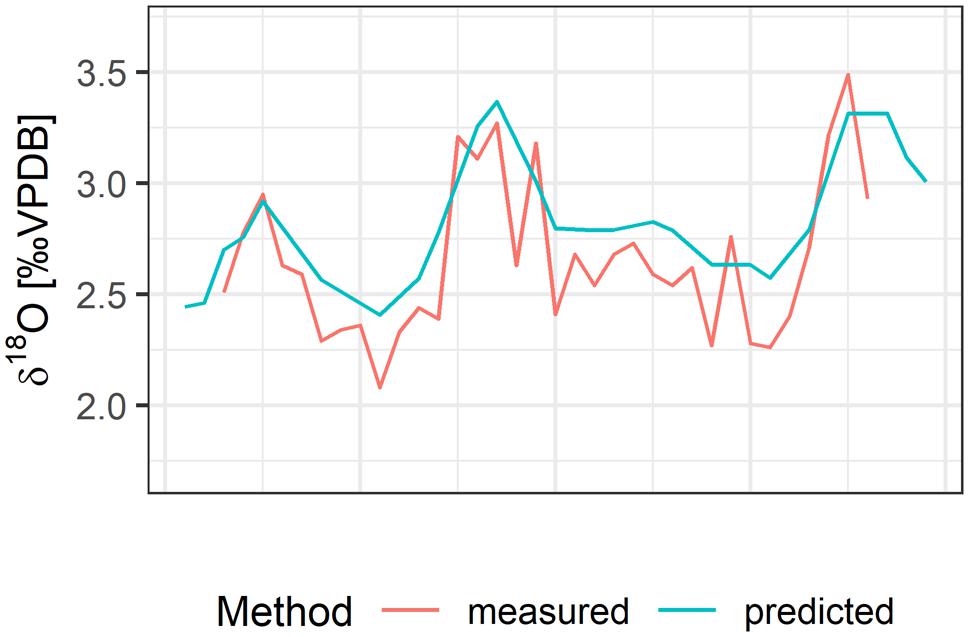
Figure 7. Example of the correspondence between measured and predicted δ18Ootolith in one otolith specimen (frontal cod, tagging and recapture area: northeast).
The correspondence of measured and predicted δ18Ootolith values improved when accounting for non-linear otolith growth (SC 2), however, a small divergence between measured and predicted δ18Ootolith values remained (Figure 8). The two growth scenarios SC 1 and SC 2 were significantly different when including both ecotypes (paired-sample Wilcoxon-test: V = 498, n = 37, p < 0.05) and for coastal cod (V = 246, n = 24, p < 0.01), but not for frontal cod V = 45, n = 13, p = non-significant).
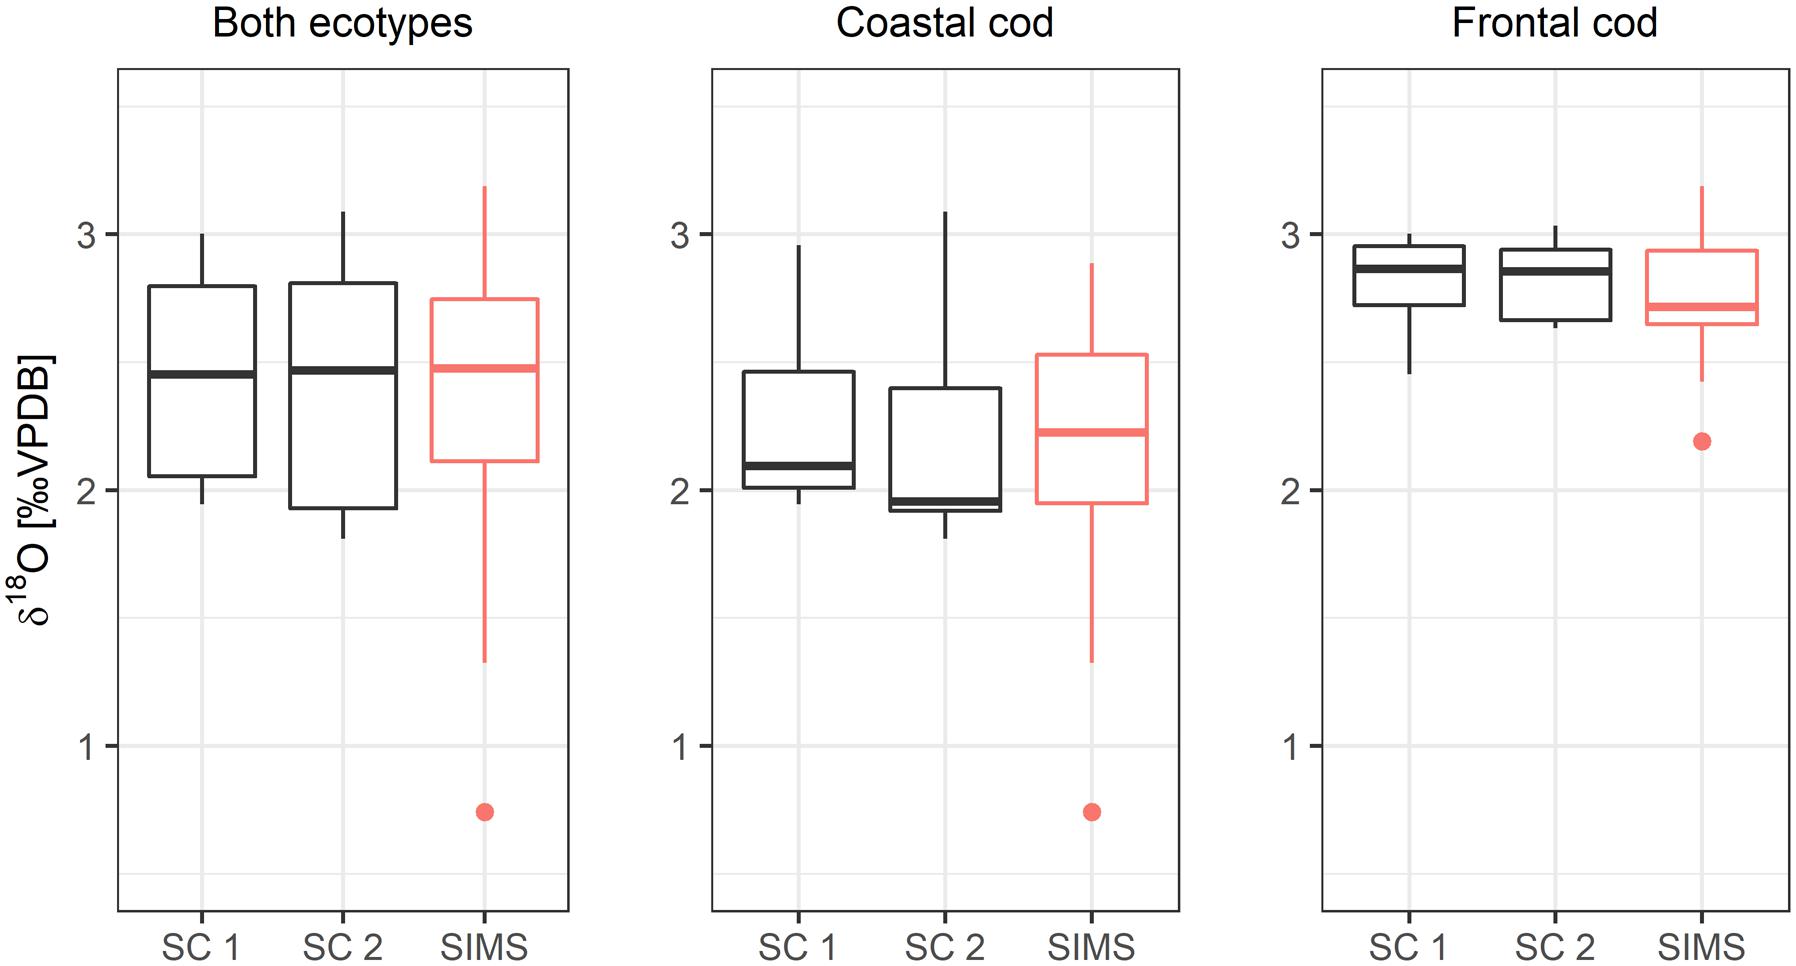
Figure 8. Predicted δ18Ootolith from each otolith growth scenario (SC 1, SC 2) compared with SIMS-analyzed δ18Ootolith values by ecotypes.
Discussion
Accuracy of Secondary Ion Mass Spectrometry-Measured δ18Ootolith Values as an Index of Temperature Exposure
Our results indicated that otoliths are well-suited as proxies for the temperature exposure of wild, free-swimming cod. Predicted δ18Ootolith values correlated well with those measured in the otolith by SIMS, especially for mean and maximum δ18O values. On the other hand, measured and predicted minimum δ18Ootolith values differed significantly. In general, the SIMS-measured δ18Ootolith values were lower, implying that the SIMS measurements were overestimating the ambient temperature (Rollion-Bard et al., 2007; Shirai et al., 2018). Overestimated ambient temperatures based on isotope-ratio mass spectrometry (IRMS) measurements in previous studies provided similar results, suggesting that this is probably a bias endemic to both of these analytical methods (Weidman and Millner, 2000; Geffen, 2012).
There are two possible reasons for the analytical bias causing the small divergence between measured and predicted δ18Ootolith values. One could be the matrix effect of the SIMS method, whereby the different chemical compositions and structures of the otolith relative to the reference material can introduce a bias [Hane et al. (2020) and references therein]. This matrix effect is unavoidable in the absence of a matrix-matched reference material had been available. Reliable biogenic aragonite references are not yet available, and calcite is used primarily to constrain the measurement reproducibility. Aragonite may also behave differently from calcite under a caesium (Cs) ion beam due to its different trace element chemistry [e.g., aragonite is commonly strontium (Sr) enriched while calcite reference material is typically low in trace elements]. While the calcite-based calibrations are therefore inaccurate, they were very precise, thus ensuring that all of the within-otolith and between-otoliths differences were accurate. There is no standard approach to correcting SIMS-analyzed otolith δ18O values that have been calibrated against a calcite standard. However, the offset factor of 1.62 applied in this study appeared to be the best of the different approaches and performed better than the offset factor of 1.58 (Table 3, scenario 1 which had the highest accuracy of corresponding salinity estimations). This correction is not perfect as an average value is applied, which does not consider inherent mass-balance and growth rate issues.
The estimation of ambient salinity and δ18Oseawater composition can introduce potential errors in temperature reconstructions. Despite the feeding migration of frontal cod and the accompanying salinity changes, the match of DST-recorded temperatures and respective salinity values was more accurate for frontal cod than for coastal cod. Frontal cod are mainly found offshore and in deeper waters where salinity fluctuations are less pronounced than in coastal areas (Thorsteinsson et al., 2012). Although coastal cod do not undergo significant feeding migrations, they do migrate along the coast. The broader range of measured δ18Ootolith values compared to predicted values suggested that cod experienced a broader range of environmental conditions than were assumed. This could be due to the fact that coastal cod were exposed to local salinity fluctuations, which were not represented in the quarterly salinity measurements conducted by the Marine and Freshwater Research Institute. Freshwater run-off by glaciers also causes salinity fluctuations, especially along the south coast of Iceland (Thórdardóttir, 1986). Incorrect salinity estimations could partly explain some of the implausible, low measured δ18Ootolith values. The salinity values needed to predict such low values are not found in fully marine water around Iceland, which usually range between 34.5 and 35.2. These outliers were always coastal cod, which are typically found in shallower waters closer to the shore, where they might have been exposed to freshwater runoff. This would have resulted in lower salinity values in the range of 31–33 needed to predict such low δ18Ootolith values. The uncertainty around the salinity estimates in combination with the calculation of the offset factor and the precision of the SIMS likely explain the observed difference between measured and predicted δ18Ootolith values. A salinity difference of 0.1 would result in a temperature difference of 0.3°C [using the equation by Jones and Campana (2009)]. However, the salinity estimates could only be improved if proxies for salinity were developed and/or DST-tags were capable of recording the salinity.
Potential Factors to Modify Measured and Predicted δ18O Values
Otolith stable oxygen isotopes are commonly applied to reconstruct the temperature exposure of fish, based on the assumption that the isotopic fractionation between otolith aragonite and the ambient water is in equilibrium (Kalish, 1991; Campana, 1999; Høie et al., 2003). Otolith δ13C values are strongly influenced by physiological processes (Kalish, 1991; Geffen, 2012), but experimental studies have shown that otolith δ18O values are driven mainly by ambient temperatures and is independent of fish metabolism (Thorrold et al., 1997; Høie et al., 2003). Other studies have suggested that physiological, kinetic, or metabolic processes (i.e., “vital effects”) influence temperature-dependent δ18O fractionation. Differences in the extent of temperature-dependent δ18O fractionation have been reported across life-stages, species, stocks, and across temperature-salinity combinations (Kalish, 1991; Thorrold et al., 1997; Høie et al., 2004b; Ghosh et al., 2007; Storm-Suke et al., 2007; Geffen, 2012; Darnaude et al., 2014). Although both cod-specific temperature fractionation equations reconstructed the ambient temperature of Atlantic cod relatively well (von Leesen et al., 2020), the temperature equation of Jones and Campana (2009) was slightly more accurate than that of Høie et al. (2004b). The mean difference between predicted δ18Ootolith values obtained with the two equations was 0.22‰, corresponding to a temperature difference of 1.1°C, with higher predicted δ18Ootolith values by Høie et al. (2004b). A possible reason for the difference in predicted values between the equations is that Høie et al. (2004b) was based on lab-reared juvenile cod at temperatures between 6 and 20°C. Although juvenile cod can tolerate temperatures of up to 20°C, the critical annual mean bottom temperature of cod is 12°C (Myers et al., 1997; Drinkwater, 2005). Icelandic cod, especially those off northern Iceland, are typically exposed to temperatures below 6°C all year around. Temperature-dependent fractionation of oxygen isotopes is close to that reported for inorganic aragonite at low temperatures, supporting the use of the Jones and Campana (2009) equation. Furthermore, all otoliths in this study were from mature fish and belonged to the same stock. Based on observations of vital effects in lab-reared fish, Darnaude et al. (2014) suggested that deviations between measured and predicted otolith δ18O values in wild fish are more pronounced because of the greater variation in environmental exposure and metabolic uptake. However, our results showed that the isotopic composition of otoliths from wild, free-swimming cod is an accurate index of temperature exposure with no apparent evidence of vital effects.
Incorrect ambient salinity estimations can be a source of error in otolith-based temperature reconstructions. Geo-locations and migrations paths of individual fish were estimated based on known ecotype, their known migration paths, the tagging and recapture position, and the depth profile recorded by DST tags. Wrongly assigned geo-locations could cause incorrect salinity estimations resulting in inaccurately predicted δ18Ootolith values (Darnaude et al., 2014). However, a salinity sensitivity analysis showed that the assumed (“most probable”) salinity had the best correspondence between measured and predicted δ18Ootolith values. A second potential source of error was the back-calculation of δ18Oseawater values based on an area-specific salinity mixing line. Direct measurements of δ18Oseawater are rarely available, and thus, the area-specific salinity mixing line is a well-established method to overcome the data limitation. Oceanographic conditions that influence the water chemistry change over long time periods and thus, were assumed to be negligible in this study. A third potential source of error was the influence of seasonal temperature variations on the otolith accretion rate, resulting in non-linear otolith growth and the over- or under-estimation of calcium carbonate accretion in certain months. The importance of intra-annual variation in otolith growth has been mentioned previously when predicting δ18Ootolith values of wild fish (Darnaude et al., 2014). However, intra-population variations in otolith deposition rates and/or metabolic differences across populations (i.e., the occurrence of vital effects) were also observed. An assumption of non-linear otolith growth in our study generally improved the correspondence of measured and predicted δ18Ootolith, particularly of frontal cod. Our results suggested that intra-annual differences in the otolith accretion rate might be less pronounced in coastal cod. Ecotype-specific accretion rates could be due to their different temperature exposure with lower intra-annual temperature variation experienced by coastal cod, as temperature seems to drive the accretion rate of otolith growth.
To our knowledge, this is the first study that has groundtruthed the accuracy of temperature reconstructions based on routine in situ SIMS otolith oxygen isotope assays of wild, free-swimming fish. Our results confirm that otoliths are well-suited as proxies for ambient temperature reconstructions. Although mean temperature exposures were accurately estimated in our study, the maximum temperatures were sometimes overestimated, an issue which affected absolute accuracy but not relative temperature changes. Although archival tags are also capable of providing temperature history, they can be limited by low or location-specific recapture rates, which is not an issue with otoliths. Indeed, the wide availability of otoliths makes them particularly suitable for paleotemperature studies.
Isotope-ratio mass spectrometry and SIMS both provide δ18O-based temperature reconstructions, but both approaches have advantages and disadvantages. Although classical IRMS measurements are less expensive than SIMS assays, SIMS assays offer a higher temporal-spatial resolution of otoliths. SIMS measurements enable the investigation of weekly or even daily resolution (depending on otolith growth rate), while micromilling (IRMS) allows sub-annual (monthly) resolution at its best. Moreover, IRMS requires larger amounts of sample material than SIMS, resulting in unintended temporal averaging of IRMS δ18Ootolith values. Furthermore, to obtain the required sample weight (usually ∼ 50 μg), IRMS samples drill deeper, resulting in the mixing of different accretion layers due to the three-dimensional structure of otoliths. On the other hand, SIMS measurements suffer from the general lack of a reliable aragonite reference material, while IRMS does not. Thus, the use of SIMS is recommended when the calcite-aragonite bias can be corrected, as is the case here, or only relative temperature changes are of interest.
Data Availability Statement
The original contributions presented in the study are included in the article/Supplementary Material, further inquiries can be directed to the corresponding author.
Ethics Statement
The license for operations on fish (No. 0304-1901) was issued by the Icelandic Committee for Welfare of Experimental Animals, Chief Veterinary Office at the Ministry of Agriculture, Reykjavik, Iceland.
Author Contributions
GvL and SC: conceptualization. GvL: formal analysis and writing – original draft. SC: funding acquisition. GvL, HB, and MW: investigation. GvL, HB, SH, MW, and SC: writing – review and editing. All authors contributed to the article and approved the submitted version.
Funding
Funding for this study was provided by the Icelandic Research Fund grant 173906-051 to SC and the Eimskip University Fund (project number: 1535-1533127) to GvL. Funding for NordSIMS by the Swedish Museum of Natural History, Swedish Research Council (infrastructure grant 2017-00671) and the University of Iceland is also acknowledged.
Conflict of Interest
The authors declare that the research was conducted in the absence of any commercial or financial relationships that could be construed as a potential conflict of interest.
Publisher’s Note
All claims expressed in this article are solely those of the authors and do not necessarily represent those of their affiliated organizations, or those of the publisher, the editors and the reviewers. Any product that may be evaluated in this article, or claim that may be made by its manufacturer, is not guaranteed or endorsed by the publisher.
Acknowledgments
We owe thanks to the Marine and Freshwater Research Institute for providing the otoliths of DST-tagged cod and the DST data. Special thanks to Kerstin Lindén and Heejin Jeon (both NordSIMS laboratory, Department of Geosciences, Swedish Museum of Natural History) for their support with the SIMS measurements; this is NordSIMS publication 691. We thank Alberto Caracciolo for his help with preparing the SIMS sample mounts.
Supplementary Material
The Supplementary Material for this article can be found online at: https://www.frontiersin.org/articles/10.3389/fmars.2021.698908/full#supplementary-material
Footnotes
References
Bardarson, H., McAdam, B. J., Thorsteinsson, V., Hjorleifsson, E., and Marteinsdottir, G. (2017). Otolith shape differences between ecotypes of Icelandic cod (Gadus morhua) with known migratory behaviour inferred from data storage tags. Can. J. Fish. Aquat. Sci. 74, 2122–2130.1. doi: 10.1139/cjfas-2016-0307
Bemis, B. E., Spero, H. J., Bijma, J., and Lea, D. W. (1998). Reevaluation of the oxygen isotopic composition of planktonic foraminifera: experimental results and revised paleotemperature equations. Paleoceanography 13, 150–160. doi: 10.1029/98PA00070
Campana, S. E. (1999). Chemistry and composition of fish otoliths: pathways, mechanisms and applications. Mar. Ecol. Prog. Ser. 188, 263–297. doi: 10.3354/meps188263
Campana, S. E., and Thorrold, S. R. (2001). Otoliths, increments, and elements: keys to a comprehensive understanding of fish populations? Can. J. Fish. Aquat. Sci. 58, 30–38. doi: 10.1139/f00-177
Darnaude, A. M., Sturrock, A., Trueman, C. N., Mouillot, D., Campana, S. E., and Hunter, E. (2014). Listening in on the past: what can otolith δ18O values really tell us about the environmental history of fishes? PLoS One 9:e108539. doi: 10.1371/journal.pone.0108539
Drinkwater, K. F. (2005). The response of Atlantic cod (Gadus morhua) to future climate change. ICES J. Mar. Sci. 62, 1327–1337. doi: 10.1016/j.icesjms.2005.05.015
Drinkwater, K. F., Beaugrand, G., Kaeriyama, M., Kim, S., Ottersen, G., Perry, R. I., et al. (2010). On the processes linking climate to ecosystem changes. J. Mar. Syst. 79, 374–388. doi: 10.1016/j.jmarsys.2008.12.014
Geffen, A. J. (2012). Otolith oxygen and carbon stable isotopes in wild and laboratory-reared plaice (Pleuronectes platessa). Environ. Biol. Fishes 95, 419–430.1. doi: 10.1007/s10641-012-0033-2
Ghosh, P., Eiler, J., Campana, S. E., and Feeney, R. F. (2007). Calibration of the carbonate ‘clumped isotope’ paleothermometer for otoliths. Geochim. Cosmochim. Acta 71, 2736–2744. doi: 10.1016/j.gca.2007.03.015
Grabowski, T. B., Thorsteinsson, V., McAdam, B. J., and Marteinsdóttir, G. (2011). Evidence of segregated spawning in a single marine fish stock: sympatric divergence of ecotypes in Icelandic cod? PLoS One 6:e17528. doi: 10.1371/journal.pone.0017528
Grossman, E. L. (2012). Applying oxygen isotope paleothermometry in deep time. Paleontol. Soc. Pap. 18, 39–68.1. doi: 10.1017/S1089332600002540
Hane, Y., Kimura, S., Yokoyama, Y., Miyairi, Y., Ushikubo, T., Ishimura, T., et al. (2020). Reconstruction of temperature experienced by Pacific bluefin tuna Thunnus orientalis larvae using SIMS and microvolume CF-IRMS otolith oxygen isotope analyses. Mar. Ecol. Prog. Ser. 649, 175–188. doi: 10.3354/meps13451
Helser, T. E., Kastelle, C. R., McKay, J. L., Orland, I. J., Kozdon, R., and Valley, J. W. (2018). Evaluation of micromilling/conventional isotope ratio mass spectrometry and secondary ion mass spectrometry of δ18O values in fish otoliths for sclerochronology. Rapid Commun. Mass Spectrom. 32, 1781–1790.1. doi: 10.1002/rcm.8231
Høie, H., Folkvord, A., and Otterlei, E. (2003). Effect of somatic and otolith growth rate on stable isotopic composition of early juvenile cod (Gadus morhua L) otoliths. J. Exp. Mar. Biol. Ecol. 289, 41–58. doi: 10.1016/S0022-0981(03)00034-0
Høie, H., Otterlei, E., and Folkvord, A. (2004b). Temperature-dependent fractionation of stable oxygen isotopes in otoliths of juvenile cod (Gadus morhua L.). ICES J. Mar. Sci. 61, 243–251. doi: 10.1016/j.icesjms.2003.11.006
Høie, H., Andersson, C., Folkvord, A., and Karlsen, Ø (2004a). Precision and accuracy of stable isotope signals in otoliths of pen-reared cod (Gadus morhua) when sampled with a high-resolution micromill. Mar. Biol. 144, 1039–1049. doi: 10.1007/s00227-003-1275-5
IPCC (2013). Climate Change 2013: The Physical Science Basis. Contribution of Working Group I to the 5th Assessment Report of the Intergovernmental Panel on Climate Change. Cambridge: Cambridge University Press. doi: 10.1017/CBO9781107415324
Jones, J. B., and Campana, S. E. (2009). Stable oxygen isotope reconstruction of ambient temperature during the collapse of a cod (Gadus morhua) fishery. Ecol. Appl. 19, 1500–1514. doi: 10.1890/07-2002.1
Jónsson, J. (1996). Tagging of cod (Gadus morhua) in Icelandic waters 1948-1986. Rit Fiskideildar 14, 1–82.
Kalish, J. M. (1991). 13C and 18O isotopic disequilibria in fish otoliths: metabolic and kinetic effects. Mar. Ecol. Prog. Ser. 75, 191–203. doi: 10.3354/meps075191
Kim, S.-T., and O’Neil, J. R. (1997). Equilibrium and nonequilibrium oxygen isotope effects in synthetic carbonates. Geochim. Cosmochim. Acta 61, 3461–3475. doi: 10.1016/S0016-7037(97)00169-5
Kotov, S., and Paelike, H. (2018). “QAnalySeries-a cross-platform time series tuning and analysis tool,” in Proceedings of the AGU Fall Meeting Abstracts PP53D-1230, Washington, DC. doi: 10.1002/essoar.10500226.1
Marchitto, T. M., Curry, W. B., Lynch-Stieglitz, J., Bryan, S. P., Cobb, K. M., and Lund, D. C. (2014). Improved oxygen isotope temperature calibrations for cosmopolitan benthic foraminifera. Geochim. Cosmochim. Acta 130, 1–11. doi: 10.1016/j.gca.2013.12.034
Marteinsdottir, G., Gunnarsson, B., and Suthers, I. M. (2000). Spatial variation in hatch date distributions and origin of pelagic juvenile cod in Icelandic waters. ICES J. Mar. Sci. 57, 1182–1195.1. doi: 10.1006/jmsc.2000.0880
Myers, R. A., Mertz, G., and Fowlow, P. S. (1997). Maximum population growth rates and recovery times for Atlantic cod, Gadus morhua. Fish. Bull. 95, 762–772.
Neuenfeldt, S., Righton, D., Neat, F., Wright, P. J., Svedäng, H., Michalsen, K., et al. (2013). Analysing migrations of Atlantic cod Gadus morhua in the north-east Atlantic Ocean: then, now and the future. J. Fish Biol. 82, 741–763. doi: 10.1111/jfb.12043
Ottersen, G., Kim, S., Huse, G., Polovina, J. J., and Stenseth, N. C. (2010). Major pathways by which climate may force marine fish populations. J. Mar. Syst. 79, 343–360. doi: 10.1016/j.jmarsys.2008.12.013
Pálsson, ÓK., and Thorsteinsson, V. (2003). Migration patterns, ambient temperature, and growth of Icelandic cod (Gadus morhua): evidence from storage tag data. Can. J. Fish. Aquat. Sci. 60, 1409–1423. doi: 10.1139/f03-117
Pampoulie, C., Daníelsdóttir, A. K., Thorsteinsson, V., Hjörleifsson, E., Marteinsdóttir, G., and Ruzzante, D. E. (2012). The composition of adult overwintering and juvenile aggregations of Atlantic cod (Gadus morhua) around Iceland using neutral and functional markers: a statistical challenge. Can. J. Fish. Aquat. Sci. 69, 307–320.1. doi: 10.1139/f2011-151
Pampoulie, C., Jakobsdóttir, K. B., Marteinsdóttir, G., and Thorsteinsson, V. (2008). Are vertical behaviour patterns related to the pantophysin locus in the Atlantic Cod (Gadus morhua L.)? Behav. Genet. 38, 76–81.1. doi: 10.1007/s10519-007-9175-y
Pilling, G. M., Millner, R. S., Easey, M. W., Maxwell, D. L., and Tidd, A. N. (2007). Phenology and North Sea cod Gadus morhua L.: has climate change affected otolith annulus formation and growth? J. Fish Biol. 70, 584–599.1. doi: 10.1111/j.1095-8649.2007.01331.x
R Core Team (2019). R: A Language and Environment for Statistical Computing, 3.6.0 Edn. Vienna: R Foundation for Statistical Computing.
Righton, D., and Mills, C. M. (2008). Reconstructing the movements of free-ranging demersal fish in the North Sea: a data-matching and simulation method. Mar. Biol. 153, 507–521.1. doi: 10.1007/s00227-007-0818-6
Rollion-Bard, C., Mangin, D., and Champenois, M. (2007). Development and application of oxygen and carbon isotopic measurements of biogenic carbonates by ion microprobe. Geostand. Geoanal. Res. 31, 39–50. doi: 10.1111/j.1751-908X.2007.00834.x
Shirai, K., Otake, T., Amano, Y., Kuroki, M., Ushikubo, T., Kita, N. T., et al. (2018). Temperature and depth distribution of Japanese eel eggs estimated using otolith oxygen stable isotopes. Geochim. Cosmochim. Acta 236, 373–383. doi: 10.1016/j.gca.2018.03.006
Storm-Suke, A., Dempson, J. B., Reist, J. D., and Power, M. (2007). A field-derived oxygen isotope fractionation equation for Salvelinus species. Rapid Commun. Mass Spectrom. 21, 4109–4116. doi: 10.1002/rcm.3320
Thórdardóttir, T. (1986). Timing and Duration of Spring Blooming South and Southwest of Iceland. Berlin: Springer, 345–360. doi: 10.1007/978-3-642-70886-2_25
Thorrold, S. R., Campana, S. E., Jones, C. M., and Swart, P. K. (1997). Factors determining δ13C and δ18O fractionation in aragonitic otoliths of marine fish. Geochim. Cosmochim. Acta 61, 2909–2919. doi: 10.1016/S0016-7037(97)00141-5
Thorsteinsson, V., Pálsson, ÓK., Tómasson, G. G., Jónsdóttir, I. G., and Pampoulie, C. (2012). Consistency in the behaviour types of the Atlantic cod: repeatability, timing of migration and geo-location. Mar. Ecol. Prog. Ser. 462, 251–260. doi: 10.3354/meps09852
von Leesen, G., Ninnemann, U. S., and Campana, S. E. (2020). Stable oxygen isotope reconstruction of temperature exposure of the Icelandic cod (Gadus morhua) stock over the last 100 years. ICES J. Mar. Sci. 77, 942–952.1. doi: 10.1093/icesjms/fsaa011
Wang, T., Surge, D., and Walker, K. J. (2013). Seasonal climate change across the Roman Warm Period/Vandal Minimum transition using isotope sclerochronology in archaeological shells and otoliths, southwest Florida, USA. Quat. Int. 308-309, 230–241. doi: 10.1016/j.quaint.2012.11.013
Weidman, C. R., and Millner, R. (2000). High-resolution stable isotope records from North Atlantic cod. Fish. Res. 46, 327–342. doi: 10.1016/S0165-7836(00)00157-0
West, C. F., Wischniowski, S., and Johnston, C. (2012). Pacific cod (Gadus macrocephalus) as a paleothermometer: otolith oxygen isotope reconstruction. J. Archaeol. Sci. 39, 3277–3283. doi: 10.1016/j.jas.2012.05.009
Keywords: accuracy, Atlantic cod, DST-tags, SIMS, stable oxygen isotopes
Citation: von Leesen G, Bardarson H, Halldórsson SA, Whitehouse MJ and Campana SE (2021) Accuracy of Otolith Oxygen Isotope Records Analyzed by SIMS as an Index of Temperature Exposure of Wild Icelandic Cod (Gadus morhua). Front. Mar. Sci. 8:698908. doi: 10.3389/fmars.2021.698908
Received: 22 April 2021; Accepted: 17 September 2021;
Published: 11 October 2021.
Edited by:
Pedro Morais, University of Algarve, PortugalReviewed by:
Sharon Z. Herzka, Center for Scientific Research and Higher Education in Ensenada (CICESE), MexicoJaclyn Hill, Maurice Lamontagne Institute, Fisheries and Oceans Canada, Canada
Copyright © 2021 von Leesen, Bardarson, Halldórsson, Whitehouse and Campana. This is an open-access article distributed under the terms of the Creative Commons Attribution License (CC BY). The use, distribution or reproduction in other forums is permitted, provided the original author(s) and the copyright owner(s) are credited and that the original publication in this journal is cited, in accordance with accepted academic practice. No use, distribution or reproduction is permitted which does not comply with these terms.
*Correspondence: Gotje von Leesen, Z290amUudm9uLmxlZXNlbkBiaW8uYXUuZGs=
†Present address: Gotje von Leesen, Department of Biology, Aquatic Biology, Aarhus University, Aarhus, Denmark