 Ruping Ge1,2†
 Hongju Chen
 Yunyun Zhuang
 Guangxing Liu
- 1Key Laboratory of Marine Environment and Ecology, Ministry of Education, Ocean University of China, Qingdao, China
- 2Laboratory for Marine Ecology and Environmental Science, Qingdao National Laboratory for Marine Science and Technology, Qingdao, China
The active carbon flux mediated by diel vertical migration (DVM) of zooplankton is an important component of the downward carbon flux in the ocean. However, active fluxes transported by zooplankton DVM are poorly known in the South China Sea (SCS) and the Western Philippine Sea (WPS). In this study, active carbon fluxes in the SCS and WPS were evaluated on the basis of the data of mesozooplankton community and DVM at two stations of these areas. The mesozooplankton community in the SCS was obviously different from that in the WPS, and higher species number and abundance in the SCS were observed, which may be related to the higher chlorophyll a (Chl a) concentration and the wide gradients of temperature and salinity in this sea. Moreover, shallow depth Chl a maximum and strong thermocline were detected in the SCS, causing lower migration amplitudes of mesozooplankton in the SCS than those in the WPS. However, the migrant biomass of mesozooplankton in the SCS was 98.40 mg C m–2, higher than that in the WPS at 25.12 mg C m–2. The mesozooplankton active carbon flux in the SCS (4.64 mg C m–2⋅d–1) was also higher than that in the WPS (1.80 mg C m–2⋅d–1). The mesozooplankton active fluxes were equivalent to 8.3 and 8.1% of the total flux (active flux plus passive flux) of the SCS and WPS, respectively, and they play an important role in the biological pump functioning in the two regions.
Introduction
The biological pump is one of the most important paths that transport carbon from the euphotic zone to the mesopelagic layer (Hernández-León et al., 2019b; Pakhomov et al., 2019). Diel vertical migration (DVM) of zooplankton is an important component of the biological pump; it mediates the carbon export referred to as active flux (Steinberg and Landry, 2017). The active carbon flux carried by migrant zooplankton represented a considerable percentage (more than 50% in some cases) of the total carbon flux (Longhurst et al., 1990; Steinberg et al., 2000; Al-Mutairi and Landry, 2001; Hidaka et al., 2001). Active carbon fluxes transported by zooplankton DVM have been recorded worldwide (Steinberg et al., 2000, 2002; Al-Mutairi and Landry, 2001; Hidaka et al., 2001; Stukel et al., 2013), indicating that active fluxes varied significantly in different marine systems with distinct hydrological properties. The process of zooplankton DVM is generally influenced by temperature, food, or thermohaline barriers (Hays, 2003), and the response of zooplankton to these factors varies among taxa in spatial and temporal ranges (Irigoien et al., 2004), leading to the variation of active fluxes in different water regions.
The South China Sea (SCS) and the Western Philippine Sea (WPS) are located in the Western Pacific, and they belong to the oligotrophic marginal sea. The proportion of zooplankton active flux in the total carbon flux is generally higher in the oligotrophic marine systems than in the meso- and eutrophic regions (Al-Mutairi and Landry, 2001; Steinberg and Landry, 2017; Yebra et al., 2018; Hernández-León et al., 2019b). The passive carbon fluxes (particle organic carbon, POC) in the SCS and WPS have been well documented (Chen et al., 1998; Hung and Gong, 2007; Ma et al., 2008; Cai et al., 2015; Zhang et al., 2019; Tan et al., 2020). In summer, the passive carbon flux in the oligotrophic basin region (51.6 mg C m–2 d–1) was lower than that in the costal (368.4 mg C m–2 d–1) and shelf (128.4 mg C m–2 d–1) regions in the SCS (Cai et al., 2015), and it was higher than that in the WPS (20.1 mg C m–2 d–1; Hung and Gong, 2007). In addition, the nutrients (such as phosphate and nitrate) in the SCS were higher than those in the WPS (Wu et al., 2003; Shiozaki et al., 2015). However, the knowledge of active fluxes transported by zooplankton DVM in the SCS and WPS is limited, and the difference in zooplankton active flux between the SCS and WPS is not clear.
During July to August 2017, we conducted an observational study in SCS and WPS, to examine mesozooplankton DVM and their contributions to the vertical active carbon flux in these oligotrophic waters. We addressed two key questions with our study:
(1) How much is the active flux contributed by mesozooplankton DVM in SCS and WPS?
(2) What is the difference of active flux between SCS and WPS? What causes these differences?
Materials and Methods
Sampling Procedures and Samples Analysis
Sampling was carried out on board R/V “Dong Fang Hong 2” at stations A (123.09° E, 22.10° N, water depth ca. 3,030 m) in the SCS on 14–15 July 2017 (local time: daytime, 13:30; nighttime, 01:30) and station B (115.00° E, 15.20° N, water depth ca. 4,260 m) in the WPS on 4 August 2017 (local time: daytime, 08:30; nighttime, 21:30). The locations of these two stations and the surface currents in these areas are shown in Figure 1. Samples were collected from five strata (0–30, 30–50, 50–100, 100–200, and 200–300 m) by using a multinet plankton sampler system (MultiNet, HYDRO-BIOS, mouth opening of 0.25 m2, mesh size of 200 μm) during day and night at these two stations. The towing speed was 0.5–1.0 m⋅s–1. The MultiNet was equipped with two flowmeters (HYDRO-BIOS) to measure the filtered water volume. The zooplankton samples were preserved in 4% buffered formalin-seawater solution immediately after each towing. A total of 10 samples were obtained for each sampling site.
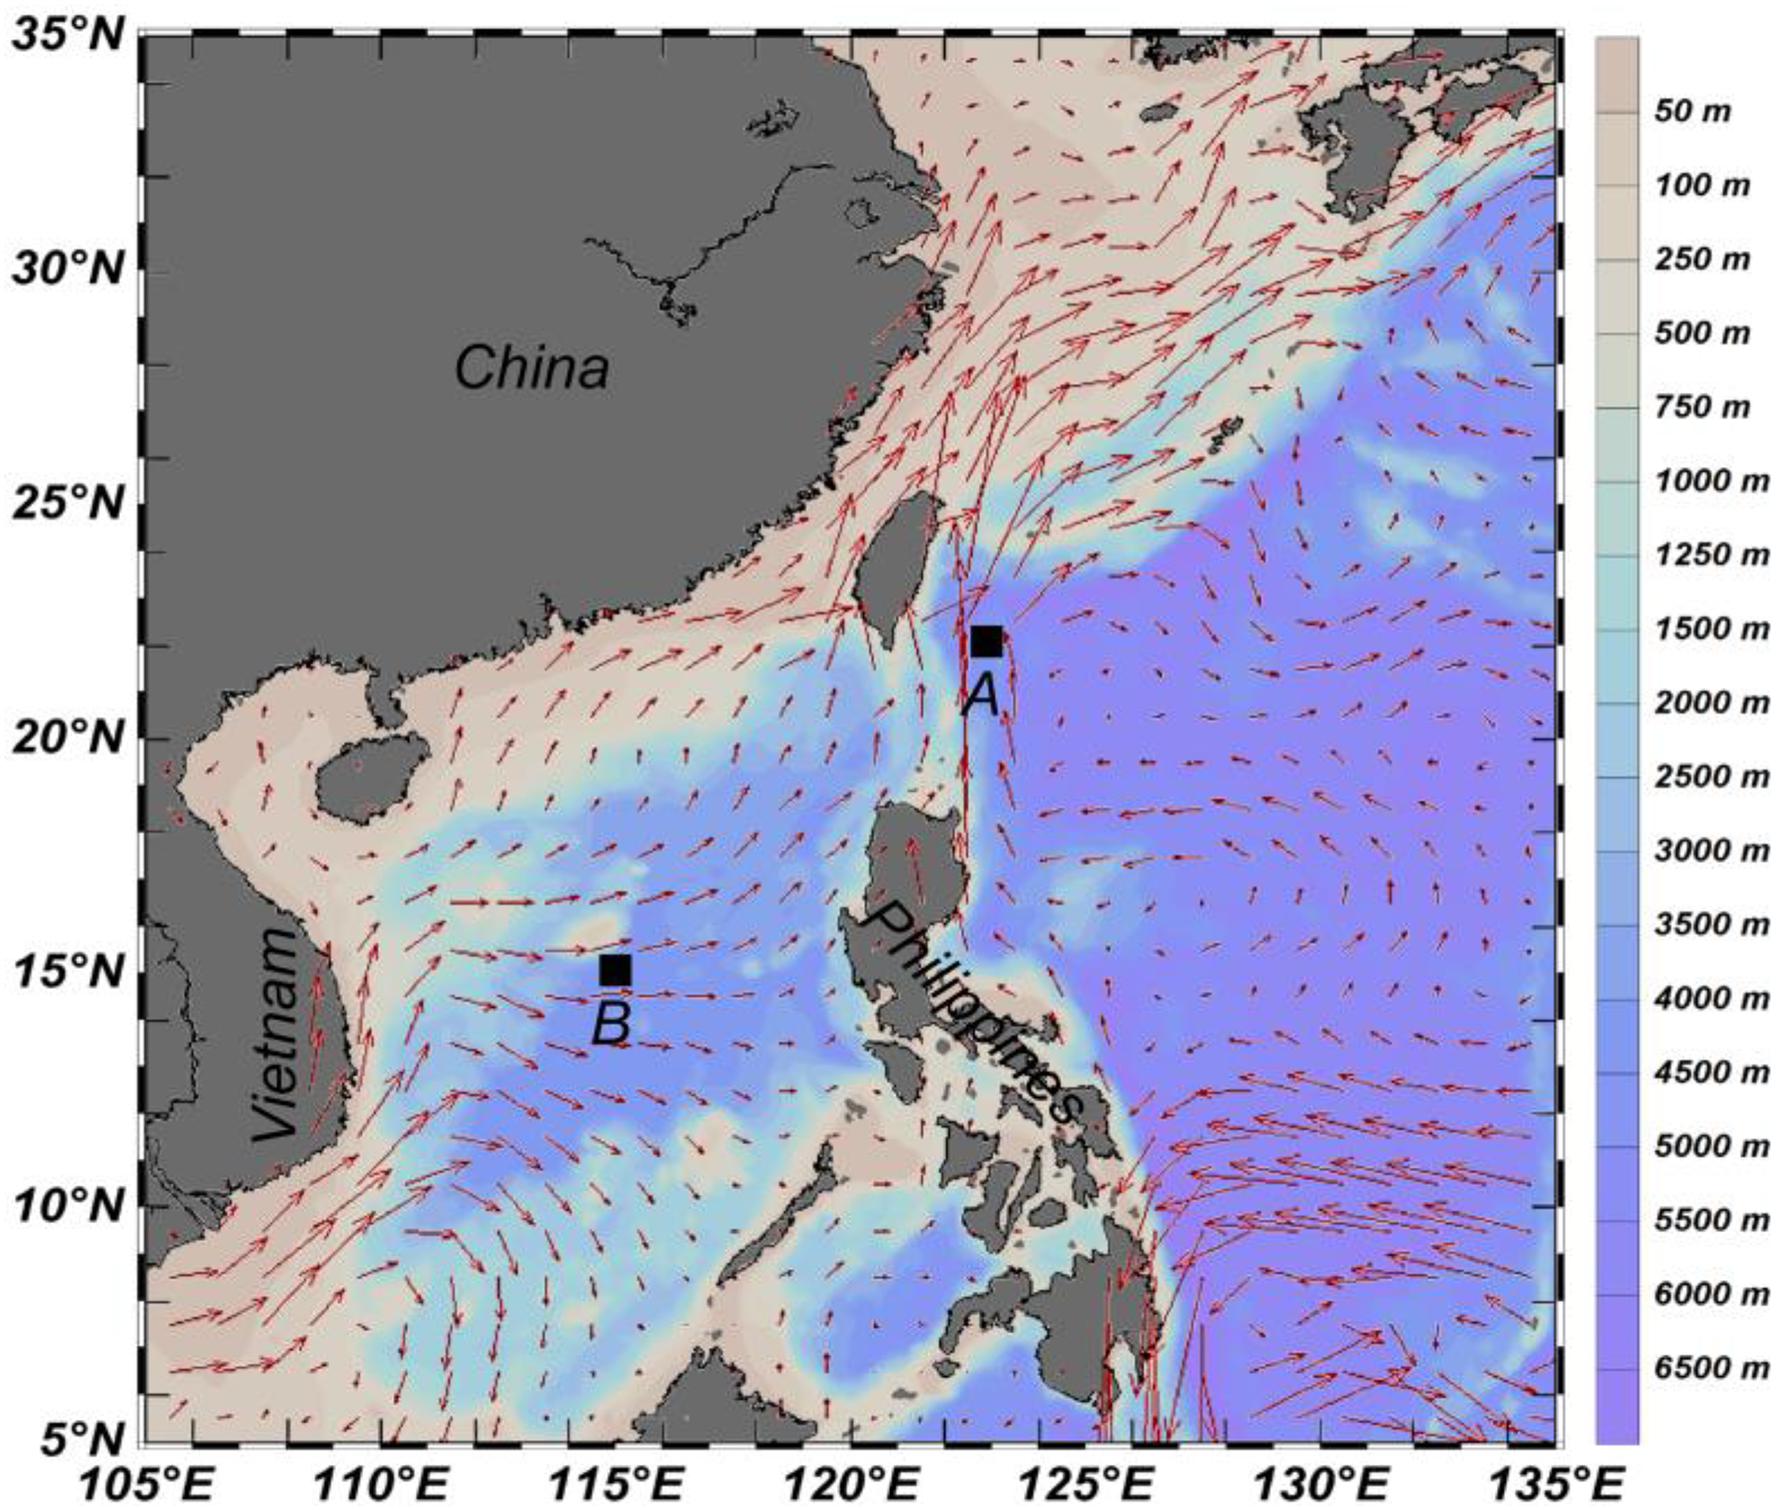
Figure 1. Sampling stations and surface currents in the investigating areas.
The depth-specific sea temperature and salinity were recorded using a conductivity-temperature-depth system (Sea-Bird SBE 911 plus). The maximum salinity at station A was 35.2, and the temperature was approximately 24.5°C, which is a typical characteristic of Kuroshio water (KW, Chen et al., 2011), while the highest salinity at station B was 34.8 when the water temperature was 20.1°C, representing the characteristic of SCS water (SCSW, Chen et al., 2011). The surface current also showed that stations A and B were influenced by KW and SCSW, respectively (Figure 1). Water samples for chlorophyll a (Chl a) measurement were collected at 5, 25, 50, 75, 100, and 150 m depth for station A and at 5, 25, 50, 60, 100, and 150 m depth for station B. The water samples were filtered through Whatman GF/F filters and preserved in liquid nitrogen for further analyses.
Data of the surface currents during the investigation period were downloaded from the European Center for Medium-range Weather Forecasts (ECMWF; data source:1). Remotely sensed surface temperature and Chl a concentration were obtained from Moderate Resolution Imaging Spectroradiometer level 3 products (data source:2). The data showed a monthly average in July 2017 and a spatial resolution of around 4 km.
In the laboratory, zooplankton were identified and counted under a stereomicroscope (Leica S8APO), and all zooplankton were identified to species level if possible. For each sample, a subsample of 1/4–1/16 fractions of the preserved amount was extracted with a Folsom plankton splitter. Subsample volume was determined on the basis of zooplankton density in the original sample which included at least 500 adult individuals. The dry weight (DW) of the zooplankton samples were measured using an analytical balancer (Sartorius BSA224S) after drying at 60°C for 24 h. The Chl a on each filter was extracted in 90% acetone for 24 h in the dark and measured using Shimadzu Design 20A Liquid Chromatograph (Shimadzu).
Data Analysis
Zooplankton abundance data were standardized to individuals per square meter (ind m–2). The abundance of each species was calculated in each layer, and the top five were selected as the dominant species.
Multivariate analyses were conducted using the software PRIMER V6.0 (PRIMER-e). The zooplankton abundances were calculated as lg (x + 1) –transformed, and then a similarity matrix between the sampling layers was built on the basis of Bray–Curtis coefficient of similarity (Field et al., 1982). Cluster analyses based on the average linkage group classification were conducted to determine the interrelations between stations (Field et al., 1982). Analysis of similarity was used to test the differences among the resultant groups, and a R-statistic value close to 1 indicates considerable difference in pairwise comparisons. The correlation between zooplankton abundance and environmental factors was analyzed by the RELATE procedure. The BIO-ENV procedure was used to test which environmental factors (average temperature, salinity, density, and Chl a concentration of water column in each layer) could best explain the patterns in the cluster result. Given that the Chl a sample at 200–300 m layer was not collected in this study, the Chl a data at 200–300 m layer applied to correlation analyses were referenced to the literature of Dai et al. (2017) and Li et al. (2021). Redundancy analysis (RDA) was used to explain the relationship between zooplankton and environmental factors in different stations and depth layers (Lepš and Šmilauer, 2003).
In order to quantify the presence and extent of DVM of zooplankton at two stations, the weighted mean depth (WMD) for zooplankton abundance was calculated in this study, as a measure of the center of gravity of zooplankton’s vertical distribution, according to Andersen and Sardou (1992) following equation:
where ni is zooplankton abundance (ind m–3) at depth di, and di is the mean depth of each stratum (m).
The amplitude of vertical migration (ΔDVM) was also calculated in this study, as the difference between the WMD of the organisms during the day and the night (Tutasi and Escribano, 2020). This ΔDVM was considered as the criterion to assess the zooplankton DVM behavior.
Carbon content (C) of zooplankton was converted from DW. Formalin preservation usually leads to 37% loss of the zooplankton DW (Giguère et al., 1989). Additionally, the carbon content constitutes 40% of the DW (Omori, 1969; Dam and Peterson, 1993). Thus, the C was calculated using the following equation:
The active carbon flux mediated by migrating mesozooplankton was the sum of respiratory carbon flux (Fr), excretory carbon flux (Fe), and mortality carbon flux (Fm). The migrant biomass of the mesozooplankton was estimated on the basis of the difference between nighttime and daytime biomass in the euphotic zone (0–200 m, Dam et al., 1995). The respiratory carbon flux of the migrant mesozooplankton was calculated using the following equation (Zhang and Dam, 1997):
where B = diel migrant mesozooplankton biomass (mg C m–2); R = hourly weight-specific rate of carbon respiration estimated from the body weight and the mean temperature (°C) between 200 and 300 m (h–1); T = number of hours per day that the migrant mesozooplankton stayed below 200 m (12 h⋅d–1 in this study).
The hourly weight-specific rate of carbon respiration (R) was estimated using the following equation:
where RO (μl O2 ind–1⋅h–1) is the respiratory rate, which is estimated using the model of Ikeda (2014); RQ is the respiration quotient (assumed to 0.97; Omori and Ikeda, 1984), which is the molar ratio of carbon dioxide produced to oxygen consumed; 12 is the molecular weight of carbon; 22.4 is the molar volume of an ideal gas at standard temperature and pressure; and W is the body weight of mesozooplankton (μg C per individual).
The excretory carbon flux of the migrant mesozooplankton was estimated on the basis of the findings of Steinberg et al. (2000). They suggested that the respiration and excretion rates vary depending on zooplankton dry weight and environmental temperature, and the excretion of DOC was 32% of CO2 respiration. Therefore, in the present study, Fe was assumed to be equal to 32% of Fr.
Mortality flux of zooplankton was estimated from growth assuming steady-state conditions in the mesopelagic zone (growth = mortality) using the equation of Ikeda and Motoda (1978) relating respiration and growth, where Growth = 0.75 × Respiration.
Results
Environmental Factors
The temperature within the 0–300 m water column at station A ranged from 18.6 to 30.8°C. The salinity at station A varied from 34.5 to 35.2, with the highest and lowest values detected at 126 m depth and the surface, respectively. The temperature and salinity at station B varied from 11.3 to 29.2°C and from 33.4 to 34.8, respectively. The temperature and salinity at station A were higher than those at Station B, but the temperature and salinity showed no obvious diel variation in the vertical profiles for both stations (Figure 2A). In addition, the mixed layer depth reached approximately 50 m at both stations where thermoclines were evident, and the thermocline at station B was stronger than that at station A. The Chl a concentration at station A ranged from 0.10 to 0.44 mg m–3, while that at station B ranged from 0.04 to 0.74 mg m–3 (Figure 2B). The satellite data of sea surface temperature and Chl a concentration are shown in Figures 2C,D.
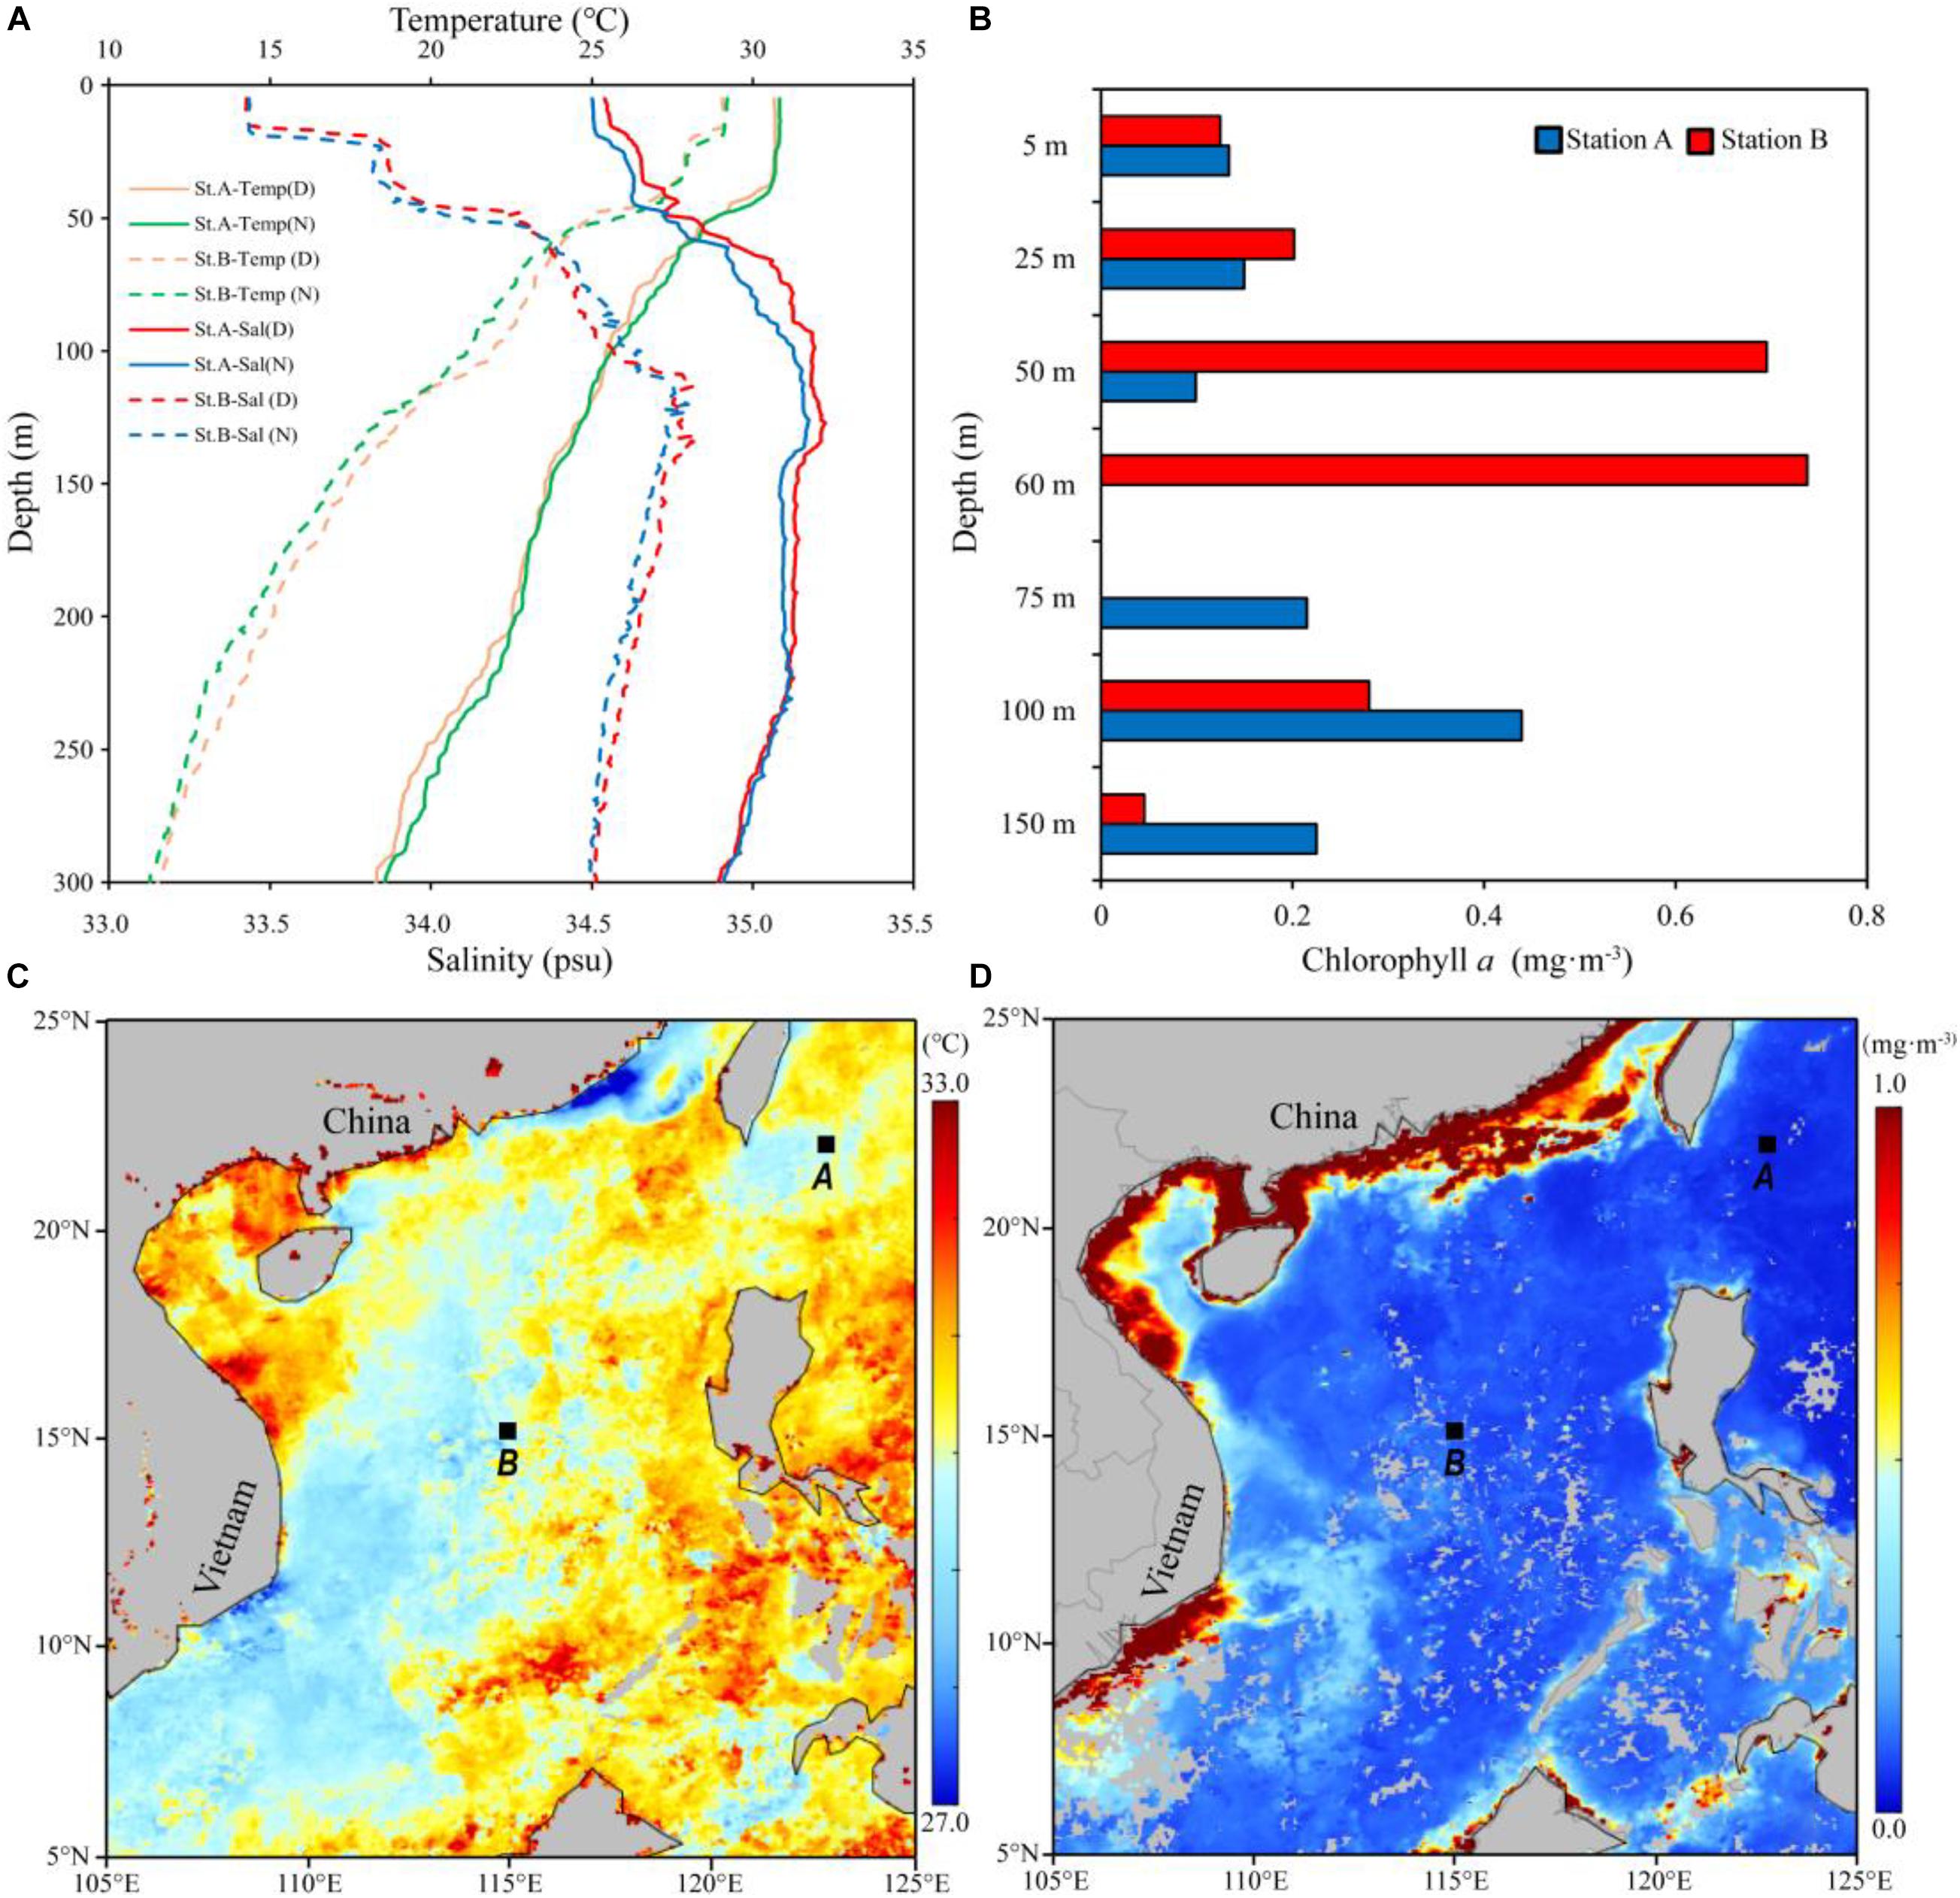
Figure 2. Vertical profile of temperature and salinity above 300 m at stations A and B (A) (Temp, temperature; Sal, salinity; D, daytime; N, nighttime). Vertical distribution of Chl a concentration above 150 m at stations A and B (B). Surface sea temperature (C) and Chl a concentration (D) based on satellite data (Date: 01–31 July 2017).
Species Composition and Community Structure of Zooplankton
A total of 170 mesozooplankton taxa at station A and 217 taxa at station B were recorded. Copepods were the most dominant component at both stations (Supplementary Figures 1A,B). In addition, the species numbers varied in different layers at the two stations (Supplementary Figure 1C). During daytime, the maximum and minimum species number presented at 100–200 and 0–30 m layers of Station A, respectively. The highest species number was recorded at 100–200 m layer in nighttime, and the lowest was found in the 30–50 and 200–300 m layers. At station B, the maximum species numbers during daytime and nighttime were recorded at 50–100 m layer, while the minimum numbers were documented at 200–300 m layer. The common dominant species included copepods Acartia negligens, Clausocalanus furcatus, Oithona plumifera, Oithona similis, Oncaea venusta and Paracalanus aculeatus and protozoans Noctiluca scintillans and Trilobatus trilobus at stations A and B (Supplementary Tables 1, 2).
Cluster analyses showed that the mesozooplankton were divided into three assemblages (0–50, 50–200, and 200–300 m) at both stations with obvious differences among the mesozooplankton assemblages at the two stations (Figure 3). Compared with station A, station B showed a high similarity of the three assemblages. In addition, the mesozooplankton assemblage at 50–200 m at station A showed a relatively high similarity compared with that at 0–50 and 50–200 m at station B. RELATE analyses showed that the mesozooplankton communities were significantly correlated with environmental factors at both station A (R = 0.778, p < 0.001) and B (R = 0.622, p < 0.001; Table 1). BIOENV analyses revealed that the combination of temperature and salinity could best explain the patterns in the cluster result at station A (coefficient = 0.785, p < 0.001), and temperature had the highest correlation with mesozooplankton communities (coefficient = 0.761, p < 0.001). At station B, temperature could best explain the patterns in the cluster result (coefficient = 0.744, p < 0.001).
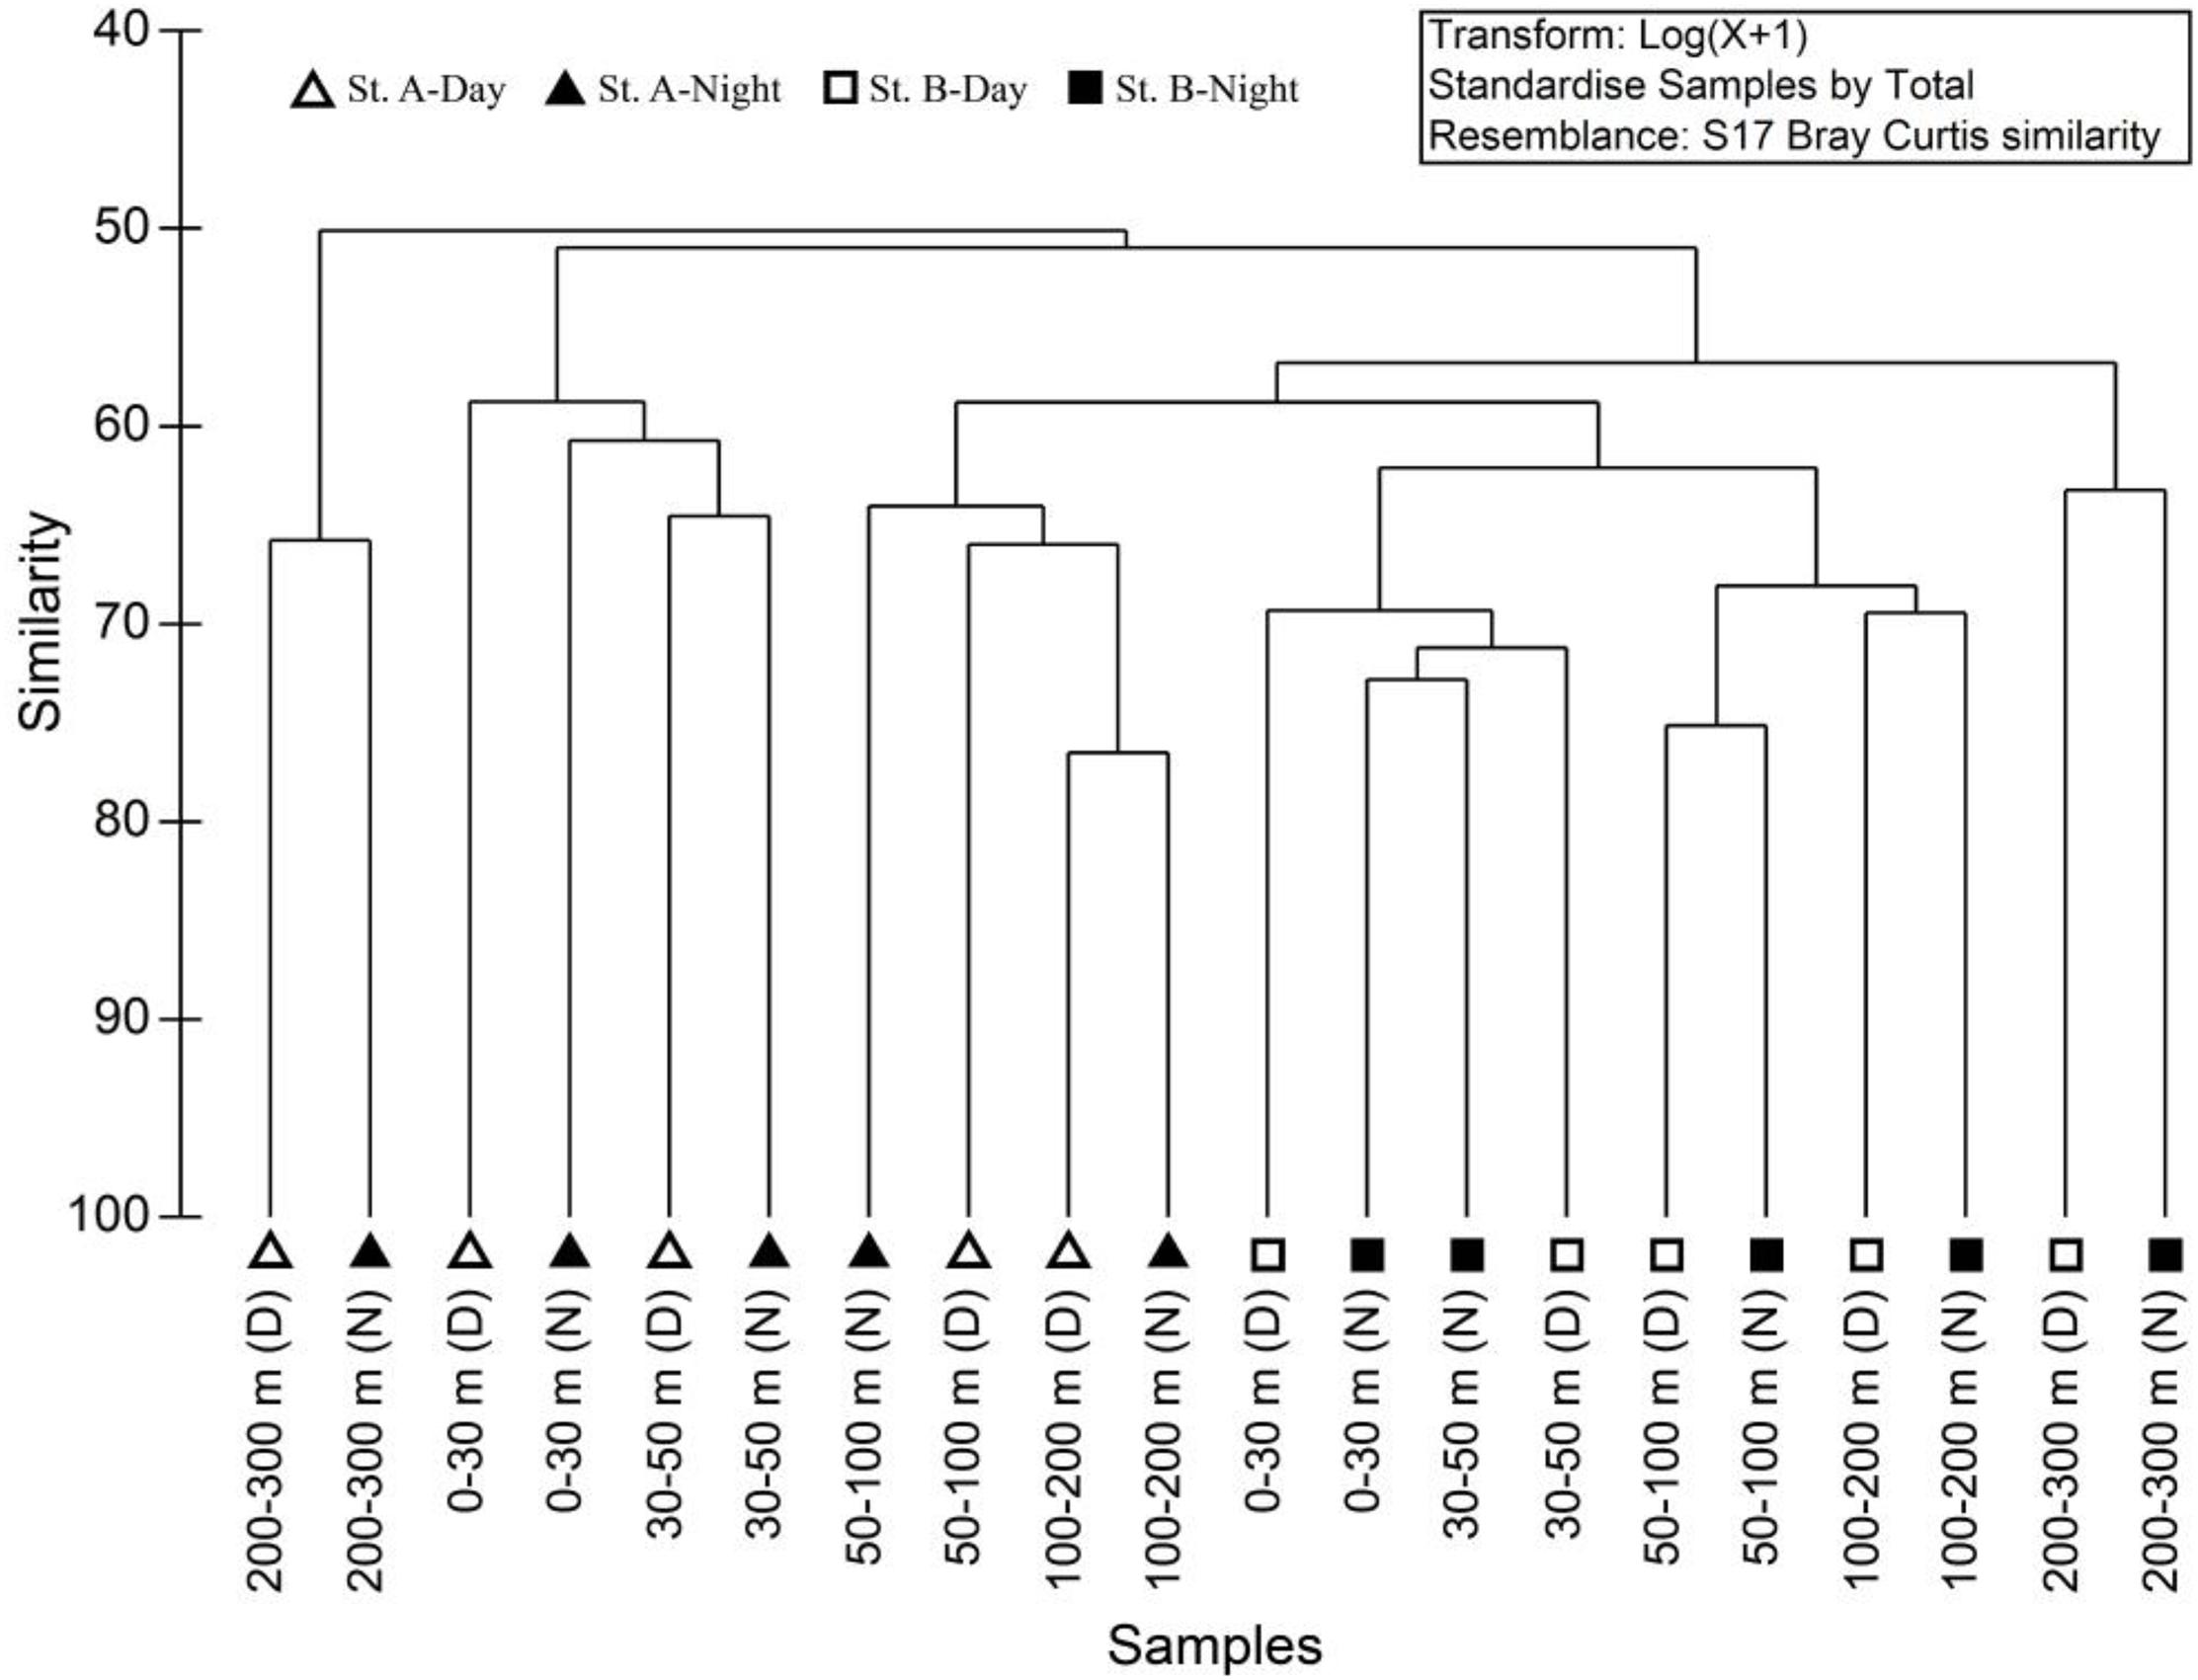
Figure 3. Cluster analyses of zooplankton between different water layers at two stations.
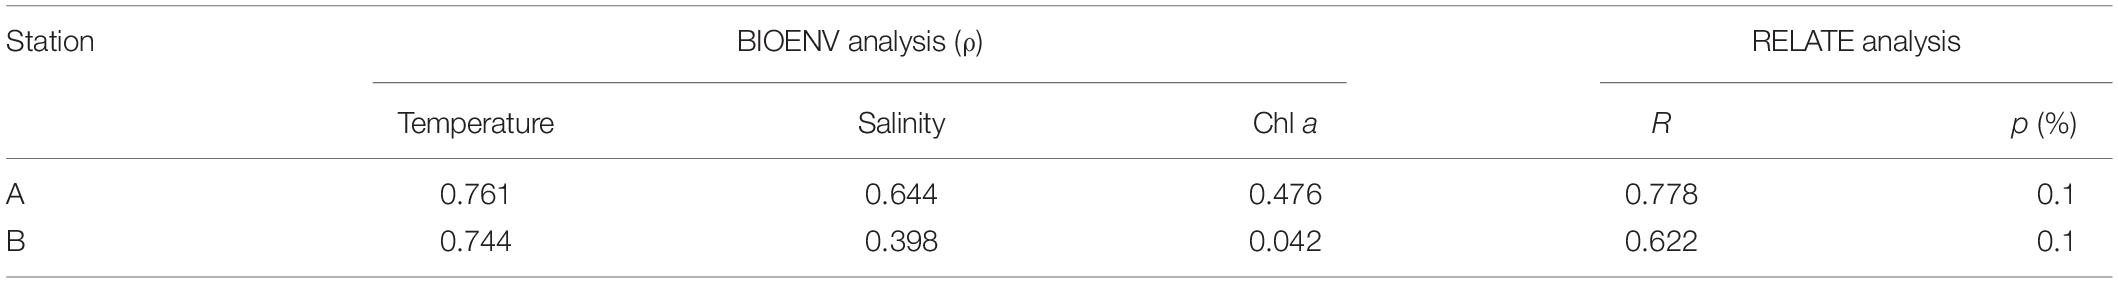
Table 1. Correlations between zooplankton abundance and environmental factors (sea temperature, sea salinity, and phytoplankton density) according to BIOENV and RELATE analyses.
The result of RDA showed that Chl a (F = 6.1, p = 0.002) and salinity (F = 4.9, p = 0.004) were the crucial environmental factors affecting the mesozooplankton community structures and vertical distributions. Additionally, all mesozooplankton taxa except for hydromedusae and siphonophore were positively correlated with Chl a (Supplementary Figure 2).
Diel Vertical Distribution of Mesozooplankton
The vertical distributions of mesozooplankton abundance showed remarkable diel variations at both stations (Figure 4A). An obvious mesozooplankton DVM pattern was found at station A. The mesozooplankton were mainly concentrated at 50–200 m layer during the daytime, while they migrated to 0–50 m layer at nighttime (Figure 4A1). The mesozooplankton also migrated from the deep to sea surface at nighttime at station B (Figure 4A2). The migration amplitudes of mesozooplankton were higher at station A than at station B (Figure 4A and Supplementary Table 3). The ΔDVM of total abundance of mesozooplankton ranged from 98 to 81 m at station A, which was higher than that at station B (ΔDVM = 9 m). The migration of biomass was bound up with abundance, but it differed between the migration patterns of these two parameters. The migrant DW biomasses of mesozooplankton varied between two stations (Figure 4B). The DW biomass at night increased from 1,361.2 to 1,423.9 mg⋅m–2 at station A in the euphotic layer and from 2,731.3 to 2,976.1 mg m–2 at station B.
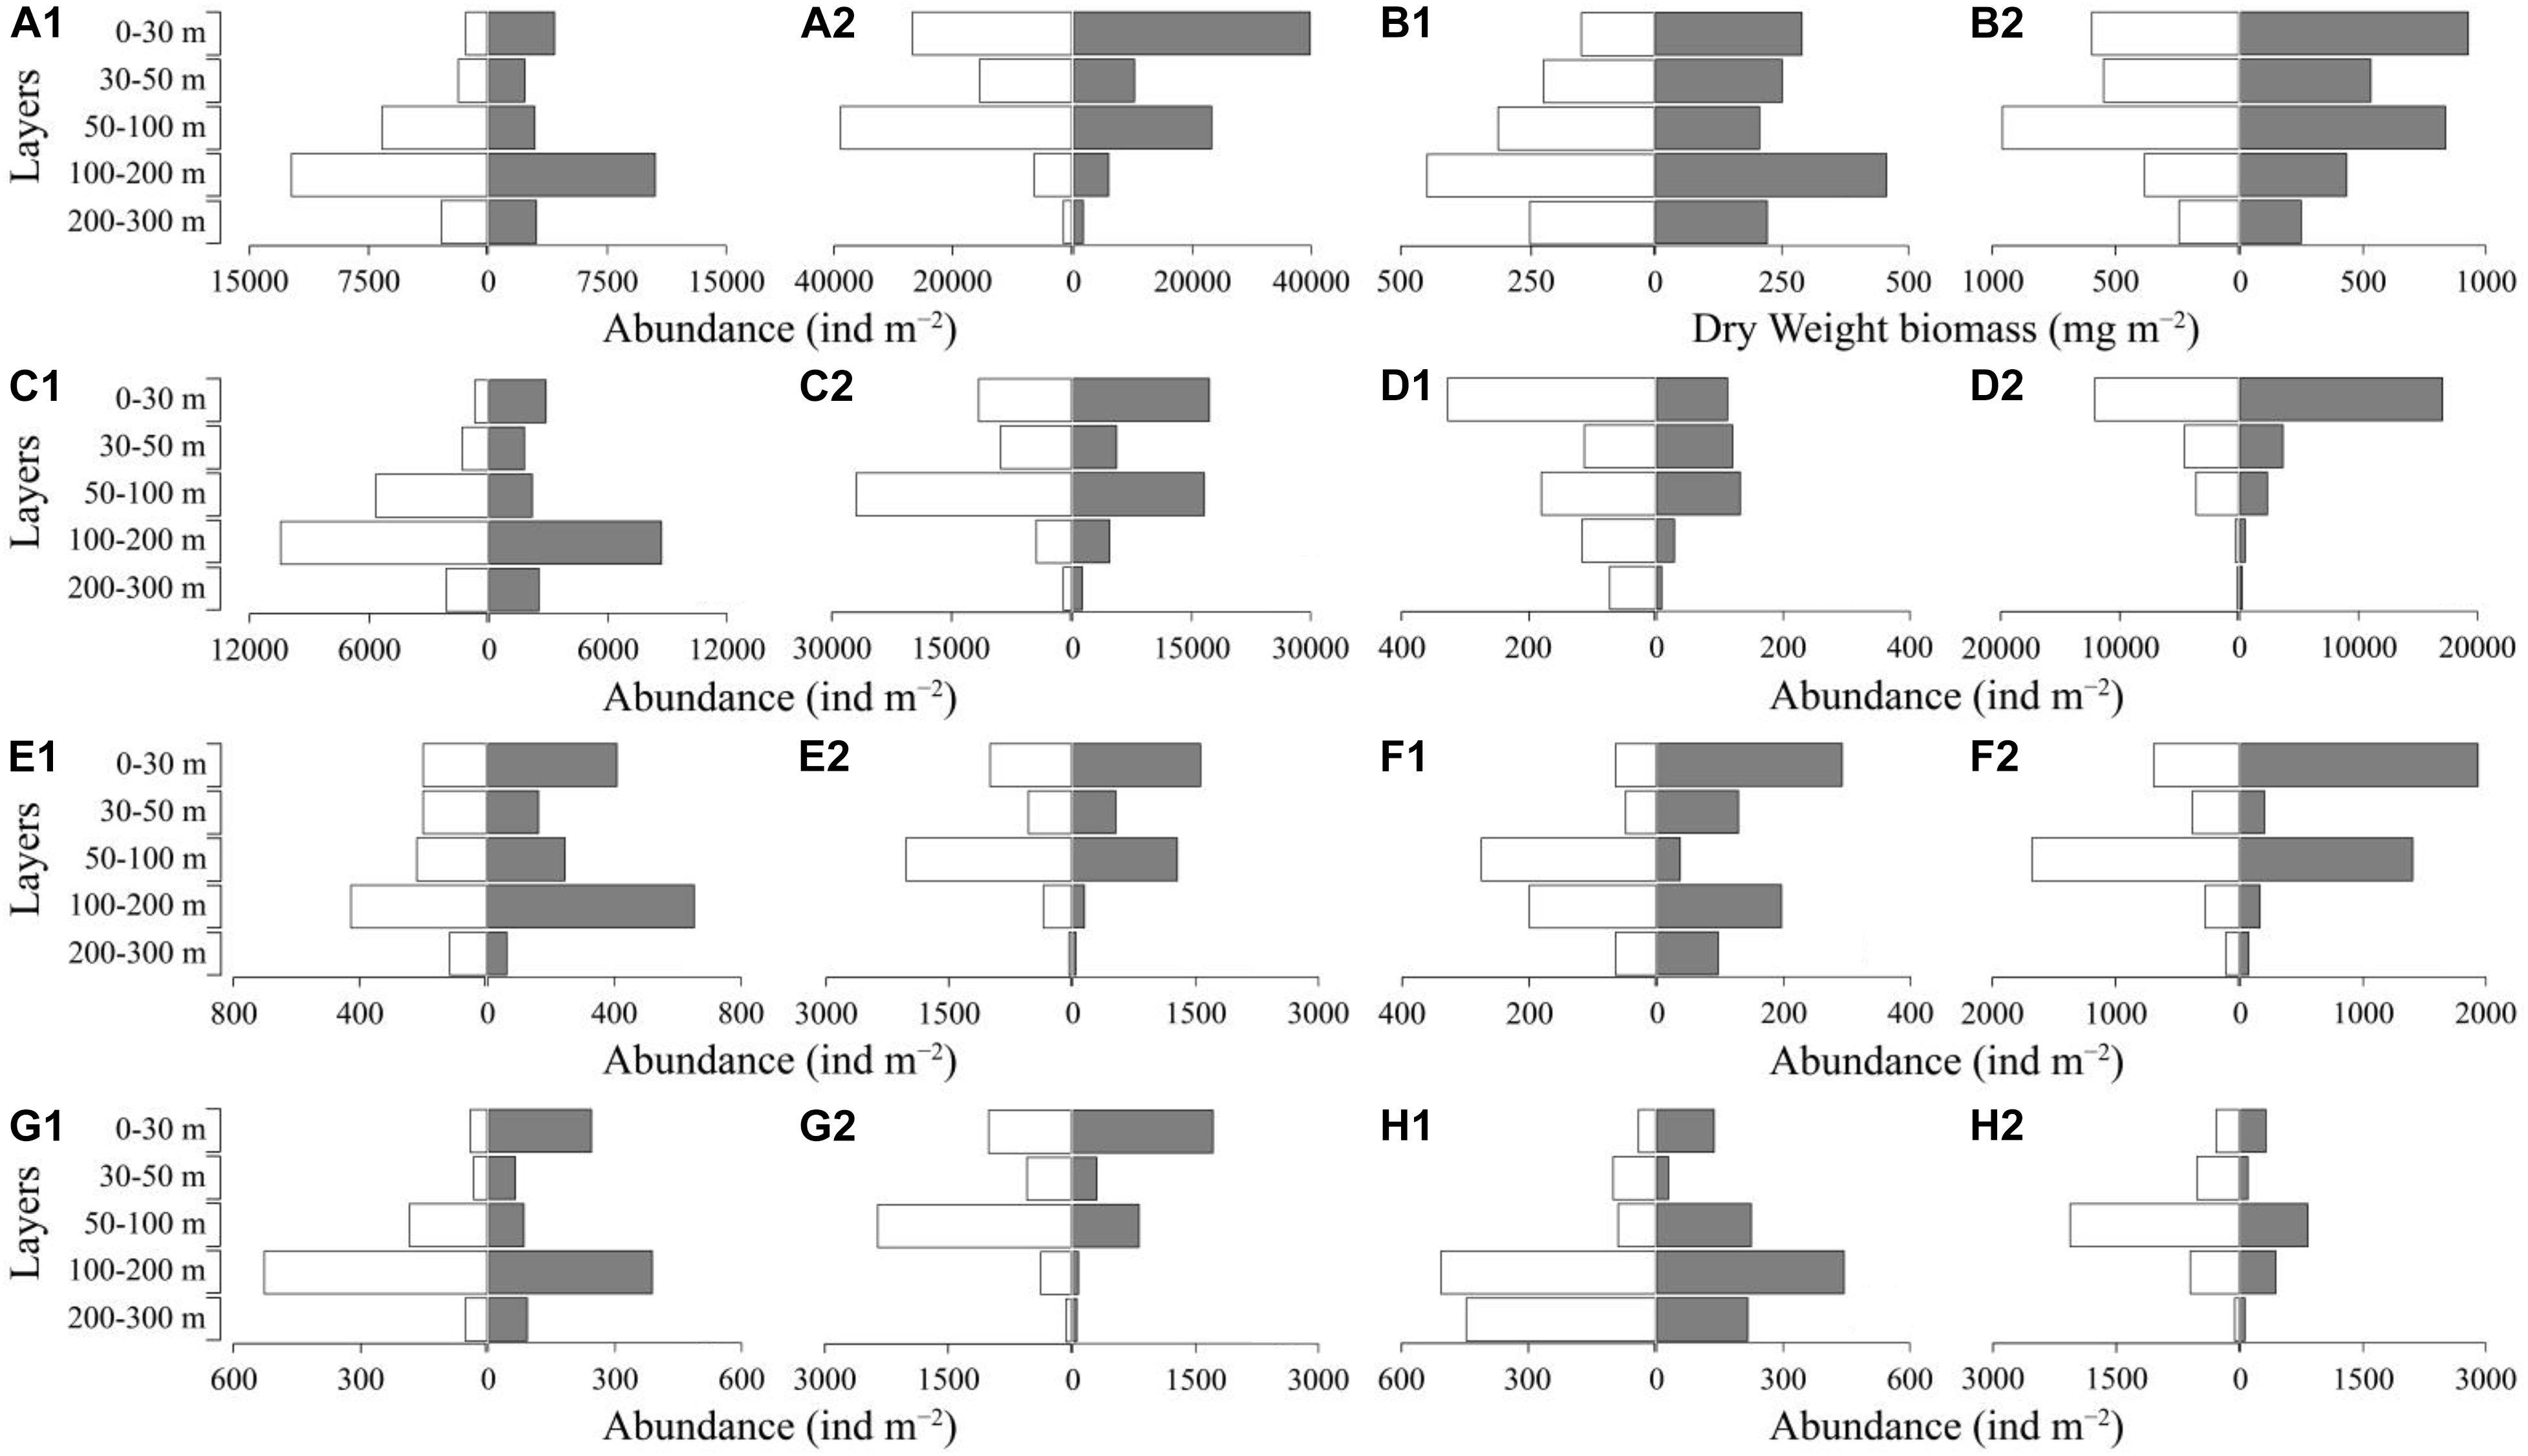
Figure 4. Diel vertical distribution of mesozooplankton abundance and dry weight biomass in two fixed stations [(A) total abundance; (B) total dry weight biomass; (C) copepod; (D) protozoan; (E) tunicate; (F) chaetognath; (G) pelagic larvae; (H) others; 1, station A; 2, station B; white, day; gray, night].
Copepods, protozoans, chaetognaths, and tunicates were the main groups of mesozooplankton, and these taxa showed different DVM patterns between stations A and B (Figure 4). Copepods, tunicates and chaetognaths showed an obvious DVM trend at both stations, while the migrant ranges differed, and the migration amplitudes at station A were greater than that at station B except for tunicates (Figures 4C,E,F and Supplementary Table 3). Protozoans showed no obvious diel variations at both stations (Figure 4D1,2).
The dominant species of mesozooplankton also showed different DVM patterns between stations A and B (Figure 5). A. negligens, O. venusta and P. aculeatus showed obvious DVM at two stations, while the ΔDVM of these species at station A was higher than that at Station B (Figures 5A,F,G and Supplementary Table 3). C. furcatus and O. plumifera showed different DVM patterns at two stations (Figures 5B,D). C. furcatus exhibited obvious DVM at station A with 36 m ΔDVM, while no diel variation was detected at station B (Figure 5B). Contrastingly, O. plumifera showed no obvious diel variation at station A, but a significant DVM trend was detected at station B, migrating from the 50–200 m layer to sea surface at nighttime (Figure 5D). Copepods O. similis and protozoans N. scintillans showed no obvious diel variations at two stations, but the distributions of these species were deeper at station A than that at station B (Figures 5C,E and Supplementary Table 3). T. trilobus also showed no obvious diel variation at two stations, and they mainly distributed in the 0–30 m layer (Figure 5H1,2).
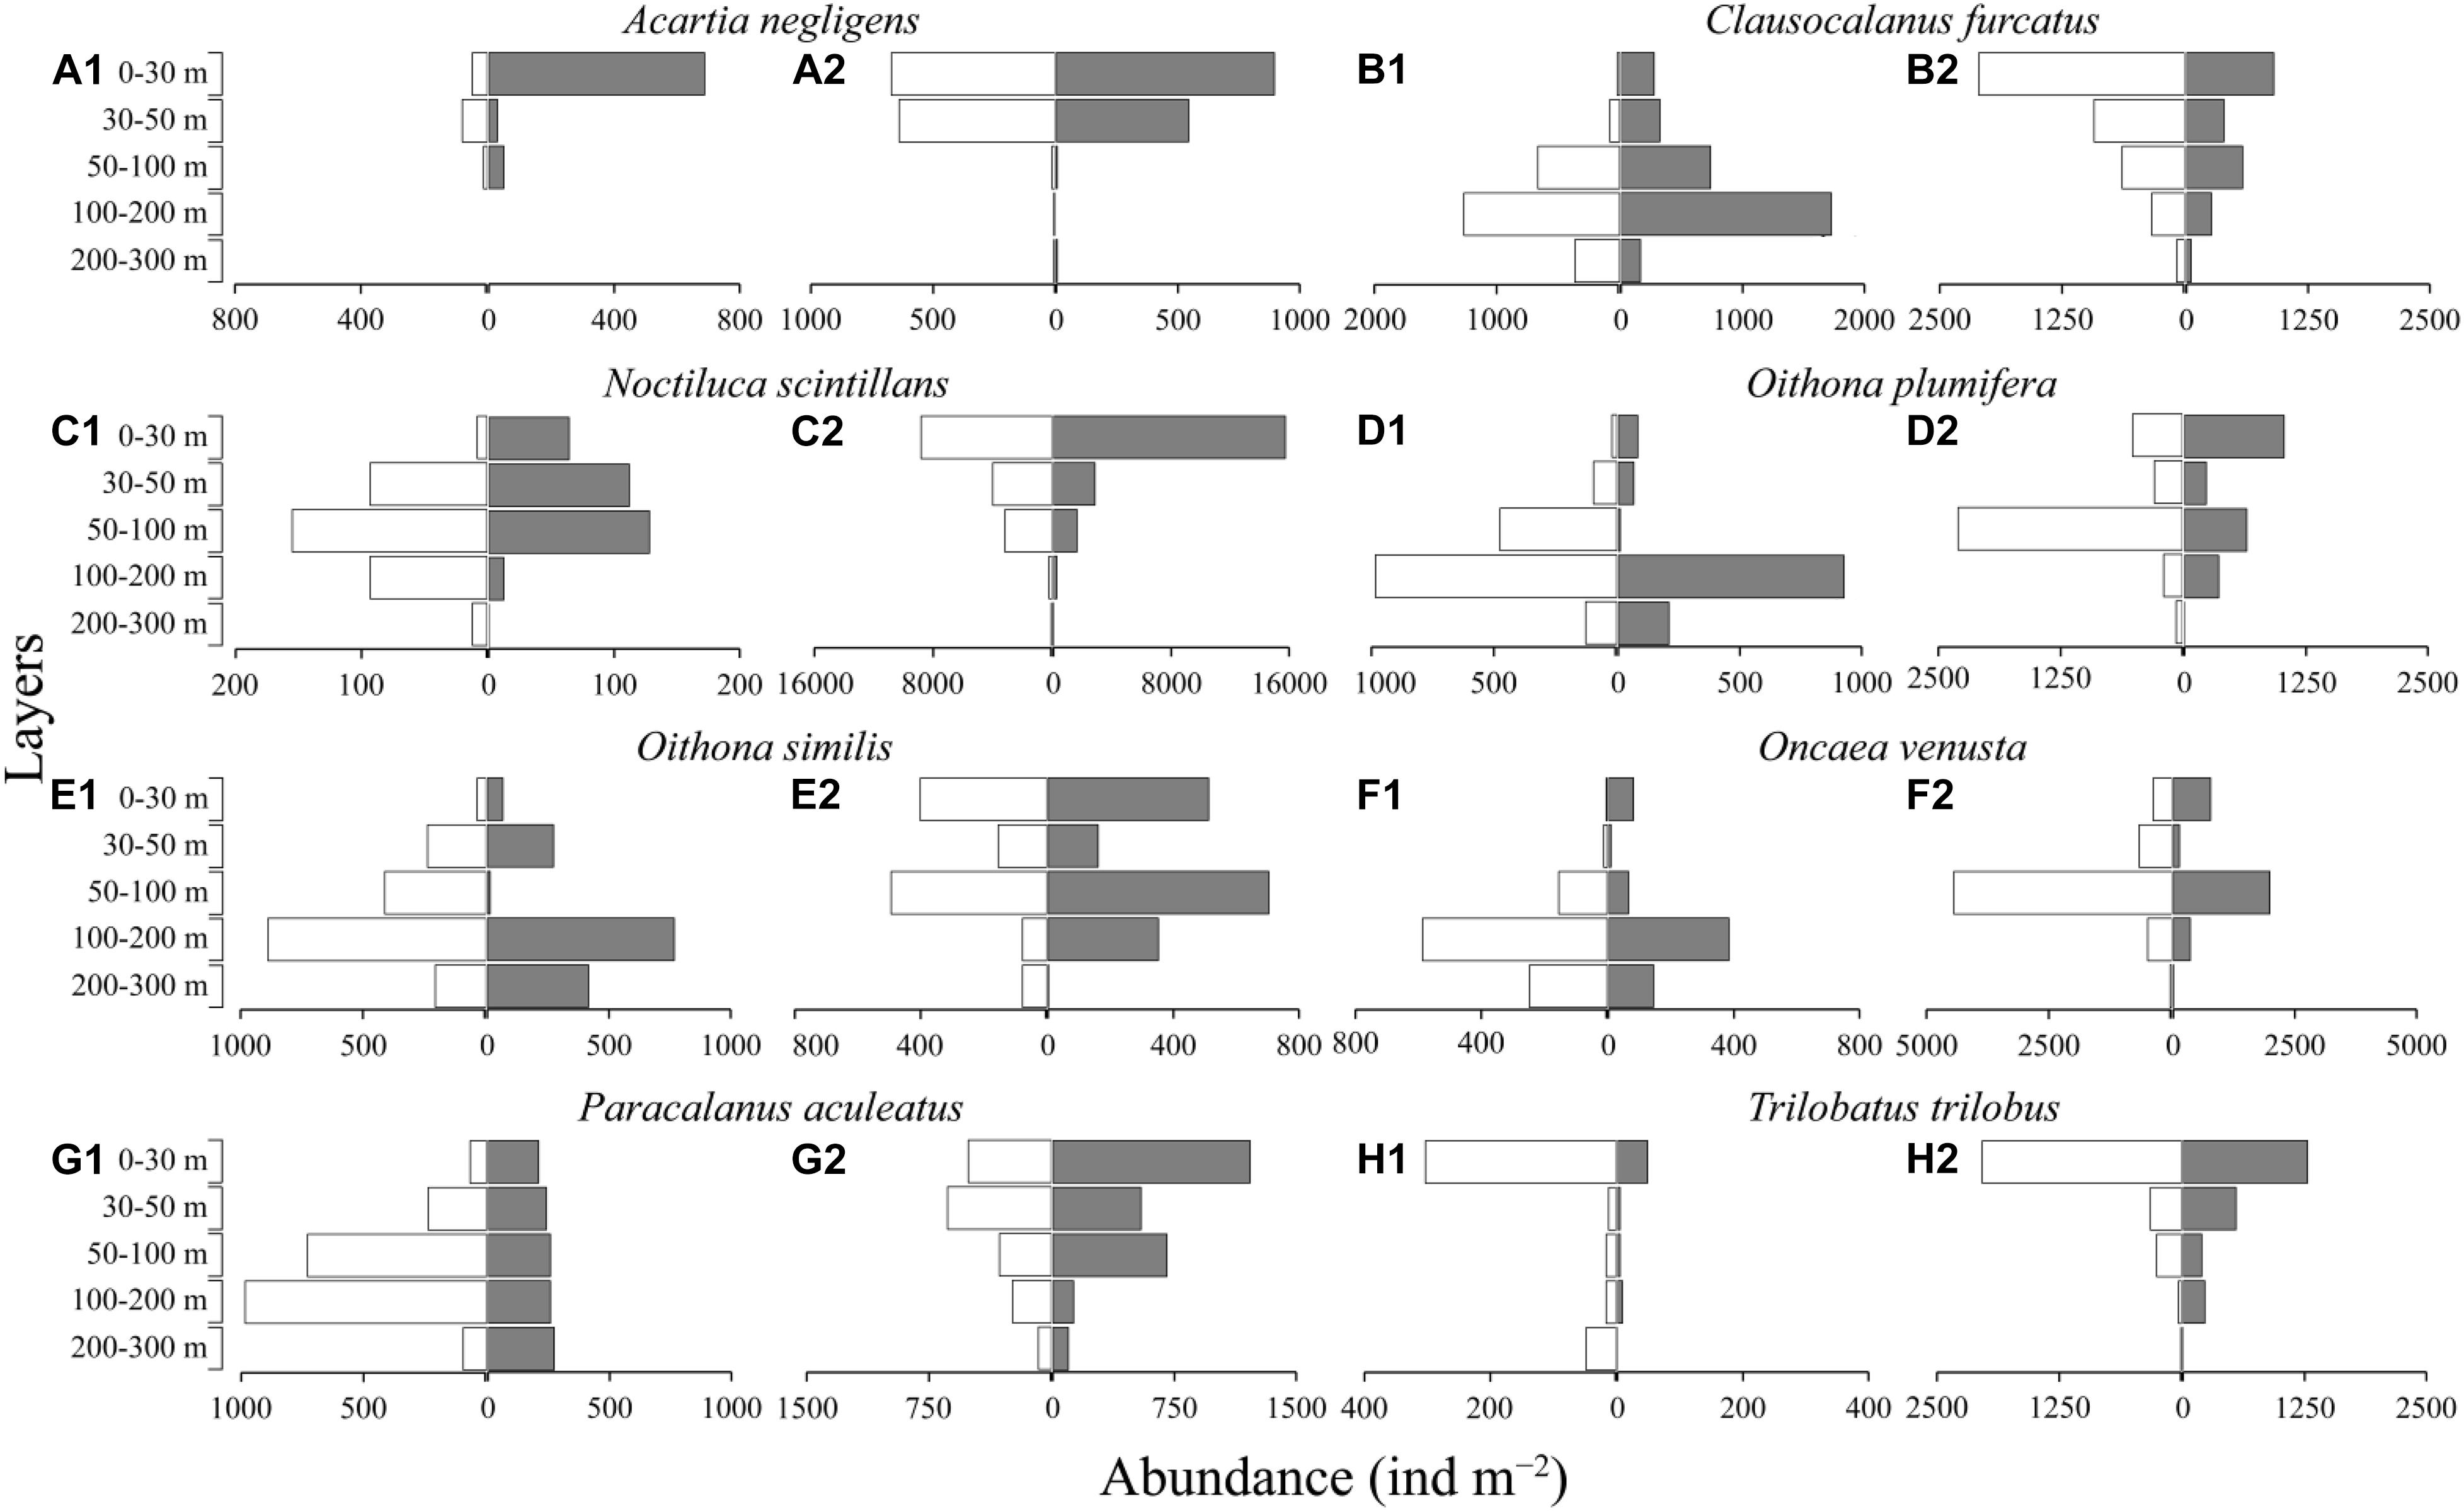
Figure 5. Diel vertical distribution of mesozooplankton dominant species at two fixed stations (white, daytime; gray, nighttime; 1, station A; 2, station B).
Migrant Biomass and Active Carbon Flux
The migrant biomass of mesozooplankton was 25.12 mg C m–2 at station A and 98.40 mg C m–2 at station B (Table 2). The total active flux of migrant mesozooplankton was 1.80 mg C m–2 d–1 at station A and 4.64 mg C m–2 d–1 at station B, while the total downward carbon flux at station B was 2.6 times that at station A (Table 2). The respiratory flux accounted for the highest proportion in the total active flux at two station, followed by the mortality and excretory flux.
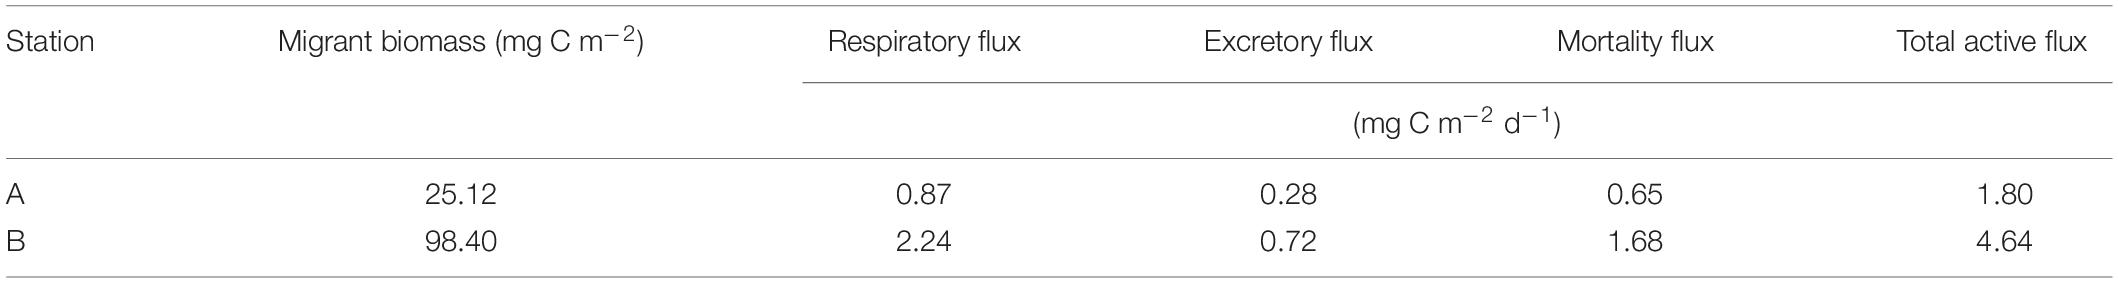
Table 2. Total biomass of mesozooplankton and downward active fluxes below the depth of 200 m.
Discussion
Different water masses (or currents) have distinct natural physical and chemical properties, which influenced the zooplankton species composition and community structure (Yamaguchi et al., 2002, 2015; Raybaud et al., 2008; Eisner et al., 2013; Lian et al., 2013). In the present study, the distinct hydrological regime shaped the mesozooplankton communities of two waters with striking difference in abundance, biomass and species richness. Previous study in western Pacific showed that Chl a concentration could be a crucial factor influencing the abundance and biomass of zooplankton (Sun and Wang, 2017; Yang et al., 2017). In our study, the Chl a concentration at Station B in the SCS was higher than that at station A in the WPS, and it could possibly provide abundant food resources for zooplankton growth and reproduction (Martin et al., 2015), resulting in higher abundance and biomass of mesozooplankton in the SCS. Moreover, the temperature and salinity variation may contribute to the difference in species richness between two stations. The ranges of temperature and salinity were wider above 300 m depth in the SCS than that in the WPS, which possibly provide more diverse habitats with higher species richness for mesozooplankton in the SCS. Lian et al. (2013) also indicated that the abundance and species richness of zooplankton in the SCS were higher than that in the WPS.
The characteristics of distinct water masses also influence the migrating amplitudes (ΔDVM) of zooplankton, which was observed in our study and previous researches in Pacific (Sogawa et al., 2016; Tutasi and Escribano, 2020). The ΔDVM of the total abundance, as well as dominant groups except for protozoan and tunicate, were higher in the WPS than that in the SCS. In general, the vertical distribution of zooplankton was closely related to Chl a (Madhupratap and Haridas, 1990; Onsrud and Kaartvedt, 1998; Steinberg et al., 2008a; Briseño-Avena et al., 2020). Steinberg et al. (2008a) indicated that the deeper the maximum depth of Chl was, the stronger the DVM was performed. In the present study, the vertical distribution of mesozooplankton was also obviously influenced by Chl a (Supplementary Figure 2). The depth of Chl a maximum at station B appeared at 60 m, which was shallower than that at station A (100 m), possibly leading to a small ΔDVM at station B. In addition, the thermocline strength may also control the migration amplitude of mesozooplankton. Previous studies suggested that zooplankton DVM was restricted by strong thermoclines (Farstey et al., 2002; Júnior et al., 2014; Ge et al., 2021). For instance, over 70% of the zooplankton (>100 μm) was restricted above 100 m by the strong stratification in the Red Sea, whereas zooplankton could migrant throughout the euphotic layer when the thermocline decreased due to vertical mixing (Farstey et al., 2002). In the present study, thermoclines were detected at both two stations, and the thermocline was stronger at station B than at station A (Figure 2A). The strong thermocline at station B restricted the DVM of zooplankton with poor swimming abilities, thereby resulting in a small ΔDVM in the SCS (Figure 5).
Although the migrant amplitudes of mesozooplankton were higher in the WPS, the migrant biomass was higher in the SCS than that in the WPS (Table 2). Migrant biomass was closely related to high primary productivity and zooplankton biomass (Putzeys et al., 2011; Hernández-León et al., 2019b). Thus, primary productivity remarkably influenced the zooplankton migrant biomass in marine systems. In the present study, the Chl a concentration in the SCS was higher than that in the WPS (Figure 2B), likely enhancing the high migrant biomass in the SCS (Table 2). As the main contributors of migrant biomass, the abundances of copepods, chaetognaths, and tunicates in the SCS were one order of magnitude higher than those in the WPS (Figure 4).
The respiratory fluxes transported by zooplankton DVM varied in different marine systems, and they are higher in the eutrophic and mesotrophic regions than in the oligotrophic marine systems (Table 3). In general, the respiratory flux was highly dependent on the migrant biomass of zooplankton (Steinberg et al., 2002; Hernández-León et al., 2019b). The migrant biomasses in the eutrophic and mesotrophic regions were much higher than those in the oligotrophic regions, thereby causing the high respiratory flux (Table 3). In the present study, SCS and WPS belong to oligotrophic zones, and the respiratory fluxes mediated by mesozooplankton in the two zones were remarkably lower than those in other meso- and eutrophic marine systems due to the low migrant biomass (Table 3). Generally, the respiratory fluxes in the oligotrophic regions were low, ranged from 0.87 to 3.8 mg C m–2 d–1, and there was no obvious difference between sea areas (Table 3). However, the high respiratory fluxes have been detected in oligotrophic waters in the case of mesoscale gyre, which could be up to 9.21 and 17.17 mg C m–2 d–1, in the oligotrophic Alboran Sea gyre edge and core respectively (Yebra et al., 2018).
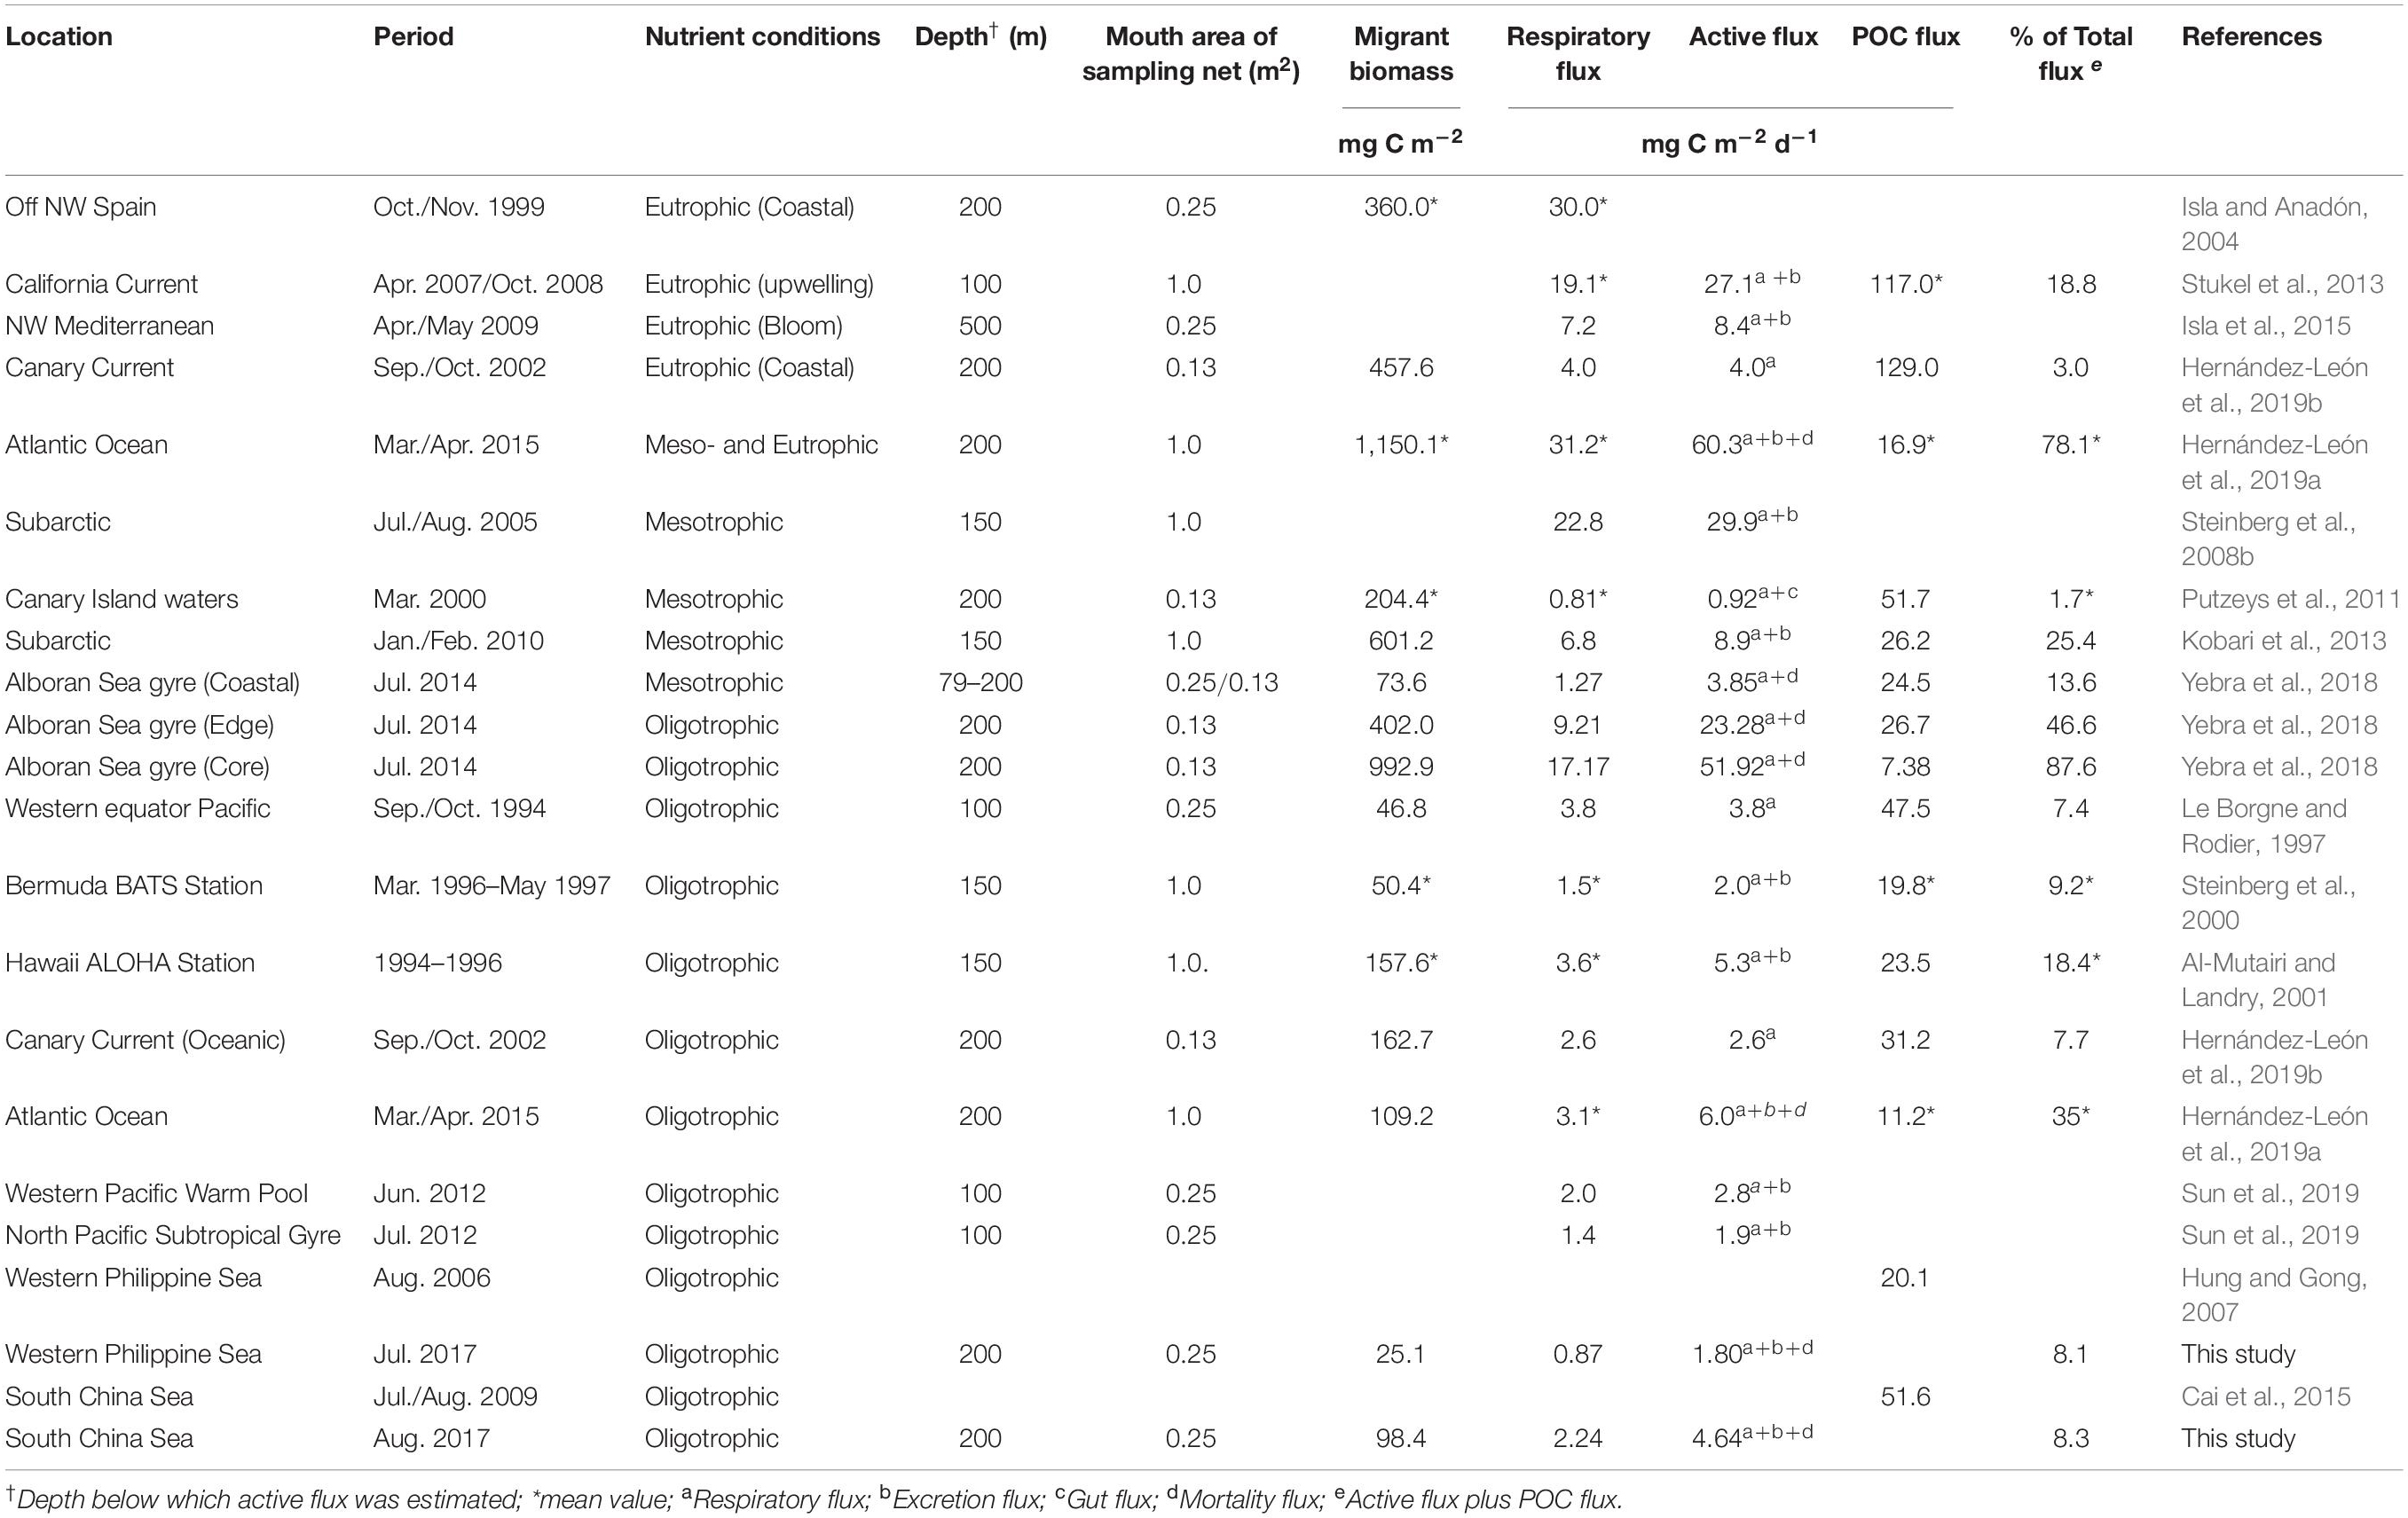
Table 3. Zooplankton active flux estimated in different oceanic zones.
The active flux transported by zooplankton DVM represented a considerable percentage of total carbon flux (active flux + POC flux), especially in the oligotrophic marine systems (Table 3). The relative importance of active flux transported by zooplankton DVM increases highly in oligotrophic regions due to the low sinking POC fluxes (Steinberg and Landry, 2017). The POC fluxes in WPS and SCS in summer were 20.1 and 51.6 mg C m–2 d1, respectively (Hung and Gong, 2007; Cai et al., 2015). Therefore, the mesozooplankton active fluxes also occupied an important proportion in the total flux in WPS and SCS, with similar proportions (Table 3).
The active carbon fluxes calculated in this study might be underestimated due to technical limitations. We primarily focused on the mesozooplankton collected by a net with a mouth opening of 0.25 m2 and a mesh size of 200 μm. Previous study has shown that the net with a mouth opening of 0.25 m2 could not efficiently collect the large-sized zooplankton (Zhang and Dam, 1997), such as euphausiids, decapods and medusae. Thus, the contributions of large zooplankton to the active carbon flux may be underestimated in our study. Additionally, our sampling depth was limited to 300 m, thus, mesozooplankton that migrate deeper than 300 m (Steinberg et al., 2008a), were not included in our calculation. Within our sampling depth, the dominant taxa consisting of small-sized copepods and protozoans had weak swimming abilities (Figure 5), indicating their limited contributions to active carbon export in WPS and SCS. However, we only measured the overall DW of mesozooplankton, instead of lineage-specific DW, thus the dominant contributors of active flux remain unclear and worthy further study.
In conclusion, the biodiversities, abundances, migrant biomasses and active fluxes of mesozooplankton were remarkably different between the SCS and WPS due to the distinct environmental factors. The migrant biomass in the SCS was higher than that in the WPS, which was caused by the high Chl a concentration and mesozooplankton biomass of the SCS. Moreover, the active carbon flux mediated by mesozooplankton in the SCS was higher than that in the WPS owing to the high migrant biomass of the SCS. The active flux transported by mesozooplankton DVM represents a considerable percentage of total carbon flux in the SCS and WPS, and plays an important role in the biological pump functioning in the two regions.
Data Availability Statement
The original contributions presented in the study are included in the article/Supplementary Material, further inquiries can be directed to the corresponding author/s.
Author Contributions
GL and HC conceived and coordinated the project with help from YZ. RG sampled. RG and HC did the classification and measurements. RG and HC analyzed the data with the help of YZ. The manuscript was co-written by RG, HC, YZ, and GL. All authors contributed to the article and approved the submitted version.
Funding
This work was supported by the National Key Research and Development Program of China (No. 2016YFA0601202) and the National Natural Science Foundation of China (No. 42076146).
Conflict of Interest
The authors declare that the research was conducted in the absence of any commercial or financial relationships that could be construed as a potential conflict of interest.
Publisher’s Note
All claims expressed in this article are solely those of the authors and do not necessarily represent those of their affiliated organizations, or those of the publisher, the editors and the reviewers. Any product that may be evaluated in this article, or claim that may be made by its manufacturer, is not guaranteed or endorsed by the publisher.
Acknowledgments
We would like to thank the captain and crew of the R/V “Dong Fang Hong 2,” and appreciate the kind help of Haoran Li and Yutao He for sample collection on board. We would also like to thank Bangqin Huang from Xiamen University for providing chlorophyll a data. We would also like to thank Fuhua Li from Institute of Oceanology, Chinese Academy of Sciences for giving helpful suggestions and comments on the manuscript. We would also like to thank the two reviewers for the highly constructive comments that improved the manuscript.
Supplementary Material
The Supplementary Material for this article can be found online at: https://www.frontiersin.org/articles/10.3389/fmars.2021.697743/full#supplementary-material
Footnotes
References
Al-Mutairi, H., and Landry, M. R. (2001). Active export of carbon and nitrogen at Station ALOHA by diel migrant zooplankton. Deep Sea Res. II Top. Stud. Oceanogr. 48, 2083–2103. doi: 10.1016/S0967-0645(00)00174-0
Andersen, V., and Sardou, J. (1992). The diel migrations and vertical distributions of zooplankton and micronecton in the Northwestern Mediterranean Sea I: euphausiids, mysids, decapods and fishes. J. Plankton Res. 14, 1129–1154. doi: 10.1093/plankt/14.8.1129
Briseño-Avena, C., Prairie, J. C., Franks, P. J. S., and Jaffe, J. S. (2020). Comparing vertical distributions of Chl-a fluorescence, marine snow, and taxon-specific zooplankton in relation to density using high-resolution optical measurements. Front. Mar. Sci. 7:602. doi: 10.3389/fmars.2020.00602
Cai, P., Zhao, D., Wang, L., Huang, B., and Dai, M. (2015). Role of particle stock and phytoplankton community structure in regulating particulate organic carbon export in a large marginal sea. J. Geophys. Res. Oceans 120, 2063–2095. doi: 10.1002/2014JC010432
Chen, G., Hou, Y., and Chu, X. (2011). Water exchange and circulation structure near the Luzon Strait in early summer. Chin. J. Oceanol. Limnol. 29, 470–481. doi: 10.1007/s00343-011-0198-0
Chen, J. F., Zheng, L. F., Wiesner, M. G., Chen, R. H., Zheng, Y. L., and Wong, H. K. (1998). Estimations of primary production and export production in the South China Sea based on sediment trap experiments. Chin. Sci. Bull. 43, 583–586. doi: 10.1007/BF02883645
Dai, L. P., Li, C. L., Tao, Z. C., Yang, G., Wang, X. C., and Zhu, M. L. (2017). Zooplankton abundance, biovolume and size spectra down to 3000 m depth in the western tropical North Pacific during autumn 2014. Deep Sea Res. I Oceanogr. Res. Pap. 121, 1–13. doi: 10.1016/j.dsr.2016.12.015
Dam, H. G., and Peterson, W. T. (1993). Seasonal contrasts in the diel vertical distribution, feeding behavior, and grazing impact of the copepod Temora longicornis in Long Island Sound. J. Mar. Res. 51, 561–594. doi: 10.1357/0022240933223972
Dam, H. G., Roman, M. R., and Youngbluth, M. J. (1995). Downward export of respiratory carbon and dissolved inorganic nitrogen by diel-migrant mesozooplankton at the JGOFS Bermuda time-series station. Deep Sea Res. I Oceanogr. Res. Pap. 42, 1187–1197. doi: 10.1016/0967-0637(95)00048-B
Eisner, L., Hillgruber, N., Martinson, E., and Maselko, J. (2013). Pelagic fish and zooplankton species assemblages in relation to water mass characteristics in the northern Bering and southeast Chukchi seas. Polar Biol. 36, 87–113. doi: 10.1007/s00300-012-1241-0
Farstey, V., Lazar, B., and Genin, A. (2002). Expansion and homogeneity of the vertical distribution of zooplankton in a very deep mixed layer. Mar. Ecol. Prog. Ser. 238, 91–100. doi: 10.3354/meps238091
Field, J. G., Clarke, K. R., and Warwick, R. M. (1982). A practical strategy for analysing multispecies distribution patterns. Mar. Ecol. Prog. Ser. 8, 37–52. doi: 10.3354/meps008037
Ge, R. P., Chen, H. J., Liu, G. X., Zhu, Y. Z., and Jiang, Q. (2021). Diel vertical migration of mesozooplankton in the northern Yellow Sea. J. Oceanol. Limnol. 39, 1373–1386. doi: 10.1007/s00343-020-0170-y
Giguère, L. A., St-Pierre, J. F., Bernier, B., Vézina, A., and Rondeau, J. G. (1989). Can we estimate the true weight of zooplankton samples after chemical preservation? Can. J. Fish. Aquat. Sci. 46, 522–527. doi: 10.1139/f89-070
Hays, G. C. (2003). A review of the adaptive significance and ecosystem consequences of zooplankton diel vertical migrations. Hydrobiologia 503, 163–170. doi: 10.1023/B:HYDR.0000008476.23617.b0
Hernández-León, S., Olivar, M. P., Fernández De Puelles, M. L., Bode, A., Castellon, A., Lopez-Perez, C., et al. (2019a). Zooplankton and micronekton active flux across the tropical and subtropical Atlantic Ocean. Front. Mar. Sci. 6:535. doi: 10.3389/fmars.2019.00535
Hernández-León, S., Putzeys, S., Almeida, C., Becognee, P., Marrero-Diaz, A., Aristegui, J., et al. (2019b). Carbon export through zooplankton active flux in the Canary Current. J. Mar. Syst. 189, 12–21. doi: 10.1016/j.jmarsys.2018.09.002
Hidaka, K., Kawaguchi, K., Murakami, M., and Takahashi, M. (2001). Downward transport of organic carbon by diel migratory micronekton in the western equatorial Pacific: its quantitative and qualitative importance. Deep Sea Res. I Oceanogr. Res. Pap. 48, 1923–1939. doi: 10.1016/S0967-0637(01)00003-6
Hung, C., and Gong, G. (2007). Export flux of POC in the main stream of the Kuroshio. Geophys. Res. Lett. 34:L18606. doi: 10.1029/2007GL030236
Ikeda, T. (2014). Respiration and ammonia excretion by marine metazooplankton taxa: synthesis toward a global-bathymetric model. Mar. Biol. 161, 2753–2766. doi: 10.1007/s00227-014-2540-5
Ikeda, T., and Motoda, S. (1978). Estimated zooplankton prodction and their ammonia excretion in the Kuroshio and adjacent seas. Fish. Bull. 76, 357–367.
Irigoien, X., Conway, D. V. P., and Harris, R. P. (2004). Flexible diel vertical migration behaviour of zooplankton in the Irish Sea. Mar. Ecol. Prog. Ser. 267, 85–97. doi: 10.3354/meps267085
Isla, A., Scharek, R., and Latasa, M. (2015). Zooplankton diel vertical migration and contribution to deep active carbon flux in the NW Mediterranean. J. Mar. Syst. 143, 86–97. doi: 10.1016/j.jmarsys.2014.10.017
Isla, J. A., and Anadón, R. (2004). Mesozooplankton size-fractionated metabolism and feeding off NW Spain during autumn: effects of a poleward current. ICES J. Mar. Sci. 61, 526–534. doi: 10.1016/j.icesjms.2004.03.014
Júnior, M. N., Brandini, F. P., and Codina, J. C. U. (2014). Distribution of planktonic cnidarians in response to South Atlantic central water intrusion in the South Brazilian Bight. Cont. Shelf Res. 89, 93–102. doi: 10.1016/j.csr.2014.02.022
Kobari, T., Kitamura, M., Minowa, M., Isami, H., Akamatsu, H., Kawakami, H., et al. (2013). Impacts of the wintertime mesozooplankton community to downward carbon flux in the subarctic and subtropical Pacific Oceans. Deep Sea Res. I Oceanogr. Res. Pap. 81, 78–88. doi: 10.1016/j.dsr.2013.07.003
Le Borgne, R., and Rodier, M. (1997). Net zooplankton and the biological pump: a comparison between the oligotrophic and mesotrophic equatorial Pacific. Deep Sea Res. II Oceanogr. Res. Pap. 44, 2003–2023. doi: 10.1016/S0967-0645(97)00034-9
Lepš, J., and Šmilauer, P. (2003). Multivariate Analysis of Ecological Data Using CANOCO. Cambridge: Cambridge University Press.
Li, K. Z., Ren, Y. Z., Ke, Z. X., Li, G., and Tan, Y. H. (2021). Vertical distribution of epipelagic and mesopelagic zooplankton in the continental slope of the northeastern South China Sea. J. Trop. Oceanogr. 40, 61–73. doi: 10.11978/2020061
Lian, X. P., Tan, Y. H., Liu, Y. H., Huang, L. M., Chen, Q. C., and Zhou, L. B. (2013). Preliminary study of zooplankton community in the Luzon strait. J. Biol. 30, 31–35. doi: 10.3969/j.issn.2095-1736.2013.01.031
Longhurst, A. R., Bedo, A. W., Harrison, W. G., Head, E. J. H., and Sameoto, D. D. (1990). Vertical flux of respiratory carbon by oceanic diel migrant biota. Deep Sea Res. I Oceanogr. Res. Pap. 37, 685–694. doi: 10.1016/0198-0149(90)90098-G
Ma, H., Zeng, Z., He, J. H., Chen, L. Q., Yin, M. D., Zeng, S., et al. (2008). Vertical flux of particulate organic carbon in the central South China Sea estimated from 234Th-238U disequilibria. Chin. J. Oceanol. Limnol. 26, 480–485. doi: 10.1007/s00343-008-0480-y
Madhupratap, M., and Haridas, P. (1990). Zooplankton, especially calanoid copepods, in the upper 1000 m of the south-east Arabian Sea. J. Plankton Res. 12, 305–321. doi: 10.1093/plankt/12.2.305
Martin, B., Eggert, A., Koppelmann, R., Diekmann, R., Mohrholz, V., and Schmidt, M. (2015). Spatio-temporal variability of zooplankton biomass and environmental control in the Northern Benguela upwelling system: field investigations and model simulation. Mar. Ecol. 36, 637–658. doi: 10.1111/maec.12173
Omori, M. (1969). Weight and chemical composition of some important oceanic zooplankton in the North Pacific Ocean. Mar. Biol. 3, 4–10. doi: 10.1007/BF00355587
Onsrud, M. S. R., and Kaartvedt, S. (1998). Diel vertical migration of the krill Meganyctiphanes norvegica in relation to physical environment, food and predators. Mar. Ecol. Prog. Ser. 171, 209–219. doi: 10.3354/meps171209
Pakhomov, E. A., Podeswa, Y., Hunt, B. P. V., and Kwong, L. E. (2019). Vertical distribution and active carbon transport by pelagic decapods in the North Pacific subtropical gyre. ICES J. Mar. Sci. 76, 702–717. doi: 10.1093/icesjms/fsy134
Putzeys, S., Yebra, L., Almeida, C., Bécognée, P., and Hernández-León, S. (2011). Influence of the late winter bloom on migrant zooplankton metabolism and its implications on export fluxes. J. Mar. Syst. 88, 553–562. doi: 10.1016/j.jmarsys.2011.07.005
Raybaud, V., Nival, P., Mousseau, L., Gubanova, A., Altukhov, D., Khvorov, S., et al. (2008). Short term changes in zooplankton community during the summer-autumn transition in the open NW Mediterranean Sea: species composition, abundance and diversity. Biogeosciences 5, 1765–1782. doi: 10.5194/bg-5-1765-2008
Shiozaki, T., Takeda, S., Itoh, S., Kodama, T., Liu, X., Hashihama, F., et al. (2015). Why is Trichodesmium abundant in the Kuroshio? Biogeosciences 12, 6931–6943. doi: 10.5194/bg-12-6931-2015
Sogawa, S., Sugisaki, H., Saito, H., Okazaki, Y., Ono, T., Shimode, S., et al. (2016). Seasonal and regional change in vertical distribution and diel vertical migration of four euphausiid species (Euphausia pacifica, Thysanoessa inspinata, T. longipes, and Tessarabrachion oculatum) in the northwestern Pacific. Deep Sea Res. I Oceanogr. Res. Pap. 109, 1–9. doi: 10.1016/j.dsr.2015.12.010
Steinberg, D. K., Carlson, C. A., Bates, N. R., Goldthwait, S. A., Madin, L. P., and Michaels, A. F. (2000). Zooplankton vertical migration and the active transport of dissolved organic and inorganic carbon in the Sargasso Sea. Deep Sea Res. I Oceanogr. Res. Pap. 47, 137–158.
Steinberg, D. K., Cope, J. S., Wilson, S. E., and Kobari, T. (2008a). A comparison of mesopelagic mesozooplankton community structure in the subtropical and subarctic North Pacific Ocean. Deep Sea Res. II Oceanogr. Res. Pap. 55, 1615–1635. doi: 10.1016/j.dsr2.2008.04.025
Steinberg, D. K., Goldthwait, S. A., and Hansell, D. A. (2002). Zooplankton vertical migration and the active transport of dissolved organic and inorganic nitrogen in the Sargasso Sea. Deep Sea Res. I Oceanogr. Res. Pap. 49, 1445–1461. doi: 10.1016/S0967-0637(02)00037-7
Steinberg, D. K., and Landry, M. R. (2017). Zooplankton and the ocean carbon cycle. Annu. Rev. Mar. Sci. 9, 413–444. doi: 10.1146/annurev-marine-010814-015924
Steinberg, D. K., Van Mooy, B. A. S., Buesseler, K. O., Boyd, P. W., Kobari, T., and Karl, D. M. (2008b). Bacterial vs. zooplankton control of sinking particle flux in the ocean’s twilight zone. Limnol. Oceanogr. 53, 1327–1338. doi: 10.4319/lo.2008.53.4.1327
Stukel, M. R., Ohman, M. D., Benitez-Nelson, C. R., and Landry, M. R. (2013). Contributions of mesozooplankton to vertical carbon export in a coastal upwelling system. Mar. Ecol. Prog. Ser. 491, 47–65. doi: 10.3354/meps10453
Sun, D., and Wang, C. (2017). Latitudinal distribution of zooplankton communities in the Western Pacific along 160 degrees E during summer 2014. J. Mar. Syst. 169, 52–60. doi: 10.1016/j.jmarsys.2017.01.011
Sun, D., Zhang, D., Zhang, R., and Wang, C. (2019). Different vertical distribution of zooplankton community between North Pacific subtropical gyre and Western Pacific warm pool: its implication to carbon flux. Acta Oceanol. Sin. 38, 32–45. doi: 10.1007/s13131-018-1237-x
Tan, S. R., Zhang, J. J., Li, H. L., Sun, L., Wu, Z. Z., Wiesner, M. G., et al. (2020). Deep ocean particle flux in the northern South China Sea: variability on intra-seasonal to seasonal timescales. Front. Earth Sci. 8:74. doi: 10.3389/feart.2020.00074
Tutasi, P., and Escribano, R. (2020). Zooplankton diel vertical migration and downward C flux into the oxygen minimum zone in the highly productive upwelling region off northern Chile. Biogeosciences. 17, 455–473. doi: 10.5194/bg-17-455-2020
Wu, J. F., Chung, S. W., Wen, L. S., Liu, K. K., Chen, Y. L., Chen, H. Y., et al. (2003). Dissolved inorganic phosphorus, dissolved iron, and Trichodesmium in the oligotrophic South China Sea. Glob. Biogeochem. Cy. 17:1008. doi: 10.1029/2002GB001924
Yamaguchi, A., Matsuno, K., and Homma, T. (2015). Spatial changes in the vertical distribution of calanoid copepods down to great depths in the North Pacific. Zool. Stud. 54, 1–12. doi: 10.1186/s40555-014-0091-6
Yamaguchi, A., Watanabe, Y., Ishida, H., Harimoto, T., Furusawa, K., Suzuki, S., et al. (2002). Community and trophic structures of pelagic copepods down to greater depths in the western subarctic Pacific (WEST-COSMIC). Deep Sea Res. I Oceanogr. Res. Pap. 49, 1007–1025. doi: 10.1016/S0967-0637(02)00008-0
Yang, G., Li, C., Wang, Y., Wang, X., Dai, L., Tao, Z., et al. (2017). Spatial variation of the zooplankton community in the western tropical Pacific Ocean during the summer of 2014. Cont. Shelf Res. 135, 14–22. doi: 10.1016/j.csr.2017.01.009
Yebra, L., Herrera, I., Mercado, J. M., Cortes, D., Gomez-Jakobsen, F., Alonso, A., et al. (2018). Zooplankton production and carbon export flux in the western Alboran Sea gyre (SW Mediterranean). Prog Oceanogr. 167, 64–77. doi: 10.1016/j.pocean.2018.07.009
Zhang, J. J., Li, H. L., Xuan, J. L., Wu, Z. Z., Yang, Z., Wiesner, M. G., et al. (2019). Enhancement of mesopelagic sinking particle fluxes due to upwelling, aerosol deposition, and monsoonal influences in the northwestern South China Sea. J. Geophys. Res Oceans 124, 99–112. doi: 10.1029/2018JC014704
Keywords: mesozooplankton, diel vertical migration, active carbon flux, South China Sea, Philippine Sea
Citation: Ge R, Chen H, Zhuang Y and Liu G (2021) Active Carbon Flux of Mesozooplankton in South China Sea and Western Philippine Sea. Front. Mar. Sci. 8:697743. doi: 10.3389/fmars.2021.697743
Received: 20 April 2021; Accepted: 24 August 2021;
Published: 13 September 2021.
Edited by:
Suzanne Jane Painting, Centre for Environment, Fisheries and Aquaculture Science (CEFAS), United KingdomReviewed by:
Dong Sun, Second Institute of Oceanography, Ministry of Natural Resources, ChinaLidia Yebra, Spanish Institute of Oceanography (IEO), Spain
Copyright © 2021 Ge, Chen, Zhuang and Liu. This is an open-access article distributed under the terms of the Creative Commons Attribution License (CC BY). The use, distribution or reproduction in other forums is permitted, provided the original author(s) and the copyright owner(s) are credited and that the original publication in this journal is cited, in accordance with accepted academic practice. No use, distribution or reproduction is permitted which does not comply with these terms.
*Correspondence: Guangxing Liu, Z3hsaXVAb3VjLmVkdS5jbg==
†These authors have contributed equally to this work and share first authorship