 Serena Blyth Lee
 Fan Zhang
 Charles James Lemckert
 Rodger Tomlinson
- 1Coastal and Marine Research Centre, Griffith University, Gold Coast, QLD, Australia
- 2Climate Action Beacon, Griffith University, Gold Coast, QLD, Australia
- 3Southern Marine Science and Engineering Guangdong Laboratory (Zhuhai), Zhuhai, China
- 4School of Design and the Built Environment and Centre for Applied Water Science, University of Canberra, Canberra, ACT, Australia
Understanding coastal circulation and how it may alter in the future is important in island settings, especially in the South West Pacific, where communities rely heavily upon marine resources, and where sea level rise (SLR) is higher than the global average. In this study we explore the use of an unstructured-mesh finite-volume modelling approach to assist in filling the knowledge gaps with respect to coastal circulation in remote island locations—selecting the Vanuatu and New Caledonia archipelagos as our example study site. Past limited observations and modelling studies are leveraged to construct and verify a regional/coastal ocean model based on the Finite-Volume Community Ocean Model (FVCOM). Following verification with respect to tidal behaviour, we investigate how changes in wind speed and direction, and SLR, alter coastal water levels and coastal currents. Results showed tidal residual circulation was typically associated with flow separation at headlands and islands. Trade winds had negligible effect on water levels at the coast, however, wind-residual circulation was sensitive to both wind speed and direction. Wind-residual currents were typically strongest close to coastlines. Wind residual circulation patterns were strongly influenced by Ekman flow, while island blocking, topographic steering and geostrophic currents also appear to influence current patterns. Tidal amplitudes and phases were unchanged due to SLR of up to 2 m, while maximum current speeds altered by as much as 20 cm/s within some coastal embayments. Non-linear relationships between SLR and maximum current speeds were seen at some coastal reef platform sites. Under higher sea levels, tidal residual currents altered by less than ±2 cm/s which is relatively significant given maximum tidal residual current speeds are typically below 10 cm/s. Our findings indicate that under higher sea levels, coastal processes governing sediment transport, pollutant dispersal and larval transport are likely to alter, which may have implications for coastal environments and ecosystems. Given winds influence coastal circulation and subsequent coastal processes, changes in trade winds due to climate change may act to further alter coastal processes. It is felt that the current modelling approach can be applied to other regions to help fill critical knowledge gaps.
Introduction
Lack of data documenting present-day coastal circulation in many remote islands impedes accurate prediction of how coastal environments and marine resources will fair under future oceanic and atmospheric conditions. Decisions regarding the allocation of coastal hazards zones, placement of infrastructure, future site development to accommodate expanding populations, and the management of natural resources, requires fine-scale (∼0.01–1 km resolution) process understanding. While desirable, it is not financially feasible to undertake comprehensive field surveys documenting coastal circulation at every island location. Over recent decades, whilst improved understanding of how sea levels vary over broad scales (tens of km) in remote island regions has been garnered from global modelling studies and satellite observation platforms, detailed understanding of coastal circulation and subsequent coastal processes necessary for making informed coastal planning decisions at these locations is often lacking. A principal limitation in our ability to predict coastal sea level variability is coarse model resolution and coarse bathymetry (Jevrejeva et al., 2019).
Remote Pacific Island communities rely heavily upon marine resources as a source of food, wealth and cultural identity, and coastal zones are intensely utilised for residential and economic activities (Andrew et al., 2019). Lack of understanding with respect to present-day coastal circulation impedes accurate prediction of how coastal environments and marine resources will fair under future oceanic and atmospheric conditions. In order to understand how these changes will affect remote Pacific Island communities, higher resolution modelling and monitoring is necessary.
In the absence of comprehensive field observations describing coastal circulation and coastal processes, well-constructed numerical models provide a useful tool to help fill data gaps. In this study we construct and employ an unstructured-mesh Finite-Volume Community Ocean Model (FVCOM) detailed in Chen et al. (2006) to investigate coastal circulation across the Vanuatu/New Caledonia region of the South West Pacific Ocean. Observations from tide gauges and previous limited coastal monitoring and modelling studies are leveraged, to verify the model with respect to tides, and to identify strengths and limitations of the model setup. Following verification, the model is used to investigate how changes in trade winds, and changes in mean sea level, alter water levels and currents across the region and select coastal locations.
Site Description
The Vanuatu archipelago contains 83 islands, spread between latitudes 13°S–21°S, and longitudes 166°E–170°E (Figure 1). While 65 islands are inhabited, only 14 islands have surface areas exceeding 100 km2. The islands of Vanuatu and New Caledonia have complex shoreline environments, comprised of a mix of fringing reefs and lagoons, coarse white sand beaches, fine volcanic black sand beaches, uplifted reef limestone terraces, soft sedimentary cliffs, and coastal plains. Small sections of coastline have been modified using hard engineered seawalls or gabion cages filled with oyster shells. The majority of shoreline environments across the islands, however, are unmodified. The majority of land sits higher than 5 m elevation, well beyond worst-case sea level rise (SLR) projections. However, the main populations centres are located in coastal areas, and major infrastructure such as airports and roads are situated in low-lying coastal land or reclaimed land. Fisheries play a vital role for island communities providing both food security and employment (David, 2016). Consequently, people’s health, wellbeing and livelihoods are strongly connected with coastal and marine resources. For these reasons, climate change and SLR still pose a significant threat, to island communities, despite the limited extent of low-lying (>5 m elevation) coastal land.
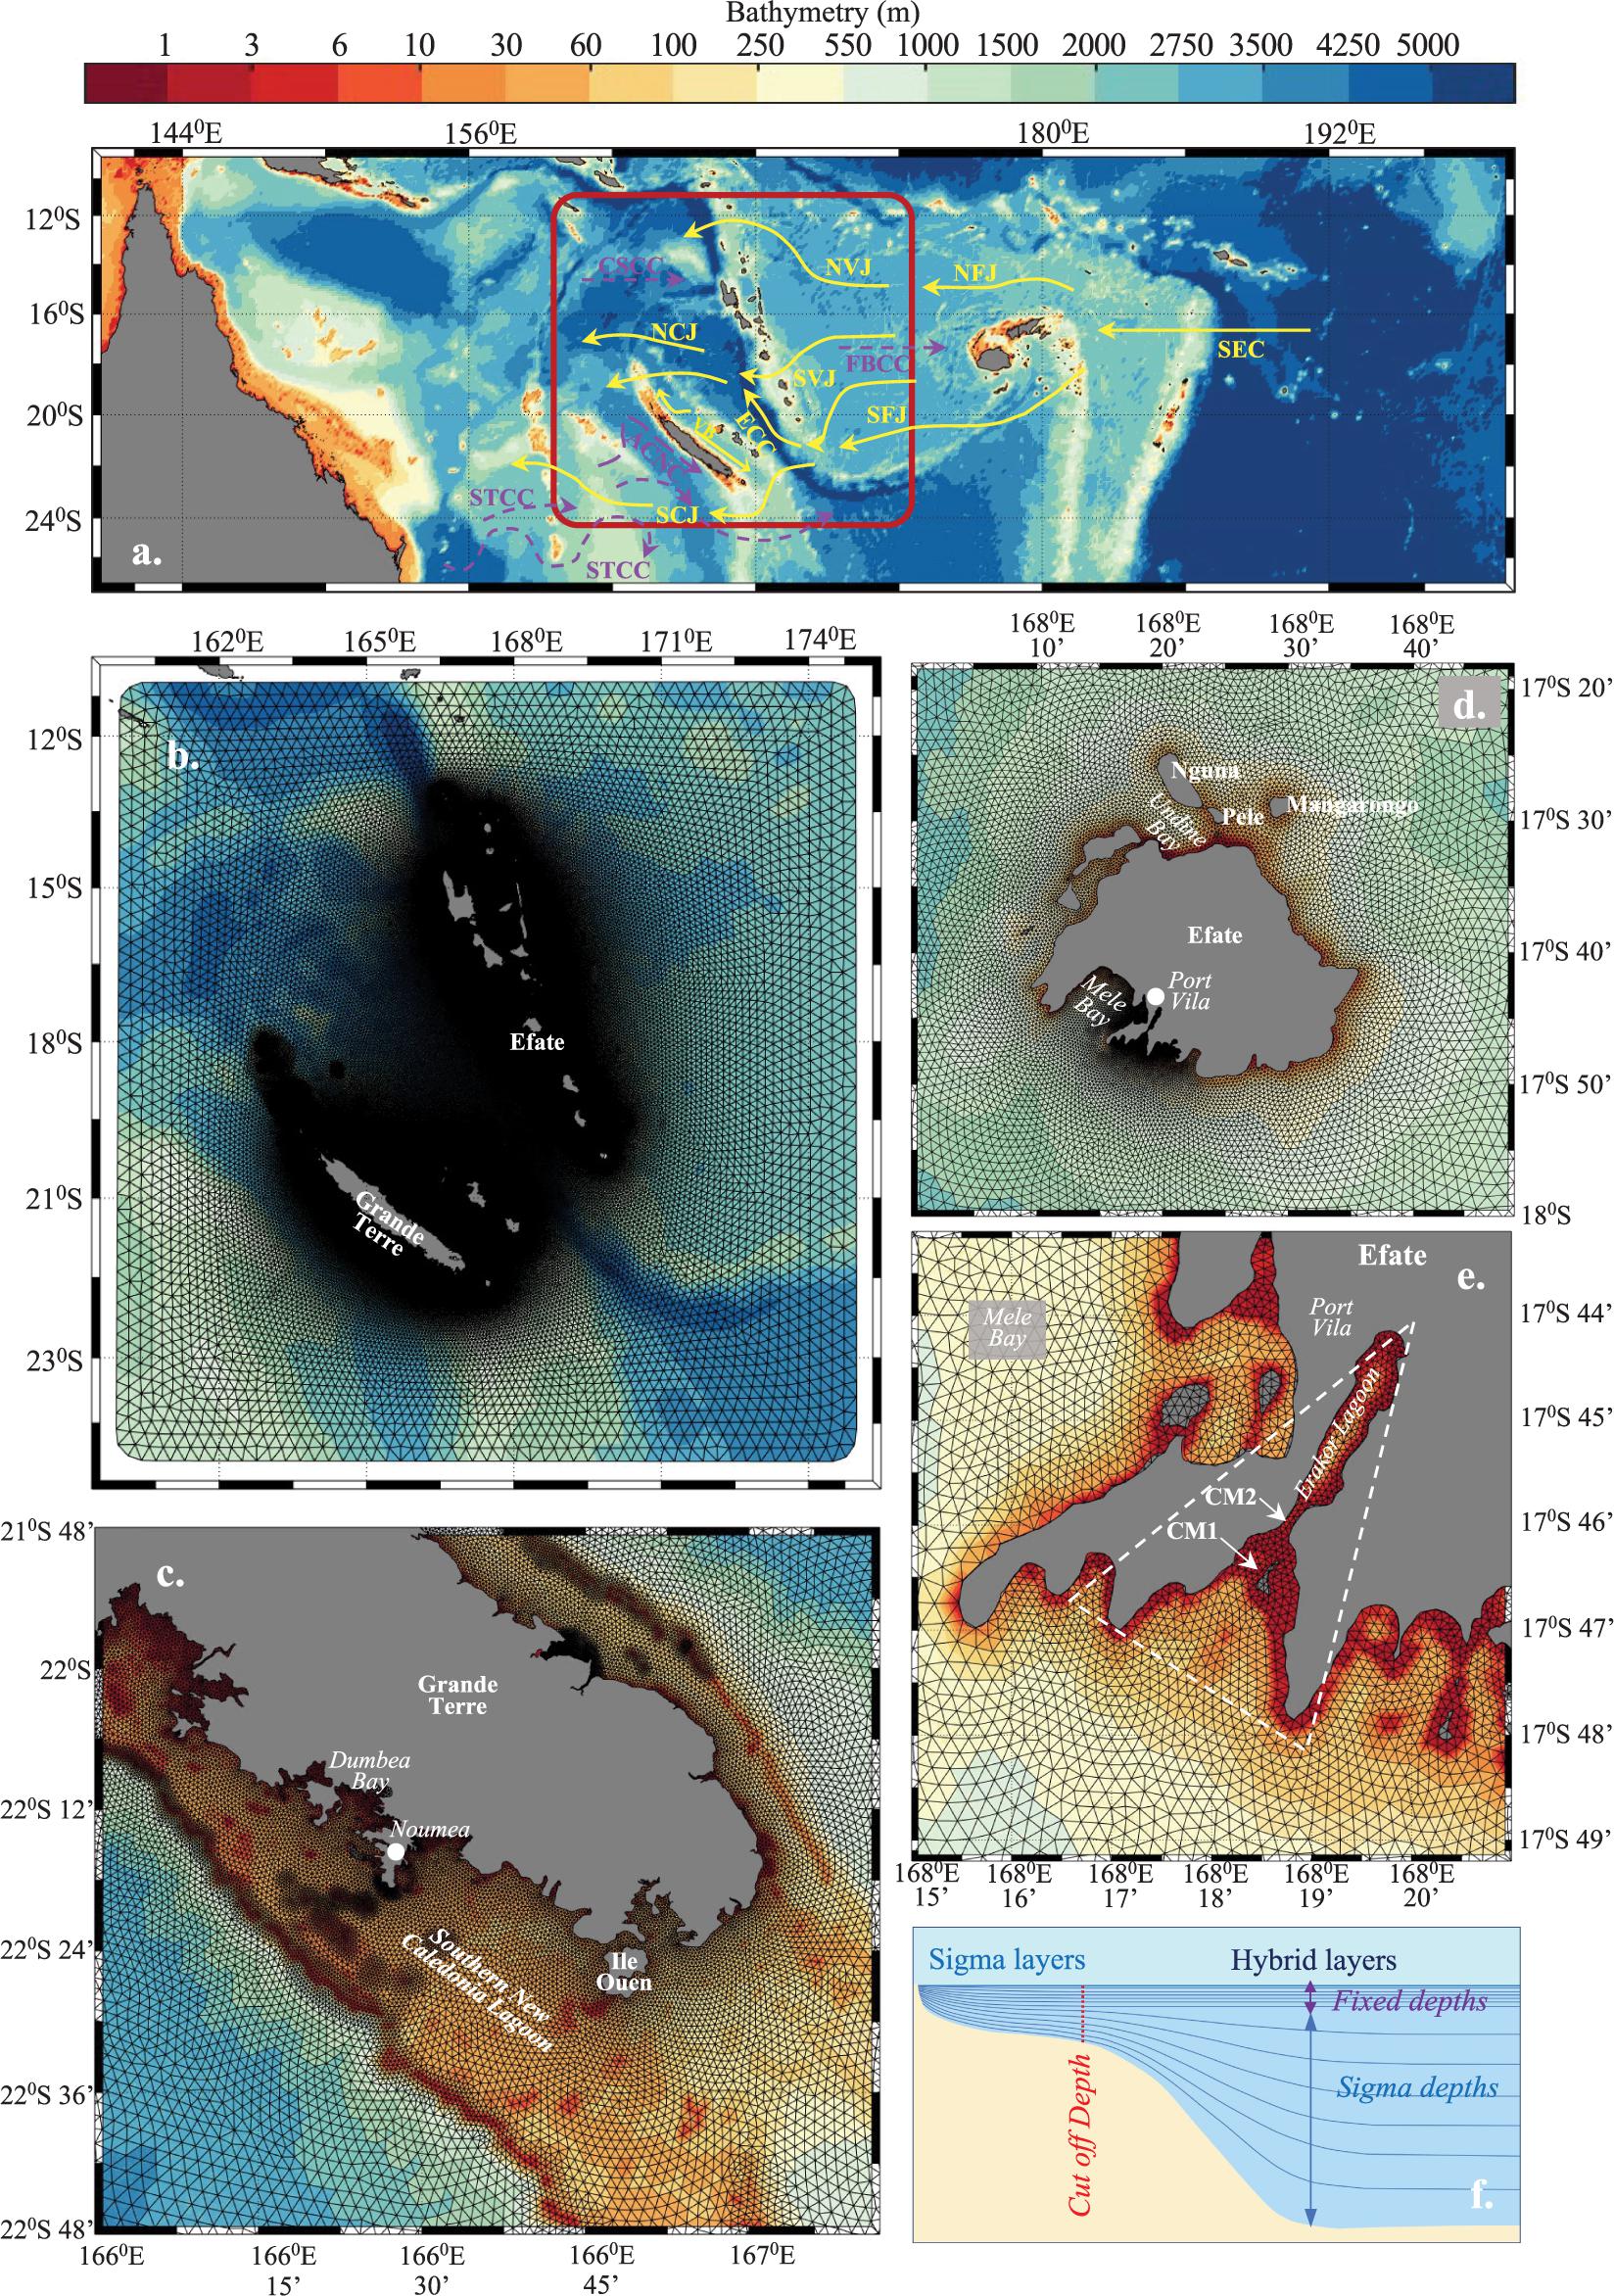
Figure 1. Site map and bathymetry of the ocean region investigated, covering the Vanuatu and New Caledonia archipelagos (a). The model domain extent is shown highlighted in the dark red rectangle. Yellow arrows represent regional currents associated with the passage of the Southern Equatorial Current (SEC) through the archipelagos and purple dashed arrows represent counter currents in the region. Indicated are the North/South Fiji Jets (NFJ/SFJ), North/South Vanuatu Jets (NVJ/SVJ), North/South Caledonia Jets (NCJ/SCJ), East Caledonia Current (ECC), the Vauban Current (VC), the SubTropical Counter Current (STCC), Coral Sea Counter Current (CSCC), Alis Current of New Caledonia (ACNC), and the Fiji Basin Counter Current (FBCC). The Van-Fvcom model grid constructed for the study (b) overlying bathymetry. Excerpts of the Van-Fvcom model grid covering southern Grande Terre (c), Efate Island (d) and Erakor Lagoon, Efate Island (e) overlying bathymetry. Erakor Lagoon is highlighted in the dashed white triangle (e). The legend shown at the top of the figure applies to panels (a–e). Visual description of the hybrid vertical layer system employed by the Van-Fvcom model (f).
Vanuatu lies just east of the New Hebrides/Vanuatu Trench, where water depths exceed 7,000 m. The islands of New Caledonia lie west of the Trench (Figure 1a) and are divided into four main groups, Grande Terre, the main island, and largest island in our model domain, the Loyalty Islands west of Grande Terre, the Belep Islands north west of Grande Terre, the Ilse of Pines south east of Grande Terre and the Chesterfield Islands, located over 500 km to the east of Grande Terre and which falls outside the model domain used in this study.
The majority of islands in the region are fringed by coral reef/lagoon systems. Within lagoons, water depths are typically <50 m. Beyond reefs, topography is very steep, rapidly descending to over 1,000 m a few hundred metres past outer reefs (Figure 1a).
The predominant trade wind direction is from the South East, and meteorological events such as Tropical Cyclones typically form in lower latitudes, tracking south, south-west. The islands act as an obstruction to the broad-scale ocean circulation, due to the Southern Equatorial Current (SEC) bifurcating around the islands (Figure 1a), forming boundary currents and western zonal jets at the northern and southern ends of islands/island groups (Cravatte et al., 2015). While relatively little is known about the variability of these currents and jets, research cruises undertaken in waters between New Caledonia and Vanuatu as part of the Southwest Pacific Ocean Circulation and Climate Experiment (SPICE) project (Ganachaud et al., 2014), have documented their presence and general pathways. A schematic representation of the known currents and jets flowing in our region of interest is presented in Figure 1a.
Local circulation features such as upwelling, downwelling, and near-coastal currents result from the interaction between island topography, ocean currents, and atmospheric winds, with the strength of these processes being influenced by island orientation with respect to wind and ocean current direction (Cravatte et al., 2015). Hénin and Cresswell (2005) investigated upwelling and downwelling using satellite observations and in situ observations obtained from four outer reef locations surrounding Grande Terre, New Caledonia. The modelling experiments undertaken by Marchesiello et al. (2010), explored upwelling/downwelling events around New Caledonia, however, exchange processes between oceanic and lagoon waters were not addressed.
With respect to SLR, analysis of satellite altimetry data for the period 1993–2018, calculated the global mean rate of SLR to be 3.1 ± 0.3 mm/year (WCRP Global Sea Level Budget Group, 2018). Over this same period, in the remote South Pacific Island region, the rate of SLR ranged from ∼ 3 to 5 mm/year, and was ∼4 mm/year in the Vanuatu/New Caledonia region (Hamlington et al., 2020). Port Vila, Vanuatu, and Noumea, New Caledonia were included in a study investigating relationships between SLR and tidal characteristics based upon analysis of tide gauge records (Devlin et al., 2017). These same two locations were included in a global modelling study by Pickering et al. (2017) investigating the effect future SLR (0.5–10 m) would have on future Highest Astronomical Tide (HAT) levels, and M2 and K1 amplitudes. The last IPCC 5 report presented ensemble CMIP5 projections of SLR due to four different emission scenarios, projecting up to 0.98 m global mean sea level (GMSL) rise by 2100 under the highest emission scenario (Church et al., 2013). For the Vanuatu/New Caledonia region, future sea level in 2100 was projected to range by up to 10% from GMSL (Church et al., 2013). Hermans et al. (2021) used the same methodology previously employed to generate CMIP5 ensemble future SLR values, estimating GMSL under the highest emission scenario (SSP5-RECP 8.5) will increase by up to 1.05 m by 2100, relative to 1986–2005 levels. To enable cross comparison instability of the Antarctic ice sheet is not accounted for in the results presented by Hermans et al. (2021) and thus these results likely under-predict future sea level for this scenario. Similar analysis of ensemble CMIP6 data estimating regional SLR are presently not available, however, it is anticipated that similar variations of up to 10% from global values might be expected. In an effort to provide useful information for risk averse stakeholders, such as coastal planners and managers of critical infrastructure, Dayan et al. (2021) conducted an assessment of high-end sea level scenarios (HESs), providing maps of regional HESs projections. From this analysis, if temperatures stabilised at 2°C above pre-industrial levels by 2100, HESs in the Vanuatu/New Caledonia region was estimated to increase by between 1 and 1.2 m, under the “likely” (17–83%) range, increasing to 1.8–2 m under the “credible” (5–95%) range. If temperatures stabilised at 5°C over this same period HES increased to 2–2.2 m and 3.5–3.8 m under the “likely” and “credible” ranges respectively (Dayan et al., 2021).
While progress has been made with respect to understanding regional circulation processes in the South West Pacific, and processes influencing sea level trends, near-coastal circulation for the majority of Pacific Islands, including the islands of Vanuatu and much of New Caledonia, remains poorly understood. As a consequence, our ability to predict how coastal circulation and coastal water levels will alter under future ocean conditions is limited. By constructing a numerical model capable of resolving circulation processes within coastal waterways, we aim to begin to address these challenges.
Methodology
To better infer how climate change (predicted at large scale in low-resolution climate models) will influence island ecosystems and coastal processes, these poorly-understood, complex, near-coastal circulations and their relationship to large-scale ocean circulation must be better understood. Further, attempts to replicate the exchange between oceanic and coastal waters, including lagoon waters, is necessary in order to capture the full range of processes influencing near-shore sea levels and coastal processes. Therefore, in this study we construct an unstructured mesh, triangular cell grid, that encompasses a wide region (∼13.5° latitude, ∼15° longitude), but whose resolution nearshore is sufficiently fine (∼100 m), to resolve complex island shoreline geometry. In this way we endeavour to improve understanding of coastal circulation in this relatively under-studied region, where communities rely heavily on marine resources and ecosystems.
In this study we focus purely on tidal circulation, wind driven circulation, and how SLR might modify tidal characteristics and coastal currents, excluding the important role of regional circulation, which will be addressed in future modelling studies. It is recognised that wind-wave processes play an important role in coastal circulation, however, these processes are not addressed in this paper. For the purpose of this paper, the term “coastal” is used to describe shallow (depth <∼100 m) water environments within barrier-reef lagoon systems, or for islands with fringing reefs and steep near-shore topography, “coastal” is taken to mean waters within a few kilometres of shorelines.
Model Description
The Finite Volume Coastal Ocean Model (FVCOM; Chen et al., 2006) is used to configure a coupled coastal-ocean model for the Vanuatu and New Caledonia archipelagos, hereafter referred to as Van-Fvcom. For the simulations performed in this study, the model is run in three-dimensional barotropic mode. The following governing equations for momentum and continuity are solved by the FVCOM model:
where u, v, and w represent the velocity components in the x (eastward), y (northward), and z (vertical) directions, respectively, f is the Coriolis parameter, pa is air pressure at the sea surface, p is the hydrostatic pressure, ρ0 is the reference water density, Km and Kh are the vertical and horizontal eddy viscosity and g is gravitational acceleration. The direct effect of the tidal-generating force within the model domain is not considered.
The open ocean boundary encircles the model domain, with the distance between islands of interest and open boundaries exceeding three hundred kilometres. A single land cell separates the beginning and end of the open ocean boundary, positioned over Rennell Island (160.264°E, 11.663°S) (Figures 1b–e). In the vertical direction 26 levels were employed using a hybrid scheme. The hybrid scheme used stretched sigma coordinates for all levels in waters <100 m deep, while for deeper waters the first six upper layers employed fixed layer thicknesses of 2.5, 5.0, 7.5, 10, 10, and 10 m (from the surface layer to the sixth layer, respectively) and evenly distributed sigma coordinates for the remaining levels. A simplified visualisation of a hybrid layer scheme is shown in Figure 1f.
Initially it was intended that full resolution coastline files obtained from the global self-consistent, hierarchical, high-resolution geography database (Wessel and Smith, 1996), version 2.3.7 released in 2017, would be used to generate model grid land boundaries for the islands of Vanuatu and New Caledonia. However, it was found that the island shorelines positions from this dataset contained an offset of a few hundred metres, relative to satellite images, coral reef extent data from the Millennial Coral Reef Mapping project [Spalding et al., 2001; IMaRS-USF and Institut de Recherche pour le Developpement (IRD), 2005; Institute for Marine Remote Sensing-University of South Florida (IMaRS-USF)., 2005; UNEP-WCMC et al., 2010], and LiDAR data, despite all datasets reportedly using the WGS 84 the coordinate system. Such small offsets are unlikely to cause irregularities in coarser resolution (>500 m) fixed-grid regional models, however, given our model is attempting to resolve coastal lagoon systems, the data discrepancy posed a challenge. This challenge was made more difficult by a lack of high resolution (<500 m) elevation data available in this region, from which a consistent shoreline might be generated based upon elevation contours. After attempts to align the different datasets were unable to resolve the discrepancies, new shoreline data were generated, by manually digitised island shorelines using google earth. For the purpose of this study, shoreline polyline vertices were placed on the landward side of the land/water interface identified in satellite images. This was done in order so as to allow the movement of water overland in response to changing water levels. Given the majority of island shorelines have narrow coastal fringes, the shoreline was typically positioned within 50 m of the land/water interface. In areas covered by mangroves, the shoreline was placed landward of the mangrove area where possible. Mangroves typically occupy low-lying land, including intertidal flats, likely to become inundated during the tidal cycle and under higher sea levels, justifying their inclusion in the model domain. It should be noted, however, the influence mangroves may have on the movement of water due to friction and obstruction of flow, was not accounted for in this study. When constructing the Van-Fvcom grid, cell vertices, were positioned along the digitised shorelines thus capturing the complex geometry of the coastal waterways (Figure 1). Coastal waters are resolved applying grid resolutions of between 0.1 and 1.2 km along island shorelines. Higher resolutions (∼0.1 km) are employed in locations where high-resolution (∼ 5 m × 5 m) coastal bathymetry and elevation data were available (e.g., Figures 1d,e). While the model grid was constructed to closely follow coastlines, a lack of sufficient blended coastal elevation/bathymetry data at most locations limits our ability to replicate intertidal processes across all island shorelines, however, as improved data becomes available these data can be incorporated into the model. Similarly, while a concerted effort was made to resolve coastal reef/lagoons systems, the lack of high-resolution (<100 m) data capturing bathymetry in these geometrically complex systems likely limits our ability to accurately represent all processes governing circulation within reef waters. To allow flow over land in response to water level variations due to tidal processes and applied SLR, wetting and drying was implemented, using a using a cut-off water depth of 10 cm to trigger a cell becoming wet or dry. Using this regime grid cells on low-lying (<2 m HAT) coastal land, or in intertidal zones only become active when the water level exceeds the cut-off water depth. As such the shoreline moves in response to water level. Flow around small islands (<1 km across) incorporated in the model grid is accounted for via elevation, since cells whose elevation exceeds the minimum water depth remain dry during simulations.
High-resolution (∼5 m horizontal resolution) blended coastal elevation/bathymetry data for coastal waters of Southern Efate Island, and Southern Espiritu Santo Island are obtained from the Vanuatu Meteorology and Geo-Hazards Department. High resolution (∼5 m horizontal resolution) bathymetry data for Port Resolution, Tanna Island are obtained from the UK Hydrographic Office. For the remaining areas, bathymetry and coastal topography relied upon the GEBCO 15 arc second data (GEBCO Compilation Group, 2020), supplemented with data documented in nautical charts. Given GEBCO data poorly resolves coastal bathymetry and elevations, cells depths around islands reliant upon these data were manually edited to better match depths documented in nautical charts. While rudimentary, this methodology was necessary given the absence of adequate near-shore bathymetry and elevation data currently available in this remote island region.
At the offshore open boundary, tidal elevations are prescribed using eight tidal constituents (M2, S2, N2, K2, K1, O1, P1, and Q1) according to the Oregon State University global tidal model, TPXO9-atlas (Egbert and Erofeeva, 2002). At the ocean bed, a quadratic stress is exerted assuming a logarithmic bottom boundary layer. There is little understanding of the spatial variability in bed characteristics in our model region. For this study variable bottom roughness is applied, setting maximum bottom roughness heights (z0) of 2.5 cm in shallow waters (depths <50 m) decreasing to 1 mm in the deep ocean (depths >200 m). Sensitivity tests conducted applying uniform bottom roughness between 0.01 and 2.5 cm showed predicted water levels and currents were generally insensitive to changes in bottom roughness values ranging from 0.1 to 2.5 cm.
When investigating changes in coastal circulation, particularly maximum current speeds and residual circulation, three example sites are used to discuss coastal results. The sites selected include southern Grande Terre, New Caledonia, Efate Island Vanuatu, and Erakor Lagoon, near Port Vila on the south-western side of Efate Island. Southern Grande Terre, encompasses the Southern New Caledonia Lagoon, a relatively well-studied reef/lagoon system, on the south-western side of Grande Terre. Efate Island lies in central Vanuatu, housing the national capital Port Vila. Erakor Lagoon is a small urbanised reef/lagoon system near Port Vila where some focussed coastal process studies have been undertaken (Faivre et al., 2020).
Numerical Experiments
Tidal Behaviour
Model runs are conducted to verify the model’s ability to replicate tidal characteristics. Simulations run from July 2015 to December 2016. Water level observation data at 11 tide gauges located within the model domain, were obtained from the IOC Sea Level Station Monitoring Facility [Flanders Marine Institute (VLIZ) and Intergovernmental Oceanographic Commission (IOC), 2021] and the University of Hawaii Sea Level Centre (Caldwelal et al., 2015). Four tide gauges are located on Vanuatu islands, and seven tide gauges are located on New Caledonia islands. The quality of observations at 9 of the 11 locations is not deemed to be research quality, the two exceptions are Port Vila in Vanuatu and Noumea in New Caledonia. Both sites have been included in the GLOSS tide gauge network. The water level data are provided in raw form, and as such, are affected by non-tidal influences, including atmospheric pressure, wind, and buoyancy related contributions, as well as contributions due to changes in regional circulation associated with ENSO cycles. In order to remove non-tidal influences, constituent analysis was performed on the raw observations using the U-tide program (Codiga, 2011), with the subsequent constituent amplitudes and phases used to predict tidal water levels at each location. The resulting tidal water level time series were compared with Van-Fvcom predicted water levels extracted at grid cells nearest tide gauge locations, satisfying the criteria that the grid cell depth >3 m to avoid the selection of intertidal grid cells. Constituent analysis of predicted water levels were compared with observed constituent data to determine the accuracy with which the model replicated observed tidal characteristics. Constituent data reported at an additional ten temporary water level monitoring sites within the Southern New Caledonia Lagoon (SNC Lagoon) were also compared with tidal constituents calculated from Van-Fvcom model water levels extracted nearest these locations.
Following verification with respect to tidal water levels, the Van-Fvcom model was used to predict tidal water levels at 12 unmonitored locations across Vanuatu. Results of constituent analysis for the five main tidal constituents (M2, K1, S2, N2, and O1) are reported for these 12 locations, to assist fill gaps in knowledge of tidal behaviour at unmonitored sites.
To understand the strengths and limitations of the Van-Fvcom model with respect to replication of currents in coastal waters, tidal currents extracted at grid points nearest to current meters are compared with observations. In New Caledonia, current observations were obtained at five sites within the SNC Lagoon (Douillet, 1998; Douillet et al., 2001). The only published study documenting tidal currents in coastal waters of Vanuatu, was undertaken in Erakor Lagoon, Efate Island by Faivre et al. (2020). Current velocity data from the same 58-days of the 60 day Van-Fvcom tidal simulation were analysed to determine maximum current speeds, and M2 tidal ellipses. Van-Fvcom M2 ellipses were mapped on top of maximum current speeds, and visually compared with ellipses documented in previous SNC Lagoon modelling studies (Douillet, 1998; Douillet et al., 2001). Maximum current speeds extracted from grid cells nearest to the CM1 and CM2 current meter sites in Erakor Lagoon (locations shown in Figure 1e) were compared with observed maximum currents speeds reported by Faivre et al. (2020).
Van-Fvcom maximum current speed data from tidal simulations are plotted for later comparison with simulations applying uniform wind fields in addition to tidal forcing, and simulations applying uniform SLR. Residual current speeds and directions were calculated for similar comparisons. In our study we do not address the influence of residual currents entering the model domain at the open boundary and only address internal circulatory residuals.
Wind Experiments
To investigate the sensitivity of coastal circulation to wind, nine 31-day simulations were run employing uniform 10, 20, and 40 km/h winds from the North East, East, and South East, to reflect predominant trade wind directions and speeds (light, moderate, and strong). Water levels were extracted at each tide gauge location and compared with tide-only simulations conducted over the same timeframe. The first 3 days of data were ignored to allow for model spinup, and the subsequent 28 days, covering two neap-spring tidal cycles analysed, to determine maximum depth-averaged current speeds (maxDA_curSp), and residual currents. The effect of the different wind regimes was investigated by calculating the difference in maxDA_curSp associated with each wind regime (Wind & Tide maxDA_curSp – Tide maxDA_curSp). To calculate residual currents due to wind only, 28-day mean eastward and northward currents were calculated at each grid cell for both tide-only and wind and tide simulations. The tide-only mean currents were then subtracted from wind and tide mean currents to obtain wind residual currents.
Sea Level Rise
To investigate the relationship between SLR and tidal behaviour, two different SLR experiments applying 1 and 2 m SLR were conducted. CMIP6-based global mean sea level (GMSL) ensemble projections estimate mean sea levels by 2100 will increase by 0.52–1.05 m relative to 1986–2005 levels, applying the SSP5-RCP8.5 scenario (Hermans et al., 2021). Altimetry sea level observations between 2005 and 2016 indicate GMSL increased by nearly 4 cm over this period (Yi et al., 2017). Thus 1 m SLR reflects an upper estimate for GMSL relative to 2016 levels, which is the year used to represent present-day conditions in this study. It is recognised that this value likely does not fully account for contributions associated with the instability of the Antarctic ice sheet due to the assumptions made when generating the CMIP6 ensemble estimates (Hermans et al., 2021). The 2 m SLR value employed, reflects “credible” high-end scenarios of SLR by 2100, assuming 2°C warming relative to pre-industrial air temperatures, while also falling within the “likely” range assuming 5°C warming (Dayan et al., 2021), where high-end scenario values attempt to better account for the contribution of the Antarctic ice sheet. SLR values of 1 and 2 m were also chosen in this study to be consistent with other studies addressing the impact of SLR (e.g., Pelling and Green, 2013; Pickering et al., 2017).
For both simulations the additional SLR was uniformly added to tidal forcing at the open boundary and the model run for 60 days. The first ten simulation days were ignored to allow for model spin-up. Predicted water levels were extracted at tide gauge locations, and tidal constituent analysis performed to determine if 1–2 m SLR altered tidal constituent amplitudes and phases, thus changing tidal behaviour. Following this determination, maxDA_curSp and residual currents for the two SLR scenarios were compared to baseline (0 m SLR) maxDA_curSp and residual currents, to establish how SLR might alter circulation.
Results
Tidal Water Level Verification
Modelled water levels show strong agreement with observed water levels (Figure 2). Tidal constituent analysis comparisons also show strong agreement (Table 1) with respect to both amplitudes and phases. Tidal behaviour across the region is dominated by the M2 constituent, whose amplitudes are approximately double K1 and S2 amplitudes, and approximately four times N2 and O1 amplitudes (Table 1). For the M2 constituent, mean difference between observed and predicted amplitudes and phases across all 11 tide gauge sites was 2.0 cm and 4.8°, respectively. Maximum differences in M2 amplitudes and phases were 4.3 cm and 24°, at Litzlitz (Table 1 and Figure 2C). For the K1 constituent, mean difference between observed and predicted amplitudes and phases across all 11 sites was 1.9 cm and 12.7°, respectively. Maximum difference in K1 amplitude was 4.1 cm at Tanna Island (Table 1 and Figure 2E) and maximum difference in K1 phase was 24.8°, at Thio (Table 1 and Figure 2H).
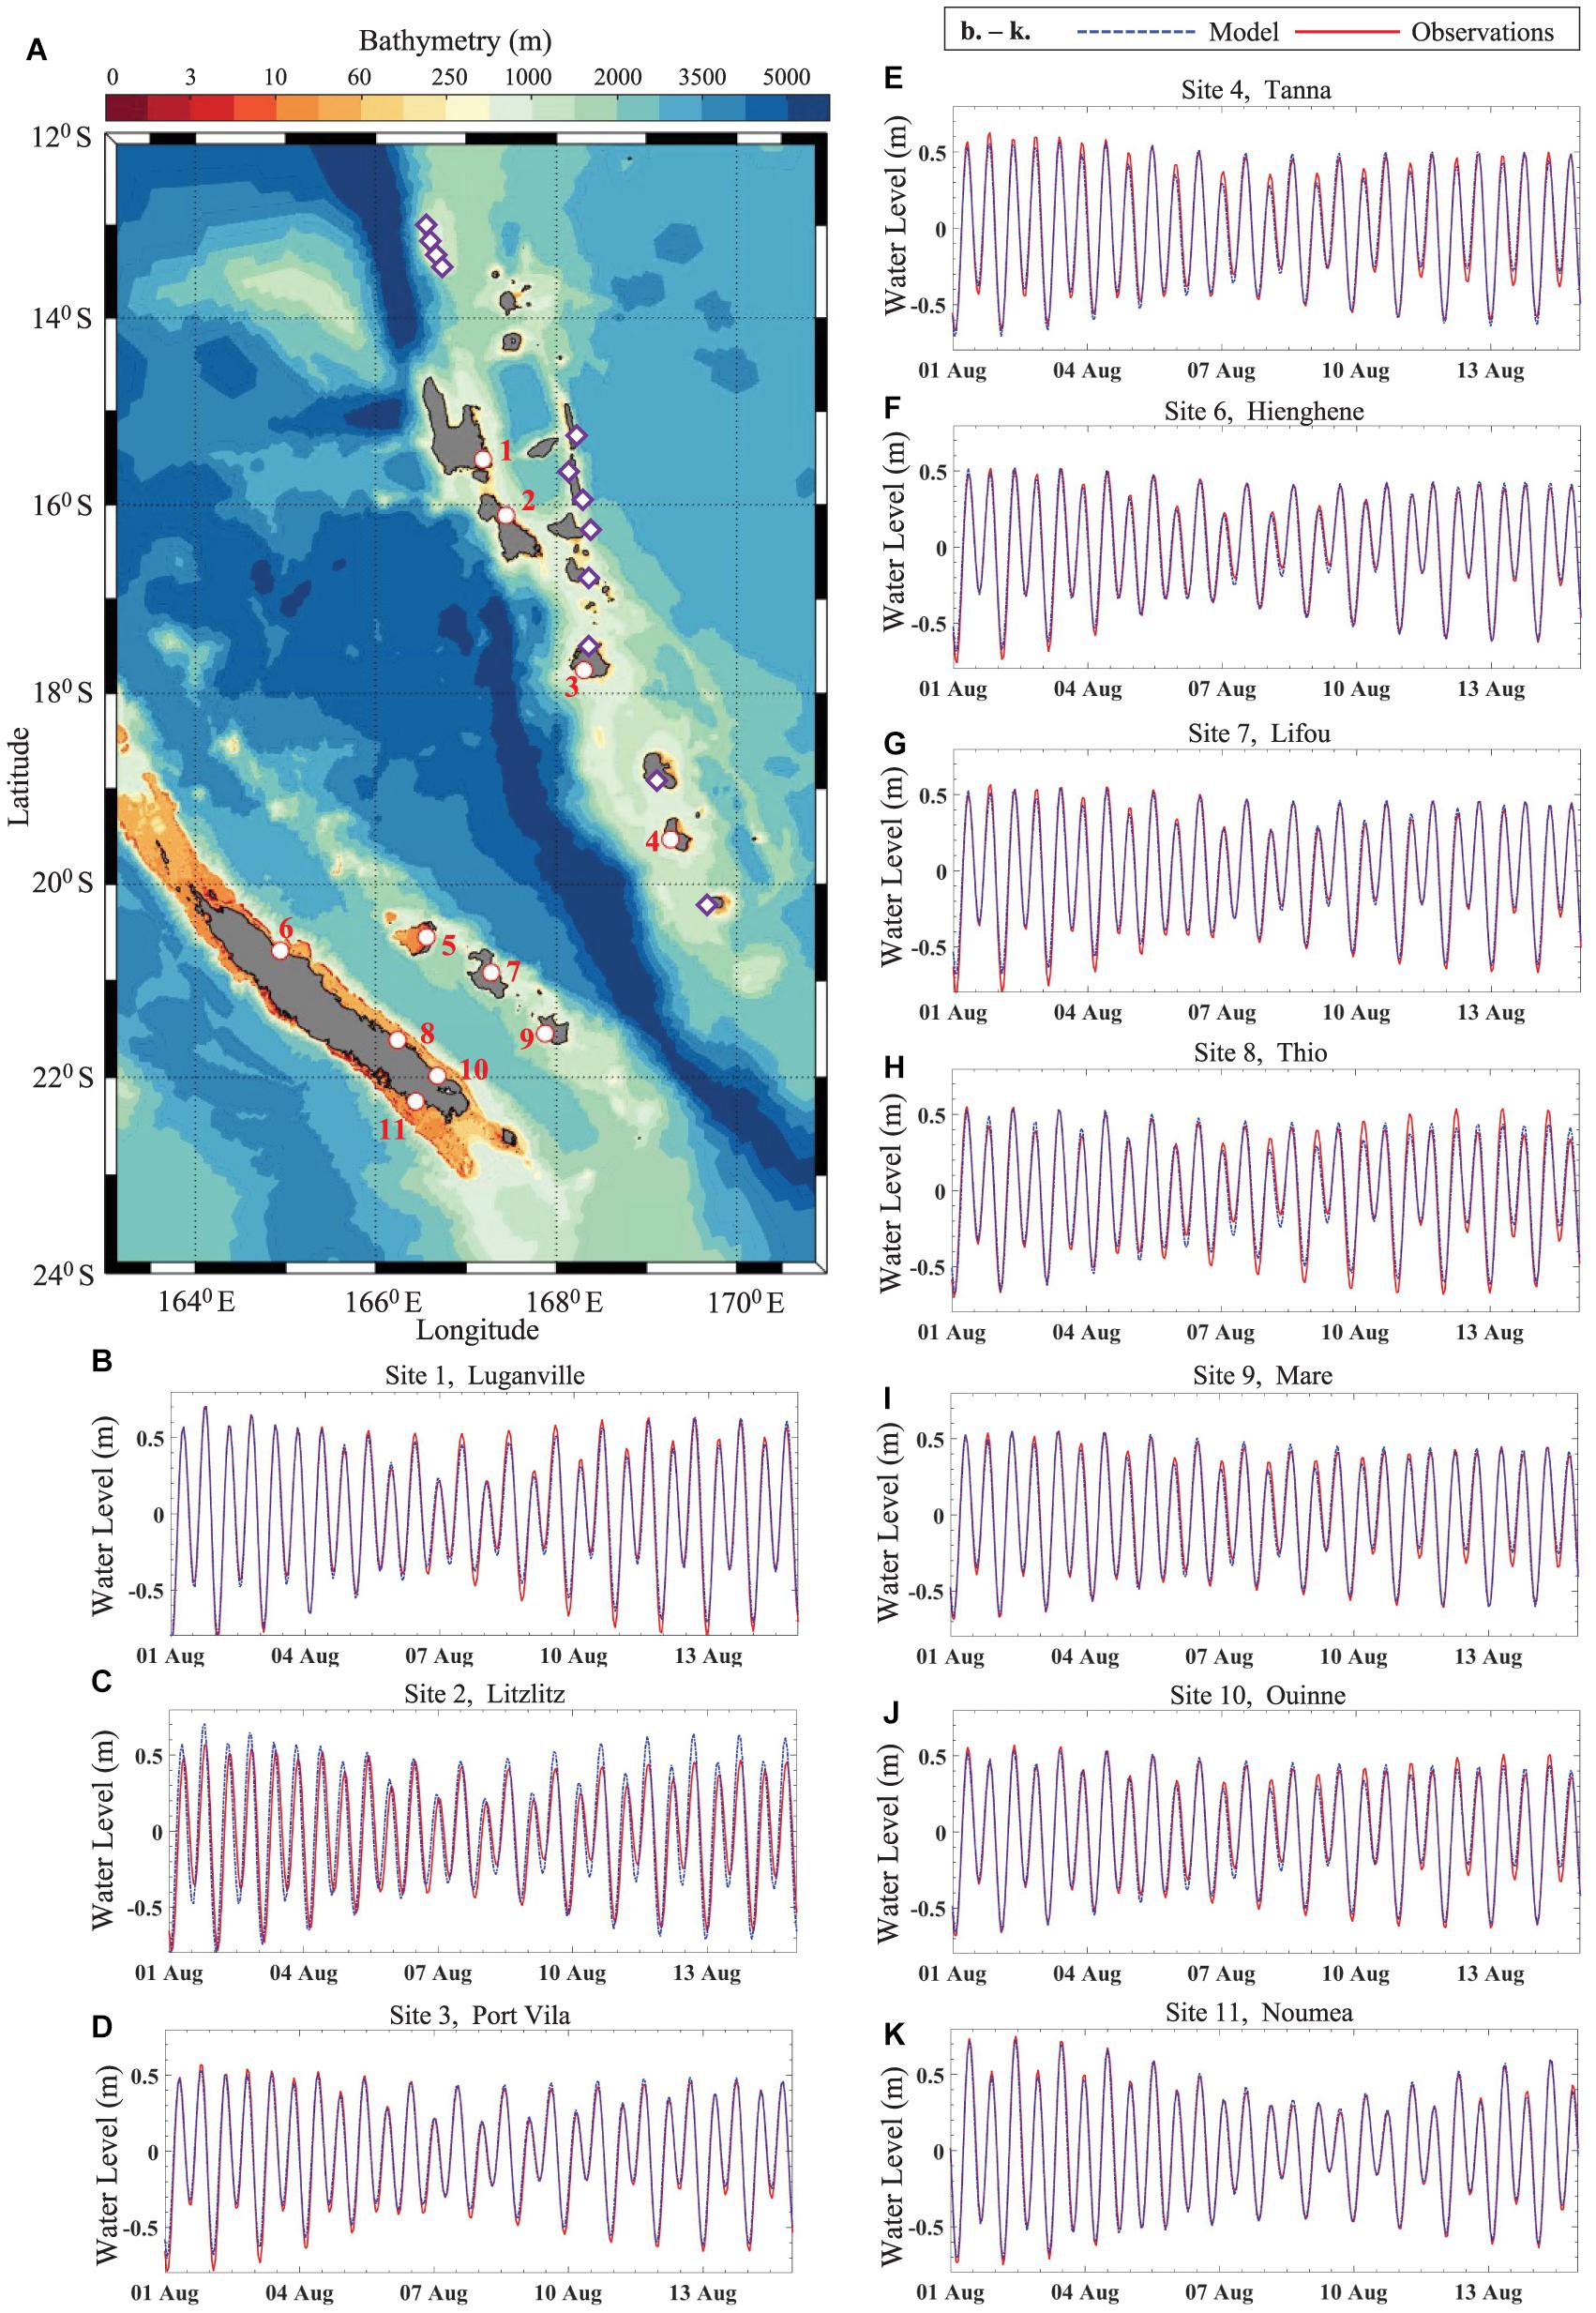
Figure 2. Site map of tide gauge locations across Vanuatu and New Caledonia (A). Tide gauge locations are highlighted using red and white circle markers, with red site number labels. Unmonitored locations where tidal characteristics were extracted are depicted using purple and white diamonds. Comparison between modelled water levels (blue) and observations (red) at ten of the eleven tide gauge locations (B–K) shown in panel (A).
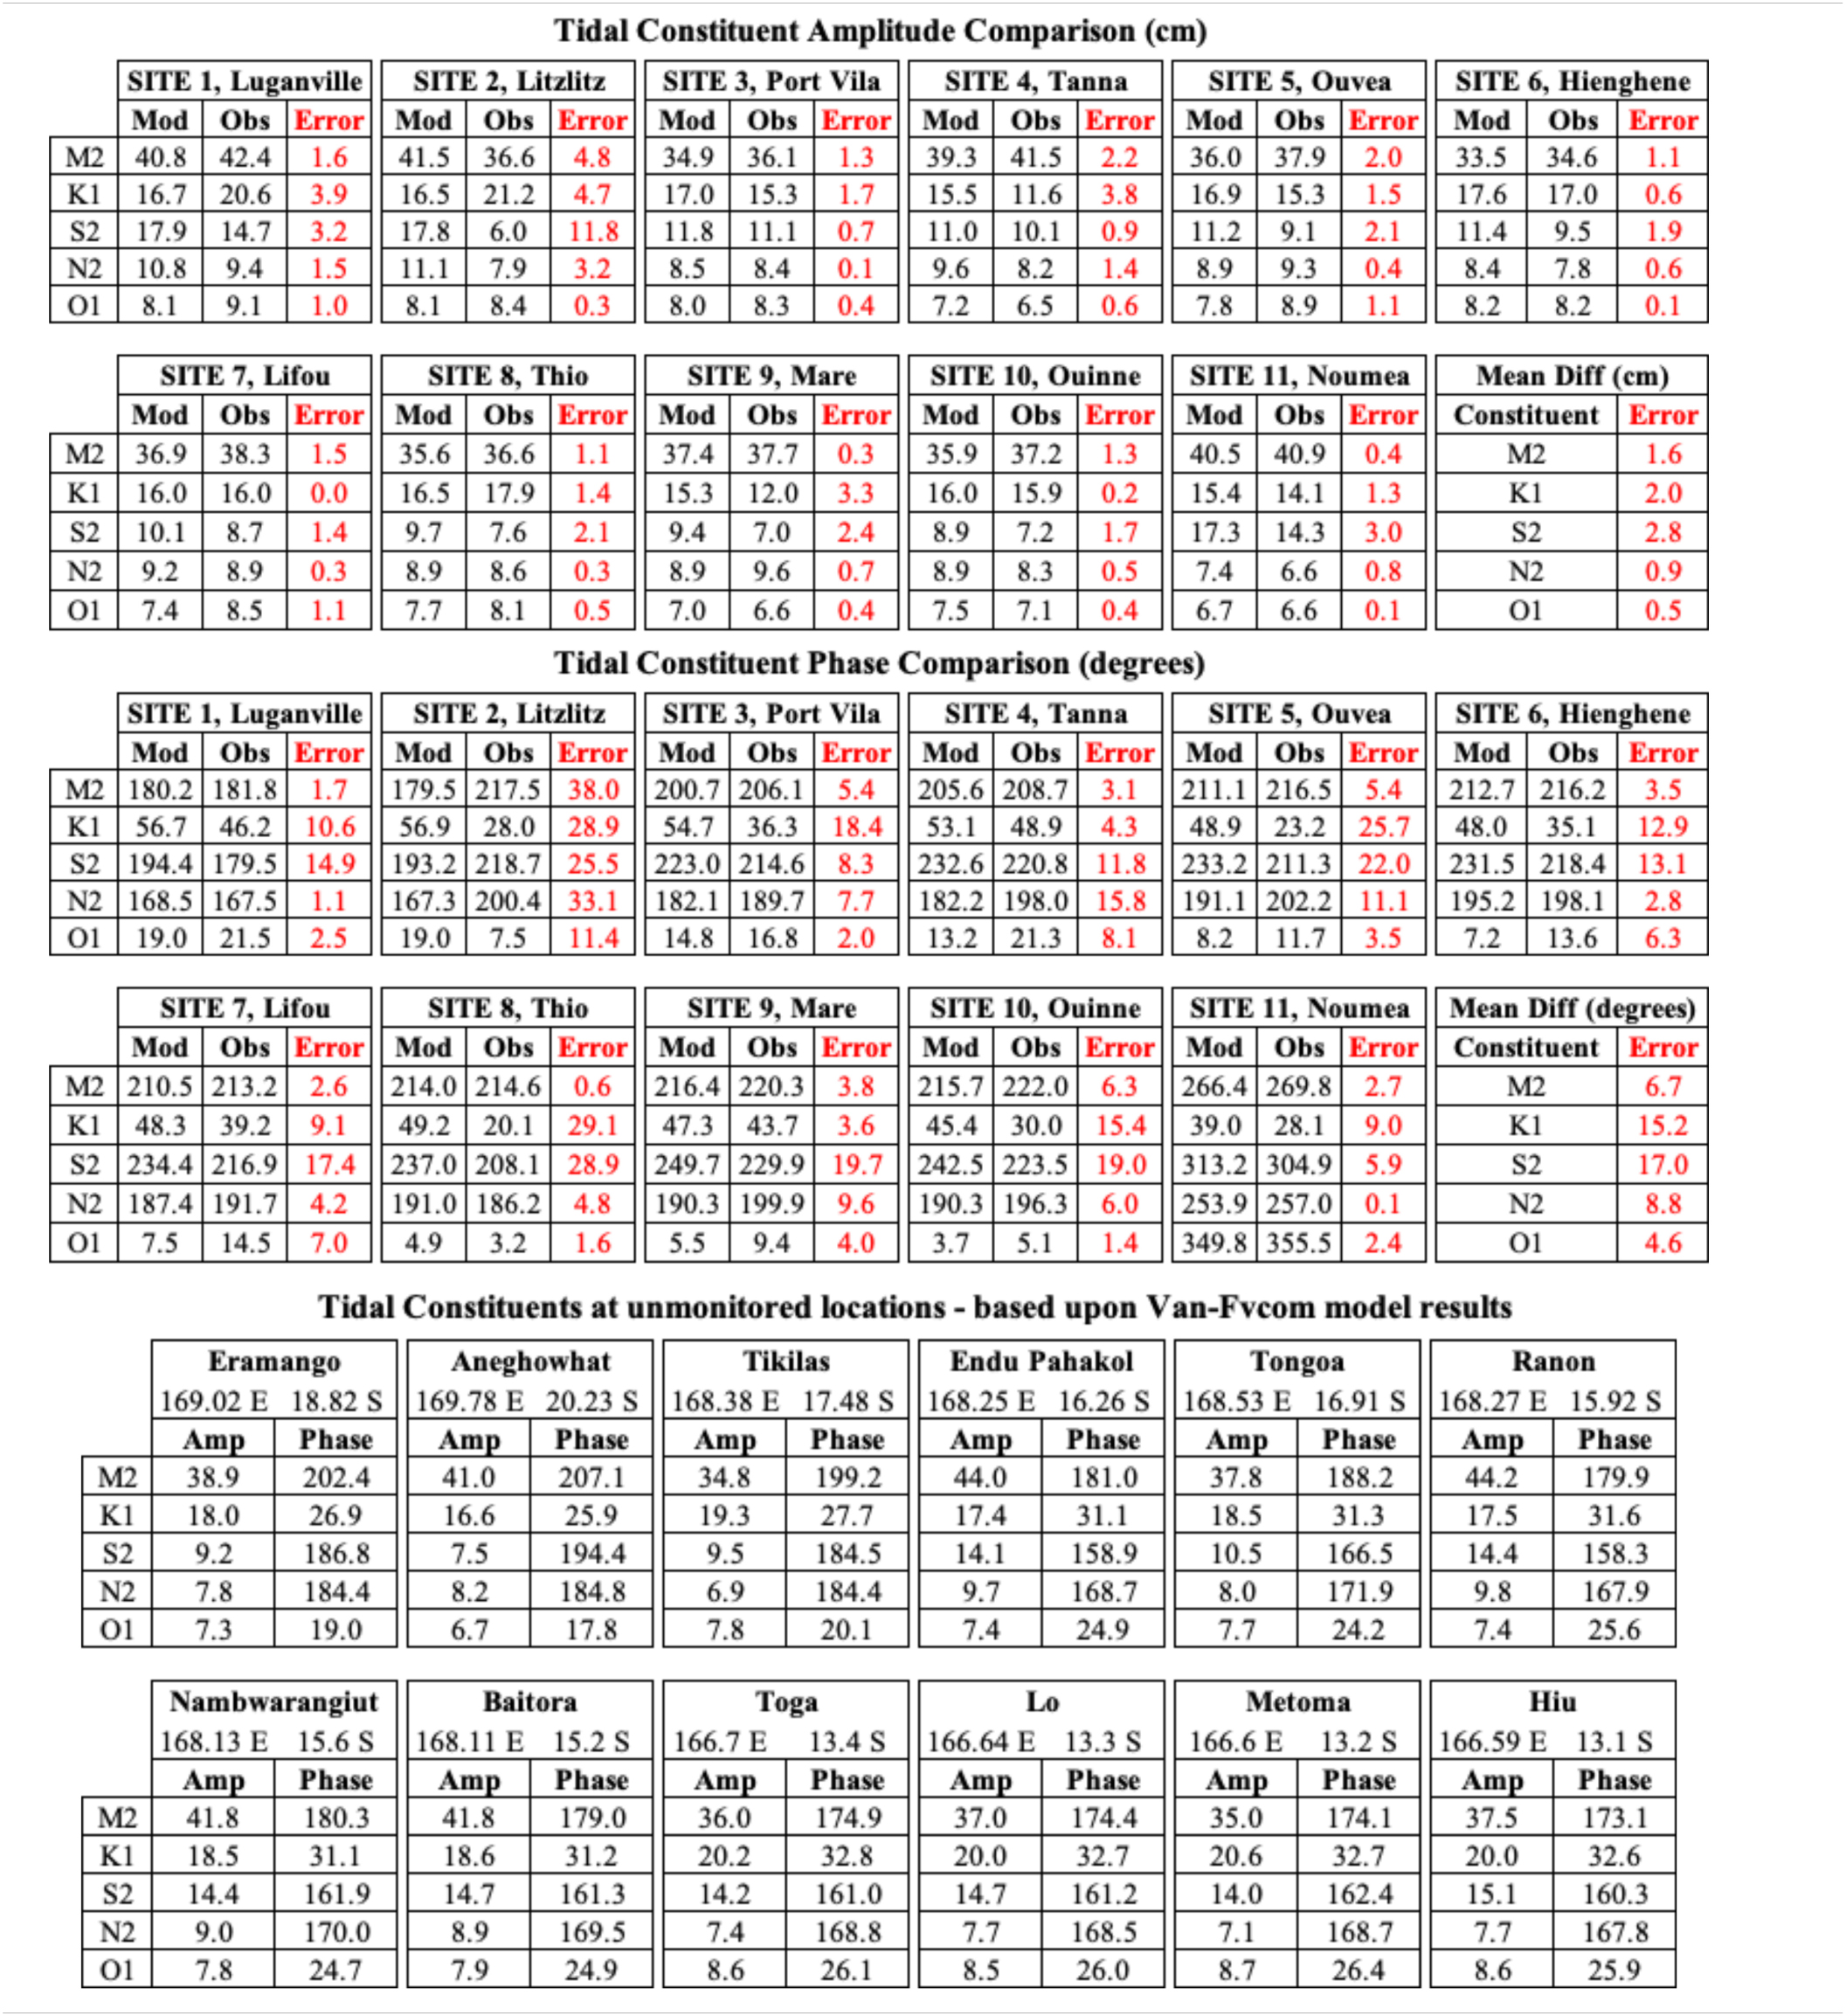
Table 1. Results of observed and model predicted tidal constituent analysis, and predicted tidal constituents at unmonitored coastal locations (locations shown in Figure 2A).
Additional comparison with data acquired from ten temporary water level gauges deployed within the Southern New Caledonia Lagoon demonstrate the ability of the Van-Fvcom model to replicate tidal characteristics within the barrier reef lagoon system (Table 2). Despite the complex lagoon bathymetry, observed and predicted tidal constituent amplitudes showed close agreement (mean constituent amplitude difference <4 cm). For M2 and S2 constituents mean phase difference = 36° and 9°, respectively. Given the close agreement between M2 and S2 tidal constituents at the 10 temporary lagoon monitoring sites and the close agreement at the permanent tide gauge station in Noumea, we are confident that the model performs well and replicates tidal characteristics in this geometrically complex lagoon system.
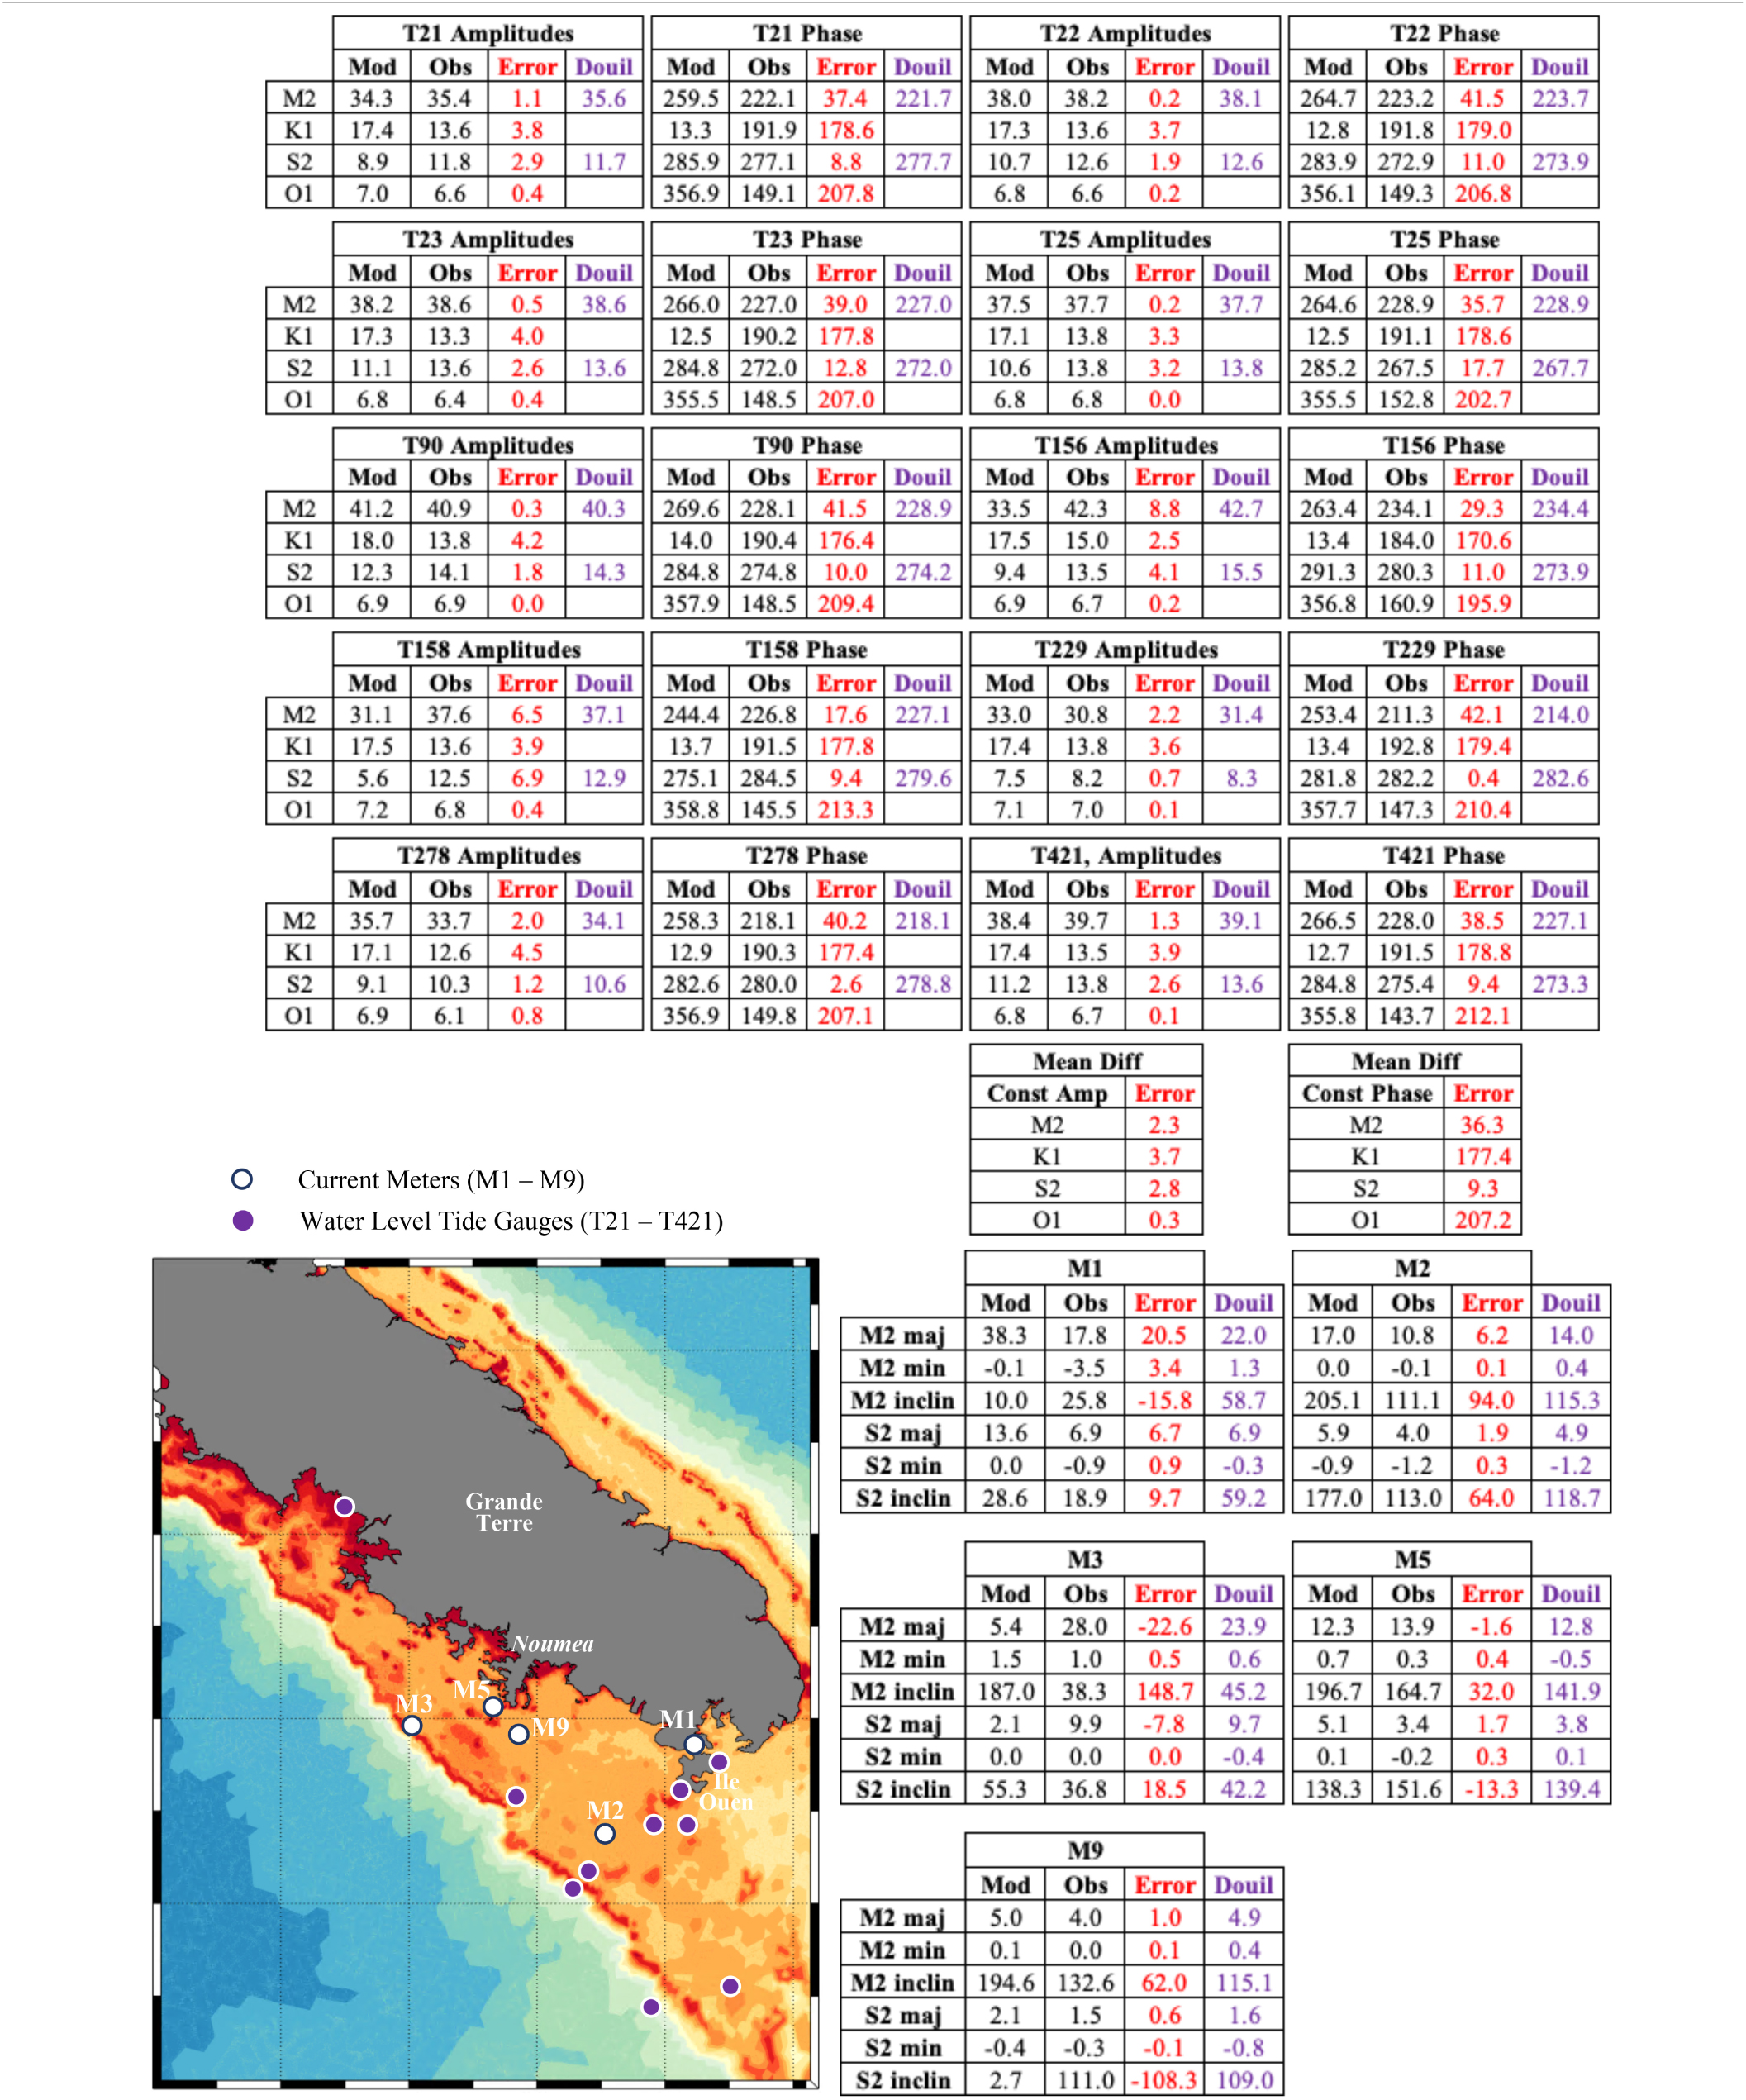
Table 2. Southern New Caledonia Lagoon tidal constituent amplitudes and phases at tide gauges (T21–T421).
Tidal characteristics were well replicated across the model domain enabling the Van-Fvcom model to be used to determine tidal constituent amplitudes and phases at 12 unmonitored Vanuatu locations (white diamonds Figure 2A). Results of tidal constituent analysis at these locations are provided in Table 1.
Tidal Currents
Analysis of predicted maximum depth averaged current speeds over the whole domain indicate highest tidal current speeds typically occur over reef/lagoon systems and between narrow passages between islands (Figure 3a). Compared to water levels, current speeds vary over smaller spatial scales in geometrically complex environments like reef/lagoon systems. To test Van-Fvcom’s ability to replicate tidal currents we compare maximum current speeds and M2 tidal ellipses with those reported in previous modelling studies in the Southern New Caledonia Lagoon (Douillet, 1998; Douillet et al., 2001). Visual comparisons show similar results with respect to both current magnitudes and M2 tidal ellipses, despite differences in model setup. The previous modelling studies of the SNC Lagoon system, used a fixed resolution (1 km × 1 km) grid, oriented NW/SE between latitudes 22° 05′ S and 22° 40′ S and longitudes 166° 05′ E and 166° 50′ E, employing uniform bathymetry (depth = 50 m) in the southern extent of the model domain (Douillet, 1998; Douillet et al., 2001).

Figure 3. Baseline maximum depth-averaged current speeds (cm/s) across the whole model domain shown underlying M2 tidal ellipses (a). Change in maximum depth-averaged current speeds (cm/s) under 1 m SLR (b) and 2 m SLR (c). Change in maximum depth-averaged current speed (cm/s) under 10 km/h (d), 20 km/h (e), and 40 km/h (f) northeast winds. Change in maximum depth-averaged current speed (cm/s) under 10 km/h (g), 20 km/h (h), and 40 km/h (i) east winds. Change in maximum depth-averaged current speed (cm/s) under 10 km/h (j), 20 km/h (k), and 40 km/h (l) southeast winds. Latitudes are displayed to the right of panels (c,f,i,l). Longitude for all panels are displayed below panels (j–l).
Within the SNC Lagoon, north of 22° 30′ S, Van-Fvcom maximum current speeds reached approximately 20 cm/s (Figure 4a), agreeing with the findings reported by Douillet (1998). South of 22° 30′ S, current speeds increased beyond 50 cm/s (Figure 4a). Maximum currents speeds approached 1 m/s in the narrow Canal Woodin, between Grande Terre and Ile Ouen. Similar high currents speeds appear to be predicted in Canal Woodin, based upon modelled M2 tidal ellipses presented by Douillet et al. (2001). Agreement between modelled and measured tidal constituent analysis in the SNC Lagoon show a closer agreement for the fixed-grid model than the Van-Fvcom model (Table 2). The fixed-grid model also reports closer agreement with respect to currents than was achieved in our simulations.
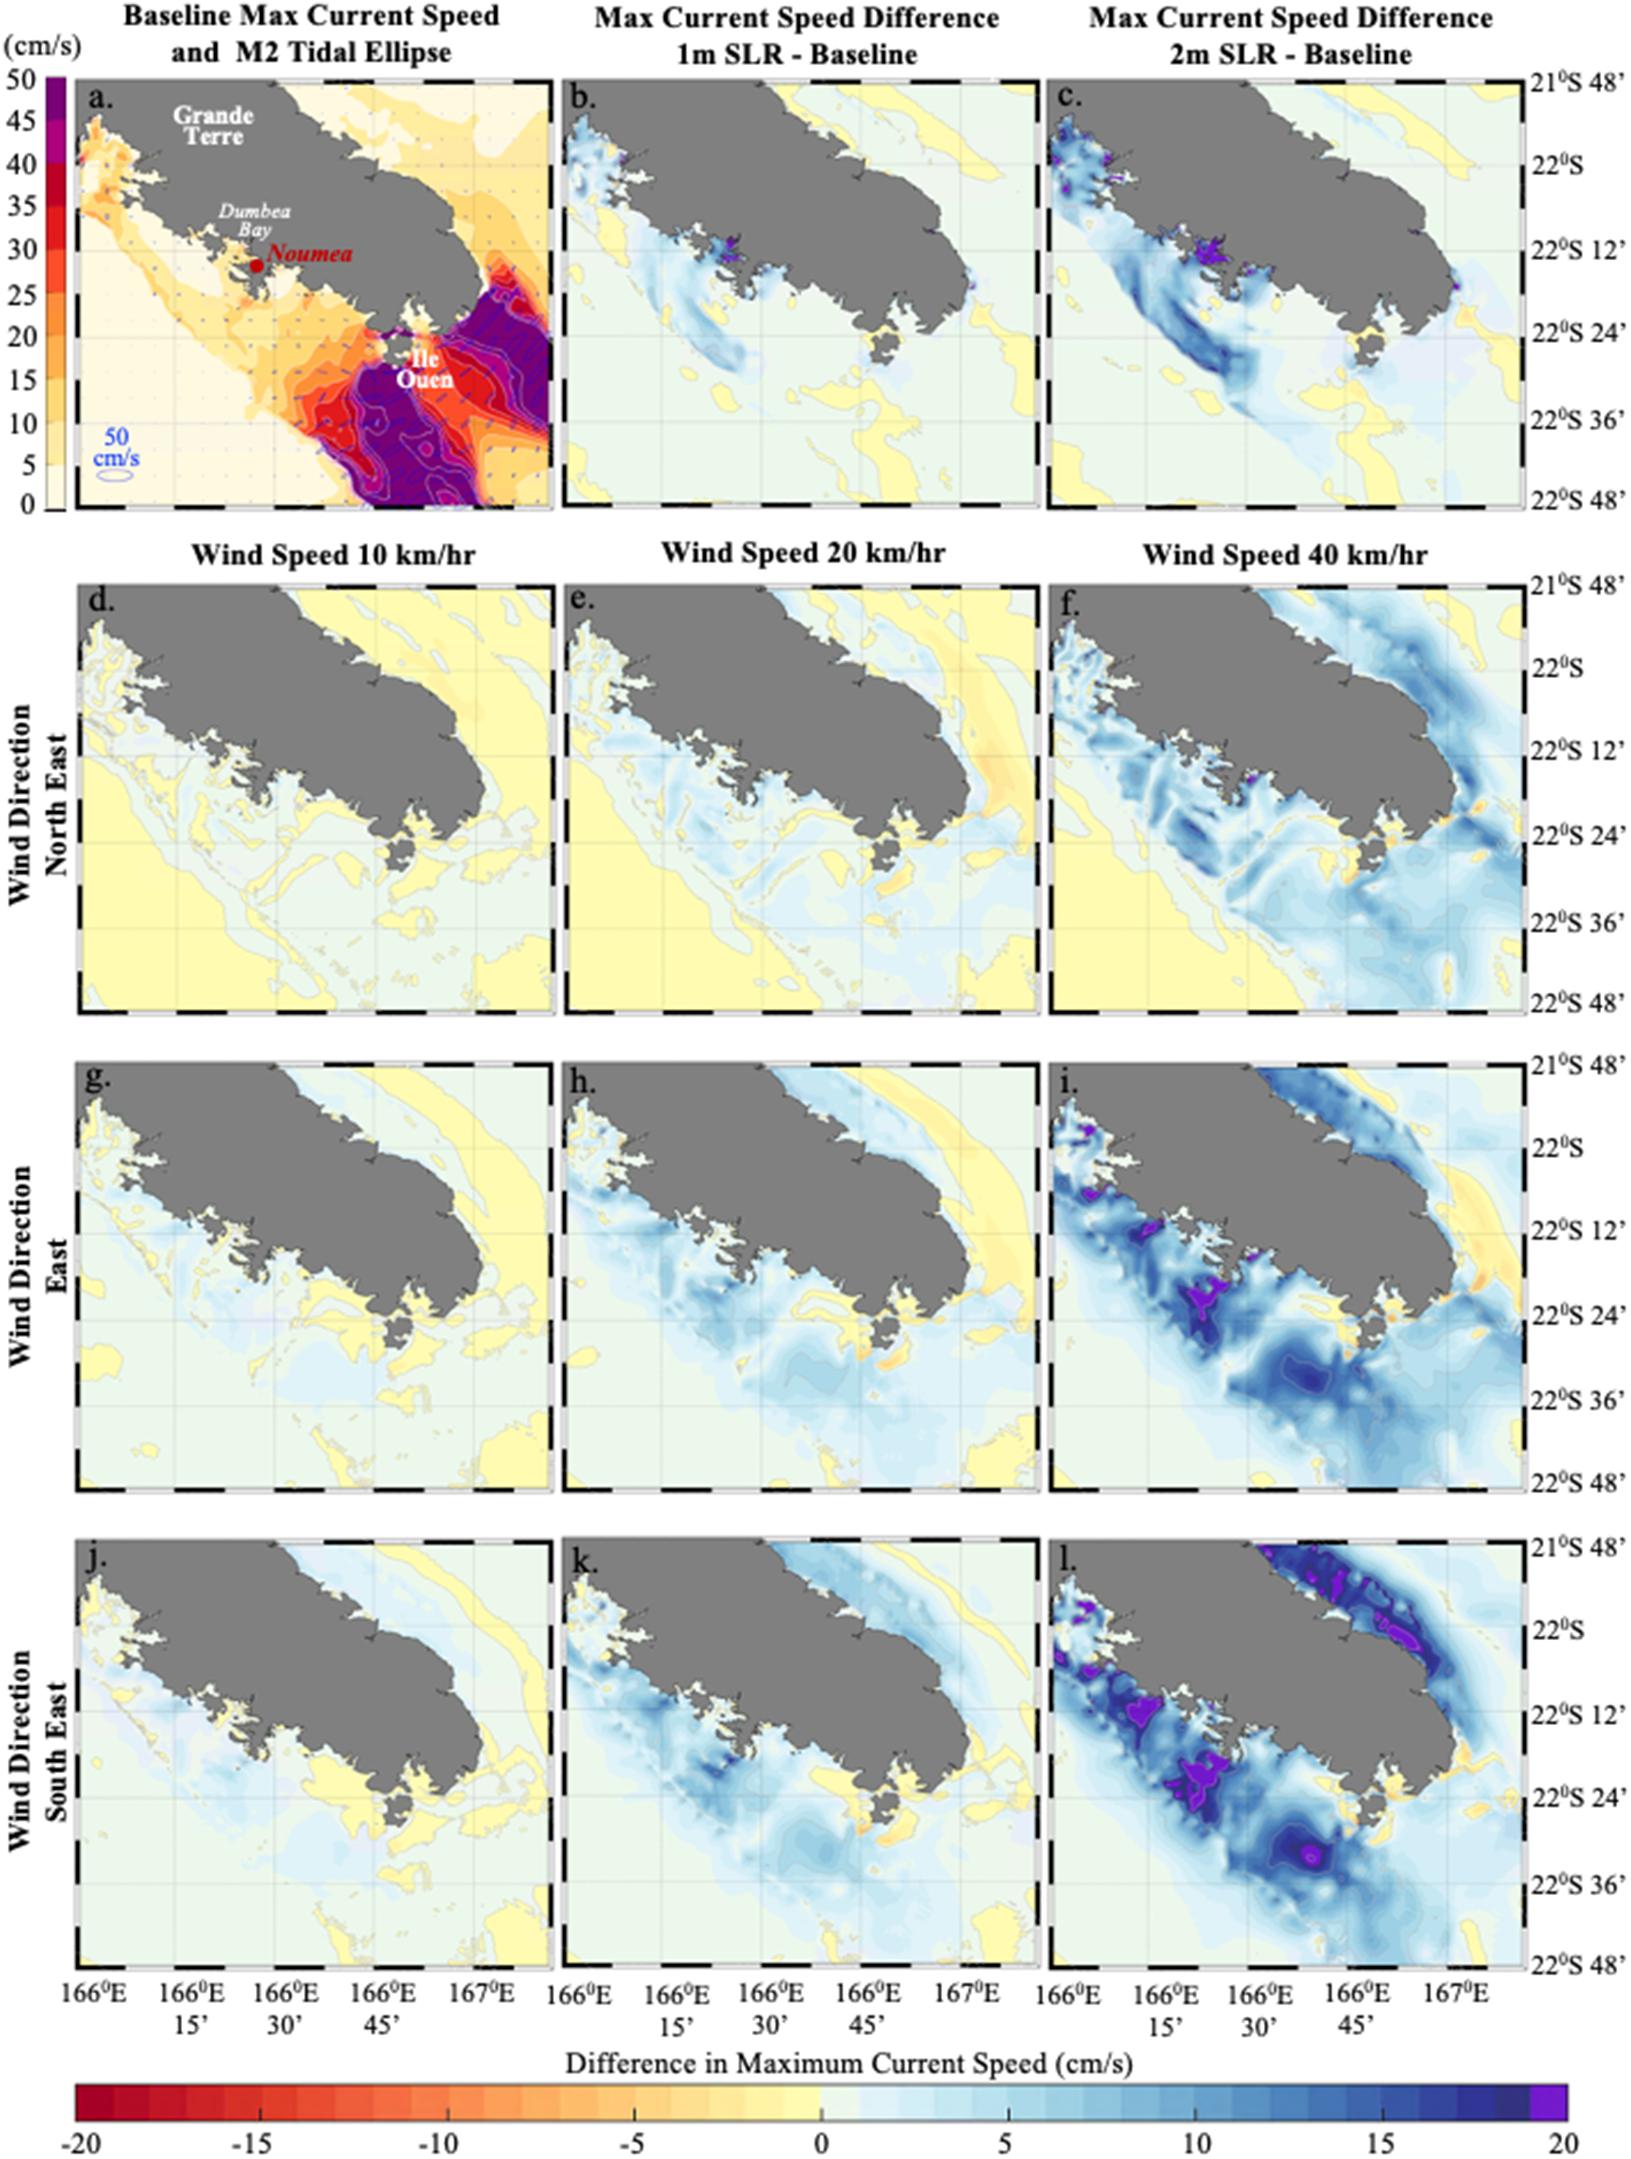
Figure 4. Baseline maximum depth-averaged current speeds (cm/s) for southern Grande Terre, New Caledonia, shown underlying M2 tidal ellipses, with white isolines at 5 cm/s intervals (a). Change in maximum depth-averaged current speeds (cm/s) under 1 m SLR (b) and 2 m SLR (c). Change in maximum depth-averaged current speed (cm/s) under 10 km/h (d), 20 km/h (e), and 40 km/h (f) northeast winds. Change in maximum depth-averaged current speed under 10 km/h (g), 20 km/h (h), and 40 km/h (i) east winds. Change in maximum depth-averaged current speed under 10 km/h (j), 20 km/h (k), and 40 km/h (l) southeast winds. Light grey isolines (b–l) indicate 5 cm/s intervals. Latitudes are displayed to the right of panels (c,f,i,l). Longitude for all panels are displayed below panels (j–l).
Maximum tidal current speeds and M2 tidal ellipses predicted around Efate Island are shown in Figure 5a. This scale however, does not clearly indicate current speed variability within the narrow Erakor Lagoon, where current meters for the Faivre et al., 2020 study were located. Within Erakor Lagoon, on Efate Island, the location of two current meters, labelled CM1 and CM2, are indicated on Figures 1e, 6a. Model predicted maximum current speeds were close to observed values at the CM2 current meter site (model = 56 cm/s, CM2 = ∼59 cm/s). The coastline contracts near CM2, forming a relatively narrow channel (<150 m wide along its narrowest section). The Van-Fvcom model, predicts highest current speeds through the constriction, relative to surrounding lagoon waters (Figure 6a). At CM1, maximum current speeds are under-predicted by Van-Fvcom, reaching ∼30 cm/s during the simulation, while observed currents speeds reach ∼65 cm/s. CM1 is located in a narrow (∼ 50 m wide) reef channel between adjacent reef platforms (Faivre et al., 2020). It was initially thought that water depth settings used for reef platforms may be partly responsible for the under-prediction of current speeds at CM1. Whilst reef platforms in the vicinity of CM1 typically have sharp drop offs, with seaward edges becoming exposed during low tide, in the Van-Fvcom model water depths for grid cells at the seaward edge of platforms were set to 2 m. In this way cells adjacent to the channel did not become dry during low-tide. These depth setting were employed to allow the use of 1–2 s timesteps for simulations. To test the sensitivity of modelled currents to reef exposure at this location, a simulation was conducted whereby water level was reduced by 1 m, allowing more cells on the reef platform to dry during low tides, however, maximum current speeds at CM1 did not significantly improve, and maximum current speeds remained around 30 cm/s. Wind experiments discussed in detail in following sections increase maximum current speeds by less than 10 cm/s in the vicinity of CM1, and thus even under 40 km/h winds, Van-Fvcom maximum current speeds are underpredicted by ∼ 20 cm/s at this location.

Figure 5. Baseline maximum depth-averaged current speeds around Efate Island, Vanuatu shown underlying M2 tidal ellipses, with white isolines at 5 cm/s intervals (a). Change in maximum depth-averaged current speeds (cm/s) under 1 m SLR (b) and 2 m SLR (c). Change in maximum depth-averaged current speed (cm/s) under 10 km/h (d), 20 km/h (e), and 40 km/h (f) northeast winds. Change in maximum depth-averaged current speed under 10 km/h (g), 20 km/h (h), and 40 km/h (i) east winds. Change in maximum depth-averaged current speed under 10 km/h (j), 20 km/h (k), and 40 km/h (l) southeast winds. Light grey isolines (b–l) indicate 2 cm/s intervals. Latitudes are displayed to the right of panels (c,f,i,l). Longitude for all panels are displayed below panels (j–l).
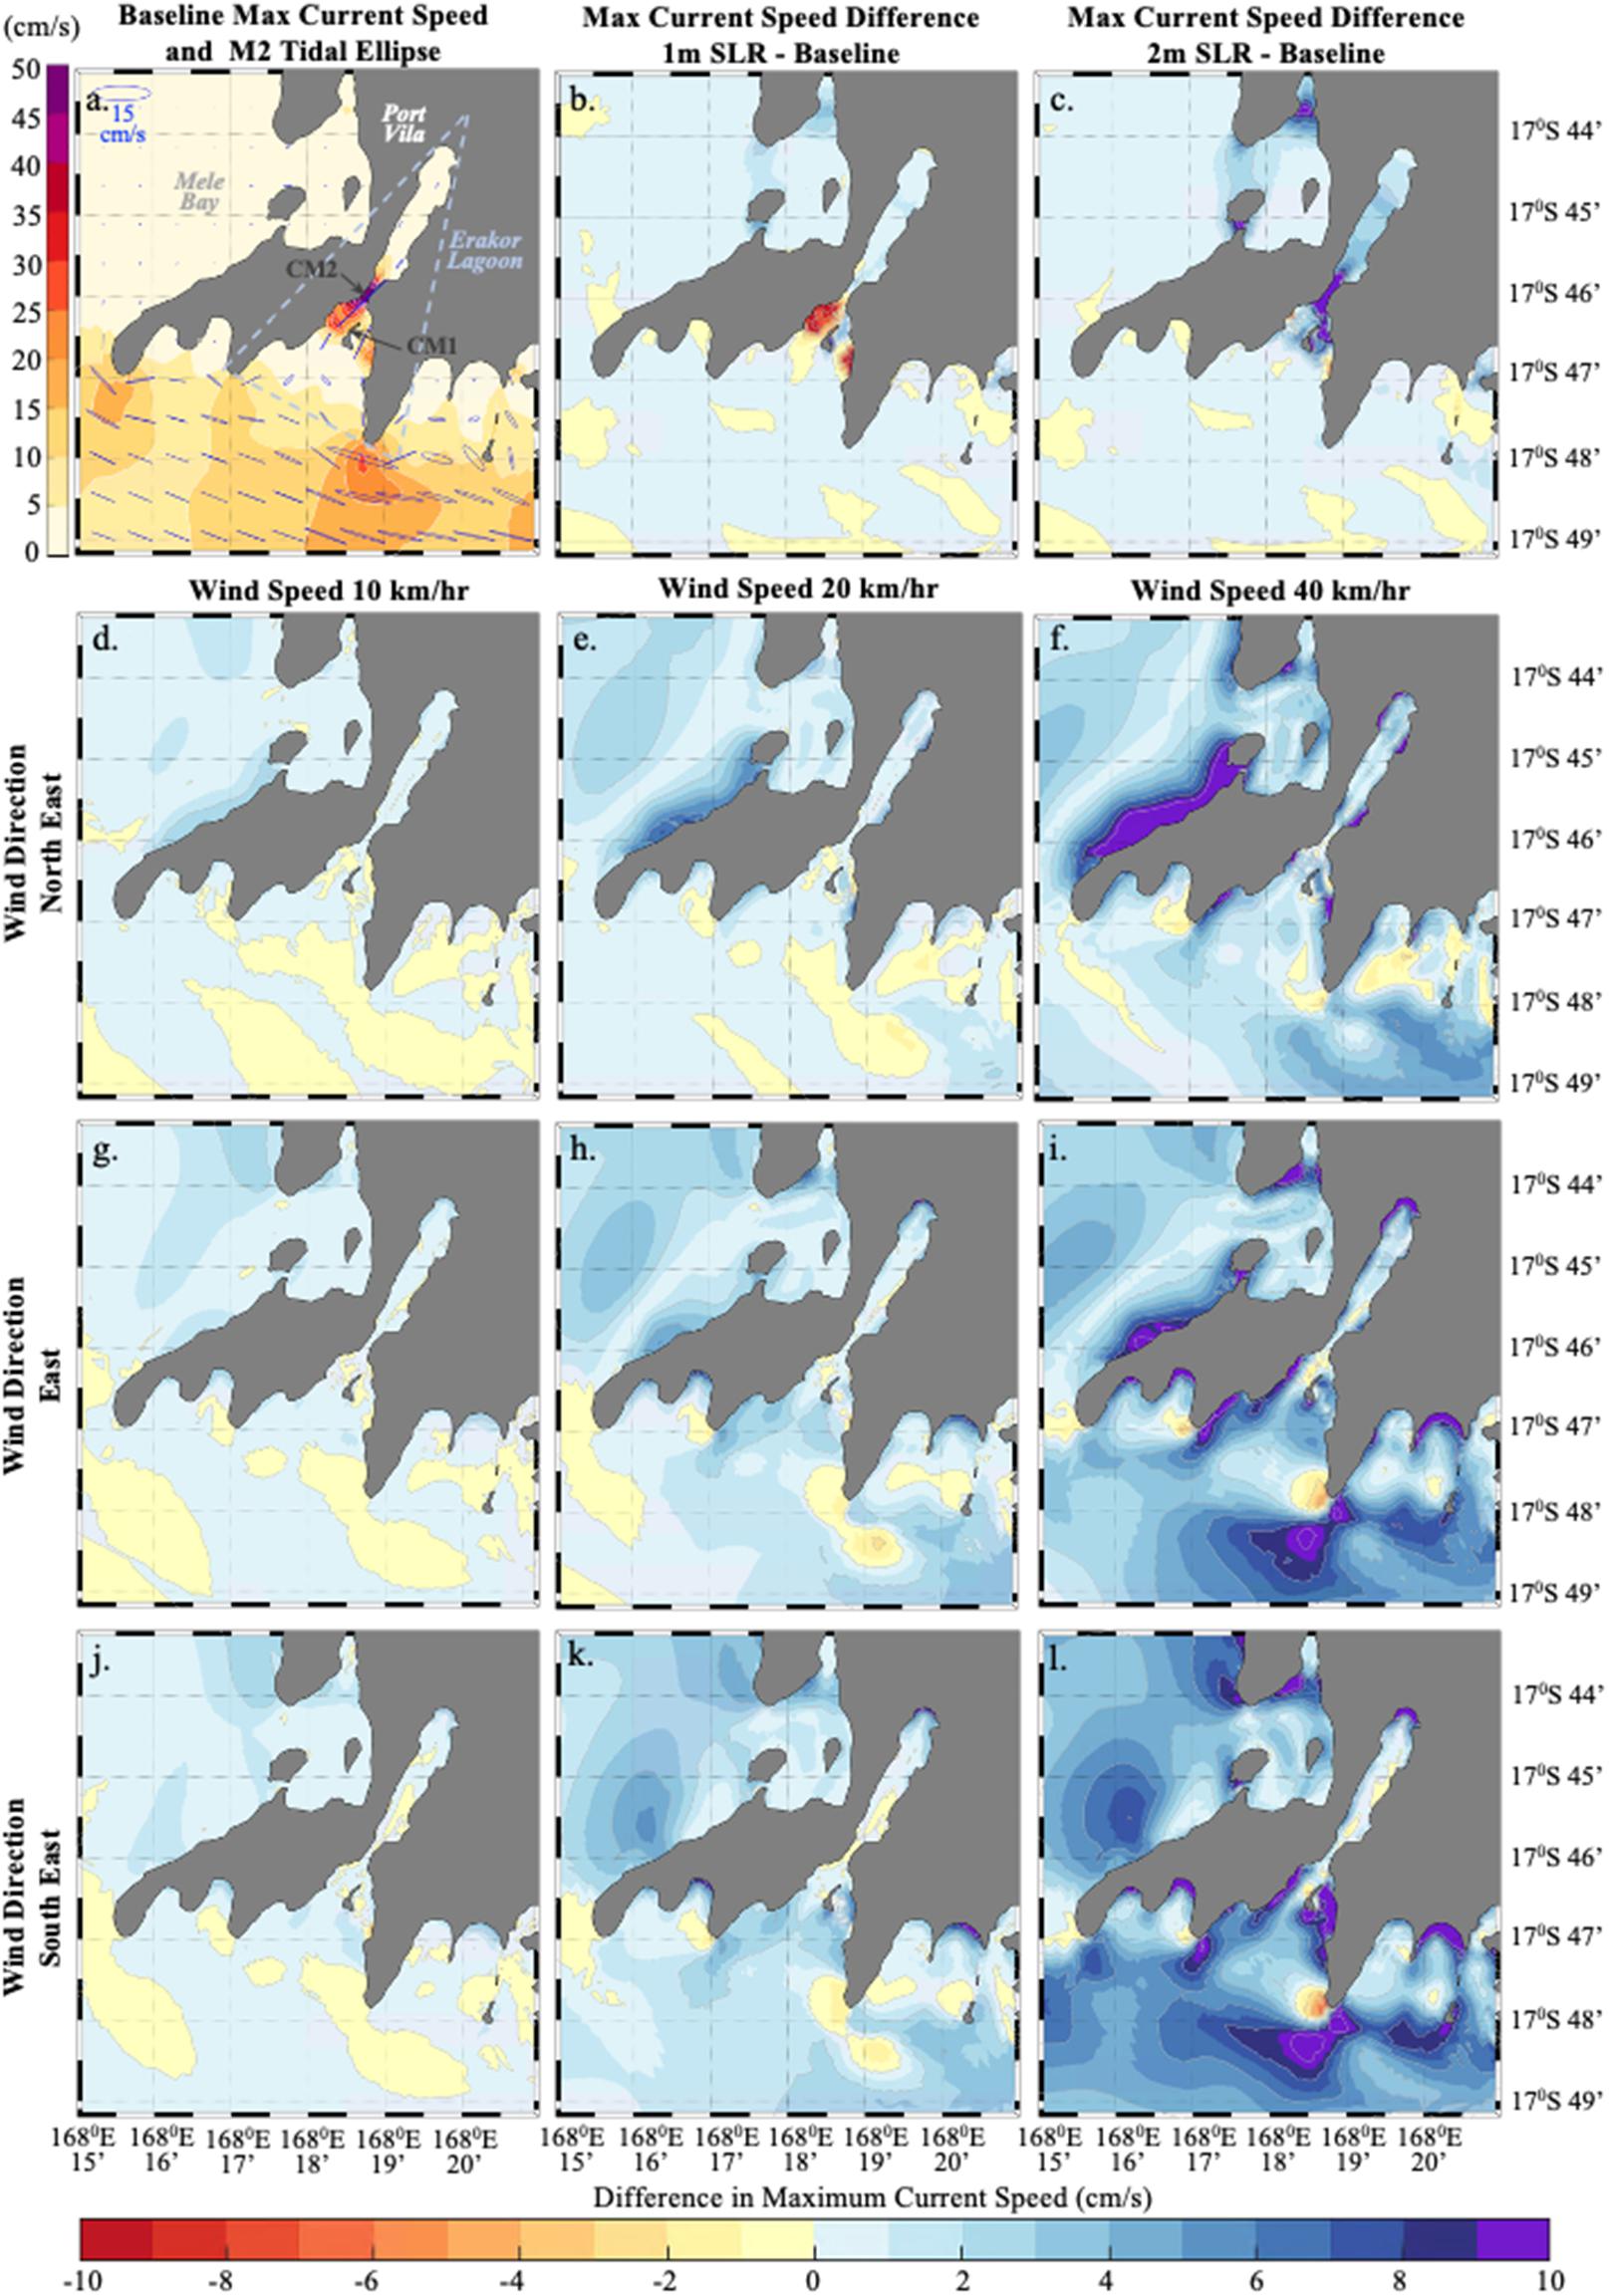
Figure 6. Baseline maximum depth-averaged current speeds focussing on Erakor Lagoon, southwest Efate Island, shown underlying M2 tidal ellipses, with white isolines at 5 cm/s intervals (a). Change in maximum depth-averaged current speeds (cm/s) under 1 m SLR (b) and 2 m SLR (c). Change in maximum depth-averaged current speed (cm/s) under 10 km/h (d), 20 km/h (e), and 40 km/h (f) northeast winds. Change in maximum depth-averaged current speed under 10 km/h (g), 20 km/h (h), and 40 km/h (i) east winds. Change in maximum depth-averaged current speed under 10 km/h (j), 20 km/h (k), and 40 km/h (l) southeast winds. Light grey isolines (b–l) indicate 2 cm/s intervals. Latitudes are displayed to the right of panels (c,f,i,l). Longitude for all panels are displayed below panels (j–l).
Analysis of predicted maximum depth-averaged current speeds over the whole model domain indicate that tidal currents were typically fastest at north-western and south-eastern ends of islands (Figure 3a). In New Caledonia predicted tidal currents were fastest over the reefs and lagoons to the north/north west and south/south east of Grande Terre. For Vanuatu, fastest tidal currents also occur at the north/northwest and south/southeast tips of most islands, as well as between closely spaced islands (Figure 3a). Within the Southern New Caledonia Lagoon of Grande Terre, predicted tidal currents were fastest within two sections of the lagoon that extend from the south-eastern and south-western corners of Grand Terre, as well as in the narrow strait between Ile Ouen and Grande Terre (Figure 4a). Predicted maximum depth-averaged tidal current speeds reduced to less than 10 cm/s within coastal embayments (Figure 4a). Around Efate Island, fastest tidal currents were predicted in waters to the southeast of Efate, and to the north of Nguna Island, as well as between Efate, Pele, and Mangarongo Islands (Figure 5a). Within Erakor Lagoon, on the southwestern side of Efate Island, predicted tidal currents were fastest within the constriction in the lagoon (Figure 6a) as discussed earlier.
Wind Experiments
Water Levels
For all wind experiments, tidal water levels showed negligible (<1 cm) response to wind forcing (not shown). Extreme meteorological events such as Tropical Cyclone Pam (2015) can cause water levels to alter by up to 0.6 m. Winds during TC Pam exceeded 160 km/h, however, the majority of storm surge was due to low atmospheric pressure (Nishijima et al., 2015). While regional ocean circulation, driven by global wind systems, does alter the position of mean water over daily, and monthly timeframes, our results indicate that local wind forcing by trade winds within the model domain does not significantly alter coastal water levels at tide gauge stations.
Maximum Depth-Averaged Current Speeds
Between islands, changes under NE winds showed a mixed response, while coastal maxDA_curSp mainly increased (Figures 3d–f). Under E winds maxDA_curSp around and between islands mainly increased. Larger responses typically occurred on windward, southern, and northern sides of islands (Figures 3g–i). Under SE winds maxDA_curSp demonstrated a clear response, increasing along the axis of the wind. Both the Vanuatu and New Caledonia archipelagos are approximately orientated in a SE direction (Figures 3j–l) which likely contributes to larger response to SE winds, compared with NE and E winds. Coastal waters where the largest change in maxDA_curSp occur correspond to shallower areas of lagoon/reef systems.
Within coastal waters in southern Grande Terre, New Caledonia maxDA_curSp typically increased in response to increasing wind speed. The largest increases in maxDA_curSp are seen under SE winds (Figures 4g–i), and smallest changes occur under NE winds (Figures 4d–f). Under 40 km/h wind conditions maxDA_curSp increased by up to a factor of 2, within the Southern New Caledonia Lagoon.
In coastal waters around Efate, overall patterns with respect to changes in maxDA_curSp are similar under NE, E, and SE winds (Figures 5d–l). This is likely due to the more circular shape of Efate Island, compared to other islands such as Grande Terre, New Caledonia. Within Mele Bay, located on the southwestern side of Efate island, maxDA_curSp increase most significantly close to the coast, on the northern and western sides of the bay (Figures 5d–l).
Near Erakor Lagoon, Port Vila, on Efate Island, increasing wind speeds typically increased maxDA_curSp (Figures 6d–l). MaxDA_curSp increased most significantly under SE winds, while NE winds resulted in the least change. Under NE winds the largest change in maxDA_curSp were seen in waters running along the southeast shores of Mele Bay. Under E winds, maxDA_curSp increased on both the SE shores of Mele, and the SW shores of Erakor Lagoon, as well as waters immediately south of Erakor Lagoon. Under SE winds shallow waters over reefs and adjacent to shorelines showed the largest increases in maxDA_curSp, while within the upper Erakor Lagoon maxDA_curSp changed to a lesser degree, compared with those generated by NE and E winds (Figures 6d–l).
Residual Currents
Tidal residual currents are persistent features associated with the local bottom or coastal topography, which alter in response to the strength of the semidiurnal tides over regular spring neap cycles (Robinson, 1983). Small-scale eddies (1–10 km) are commonly observed in coastal waters in the vicinity of headlands or islands, driven by oscillatory tidal flow, forming on alternate sides of islands or headlands with the reversal of the tide (Signell and Geyer, 1991). For our model domain tidal residual currents are most significant in coastal waters due to the interaction of irregular shorelines and tidal flow (Figures 7a, 8a, 9a, 10a). In open ocean waters, tidal residual current patterns are complex, with numerous meanders and cyclonic/anti-cyclonic eddies. Between the Vanuatu and New Caledonia islands, tidal residual flow appears to be influenced by topographic steering with north-westward flowing residual currents aligning with the Vanuatu (New Hebrides) Trench (Figure 7a). While residual current patterns in open ocean waters are complex, current speeds are relatively low (<0.5 cm/s) (Figure 7a) compared to coastal residual currents (up to ∼15 cm/s) (Figures 8a, 9a, 10a).
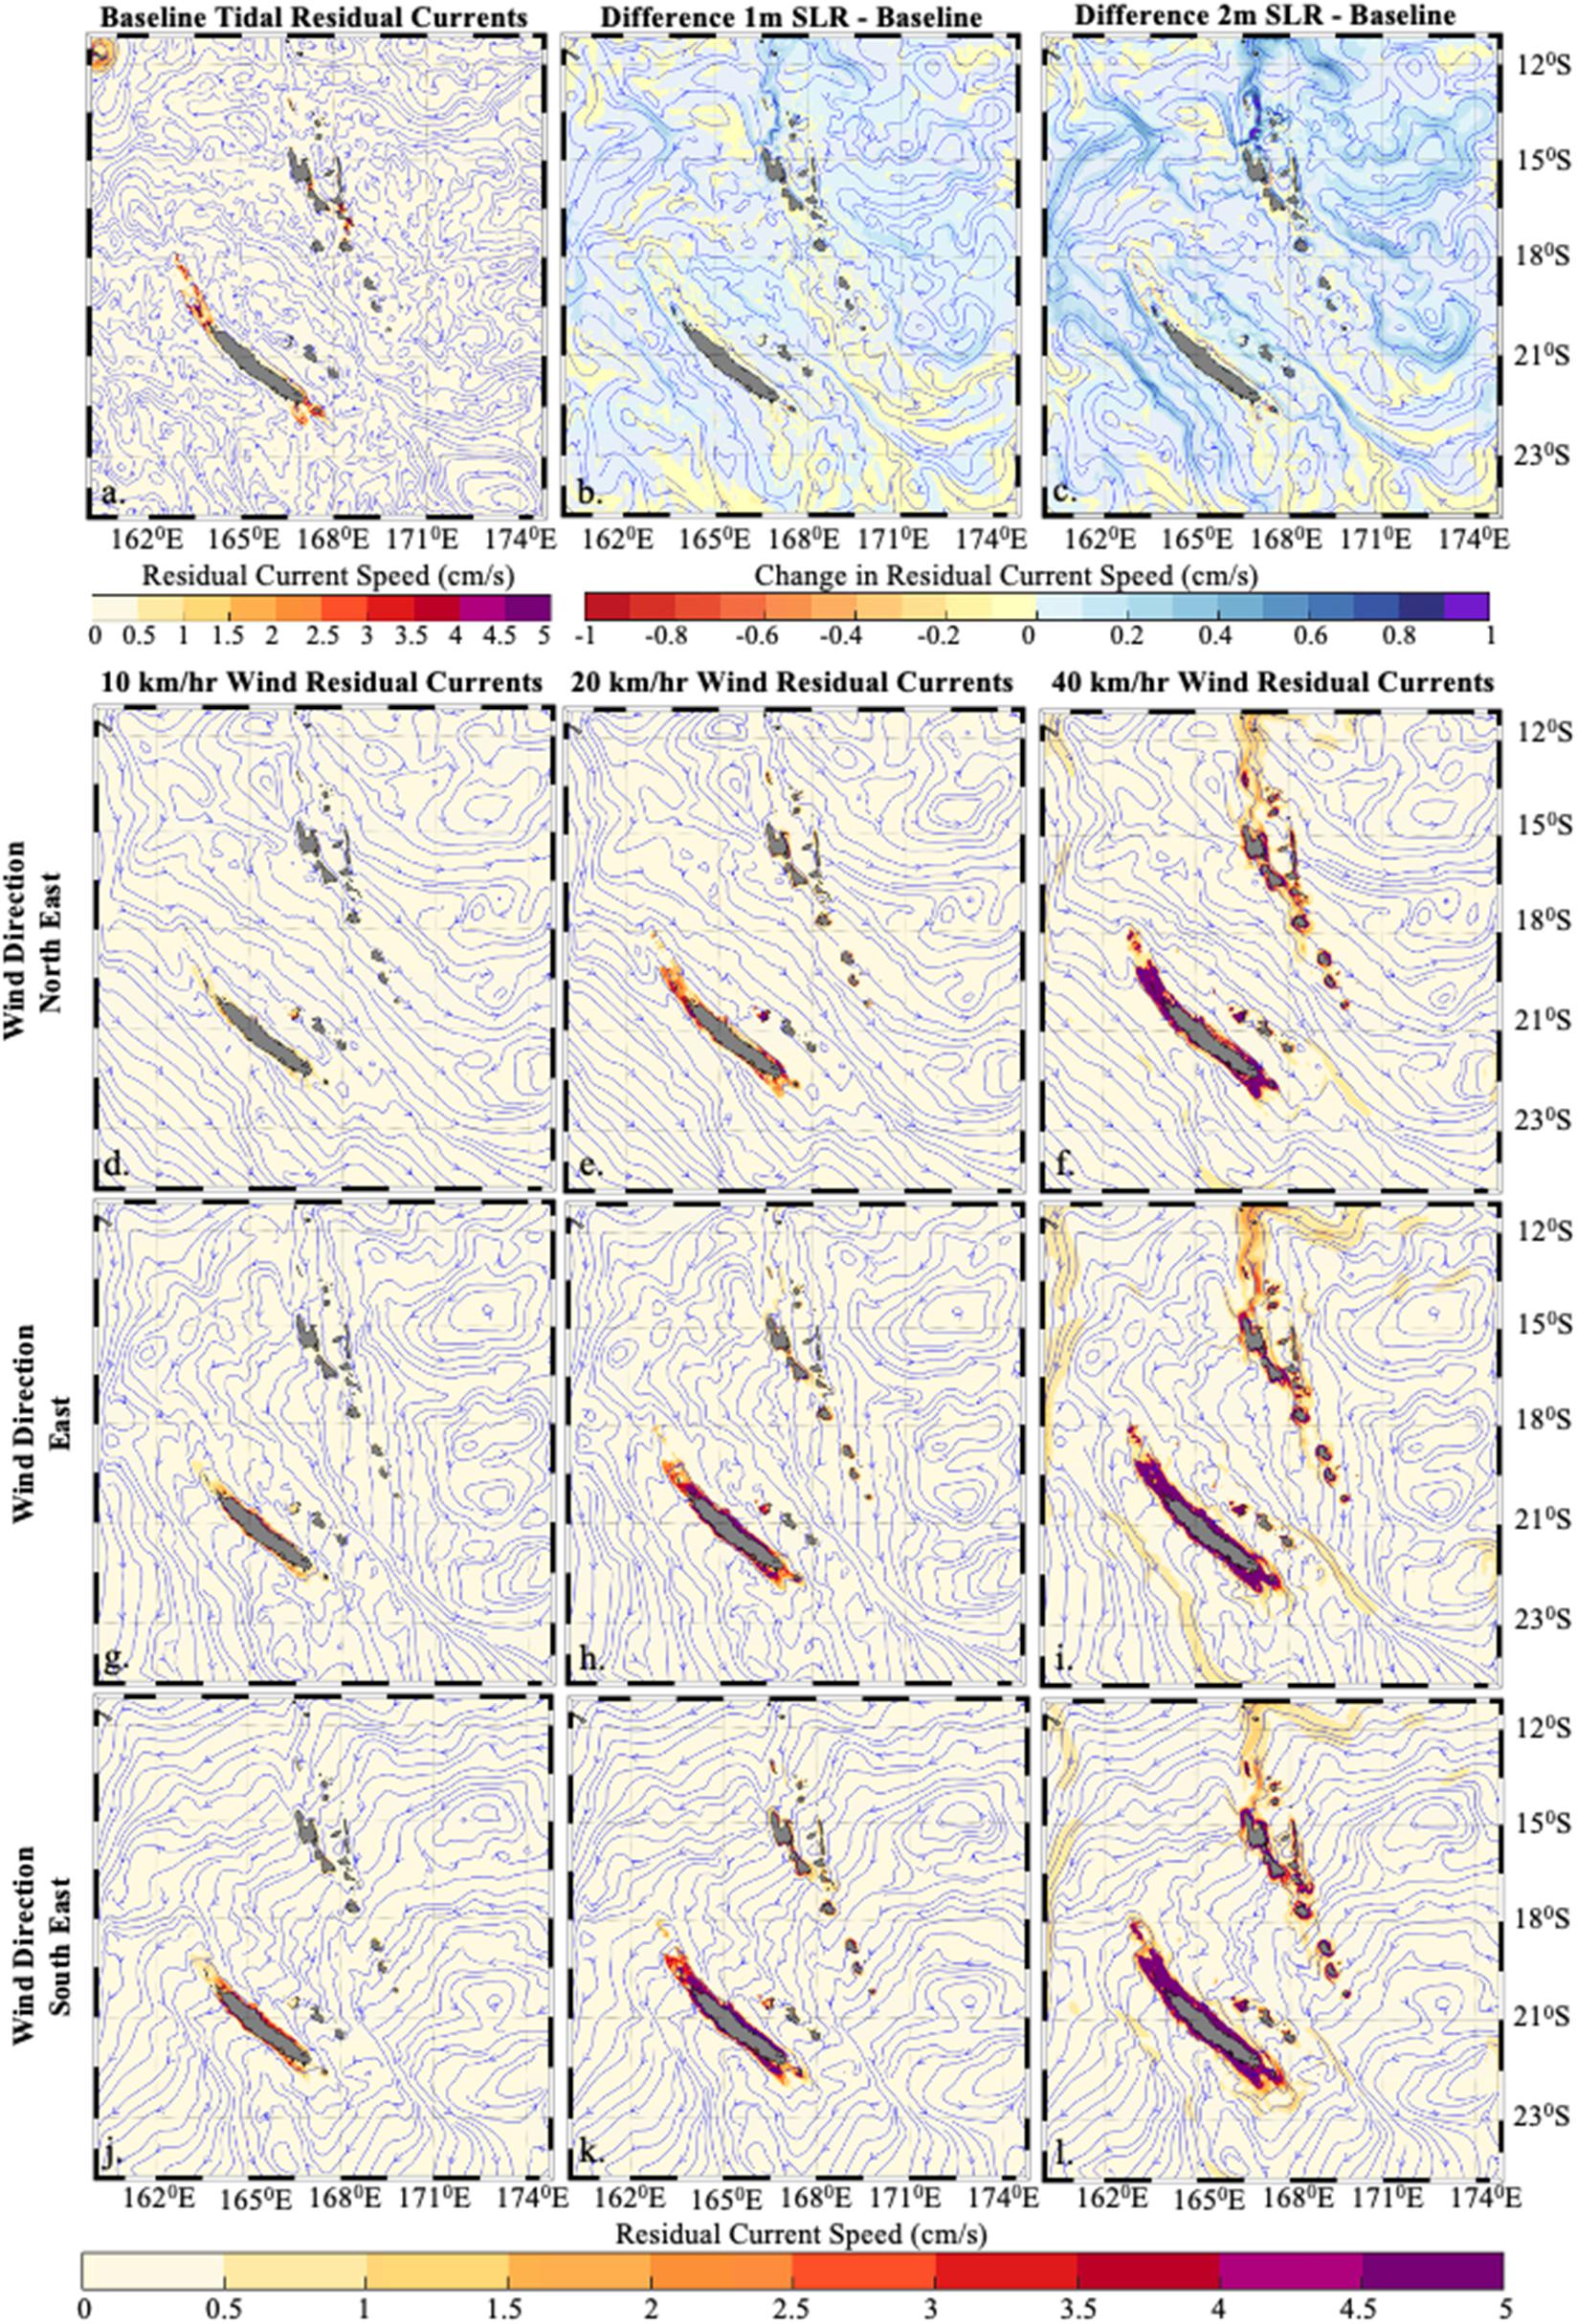
Figure 7. Tidal residual current speeds (cm/s), with current patterns indicated by streamlines, across the whole model domain (a). Change in residual current speeds (cm/s) and patterns under 1 m SLR (b) and 2 m SLR (c). Wind residual current speeds (cm/s) and patterns under 10 km/h (d), 20 km/h (e), and 40 km/h (f) northeast winds. Wind residual current speeds (cm/s) and patterns under 10 km/h (g), 20 km/h (h), and 40 km/h (i) east winds. Wind residual current speeds (cm/s) and patterns under 10 km/h (j), 20 km/h (k), and 40 km/h (l) southeast winds. Latitudes are displayed to the right of panels (c,f,i,l). Longitude for all panels are displayed below panels (a–c,j–l).
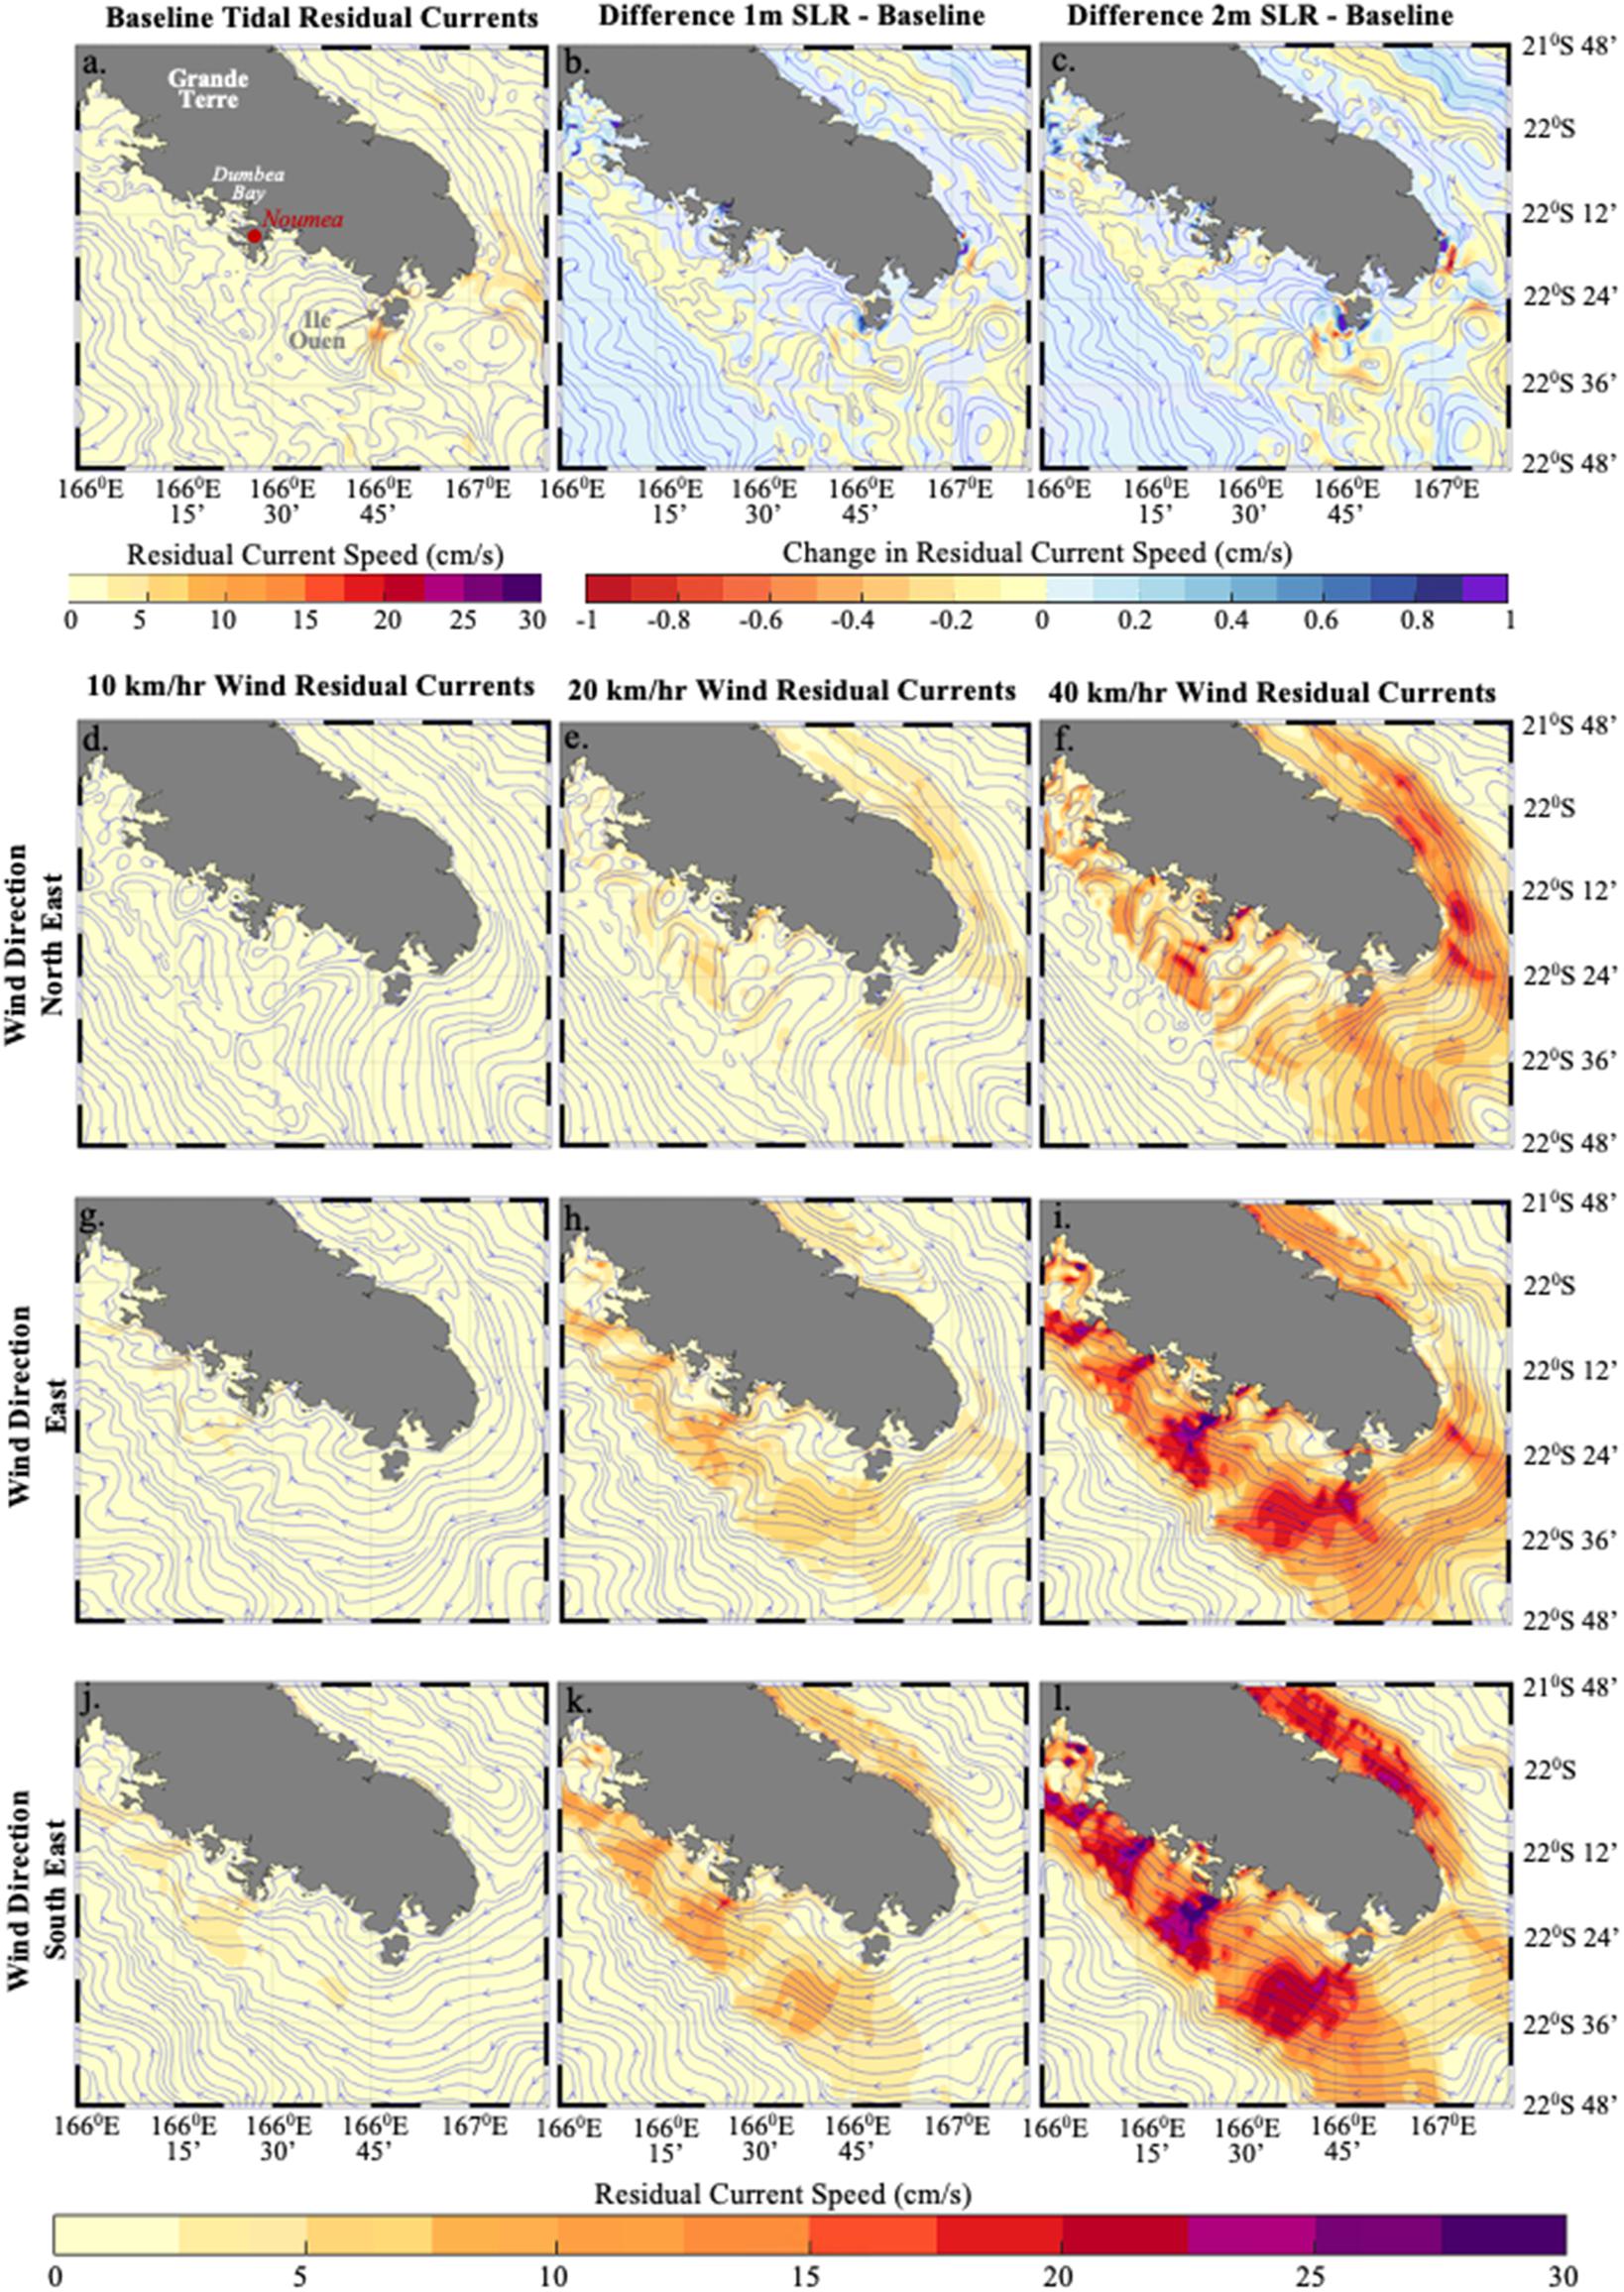
Figure 8. Tidal residual current speeds (cm/s), with current patterns indicated by streamlines for southern Grande Terre, New Caledonia (a). Change in residual current speeds (cm/s) and patterns under 1 m SLR (b) and 2 m SLR (c). Wind residual current speeds (cm/s) and patterns under 10 km/h (d), 20 km/h (e), and 40 km/h (f) northeast winds. Wind residual current speeds (cm/s) and patterns under 10 km/h (g), 20 km/h (h), and 40 km/h (i) east winds. Wind residual current speeds (cm/s) and patterns under 10 km/h (j), 20 km/h (k), and 40 km/h (l) southeast winds. Latitudes are displayed to the right of panels (c,f,i,l). Longitude for all panels are displayed below panels (a–c,j–l).
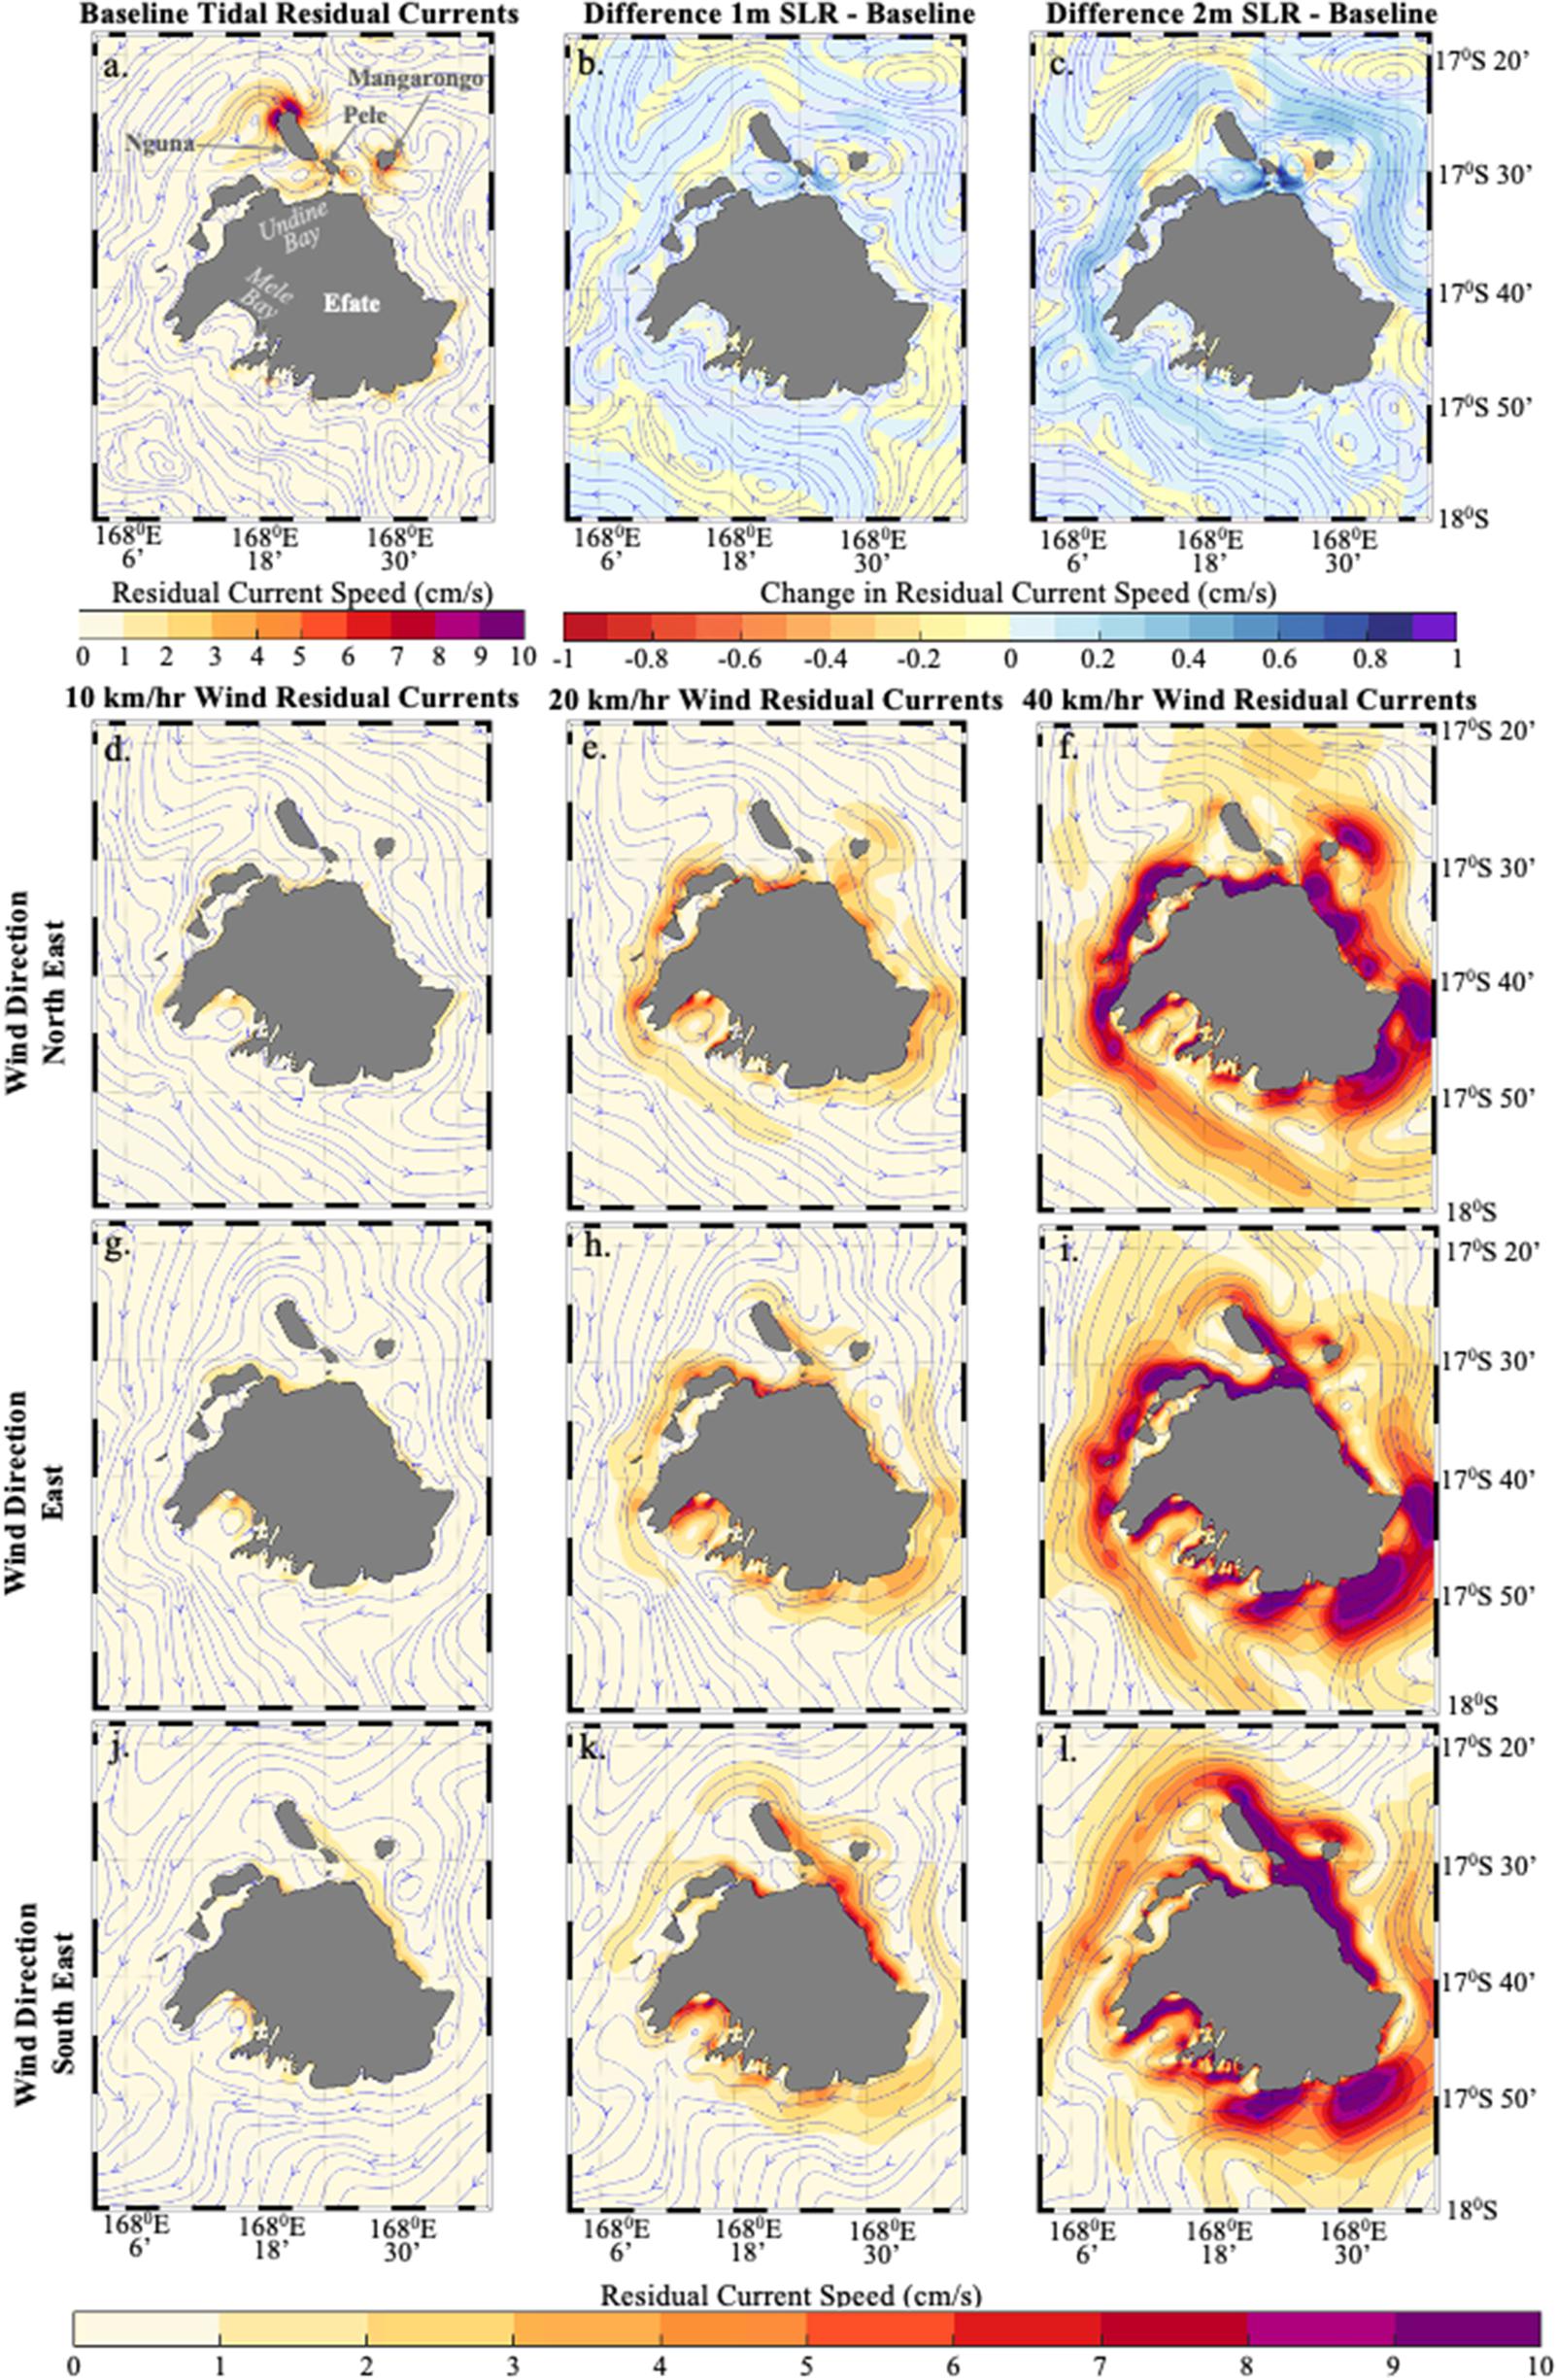
Figure 9. Tidal residual current speeds, with current patterns indicated by streamlines, around Efate Island, Vanuatu (a). Change in residual current speeds (cm/s) and patterns under 1 m SLR (b) and 2 m SLR (c). Wind residual current speeds (cm/s) and patterns under 10 km/h (d), 20 km/h (e), and 40 km/h (f) northeast winds. Wind residual current speeds (cm/s) and patterns under 10 km/h (g), 20 km/h (h), and 40 km/h (i) east winds. Wind residual current speeds (cm/s) and patterns under 10 km/h (j), 20 km/h (k), and 40 km/h (l) southeast winds. Latitudes are displayed to the right of panels (c,f,i,l). Longitude for all panels are displayed below panels (a–c,j–l).
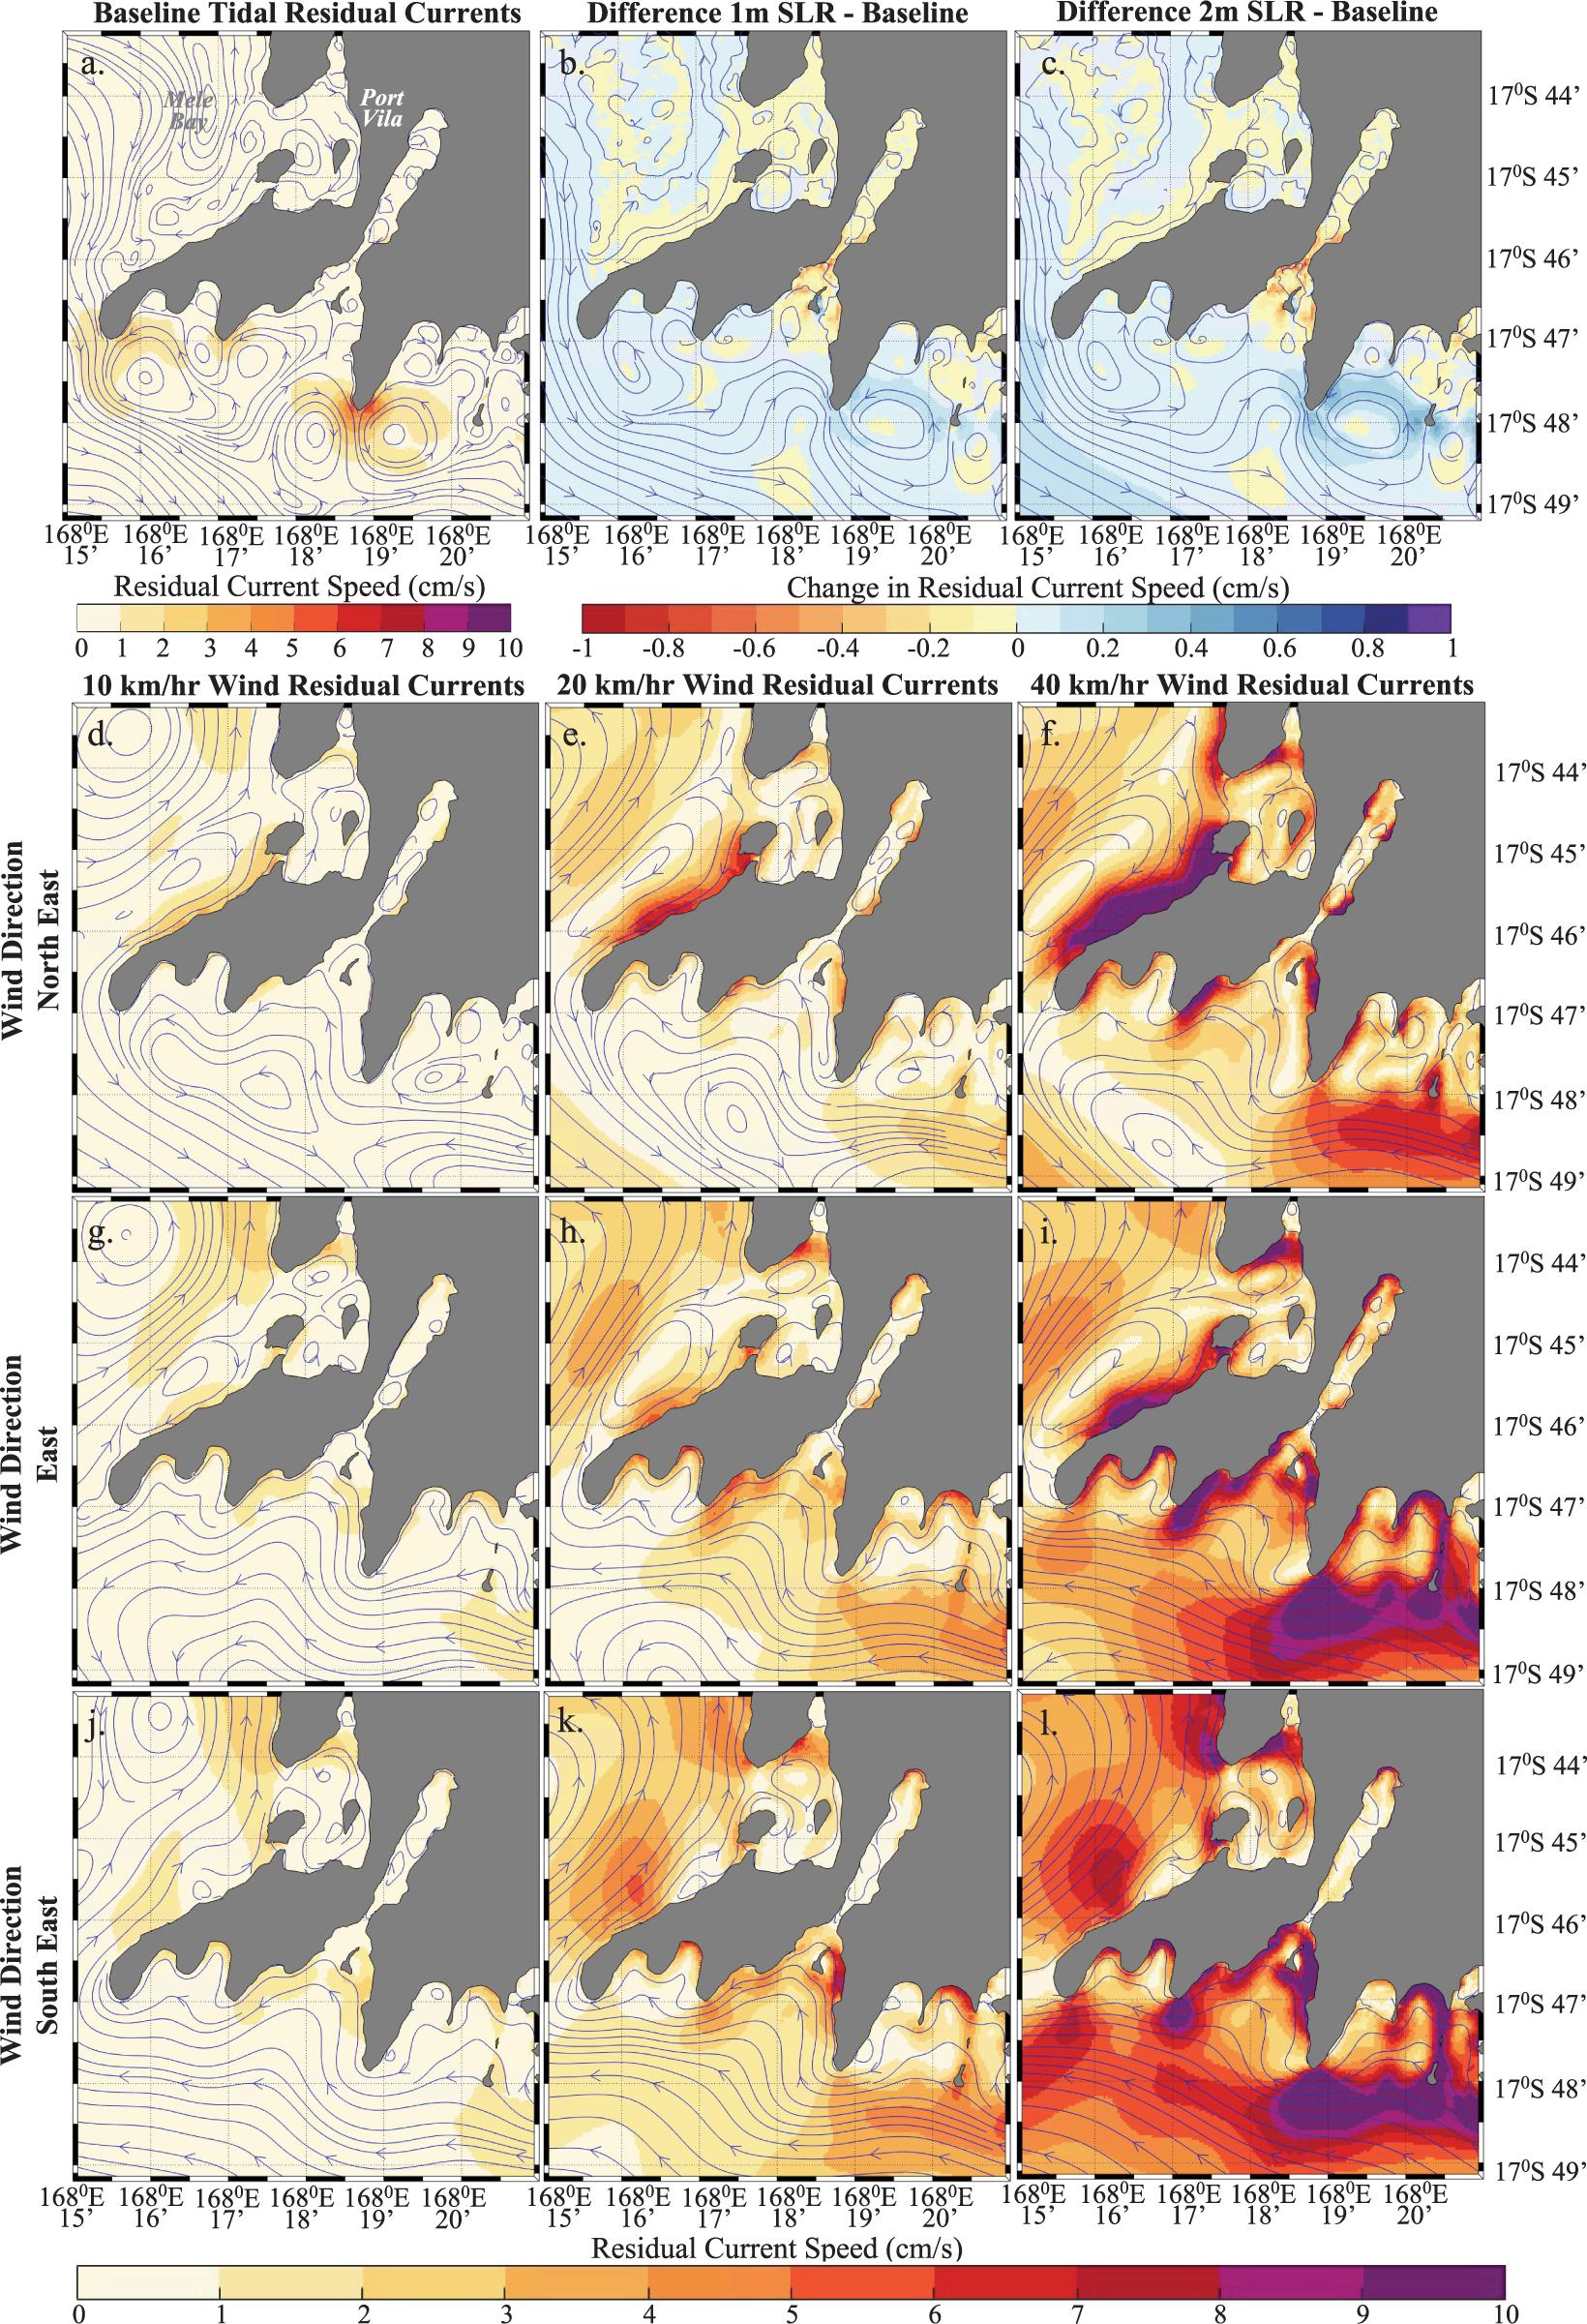
Figure 10. Tidal residual current speeds, with current patterns indicated by streamlines, focussing on Erakor Lagoon, southwest Efate Island (a). Change in residual current speeds (cm/s) and patterns under 1 m SLR (b) and 2 m SLR (c). Wind residual current speeds (cm/s) and patterns under 10 km/h (d), 20 km/h (e), and 40 km/h (f) northeast winds. Wind residual current speeds (cm/s) and patterns under 10 km/h (g), 20 km/h (h), and 40 km/h (i) east winds. Wind residual current speeds (cm/s) and patterns under 10 km/h (j), 20 km/h (k), and 40 km/h (l) southeast winds. Latitudes are displayed to the right of panels (c,f,i,l). Longitude for all panels are displayed below panels (a–c,j–l).
The application of trade winds from the NE, E and SE generated Ekman flow as demonstrated by wind residual circulation streamline directions (Figures 7d–l). In open ocean waters, current speeds associated with wind residual circulation remain relatively low (0–5 cm/s, under 40 km/h winds). The direction of wind residual currents was consistent for simulations employing the same wind direction, with residual current speeds increasing in response to higher wind speed (Figures 7d–l). In addition to currents flowing approximately perpendicular to the wind direction, residual current patterns reveal the formation of anti-cyclonic eddies in open ocean waters, particularly east of 171°E, and complex meandering flow on the leeward side of islands (Figures 7d–l).
Within coastal waters of Grande Terre, tidal residual currents typically flow NW parallel to the shoreline along the eastern side of the island, turning west in coastal waters north of Grande Terre, before flowing SW down the western side of the island. Within lagoon wates of southern Grande Terre, the north-westward flowing tidal residual currents along the eastern shoreline, reach speeds of up to 3.5 cm/s near the outer reef edge. Between the eastern outer reef and the shoreline, tidal residual current speeds range from 0.5 to 2 cm/s and follow a more meandering path, with an overall north-westerly flow (Figure 8a). In coastal waters of the Southern New Caledonia Lagoon, on the southwestern side of Grande Terre, tidal residual current speeds are most significant (up to ∼13 cm/s) near Ile Ouen, where cyclonic and anticyclone eddies form (Figure 8a). Within lagoon waters north of Ile Ouen, tidal residual current speeds are typically less than 2.5 cm/s, with the higher speeds occurring close to shore, near headlands and small islands. NE wind residual currents typically flowed SE, in line with currents in deep water adjacent to Grande Terre (Figures 7d–f, 8d–f), however currents within lagoon waters on the western side were more meandering, compared to those on the east (Figures 8d–f). Under E and SE winds, coastal wind residual currents flowed NW within lagoon waters on both the eastern and western sides of Grande Terre. On the eastern side of Grande Terre, currents in deep water, beyond the lagoon, flowed SE. On the western side of Grande Terre, north-westward currents extended well beyond lagoon waters, before eventually turning south/southwest (for E/SE winds, respectively) a few hundred kilometres west of Grande Terre (Figures 7g–l, 8g–l). Wind-residual current speeds increased in response to higher wind speeds for all three wind directions. The fastest residual current speeds were generated by winds blowing from the SE, followed by E, then NE. Residual current speeds under 40 km/h winds reached 56, 49, and 31 cm/s for SE, E, and NE winds, respectively.
In coastal waters of Efate Island, tidal residual circulation largely flows in an anticlockwise direction around the island. Fastest tidal residual currents are generated near headlands and islands, and appear strongest north of Efate Island in the vicinity of Nguna, Mangaronga, Pele, and Islands. Cyclonic and anticyclonic eddies form either side of Nguna Island, reaching speeds of up to 6 cm/s at the northern tip of Nguna Island (Figure 9a). A clockwise eddy is also generated within Undine Bay (Figure 9a). NE wind residual currents flow SE, splitting at Nguna Island, with currents continuing to flow S/SE on the eastern side of Efate, while west of Nguna Island currents flow south-west, parallel to the coastline, before turning southeast again at the western-most point of Efate Island, outside Mele Bay. Clockwise circulation occurs within Undine Bay, and anticyclonic circulation occurs within Mele Bay (Figures 9d–f). E wind residual currents flow S either side of Efate Island. Close to north Efate, the southerly flow is interrupted by the small islands, which cause the currents to flow westward, following the topography. At Nguna island currents flow SW, turning S/SE at the western tip of Efate. On the southern side of the island currents flowing down the eastern side of the island turn southwest, following the coastline, bending west before turning southeast just south of Mele Bay. Within Undine Bay, circulation is clockwise, and within Mele Bay circulation is anticlockwise (Figures 9g–i). SE wind residual currents flow SW around Efate, splitting to flow either side of the island north of Mangaronga Island. Within Undine Bay a smaller anticlockwise eddy forms west of Pele Island which interacts with flow generated in the wake of Nguna Island. Within Mele Bay, anticyclonic circulation persists (Figures 9j–l). Under all three wind directions, wind residual currents were typically strongest close to shore.
In the vicinity of Erakor Lagoon, Efate, the anticlockwise tidal residual currents circumnavigating Efate Island (shown in Figure 9a) interact with complex shoreline geometry, generating cyclonic and anticyclonic eddies either side of headlands and within embayments (Figures 9a, 10a). Tidal residual current speeds largely fell between 0 and 2 cm/s inside embayments, exceeding 5 cm/s at the tips of headlands (Figure 10a). Being located on the southwestern side of Efate Island, the embayments shown in Figure 10 do not experience the full force of winds from the NE, E, or SE, however winds from all three directions generated significant residual currents. Unlike tidal residual currents, wind residual currents were typically fastest along shorelines within embayments, rather than at the tips of headlands. Strong wind residual currents (>10 cm/s, under 40 km/h winds) also consistently flowed in waters just south of Erakor Lagoon (Figures 10d–l, east of 168° 18′ E, and south of 17° 48′ S) for all three wind directions.
Sea Level Rise Experiments
Tidal Constituents
Applying uniform sea level at the model open boundary resulted in negligible change in tidal constituent amplitudes and phases relative to baseline (0 m SLR) values. Both 1 and 2 m SLR scenario constituent amplitudes and phases altered by less than 1 mm and 0.2 degrees relative to baseline values across all eleven tide gauge locations. Pickering et al. (2017) investigated changing tidal constituent amplitudes and mean high water levels across the Pacific Basic under a 2 m SLR scenario, finding little change (±1 cm) in the Vanuatu/New Caledonia region.
Maximum Depth-Averaged Current Speeds
Whilst tidal amplitudes and phases were not impacted by 1–2 m SLR, maxDA_curSp diverged from baseline values in response to higher sea levels, with speeds mostly increasing with SLR (Figures 3b,c). The most significant changes are seen in coastal waters, and over remote reef/lagoon environments (Figures 3b,c).
Within lagoon waters surrounding southern Grande Terre, under 1 m SLR, maxDA_curSp increased by more than 20 cm/s inside Dumbea Bay, near Noumea (Figure 4b). Under 2 m SLR, areas where current speeds increased by 20 cm/s expanded (Figure 4c). MaxDA_curSp in outer sections of the Southern New Caledonia Lagoon, also showed a strong positive response to higher sea levels (green/blue areas, Figures 4b,c), increasing by 5–20 cm/s under 2 m SLR.
In waters surrounding Efate Island, changes were less significant than for Grande Terre, particularly for the 1m SLR scenario (Figures 5b,c). Changes in maxDA_curSp fell within ±10 cm/s of baseline conditions, and were mostly positive, with the exception of two Efate locations where current speeds decreased under 1m SLR (red and orange areas Figure 5b).
Figure 6b displays a closer view of Erakor Lagoon on the south-western side of Efate, where maxDA_curSp were seen to reduce under 1 m SLR. Under 2 m SLR, the area within Erakor Lagoon, where current speeds reduced significantly decreased, and area where current speeds increased expanded. At this location the relationship between maxDA_curSp and SLR is non-linear.
Residual Currents
Increasing sea level by up to 2 m caused tidal residual current speeds to alter by between −0.5 and +1 cm/s over the majority of the model domain (Figures 7b,c). As with changes in maxDA_curSp, the highest degree of change (up to ±2.5 cm/s) occurred in coastal waters, within a few kilometres of island shorelines and remote open ocean reefs (Figures 7b,c, 8b,c, 9b,c, 10b,c). Overall, tidal residual current patterns under 1 and 2 m SLR conditions are similar to those under present-day water levels. Within the lagoon waters of southern Grande Terre, changes in tidal residual currents showed a variable response, both with respect to speed and direction (Figures 8b,c). Around Efate Island, SLR largely enhanced the anticlockwise tidal residual circulation (Figures 9b,c). Within Erakor Lagoon, on the south-western side of Efate Island, tidal residual current speeds decreased in response to higher sea levels, whilst outside the lagoon, near headlands, eddy circulation was enhanced (Figures 10b,c).
Discussion
Tide gauge observations at nine of the eleven locations are not quality controlled (Port Vila and Noumea are the two quality-controlled sites). Errors in tide gauge observations may contribute to differences between observed and model-predicted tidal water level time series, and tidal constituents. At Litzlitz water level time series are approximately 1 h out of phase (Figure 2C). Data from different years were used to perform tidal constituent analysis and subsequent observed tidal water level time series, however the temporal offset between model and observed tidal water level time series did not alter. When differences at this location where first identified during model runs using a preliminary iteration of the Van-Fvcom grid, it was thought that differences from observations at this location may be due to insufficient grid resolution. Improvements were made increasing the grid resolution from Grid resolution in this area was initially ∼500 m. In an effort to improve model representation of the coastal embayment containing the Litzlitz tidal gauge, grid resolution was increased to ∼350 m, which improved replication of tidal amplitudes (not shown), however phase differences between modelled and observed water levels did not significantly alter. Higher grid resolution (∼100 m) may be necessary at this location, however, such improvements must be accompanied by higher resolution (<100 m) bathymetry data, which at present is not available at this site. Alternatively human error converting from local time to GMT, may be responsible for model/observation phase differences at this location, as the tide gauge data is not quality controlled. Aside from these differences the model performs well and replicates tidal characteristics across the model domain. In the absence of observations, the tidal constituents determined from model predicted water levels may be used to generate tidal water level data at unmonitored coastal locations within the model domain. This information may assist shipping, since these islands are heavily reliant upon shipping for the transportation of goods, but some docks may be difficult to access during low tide due to the presence of barrier and fringing reefs.
While point current measurements are difficult to reproduce in the Van-Fvcom regional/coastal model due to the complexity of reef/lagoon bathymetry, the replication of previously modelled M2 tidal ellipse data, and close agreement at sites where coastline complexity is captured (CM2, Erakor lagoon) provide confidence the Van-Fvcom model adequately replicates overall tidal circulation in this complex region. Currents due to wind waves may contribute to the under-prediction of maximum current speeds at the CM1 site in Erakor Lagoon. The horizontal grid resolution, which is ∼80 m in this section of the grid, may also contribute to the lower current speeds predicted at this location. To this end, higher resolution, site specific coastal models are necessary to capture the full variability of coastal currents within these highly spatially variable reef/lagoon environments. With respect to the higher agreement achieved by the fixed-grid New Caledonia model (Douillet, 1998) relative to the Van-Fvcom model, factors which may contribute to the higher discrepancy are: the much larger Van-Fvcom model domain; the distant location of open boundary forcing; differences in methodologies employed to generate tidal forcing at the open boundary; lack of calibration with respect to currents; and the inclusion of variable wind forcing in the fixed-grid model, while the Van-Fvcom verification runs were forced solely by tidal processes. Results achieved by Van-Fvcom tidal simulations demonstrate that the model is an appropriate tool for investigating circulation at scales larger than ∼100 m. As higher resolution coastal bathymetry data become available and computational capacity increases, the accuracy with which future unstructured-mesh models covering the region are able to replicate current meter observations will likely improve. Despite the limitations discussed, given the overall strong performance of the Van-Fvcom model with respect to tidal characteristics, the regional/coastal model would prove extremely useful in providing boundary conditions to drive higher-resolution, site specific coastal process models.
Local wind forcing by weak to strong trade winds within the model domain do not significantly alter coastal water levels at tide gauge stations, however, coastal currents are sensitive to trade winds (Figures 3–10). The shape and orientation of islands with respect to wind direction strongly influenced the degree to which wind altered maximum current speeds in coastal waters (Figures 3–6). This is evident in the different responses seen for Efate compared with Grande Terre. Grande Terre, having an elongated shape (∼400 km long, ∼60 km wide), oriented northwest/southeast, showed a reduced response to winds from the NE on both windward and leeward sides of the island, compared with winds from the E and SE (Figures 4d–l). While overall changes in maximum current speeds due to wind around Efate were less than those seen around Grande Terre, magnitudes were similar for the three wind directions (Figures 5d–l). This is a reflection of its smaller size and more circular shape (∼ 50 km long, ∼50 km wide). Differences in wind residual current patterns (Figures 7–10) further demonstrate the influence of island shape on coastal circulation. While Ekman flow is evident from residual circulation plots for all three wind directions, Ekman processes dominate residual circulation for NE wind events. Both the New Caledonia and Vanuatu archipelagos lie along a NW/SE orientation, which aligns with the direction of Ekman flow due to NE winds. As such, Ekman currents generated by NE winds experience less interruption by the topography, compared to Ekman currents generated by E and SE winds (Figures 7d–f). East winds generate southward Ekman currents, however, residual circulation patterns were more complex, likely due the higher degree of blocking along the N/S axis by islands. In relatively open water, between Vanuatu and New Caledonia, rather than flowing directly south, residual currents flowed SE, aligning with the orientation of both island chains and the deep Vanuatu trench (Figures 7g–i). Below Grande Terre, an irregular anticyclonic eddy forms which facilitates NW residual current flow in western Grande Terre coastal waters (Figures 7g–i, 8g–i). West of 163°E, residual circulation is dominated by Ekman processes, flowing south (Figures 7g–i). South east winds generated SW flowing Ekman currents. Despite the Vanuatu islands lying perpendicular to the Ekman current flow, north of 17°S, residual circulation largely follows a SE path, showing little diversion due to blocking by islands (Figures 7j–l). Between Vanuatu and New Caledonia, below 17°S, residual currents bend to the SE, again aligning with the orientation of the Vanuatu Trench. On the western side of Grande Terre, an anticyclonic eddy forms which generates NW residual currents close to shore. West of 163°E, residual circulation is once more dominated by Ekman processes, flowing SE (Figures 7j–l). Under all three wind directions a series of large anticyclonic eddies form in the eastern half of the model domain, in deep ocean waters (Figures 7d–l). Here we attribute residual circulation to geostrophic currents set up in response to Ekman flow from winds with an easterly component, since all the eddies rotate in an anticlockwise direction. Geostrophic processes also likely contribute to the eddy which forms south of Grande Terre, since sea surface height anomalies correspond strongly with streamline shapes (Supplementary Material 1). Further experiments testing the effect of uniform bathymetry and presence/absence of islands would help explain these features more fully. With respect to coastal circulation, wind-residual current results shown in Figures 8–10, demonstrate the important role wind-driven circulation has on near-shore currents, and thus coastal processes.
Tidal constituents did not noticeably alter under higher sea level conditions. This contrasts with the findings of Devlin et al. (2017), at least at Port Vila, Vanuatu, where M2 and K1 amplitudes were reported to alter by 8.25 ±1.95, and −1.17 ± 0.5 cm per m SLR respectively. At Noumea change in M2 amplitude was not statistically significant, and change in K1 amplitude was 2.7 ± 1.01 cm per m SLR (Devlin et al., 2017). Despite changes in M2 and K1 constituents, change in HAT was not statistically significant at Vanuatu and New Caledonia locations (Devlin et al., 2017). The differences between our findings and those of Devlin et al. (2017) are likely due to the fact that our model experiments did not account for basin-scale changes in tidal characteristics in model forcing, which are likely to be evident in tidal gauge data. In a global tidal modelling study investigating the impact of SLR on tides, Pickering et al. (2017) found SLR of 1 and 2 m had relatively little effect on mean water levels in the New Caledonia/Vanuatu region. Under 2 m SLR, mean high water levels altered by ∼0 – 1 cm (Pickering et al., 2017). These results are similar to our findings. Taking these studies as a whole, results indicate that relative SLR is unlikely to be significantly affected by changing tidal characteristics under higher sea levels at Vanuatu and New Caledonia coastal locations. As tidal gauge and satellite altimetry records extend in time, a clearer picture with respect to changing tidal behaviour in this region will be obtained.
While future tidal amplitudes and phases did not alter, analysis of maximum and residual currents under SLR show changes in coastal currents should be taken into account when investigating how coastal environments will alter in the future. Changes in maximum depth-averaged currents speeds were greatest under 2 m SLR conditions, and the spatial distribution of areas that experienced the greatest change differed from those due to wind (Figures 3b,c, 4b,c, 5b,c, 6b,c). Within the Southern New Caledonia Lagoon, the largest changes correspond to upper embayments and shallower sections within the lagoon (purple shaded areas Figures 4b,c). In coastal waters of Efate, the two locations which showed a reduction in maximum depth-averaged current speed due to SLR, correspond to shallow fringing reef environments (yellow/orange shaded areas Figures 5b,c, 6b,c). The reduction at these sites is likely due to water depths increasing by approximately an order of magnitude under 1m SLR (e.g., from ∼0.1 m at low tide to ∼1.1 m at low tide under 1 m SLR), resulting in lower depth-averaged current speeds. In shallow water (∼<3 m) dissipation of tidal energy appears to exceed potential increases in tidal energy associated with the increase in tidal prism due to 1m SLR. Within Erakor Lagoon, under 2 m SLR water depth over the majority of the reef platforms exceeds 3 m, and increased tidal energy due to the larger tidal prism appears to dominate reduction in tidal energy due to dissipation in shallow water (<3 m), leading to predominantly positive changes in maxDA_curSp in Erakor Lagoon (Figure 6c). The results in Erakor Lagoon indicate that the representation of the reef is very important when determining the impact changing sea levels will have on coastal processes in fringing reef locations. Significant changes in current speeds alter coastal processes including sediment transport regimes, tidal flushing rates, pollutant dispersal and larval transport. Further analysis is needed to determine how model depth settings over reef environments may alter response to SLR at other coastal locations within our model domain, to better understand the variety of responses different locations will experience in the future. While the magnitude of change in residual current speeds due to SLR is small relative to those seen due to wind conditions, these small changes still have the potential to influence sediment transport erosion and deposition patterns, due to the sustained nature of tide-generated residual currents.
In the scenarios tested, it was assumed that the underlying morphology would remain unchanged. In the context of Vanuatu and New Caledonia, this includes the assumption that the shape and height of coral reefs will not alter between present-day and 2100. Given the tectonic activity present in this region, coupled with the rapid development of some coastal sites, and lack of data regarding reef growth/damage, this assumption is limited. Nevertheless, results presented provide important insights which may assist future modelling efforts exploring impacts associated with changing sea levels in this region.
Interannual and interdecadal sea level variability is of the order ±0.1 m in the Western South Pacific Ocean, and is determined by large-scale ocean dynamics (Kumar et al., 2018). As such, changes in current speeds and residual circulation caused by interannual sea level variability are likely to be relatively small, given the limited response seen under +1 m SLR (Figures 3b, 10b). Sites likely to be most sensitive to sea level variations due to regional circulation are shallow reef platforms near narrow deeper channels, as well as coastal embayments where higher water levels act to alter the tidal prism. The effect baroclinic processes and the transfer of kinetic energy associated with the jets and boundary currents, have on coastal circulation in lagoons and embayments is presently unknown. The role these processes play in island coastal waters will be the focus of future modelling studies employing the Van-Fvcom model, in an effort to better understand how regional ocean processes affect coastal processes in remote island locations.
Conclusion
The model setup employed in this study adequately replicated tidal characteristics at coastal sites across the region and is an appropriate tool for predicting tidal behaviour at unmonitored coastal locations within the model domain. While point current meter data were difficult to replicate within spatially variable reef/lagoon environments, overall current patterns match those of previous studies.
Coastal waters and waters between closely spaced islands were most sensitive to changes in current speeds and residual current patterns associated with changes in wind speed and direction, and due to changes in sea level. Within reef/lagoon systems the largest changes in maximum depth-averaged current speeds due to wind corresponded with shallower sections of the waterways.
Wind-residual current speeds were sensitive to changes in wind speed. Strong winds (up to 40 km/h) generated coastal residual currents whose magnitudes were significantly larger (up to an order of magnitude) than those associated with tidal-residual currents. Wind-residual current patterns depended upon wind direction, with circulating patterns showing little alteration due to changing wind speed. Wind residual circulation appears to be influenced by Ekman processes, geostrophic currents, and topographic steering, with the influence of each process varying across the region. Future simulations will employ spatially and temporally varying wind fields to determine how realistic wind-residual current patterns and magnitudes vary from those due to the uniform wind fields employed in this study.
Sea level rise of up to 2 m SLR did not significantly alter tidal amplitudes and phases at Vanuatu and New Caledonia coastal sites. Changes in maximum current speeds due to SLR were sensitive to the presence of reef platforms. For reef platforms that were exposed, or close to becoming exposed at low tide under 0 m SLR, response to SLR was non-linear. Sections of reef platforms experienced reduced current speeds under 1m SLR and increasing current speeds under 2 m SLR. The sensitivity of modelled currents within reef/lagoon systems to the assumptions made regarding reef bathymetry require further research, and comprehensive sensitivity studies are necessary to accurately predict how SLR will alter coastal processes in these environments.
Tidal-residual current patterns were little altered by changes in sea level and changes in tidal-residual current speeds ranged from 0 and ±2.5 cm/s. Model results demonstrate that coastal circulation was more sensitive to changes in wind than changes in sea level. Given the sustained nature of tidal processes, when compared with the variability of wind, the impact of higher sea levels on maximum current speeds and residual circulation still needs to be taken into consideration when investigating the impact climate change will have on island coastal communities and ecosystems.
Given the important role regional circulation processes play in the SW Pacific region, it is vital to investigate exchange processes between oceanic and lagoon waters. While preliminary, the modelling experiments undertaken in this study demonstrate the potential value of using unstructured-mesh finite volume modelling approaches to investigate circulation in geometrically complex environments covering large regions. Further this study justifies the future use of the Van-Fvcom model to investigate more complex ocean processes in remote island regions. While this paper addresses circulation, future coastal/ocean modelling studies will need to examine the influence of regional ocean circulation, nutrient, pollutant and fishery distribution patterns, and their impacts on existing systems and communities, to better understand the full range of impacts associated with changing climate.
Data Availability Statement
Model outputs generated during the current study are available from the corresponding author upon reasonable request, with permission of the Director of the Griffith Climate Action Beacon.
Author Contributions
SL, CL, and RT contributed to conception and design of the study. SL constructed the model upon which the study is based and FZ assisted identify and rectify errors in model setup and input files. SL analysed model results with assistance from FZ who provided expertise with respect to tidal analysis. SL wrote the first draft of the manuscript. All authors contributed to manuscript revision, read, and approved the submitted version.
Funding
This research was supported by a grant from a private charitable trust.
Conflict of Interest
The authors declare that the research was conducted in the absence of any commercial or financial relationships that could be construed as a potential conflict of interest.
Publisher’s Note
All claims expressed in this article are solely those of the authors and do not necessarily represent those of their affiliated organizations, or those of the publisher, the editors and the reviewers. Any product that may be evaluated in this article, or claim that may be made by its manufacturer, is not guaranteed or endorsed by the publisher.
Acknowledgments
This research was undertaken with the assistance of resources and services from the National Computational Infrastructure (NCI), which is supported by the Australian Government, through support from the Queensland Cyber Infrastructure Foundation (QCIF). Many thanks to Andrew Ross and Jianhua Qi for patiently answering all queries relating to FVCOM. Thanks to John Luick for providing assistance applying phase corrections for tidal constituent data used to force the FVCOM model. We wish to acknowledge the Vanuatu Meteorology and Geo-Hazards Department and the UK Hydrographic Office for the provision of bathymetry data. This research was undertaken through an MOU with the Tafea Provincial Government and under a research agreement with the Vanuatu National Cultural Centre representing the Government of the Republic of Vanuatu and the local community.
Supplementary Material
The Supplementary Material for this article can be found online at: https://www.frontiersin.org/articles/10.3389/fmars.2021.697741/full#supplementary-material
Supplementary Material 1 | Plots to illustrate the potential influence of geostrophic currents (a) and topographic steering and island blocking (b) on wind-residual current patterns. Sea surface height anomaly (a) reflects the mean value calculated over the same timeframe used to calculate wind residual currents. Latitudes are shown to the left of panels with longitude displayed below.
References
Andrew, N. L., Bright, P., de la Rua, L., Teoh, S. J., and Vickers, M. (2019). Coastal proximity of populations in 22 Pacific island countries and Territories. PLoS One 14:e0223249.
Caldwelal, P. C., Merrifield, M. A., and Thompson, P. R. (2015). Sea Level Measured by Tide Gauges from Global Oceans — the Joint Archive for Sea Level holdings (NCEI Accession 0019568), Version 5.5.
Chen, C., Beardsley, R., and Cowles, G. (2006). An unstructured-grid Finite-Volume Coastal Ocean Model (FVCOM) system. Oceanography 19, 78–89. doi: 10.5670/oceanog.2006.92
Church, J. A., Clark, P. U., Cazenave, A., Gregory, J. M., Jevrejeva, S., and Levermann, A. (2013). “Sea level change,” in Climate Change 2013: the Physical Science Basis. Contribution of Working Group I to the Fifth Assessment Report of the Intergovernmental Panel on Climate Change, eds T. F. Stocker, D. Qin, and G.-K. Plattner (Cambridge: Cambridge University Press).
Codiga, D. L. (2011). Unified Tidal Analysis and Prediction Using the UTide Matlab Functions. Technical Report 2011-01. Narragansett, RI: University of Rhode Island.
Cravatte, S., Kestenare, E., Eldin, G., Ganachaud, A., Lefèvre, J., Marin, F., et al. (2015). Regional circulation around New Caledonia from two decades of observations. J. Mar. Syst. 148, 249–271. doi: 10.1016/j.jmarsys.2015.03.004
David, G. (2016). “The challenge of sustainability for Pacific Island village fisheries, a historical perspective,” in Fisheries in the Pacific: the Challenges of Governance and Sustainability, [online] (Marseille: Pacific-credo Publications). doi: 10.4000/books.pacific.446 ISBN: 9782956398165.
Devlin, A. T., Jay, D. A., Zaron, E. D., Talke, S. A., Pan, J., and Lin, H. (2017). Tidal variability related to sea level variability in the Pacific Ocean. J. Geophys. Res. Oceans 122, 8445–8463. doi: 10.1002/2017JC013165
Douillet, P. (1998). Tidal dynamics of the south-west lagoon of New Caledonia: observations and 2D numerical modelling. Oceanologica Acta 21, 69–79. doi: 10.1016/S0399-1784(98)80050-9
Douillet, P., Ouillon, S., and Cordier, E. (2001). A numerical model for fine suspended sediment transport in the south-west lagoon of New-Caledonia. Coral Reefs 20, 361–372. doi: 10.1007/s00338-001-0193-6
Dayan, H., Le Cozannet, G., Speich, S., and Thiéblemont, R., (2021). High-End scenarios of sea-level rise for coastal risk-averse stakeholders. Front. Mar. Sci. 8:569992. doi: 10.3389/fmars.2021.569992
Egbert, G., and Erofeeva, S. (2002). Efficient inverse modeling of barotropic ocean tides. J. Atmos. Oceanic Technol. 19, 183–204. doi: 10.1175/1520-0426(2002)019<0183:EIMOBO>2.0.CO;2
Faivre, G., Vieira da Silva, G., Aimbie, J., Ware, D., Tomlinson, R., Mackey, B., et al. (2020). “Coastal processes within a coral reef lagoon system: Erakor lagoon, Efate Island, Vanuatu,” in Global Coastal Issues of 2020, eds G. Malvárez and F. Navas (Florida: Coconut Creek).
Flanders Marine Institute (VLIZ) and Intergovernmental Oceanographic Commission (IOC) (2021). Sea Level Station Monitoring Facility. Available online at: http://www.ioc-sealevelmonitoring.org (accessed August 16, 2021). doi: 10.14284/482
Ganachaud, A., Cravatte, S., Melet, A., Schiller, A., Holbrook, N. J., Slyon, B. M., et al. (2014). The Southwest Pacific Ocean circulation and climate experiment (SPICE). J. Geophys. Res. Oceans 119, 7660–7686. doi: 10.1002/2013JC009678
Hamlington, B. D., Frederikse, T., Nerem, R. S., Fasullo, J. T., and Adhikari, S. (2020). Investigating the acceleration of regional sea level rise during the satellite altimeter era. Geophys. Res. Lett. 47:e2019GL08 6528.
Hénin, C., and Cresswell, G. R. (2005). Upwelling along the western barrier reef of New Caledonia. Mar. Freshw. Res. 56, 1005–1010. doi: 10.1071/MF04266
Hermans, T. H. J., Gregory, J. M., Palmer, M. D., Ringer, M. A., Katsman, C. A., and Slangen, A. B. A. (2021). Projecting global mean sea-level change using CMIP6 models. Geophys. Res. Lett. 48:e2020GL092064.
IMaRS-USF and Institut de Recherche pour le Developpement (IRD) (2005). Millennium Coral Reef Mapping Project. Validated Maps. Cambridge: UNEP World Conservation Monitoring Centre.
Institute for Marine Remote Sensing-University of South Florida (IMaRS-USF). (2005). Millennium Coral Reef Mapping Project. Unvalidated Maps. these Maps are Unendorsed by IRD, but Were Further Interpreted by UNEP World Conservation Monitoring Centre. Cambridge: UNEP World Conservation Monitoring Centre.
Jevrejeva, S., Frederikse, T., Kopp, R. E., Le Cozannet, G., Jackson, L. P., and van de Wal, E. S. W. (2019). Probabilistic sea level projections at the coast by 2100. Surv. Geophys. 40, 1673–1696. doi: 10.1007/s10712-019-09550-y
Kumar, V., Melet, A., Meyssignac, B., Ganachaud, A., Kessler, W. S., Singh, A., et al. (2018). Reconstruction of local sea levels at South West Pacific Islands - a multiple linear regression approach (1988–2014). J. Geophys. Res. Oceans 123, 1502–1518. doi: 10.1002/2017JC013053
Marchesiello, P., Lefèvre, J., Vega, A., Couvelard, X., and Menkes, C. (2010). Coastal upwelling, circulation and heat balance around New Caledonia’s barrier reef. Mar. Pollut. Bull. 61, 432–448. doi: 10.1016/j.marpolbul.2010.06.043
Nishijima, K., Mori, N., Yasuda, T., Shimura, T., Gogon, J. T., Gibson, D., et al. (2015). DPRI-VMGD Joint Survey for Cyclone Pam Damages. Available Online at: http://www.taifu.dpri.kyoto-u.ac.jp/wp-content/uploads/2015/05/DPRI-VMGD-survey-first-report-Final.pdf (accessed October 20, 2015).
Pelling, H. E., and Green, J. A. M. (2013). Sea leve rise and tidal power plants in the Gulf of Maine. J. Geophys. Res. Oceans 118, 2863–2873. doi: 10.1002/jgrc.20221
Pickering, M. D., Horsburgh, K. J., Blundell, J. R., Hirschi, J. J.-M., Nicholls, R. J., Verlaan, M., et al. (2017). The impact of future sea-level rise on the global tides. Cont. Shelf Res. 142, 50–68. doi: 10.1016/j.csr.2017.02.004
Robinson, I. S. (1983). “Chapter 7 tidally induced residual flows,” in Elsevier Oceanography Series, ed. B. Johns (Amsterdam: Elsevier).
Signell, R. P., and Geyer, R. (1991). Transient eddy formation around headlands. J. Geophys. Res. 96, 2561–2575. doi: 10.1029/90JC02029
Spalding, M. D., Ravilious, C., and Green, E. P. (2001). World Atlas of Coral Reefs. Berkeley, CA: The University of California Press.
UNEP-WCMC, WorldFish Centre, WRI, and TNC (2010). Global Distribution of Warm-Water Coral Reefs, Compiled from Multiple Sources (listed in “Coral_Source.mdb”), and Including IMaRS-USF and IRD (2005), IMaRS-USF (2005) and Spalding et al. (2001). Cambridge: UNEP World Conservation Monitoring Centre.
WCRP Global Sea Level Budget Group (2018). Global sea-level budget 1993–present. Earth Syst. Sci. Data 10, 1551–159018. doi: 10.5194/essd-10-1551-2018
Wessel, P., and Smith, W. H. F. (1996). A global, self-consistent, hierarchical, high-resolution shoreline database. J. Geophys. Res. 101, 8741–8743. doi: 10.1029/96JB00104
Keywords: sea level rise, residual, circulation, tidal, constituents
Citation: Lee SB, Zhang F, Lemckert CJ and Tomlinson R (2021) Investigations Exploring the Use of an Unstructured-Grid, Finite-Volume Modelling Approach to Simulate Coastal Circulation in Remote Island Settings—Case Study Region, Vanuatu/New Caledonia. Front. Mar. Sci. 8:697741. doi: 10.3389/fmars.2021.697741
Received: 20 April 2021; Accepted: 24 June 2021;
Published: 07 September 2021.
Edited by:
Rui Caldeira, Agência Regional para o Desenvolvimento da Investigação Tecnologia e Inovação (ARDITI), PortugalReviewed by:
Shiqiang Yan, City University of London, United KingdomMilena Menna, National Institute of Oceanography and Applied Geophysics (Italy), Italy
Michela De Dominicis, National Oceanography Centre, United Kingdom
Copyright © 2021 Lee, Zhang, Lemckert and Tomlinson. This is an open-access article distributed under the terms of the Creative Commons Attribution License (CC BY). The use, distribution or reproduction in other forums is permitted, provided the original author(s) and the copyright owner(s) are credited and that the original publication in this journal is cited, in accordance with accepted academic practice. No use, distribution or reproduction is permitted which does not comply with these terms.
*Correspondence: Serena Blyth Lee, c2VyZW5hLmxlZUBncmlmZml0aC5lZHUuYXU=