 Shuai Zhang
 Min Li
 Jiangfeng Zhu
 Shannan Xu
 Zuozhi Chen
94% of researchers rate our articles as excellent or good
Learn more about the work of our research integrity team to safeguard the quality of each article we publish.
Find out more
ORIGINAL RESEARCH article
Front. Mar. Sci. , 06 September 2021
Sec. Marine Biology
Volume 8 - 2021 | https://doi.org/10.3389/fmars.2021.693954
An integrated approach including analyses of different biological traits is a proven and powerful tool used to assess the population structures of fish species, which is vital for fishery stock conservation and management of wild resources. This study evaluates the use of three natural tags (i.e., microsatellites, parasites, and otolith nucleus chemistry) in order to describe the population structure of the spinyhead croaker, Collichthys lucidus, in the coastal waters of China, on evolutionary and ecological time scales. Spinyhead croaker was assigned with 86% accuracy to its regional origin (northern China vs. southern China) using all three natural tags. Accuracy decreased when incorporating only one type of natural tag (genetics: 19–69%; parasites: 30–60%; otolith chemistry: 51–86%) or when assigning the fish to a fine scale (sea areas: 44–64%; sampled estuaries: 19–66%). However, the overall accuracy assignment improved slightly compared with otolith chemistry (estuaries: 55 vs. 51%; sea areas: 66 vs. 64%; regions: 86 vs. 86%). Three natural tags and integrated results show that C. lucidus in Chinese coastal waters can be separated into distinct northern and southern Chinese stocks. Finally, this information should promote the development of effective conservation strategies and integrated fisheries management plans for this commercially important species.
Knowledge of fish stock structures is fundamental to understand the population ecology of species and is a prerequisite for stock assessments and fishery management (Begg and Waldman, 1999; Cadrin et al., 2014; Pita et al., 2016). Definitions of what constitutes a fish stock have varied among studies, but the terms stock and population are often used synonymously in fisheries science (Waldman, 2005; Secor, 2014; Tanner et al., 2016). In general, “stock” and “population” are defined as an intraspecific group of randomly mating, reproductively isolated individuals, with temporal or spatial integrity (Begg and Waldman, 1999). Population structures are complex, and mismatches often occur between the ecology or biology of a species and the realized management unit, which can bias stock assessments and impede sustainable fisheries management (Reiss et al., 2009; Cadrin et al., 2014; Kerr et al., 2017).
Various methods are used to delineate fish stocks, including demographic (e.g., life-history parameters), phenotypic (e.g., body and otolith morphometrics and meristics), and natural markers (e.g., genetics, parasites, otolith elemental composition, and fatty acid profiles), and applied marks (e.g., internal and external tags, electronic tags, and otolith thermal marking) (Cadrin et al., 2014; Pita et al., 2016; Tanner et al., 2016). However, a single method is generally insufficient to uncover the complexity of stock structures. Consequently, a holistic approach whereby different data types are simultaneously analyzed is deemed best practice for determining the most appropriate spatial structure for stock assessments (Begg and Waldman, 1999; Abaunza et al., 2008; Cadrin et al., 2014; Cadrin, 2020). For example, a multidisciplinary approach integrating analyses of population genetics, parasites, and otolith chemistry could provide essential insights into the stock spatial structure and connectivity among stocks (Higgins et al., 2010; Tanner et al., 2014; Moura et al., 2020).
Genetic markers are well-established and can reveal long-term population structures and connectivity on evolutionary time scales in aquatic environments (Antoniou and Magoulas, 2014; Mariani and Bekkevold, 2014; Moreira et al., 2020). Microsatellite DNA markers have proved to be useful for fine-scale population discrimination, as they are less affected by selective pressures and undergo fast mutation rates with high levels of polymorphism (Kasapidis and Magoulas, 2008; Mariani and Bekkevold, 2014; Moreira et al., 2020). However, the ecological implications from low but significant genetic differentiation among marine fish populations are difficult to assess, because the exchange between relatively few individuals (i.e., 10 individuals per generation) precludes the accumulation of large genetic differences among groups of fish (Slatkin, 1987; Palumbi, 2003).
Alternatively, parasites and otolith chemistry have been extensively used to examine the stock structure over ecological time scales (MacKenzie and Abaunza, 2014; Tanner et al., 2016). The use of parasites as biological tags to differentiate fish stocks is based on the variations under ecological and environmental conditions in the regions that the hosts inhabit, resulting in non-uniform distributions and abundances of the parasites on the intermediate and final hosts (MacKenzie and Abaunza, 2014; Canel et al., 2019; Levy et al., 2019). Otoliths, situated in the inner ear of fishes, are composed of calcium carbonate crystals and have the traits of being metabolically inert yet sensitive to environmental factors as they grow in daily increments (Campana, 1999; Campana and Thorrold, 2001). Moreover, growth increments in otoliths constitute a stable chronological and environmental record over the entire life of a fish (Elsdon et al., 2008). The chemistry of the otolith nucleus, laid down during early life, can be used to detect spatial separation resulting from segregation during spawning and hence population differences (Ashford et al., 2006).
Despite progress in the application of different methods to identify fish stock structures, delineation of the management units of many commercially exploited species is far from resolved. The Collichthys lucidus (Richardson, 1844) is a commercially important small-sized fish widely distributed in the northwestern Pacific, from southern Japan to the inshore waters of Vietnam, with the majority of its distribution in Chinese waters (Nguyen Van et al., 2020). The C. lucidus is relatively short-lived (<4 years), sexually matures at the age of 1 year, and has high fecundity, typically with 10,000 to 20,000 eggs per female (Wu and Chen, 1991; Wu and Wang, 1996; Liu et al., 2015). This species presents estuarine-resident life history and may make a short distance migration from deep to shallow water areas in breeding seasons (Liu et al., 2015). Its high consumption (Hu et al., 2015), flesh quality, and high commercial value make this species of great interest to fishers and fishery managers; in 2007, the Ministry of Agriculture and Rural Affairs added it to the “List of China State Key Protected Commercial Sources of Aquatic Animals and Plants.” In recent years, the yield of C. lucidus has dramatically declined in traditionally fished estuaries, such as Yangtze River Estuary and Minjiang River Estuary (Figure 1), attributed to overfishing (Huang et al., 2010; Hu et al., 2015; Wang et al., 2020). Previous studies of C. lucidus on genetics revealed genetic differentiation, but the boundary of stocks of this species varied (Zheng et al., 2011; Song et al., 2019; Zhang et al., 2021), and the results of body morphology showed a single stock for this species (Liang et al., 2018) (more information in Supplementary Table 1). Thus, information on the stock structure of C. lucidus is far from resolved.
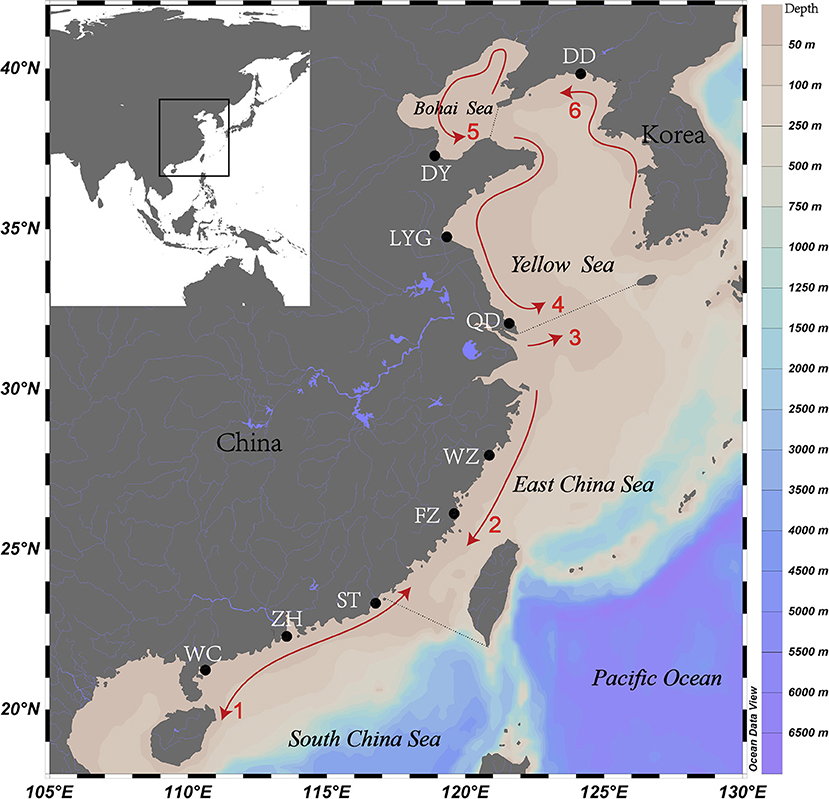
Figure 1. Sampled estuaries for spinyhead croaker Collichthys lucidus in Chinese coastal waters. Black dots represent the sampled estuaries: DD, Yalu River Estuary; DY, Yellow River Estuary; LYG, Haizhou Bay; QD, Yangtze River Estuary; WZ, Oujiang River Estuary; FZ, Minjiang River Estuary; ST, Hanjiang River Estuary; ZH, Pearl River Estuary; and WC, Jianjiang River Estuary. Arrows indicate the spreading direction of coastal currents: 1, Guangdong Coastal Current (GCC); 2, Zhejiang–Fujian Coastal Current (ZFCC); 3, Yangtze Diluted Water (YDW); 4, Yellow Sea Coastal Current (YSCC); 5, Bohai Sea Coastal Current (BSCC); and 6, Korea Coastal Current (KCC). The coastal current system diagram is a composite mainly based on reference (Chen et al., 1991). Water depths are shown in different colors. For interpretation of the color references in this figure legend, the reader is referred to the Web version of this article.
This study aimed to apply, for the first time, combined analyses of genetics, parasites, and otolith chemistry, using the same set of specimens, to provide useful information on the stock structure of C. lucidus in China, which will have implications for fishery management.
Collichthys lucidus samples (n = 352) were collected from nine estuaries along the coast of China in autumn (September to November) 2019 (Figure 1; Table 1). Fish were captured by local fishers (typically caught using a bottom trawl), frozen in individual plastic bags at −20°C, and sent to the laboratory. After thawing, each fish was measured for body length (BL, to the nearest 0.1 mm) and sexed.
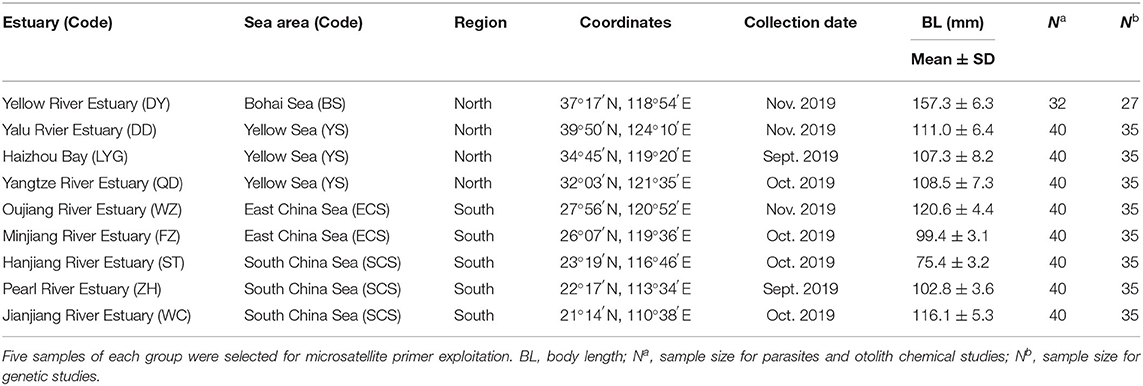
Table 1. Sampling information of spinyhead croaker Collichthys lucidus from Chinese coastal waters.
Parasites were removed from the gills, body cavity, and viscera (stomach, pyloric caeca, intestine, bladder, liver, gallbladder, gonads, and mesenteries) using a stereoscopic microscope (20×). Parasites were counted and preserved in 75% of ethanol for molecular identification or mounted in ammonium picrate glycerin (APG) for morphological study. A sample of dorsal muscle from each fish was preserved in 95% of ethanol for microsatellite study. Sagittal otoliths were extracted, cleaned in ultrapure water, sonicated for 5 min, and stored dry in plastic tubes.
Ten microsatellite loci were selected from published studies that previously described this species (Lin et al., 2011; Ma et al., 2011; Sun et al., 2013): CL2 (HQ843049), CL9 (HQ843056), CL10 (HQ843057), CL11 (HQ843058), CL12 (HQ843059), CL13 (HQ843060), CL15 (HQ843062), CL17 (HQ843064), CL18 (HQ843065), and PC8F5 [not uploaded, details given in the study by Lin et al. (2011)]. PCR was performed in a total reaction volume of 10 μl containing 2.0 mM of MgCl2, 0.2 mM of dNTP mix, 0.2 μM of each primer, 0.04 U of Taq DNA polymerase (Invitrogen), 1× PCR buffer, approximately 40 ng of template DNA, and deionized water. The forward primer of each pair was labeled with a fluorescent dye (M13; Applied Biosystems). PCR thermocycling parameters were as follows: an initial denaturation of 2 min at 94°C; five touchdown cycles of 94°C for 30 s, 60°C−50°C for 30 s (dropping 1°C per cycle), and 72°C for 30 s; and a final extra extension at 72°C for 5 min. The PCR products were examined on a 2% agarose gel. Amplified fragments were analyzed by capillary electrophoresis on an ABI 3730xl DNA Analyzer (Applied Biosystems) at the Leba Technology Co., Beijing, China. Microsatellite alleles were scored using GeneMapper 3.2 (Applied Biosystems, USA), and the size data were transformed using Convert 1.31 (Glaubitz, 2004).
Diagnostic morphological characters were used first to identify parasites, and the molecular markers were used for confirmation or higher-resolution identification of the taxa. For monogenean and trematode, APG-preserved oralum-carmine-stained specimens of Grenacher were identified according to morphological characters (Shen and Qiu, 1995; Zhang et al., 1999; Sailaja et al., 2019). The partial 28S rDNA sequences of monogenean were amplified following the method of Jovelin and Justine (2001). For nematode, the entire ITS region (ITS1, 5.8S, and ITS2) was amplified for all specimens, following the procedures of Kong et al. (2015). For acanthocephalan, alum-carmine-stained specimens of Grenacher were identified by morphological characters (Zhang et al., 1999), and the partial 18S sequences were amplified following the procedures of Li et al. (2018).
The PCR products were subjected to automated DNA sequencing (BGI, Guangzhou, China) with the same primers used for amplification. Sequences were assembled and edited using DNAStar software (DANSTAR, USA) and BLASTn from the National Center for Biotechnology Information (NCBI) database. Sequences were designated as belonging to a given species if there was ≥99% sequence identity to the NCBI database, and if a sequence could be assigned to several species (≥99% matching rate) belonging to the same genus, the taxonomic resolution was collapsed to the genus level. Sequences were designated as belonging to a genus if there was ≥96% sequence identity, and the other sequences were assigned as an unidentified parasite. Sequences were deposited in GenBank under the following accession numbers: monogenean, MW365537; nematode, MW370538–MW371024; acanthocephalan, MW371026–MW371027.
In general, short-lived parasites (ectoparasites and adults of gastrointestinal parasites) are unsuitable as they are indicators for fish stock discrimination (MacKenzie and Abaunza, 2014). Furthermore, short-lived species, unidentified species, and parasite species found at a low prevalence (in less than three samples) were excluded. Six long-lived parasite species (i.e., Hysterothylacium aduncum, Hysterothylacium fabri, Hysterothylacium liparis, Hysterothylacium sinense, Hysterothylacium sp. 1, and Raphidascaris sp. 1) were selected for fish stock discrimination in this study (Supplementary Tables 2, 3). The population indices (i.e., prevalence, abundance, and mean abundance) were calculated according to the definitions given by Bush et al. (1997).
The right sagittal otoliths were selected and embedded in epoxy resin (Buehler, USA), and then, a transverse section (400–500 μm thick) including the nucleus was prepared using an IsoMet 1000 precision saw (Buehler, USA) at low speed. The sections were polished with 600- and 1,200-grit paper with a MetaServ 250 grinder-polisher (Buehler, USA), and they were examined under a microscope (Olympus, 20×) until the core was exposed. After drying, three otoliths were attached to a clean petrographic slide using the Crystalbond 509 mounting adhesive (Aremco Products Inc., USA) with the nucleus side up. Thereafter, samples were rinsed and sonicated for 8 min in ultrapure water, dried at room temperature, and stored until chemical analysis.
The core region of otolith was analyzed (one spot per otolith) in a random order using laser ablation inductively coupled plasma mass spectrometry (LA-ICP-MS) (UP193, ESI New Wave Research; ThermoScientific iCAP RQ ICP-MS) at the Guangzhou Taoyuan Testing Technology Co., Ltd. (Guangzhou, China). The laser was programmed at a wavelength of 193 nm, a pulse rate of 8 Hz, an energy density of 5 J/cm2, a dwell time of 5 s, and a spot size of 50 μm (representing about 2.5 days of the fish lifetime). The otolith surface was pre-ablated to remove any contaminations. External calibration was performed with two standard reference materials (SRMs), namely, NIST 612 and NIST 610, which were analyzed at the beginning and at the end of the sampling sessions (after nine samples). Calcium was used as an internal standard to account for variation in ablation and aerosol efficiency. Twenty-five elements were analyzed, namely, 6Li, 11B, 23Na, 25Mg, 27Al, 29Si, 31P, 39K, 43Ca, 53Cr, 55Mn, 57Fe, 59Co, 60Ni, 65Cu, 66Zn, 77Se, 85Rb, 88Sr, 105Pd, 111Cd, 115In, 121Sb, 138Ba, and 208Pb. Concentrations of elements lower than the limit of detection (LOD) and with >10% uncertainty were excluded from subsequent analyses (Supplementary Table 4). Eight elements (i.e., 23Na, 25Mg, 31P, 39K, 55Mn, 57Fe, 88Sr, and 138Ba) were expressed as ratios relative to 43Ca and transformed to μg element g−1 calcium for later analyses.
Based on the samples obtained from the estuaries, associated sea areas, and according to the geographical region, the following three spatial scales were proposed to analyze the data: (1) the nine sampled estuaries; (2) four groups of sea areas associated with the sampled estuaries (the Bohai Sea, BS; Yellow Sea, YS; East China Sea, ECS; South China Sea, SCS); and (3) two groups based on the geographical regions (North and South) (Figure 1; Table 1).
To test normality and homoscedasticity of the dataset, including BL, parasite abundance, and otolith nucleus chemistry, the Shapiro–Wilk test (S–W test), and Levene's test were conducted, respectively. The Kruskal–Wallis test (K–W test) followed by Dunn's multiple-comparison test was conducted to determine the differences in BL and otolith mean elemental ratios among locations. Pearson's test was conducted among data for the nine sampled estuaries to determine relationships between sex, BL, and parasite infection rate. Multivariate analysis of variance (MANOVA) implemented using SPSS 19.0 (SPSS, Inc., Chicago, IL, USA) was used to test for spatial differences in otolith multi-elemental composition and parasite assemblages at the three spatial scales, and the normality assumption is only needed for small sample sizes (n < 30) according to the central limit theorem.
Before performing analyses to determine genetic variability and population structure patterns, Micro-Checker 2.2.3 was used to estimate the frequency of null alleles, large allele dropout, and scoring errors (van Oosterhout et al., 2004). Genetic diversity parameters at the population level, including the actual number of alleles (Na), the effective number of alleles (Ne), observed (Ho) and expected (He) heterozygosity, and inbreeding coefficient (F) were calculated using GenAIEx 6.5 (Peakall and Smouse, 2012). Allelic richness (Ar) was calculated based on the minimum sample size (n = 27), using Fstat 2.9.3.2 (Goudet, 1995). The polymorphism information content (PIC) (Botstein et al., 1980) was calculated using MS Tools and Cervus 3.0 (Kalinowski et al., 2007). Genepop 4.7.5 (Raymond and Rousset, 1995) was used to identify deviations from Hardy–Weinberg equilibrium (HWE) using the Markov chain approximation method (10,000 dememorizations, 100 batches, and 5,000 iterations per batch), and the significance level was adjusted by applying sequential Bonferroni correction using Fstat 2.9.3.2 (Goudet, 1995). A unweighted pair group method with arithmetic mean (UPGMA) tree based on genetic distance of Nei was generated using NTSYSpc 2.10e (Applied Biostat, New York). To compare the patterns of genetic structure, the principal coordinate analysis (PCoA) of the gene frequency data was performed using GenAIEx 6.5 (Peakall and Smouse, 2012).
To understand the population spatial genetic structure, the most likely number of clusters (K) within and among the nine sampled estuaries was evaluated using the Bayesian clustering method with STRUCTURE 2.3.4 (Pritchard et al., 2000). The calculation was performed under an admixture model with 10 independent simulations with 100,000 iterations of Markov chain Monte Carlo after a burn-in of 100,000. The value of K was assumed to be in the range of 1–10 populations, and the optimal number of clusters (K) was determined using the ΔK method (Evanno et al., 2005) implemented using STRUCTURE HARVESTER 0.6.94 (Earl and Vonholdt, 2012). The best value of K was not influenced by loci with low genetic polymorphisms (PIC < 0.5), so these loci were used in this study (the results are shown in Supplementary Figure 1).
To measure the hierarchical population genetic differentiation, a spatially explicit analysis of molecular variance (AMOVA) and pairwise F-statistics (FST) were implemented using Arlequin 3.5.1.2 (Excoffier and Lischer, 2010). All groupings were evaluated with 10,000 permutations. Molecular variance as defined in the M&M general analysis was analyzed at the three spatial scales (i.e., estuaries, sea areas, and geographical regions). To evaluate the relationship between genetic distance and geographical distance, the Mantel test was implemented using GenAIEx 6.5 (Peakall and Smouse, 2012).
To illustrate the differences between estuaries, a canonical analysis of principal coordinates (CAP) was performed with the data for parasites and otolith chemistry; the Bray–Curtis index of similarity was computed for square-root-transformed parasite abundance data, zero-adjusted (dummy variable value = 1) owing to a large number of spinyhead croaker found without any parasites, and the Euclidean distance was computed for square-root-transformed otolith elemental concentrations data, set as 9,999 permutations (Anderson et al., 2008; Clarke and Gorley, 2015). Canonical analysis of principal coordinates analyses were performed using the PERMANOVA+ add-on package for PRIMER7, (PRIMER-e, New Zealand) (Anderson et al., 2008; Clarke and Gorley, 2015).
The linear discriminant analysis (LDA) was selected to examine the assignment accuracy of fish to its sampling location at the three spatial scales using different combinations of the natural tags: (i) allele frequencies of microsatellite loci (genetics); (ii) infection abundance of long-lived parasites (parasites); (iii) sagittal otolith element concentrations (otolith chemistry); and (iv) genetics, parasites, and otolith chemistry (combined). For genetics, parasites, and otolith chemistry, a population assignment (n = 307, details are given in Table 1) was performed using the assignPOP package (Chen et al., 2018). The assignment accuracy might be affected by low-variance alleles, and alleles with more than 95% allele frequency were removed using the reduce.allele function. Monte-Carlo cross-validation was performed using the assign.MC and accuracy.MC functions for the subset sampled (proportions: 0.5, 0.7, and 0.9) and assigned them to populations, using 1, 25, 50, and 100% of the loci, performed for 30 iterations. The assignment accuracy mean values and SD (overall and per baseline) were calculated, and the proportions of individuals and loci with the highest overall accuracy assignment were selected.
Unless otherwise specified, the statistical analyses were implemented using R software (R Core Team, 2021).
Fish BL was not normally distributed across the overall data (S–W test: BL, W = 0.828, p < 0.01), and variances were heterogeneous among the sampled estuaries [Levene's test: BL, F(8, 343) = 5.351, p < 0.001] (Supplementary Table 5). Parasite species and otolith element ratios were mostly non-normal and heterogeneous among locations (Supplementary Table 5). Parasite assemblages were significantly different at the three spatial scales [MANOVA; estuaries, Wilks' lambda (Λ) = 0.325, F(48, 1, 667) = 8.911, p < 0.001; sea areas, Λ = 0.485, F(18, 971) = 15.717, p < 0.001; and geographical regions, Λ = 0.857, F(6, 345) = 9.570, p < 0.001]. The ratios of all otolith elements to calcium (element:Ca ratio) significantly differed at the three spatial scales [MANOVA; estuaries, Λ = 0.09, F(64, 1, 945) = 15.759, p < 0.001; sea areas, Λ = 0.306, F(27, 994) = 18.397, p < 0.001; and geographical regions, Λ = 0.505, F(9, 342) = 37.211, p < 0.001], and each of the element ratios differed significantly among estuaries, except for P:Ca and Fe:Ca (Supplementary Figure 3). Body length was positively related to the parasite infection rate for H. liparis (Pearson, r = 0.4, p < 0.001), H. sinense (Pearson, r = 0.5, p < 0.001), and Hysterothylacium sp. 1 (Pearson, r = 0.2, p < 0.01) (Supplementary Table 6). Sex was not significantly related to the infection rates of each parasite species (Pearson, p > 0.05) (Supplementary Table 6).
The 10 microsatellite loci examined were polymorphic (average PIC = 0.527, range 0.170–0.929) in all individuals (Supplementary Table 7). The Micro-Checker analysis suggested the possible presence of null alleles at CL2 in fish from the Haizhou Bay, Yangtze River Estuary, and Pearl River Estuary (LYG, QD, and ZH); at CL9 in all location samples; at CL11 in all samples except for Yellow River Estuary, Hanjiang River Estuary, and Jianjiang River Estuary (DY, ST, and WC); at CL15 in DY and QD; at CL17 in Minjiang River Estuary (FZ); and at CL18 in QD. In addition, no evidence for scoring error caused by stuttering or large allele dropout was observed. Tests for conformity to HWE were applied for multi-locus and locus-by-locus by locations and revealed several deviations after Bonferroni correction, mainly caused by heterozygote deficiency and possibly by null alleles (Supplementary Table 7). The genetic parameters are summarized in Supplementary Table 7.
The Bayesian clustering analysis suggested two putative stocks (K = 2) (Supplementary Figure 1A). The first cluster comprised individuals collected in the North geographical region (i.e., at DY, DD, LYG, and QD), and the second cluster included the individuals collected in the South geographical region (i.e., at WZ, FZ, ST, ZH, and WC) (Figure 2). The clustering analysis based on UPGMA and PCoA separated the locations into two main groups, with similar results from the STRUCTURE analysis (Supplementary Figures 4, 5).
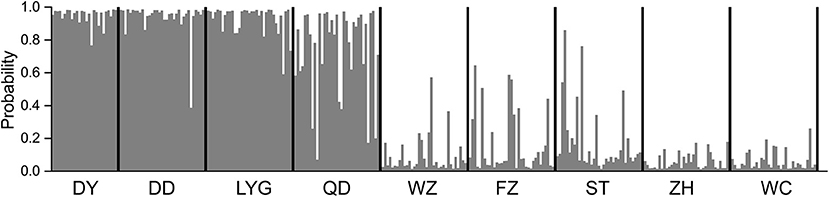
Figure 2. Assignment of individuals based on the Bayesian clustering method by using STRUCTURE at K = 2. Each bar represents one individual of spinyhead croaker C. lucidus, with the estimated probability belonging to one or another population. Codes at the bottom indicate sampled estuaries (see Table 1 for abbreviations).
The AMOVA showed significant genetic differentiation at three hierarchical levels (Supplementary Table 8). Genetic variations were mostly found within the population levels at three hierarchical levels and ranged from 89 to 92.74% (Supplementary Table 8). The global FST among all populations based on the microsatellite dataset was significant (FST = 0.108, p < 0.01). Genetic population differentiation of C. lucidus was high among the nine sampled estuaries as revealed by pairwise multi-locus FST-values ranging from 0.010 (DD-LYG and ZH-WZ) to 0.153 (DY-WC) (Table 2), and the samples from the North geographical regions were significantly differentiated from samples collected in the South geographical regions (Table 2). In general, significant differences were found between estuaries within the northern and southern China regions, except for DY-DD, DD-LYG, WZ-ZH, WZ-WC, and FZ-WC (Table 2). The Mantel test showed significant positive correlation with geographical distance (r = 0.713, p < 0.05) (Supplementary Figure 6).
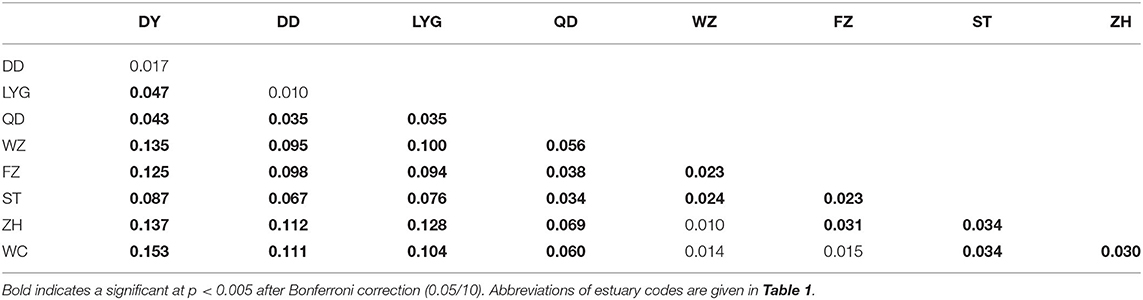
Table 2. Pairwise genetic differentiation estimates based on 10 microsatellite loci of spinyhead croaker C. lucidus among nine sampled estuaries in the Chinese coastal waters.
The C. lucidus specimens harbored a total of 16 parasite species, of which 12 are new host records according to the present analyses (Supplementary Table 2). A total of 748 metazoan parasites were counted, with a high proportion of nematodes (83.6%), dominated by H. sinense (42.1%) and Raphidascaris sp. 1 (23.9%). The temporary parasite Mazocraeoides dussumieri was the only parasite found on spinyhead croaker in YS and with high infection prevalence in LYG (47.5%) and QD (27.5%) (Supplementary Table 2). Parasite burdens were variable across the parasite species and fish sampling locations in terms of both prevalence and abundance. Total parasite prevalence on the sampled fish was <50.9%; however, only five parasite taxa showed a prevalence >10% in at least one of the estuaries, and four of these taxa are long-lived species (Supplementary Table 2). In addition, six of the parasite taxa were represented by a single specimen (Supplementary Table 3).
The CAP analysis of parasites showed significant differences among estuaries [trace statistic (tr) = 1.11; p < 0.001], and the selected orthonormal principal coordinate (PCO) axes (m = 3) described 98.5% of the variations. The first two canonical axes resulting from the CAP analysis of the parasite dataset were separated clearly into two main groups (Figure 3A): the cluster on the left part of the biplot mostly consisted of DY and DD fish, and the cluster on the right consisted of fish from the other locations. When vectors corresponding to Pearson's correlations of individual parasite species were superimposed with the CAP axes (Pearson, r > 0.3), H. sinense (−0.71) and H. liparis (−0.50) were mainly associated with DY and DD by CAP1, and H. fabri (0.61) and Raphidascaris sp. 1 (0.51) were mainly associated with other locations by CAP2.
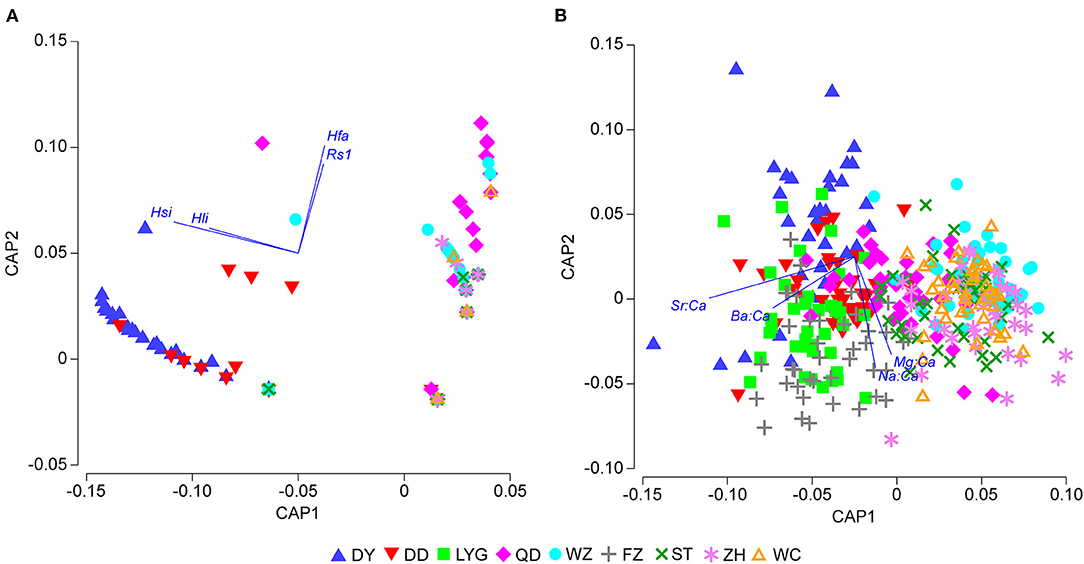
Figure 3. Canonical analysis of principal coordinates (CAP) biplot of spinyhead croaker C. lucidus from Chinese coastal waters. (A) Parasite infracommunities based on Bray–Curtis dissimilarity (dummy variable value = 1) of square-root-transformed parasite abundance data; (B) otolith chemistry based on Euclidean distance dissimilarity of square-root-transformed otolith nucleus elemental concentration data. Vectors represent Pearson's correlations of individual parasite species or otolith elemental ratios with the CAP axes (r > 0.3), including Hsi, Hysterothylacium sinense; Hli, H. liparis; Rs1, Raphidascaris sp. 1; and Hfa, H. fabri. Abbreviations of estuary codes are shown in Table 1. For interpretation of the color references in this figure legend, the reader is referred to the web version of this article.
The CAP analysis of element ratios showed significant differences among estuaries (tr = 1.66; p < 0.001), and the selected orthonormal PCO axes (m = 8) described 100% of the variations. The first two canonical axes resulting from the CAP analysis of otolith element ratios also separated two main groups (Figure 3B); one cluster on the top left of the biplot mainly grouping samples from the northern China region and the second cluster on the lower right mainly grouping samples from the southern China region. When vectors corresponding to Pearson's correlations of individual otolith elemental ratios were superimposed on the CAP axes (Pearson's, r > 0.3), the ratios Sr:Ca (−0.82) and Ba:Ca (−0.46) were mainly associated with samples from the North geographical region by CAP1, and the ratios Na:Ca (−0.63) and Mg:Ca (0.55) were mainly associated with samples from the South geographical region by CAP2.
After removing loci with a low variance of microsatellite markers, 37.6% of loci remained from the original dataset. The overall assignment accuracy using genetic baselines ranged from 19.4 to 68.9%; zero assignment accuracy (0%) occurred for estuary WZ and sea areas BS and ECS (Table 3); and the highest assignment accuracy ranged from 67.2 to 70.2% at the regional level, between the North and South geographical regions. The overall assignment accuracy using parasite baselines ranged from 30.4 to 66.2%, lower than those of genetics, otolith chemistry, and combined dataset baselines at the three spatial scales, except for genetics at the estuaries scale (Table 3); zero assignment accuracy (0%) occurred in LYG, ST, ZH, and WC at the estuaries level, and low assignment accuracy in ECS (4.6%) and SCS (6.9%); and the South geographical region had much higher assignment accuracy than the North geographical region (99.6 vs. 21.9%). The overall assignment accuracy using otolith chemistry baselines ranged from 51.3 to 85.6%; the highest assignment accuracy ranged from 82.2 to 88.1% at the regional level; and the accuracy was relatively higher than it was for the other two natural tags at the three spatial scales (Table 3). The overall assignment accuracy of the integrated baselines ranged from 54.6 to 85.5%, which was similar to those of the otolith chemistry baselines at the three spatial scales (i.e., 54.6 vs. 51.3%, 66.3 vs. 63.8%, and 85.5 vs. 85.6%, respectively). Overall, the assignment accuracy increased with the spatial scale (Table 3). The results showed that the data for the combined natural tags and for otolith chemistry had the highest assignment accuracy at the three spatial scales, parasites had the lowest assignment accuracy at the sea areas and region scales, and genetics had the lowest assignment accuracy at the estuaries scale.
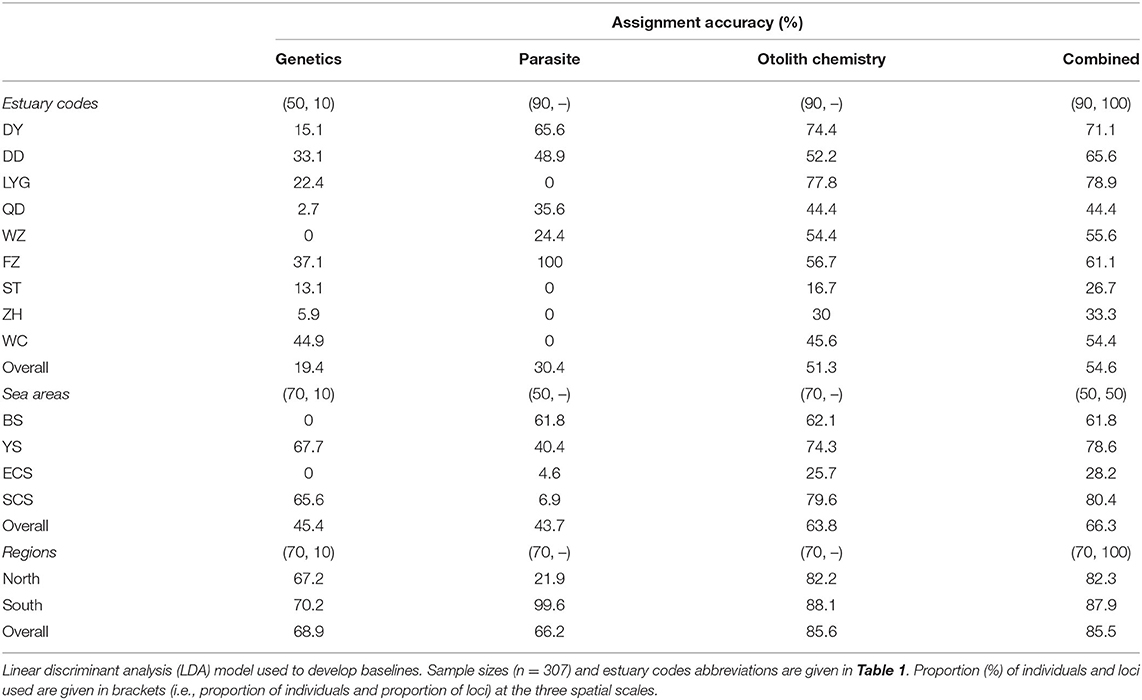
Table 3. Assignment accuracy baselines developed for spinyhead croaker C. lucidus from Chinese coastal waters based on genetics, parasites, otolith chemistry, and the three datasets combined at the three spatial scales.
The application of microsatellite markers, parasites, and otolith chemistry allowed the identification of possible natal origins and the population structure of this species along the coast of China. Microsatellite markers revealed gene flow over evolutionary time scales and, therefore, act at broad spatial/temporal resolutions (Antoniou and Magoulas, 2014; Mariani and Bekkevold, 2014). In addition, parasites and otolith nucleus chemistry generally provide information on finer spatial and temporal scales (MacKenzie and Abaunza, 2014; Tanner et al., 2016). In this instance, northern and southern China stocks of C. lucidus in nearshore Chinese waters were distinguished based on the three natural tags, which differed significantly among geographical regions (North and South) over the full geographical range of this study.
Marine fishes generally show weak genetic differentiation over close geographical regions because of an absence of physical barriers (Palumbi, 1994; Grant and Bowen, 1998; Liu et al., 2006). Mechanisms underlying the spatial structures of marine fishes include (i) biophysical process involved in patterns of egg and larval dispersal (Cowen and Sponaugle, 2009; Kerr et al., 2017), and (ii) post-larval movements (i.e., by juveniles and adults) related to natal homing, straying behavior, and/or migration strategies (Cadrin and Secor, 2009). Measures of the population structure indicated two genetically differentiated groups according to population differentiation (FST) and the STRUCTURE, UPGMA, and PCoA analyses, as suggested by previous studies using mitochondrial DNA and nuclear markers (Zheng et al., 2011; Zhang et al., 2021). A similar pattern of differentiation between northern and southern Chinese regions has been found in other species in the area, such as Lateolabrax maculatus (Liu et al., 2006), Mugil cephalus (Liu et al., 2009), and Scomber japonicus (Cheng et al., 2015). As an estuary-dependent fish, the C. lucidus lives in brackish waters (Liu et al., 2015) without migration behaviors reported, and fish sampled in a short period in this study. Therefore, the dispersal of C. lucidus may occur through its pelagic eggs and larvae, which would act as the main driver of population structure and connectivity. The Guangdong and the Zhejiang–Fujian coastal currents could facilitate the larval dispersion of species within the southern China coastal region, while the Yellow Sea and Bohai Sea coastal currents might facilitate its larval dispersion within the northern China coastal region (Figure 1). The Yangtze diluted water plume is a huge mass of discharged freshwater that might represent a virtually insurmountable barrier to the dispersion of C. lucidus larvae between the northern and southern China geographical regions (Figure 1) (Chen et al., 1991).
Marine environments are considered as open habitats where isolation by distance is the main mechanism that could promote genetic differentiation (Palumbi, 1994). The Mantel test results exposed a strong pattern of isolation by distance in C. lucidus, which implies that geographical obstruction restricts gene flow between different estuaries. Simulations of one-dimensional stepping-stone populations with larval dispersal regimes show that isolation by distance is most obvious when comparing populations separated by 2–5 times the mean larval dispersal distance (Palumbi, 2003). For C. lucidus, the geographical distance and environmental features (coastal currents) might be the principal factors in structuring northern and southern China populations, while the biophysical attributes of fish behavior (e.g., spawning-site fidelity) and habitat requirements across the life cycle of species might promote retention among regions (Liu et al., 2015; Kerr et al., 2017).
The dominant taxa found among the parasites harbored by the C. lucidus sampled from nine estuaries were larval nematodes, which have been recommended as biological tags (MacKenzie and Abaunza, 2014). As far as we know, this is the first quantitative study on the parasite fauna in C. lucidus, extending the list of parasites for this host by 12 taxa. However, the total parasite infection rate was relatively low, which might be attributed to the small body size of the host (Poulin, 2000). Those long-lived parasite taxa with a high infection level, namely, the nematodes H. sinense and Raphidascaris sp. 1, appear to be useful biological tags for stock discrimination in C. lucidus.
The temporary monogenean Mazocraeoides dussumieri was previously reported from the host sardine Dussumieria spp. in the South China Sea and Indian Ocean (Sailaja et al., 2019); M. dussumieri might be transported by the type-host Dussumieria spp., which are widely distributed in the Indo-West Pacific region. Curiously, in this study, this parasite species was not sampled from C. lucidus in estuaries linked to the South China Sea and the East China Sea, although further study (with more extensive collections including different seasons) is needed to confirm this finding. In general, monogenean ectoparasites, which are in direct contact with water and display a direct lifecycle, are highly sensitive to changes in environmental conditions, such as salinity (Brazenor and Hutson, 2015). The Chinese estuaries inhabited by C. lucidus have likely suffered great changes in salinity, which might be accounted for the loss of ectoparasites for samples from the East China Sea and the South China Sea.
The elemental signatures recorded in the otolith nucleus of C. lucidus showed significant regional variation. It is known that the chemical composition of fish otoliths is influenced by extrinsic and intrinsic factors, as they are associated with the physicochemical properties of the aquatic environment (e.g., water chemistry, salinity, and temperature) and/or the fish biology (e.g., ontogeny, maturation, and feeding/growth), and genetics and evolutionary history (Thomas and Swearer, 2019; Hüssy et al., 2020). Four element ratios were mostly contributed to group separation between northern and southern China stocks, namely, Na:Ca, Mg:Ca, Sr:Ca, and Ba:Ca (Figure 3B).
The deposition of Na is highly regulated by physiology, including growth and reproduction (Grammer et al., 2017). Otolith Na:Ca ratios slightly ascended from the northern to southern estuaries, perhaps as an effect of temperature, which is an important ecological driver modulating life-history traits of fish (Hasnain et al., 2013). The ratio of Mg:Ca is neither influenced by the ambient concentrations of these elements nor influenced by salinity, yet it is higher in warm water temperatures (Stanley et al., 2015); in fact, in this study, this trend was observed as Mg:Ca ratios were relatively higher in the southern estuaries. No clear patterns were observed for the ratios Sr:Ca and Ba:Ca among the different locations; however, these ratios were markedly positively influenced by the water mass, which is the main source of Sr and Ba elements in the otoliths (Webb et al., 2012; Doubleday et al., 2013). The ratio of Sr:Ca is the most widely used elemental marker applied in otolith microchemistry studies, such as population discrimination and habitat reconstruction (Sturrock et al., 2015). The incorporation of Sr in otoliths shows a positive relationship with temperature and salinity (Secor and Rooker, 2000). The highest Sr:Ca ratio in C. lucidus was found in LYG, which may be due to relatively higher salinities because of less freshwater flow. The ratio of Ba:Ca changes across salinity gradients and maybe the proxy of choice for identifying the movement of fish into low-salinity waters (Walther and Nims, 2015). In this study, the ratio of Ba:Ca was much higher in estuary-dependent C. lucidus than those in Scomberomorus niphonius, which spends most of its lifetime in marine (Liu et al., 2015; Pan et al., 2020). This could be partially explained as a consequence of rivers that flow to the coast, as the element Ba has higher concentrations in freshwater (Secor et al., 2001). The ratios K:Ca and Mn:Ca found in the otoliths of C. lucidus differed significantly among the sampled estuaries, whereas the ratios P:Ca and Fe:Ca did not. These four elemental ratios showed low discrimination ability, with little value for stock identification in C. lucidus. However, the ratios Fe:Ca and Mn:Ca have been used as elemental fingerprints in other studies of stock differentiation in fishes (Elsdon et al., 2008; Sturrock et al., 2012).
The mechanism behind the incorporation of elements into fish otoliths is a complex process that remains poorly understood (Campana, 1999; Thomas and Swearer, 2019; Hüssy et al., 2020). However, the results of multi-elemental fingerprints analyses showed a clear separation between the northern and southern China coastal regions, whereas the otoliths of C. lucidus from the South China Sea exhibited an overlap in their chemical signatures, suggesting a subtropical region with minor latitudinal differences.
Fish stock research study frequently uses a combination of genetic markers and non-genetic methods to reveal unique phenomena (Selkoe et al., 2008). The combined use of microsatellites, parasites, and otolith nucleus chemistry showed overall high assignment accuracy (55–86%) at the three spatial scales; therefore, this integrative approach represents a promising tool for stock identification of C. lucidus. The observed classification accuracy to sampling locations was similar to other stock identifications that used multidisciplinary approaches, such as for Merluccius merluccius (86–99%, Tanner et al., 2014) and Scomber scombrus (68–100%, Moura et al., 2020). Baselines using otolith nucleus chemistry and the combined natural tag datasets resulted in similar assignment accuracy at the three spatial scales, though this might have been influenced by the lower classification accuracy of the genetics data and parasite data. The existence of null alleles may bias parametric population inferences, but which have a slight influence on the accuracy of assigning individuals to populations (Carlsson, 2008). In addition, the low variance of microsatellite markers might be accounted for the low discrimination ability in C. lucidus for microsatellite tags. The parasite assemblages exhibited low discriminatory power in C. lucidus, perhaps due to the low rate of parasite infection and also because of the small body size of the sampled specimens (7–17 cm BL). The host size is an important determinant of parasite community structure in fish, with increases in both parasite abundance and species richness in larger hosts being a common feature of fish–parasite systems (Poulin, 2000), as observed in this study.
This study improves the knowledge of a marine species for which there is little information on the population structure. We can deduce that C. lucidus in the coastal waters of China exists as northern and southern China populations, providing a new perspective on C. lucidus fishery stock conservation and management. The integrated approach showed slightly improved discrimination ability than only using otolith microchemistry, which may be affected by the low discrimination ability of genetics and parasite tags. To investigate the fine-scale population structure, natal origins, and habitat connectivity of this species, future studies might utilize high-resolution genetic markers (such as through next-generation sequencing), other phenotypic techniques (e.g., morphological analyses), and complimentary microchemistry approaches (such as whole otolith elemental and stable isotopic signatures). The ultimate goal of various methods applied for stock identification would be to find a biologically based definition of population structure to provide adequate information as needed for stock assessment and fishery management.
The original contributions presented in the study are included in the article and supplementary material, further inquiries can be directed to the corresponding author.
Ethical review and approval was not required for the animal study because all the fish samples were collected by commercial fishing and no specific licenses for the studied populations were needed.
SZ: conceptualization, investigation, methodology, data curation, formal analysis, and writing—original draft. ML, JZ, SX, and ZC: writing—review and editing. SZ, SX, and ZC: funding acquisition. ZC: supervision. All authors contributed to the article and approved the submitted version.
This study was supported by the National Key Research and Development Program of China (2018YFD0900902), the Key Special Project for Introduced Talents Team of Southern Marine Science and Engineering Guangdong Laboratory (GML2019ZD0605), and the Central Public-Interest Scientific Institution Basal Research Fund South China Sea Fisheries Research Institute CAFS (2019TS26 and 2020TD05).
The authors declare that the research was conducted in the absence of any commercial or financial relationships that could be construed as a potential conflict of interest.
All claims expressed in this article are solely those of the authors and do not necessarily represent those of their affiliated organizations, or those of the publisher, the editors and the reviewers. Any product that may be evaluated in this article, or claim that may be made by its manufacturer, is not guaranteed or endorsed by the publisher.
We thank Hongli Jiang for the microsatellite experiment and data acquisition, Dr. Binbin Shan (SCSFRI) for microsatellite data analysis, Prof. Tingbao Yang (SYSU) for providing documents on helminths, Yan'e Jiang (SCSFRI) for assistance on otolith section, Yang Xiao for the LA-ICP-MS experiment and data acquisition, and Shuai He (SYSU) for software R. Cynthia Kulongowski (MSc), with the Edanz Group (www.liwenbianji.cn/ac), edited a draft of this manuscript. We thank the reviewers for their valuable comments on an early draft of this manuscript.
The Supplementary Material for this article can be found online at: https://www.frontiersin.org/articles/10.3389/fmars.2021.693954/full#supplementary-material
Abaunza, P., Murta, A. G., Campbell, N., Cimmaruta, R., Comesana, A. S., Dahle, G., et al. (2008). Stock identity of horse mackerel (Trachurus trachurus) in the Northeast Atlantic and Mediterranean Sea: integrating the results from different stock identification approaches. Fish. Res. 89, 196–209. doi: 10.1016/j.fishres.2007.09.022
Anderson, M. J., Gorley, R. N., and Clarke, K. R. (2008). PERMANOVA+ for PRIMER: Guide to Software and Statistical Methods. Plymouth, UK: PRIMER-E.
Antoniou, A., and Magoulas, A. (2014). “Application of mitochondrial DNA in stock identification,” in Stock Identification Methods: Applications in Fishery Science, 2nd Edn., eds S. X. Cadrin, L. A. Kerr, and S. Mariani (Amsterdam: Elsevier Academic Press), 257–295. doi: 10.1016/B978-0-12-397003-9.00013-8
Ashford, J. R., Arkhipkin, A. I., and Jones, C. M. (2006). Can the chemistry of otolith nuclei determine population structure of Patagonian toothfish Dissostichus eleginoides? J. Fish Biol. 69, 708–721. doi: 10.1111/j.1095-8649.2006.01144.x
Begg, G. A., and Waldman, J. R. (1999). An holistic approach to fish stock identification. Fish. Res. 43, 35–44. doi: 10.1016/S0165-7836(99)00065-X
Botstein, D., White, R. L., Skolnick, M., and Davis, R. W. (1980). Construction of a genetic linkage map in man using restriction fragment length polymorphisms. Am. J. Hum. Genet. 32, 314–331.
Brazenor, A. K., and Hutson, K. S. (2015). Effects of temperature and salinity on the life cycle of Neobenedenia sp. (Monogenea: Capsalidae) infecting farmed Barramundi (Lates calcarifer). Parasitol. Res. 114, 1875–1886. doi: 10.1007/s00436-015-4375-5
Bush, A. O., Lafferty, K. D., Lotz, J. M., and Shostak, A. W. (1997). Parasitology meets ecology on its own terms: Margolis et al. revisited. J. Parasitol. 83, 575–583. doi: 10.2307/3284227
Cadrin, S. X. (2020). Defining spatial structure for fishery stock assessment. Fish. Res. 221:105397. doi: 10.1016/j.fishres.2019.105397
Cadrin, S. X., Karr, L. A., and Mariani, S. (2014). “Stock identification methods: an overview,” in Stock Identification Methods: Applications in Fishery Science, 2nd Edn, eds S. X. Cadrin, L. A. Kerr, and S. Mariani (Amsterdam: Elsevier Academic Press), 1–5. doi: 10.1016/B978-0-12-397003-9.00001-1
Cadrin, S. X., and Secor, D. H. (2009). “Accounting for spatial population structure in stock assessment: past, present, and future,” in The Future of Fisheries Science in North America, Fish and Fisheries Series, Vol. 31, eds R. J. Beamish and B. J. Rothschild (Dordrecht: Springer), 405–426.
Campana, S. (1999). Chemistry and composition of fish otoliths: pathways, mechanisms and applications. Mar. Ecol. Prog. Ser. 188, 263–297. doi: 10.3354/meps188263
Campana, S. E., and Thorrold, S. R. (2001). Otoliths, increments, and elements: keys to a comprehensive understanding of fish populations? Can. J. Fish. Aquat. Sci. 58, 30–38. doi: 10.1139/f00-177
Canel, D., Levy, E., Soares, I. A., Braicovich, P. E., Haimovici, M., Luque, J. L., et al. (2019). Stocks and migrations of the demersal fish Umbrina canosai (Sciaenidae) endemic from the subtropical and temperate Southwestern Atlantic revealed by its parasites. Fish. Res. 214, 10–18. doi: 10.1016/j.fishres.2019.02.001
Carlsson, J. (2008). Effects of microsatellite null alleles on assignment testing. J. Hered. 99, 616–623. doi: 10.1093/jhered/esn048
Chen, G. X., Gu, X. G., and Gao, H. R. (1991). Marine Fishery Environment in China. Hangzhou: Zhejiang Scientific and Technology Press (in Chinese), 63–96.
Chen, K. Y., Marschall, E. A., Sovic, M. G., Fries, A. C., Gibbs, H. L., and Ludsin, S. A. (2018). assignPOP: an R package for population assignment using genetic, non-genetic, or integrated data in a machine-learning framework. Methods Ecol. Evol. 9, 439–446. doi: 10.1111/2041-210X.12897
Cheng, J., Yanagimoto, T., Song, N., and Gao, T. X. (2015). Population genetic structure of chub mackerel Scomber japonicus in the Northwestern Pacific inferred from microsatellite analysis. Mol. Biol. Rep. 42, 373–382. doi: 10.1007/s11033-014-3777-2
Cowen, R. K., and Sponaugle, S. (2009). Larval dispersal and marine population connectivity. Annu. Rev. Mar. Sci. 1, 443–466. doi: 10.1146/annurev.marine.010908.163757
Doubleday, Z. A., Izzo, C., Woodcock, S. H., and Gillanders, B. M. (2013). Relative contribution of water and diet to otolith chemistry in freshwater fish. Aquat. Biol. 18, 271–280. doi: 10.3354/ab00511
Earl, D. A., and Vonholdt, B. M. (2012). STRUCTURE HARVESTER: a website and program for visualizing STRUCTURE output and implementing the Evanno method. Conserv. Genet. Resour. 4, 359–361. doi: 10.1007/s12686-011-9548-7
Elsdon, T. S., Wells, B. K., Campana, S. E., Gillanders, B. M., Jones, C. M., Limburg, K. E., et al. (2008). “Otolith chemistry to describe movements and life-history parameters of fishes: hypotheses, assumptions, limitations and inferences,” in Oceanography and Marine Biology, eds R. N. Gibson, R. J. A. Atkinson, and J. D. M. Gordon, Vol. 46 (Boca Raton, FL: CRC Press), 297–330. doi: 10.1201/9781420065756.ch7
Evanno, G., Regnaut, S., and Goudet, J. (2005). Detecting the number of clusters of individuals using the software STRUCTURE: a simulation study. Mol. Ecol. 14, 2611–2620. doi: 10.1111/j.1365-294X.2005.02553.x
Excoffier, L., and Lischer, H. E. (2010). Arlequin suite ver 3.5: a new series of programs to perform population genetics analyses under Linux and Windows. Mol. Ecol. Resour. 10, 564–567. doi: 10.1111/j.1755-0998.2010.02847.x
Glaubitz, J. C. (2004). convert: a user-friendly program to reformat diploid genotypic data for commonly used population genetic software packages. Mol. Ecol. Notes. 4, 309–310. doi: 10.1111/j.1471-8286.2004.00597.x
Goudet, J. (1995). FSTAT (Version 1.2): a computer program to calculate F-statistics. J. Hered. 86, 485–486. doi: 10.1093/oxfordjournals.jhered.a111627
Grammer, G., Morrongiello, J., Izzo, C., Hawthorne, P., Middleton, J., and Gillanders, B. (2017). Coupling biogeochemical tracers with fish growth reveals physiological and environmental controls on otolith chemistry. Ecol. Monogr. 87, 487–507. doi: 10.1002/ecm.1264
Grant, W. A. S., and Bowen, B. W. (1998). Shallow population histories in deep evolutionary lineages of marine fishes: insights from sardines and anchovies and lessons for conservation. J. Hered. 89, 415–426. doi: 10.1093/jhered/89.5.415
Hasnain, S. S., Shuter, B. J., and Minns, C. K. (2013). Phylogeny influences the relationships linking key ecological thermal metrics for North American freshwater fish species. Can. J. Fish. Aquat. Sci. 70, 964–972. doi: 10.1139/cjfas-2012-0217
Higgins, R. M., Danilowicz, B. S., Balbuena, J. A., Danielsdottir, A. K., Geffen, A. J., Meijer, W. G., et al. (2010). Multi-disciplinary fingerprints reveal the harvest location of cod Gadus morhua in the northeast Atlantic. Mar. Ecol. Prog. Ser. 404, 197–206. doi: 10.3354/meps08492
Hu, Y., Zhang, T., Yang, G., Zhao, F., Hou, J. l., et al. (2015). Assessment of resource situation of Collichthys lucidus in coastal waters of the Yangtze estuary. Ying Yong Sheng Tai Xue Bao. 26, 2867–2873 (In Chinese with English abstract). doi: 10.13287/j.1001-9332.20150630.026
Huang, L., Li, J., Xie, Y., and Zhang, Y. (2010). Study of the Collichthys lucidus fisheries resources of the Minjiang Estuary and its adjacent waters. J. Oceanogr. Taiwan Strait. 29, 250–256 (In Chinese with English abstract). doi: 10.3969/J.ISSN.1000-8160.2010.02.015
Hüssy, K., Limburg, K. E., de Pontual, H., Thomas, O. R. B., Cook, P. K., Heimbrand, Y., et al. (2020). Trace element patterns in otoliths: the role of biomineralization. Rev. Fish. Sci. Aquacult. 2020, 1–33. doi: 10.1080/23308249.2020.1760204
Jovelin, R., and Justine, J. L. (2001). Phylogenetic relationships within the polyopisthocotylean monogeneans (Platyhelminthes) inferred from partial 28S rDNA sequences. Int. J. Parasitol. 31, 393–401. doi: 10.1016/S0020-7519(01)00114-X
Kalinowski, S. T., Taper, M. L., and Marshall, T. C. (2007). Revising how the computer program CERVUS accommodates genotyping error increases success in paternity assignment. Mol. Ecol. 16, 1099–1106. doi: 10.1111/j.1365-294X.2007.03089.x
Kasapidis, P., and Magoulas, A. (2008). Development and application of microsatellite markers to address the population structure of the horse mackerel Trachurus trachurus. Fish. Res. 89, 132–135. doi: 10.1016/j.fishres.2007.09.015
Kerr, L. A., Hintzen, N. T., Cadrin, S. X., Clausen, L. W., Dickey-Collas, M., Goethel, D. R., et al. (2017). Lessons learned from practical approaches to reconcile mismatches between biological population structure and stock units of marine fish. ICES J. Mar. Sci. 74, 1708–1722. doi: 10.1093/icesjms/fsw188
Kong, Q., Fan, L., Zhang, J., Akao, N., Dong, K., Lou, D., et al. (2015). Molecular identification of Anisakis and Hysterothylacium larvae in marine fishes from the East China Sea and the Pacific coast of central Japan. Int. J. Food Microbiol. 199, 1–7. doi: 10.1016/j.ijfoodmicro.2015.01.007
Levy, E., Canel, D., Rossin, M. A., Hernández-Orts, J. S., González-Castro, M., and Timi, J. T. (2019). Parasites as indicators of fish population structure at two different geographical scales in contrasting coastal environments of the south-western Atlantic. Estuar. Coast. Shelf Sci. 229, 1–9. doi: 10.1016/j.ecss.2019.106400
Li, L., Wayland, M. T., Chen, H.-X., and Yang, Y. (2018). Remarkable morphological variation in the proboscis of Neorhadinorhynchus nudus (Harada, 1938) (Acanthocephala: Echinorhynchida). Parasitology 146, 348–355. doi: 10.1017/S003118201800166X
Liang, S., Song, W., Zhao, M., Chen, W., Li, Y., and Ma, L. (2018). Morphology of seven Collichthys lucidus populations near the coast of the Yellow Sea and East China Sea. J. Fish. Sci. China. 25, 576–585 (In Chinese with English abstract). doi: 10.3724/SP.J.1118.2018.17306
Lin, N., Su, Y., Ding, S., and Wang, J. (2011). Genetic diversity assessed using microsatellite DNA of spiny head croaker (Collichthys lucidus) from the Zhoushan offshore waters. J. Oceanogr. Taiwan Strait. 30, 229–233 (In Chinese with English abstract). doi: 10.3969/J.ISSN.1000-8160.2011.02.012
Liu, H., Jiang, T., Huang, H., Shen, X., Zhu, J., and Yang, J. (2015). Estuarine dependency in Collichthys lucidus of the Yangtze River Estuary as revealed by the environmental signature of otolith strontium and calcium. Environ. Biol. Fishes. 98, 165–172. doi: 10.1007/s10641-014-0246-7
Liu, J. X., Gao, T. X., Yokogawa, K., and Zhang, Y. P. (2006). Differential population structuring and demographic history of two closely related fish species, Japanese sea bass (Lateolabrax japonicus) and spotted sea bass (Lateolabrax maculatus) in Northwestern Pacific. Mol. Phylogen. Evol. 39, 799–811. doi: 10.1016/j.ympev.2006.01.009
Liu, J. Y., Brown, C. L., and Yang, T. B. (2009). Population genetic structure and historical demography of grey mullet, Mugil cephalus, along the coast of China, inferred by analysis of the mitochondrial control region. Biochem. Syst. Ecol. 37, 556–566. doi: 10.1016/j.bse.2009.09.002
Ma, C., Ma, H., Ma, L., Cui, H., and Ma, Q. (2011). Development and characterization of 19 microsatellite markers for Collichthys lucidus. Conserv. Genet. Resour. 3, 503–506. doi: 10.1007/s12686-011-9389-4
MacKenzie, K., and Abaunza, P. (2014). “Parasites as biological tags,” in Stock Identification Methods: Applications in Fishery Science, 2nd Edn.m eds S. X. Cadrin, L. A. Kerr, and S. Mariani (Amsterdam: Elsevier Academic Press), 185–203. doi: 10.1016/B978-0-12-397003-9.00010-2
Mariani, S., and Bekkevold, D. (2014). “The nuclear genome,” in Stock Identification Methods: Applications in Fishery Science, 2nd Edn., eds S. X. Cadrin, L. A. Kerr, and S. Mariani (Amsterdam: Elsevier Academic Press), 297–327. doi: 10.1016/B978-0-12-397003-9.00014-X
Moreira, C., Presa, P., Correia, A. T., Vaz-Pires, P., and Froufe, E. (2020). Spatio-temporal microsatellite data suggest a multidirectional connectivity pattern in the Trachurus picturatus metapopulation from the Northeast Atlantic. Fish. Res. 225:105499. doi: 10.1016/j.fishres.2020.105499
Moura, A., Muniz, A. A., Mullis, E., Wilson, J. M., Vieira, R. P., Almeida, A. A., et al. (2020). Population structure and dynamics of the Atlantic mackerel (Scomber scombrus) in the North Atlantic inferred from otolith chemical and shape signatures. Fish. Res. 230:105621. doi: 10.1016/j.fishres.2020.105621
Nguyen Van, Q., Sasaki, K., Hoshino, K., Sakai, T., Yang, C.-H., Chen, M.-H., et al. (2020). Collichthys lucidus. The IUCN Red List of Threatened Species 2020:e.T49171768A49225265. doi: 10.2305/IUCN.UK.2020-1.RLTS.T49171768A49225265.en
Palumbi, S. R. (1994). Genetic divergence, reproductive isolation, and marine speciation. Annu. Rev. Ecol. Syst. 25, 547–572. doi: 10.1146/annurev.es.25.110194.002555
Palumbi, S. R. (2003). Population genetics, demographic connectivity, and the design of marine reserves. Ecol. Appl. 13, S146–S158. doi: 10.1890/1051-0761(2003)0130146:PGDCAT2.0.CO
Pan, X., Ye, Z., Xu, B., Jiang, T., Yang, J., and Tian, Y. (2020). Population connectivity in a highly migratory fish, Japanese Spanish mackerel (Scomberomorus niphonius), along the Chinese coast, implications from otolith chemistry. Fish. Res. 231:105690. doi: 10.1016/j.fishres.2020.105690
Peakall, R., and Smouse, P. E. (2012). GenAlEx 6.5: genetic analysis in Excel. Population genetic software for teaching and research-an update. Bioinformatics. 28, 2537–2539. doi: 10.1093/bioinformatics/bts460
Pita, A., Casey, J., Hawkins, S. J., Villarreal, M. R., Gutierrez, M. J., Cabral, H., et al. (2016). Conceptual and practical advances in fish stock delineation. Fish. Res. 173, 185–193. doi: 10.1016/j.fishres.2015.10.029
Poulin, R. (2000). Variation in the intraspecific relationship between fish length and intensity of parasitic infection: biological and statistical causes. J. Fish Biol. 56, 123–137. doi: 10.1111/j.1095-8649.2000.tb02090.x
Pritchard, J. K., Stephens, M., and Donnelly, P. (2000). Inference of population structure using multilocus genotype data. Genetics 155, 945–959. doi: 10.1093/genetics/155.2.945
R Core Team (2021). R: A Language and Environment for Statistical Computing. R Foundation for Statistical Computing, Vienna, Austria. Available online at: https://www.R-project.org/ (accessed April 07, 2021).
Raymond, M., and Rousset, F. (1995). GENEPOP (Version 1.2): population genetics software for exact tests and ecumenicism. J. Hered. 86, 248–249. doi: 10.1093/oxfordjournals.jhered.a111573
Reiss, H., Hoarau, G., Dickey-Collas, M., and Wolff, W. J. (2009). Genetic population structure of marine fish: mismatch between biological and fisheries management units. Fish Fish. 10, 361–395. doi: 10.1111/j.1467-2979.2008.00324.x
Sailaja, B., Shameem, U., and Madhavi, R. (2019). Four species of Mazocraeoides Price, 1936 (Monogenea: Mazocraeidae), including two new species from clupeiform fishes off Visakhapatnam coast, Bay of Bengal. Zootaxa 4608, 233–246. doi: 10.11646/zootaxa.4608.2.2
Secor, D. H. (2014). “The unit stock concept,” in Stock Identification Methods: Applications in Fishery Science, 2nd Edn, S. X. Cadrin, L. A. Kerr, and S. Mariani (Amsterdam: Elsevier Academic Press), 7–28. doi: 10.1016/B978-0-12-397003-9.00002-3
Secor, D. H., and Rooker, J. R. (2000). Is otolith strontium a useful scalar of life cycles in estuarine fishes? Fish. Res. 46, 359–371. doi: 10.1016/S0165-7836(00)00159-4
Secor, D. H., Rooker, J. R., Zlokovitz, E., and Zdanowicz, V. S. (2001). Identification of riverine, estuarine, and coastal contingents of Hudson River striped bass based upon otolith elemental fingerprints. Mar. Ecol. Prog. Ser. 211, 245–253. doi: 10.3354/meps211245
Selkoe, K. A., Henzler, C. M., and Gaines, S. D. (2008). Seascape genetics and the spatial ecology of marine populations. Fish Fish. 9, 363–377. doi: 10.1111/j.1467-2979.2008.00300.x
Shen, J. W., and Qiu, Z. Z. (1995). Studies on the Trematodes of Fishes from the Yellow Sea and the Bo Hai Sea. Beijing: Science Press (in Chinese).
Slatkin, M. (1987). Gene flow and the geographic structure of natural populations. Science 236, 787–792. doi: 10.1126/science.3576198
Song, N., Yin, L. N., Sun, D. R., Zhao, L. L., and Gao, T. X. (2019). Fine-scale population structure of Collichtys lucidus populations inferred from microsatellite markers. J. Appl. Ichthyol. 35, 709–718. doi: 10.1111/jai.13902
Stanley, R. R. E., Bradbury, I. R., DiBacco, C., Snelgrove, P. V. R., Thorrold, S. R., and Killen, S. S. (2015). Environmentally mediated trends in otolith composition of juvenile Atlantic cod (Gadus morhua). ICES J. Mar. Sci. 72, 2350–2363. doi: 10.1093/icesjms/fsv070
Sturrock, A. M., Hunter, E., Milton, J. A., Johnson, R. C., Waring, C. P., Trueman, C. N., et al. (2015). Quantifying physiological influences on otolith microchemistry. Methods Ecol. Evol. 6, 806–816. doi: 10.1111/2041-210X.12381
Sturrock, A. M., Trueman, C. N., Darnaude, A. M., and Hunter, E. (2012). Can otolith elemental chemistry retrospectively track migrations in fully marine fishes? J. Fish Biol. 81, 766–795. doi: 10.1111/j.1095-8649.2012.03372.x
Sun, D. Q., Zhang, B. O., Xu, T. J., and Wang, R. X. (2013). Fourteen polymorphic microsatellite markers isolated from big-head croaker (Collichthys lucidus). J. Genet. 92, 79–81. doi: 10.1007/s12041-011-0095-5
Tanner, S. E., Pérez, M., Presa, P., Thorrold, S. R., and Cabral, H. N. (2014). Integrating microsatellite DNA markers and otolith geochemistry to assess population structure of European hake (Merluccius merluccius). Estuar. Coast. Shelf Sci. 142, 68–75. doi: 10.1016/j.ecss.2014.03.010
Tanner, S. E., Reis-Santos, P., and Cabral, H. N. (2016). Otolith chemistry in stock delineation: a brief overview, current challenges and future prospects. Fish. Res. 173, 206–213. doi: 10.1016/j.fishres.2015.07.019
Thomas, O. R. B., and Swearer, S. E. (2019). Otolith biochemistry-a review. Rev. Fish. Sci. Aquacult. 27, 458–489. doi: 10.1080/23308249.2019.1627285
van Oosterhout, C., Hutchinson, W. F., Wills, D. P. M., and Shipley, P. (2004). MICRO-CHECKER: software for identifying and correcting genotyping errors in microsatellite data. Mol. Ecol. Notes 4, 535–538. doi: 10.1111/j.1471-8286.2004.00684.x
Waldman, J. R. (2005). “Definition of stocks: an evolving concept,” in Stock Identification Methods. Applications in Fishery Science, eds S. X. Cadrin, K. D. Friedland, and J. R. Waldman (Amsterdam: Elsevier), 7–16. doi: 10.1016/B978-012154351-8/50003-4
Walther, B. D., and Nims, M. K. (2015). Spatiotemporal variation of trace elements and stable isotopes in subtropical estuaries: I. Freshwater endmembers and mixing curves. Estuar. Coasts 38, 754–768. doi: 10.1007/s12237-014-9881-7
Wang, L., Lin, L., Li, Y., Xing, Y., and Kang, B. (2020). Sustainable exploitation of dominant fishes in the largest estuary in southeastern China. Water 12:3390. doi: 10.3390/w12123390
Webb, S. D., Woodcock, S. H., and Gillanders, B. M. (2012). Sources of otolith barium and strontium in estuarine fish and the influence of salinity and temperature. Mar. Ecol. Prog. Ser. 453, 189–199. doi: 10.3354/meps09653
Wu, C. W., and Wang, W. H. (1996). A study on individual fecundity of Collichthys lucidus. J. Zheji. Coll. Fish. 15, 174–178 (In Chinese with English abstract).
Wu, Z., and Chen, X. (1991). A preliminary study on the age and phasic growth of Collichthys lucidus. J. Zheji. Coll. Fish. 10, 140–143 (In Chinese with English abstract).
Zhang, J. Y., Qiu, Z. Z., and Ding, X. J. (1999). Parasites and Parasitic Disease of Fishes. Beijing: Science Press (in Chinese).
Zhang, S., Li, M., Yan, S., Kong, X. L., Zhu, J. F., Xu, S. N., et al. (2021). Population genetic structure of big head croaker Collichthys lucidus based on mitochondrial cytochrome b gene sequences. J. Fish. Sci. China 28, 90–99 (In Chinese with English abstract). doi: 10.3724/SP.J.1118.2020.20127
Keywords: fish population-units, microsatellite, parasite, otolith chemistry, population structure assessment, Collichthys lucidus
Citation: Zhang S, Li M, Zhu J, Xu S and Chen Z (2021) An Integrated Approach to Determine the Stock Structure of Spinyhead Croaker Collichthys lucidus (Sciaenidae) in Chinese Coastal Waters. Front. Mar. Sci. 8:693954. doi: 10.3389/fmars.2021.693954
Received: 12 April 2021; Accepted: 31 July 2021;
Published: 06 September 2021.
Edited by:
Satya Panigrahi, Indira Gandhi Centre for Atomic Research (IGCAR), IndiaReviewed by:
Patrícia Jesus Gonçalves, Portuguese Institute for Sea and Atmosphere (IPMA), PortugalCopyright © 2021 Zhang, Li, Zhu, Xu and Chen. This is an open-access article distributed under the terms of the Creative Commons Attribution License (CC BY). The use, distribution or reproduction in other forums is permitted, provided the original author(s) and the copyright owner(s) are credited and that the original publication in this journal is cited, in accordance with accepted academic practice. No use, distribution or reproduction is permitted which does not comply with these terms.
*Correspondence: Zuozhi Chen, Y2hlbnp1b3poaUBzY3NmcmkuYWMuY24=
Disclaimer: All claims expressed in this article are solely those of the authors and do not necessarily represent those of their affiliated organizations, or those of the publisher, the editors and the reviewers. Any product that may be evaluated in this article or claim that may be made by its manufacturer is not guaranteed or endorsed by the publisher.
Research integrity at Frontiers
Learn more about the work of our research integrity team to safeguard the quality of each article we publish.