 Mireille Escudero
 Borja G. Reguero
 Edgar Mendoza
 Fernando Secaira3
 Rodolfo Silva
94% of researchers rate our articles as excellent or good
Learn more about the work of our research integrity team to safeguard the quality of each article we publish.
Find out more
ORIGINAL RESEARCH article
Front. Mar. Sci., 20 September 2021
Sec. Coastal Ocean Processes
Volume 8 - 2021 | https://doi.org/10.3389/fmars.2021.684732
Coral reefs are increasingly recognized for their shoreline protection services. The hydrodynamic performance of this ecosystem is comparable to artificial low-crested structures often used in coastal protection, whose objective is to emulate the former. Coral reefs also provide other important environmental services (e.g., food production, habitat provision, maintenance of biodiversity and social and cultural services) and leave almost no ecological footprint when conservation and restoration actions are conducted to maintain their coastal protection service. However, studies have focused on their flood protection service, but few have evaluated the morphological effects of coral reefs through their ability to avoid or mitigate coastal erosion. In this paper, we investigate the relation between shoreline change, reefs’ geometry and hydrodynamic parameters to elucidate the physics related to how the Mesoamerican Reef in Mexico protects sandy coastlines from erosion. Using numerical wave propagation and historical shoreline change calculated from satellite imagery, a direct correlation was found between shoreline movement, the depths and widths of reef flats, changes in the wave energy flux, and the radiation stresses of breaking waves. The findings indicate that the most remarkable efficacy in preventing beach erosion is due to reefs with shallow crests, wide reef flats, a dissipative lagoon seabed, located at ∼300 m from the coastline. The results provide essential insights for reef restoration projects focused on erosion mitigation and designing artificial reefs in microtidal sandy beaches. Results are limited to wave-dominated coasts.
Over the last decade, scientific and engineering interest in determining how coastal ecosystems reduce the vulnerability of coastlines to erosion and flooding has increased. Along with other ecosystems, such as saltmarshes and mangroves, coral reefs offer considerable wave energy attenuation on tropical shorelines (Guannel et al., 2016; Narayan et al., 2016; Osorio-Cano et al., 2019; Reguero et al., 2019) which is estimated up to 97% (Ferrario et al., 2014; Pontee et al., 2018). Reef hydrodynamics have been found to be as efficient as those of artificial low-crested breakwaters in decreasing the wave energy that reaches the coast by breaking the waves and by frictional dissipation (Lowe et al., 2005; Monismith et al., 2015). This prevents flood damage and provide important risk reduction services to many reef-lined coasts (Beck et al., 2019; Reguero et al., 2019; Zhao et al., 2019).
Although coral reefs are one of the most effective ecosystems in coastal protection, they continue to undergo severe deterioration while conservation and management activities remain largely insufficient (Omori, 2011; Martínez et al., 2014). In the Caribbean alone, up to 50% of the hard coral cover on reefs has been lost in last three decades (Gardner et al., 2003). Globally, the decline of coral reefs has resulted in a growing international momentum to find suitable means to conserve, manage and restore coral reefs (Bellwood et al., 2004; Hughes et al., 2005). As biodiversity and ecosystem services continue to be lost on tropical coastlines, nature-based approaches are increasingly proposed as a solution to protect communities. These alternatives, focus on imitating the performance of natural ecosystems and their ecological functions, unlike more traditional coastal structures such as breakwaters (Cardenas-Rojas et al., 2021). In this context, reef-building species such as Acropora palmata are considered to provide fast and effective reef restoration, given their significant coral cover and the complex topography they provide (Bruckner et al., 2002; Alvarez-Filip et al., 2009).
Understanding the physical mechanisms by which reefs help reduce flooding and erosion is fundamental in advancing their use as a means of coastal protection, but as yet, reliable scientific information and quantitative assessments on this are still lacking (Aerts, 2018). A recent study (Reguero et al., 2019), quantified the benefits of flood risk reduction of the Mesoamerican Reef for Quintana Roo. They showed that in reduction of these benefits, reef degradation is greater than sea level rise. Valuating the risk reduction benefits that reefs provide allows these services to be integrated into policies and management plans, and this has been done in Mexico (Reguero et al., 2019), United States (Reguero et al., 2021), and many places all around the world (Beck et al., 2019). Research also suggests that the costs of conservation and repair of reefs is significantly cheaper than the costs involved in constructing breakwaters (Ferrario et al., 2014). By understanding better how reefs contribute to erosion control may also attract investment for the conservation and restoration of reefs in areas close to coastal communities.
Erosion is one of the most pressing concerns for coastal communities, but few studies have addressed the relationships between shoreline stability and reefs. In Mexico, Ruiz de Alegria-Arzaburu et al. (2013), compared energy dissipation and the volumetric sediment transport on a reef-fronted beach at Puerto Morelos and an exposed beach in Cancun, showing a considerably less dynamic beach in Puerto Morelos due to the presence of the reef. In Grenada, East Caribbean, Reguero et al. (2018), adapted a beach equilibrium planform model often applied in coastal engineering to reef environments, to make a preliminary link between coral reef degradation (assuming flat and deep reefs) and coastal erosion. Subsequently, using a shoreline planform shape model, Baldock et al. (2019) showed that the coastline in the lee of reefs is more susceptible to erosive processes due to sea level rise than the rest of the coastline.
Studying the role of reefs in shoreline protection is challenging because the nearshore hydrodynamics in fringing reef environments are governed by the interaction of the reef geometry (width, crest height, slope, and roughness) with the local marine climate. Consequently, the structural complexity of a coral reef plays an important role in shoreline protection (Monismith et al., 2015; Harris et al., 2018). Narrow reefs with steep forereef slopes (∼1:10 or steeper) and deeper smoother reef flats (less height for same depth) produce higher wave run-up on the beaches fronted by the reefs (Péquignet et al., 2011; Quataert et al., 2015). Therefore, flatter reefs with low structural complexity induce less wave energy dissipation, and thus provide less coastal protection (Alvarez-Filip et al., 2009; Rodríguez-Martínez et al., 2010; Carriquiry et al., 2013). In contrast, Pearson et al. (2017) found that the beach slope and the sea bottom roughness due to the presence or absence of corals were less important parameters to estimate water levels and rup-up on reef-lined coasts, whereas water depth over reef flats, reef flat widths and incident wave conditions resulted as essential factors. Yet, among the remaining gaps that need to be addressed is how different reef morphologies influence the erosion potential at the shoreline (Elliff and Silva, 2017; Reguero et al., 2018; Baldock et al., 2020).
In this paper, we provide new insights into the role of reefs in beach morphodynamics at local and regional scales using wave modeling and historic shoreline changes near the Mesoamerican Reef at Puerto Morelos, Mexico. The reef characteristics here differ, and the coast is exposed to a wide range of wave climate forcing conditions. The relations between coral reef geometry, shoreline position, and hydrodynamic parameters such as the wave energy flux and the radiation stresses are used here to explain the beach erosion protection offered by the barrier reef.
Puerto Morelos, an international tourism hub, lies on the Mexican Caribbean, ∼30 km south of Cancun (Figure 1A). Turquoise water, white sandy beaches, low-density hotel infrastructure and mangrove forests make Puerto Morelos an attractive location for tourists, who can also swim and snorkel around the nearby coral reef. The study area is the nearshore region behind the southern part of the Puerto Morelos Reef (green rectangle in Figures 1A,B), approximately 11.2 km of coastline. In this area (Figure 1C), the barrier reef is the only morphological element that modifies the hydrodynamics (there are no promontories or islands), and no other geomorphological features such as salients are found to interrupt longshore sediment transport. Hence, the coastline may be considered rectilinear. This area is therefore an excellent control site for investigating the physics by which different reef geometries protect the coast.
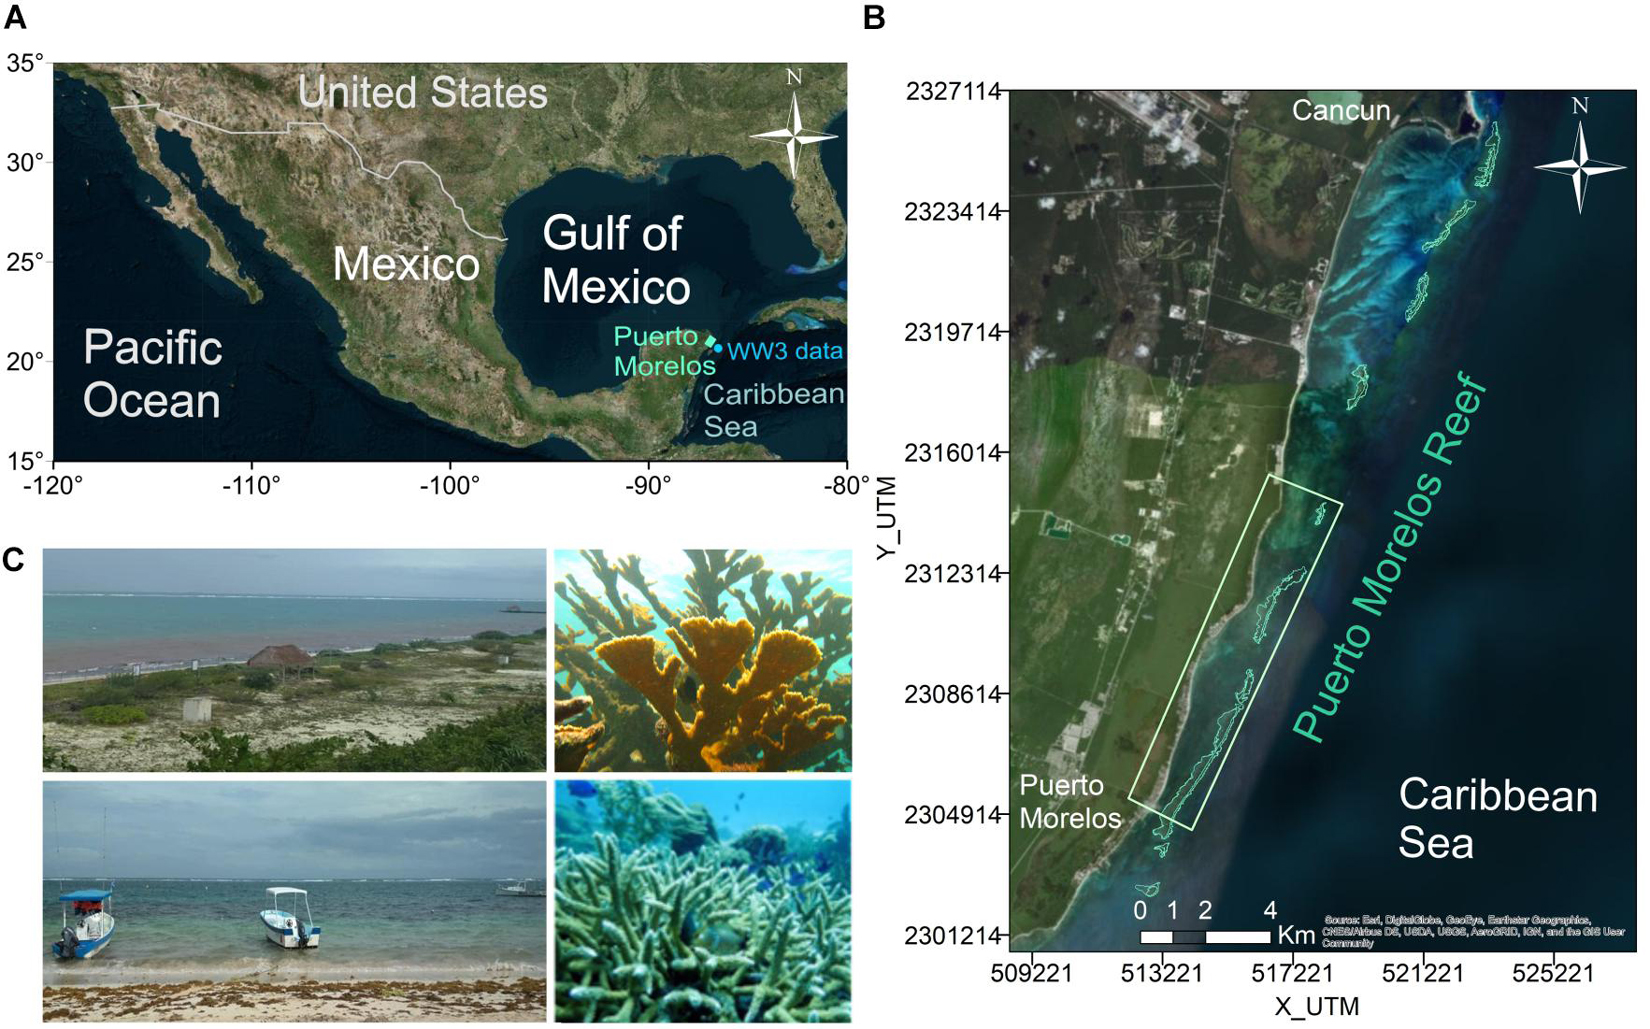
Figure 1. Study area: (A) General location. (B) Detail of the study area. (C) Coral species and beach views in Puerto Morelos.
The Puerto Morelos Reef is part of the Mesoamerican Reef System, the second longest barrier reef in the world, extending for over 1,000 km south of Cancun (Almada-Villela et al., 2002). The Puerto Morelos Reef was declared a Marine Protected Area in 1998 through a community-based marine conservation initiative to preserve the coral reef ecosystem (Rodríguez-Martínez, 2008). However, since that date there has been a loss or substitution of some essential species of the reef, such as the A. palmata colonies (Jordan et al., 1981; Rodríguez-Martínez et al., 2001; Alvarez-Filip et al., 2009; Rodríguez-Martínez et al., 2014). After Hurricane Roxanne (October 1995), a decrease in biodiversity was reported, and after the devastating Hurricane Wilma (October 2005), changes in the coral community were observed, with a complete burial of vegetation (Rodríguez-Martínez et al., 2010). Recently, Rosado-Torres et al. (2019) found links between degraded habitat, dominance of macroalgae (with values above 50%) and low reef roughness in the southeast patch of the Puerto Morelos Reef, due to the effects of local groundwater discharges. In addition, the massive sargassum arrivals, which now occur almost yearly, have become a serious threat to the coral reefs in Puerto Morelos due to the large amount of nutrients and organic matter it brings, altering the quality of the water (James et al., 2019; Chávez et al., 2020). High reef roughness has been related to healthy coral reef patches of stony corals and substratum (Rosado-Torres et al., 2019).
The Puerto Morelos Reef system is characterized by a low relief, a low forereef slope (∼1:50) and a relatively shallow reef lagoon (average depth 3–5 m) (Figures 2, 3). The seabed is composed predominantly of calcareous sand, with a mean grain of ∼0.30 mm, and seagrass meadows. The mean beach slope is of ∼0.05–0.09.
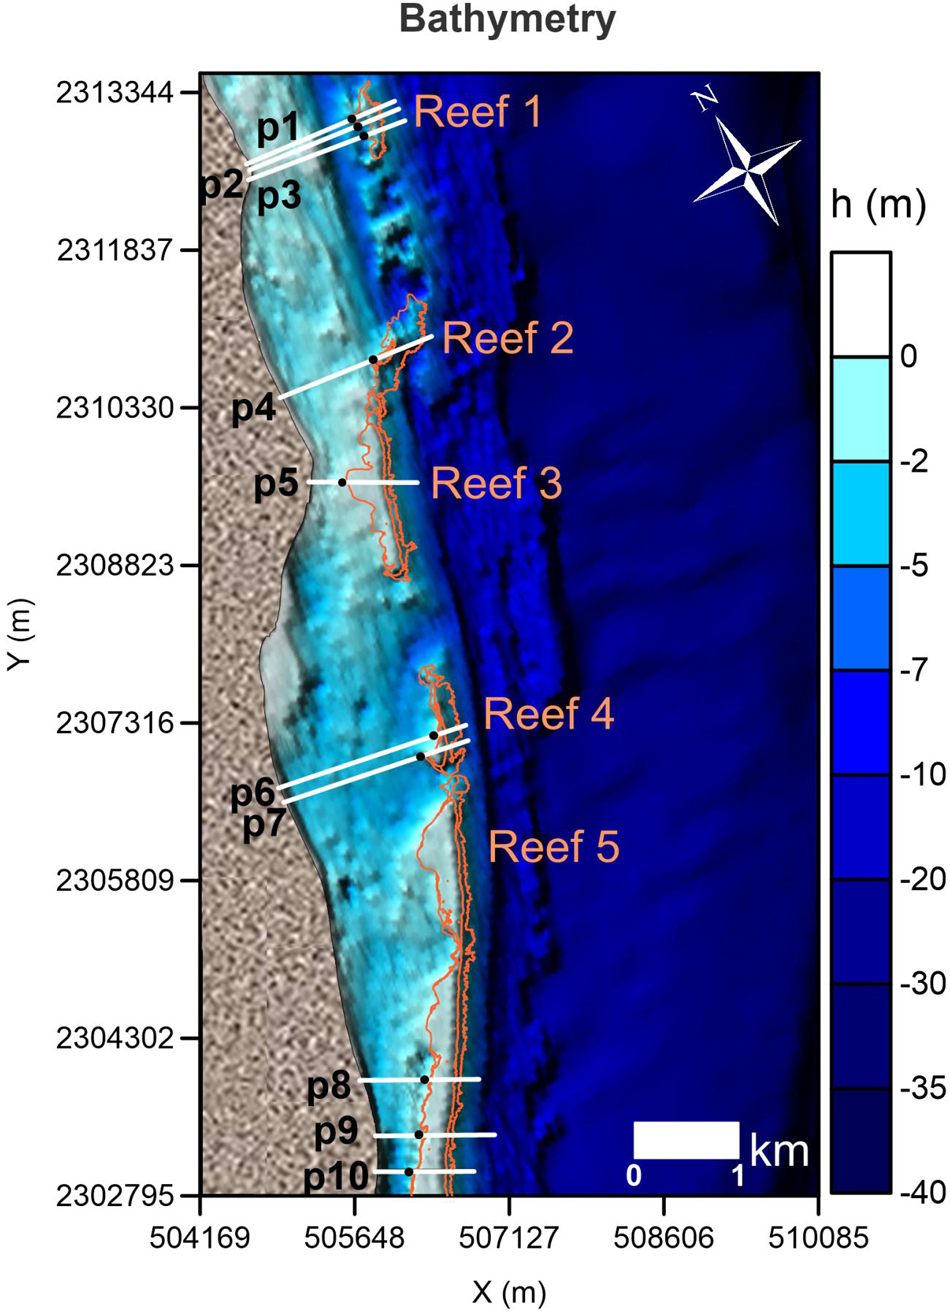
Figure 2. Bathymetric map showing the position of the reefs and the beach profiles used in the analysis presented.
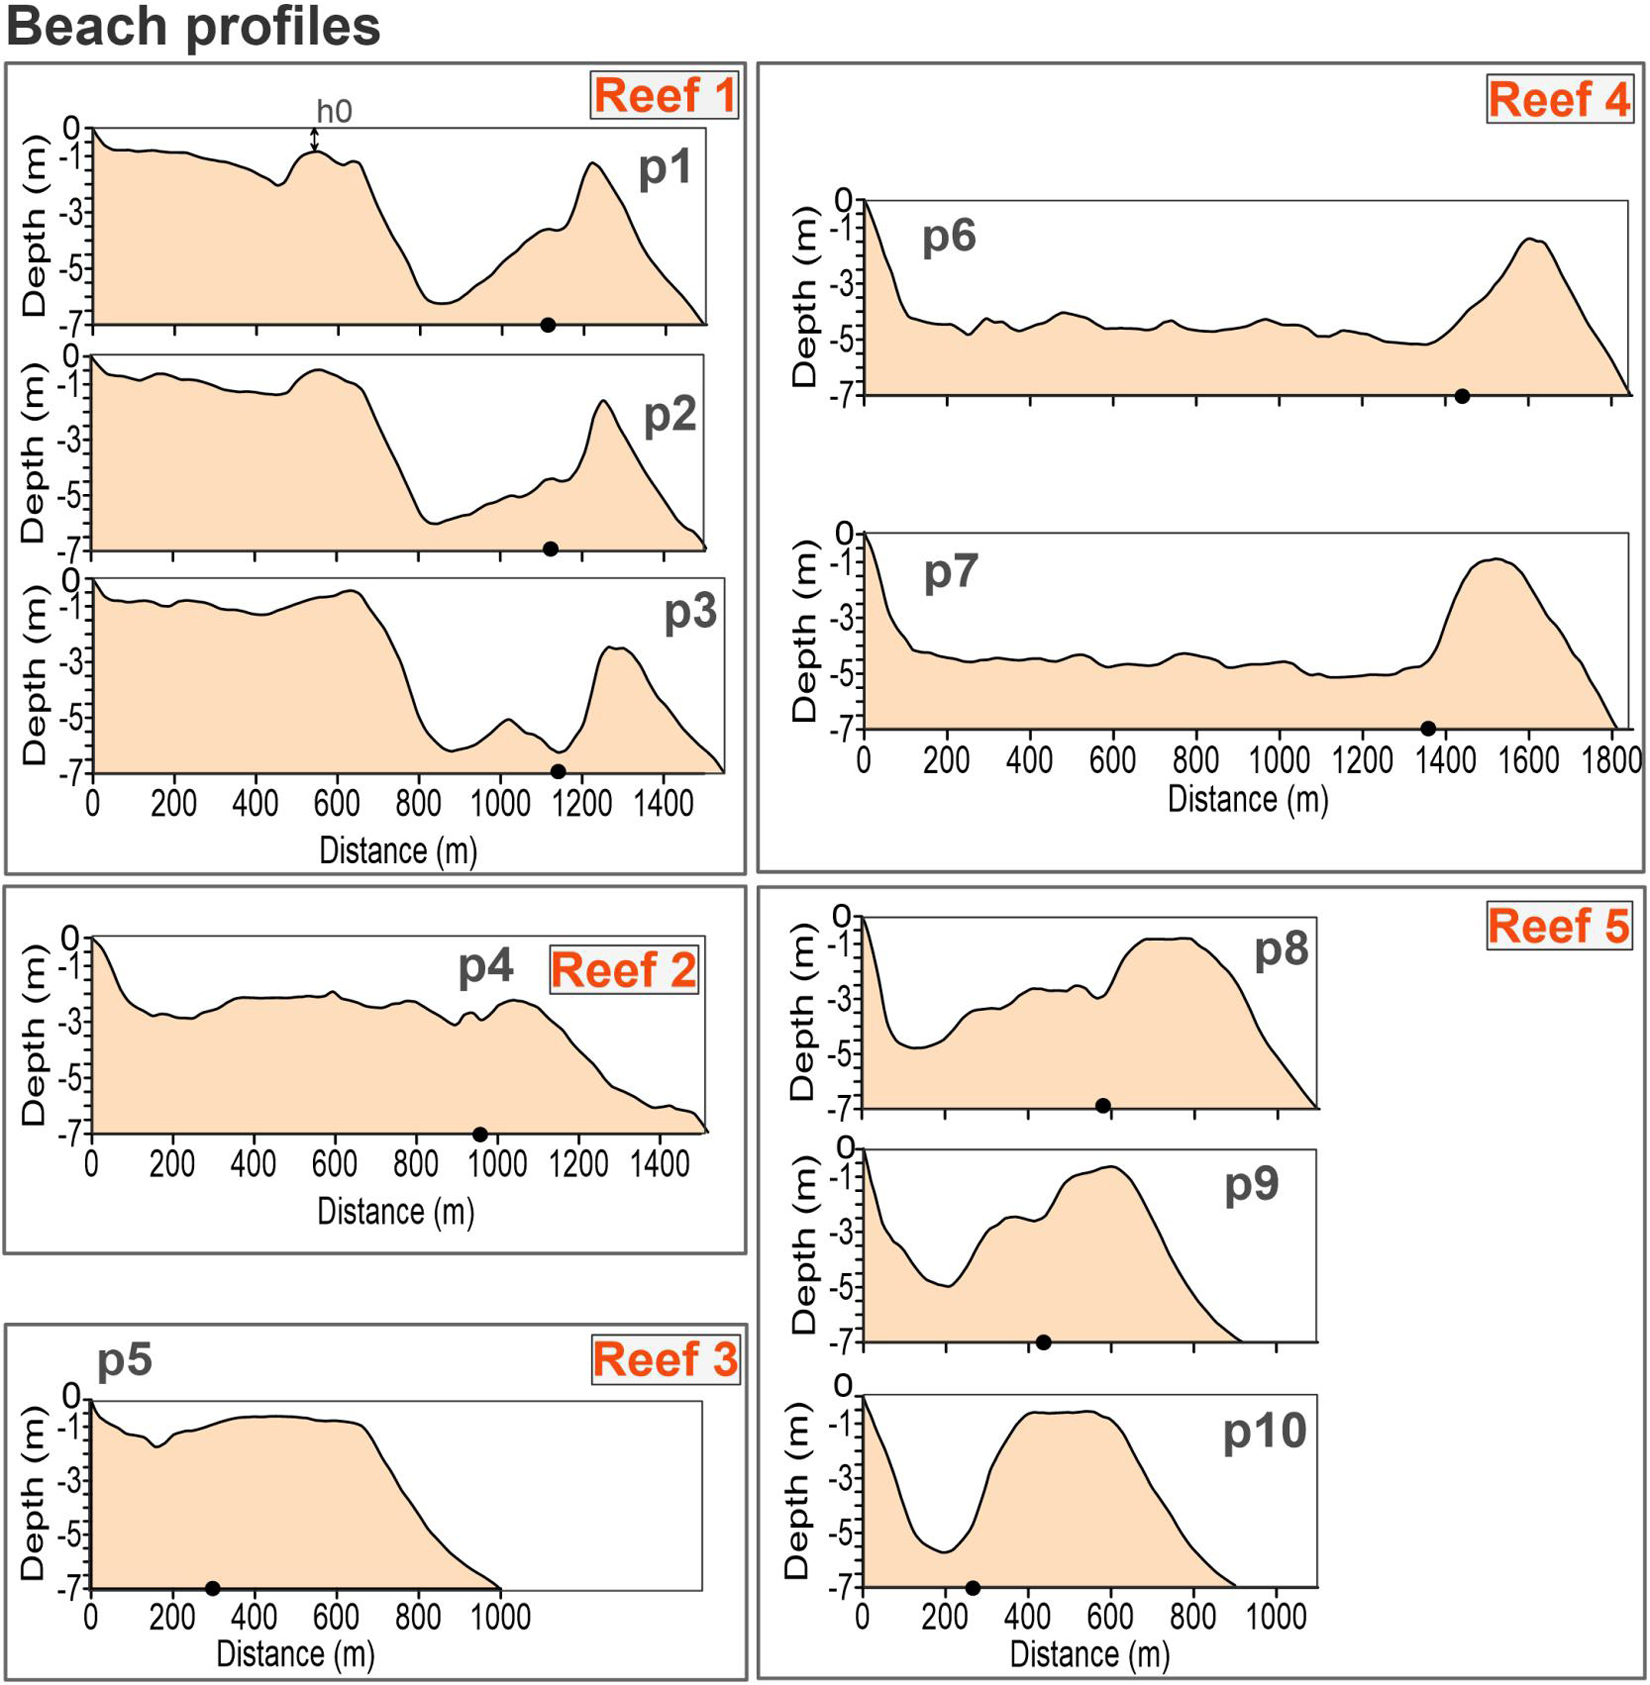
Figure 3. Reef-beach transects. The black dot in each panel indicates the limit of the reef lagoon. The vertical axis provides the elevation in meters; the horizontal axis in the panels shows the horizontal distance from the shoreline in meters.
Puerto Morelos is a wave-dominated beach, where wave overtopping on the reef crest and the resulting flow are the main driving mechanisms on the hydrodynamics. The climate of the region is tropical, with two dominant seasons in terms of wind patterns and air temperature, winter and summer (Coronado et al., 2007). Low-energy waves from the east/southeast arrive most of the year (Hs ∼ 0.5–1.5 m; Tp ∼ 4–6 s), but in winter (from November to April) intense episodes of wind from the north (cold fronts, locally known as “Nortes”) generate northerly energetic waves (Hs ∼ 2–3 m; Tp ∼ 6–8 s; Ruiz de Alegria-Arzaburu et al., 2013). In summer (from June to October), frequent storms and, sporadically, tropical cyclones define the wave pattern. The area is microtidal and the semidiurnal component dominates with a men tidal range of ∼ 0.17 m and spring and neap tidal ranges of 0.32 and 0.07 m, respectively (Coronado et al., 2007). Under extreme storm conditions, the storm surge is considered the most important component of water level elevation (i.e., during hurricane Wilma, in October 2005, storm surge reached 2.5 m at the beach and 0.5 m in deep water; Mariño-Tapia et al., 2014).
Ruiz de Alegria-Arzaburu et al. (2013) report that some sectors of Puerto Morelos beach are particularly stable, especially under storm conditions, compared to Cancun beach. This is clear evidence of the protective role of the reef. A positive balance of sediments has been reported following the series of intense hurricanes in the 10-year analysis period. Two illustrative examples are: Hurricane Wilma (a category 5 hurricane), the most devastating hurricane to hit the region, brought a large sand input into the beach system from the northern beaches (Mariño-Tapia et al., 2014), whereas Hurricane Dean (also a category 5 hurricane), in August 2007, carried a substantial volume of wind-transported sand to the southern limit of the reef (Silva et al., 2016). To the authors’ knowledge, there have been no beach restoration actions in Puerto Morelos beach in the period under study.
Bathymetric data and the spatial distribution and cover of the coral reefs were obtained from the National Commission for the Knowledge and Use of Biodiversity (Mexican CONABIO; Cerdeira-Estrada et al., 2018; Figure 2). To identify differences induced by reef typology, ten reef-beach transects were used to set the five representative categories of reef-beach systems in the area, of one barrier reef (Reef 1, in Figures 2, 3) and four fringing reefs (Reef 2 to Reef 5, in Figures 2, 3). The profiles extend seaward from the coast to a depth of -7 m (p1–p10 in Figure 2).
Five parameters were chosen to describe the beach-reef categories: width of reef (Br), width of reef flat (Brf), depth of reef crest (hr), lagoon width (Bl) and lagoon depth (hl); See Figure 3 and Table 1. These parameters led to the following reef classification:
• Reef 1 is a narrow reef (Br∼200 m), with a narrow reef-flat (Brf ∼50–70 m), a variable depth of reef crest (hr ∼1–2.5 m), the lagoon is wide (Bl ∼1,150 m), and shallow (hl ∼1.3–2 m).
• Reef 2 is a narrow reef (Br ∼200 m), with a reef-flat width (Brf) of ∼100 m, a 2.2 m reef crest depth (hr), and wide (Bl ∼900 m), and shallow (hl ∼2.4 m) lagoon.
• Reef 3 is a wide reef (Br ∼400 m), with the widest reef-flat (Brf of ∼380 m), and the shallowest reef crest (hr ∼0.7 m). It is close to the coastline (Bl ∼300 m) and has the lowest lagoon depth (hl ∼1.3 m).
• Reef 4 is a narrow reef (Br ∼200 m), with a variable reef-flat width (Brf), increasing southward from 50 to 100 m. The reef crest is shallow (hr ∼1–1.4 m), and has a very wide (Bl ∼1,350 m) and deep lagoon (hl ∼4.5 m).
• Reef 5 is the longest reef section, with wide reef (Br ∼400 m) with reef-flat width (Brf) of ∼105–200 m (higher in the southern transect), a very shallow reef crest (hr < 1 m), variable lagoon widths (Bl∼600 to 300 m, decreasing southward) and deep lagoons (hl ∼4.8–5.5 m).
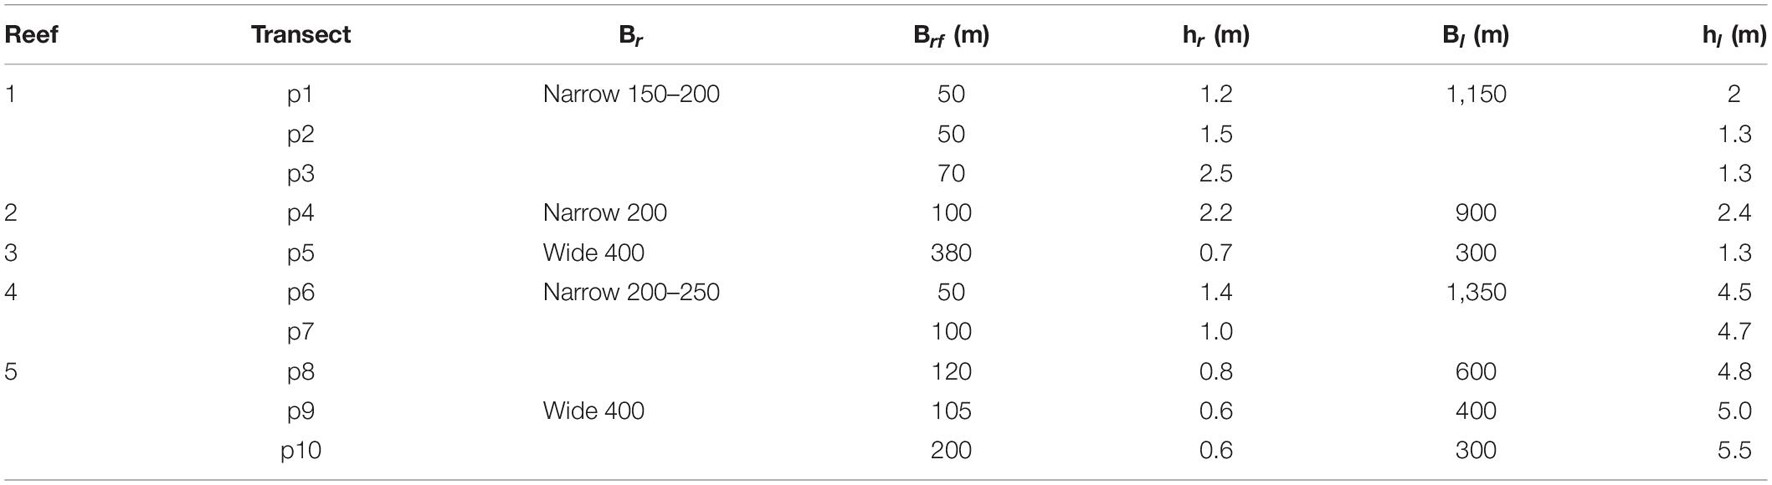
Table 1. Parameters of reefs used in the analysis.
The location and number of profiles were selected following these criteria: (i) in areas outside the influence of waves passing through the reef discontinuities (i.e., homogenous reef sections free from wave diffraction); and (ii) the profiles fall within one of the five listed representative categories. The rationale behind these criteria is to provide a beach-reef system classification that may help foreseeing the beach response.
From the information in Figure 3 and Table 1, reefs 1, 2, and 4 are considered narrow reefs (Br ∼200 m), while 3 and 5 are wide reefs (Br ∼400 m). The narrow reefs have a reef-flat of width (Brf) of ∼50–100 m, extending further from the coastline (Bl of 900–1,350 m), and a reef crest depth (hr) that varies from 1 to 2.5 m. Of the narrow fringing reefs, Reef 2 has a deeper reef crest (∼2.2 m in Reef 2 and ∼1–1.4 m in Reef 4) but shallower lagoon hl (∼2.4 m in Reef 2 and >4.5 m in Reef 4). The wide reefs, 3 and 5, have a very shallow reef crest (hr <1 m), although Reef 3 has a wider reef-flat and a shallower lagoon than Reef 5.
Google Earth Pro Imagery was used to analyze changes to the coastline between 2006 and 2016. A mosaic of five satellite images spatially distributed along the 11.2 km coastline studied, from DigitalGlobe (0.5-m resolution), was used to identify historic changes in the coastline (Table 2). A minimum of 6 and a maximum of 10 shoreline positions were available to evaluate the temporal changes behind each transect depending on its location (Table 2). The satellite images were georeferenced in the Universal Transverse Mercator coordinate system (UTM 16 N WGS84) in ArcMap 10.3, by 6–10 evenly spaced ground control points from the images. The coastlines were digitalized as the water line at the time that the images were taken.
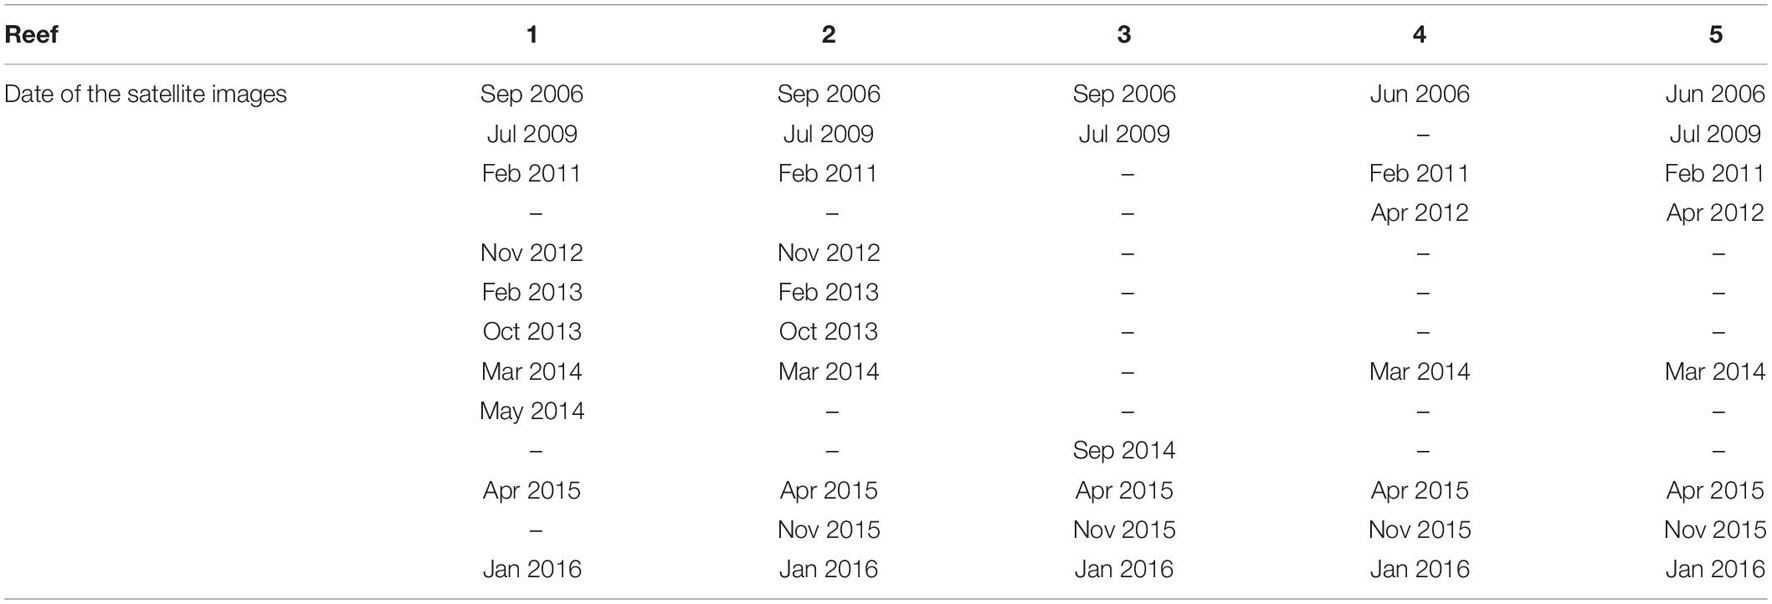
Table 2. Data used for the analysis of shoreline change.
Cross-shore transects every 20 m were generated along the 2006 coastline, which was taken as a baseline from which to measure the changes and shoreline variability over time. The rates of shoreline change were calculated for profiles p1 to p10 (Figure 3). The mean and standard deviation of shoreline movement were used as representative parameters of the net change and temporal variability of the shoreline for each beach profile. These statistical parameters are considered representative indicators of beach mobility (Zuzek et al., 2003; Ojeda and Guillén, 2008; Jackson et al., 2012).
Total errors of the digitized shoreline positions were ∼1 m, and thus, considered appropriated to obtain a feasible time series of shoreline positions. Using the water line as a proxy, errors related to the astronomical tidal phase at the time of the images were the most significant but small enough (<1 m) given by the micro-tidal regime of the area. Calm wave conditions were identified on the dates of the satellite images and, thus, possible errors due to storm surge were dismissed. In addition, negligible errors (<0.4 m) from the image georeferencing process were found.
The WAPO numerical model was used to compute the wave propagation from deep water to the beach and to quantify the hydrodynamic effects of the Puerto Morelos coral reef. WAPO is a time independent model which propagates linear waves using the 2D modified elliptic mild-slope equation (Silva et al., 2005). The model solves wave reflection and diffraction as well as the interaction between the waves and the complex reef structure (including the effects of the gaps between reef patches). The mild-slope equation version solved by the WAPO model includes an energy dissipation term that considers dissipation due to wave breaking and bottom friction. The former is evaluated as a function of the wave energy flux decay on a sloping bottom, and the latter is a Darcy-Weisbach energy damping model (please see Silva et al., 2005 for further details).
The model was configured with three overlapping, rectangular, numerical grids to cover the entire study area, with a 7 m horizontal resolution (Figure 4). The number of numerical grids covering the study area was determined by the upper limit of grid cells used in the computation by the numerical model. The borders of all the grids were considered open boundaries in the model.
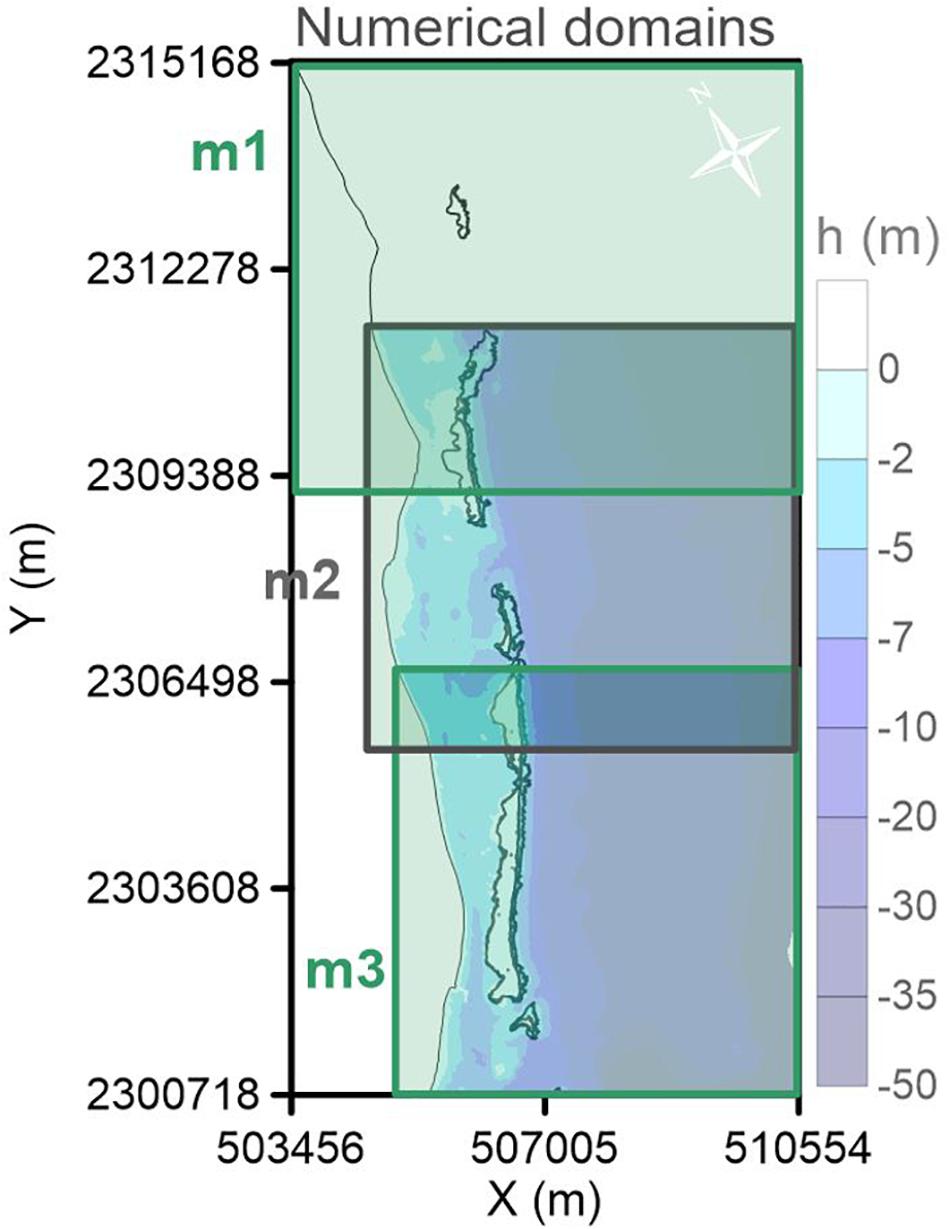
Figure 4. Bathymetry and numerical domains for the wave propagation model.
The bottom friction due to the presence of specific coral species, or any distribution of them, has not been included in the numerical model. Instead, a spatially uniform friction factor of 0.1 was set to represent the frictional dissipation due to the bottom, following Ruiz de Alegria-Arzaburu et al., 2013 for the same study region. Seagrasses were found to produce only localized effect on wave propagation and almost no effect on beach response.
Deep water wave data were obtained from the NOAA wave reanalysis database generated with the WAVEWATCH-III model ([WW3; The Wavewatch Iii Development Group (WW3DG), 2019], at a point offshore of the study area (86.5°W; 20.6667°N; Figure 1A). This wave data has been calibrated and validated by altimetry and buoy measurements data, showing a high accuracy (Chawla et al., 2009). The wave dataset provided time series of 3-hourly significant wave heights, peak periods, and wave directions, Figures 5A–C.
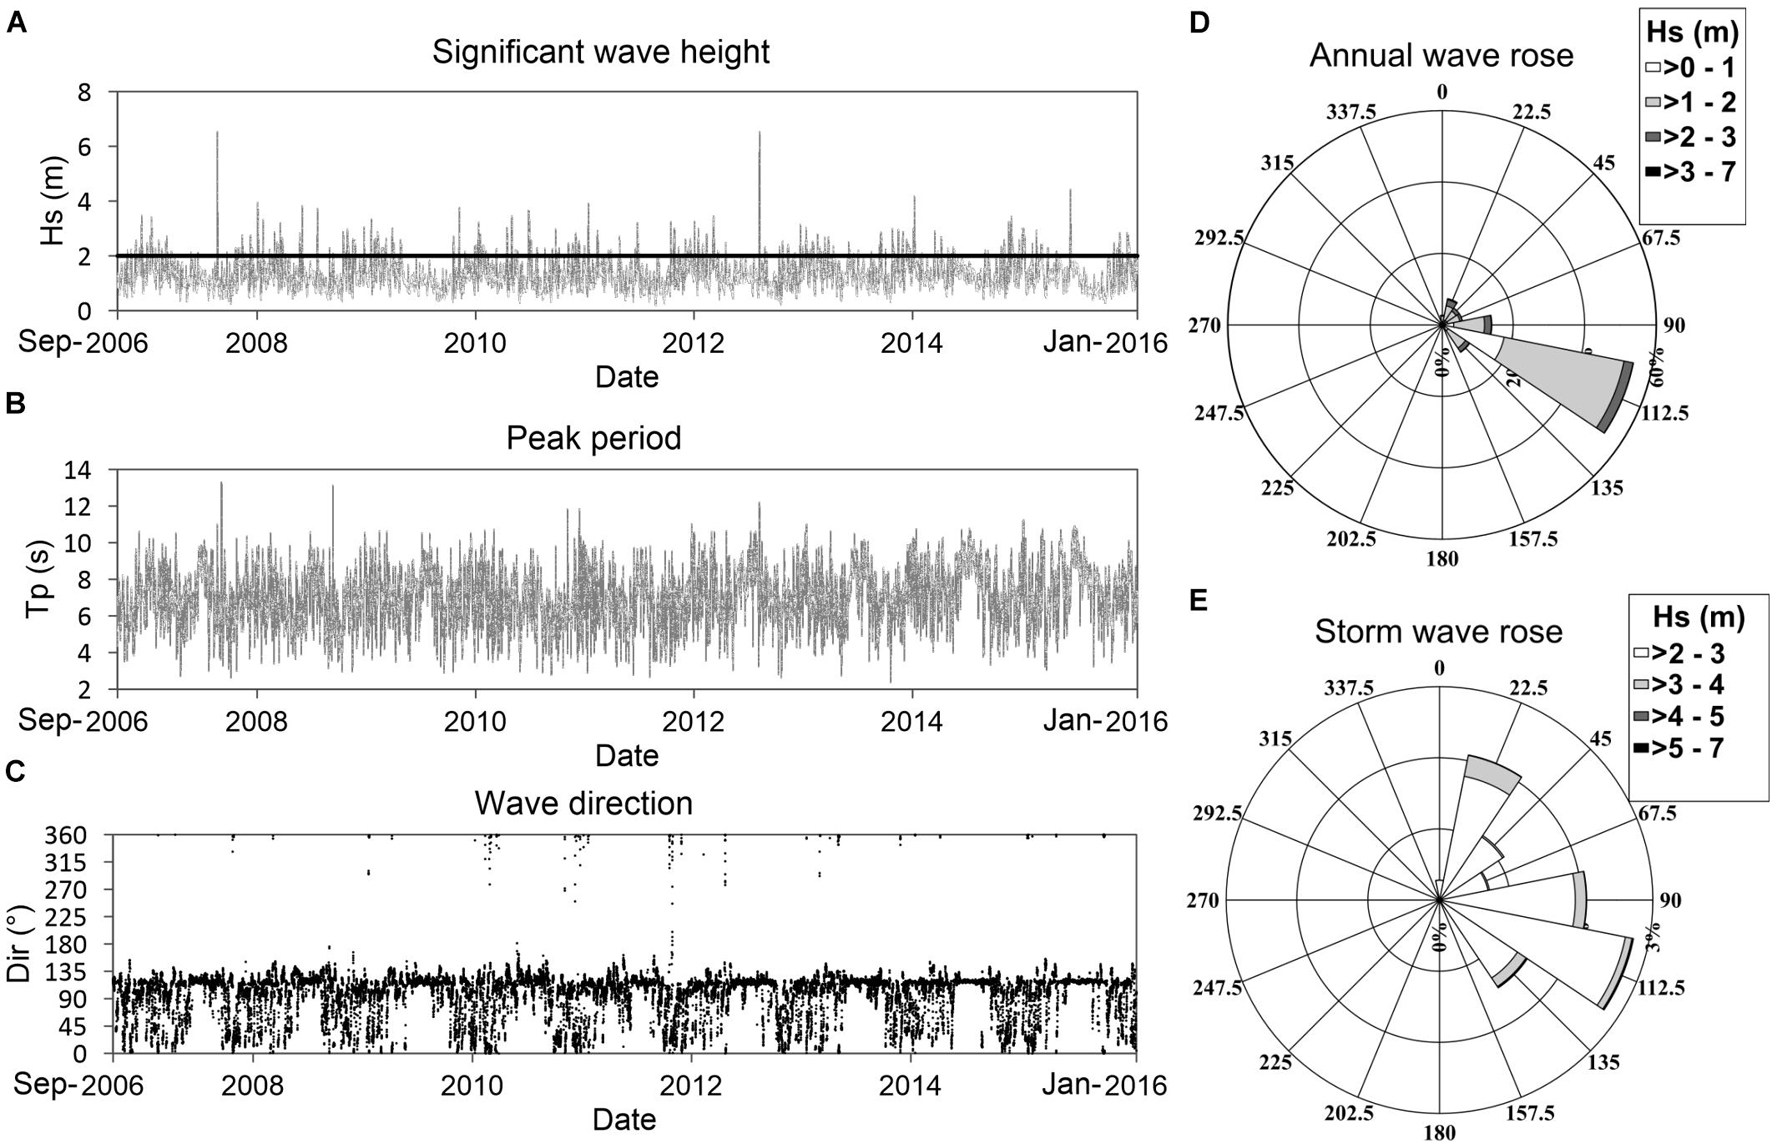
Figure 5. Time series of reanalysis data and wave roses: (A) Significant wave height (m), the horizontal line represents the storm threshold; (B) peak period (s); (C) wave direction (degrees from North); (D) wave height rose (entire data set); and (E) wave rose (only storms).
A storm was defined as an event with a significant wave height exceeding 2 m, following the climate analysis in Silva et al. (2008; Figure 5A). A directional analysis of significant wave heights (Figure 5D) shows a predominance of East-Southeast incident waves during the mean regime, while during storms the East-Southeast, East, and Southeast directions are dominant (see Figure 5E).
Based on historic data and the wave climate analysis shown in Figure 5, representative wave parameters were selected for the mean regime, frequent storms and intense storms. We considered Hs of 1 m and Tp of 6 s from the East-Southeast as typical mean regime conditions, Hs of 2 m and Tp of 8 s from the East and Southeast to define frequent storms and Hs of 3 m and Tp of 10 s from the East-Southeast for the most intense storms in the period studied.
The longshore component of the wave energy flux and cross-shore component of the radiation stress at the wave breaking points, behind the reefs, were calculated from the results of the wave propagation model to assess their influence in driving changes in coastline evolution. The radiation stress has been widely used to describe the increase in water level at the shoreline (set-up), due to breaking waves, and its effects on beach morphology (Guza and Thornton, 1981), which led us to investigate the correlation between this parameter and the historical coastline change.
The wave energy flux, assuming linear wave theory, was calculated before the wave breaking point following Mil-Homens et al. (2013) as:
where Eb is the wave energy per unit crest; Cgb is the group velocity at the breaking point; Hb is the wave height at the breaking point; γb is the breaker index (γb = 0.78); g is the acceleration due to gravity; and ρ is the water density.
The longshore component of the incident wave energy flux per unit length was calculated based on the propagation information at the breaking points as:
where αb is the wave angle at the breaking point.
The shore-normal component of the first order radiation stress was determined as (Lonquet-Higgins and Stewart, 1964):
where E is the wave energy per unit length of wave crest; k is the wave number; and h is the local depth.
Reef geometry, hydrodynamic forcing, and historic changes in the coastline were statistically correlated to assess the protection of the shoreline from erosion provided by the reefs. Linear regression by least squares was performed to describe how the variables trends are related. R-squared of the Pearson linear correlation coefficient, at the 95 of significance level, was also computed to assess the goodness of fit between the different variables.
The analysis focused on: (1) historic shoreline changes, based on remote sensing data, represented by the mean and standard deviation values of the annual shoreline change rates; (2) parameters characterizing the typology of the reef-beach profiles responsible for shoreline change; (3) the relationship between the magnitude of breaking waves behind the reefs and the geometrical features of reefs, and (4) the significance of the cross-shore component of the radiation stress, the longshore wave energy flux at the breaking point, and the location of this, to explain shoreline change.
The absolute coastline changes since 2006 show: (1) great variability in Reef 1 over the years, with a coastline retreat, compared to the 2006 position; (2) pronounced shoreline recession behind Reef 2; (3) a small change in the coastline in Reef 3 (which may be in a stable condition); (4) great variability over time in Reef 4, with coastline retreat overall; and (5) a notable seaward advance of the shoreline in p9 of Reef 5, but a retreat in p8 and very few changes in p10 (Figure 6A).
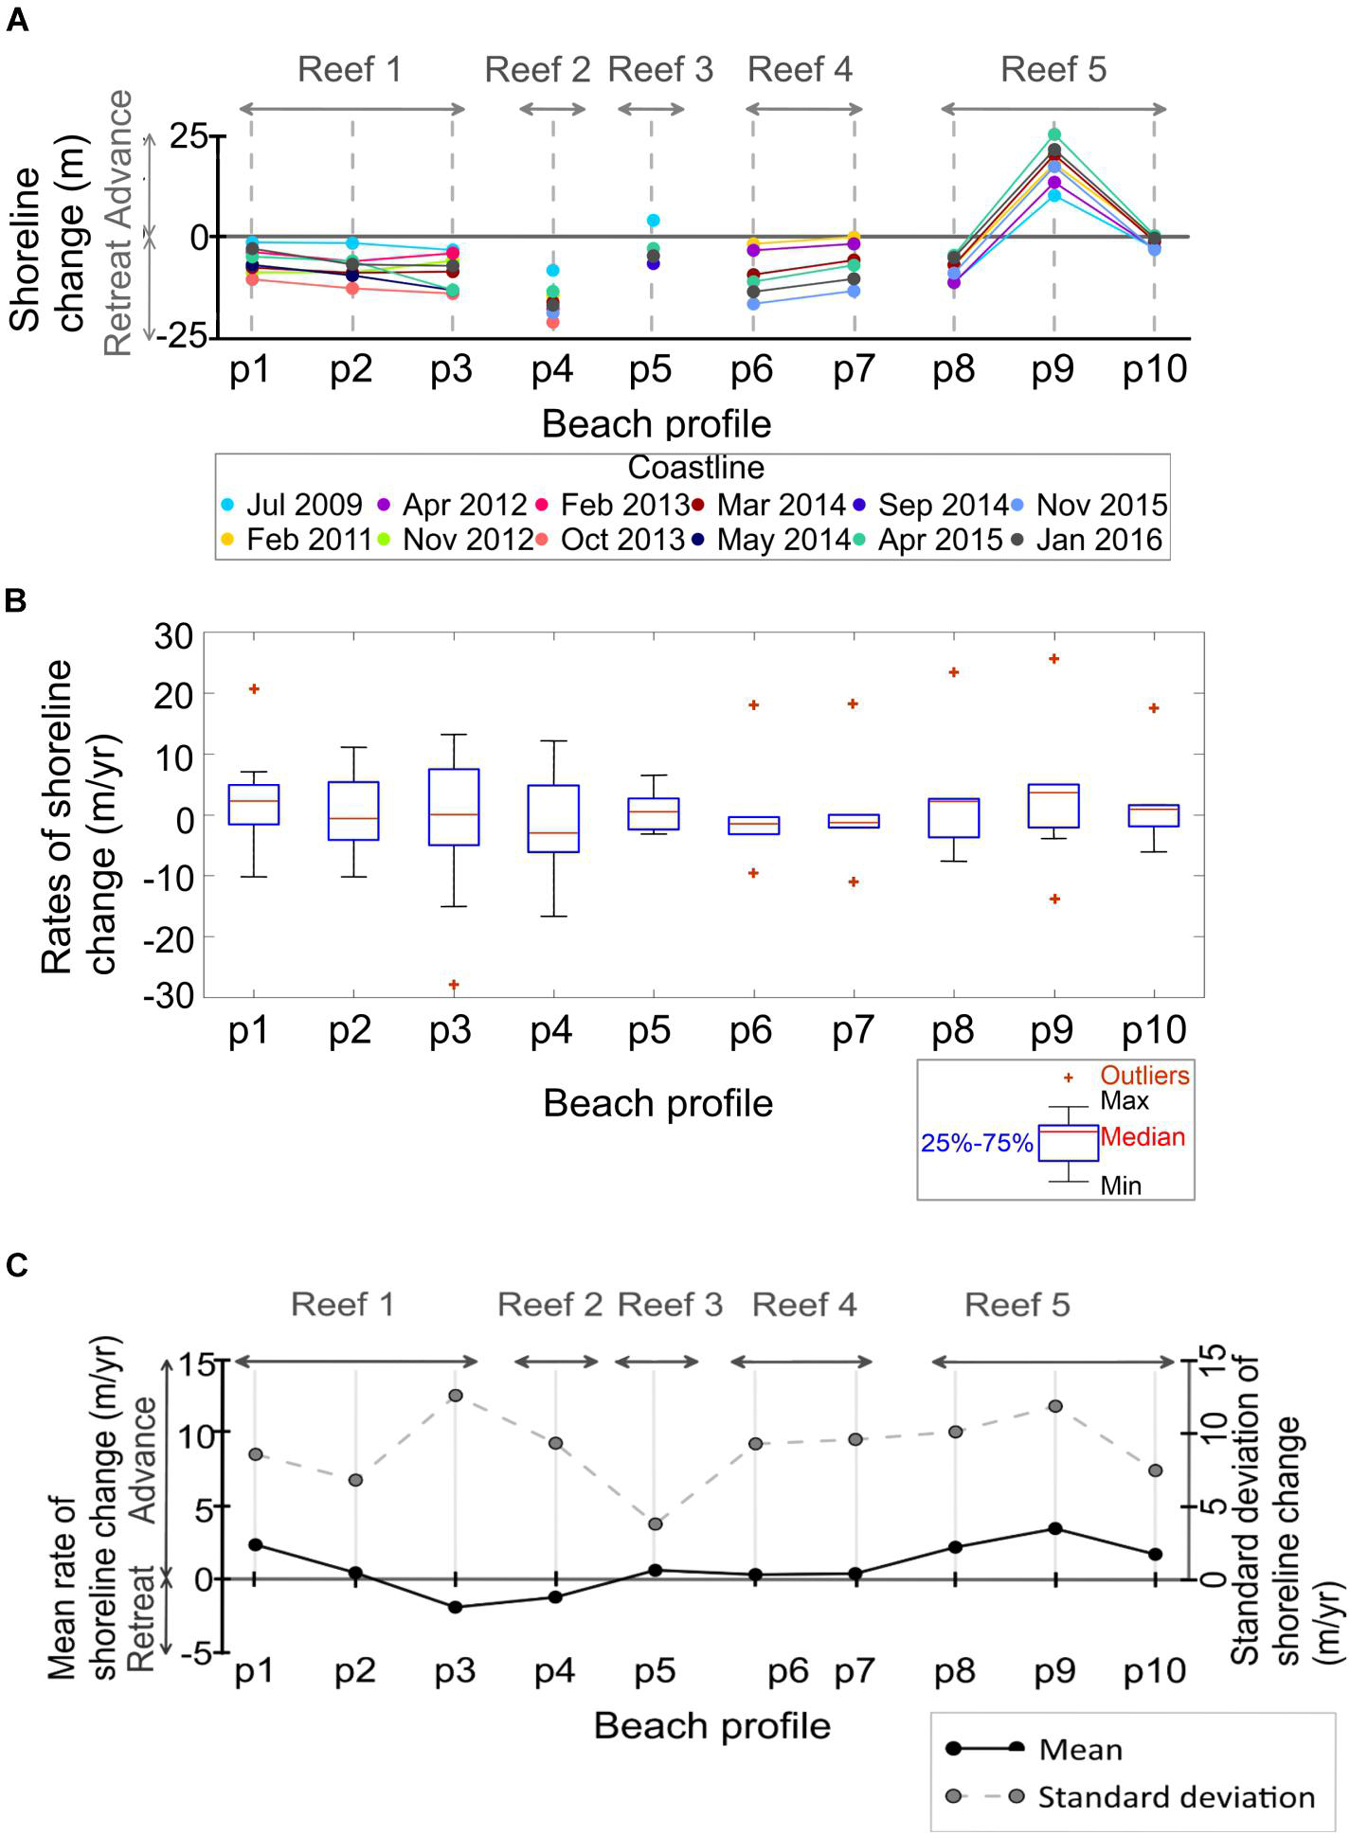
Figure 6. Shoreline evolution 2006–2016 for the ten reef-beach profiles selected: (A) Shoreline change from 2006. (B) Boxplot of rates of shoreline change. (C) Mean and standard deviation values of the rates of shoreline change.
The above observations agree with the geometric characteristics of the corresponding profiles. The beach behind Reef 1 shows the most significant variability as it features a medium to large reef lagoon with considerable depths close to the reef. This leads to arguing that under some conditions, broken waves find the opportunity to reconstitute and attack the beach with considerable energy and producing beach loss. Whenever these conditions do not occur, the beach turns into a constructive situation. Reef 2 is located behind a shallow reef lagoon of medium length. In this case, the reef itself is submerged, meaning that wave transmission is high, explaining the erosive trend. The coastline with the lesser variation is behind Reef 3. The main physical characteristic of this profile is a wide reef-flat and a shallow crest. This profile also features a very short and shallow lagoon that contributes to dissipating wave energy. Reef 4 features a slightly submerged reef and a large lagoon of medium depth. In this case, broken waves may reconstitute, especially during storms resulting in an erosive trend. In Reef 5, the short lagoon length with more significant depths close to the shore produces sediment availability for the dry beach, resulting in low erosion and the only profiles showing consistent beach accretion.
The annual rates of shoreline change also indicate (Figures 6B,C):
(1) a net accretion and erosion of ∼2 m/year in p1 and p3 of Reef 1, respectively, without significant changes of the mean evolution in p2 of this reef; with high shoreline variability for the three transects, most notably in p3 (12 m/year standard deviation);
(2) a mean erosion change of 1 m/year and a high variability, expressed by a 9 m/year standard deviation in Reef 2;
(3) an almost zero mean rate of shoreline change in Reef 3 and the least variability (∼3 m/year of standard deviation);
(4) net change of the coastline close to zero in Reef 4, though with great variability, ∼9 m/year;
(5) the greatest mean advance of the shoreline is found in Reef 5 (∼2–3 m/year), which also presents the largest variability between years in p8 and p9 (10–12 m/year of standard deviation) and less coastline changes in p10, as shown by the absolute coastline change since 2006 in Figure 6A.
Based on this analysis, along the available data period, the shoreline behind Reef 3 is the most stable, followed by transect p10 of Reef 5, whereas Reef 1 (p3) and Reef 2 show the largest erosive shoreline positions (Figure 6).
A statistically significant relation was found between shoreline evolution and the depth and width of the reef flats of the fringing reefs (Figure 7). The highly correlated mean rate of coastline change (R2 of 0.68, Figure 7A) with the depth of the reef crests, indicates that deeper reefs are associated to erosion prone areas. The widths of the reef flats and the standard deviation of coastline change rates are also highly correlated (R2 of 0.80, Figure 7B); wider reefs give more stable shorelines. This relationship explains the shoreline behavior observed in Figure 6 in shoreline change; the greater erosion behind Reef 2 was strongly linked to the effects of this deeper reef crest; whereas the shoreline stability in the regions sheltered by Reef 5 (p10) and Reef 3 is characterized by wider reef flats (200 to 380 m; Figure 3). Given the very shallow nearshore seabed landward the reef lagoon (defined by h0 in Figure 3), no correlation was found between shoreline changes and the geometry of Reef 1.
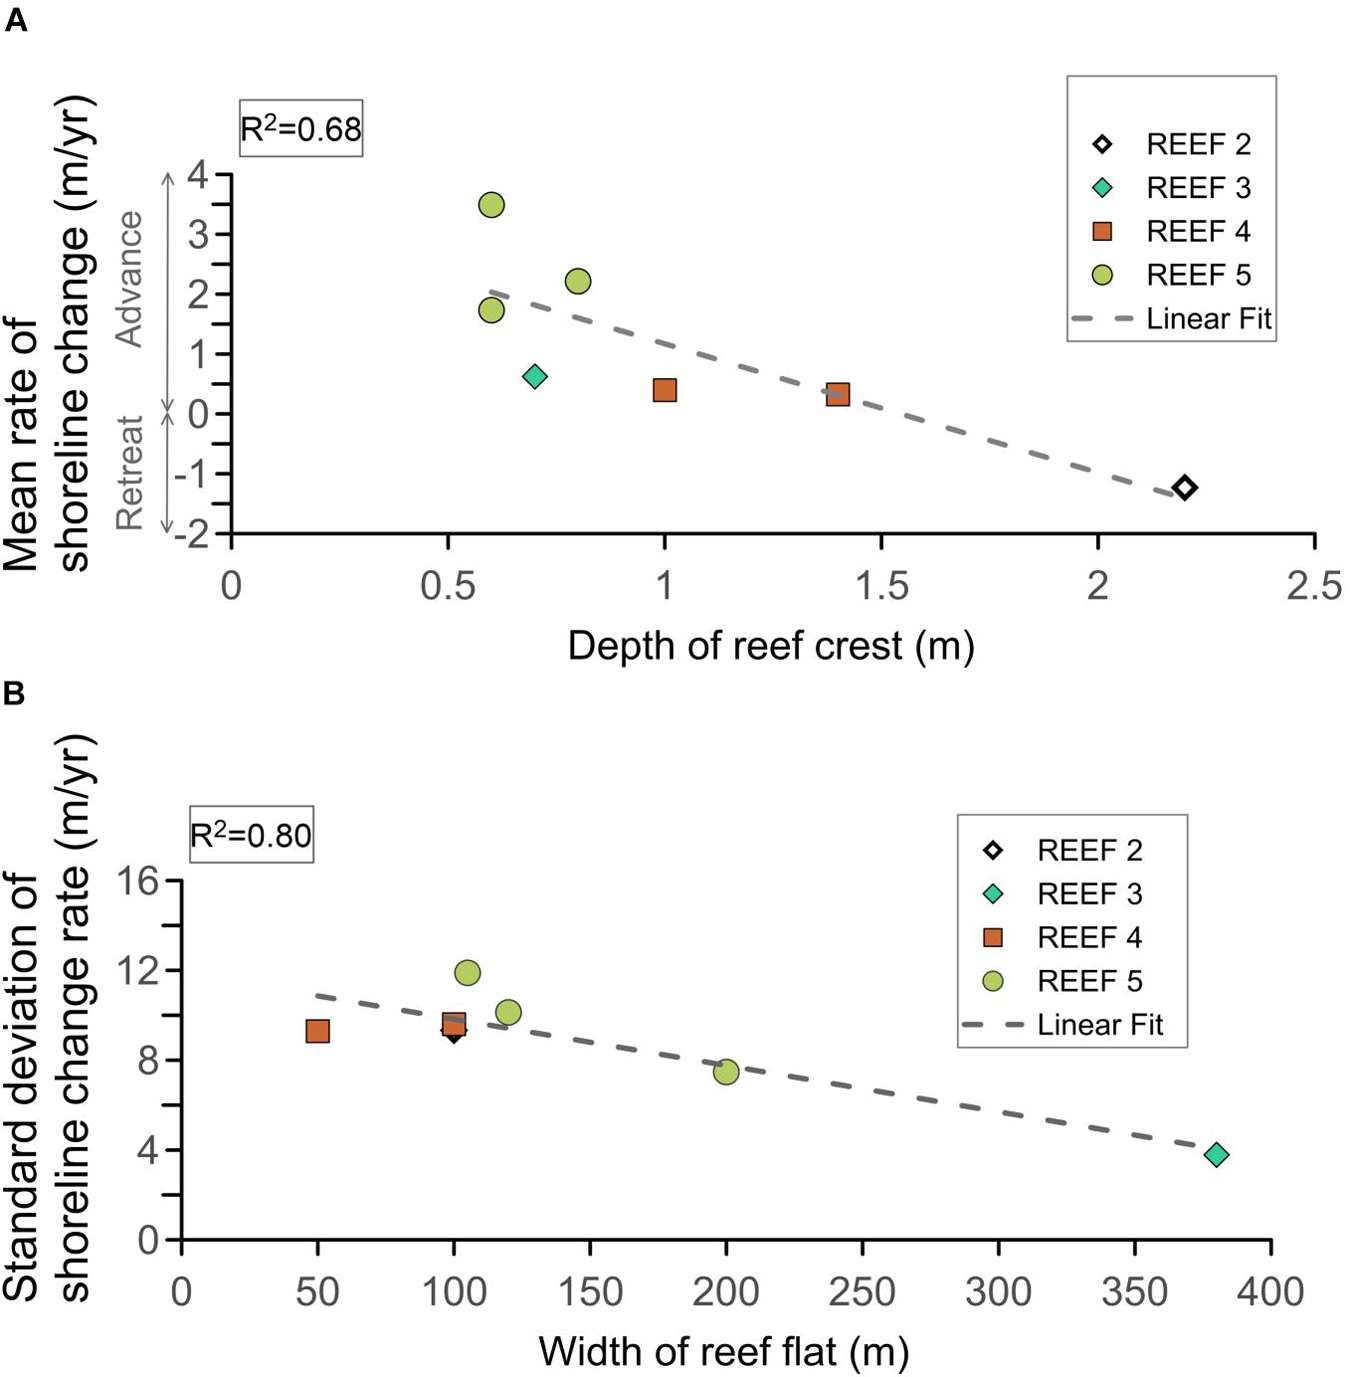
Figure 7. R-squared values of reef geometry and shoreline changes: (A) Mean rate of shoreline change against depth of reef crest. (B) Standard deviation of the shoreline change rates against width of reef flat. The colors in both panels indicate the different reef systems. The dashed line represents a linear regression line fitted by least squares. R2 is the square of the Pearson linear correlation coefficient, tested at 95% confidence level.
The hydrodynamics in the reef systems show that wave energy is reduced, both in mean conditions and storms. The shallow reef crests, <1 m, in Reefs 3 and 5 provide high wave dissipation (see the low wave heights nearshore, in purple in Figure 8). This further supports the findings shown in Figure 7A: a shallow crest depth leads to more stable shorelines due to the high wave energy dissipation that occurs through the reefs. A sheltered region was also observed behind Reef 1, especially during storm conditions (Figure 8), although in this case the wave breaking occurs at shallow depths behind the reef. Furthermore, the waves passing through the reef channels are not attenuated, showing how the continuity of the reef barriers ensures waves of lower heights reach the nearshore region of the beach. When the wave direction changes, the nearshore high energy concentration caused by the discontinuities in the coral barrier are focused elsewhere on the beach, compare Figures 8B,C, where the wave heights significantly change on passing through the gaps in the central section of Reef 5.
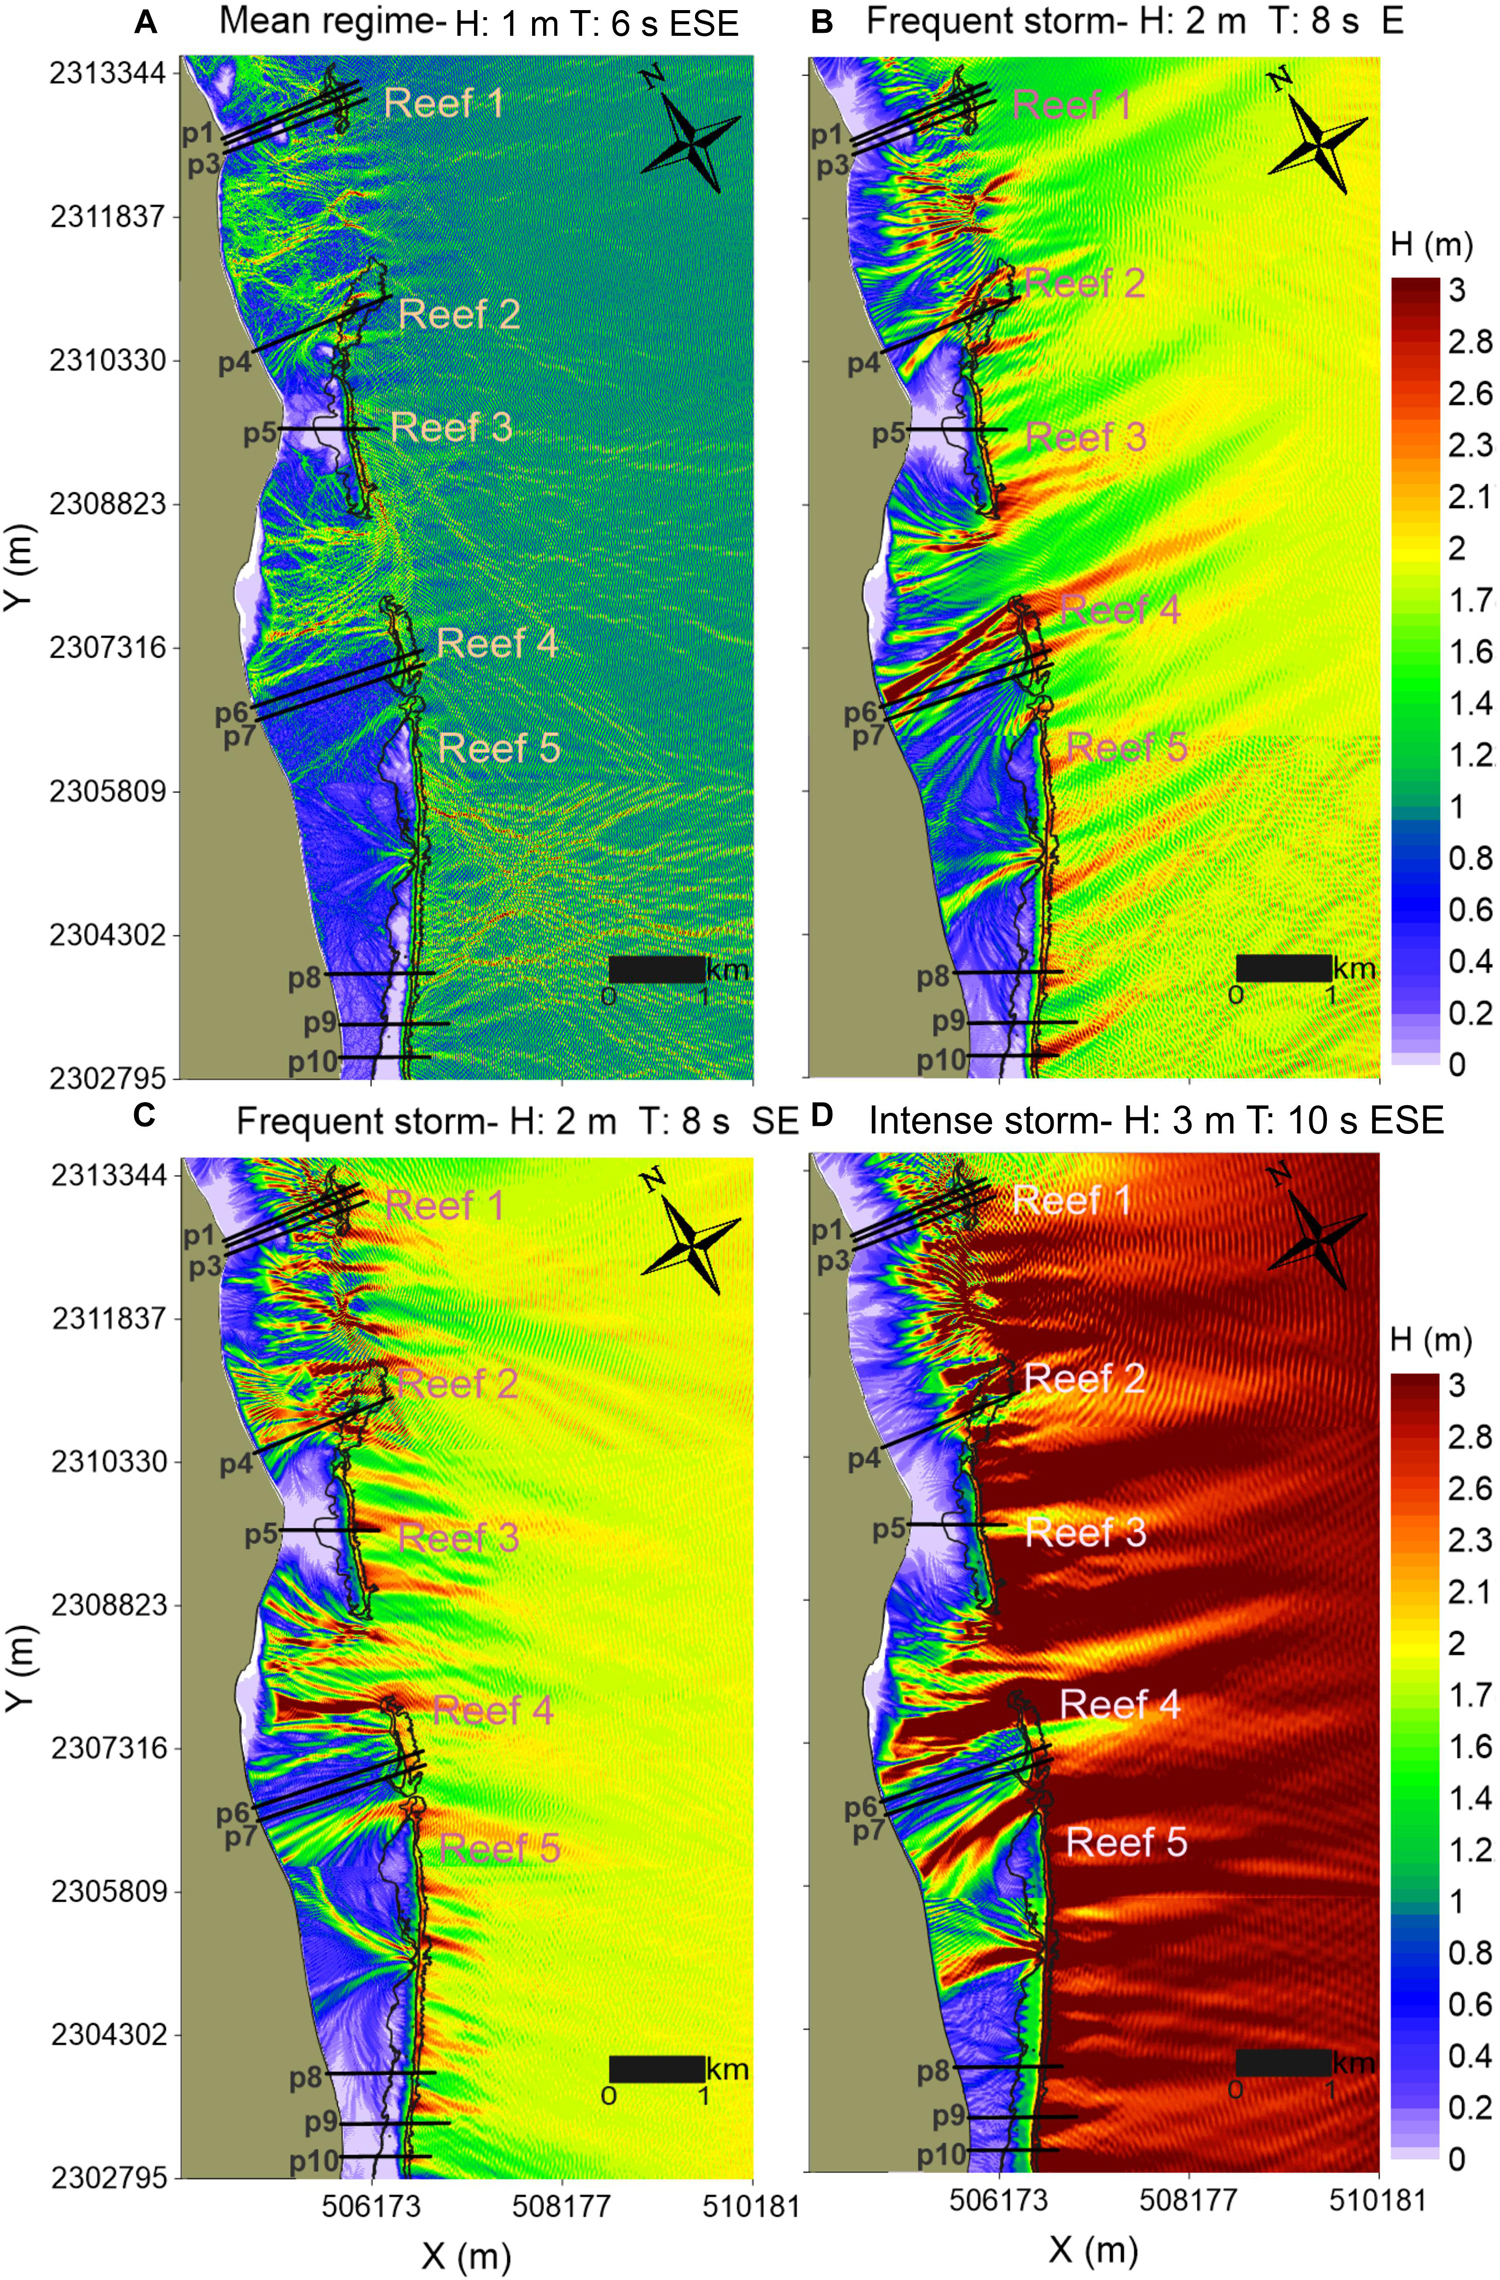
Figure 8. Maps showing maximum wave heights for storm and non-storm wave scenarios: (A) Mean regime-H: 1 m T: 6 s ESE. (B,C) Frequent storms- H: 2 m T: 8 s E/SE. (D) Intense storm- H: 3 m T: 10 s ESE.
A statistically significant positive correlation was also found between the height of the breaking waves behind the reefs and the depth of the crests of the fringing reefs (Reefs 2, 3, 4 and 5; Figures 9A–D). Coefficients of determination, R2, of 0.63–0.89 show a linear relationship between these parameters for the mean regime, frequent storms (SE) and the most intense storms; deeper crests give higher wave heights. In contrast, an R2 of 0.09 indicates a very weak relationship between the depth of the reef crests and the breaking wave heights for storms from the E (Reef 4, Figure 9B) as this is affected by the wave diffraction at the borders of the reefs (Figure 8B). Disregarding data strongly affected by wave diffraction, the analysis shows a R2 of 0.64 between breaking wave heights and the depth of reef crests (Figure 9E).
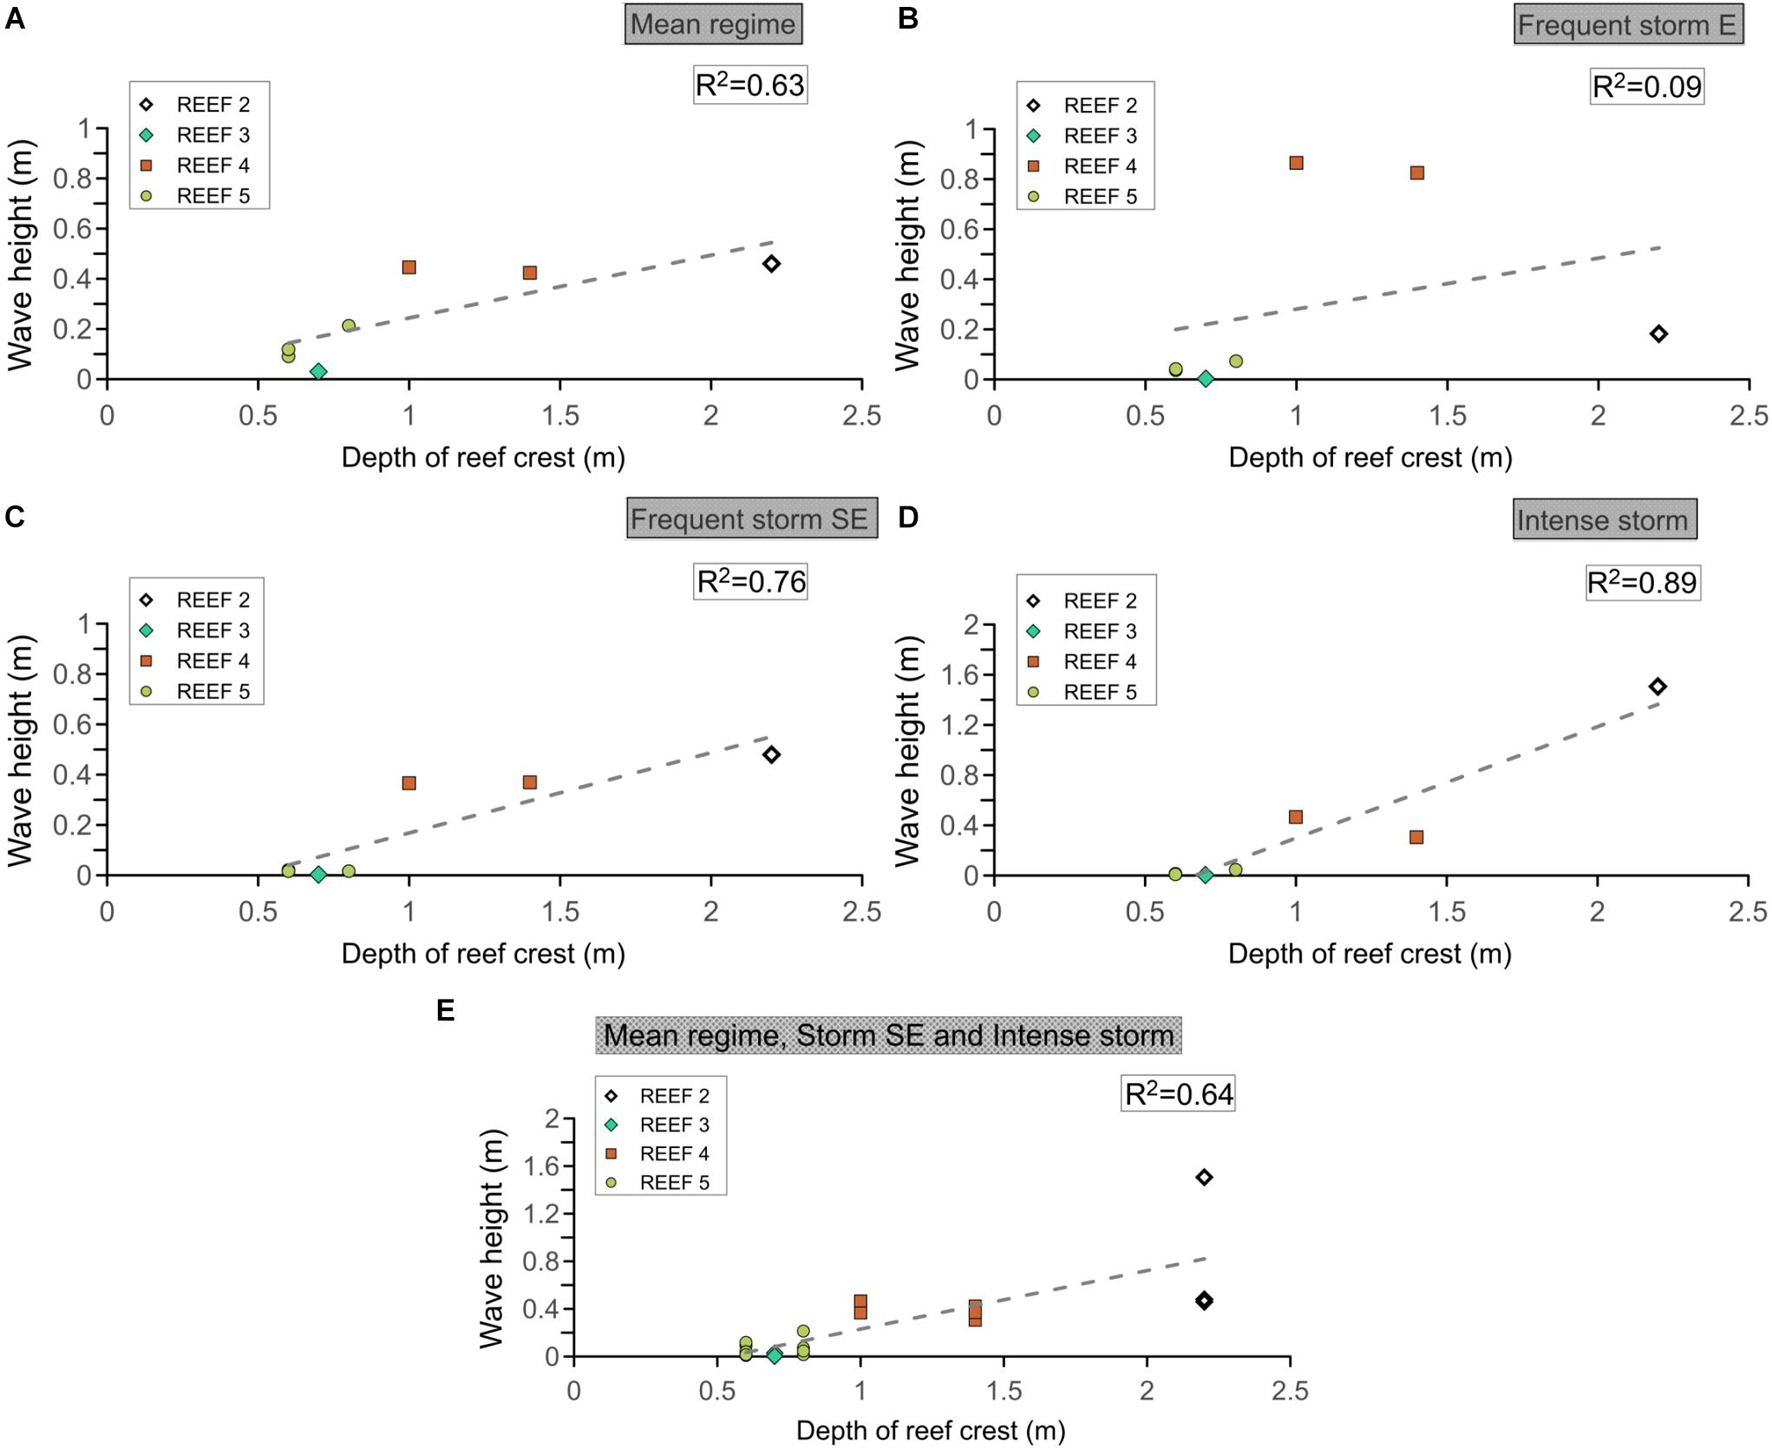
Figure 9. Correlations between breaking wave heights behind the reefs and the depth of the reef crests for different hydrodynamic forcing: (A) Mean regime (regular wave conditions). (B) Frequent storms from the East. (C) Frequent storms from the Southeast. (D) Intense storms (from the East-Southeast). (E) Mean regime, storms from the Southeast and intense storms. The dashed line represents a linear regression line fitted by least squares. R2 is the square of the Pearson linear correlation coefficient, tested at 95% confidence level.
The longshore wave energy flux and the radiation stresses in breaking wave conditions were calculated to evaluate their relevance in shoreline evolution. In Figures 10, 11, the distribution of longshore wave energy flux and radiation stress values show the location of the breaking waves behind the reefs and, thus, the width of the surf zone, for the four wave conditions at each transect.
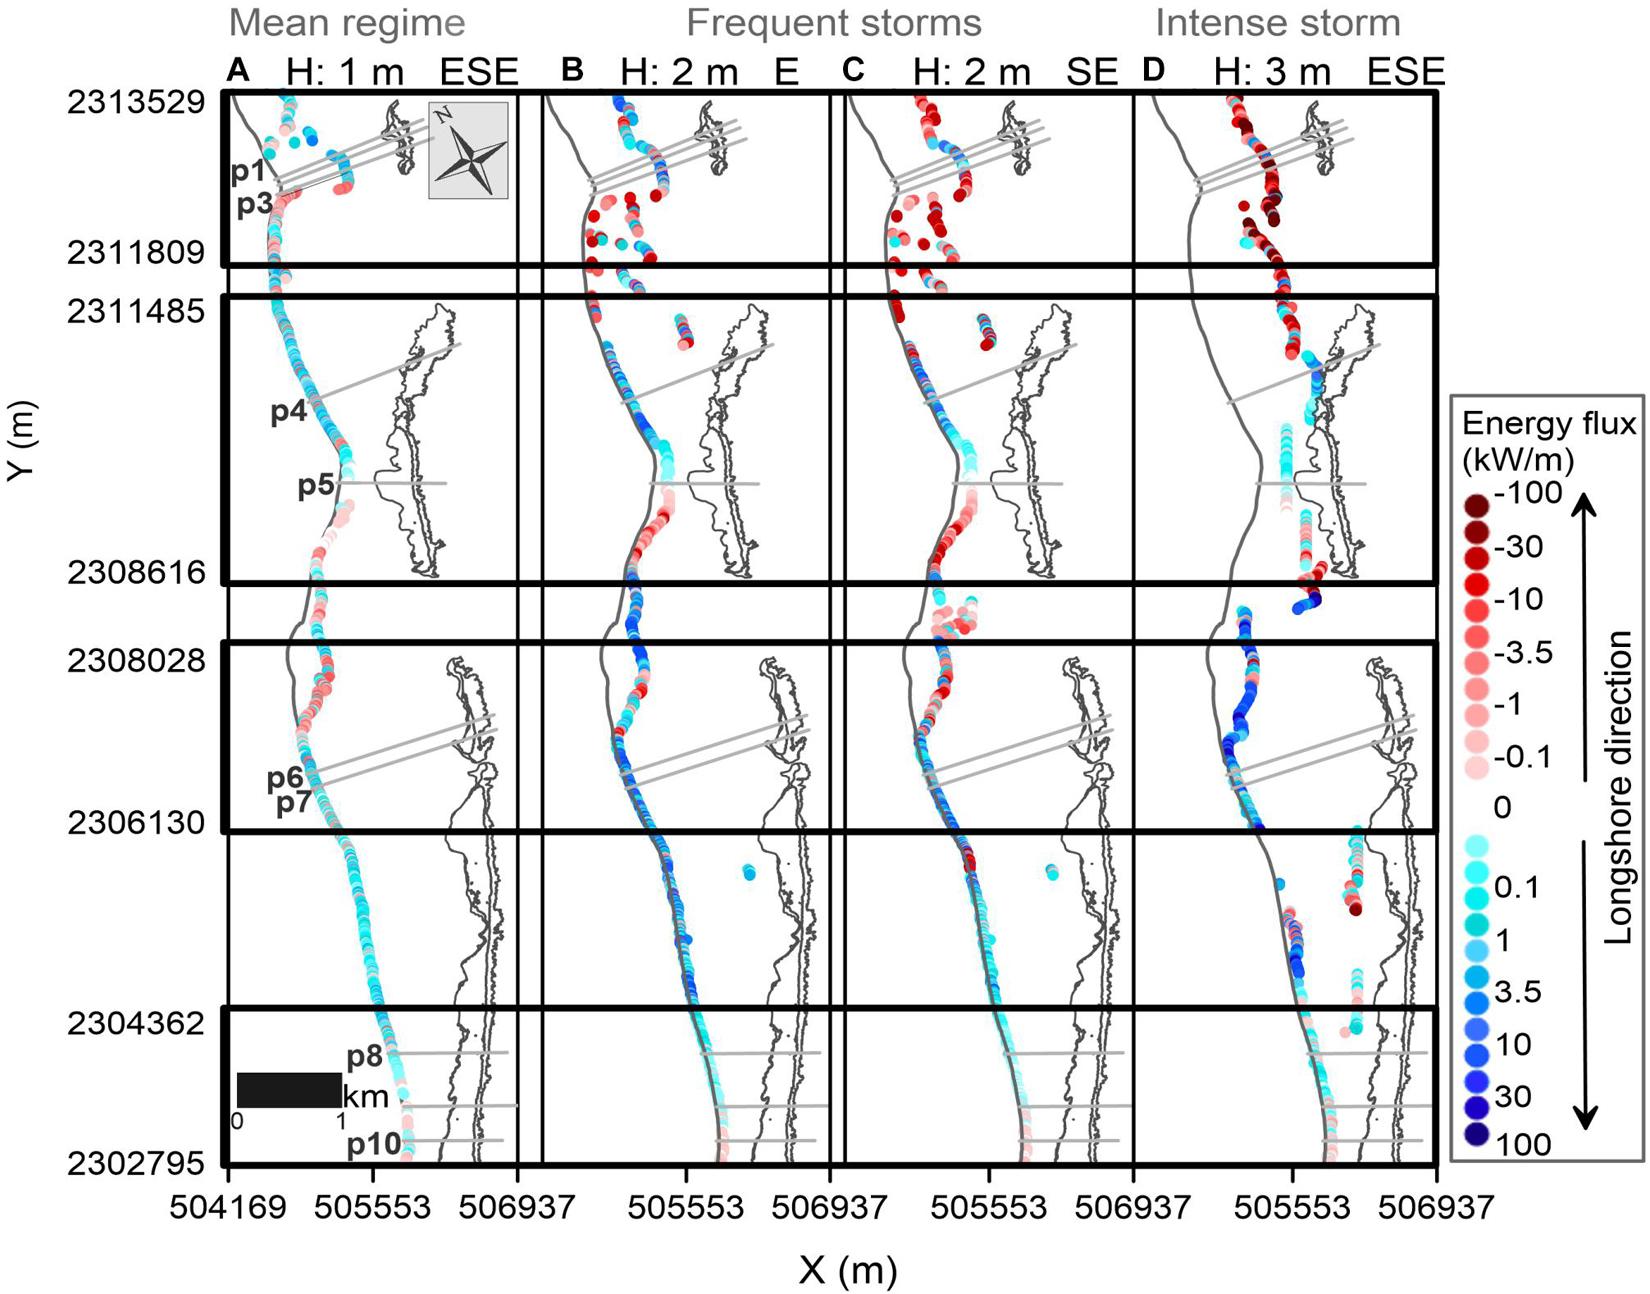
Figure 10. Longshore wave-energy flux at the breaking point. High absolute values indicate more sediment transport potential.
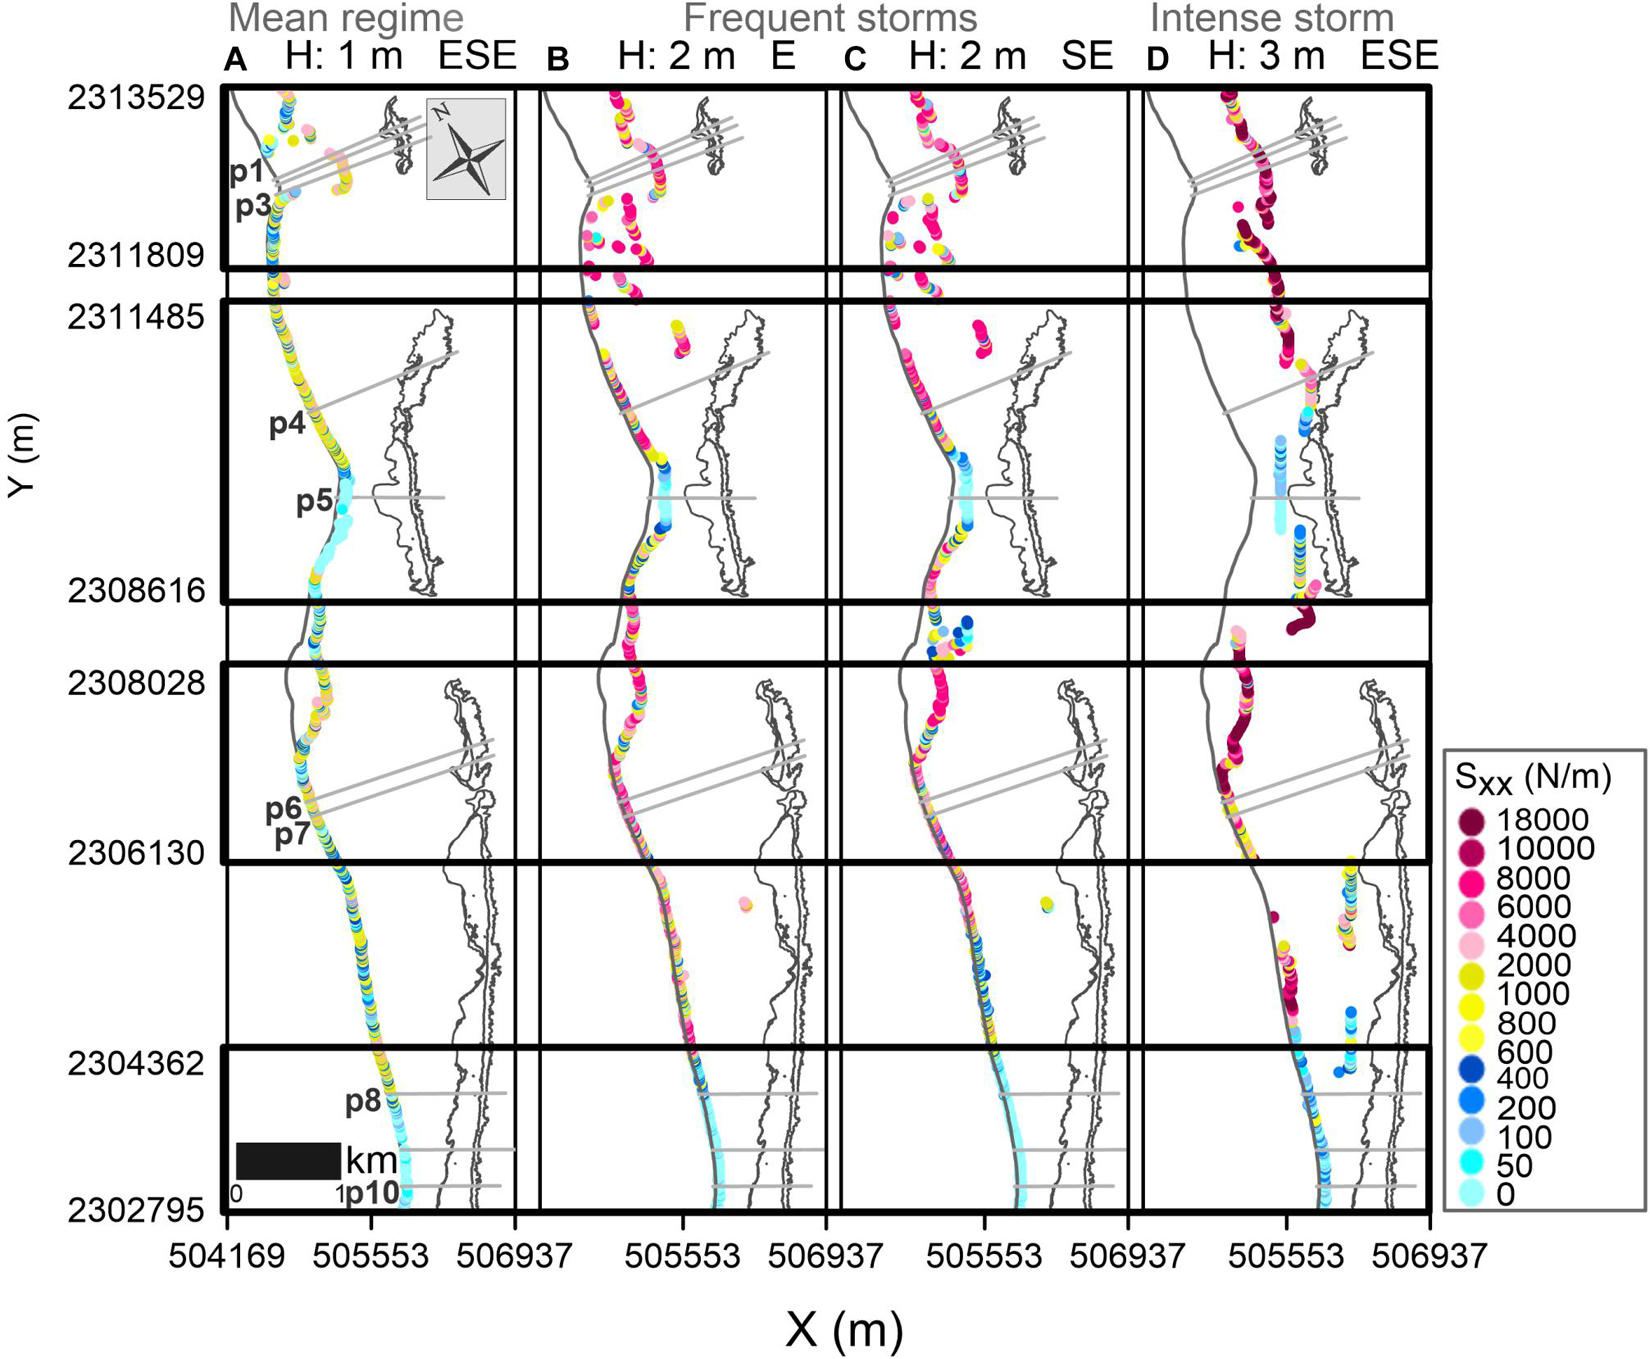
Figure 11. Cross-shore radiation stresses at the breaking point. High values indicate more cross-shore sediment transport potential.
For each reef category and wave forcing, the breaking zone behind the reefs is in a different position with respect to the coastline. The waves break closer to the coastline at Reefs 2, 4, and 5, less than 34 m for the mean regime and up to 78 m for the most intense waves. Wave breaking occurs in the lagoon behind Reef 3, induced by the very shallow lagoon bathymetry, at around 68 m from the coastline in mean regime and far from the coastline, at 174–194 m, in storms. In contrast, offshore waves break in the sheltered region of Reef 1, at 580 to 738 m from the shoreline (Figures 10, 11).
When waves break closer to the shore (less than 80 m), the coastline changes show a direct correlation (R2 > 0.57) with the radiation stress values (Figures 12A,C,D,F). The greater the radiation stress, the more coastline erosion. There is a weak correlation for storms coming from the E (Figure 12B), as seen from the analysis of breaking waves in Figure 9B, which is explained by the diffraction effects and the orthogonality of the wave action.
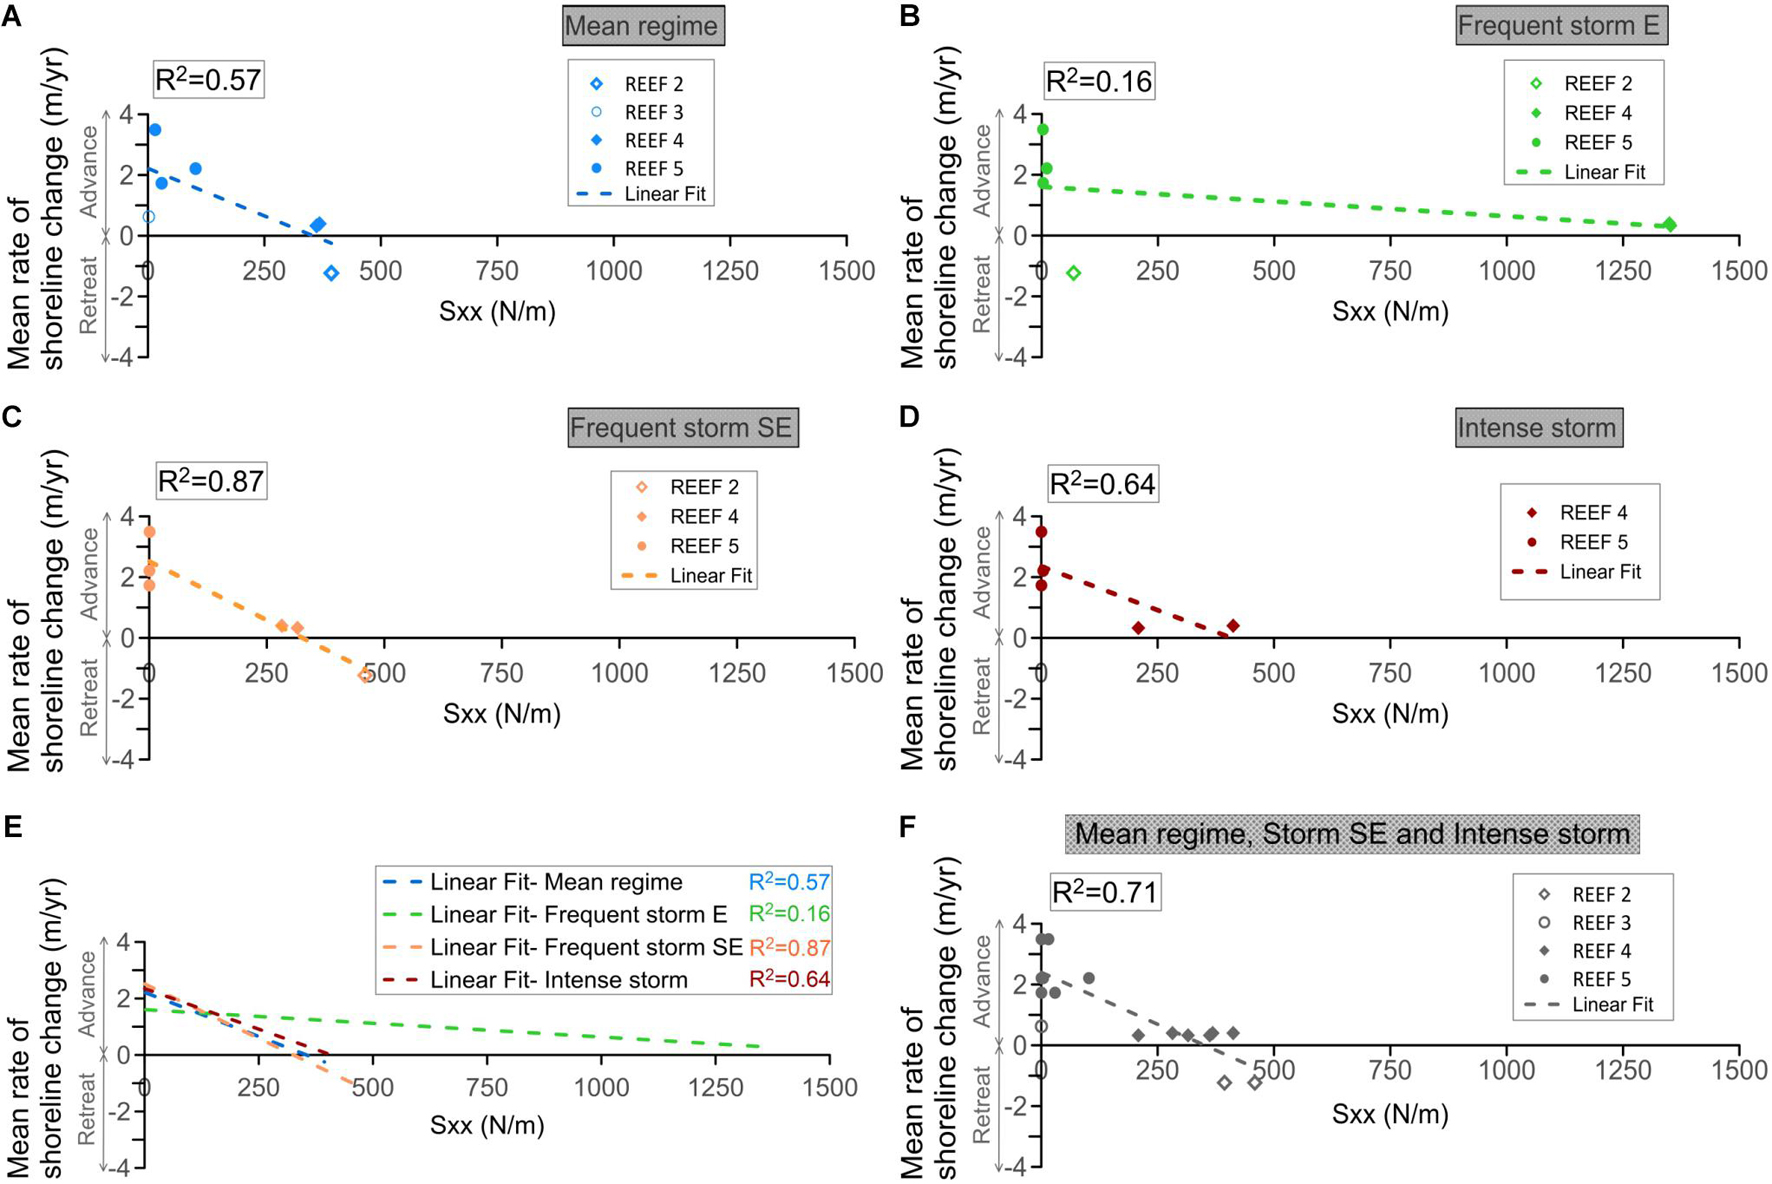
Figure 12. Shoreline change as a function of the radiation stress when waves break near the coastline, for different hydrodynamic forcing: (A) Mean regime. (B,C) Frequent storms. (D) Intense storms. (E) Fitting lines to data for the four wave cases. (F) Mean regime, storms from the Southeast and intense storms. The dashed line represents a linear regression line fitted by least squares. R2 is the square of the Pearson linear correlation coefficient, tested at 95% confidence level.
This study is one of the first analyses to provide direct correlations between coastline change and reef parameters, as a means of improving our understanding of the physics behind reefs. Previous studies have focused on enclosed systems, while the present analysis covers over 11 km of nearly uniform and rectilinear shorelines that are shaped by longshore sediment transport gradients. The results show that narrower and deeper reef flats are linked greater erosion rates. This is in agreement with previous studies focused on the hydrodynamics over reef flats and nearshore coastal processes (Péquignet et al., 2011; Quataert et al., 2015; Reguero et al., 2018; Baldock et al., 2019, 2020). The distance that the wave breaking zone is from the coastline was found to be a significant parameter to describe the coastal change, as previously characterized for shoreline response with artificial submerged structures. For example, Ranasinghe et al. (2006) explained shoreline response as a function of the ratio of the distance of the structure from the undisturbed shoreline and the width of the natural surf zone. Although the present study used the modified shoreline, the trends found are similar.
In addition, the results show that reefs with shallow crests, wide reef flats and a dissipative lagoon seabed (Reef 3), located a medium distance from the coastline (∼300 m), with breaking waves at ∼60 to 200 m from it, provide the most erosion control, contributing most to shoreline stability, or even producing equilibrium-driven features, such as salients. Reefs with similar characteristics but with a deeper lagoon (Reef 5) are associated with more variable shoreline change, as the waves break closer to the shoreline (∼13–78 m). In contrast, narrow reefs, with smaller reef flat widths and deeper reef crests (1–2.5 m depth), located far from the coastline (>900 m; Reefs 1, 2, and 4) provide less erosion protection.
Significant coastline changes occur when the waves break close to the shoreline, especially for the mean regime and frequent storms (blue and orange lines in Figure 12E). This contrasts with the limited coastline changes observed when the waves break farther from the shore during intense storms (see the milder slope of the regression in Figure 12E). For these cases, when waves break closer to the coast (less than 80 m), the coastline changes directly correlate with the radiation stress values; the greater the radiation stress, the more coastline erosion. Waves break far from the coastline (over 200 m offshore) at Reefs 1 (for all wave conditions), 2 (under intense storms), and 3 (for frequent and severe storms; Figures 10, 11). For these cases, the coastline changes and the energy flux of the breaking waves resulted directly proportional; but no relation was found with the radiation stresses. This indicates that local reef-lagoon processes (waves, currents, and sediment transport) may govern the shoreline changes when waves break far from the shore.
The radiation stresses behind Reefs 3 and 5 were low for both (p5 compared to p8–p10 in Figure 11), but the magnitude of the longshore wave energy flux, convergent at the location of the salient behind the reefs (p5 vs p8–p10 in Figure 10), was higher for Reef 3, especially under storms when the waves break far from the coastline. Greater sediment transport occurs when the waves break near the coastline, on reefs closer to the shore. This is seen in the advance of the coastline at Reef 5 (transects p8-p10 in Figure 6C) that was more pronounced than in Reef 3 (Figure 6C) because the greater influence of the radiation stress and the longitudinal wave energy flux induced by breaking waves near the shoreline. This agrees with previous studies in Puerto Morelos, where the most extensive volumetric sediment transport was found along the stretch of the beach that fronted the closest reef-crest to the shore (Ruiz de Alegria-Arzaburu et al., 2013). It is also important to note the possible contribution of the longer length of Reef 5 in coastal protection, providing a significant influence on the sediment pattern in the leeward zone of the reef, as suggested by Ketsiri et al. (2018) on the design of a submerged artificial oyster reef. Compared to other geologically controlled beaches, such as coasts perched on calcarenite landforms, sea level relative to structure elevation also proved to be a critical factor governing coastal erosion and accretion processes, along with the continuity of the rigid landforms in determining local sediment sources and sinks (Gallop et al., 2012).
Therefore, the longshore wave energy flux and the cross-shore component of the radiation stress can be used to parameterize beach change due to wave action on reef-lined coasts. In contrast, for embayed beaches, the alongshore component of the radiation stress was found to be linked to beach orientation and thus governing the beach evolution of these beaches (Ojeda and Guillén, 2008; Sancho-García et al., 2013). The distance of the wave breaking zone from the coastline is also an important parameter for erosion protection: the closer the breaking point to the coastline, the greater the coastline change. This result also highlights the possible contribution to coastal instability of mean regime waves as they break close to the shoreline. The analysis also shows the importance of reef discontinuities and borders on wave propagation, allowing the waves to reach the coastline with more wave energy. These two findings have important implications for artificial reef projects, which ideally would be located closer to the shore to provide more coastal erosion control.
In this paper, a link was established between historic shoreline change, coral reef geomorphology and their influence on wave hydrodynamics. However, sediment transport and coastal change modeling could help estimate future changes in the long term and under storm conditions. Yet, this study provides an important first approach to correlate the physics associated with coral reefs with the beach response. The approach can also be used for other coastlines (i.e., with sandy beaches with a microtidal range) to better understand the role of coral reefs in coastal protection. This can be done as long as the coast is strongly wave dominated. However, other approaches, such as shoreline equilibrium models (as in Reguero et al., 2018), could be applied in enclosed areas governed by refraction-diffraction patterns. In turn, these results may lead to increase the success of reef restoration projects to maintain shallow and wide reef flats to maximize the protective service for erosion control of these ecosystems, and to inform the design of artificial reefs in terms of location and crest height.
The raw data supporting the conclusions of this article will be made available by the authors, without undue reservation.
ME, EM, and BR conceptualized the analysis. ME and EM developed the methodology, performed the reef modeling framework and simulations. EM, BR, RS, and FS validated the results and contributed to the final manuscript discussion, reviewed and edited the manuscript. ME wrote the original draft preparation. All authors have read and agreed to the published version of the manuscript.
This work was partially funded by CONACYT-SENER/Sustentabilidad Energética through the Centro Mexicano de Innovación en Energías del Océano (CEMIE-Océano), grant number 249795.
The content is solely responsibility of the authors and does not necessarily represent the official views of the Gulf Research Program of the National Academy of Sciences, Engineering and Medicine.
The authors declare that the research was conducted in the absence of any commercial or financial relationships that could be construed as a potential conflict of interest.
All claims expressed in this article are solely those of the authors and do not necessarily represent those of their affiliated organizations, or those of the publisher, the editors and the reviewers. Any product that may be evaluated in this article, or claim that may be made by its manufacturer, is not guaranteed or endorsed by the publisher.
The authors wish to thank The Nature Conservancy for supporting this research. We especially thank the agency from the Government of Mexico that provided crucial data for the analysis: “Comisión Nacional para el Conocimiento y Uso de la Biodiversidad” (CONABIO). BR acknowledges the support from an Early- Career Research Fellowship from the Gulf Research Program of the National Academies of Sciences, Engineering, and Medicine. The authors are grateful to the reviewers and the editor for their revisions that improved the quality of this work.
Aerts, J. C. (2018). A review of cost estimates for flood adaptation. Water 10:1646. doi: 10.3390/w10111646
Almada-Villela, P., Mcfield, M., Kramer, P., Kramer, P. R., and Arias-Gonzalez, E. (2002). Status of Coral Reefs of Mesoamerica-Mexico. Belize, Guatemala, Honduras, Nicaragua, and El Salvador: Status of coral reefs of the world, 303–324.
Alvarez-Filip, L., Dulvy, N. K., Gill, J. A., Côté, I. M., and Watkinson, A. R. (2009). Flattening of Caribbean coral reefs: region-wide declines in architectural complexity. Proc. R. Soc. 276, 3019–3025. doi: 10.1098/rspb.2009.0339
Baldock, T. E., Shabani, B., and Callaghan, D. P. (2019). Open access bayesian belief networks for estimating the hydrodynamics and shoreline response behind fringing reefs subject to climate changes and reef degradation. Environ. Model Soft. 119, 327–340. doi: 10.1016/j.envsoft.2019.07.001
Baldock, T. E., Shabani, B., Callaghan, D. P., Hu, Z., and Mumby, P. J. (2020). Two-dimensional modelling of wave dynamics and wave forces on fringing coral reefs. Coast. Eng. 155:103594. doi: 10.1016/j.coastaleng.2019.103594
Beck, M. W., McCall, R. T., Storlazzi, C. D., van Dongeren, A. R., Lowe, E., Reguero, B. G., et al. (2019). Rigorously Valuing the Role of US Coral Reefs in Coastal Hazard Risk Reduction. U.S. Geological Survey Open-File Report 2019-1027. Reston, VA: U.S. Department of the Interior, U.S. Geological Survey, 41. doi: 10.3133/ofr20191027
Bellwood, D. R., Hughes, T. P., Folke, C., and Nyström, M. (2004). Confronting the coral reef crisis. Nature 429:827. doi: 10.1038/nature02691
Bruckner, A. W., Hourigan, T. F., Moosa, M., Soemodihardjo, S., Soegiarto, A., Romimohtarto, K., et al. (2002). Proactive management for conservation of Acropora cervicornis and Acropora palmata: application of the U. S. Endangered Species Act. Int. Coral Reef Symposium 2, 661–665.
Cardenas-Rojas, D., Mendoza, E., Escudero, M., and Verduzco-Zapata, M. (2021). Assessment of the performance of an artificial reef made of modular elements through small scale experiments. J. Mari. Sci. Eng. 9:130. doi: 10.3390/jmse9020130
Carriquiry, J. D., Barranco-Servin, L. M., Villaescusa, J. A., Camacho-Ibar, V. F., Reyes-Bonilla, H., and Cupul-Magaña, A. L. (2013). Conservation and sustainability of mexican caribbean coral reefs and the threats of a human-induced phase-shift. Environ. Change Sustainabil. 2, 29–51. doi: 10.5772/54339
Cerdeira-Estrada, S., Martell-Dubois, R., Heege, T., Rosique-De La Cruz, L. O., Blanchon, P., Ohlendorf, S., et al. (2018). Batimetría de los Ecosistemas Marinos Del Caribe Mexicano: Cabo CatocheXcalak. Escala: 1:8,000. México: CONABIO, EOMAP, UNAM, CINVESTAV, ECOSUR.
Chávez, V., Uribe-Martínez, A., Cuevas, E., Rodríguez-Martínez, R. E., van Tussenbroek, B. I., Francisco, V., et al. (2020). Massive influx of pelagic Sargassum spp. on the coasts of the mexican caribbean 2014–2020: challenges and opportunities. Water 12:2908. doi: 10.3390/w12102908
Chawla, A., Tolman, H. L., Hanson, J. L., Devaliere, E. M., and Gerald, V. M. (2009). Validation of a multi-grid WAVEWATCH III modeling system. NOAA/MMAB Contribution 281:15.
Coronado, C., Candela, J., Iglesias-Prieto, R., Sheinbaum, J., López, M., and Ocampo-Torres, F. J. (2007). On the circulation in the puerto morelos fringing reef lagoon. Coral Reefs 26, 149–163. doi: 10.1007/s00338-006-0175-9
Elliff, C. I., and Silva, I. R. (2017). Coral reefs as the first line of defense: shoreline protection in face of climate change. Mari. Environ. Res. 127, 148–154. doi: 10.1016/j.marenvres.2017.03.007
Ferrario, F., Beck, M. W., Storlazzi, C. D., Micheli, F., Shepard, C. C., and Airoldi, L. (2014). The effectiveness of coral reefs for coastal hazard risk reduction and adaptation. Nat. Commun. 5:3794. doi: 10.1038/ncomms4794
Gallop, S. L., Bosserelle, C., Pattiaratchi, C. B., Eliot, I., and Haigh, I. D. (2012). The influence of calcarenite limestone reefs on beach erosion and recovery. Coast. Eng. Proc. 1:sediment.72. doi: 10.9753/icce.v33.sediment.72
Gardner, T. A., Côté, I. M., Gill, J. A., Grant, A., and Watkinson, A. R. (2003). Long-term region-wide declines in Caribbean corals. Science 301, 958–960. doi: 10.1126/science.1086050
Guannel, G., Arkema, K., Ruggiero, P., and Verutes, G. (2016). The power of three: coral reefs, seagrasses and mangroves protect coastal regions and increase their resilience. PLoS One 1:e0158094. doi: 10.1371/journal.pone.0158094
Guza, R. T., and Thornton, E. B. (1981). Wave set−up on a natural beach. J. Geophys. Res. Oceans 86, 4133–4137. doi: 10.1029/jc086ic05p04133
Harris, D. L., Rovere, A., Casella, E., Power, H., Canavesio, R., Collin, A., et al. (2018). Coral reef structural complexity provides important coastal protection from waves under rising sea levels. Sci. Adv. 4:eaao4350. doi: 10.1126/sciadv.aao4350
Hughes, T. P., Bellwood, D. R., Folke, C., Steneck, R. S., and Wilson, J. (2005). New paradigms for supporting the resilience of marine ecosystems. Trends Ecol. Evolu. 20, 380–386. doi: 10.1016/j.tree.2005.03.022
Jackson, C. W. Jr., Alexander, C. R., and Bush, D. M. (2012). Application of the AMBUR R package for spatio-temporal analysis of shoreline change: Jekyll Island, Georgia, USA. Comput. Geosci. 41, 199–207. doi: 10.1016/j.cageo.2011.08.009
James, R. K., Silva, R., van Tussenbroek, B. I., Escudero-Castillo, M., Mariño-Tapia, I., Dijkstra, H., et al. (2019). Maintaining tropical beaches with seagrass and algae: a promising alternative to engineering solutions. BioScience 69, 136–142. doi: 10.1093/biosci/biy154
Jordan, E., Merino, M., Moreno, O., and Martin, E. (1981). Community structure of coral reefs in the Mexican Caribbean. Proc. Int. Coral Reef Symp. 2, 303–308.
Ketsiri, C., Kositgittiwong, D., and Ekkawatpanit, C. (2018). Submerged breakwaters design development based on artificial oyster reef. Lowland Technol. Int. 20, 151–158.
Lonquet-Higgins, M. S., and Stewart, R. W. (1964). Radiation stress in water waves: a physical discussion with application. Deep Sea Res. 11, 529–562. doi: 10.1016/0011-7471(64)90001-4
Lowe, R. J., Falter, J. L., Bandet, M. D., Pawlak, G., Atkinson, M. J., Monismith, S. G., et al. (2005). Spectral wave dissipation over a barrier reef. J. Geophy. Res. Oceans. 110:C04001. doi: 10.1029/2004JC002711
Mariño-Tapia, I., Enriquez, C., Silva, R., Mendoza-Baldwin, E., Escalante-Mancera, E., and Ruiz-Renteria, F. (2014). Comparative morphodynamics between exposed and reef protected beaches under hurricane conditions. Coast. Eng. Proc 1:55. doi: 10.9753/icce.v34.sediment.55
Martínez, K., Bone, D., Cróquer, A., and López-Ordaz, A. (2014). Population assessment of Acropora palmata (Scleractinia: Acroporidae): relationship between habitat and reef associated species. Revista de Biología Trop. 62, 309–317.
Mil-Homens, J., Ranasinghe, R., van Thiel de Vries, J. S. M., and Stive, M. J. F. (2013). Re-evaluation and improvement of three commonly used bulk longshore sediment transport formulas. Coast. Eng. 75, 29–39. doi: 10.1016/j.coastaleng.2013.01.004
Monismith, S. G., Rogers, J. S., Koweek, D., and Dunbar, R. B. (2015). Frictional wave dissipation on a remarkably rough reef. Geophys. Res. Lett. 42, 4063–4071. doi: 10.1002/2015GL063804
Narayan, S., Beck, M. W., Reguero, B. G., Losada, I. J., Van Wesenbeeck, B., Pontee, N., et al. (2016). The effectiveness, costs and coastal protection benefits of natural and nature-based defences. PLoS One 11:e0154735. doi: 10.1371/journal.pone.0154735
Ojeda, E., and Guillén, J. (2008). Shoreline dynamics and beach rotation of artificial embayed beaches. Mar. Geol. 253, 51–62. doi: 10.1016/j.margeo.2008.03.010
Omori, M. (2011). Degradation and restoration of coral reefs: experience in Okinawa, Japan. Mari. Biol. Res. 7, 3–12. doi: 10.1080/17451001003642317
Osorio-Cano, J. D., Alcérreca-Huerta, J. C., Mariño-Tapia, I., Osorio, A. F., Acevedo-Ramírez, C., Enriquez, C., et al. (2019). Effects of roughness loss on reef hydrodynamics and coastal protection: approaches in Latin America. Estuar. Coast. 42, 1742–1760. doi: 10.1007/s12237-019-00584-4
Pearson, S. G., Storlazzi, C. D., Van Dongeren, A. R., Tissier, M. F. S., and Reniers, A. J. H. M. (2017). A Bayesian−based system to assess wave−driven flooding hazards on coral reef−lined coasts. J. Geophys. Res. Oceans 122, 10099–10117. doi: 10.1002/2017jc013204
Péquignet, A. C., Becker, J. M., Merrifield, M. A., and Boc, S. J. (2011). The dissipation of wind wave energy across a fringing reef at Ipan. Guam. Coral Reefs 30, 71–82. doi: 10.1007/s00338-011-0719-5
Pontee, N., Narayan, S., Reguero, B., Beck, M., and Losada, I. (2018). “Assessing the performance of natural and nature based defences,” in Proceeding of the Coasts, Marine Structures and Breakwaters 2017: Realising the Potential (ICE Publishing), 813–822. doi: 10.1680/cmsb.63174.0813
Quataert, E., Storlazzi, C., Van Rooijen, A., Cheriton, O., and Van Dongeren, A. (2015). The influence of coral reefs and climate change on wave−driven flooding of tropical coastlines. Geophys. Res. Lett. 42, 6407–6415. doi: 10.1002/2015GL064861
Ranasinghe, R., Turner, I. L., and Symonds, G. (2006). Shoreline response to multi-functional artificial surfing reefs: a numerical and physical modelling study. Coast. Eng. 53, 589–611. doi: 10.1016/j.coastaleng.2005.12.004
Reguero, B. G., Beck, M. W., Agostini, V. N., Kramer, P., and Hancock, B. (2018). Coral reefs for coastal protection: a new methodological approach and engineering case study in Grenada. J. Environ. Manage. 210, 146–161. doi: 10.1016/j.jenvman.2018.01.024
Reguero, B. G., Storlazzi, C. D., Gibbs, A. E., Shope, J. B., Cole, A. D., Cumming, K. A., et al. (2021). The value of US coral reefs for flood risk reduction. Nat. Sustain. 4, 688–698. doi: 10.1038/s41893-021-00706-6
Reguero, B., Secaira, F., Toimil, A., Escudero, M., Díaz-Simal, P., Beck, M. W., et al. (2019). The risk reduction benefits of the mesoamerican reef in Mexico. Front. Earth Sci. 7:125. doi: 10.3389/feart.2019.00125
Rodríguez-Martínez, R. E. (2008). Community involvement in marine protected areas: the case of puerto morelos reef, México. J. Environ. Manag. 88, 1151–1160. doi: 10.1016/j.jenvman.2007.06.008
Rodríguez-Martínez, R. E., Banaszak, A. T., and Jordán-Dahlgren, E. (2001). Necrotic patches affect Acropora palmata (Scleractinia: acroporidae) in the mexican caribbean. Dis. Aquat. Organ. 47, 229–234. doi: 10.3354/dao047229
Rodríguez-Martínez, R. E., Banaszak, A. T., McField, M. D., Beltran-Torres, A. U., and Alvarez-Filip, L. (2014). Assessment of Acropora palmata in the mesoamerican reef system. PLoS One 9:e96140. doi: 10.1371/journal.pone.0096140
Rodríguez-Martínez, R. E., Ruíz-Rentería, F., Tussenbroek, B. V., Barba-Santos, G., Escalante-Mancera, E., Jordán-Garza, G., et al. (2010). Environmental state and tendencies of the puerto morelos CARICOMP site, Mexico. Revista de Biol. Trop. 58, 23–43.
Rosado-Torres, A. A., Mariño-Tapia, I., and Acevedo-Ramírez, C. (2019). Decreased roughness and macroalgae dominance in a coral reef environment with strong influence of submarine groundwater discharges. J. Coast. Res. 92, 13–21. doi: 10.2112/SI92-003.1
Ruiz de Alegria-Arzaburu, A., Mariño-Tapia, I., Enriquez, C., Silva, R., and González-Leija, M. (2013). The role of fringing coral reefs on beach morphodynamics. Geomorphology 198, 69–83. doi: 10.1016/j.geomorph.2013.05.013
Sancho-García, A., Guillén, J., and Ojeda, E. (2013). Storm-induced readjustment of an embayed beach after modification by protection works. Geo Mar. Lett. 33, 159–172. doi: 10.1007/s00367-012-0319-6
Silva, R., Borthwick, A. G., and Taylor, R. E. (2005). Numerical implementation of the harmonic modified mild-slope equation. Coast. Eng. 52, 391–407. doi: 10.1016/j.coastaleng.2004.12.009
Silva, R., Mendoza, E., Mariño-Tapia, I., Martínez, M. L., and Escalante, E. (2016). An artificial reef improves coastal protection and provides a base for coral recovery. J. Coast. Res. 75, 467–471. doi: 10.2112/SI75-094.1
Silva, R., Ruíz, G., Posada, G., Perez, D., Rivillas, G., Espinal, J., et al. (2008). Atlas de Clima Marítimo de La Vertiente Atlántica Mexicana. Mexico: Universidad Nacional Autónoma de México.
The Wavewatch Iii Development Group (WW3DG) (2019). User Manual and System Documentation of WAVEWATCH III Version 6.07.
Zhao, M., Zhang, H., Zhong, Y., Jiang, D., Liu, G., Yan, H., et al. (2019). The status of coral reefs and its importance for coastal protection: a case study of northeastern Hainan Island, South China Sea. Sustain 11:4354. doi: 10.3390/su11164354
Keywords: beach erosion mitigation, coral reefs, coastal protection, radiation stress, wave energy, nature-based solutions
Citation: Escudero M, Reguero BG, Mendoza E, Secaira F and Silva R (2021) Coral Reef Geometry and Hydrodynamics in Beach Erosion Control in North Quintana Roo, Mexico. Front. Mar. Sci. 8:684732. doi: 10.3389/fmars.2021.684732
Received: 23 March 2021; Accepted: 03 September 2021;
Published: 20 September 2021.
Edited by:
Suzana Ilic, Lancaster University, United KingdomReviewed by:
Pablo Higuera, The University of Auckland, New ZealandCopyright © 2021 Escudero, Reguero, Mendoza, Secaira and Silva. This is an open-access article distributed under the terms of the Creative Commons Attribution License (CC BY). The use, distribution or reproduction in other forums is permitted, provided the original author(s) and the copyright owner(s) are credited and that the original publication in this journal is cited, in accordance with accepted academic practice. No use, distribution or reproduction is permitted which does not comply with these terms.
*Correspondence: Edgar Mendoza, ZW1lbmRvemFiQGlpbmdlbi51bmFtLm14
Disclaimer: All claims expressed in this article are solely those of the authors and do not necessarily represent those of their affiliated organizations, or those of the publisher, the editors and the reviewers. Any product that may be evaluated in this article or claim that may be made by its manufacturer is not guaranteed or endorsed by the publisher.
Research integrity at Frontiers
Learn more about the work of our research integrity team to safeguard the quality of each article we publish.